What Factors Influence the Success of Soft Story Retrofit ...
48
San Jose State University San Jose State University SJSU ScholarWorks SJSU ScholarWorks Master's Projects Master's Theses and Graduate Research Winter 2020 What Factors Influence the Success of Soft Story Retrofit What Factors Influence the Success of Soft Story Retrofit Programs? The Example of San Francisco’s Program Programs? The Example of San Francisco’s Program Thanh Thuy Nguyen San Jose State University Follow this and additional works at: https://scholarworks.sjsu.edu/etd_projects Part of the Emergency and Disaster Management Commons, Policy Design, Analysis, and Evaluation Commons, Public Administration Commons, and the Public Policy Commons Recommended Citation Recommended Citation Nguyen, Thanh Thuy, "What Factors Influence the Success of Soft Story Retrofit Programs? The Example of San Francisco’s Program" (2020). Master's Projects. 959. DOI: https://doi.org/10.31979/etd.s4a2-7zhn https://scholarworks.sjsu.edu/etd_projects/959 This Master's Project is brought to you for free and open access by the Master's Theses and Graduate Research at SJSU ScholarWorks. It has been accepted for inclusion in Master's Projects by an authorized administrator of SJSU ScholarWorks. For more information, please contact [email protected].
Transcript of What Factors Influence the Success of Soft Story Retrofit ...
San Jose State University San Jose State University
SJSU ScholarWorks SJSU ScholarWorks
Master's Projects Master's Theses and Graduate Research
Winter 2020
What Factors Influence the Success of Soft Story Retrofit What Factors Influence the Success of Soft Story Retrofit
Programs? The Example of San Francisco’s Program Programs? The Example of San Francisco’s Program
Thanh Thuy Nguyen San Jose State University
Follow this and additional works at: https://scholarworks.sjsu.edu/etd_projects
Part of the Emergency and Disaster Management Commons, Policy Design, Analysis, and Evaluation
Commons, Public Administration Commons, and the Public Policy Commons
Recommended Citation Recommended Citation Nguyen, Thanh Thuy, "What Factors Influence the Success of Soft Story Retrofit Programs? The Example of San Francisco’s Program" (2020). Master's Projects. 959. DOI: https://doi.org/10.31979/etd.s4a2-7zhn https://scholarworks.sjsu.edu/etd_projects/959
This Master's Project is brought to you for free and open access by the Master's Theses and Graduate Research at SJSU ScholarWorks. It has been accepted for inclusion in Master's Projects by an authorized administrator of SJSU ScholarWorks. For more information, please contact [email protected].
1
What Factors Influence the Success of Soft Story Retrofit Programs?
The Example of San Francisco’s Program
by
Thanh Thuy Nguyen
A Thesis Quality Research Paper
Submitted in Partial Fulfillment of the
Requirements for the Master’s Degree
In
PUBLIC ADMINISTRATION
Professor Frances Edwards, Ph.D.
Adviser
The Graduate School
San Jose State University
December 2020
2
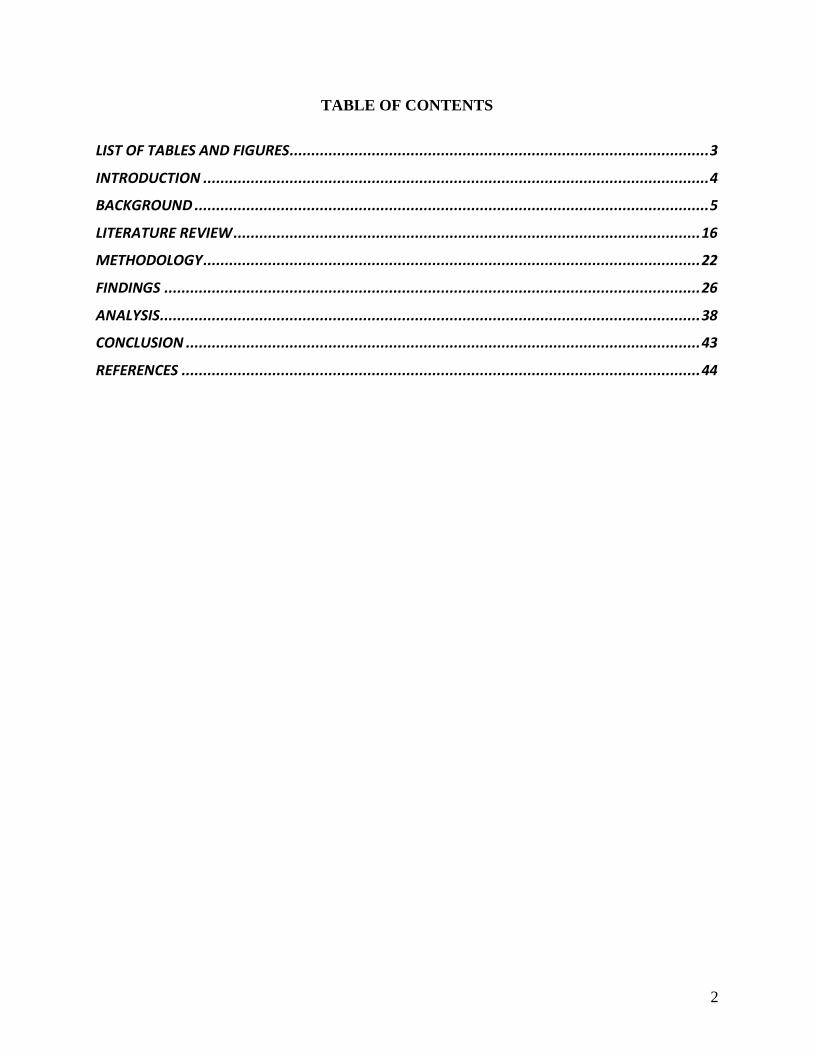
TABLE OF CONTENTS
LIST OF TABLES AND FIGURES................................................................................................. 3
INTRODUCTION ..................................................................................................................... 4
BACKGROUND ....................................................................................................................... 5
LITERATURE REVIEW ............................................................................................................ 16
METHODOLOGY ................................................................................................................... 22
FINDINGS ............................................................................................................................ 26
ANALYSIS ............................................................................................................................. 38
CONCLUSION ....................................................................................................................... 43
REFERENCES ........................................................................................................................ 44
3
LIST OF TABLES AND FIGURES
Tables
Table 1: Deadlines for Retrofitting Wood-Framed Buildings in Mandatory Seismic Retrofit
Program ............................................................................................................................... 12
Table 2: Program Evaluation .................................................................................................... 22
Table 3: Buildings for Which Work Has Been Completed and CFCs Have Been Issued.... 27
Table 4: 2010 Median Household Income by Supervisorial District ..................................... 27
Table 5: Total Retrofit Rate of Each District (Tiers 1 and 4 Excluded) ................................ 28
Table 6: Question 1 Response Breakdown ............................................................................... 29
Table 7: Question 2 Response Breakdown ............................................................................... 31
Table 8: Question 3 Response Breakdown .............................................................................. 31
Table 9: Question 4 Response Breakdown .............................................................................. 32
Table 10: Question 5 Response Breakdown ............................................................................ 32
Table 11: Additional Comments with Property Size and Property Values .......................... 33
Table 12: Overall Pros and Cons of San Francisco MSSP..................................................... 37
Table 13: Median Household Income and Retrofit Rate Comparison .................................. 38
Figures
Figure 1: Five Steps to Plan for a Soft-Story Retrofit Program ............................................... 7
Figure 2: Workflow of Procedures for Property Owners ....................................................... 14
4
INTRODUCTION
In the event of an earthquake, one of the types of structures that is most susceptible to collapse is
soft-story buildings (Association of Bay Area Governments [ABAG], 2016). Built before current
regulation and codes were enacted, a soft-story residential building is a building that has
commercial space or open parking on the first floor, with units built above it (ABAG, 2016). The
first floor has a weak structure and the units above the first floor weigh heavily on it (Arroyo,
2019). Due to their building structure, these properties may sway or collapse during an
earthquake, ultimately causing fatalities and damage (ABAG, 2016). To prevent this from
occurring, many cities have established programs to require property owners to retrofit their soft-
story buildings (ABAG, 2016). The timing and intensity of the next earthquake are
unpredictable, but to prepare for the next event, the City of San Francisco has created the
Mandatory Soft Story Program to retrofit the city’s soft-story buildings. The following research
question guides this study: In San Francisco, what factors influence owners’ decisions to retrofit
their buildings? How can this knowledge help other cities to develop effective retrofit programs?
5
BACKGROUND
Loma Prieta Earthquake
During the 1989 Loma Prieta earthquake, some soft-story buildings collapsed due to their
design (Stark, 2019). The 6.9 magnitude earthquake resulted in 63 fatalities, 3,757 injuries,
and considerable damage to many buildings (Collins, 2017). This violent earthquake
caused particularly great damage to soft-story buildings in the Marina District, making it
obvious how fragile these buildings with weak first stories were. The earthquake brought
to light the vulnerability of wood-framed buildings, which initially had been viewed by
engineers as earthquake-resistant and strong. It was quickly learned that wood-framed
buildings can still collapse under certain circumstances (Pino & Enright, 2019). These
wood light-frame structures collapsed, or came to the brink of collapse, because of their
weak first stories. Some of the contributing factors responsible for the collapse of the
larger wood-light frame buildings include a lack of bracing walls, liquefaction, and the use
of obsolete materials. The majority of the damaged buildings had been built between the
1890s and 1930s (Cobeen, Maffei, & Osteraas, 2019). For the past 30 years, urban
planners have encouraged property owners to fix the soft-story building structures in case
of another violent earthquake (Stark, 2019).
Property owners and city governments in the Bay Area have spent $1.2 billion on
retrofits since the Loma Prieta earthquake. Although there are better building codes now
than there were in the past, there are still older buildings that do not meet the standards of
the new building codes and are vulnerable to collapse. Some cities have identified the
buildings that are at risk, but they are still having problems retrofitting them, with cost
being the primary impediment. There are cities in the Bay Area that have not passed
ordinances to require retrofits. For instance, San Jose has yet to create a list of homes that
6
are at risk, but the city has estimated that there are about 1,500 soft-story properties.
Although the City of San Jose has not required the property owners to retrofit their
buildings, officials are looking into cost-effective incentives that would motivate them to
do so (Stark, 2019).
Developing a Soft-Story Retrofit Policy
Almost half of the houses that were damaged due to the Loma Prieta earthquake were soft-story
buildings. Because soft-story buildings have been identified as a significant housing issue, some
Bay Area jurisdictions “have already developed and adopted policies to take inventory, assess
and retrofit these buildings” (ABAG, 2016, p. 6). To plan for a soft-story retrofit, there are five
steps that a jurisdiction must follow. Figure 1 illustrates the steps that need to be taken to
establish a soft-story retrofit program (ABAG, 2016).
7
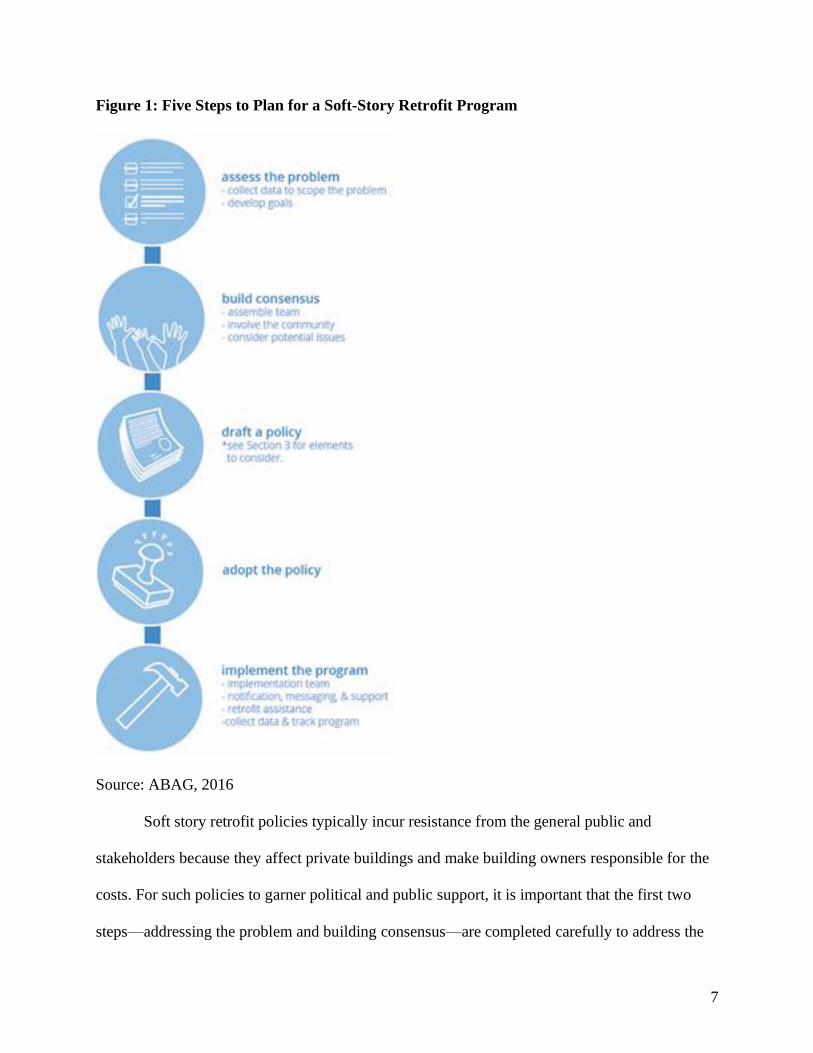
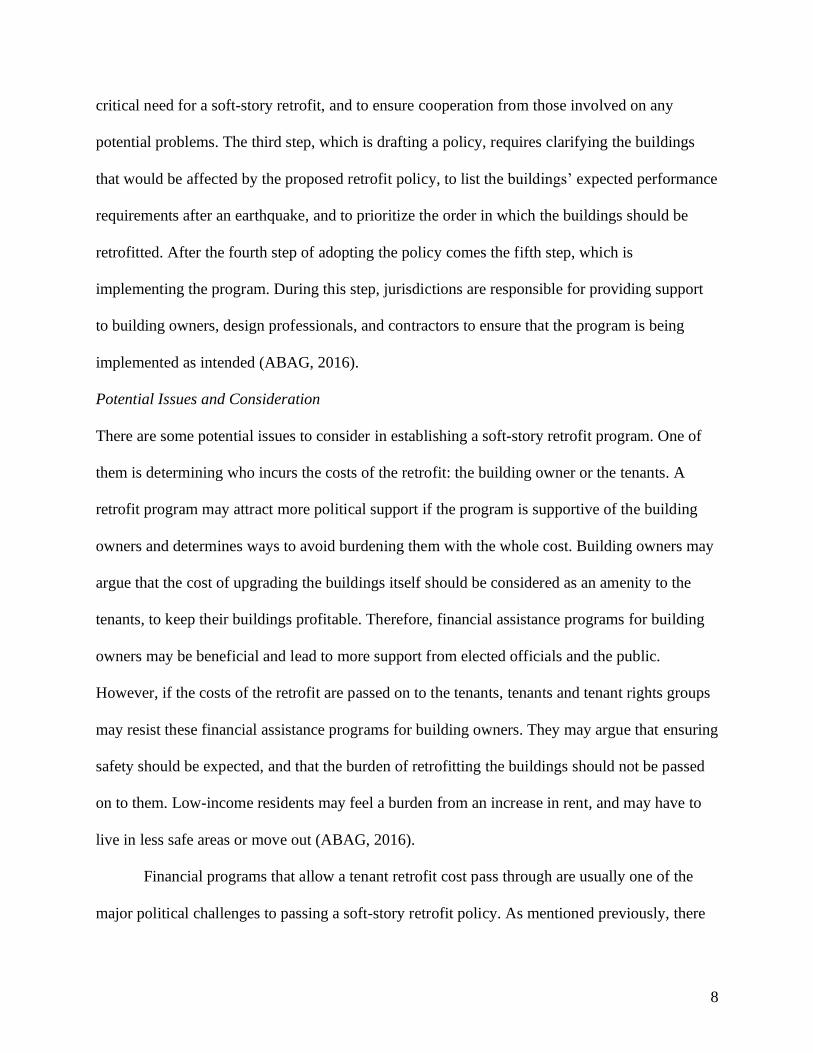
Figure 1: Five Steps to Plan for a Soft-Story Retrofit Program
Source: ABAG, 2016
Soft story retrofit policies typically incur resistance from the general public and
stakeholders because they affect private buildings and make building owners responsible for the
costs. For such policies to garner political and public support, it is important that the first two
steps—addressing the problem and building consensus—are completed carefully to address the
8
critical need for a soft-story retrofit, and to ensure cooperation from those involved on any
potential problems. The third step, which is drafting a policy, requires clarifying the buildings
that would be affected by the proposed retrofit policy, to list the buildings’ expected performance
requirements after an earthquake, and to prioritize the order in which the buildings should be
retrofitted. After the fourth step of adopting the policy comes the fifth step, which is
implementing the program. During this step, jurisdictions are responsible for providing support
to building owners, design professionals, and contractors to ensure that the program is being
implemented as intended (ABAG, 2016).
Potential Issues and Consideration
There are some potential issues to consider in establishing a soft-story retrofit program. One of
them is determining who incurs the costs of the retrofit: the building owner or the tenants. A
retrofit program may attract more political support if the program is supportive of the building
owners and determines ways to avoid burdening them with the whole cost. Building owners may
argue that the cost of upgrading the buildings itself should be considered as an amenity to the
tenants, to keep their buildings profitable. Therefore, financial assistance programs for building
owners may be beneficial and lead to more support from elected officials and the public.
However, if the costs of the retrofit are passed on to the tenants, tenants and tenant rights groups
may resist these financial assistance programs for building owners. They may argue that ensuring
safety should be expected, and that the burden of retrofitting the buildings should not be passed
on to them. Low-income residents may feel a burden from an increase in rent, and may have to
live in less safe areas or move out (ABAG, 2016).
Financial programs that allow a tenant retrofit cost pass through are usually one of the
major political challenges to passing a soft-story retrofit policy. As mentioned previously, there
9
is resistance on both sides when deciding who should be burdened with the costs. For example,
in Los Angeles, the city council took more than a year to pass a cost-sharing policy for seismic
retrofits. Furthermore, it would be difficult to pass a retrofit policy if rent control did not exist in
the jurisdiction. Each jurisdiction decides how much of the cost can be passed through to the
tenants, so it is advisable to include the local rent board in these discussions. In San Francisco,
100% of the costs are allowed to be passed through to tenants so long as there is no more than a
$30.00 or 10% increase to each tenant’s annual base rent (whichever is greater), while in Los
Angeles, only 50% of the costs are allowed to be passed through to tenants, with no more than a
$38 per month increase in rent per tenant (ABAG, 2016).
In addition, a soft-story retrofit may affect the structure of the building’s ground story, as
it may require bulky structures to be built. This may cause a reduction in the number of parking
spots available during and after construction. Therefore, tenants should be provided details about
their rights should they lose their parking spaces due to the soft-story retrofit. The building
owners could be provided accommodations in zoning ordinances for parking requirements
(ABAG, 2016).
When buildings are subjected to a soft-story retrofit ordinance, the ordinance should
clarify that owners are responsible for maintaining safe buildings in the event of a disaster. After
an earthquake, those who have experienced injuries may blame building owners for being
negligent in keeping their buildings up to code. Jurisdictions have the ability to impact owners’
liability in the wake of a future earthquake by identifying affected buildings and setting retrofit
standards and compliance deadlines (ABAG, 2016).
10
Phasing and Deadlines
Many programs have established tiered systems that permit more time for the retrofitting of
certain types of buildings than they do for others. Those buildings assigned to the highest priority
level must be retrofitted more quickly than other buildings. In the case of San Francisco, the city
government developed a tiered system that stipulated that buildings that had many occupants, or
that housed high-risk populations, had to be retrofitted sooner than others. Thus, Tier 1 buildings
are educational, assembly, or residential care facilities. Tier 2 buildings are buildings with 15 or
more dwelling units. Tier 3 buildings are those buildings that do not fall within another tier. Tier
4 buildings are those with the most recent compliance date, and that have ground-floor
commercial use, or are in a liquefaction zone. Tier 4 building owners are given more time to
retrofit their buildings due to the buildings’ more complex nature. Tenants may be displaced
during the process of a Tier 4 retrofit, or the building may be in a liquefaction zone.
Additionally, these tiers were established to prevent the city from receiving an overwhelming
number of permit requests and plans at the same time (ABAG, 2016).
San Francisco’s Mandatory Soft Story Program
In 2013, San Francisco passed the Soft Story Seismic Retrofit Ordinance, which requires a
mandatory seismic retrofit of wood-framed soft-story properties (Pino & Enright, 2019).
This ordinance was created by Mayor Ed Lee and the city’s Earthquake Safety
Implementation Program (ESIP) (San Francisco Department of Building Inspection
[SFDBI], n.d.-a). ESIP is a 30-year plan that aims to improve San Francisco’s resilience
and strength in the face of earthquakes (SFDBI, n.d.-a). Because soft-story buildings were
identified as the city’s biggest risk, the Mandatory Seismic Retrofit Program was
established (SFDBI, n.d.-a). The program mandated retrofits for multi-family and wood-
11
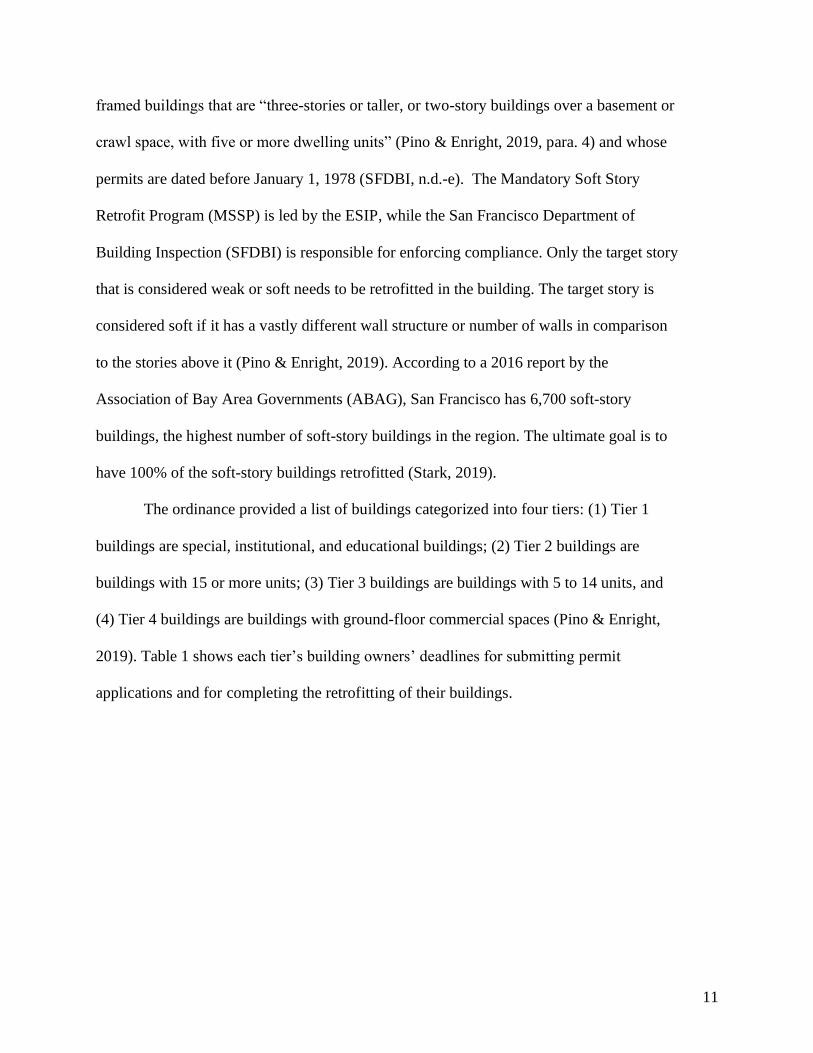
framed buildings that are “three-stories or taller, or two-story buildings over a basement or
crawl space, with five or more dwelling units” (Pino & Enright, 2019, para. 4) and whose
permits are dated before January 1, 1978 (SFDBI, n.d.-e). The Mandatory Soft Story
Retrofit Program (MSSP) is led by the ESIP, while the San Francisco Department of
Building Inspection (SFDBI) is responsible for enforcing compliance. Only the target story
that is considered weak or soft needs to be retrofitted in the building. The target story is
considered soft if it has a vastly different wall structure or number of walls in comparison
to the stories above it (Pino & Enright, 2019). According to a 2016 report by the
Association of Bay Area Governments (ABAG), San Francisco has 6,700 soft-story
buildings, the highest number of soft-story buildings in the region. The ultimate goal is to
have 100% of the soft-story buildings retrofitted (Stark, 2019).
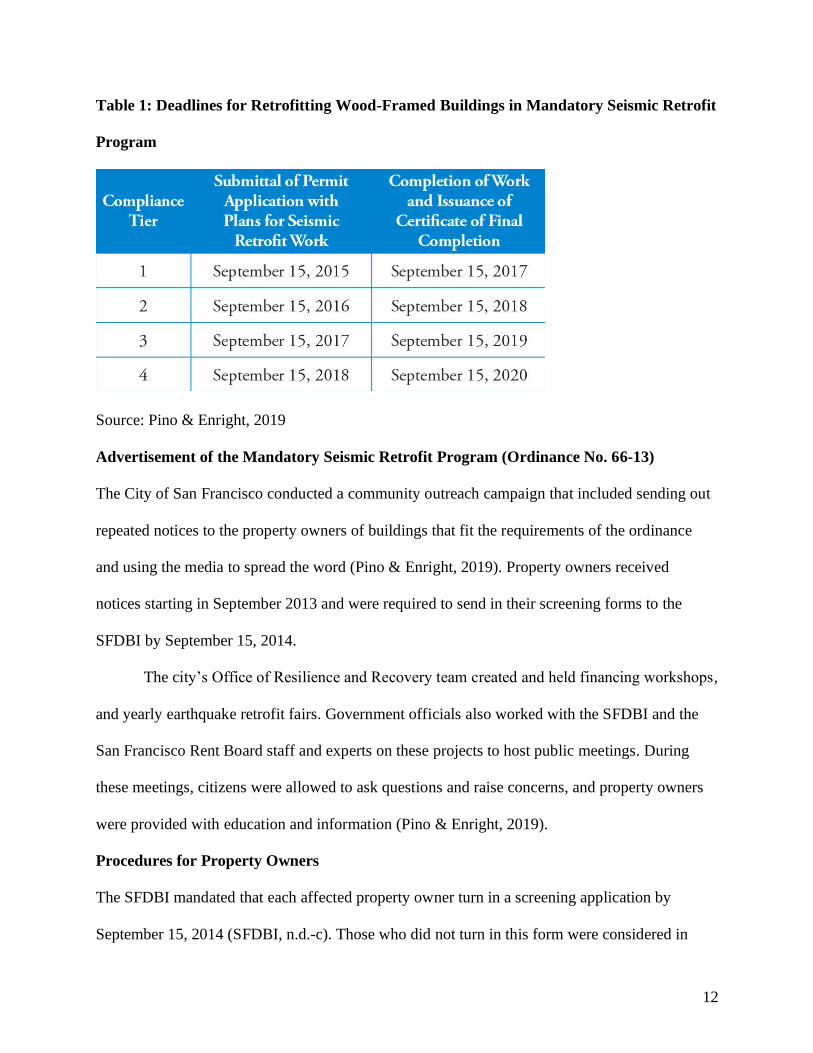
The ordinance provided a list of buildings categorized into four tiers: (1) Tier 1
buildings are special, institutional, and educational buildings; (2) Tier 2 buildings are
buildings with 15 or more units; (3) Tier 3 buildings are buildings with 5 to 14 units, and
(4) Tier 4 buildings are buildings with ground-floor commercial spaces (Pino & Enright,
2019). Table 1 shows each tier’s building owners’ deadlines for submitting permit
applications and for completing the retrofitting of their buildings.
12
Table 1: Deadlines for Retrofitting Wood-Framed Buildings in Mandatory Seismic Retrofit
Program
Source: Pino & Enright, 2019
Advertisement of the Mandatory Seismic Retrofit Program (Ordinance No. 66-13)
The City of San Francisco conducted a community outreach campaign that included sending out
repeated notices to the property owners of buildings that fit the requirements of the ordinance
and using the media to spread the word (Pino & Enright, 2019). Property owners received
notices starting in September 2013 and were required to send in their screening forms to the
SFDBI by September 15, 2014.
The city’s Office of Resilience and Recovery team created and held financing workshops,
and yearly earthquake retrofit fairs. Government officials also worked with the SFDBI and the
San Francisco Rent Board staff and experts on these projects to host public meetings. During
these meetings, citizens were allowed to ask questions and raise concerns, and property owners
were provided with education and information (Pino & Enright, 2019).
Procedures for Property Owners
The SFDBI mandated that each affected property owner turn in a screening application by
September 15, 2014 (SFDBI, n.d.-c). Those who did not turn in this form were considered in
13
violation of the San Francisco Building Code (SFDBI, n.d.-c). After the screenings were
completed, the property owners were assigned two tasks: (1) to obtain a construction permit and
(2) to complete the retrofit work, with deadlines depending on the tier of building that they
owned or managed (SFDBI, n.d.-c). These deadlines are ongoing. Prior to submitting their
permit applications, property owners in each tier must collaborate with licensed design
professionals to create plans and perform calculations (SFDBI, n.d.-c). After they have worked
with the licensed design professionals, they must go to the SFDBI to submit their permit
applications. Once these applications have been submitted, retrofit work is allowed to be
performed (SFDBI, n.d.-c). During this stage, required inspections must be accounted for and the
district inspector must be contacted (SFDBI, n.d.-c). All special inspections must be performed
and signed off on before the final inspection is allowed to take place (SFDBI, n.d.-c). During the
final inspection, when the building inspector has signed off on the job card, the property owner
must request a certificate of final completion (CFC; SFDBI, n.d.-c). The CFC is a document that
declares that a building is safe and sound for people to occupy (SFDBI, n.d.-d). The building
owner has to send the CFC to the MSSP via email or take it to Window #8 on the first floor of
1660 Mission Street in San Francisco (SFDBI, n.d.-g). The CFC confirms that they are in
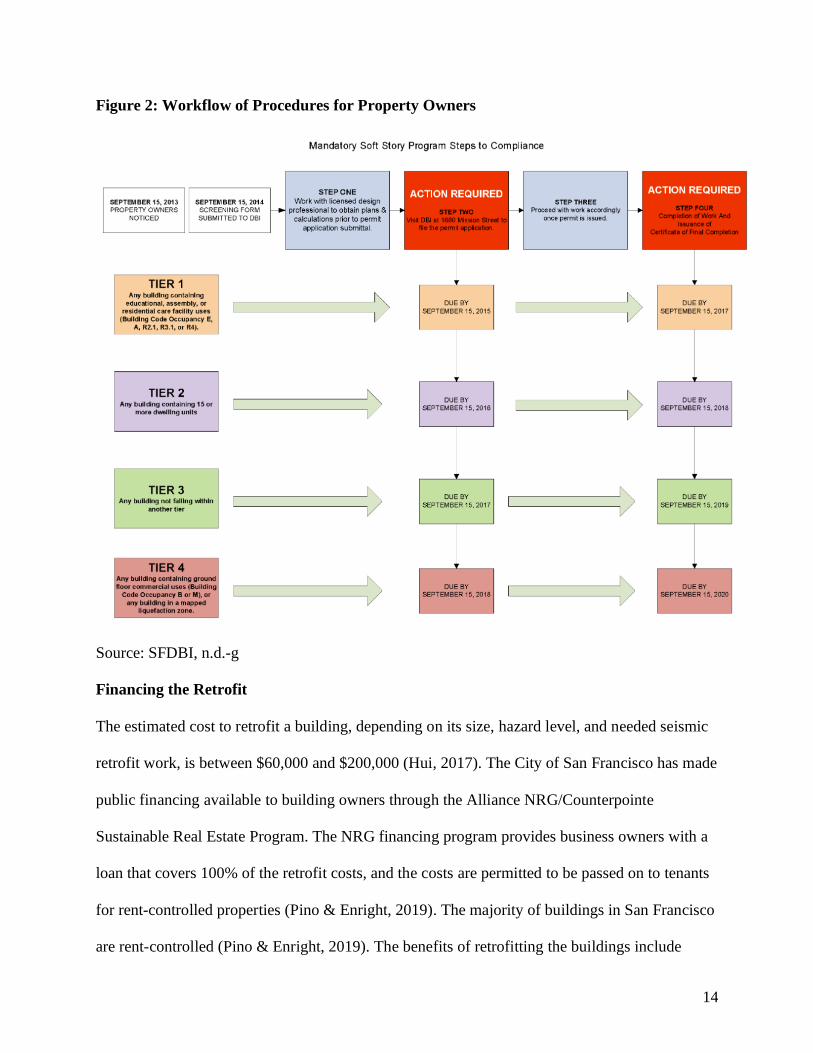
compliance with the MSSP (SFDBI, n.d.-g). Figure 2 details the steps that property owners must
take, as described above.
14
Figure 2: Workflow of Procedures for Property Owners
Source: SFDBI, n.d.-g
Financing the Retrofit
The estimated cost to retrofit a building, depending on its size, hazard level, and needed seismic
retrofit work, is between $60,000 and $200,000 (Hui, 2017). The City of San Francisco has made
public financing available to building owners through the Alliance NRG/Counterpointe
Sustainable Real Estate Program. The NRG financing program provides business owners with a
loan that covers 100% of the retrofit costs, and the costs are permitted to be passed on to tenants
for rent-controlled properties (Pino & Enright, 2019). The majority of buildings in San Francisco
are rent-controlled (Pino & Enright, 2019). The benefits of retrofitting the buildings include
15
increased protection for tenants and properties (Collins, 2017). Thus, the San Francisco Rent
Board allows 100% of costs of the seismic work required by law to be passed through to the
tenants, so long as there is no more than a 10% increase to each tenant’s annual rent (San
Francisco Rent Board, n.d.). If the cost of the passthrough exceeds the 10% increase, the rest of
the cost of the passthrough can be added to the rent the following year(s) (Collins, 2017).
However, tenants who are facing financial hardship have the option to submit a hardship appeal
application for passthroughs (SFDBI, n.d.-b). If the property owner decides to pay for the costs
of the retrofit or seek a loan from a bank, they face restrictions on the kinds of costs that can be
transferred to the tenants (Pino & Enright, 2019).
Notices of Violation
To enforce and advertise compliance, placards were posted and notices of violation (NOVs) were
sent to building owners who were non-compliant with the MSSP (SFDBI, n.d.-f). These
placards, which featured the words “Earthquake Warning!” in big, bold and red letters, warned
residents, property owners, and the public that the property owner(s) were not in compliance
with the Mandatory Soft Story Retrofit Program (Pino & Enright, 2019). Those who were
considered in violation were those property owners who had unsuccessfully completed the
screening process, who had not completed the retrofit of their buildings in accordance with the
compliance tier timeline dates, or who had not applied for a permit by the deadline (SFDBI, n.d.-
f). If the property owners failed to resolve their NOVs, they were required to attend a director’s
hearing to explain the reasons for non-compliance (SFDBI, n.d.-f). Additional costs were also
applied to the property, including the cost of the time that inspectors spent urging the property
owners to comply with the program (SFDBI, n.d.-f).
16
LITERATURE REVIEW
Soft-Story Ordinance in Los Angeles
In December 2014, the City of Los Angeles established the Resilience by Design initiative
to strengthen the city’s built environment against earthquake vulnerabilities, as well as to
protect the economy and lives of citizens by preparing the city to recover efficiently from
future earthquakes. In response to this initiative, Ordinance No. 183983 was signed into
law in October 2015; it was amended in January 2016, creating Ordinance No. 184081.
Ordinance No. 183983 and Ordinance No. 184081 require buildings with soft, weak, and
open-front wall lines and building permits issued before 1978 to be retrofitted. According
to the Los Angeles Department of Building and Safety, there are about 13,500 affected
buildings in total. The property owners are responsible for the costs of the retrofit, but if
the retrofit is completed by the specified timeline, they can apply for the city’s Seismic
Retrofit Program (Kang, Yi, & Burton, 2019). The Seismic Retrofit Work Cost Recovery
Program allows the property owners to temporarily increase the rent equally among all
rental units so they can recover up to 50% of the retrofit cost (Los Angeles Housing
Community Investment Department, n.d.).
Kang et al. (2019) explored the post-earthquake recovery-related benefits of the
city’s soft-story ordinance in five particular neighborhoods: Koreatown, Westlake, Pico
Union, Lomita, and East Hollywood. There are about 8,000 soft-story buildings in these
five neighborhoods. Kang et al. (2019) found that the ordinance would reduce the initial
post-earthquake mean loss of occupancy by about 25%. However, if the considered
recovery performance metric were set to restoring 90% occupancy, there would be a 64%
reduction as a result of the ordinance retrofit. The researchers came to these numbers by
completing a scenario-based damage assessment and using a specific model to illustrate
17
post-earthquake recovery. Another particular area of study was the effect of the city’s
ordinance on post-earthquake recovery trajectories. In comparison to the other four
neighborhoods, Koreatown had the highest percentage of soft, weak, and open-front
buildings at 28%. Kang et al. (2019) also found that the retrofit was projected to “reduce
the initial loss of occupancy in Koreatown by 45% compared to 25% when considering all
neighborhoods” (p. 181). The soft-story ordinance in Los Angeles is expected to have a
significant impact on the loss of occupancy after an earthquake.
Berkeley’s Soft-Story Retrofits
When the 1996 Northridge earthquake occurred in the Los Angeles area, the soft first story of the
Northridge Meadows apartment building failed and killed 16 people who resided in first-floor
apartments while they slept. This caused California cities to inventory their soft first-story
buildings to understand the community’s risk from such structures (Comerio, 1998). The ground
level of a building is much weaker and more flexible than other levels, putting it at greater risk of
collapse (Lindt et al., 2014). Samant et al. (2009) stated that in the event of a large earthquake,
the ground-level walls of soft-story buildings would be unable to support the stories above the
ground floors of the buildings. The ground-level walls would sway back and forth or shift
sideways, potentially resulting in building collapse, with the ground floors demolished.
Although many residential buildings are built using a woodframe construction, the partial
or entire first stories of such buildings are oftentimes used for parking. The first story of such a
building accordingly has fewer walls and partitions in comparison to the stories above. In some
areas of California, such as Los Angeles and San Francisco, two- to five-story wood-framed
buildings are typically used for multifamily dwellings. The upper stories are occupied by
residents (Burton, Rad, Yi, Gutierrez, & Ojuri, 2019). Among those that inventoried their
18
building stock, the City of Berkeley discovered that there were 321 wood-framed soft-story
buildings that contained over 3,200 housing units. As a result, in 2005, the city established an
ordinance that mandated that owners of soft-story buildings identify the weaknesses in the
buildings and propose possible solutions. They were required to post signs to alert tenants that
the buildings were seismically at risk. Signed into law on January 4, 2014, a new ordinance
required the rest of the soft-story buildings to be retrofitted, and included wood-framed buildings
built before 1978 (City of Berkeley, n.d.). By the end of 2016, owners of these soft-story
buildings were required to apply for building permits and were given two years to complete the
retrofits. As of October 2, 2015, there were 124 buildings that had yet to be retrofitted.
Public Policy and Mitigating Earthquake Risks
Based on a nine-year, $1 million-dollar study conducted by the Community Action Plan for
Seismic Safety (CAPSS), “43 to 80 percent of multi-story wood frame buildings in San
Francisco will be deemed unsafe after a magnitude 7.2 earthquake” (Lindt et al., 2014). Comerio
(2004) reviewed data collected from a variety of large earthquakes and stated that building
damage is the primary type of damage that occurs. Soft-story buildings are one of the biggest
threats to a city in the event of an earthquake (Porter & Cobeen, 2012). Earthquakes can be
viewed as a housing disaster, since they not only damage homes but also require victims to be
rehoused and require building owners to shoulder the costs of repairing and rebuilding the
buildings. The Loma Prieta earthquake heavily affected single-room occupancy hotels in San
Francisco, Oakland, and Santa Cruz and caused residents to become homeless (Comerio, 2004).
In response, the SFDBI established CAPSS to develop a plan to decrease the risk of earthquakes
in the city (Porter & Cobeen, 2012). CAPSS also developed repair plans and guidelines that
would help with recovery after an earthquake (Samant et al., 2009). Participants in CAPSS
19
argued that seismic risk was a community issue that was far more significant than the individual
concerns of building owners who may have the retrofit costs imposed on them. The CAPSS
advisory committee met numerous times and came to the consensus that there was a need for an
ordinance requiring the retrofit of high-occupancy, soft-story wood-framed buildings (Porter &
Cobeen, 2012).
Moreover, building owners were oftentimes uninsured, so the public was left to manage
the housing crisis. An example of the government implementing policies in order to mitigate
potential losses in the aftermath of disasters is when California funded the retrofit of state-owned
buildings that had poor seismic structures. This type of policy/program aimed to protect a portion
of the public building stock, but it was difficult to encourage owners of private buildings to
explore implementing similar pre-earthquake mitigation efforts (Comerio, 2004).
According to Comerio (2004), one of the basic policy approaches to reduce the
impact of disasters and encourage safe development is implementing policies that include
preparedness information, building codes, and insurance. It is obvious that establishing
building codes prevents potential damage from earthquakes and other natural disasters, but
building codes are generally focused on new buildings. In fact, the high rate of deaths from
earthquakes is generally due to a lack of enforcement of building regulations. In the United
States, building codes and practices differ between urban and rural areas and among states.
In fact, CAPSS conducted a study to analyze the potential consequences for multi-unit,
soft-story wood-framed dwellings in the event of several moderate to large earthquakes. If
several moderate to large earthquakes were to occur, an estimated tens of thousands of people
who live in these affected homes would be displaced. A mandatory retrofit would significantly
decrease this risk (Samant et al., 2009).
20
Many states provide information on how to make buildings more disaster-resistant but do
not make it mandatory for owners to perform the upgrades. Oftentimes, it can be difficult to
compel owners to provide these basic safety measures. For instance, after Hurricane Andrew,
Florida attempted to enforce a state-wide building code, but rural jurisdictions opposed it. As a
result, Florida developed a state building code that brought codes to areas that did not have any,
while having the unintended consequence of weakening the hurricane safety requirements in
other areas that already had codes. The City of Berkeley has been successful in enforcing
earthquake mitigation for public and private buildings. The government offered homeowners an
incentive, indicating that if the homeowners performed structural retrofitting of their houses, the
city would offer them a real estate transfer tax rebate. Due to this incentive, 38% of houses in
Berkeley have been seismically retrofitted. Berkeley was also successful in adding seismic
improvements to its city hall (Comerio, 2004).
In addition, because of past experiences with a lack of availability of commercial
hazard insurance, the Federal Emergency Management Agency (FEMA) has encouraged
local governments to make buildings and infrastructure disaster-resistant, thus helping to
avoid damage that may necessitate insurance payouts. Since bridges and buildings that
have been retrofitted have suffered less damage from disasters than they would have
without the retrofitting, it is apparent that encouraging earthquake and hazard mitigation
improvements would result in lower federal and personal recovery costs from future
events. Although it has been proven that mitigation efforts can prevent further losses, the
real estate market does not provide incentives for building owners to complete seismic
retrofits, such as allowing them to collect increased rent or increasing the value of their
building (Comerio, 2000).
21
Comerio (2004) stated that the ABAG conducted a study in 1999 that found that Berkeley
residents’ high income and education levels combined with the local government’s outreach and
information campaign efforts could have played a role in the city’s success in earthquake
mitigation. Governments should create initiatives and policies with incentives such as tax credits
and established relationships with lenders to associate disaster mitigation with beneficial loan
rates. Lindt et al. (2014) suggested that a policy that accommodates residents and building
owners fosters public support, and such support hastens the implementation of the policy.
Additionally, Comerio (2004) mentioned that successful mitigation policies are those that are not
restrictive and that explore ideas for how individuals, businesses, and public institutions can
establish basic safety requirements for buildings. If cities do not allow building owners to
increase rent, the cities struggle to mandate property owners to seismically retrofit their
properties due to the expensive costs. Thus, enforcing mitigation is difficult without providing
incentives (Comerio, 2000). Liou and Kapucu (2014) determined that effective disaster recovery
programs require a stronger framework for accountability. Their research showed “the weakness
of general policies and guidelines and the need for specific standards to assure the quality in
policy implementation and performance outcome” (p. 455).
22
METHODOLOGY
Design
The research is based on a program evaluation of the San Francisco MSSP. According to Sylvia
and Sylvia (2012), a program evaluation is conducted to determine whether a given program is
achieving its goal: in this case, of ensuring that the identified buildings are retrofitted. A survey
was distributed to owners of Tier 2 and Tier 3 residential buildings. Only those building owners
who had received CFCs were contacted, since they had already completed all necessary work
related to retrofitting their building. Building owners from Tier 4 were not contacted because
their CFCs are not due until September 15, 2020.
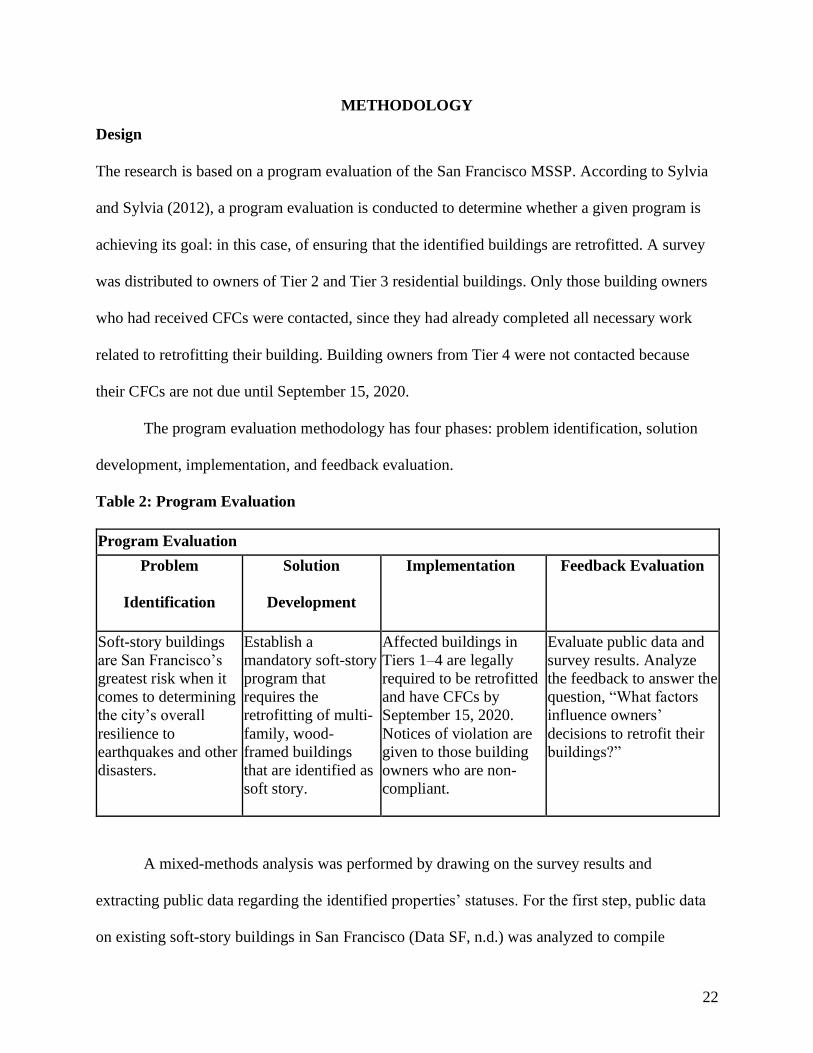
The program evaluation methodology has four phases: problem identification, solution
development, implementation, and feedback evaluation.
Table 2: Program Evaluation
Program Evaluation
Problem
Identification
Solution
Development
Implementation Feedback Evaluation
Soft-story buildings
are San Francisco’s
greatest risk when it
comes to determining
the city’s overall
resilience to
earthquakes and other
disasters.
Establish a
mandatory soft-story
program that
requires the
retrofitting of multi-
family, wood-
framed buildings
that are identified as
soft story.
Affected buildings in
Tiers 1–4 are legally
required to be retrofitted
and have CFCs by
September 15, 2020.
Notices of violation are
given to those building
owners who are non-
compliant.
Evaluate public data and
survey results. Analyze
the feedback to answer the
question, “What factors
influence owners’
decisions to retrofit their
buildings?”
A mixed-methods analysis was performed by drawing on the survey results and
extracting public data regarding the identified properties’ statuses. For the first step, public data
on existing soft-story buildings in San Francisco (Data SF, n.d.) was analyzed to compile
23
statistical information on the properties that have been retrofitted. The researcher used data from
the week of April 4, 2020. Part I of this study involved analyzing quantitative data extracted
from the city’s public data. The researcher counted how many Tier 2 and Tier 3 building retrofits
have been completed and were issued CFCs, and compared the number to the retrofit rate. In
addition, the average median income of each of the supervisorial districts of the target buildings
was identified, and the retrofit rates of the districts were compared.
Part II of this study involved analyzing qualitative data from the survey results. For the
second step, in order to find out the common factors that motivated the building owners’
decisions to retrofit, a survey was created. The distribution of responses to the survey indicates
common factors that may have played a role in owners’ decisions to retrofit. Finally, the
researcher identified the common factors that are correlated with the highest retrofit rate; this
information is useful for other current or future soft story programs to consider. The researcher
investigated how to improve retrofit programs for other cities, using San Francisco as a model
for finding out which factors influence building owners’ decisions about whether to retrofit.
Data
The researcher researched each of the 2,963 Tier 2 and Tier 3 properties that had been retrofitted
to find the property owner’s or property manager’s contact information, whether their phone
number or email address. If the property owner’s contact information was not available, the
researcher attempted to identify the property manager’s contact information. The survey data
was collected through phone calls, emails, and Qualtrics, an online survey tool. If the researcher
was only able to find an owner’s or manager’s phone number, the researcher called them. Each
time the researcher called an identified phone number, the researcher asked to speak to the
24
building owner or property manager, introduced herself, explained the research and the
commitment to confidentiality, and requested the person’s consent to ask the survey questions.
If the researcher only found their email address, the researcher sent them an email. If the
researcher found both their phone number and email address, the researcher attempted to contact
them using both methods. The email invited the owner or manager to respond to the survey by
directly emailing the researcher back, setting up a phone call, or filling out the survey with the
Qualtrics link that was provided in the email. The email also contained an introduction,
explanation of the research, and a statement of confidentiality, and asked for consent to proceed
with the survey. Upon receiving consent, the researcher proceeded with the questions. The
survey asked the following questions:
1. In 2013, Mayor Ed Lee signed legislation that requires all of San Francisco’s “multi-
unit soft-story buildings” to be retrofitted. In addition to the legal requirement, what was
the most important reason to retrofit your building?
a. To maintain and protect the housing stock
b. To enhance and increase the property’s value
c. The ability to pass through 100% of the cost of seismic retrofit work to the
tenants
d. Other. Please explain:
_________________________________________________
2. Is the building rent controlled?
a. Yes
b. No
c. Decline to state
25
3. What is the monthly average unit rent price?
a. $0-$1000
b. $1000-$2000
c. $2000-$3000
d. More than $3000
4. What is your length of ownership?
a. Under 5 years
b. Over 5 years
5. Is the building renter occupied or owner occupied?
a. All renters
b. Owner and renters
c. Decline to state
Of the 2,963 Tier 2 and Tier 3 properties that were retrofitted and issued CFCs, 678 had contact
information available to the researcher. Of the 678 property owners and managers contacted, 101
filled out the survey, which is about a 15% response rate. Thirty-four responded by phone, 45
responded by email, and 22 responded via Qualtrics.
26
FINDINGS
This section presents the results of the research, including the quantitative data (number of
properties retrofitted and the retrofit rate per district) and the response breakdown for each
question in the survey. Public information was obtained from the city’s website. Although the
public data is updated weekly, the research is based on the public data updated on April 4, 2020.
To shed light on common factors that influence owners’ decisions to retrofit, the results include
qualitative data from the survey. The participants were informed that the survey was voluntary
and that no information directly tied to them would be shared. The participants were able to opt
out of any question that they did not want to answer. The survey was administered from June to
September, 2020. Responses were collected via phone, email, and Qualtrics.
The San Francisco MSSP has four tiers. Tier 1 includes “any building containing
educational, assembly, or residential care facility uses (Building Code Occupancy E, A, R2.1,
R3.1, or R4),” Tier 2 includes buildings that have 15 or more units, Tier 3 includes buildings that
do not fall in any of the other tiers, and Tier 4 includes “any building containing ground floor
commercial uses (Building Code Occupancy B or M), or any building in a mapped liquefaction
zone” (SFDBI, n.d.-c, para.4). The reported data includes only residential buildings, which are
Tier 2 and Tier 3 buildings. Tier 1 is not residential, so it was excluded from the data. Because
Tier 4’s deadline for the completion of work and issuance of CFCs was September 15, 2020;
these buildings were thus excluded from the data.
Number of Properties Retrofitted
Table 3 shows the number of properties whose retrofit work is complete and that were issued
CFCs, as well as the retrofit rate of each tier. This table reveals that 83.69% of the total number
of Tier 2 properties requiring retrofitting have had the work completed and have had CFCs
issued, while 74.84% of the total number of Tier 3 properties requiring retrofitting have had the
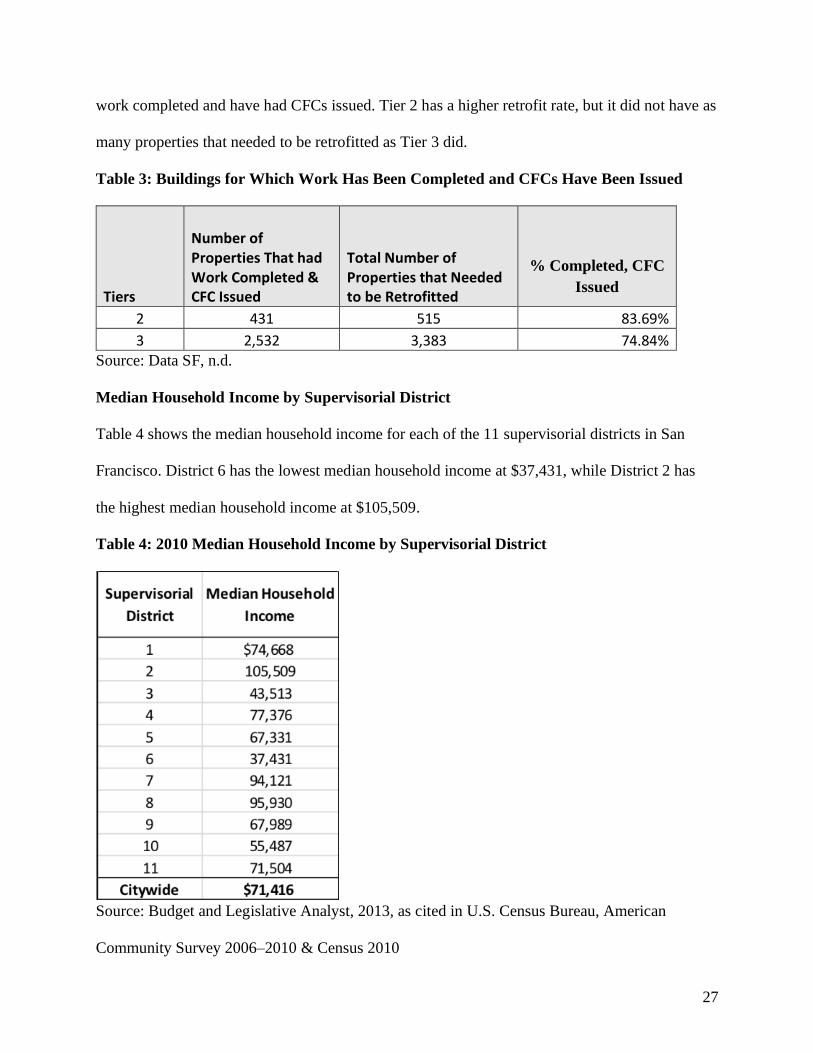
27
work completed and have had CFCs issued. Tier 2 has a higher retrofit rate, but it did not have as
many properties that needed to be retrofitted as Tier 3 did.
Table 3: Buildings for Which Work Has Been Completed and CFCs Have Been Issued
Tiers
Number of Properties That had Work Completed & CFC Issued
Total Number of Properties that Needed to be Retrofitted
% Completed, CFC
Issued
2 431 515 83.69%
3 2,532 3,383 74.84% Source: Data SF, n.d.
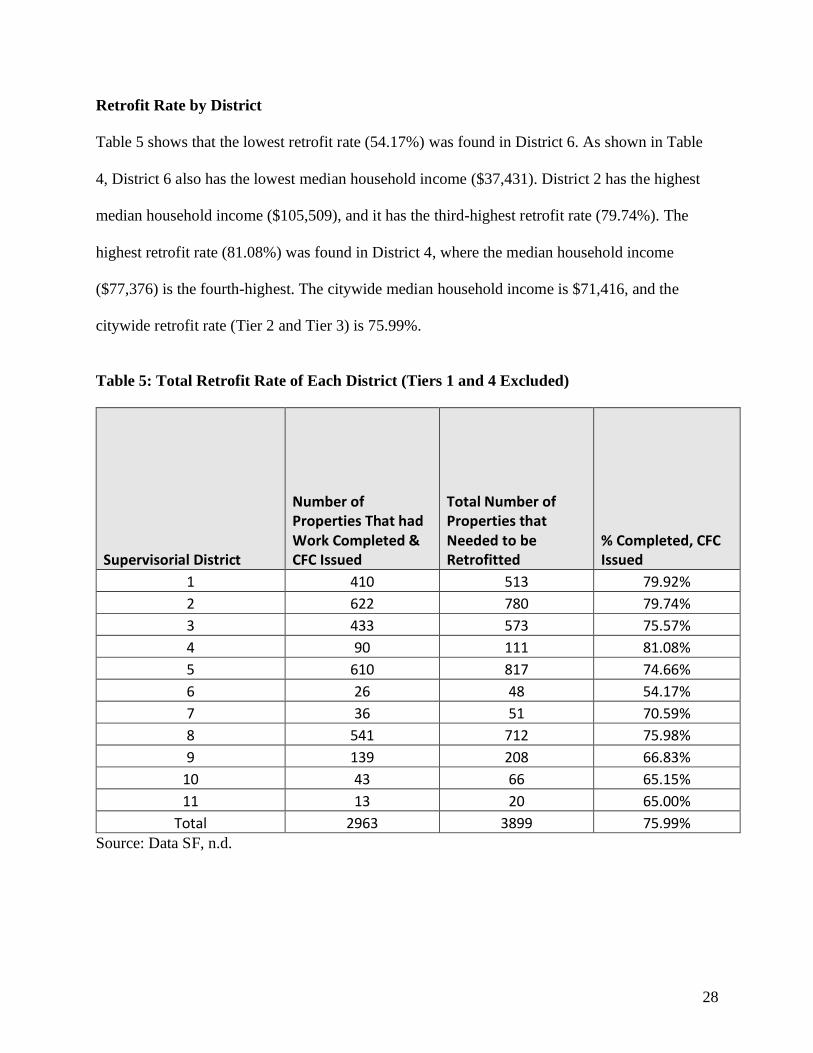
Median Household Income by Supervisorial District
Table 4 shows the median household income for each of the 11 supervisorial districts in San
Francisco. District 6 has the lowest median household income at $37,431, while District 2 has
the highest median household income at $105,509.
Table 4: 2010 Median Household Income by Supervisorial District
Source: Budget and Legislative Analyst, 2013, as cited in U.S. Census Bureau, American
Community Survey 2006–2010 & Census 2010
28
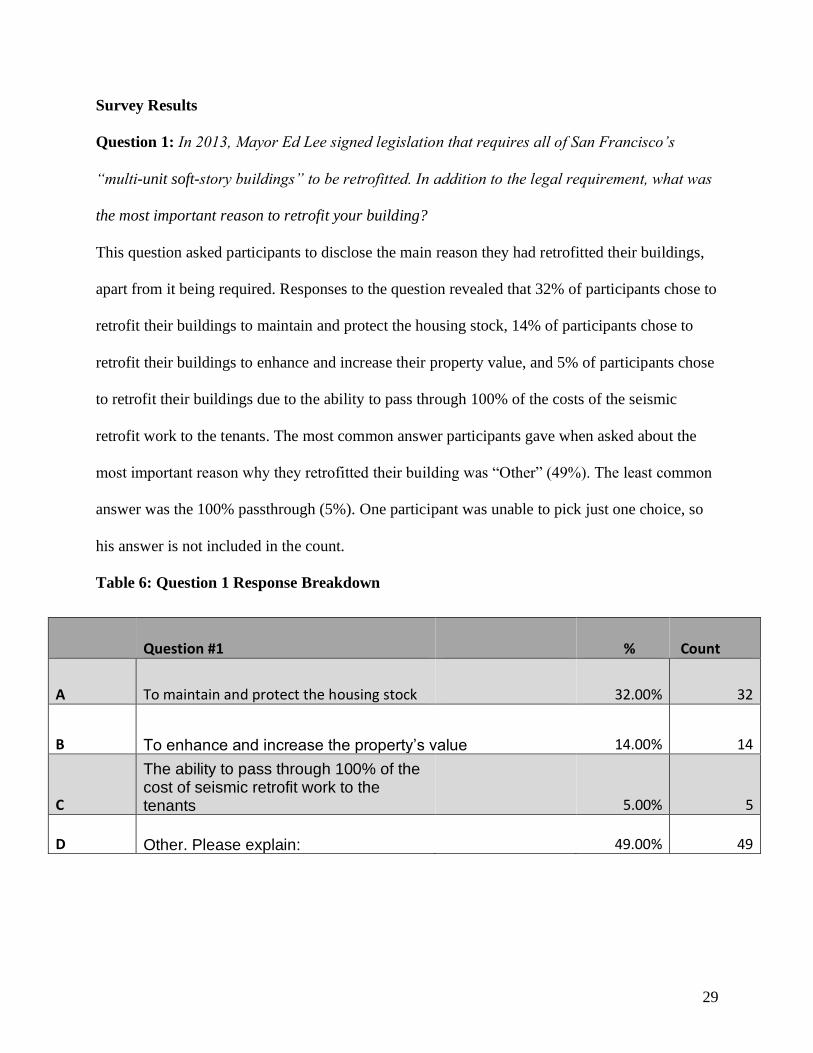
Retrofit Rate by District
Table 5 shows that the lowest retrofit rate (54.17%) was found in District 6. As shown in Table
4, District 6 also has the lowest median household income ($37,431). District 2 has the highest
median household income ($105,509), and it has the third-highest retrofit rate (79.74%). The
highest retrofit rate (81.08%) was found in District 4, where the median household income
($77,376) is the fourth-highest. The citywide median household income is $71,416, and the
citywide retrofit rate (Tier 2 and Tier 3) is 75.99%.
Table 5: Total Retrofit Rate of Each District (Tiers 1 and 4 Excluded)
Supervisorial District
Number of Properties That had Work Completed & CFC Issued
Total Number of Properties that Needed to be Retrofitted
% Completed, CFC Issued
1 410 513 79.92%
2 622 780 79.74%
3 433 573 75.57%
4 90 111 81.08%
5 610 817 74.66%
6 26 48 54.17%
7 36 51 70.59%
8 541 712 75.98%
9 139 208 66.83%
10 43 66 65.15%
11 13 20 65.00%
Total 2963 3899 75.99% Source: Data SF, n.d.
29
Survey Results
Question 1: In 2013, Mayor Ed Lee signed legislation that requires all of San Francisco’s
“multi-unit soft-story buildings” to be retrofitted. In addition to the legal requirement, what was
the most important reason to retrofit your building?
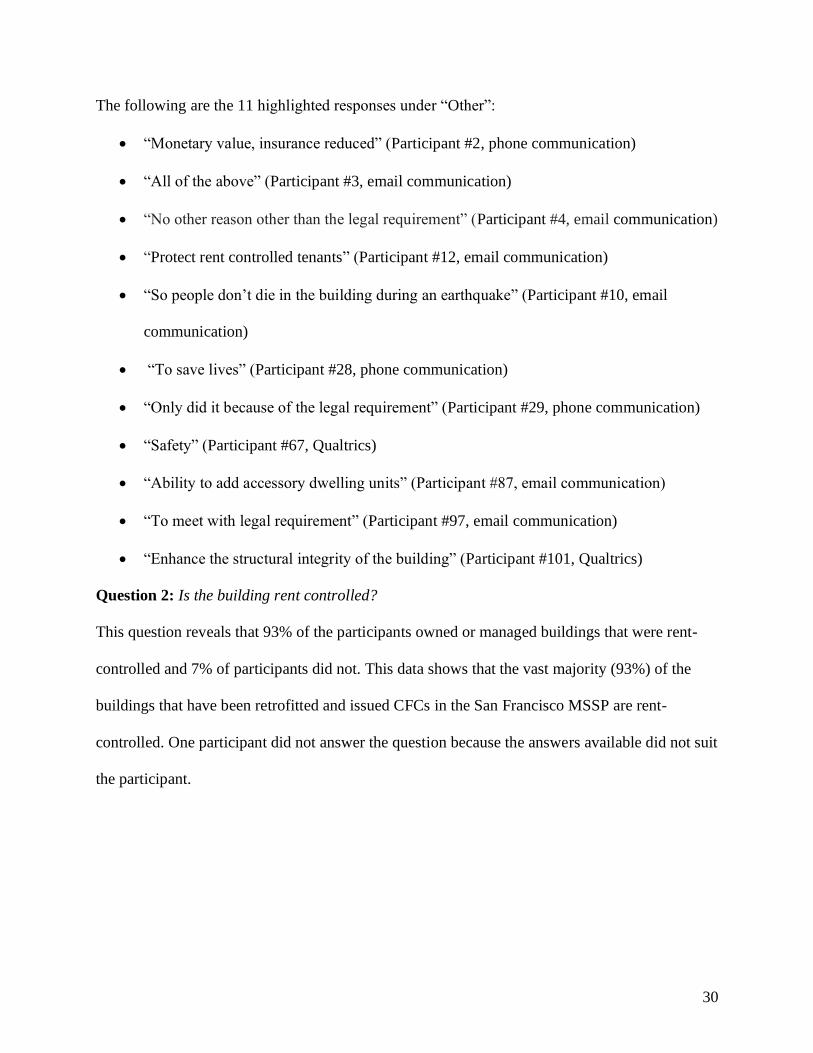
This question asked participants to disclose the main reason they had retrofitted their buildings,
apart from it being required. Responses to the question revealed that 32% of participants chose to
retrofit their buildings to maintain and protect the housing stock, 14% of participants chose to
retrofit their buildings to enhance and increase their property value, and 5% of participants chose
to retrofit their buildings due to the ability to pass through 100% of the costs of the seismic
retrofit work to the tenants. The most common answer participants gave when asked about the
most important reason why they retrofitted their building was “Other” (49%). The least common
answer was the 100% passthrough (5%). One participant was unable to pick just one choice, so
his answer is not included in the count.
Table 6: Question 1 Response Breakdown
Question #1 % Count
A To maintain and protect the housing stock 32.00% 32
B To enhance and increase the property’s value 14.00% 14
C
The ability to pass through 100% of the cost of seismic retrofit work to the tenants 5.00% 5
D Other. Please explain: 49.00% 49
30
The following are the 11 highlighted responses under “Other”:
• “Monetary value, insurance reduced” (Participant #2, phone communication)
• “All of the above” (Participant #3, email communication)
• “No other reason other than the legal requirement” (Participant #4, email communication)
• “Protect rent controlled tenants” (Participant #12, email communication)
• “So people don’t die in the building during an earthquake” (Participant #10, email
communication)
• “To save lives” (Participant #28, phone communication)
• “Only did it because of the legal requirement” (Participant #29, phone communication)
• “Safety” (Participant #67, Qualtrics)
• “Ability to add accessory dwelling units” (Participant #87, email communication)
• “To meet with legal requirement” (Participant #97, email communication)
• “Enhance the structural integrity of the building” (Participant #101, Qualtrics)
Question 2: Is the building rent controlled?
This question reveals that 93% of the participants owned or managed buildings that were rent-
controlled and 7% of participants did not. This data shows that the vast majority (93%) of the
buildings that have been retrofitted and issued CFCs in the San Francisco MSSP are rent-
controlled. One participant did not answer the question because the answers available did not suit
the participant.
31
Table 7: Question 2 Response Breakdown
Question #2 % Count
A Yes 93% 93
B No 7% 7
C Decline to state 0% 0
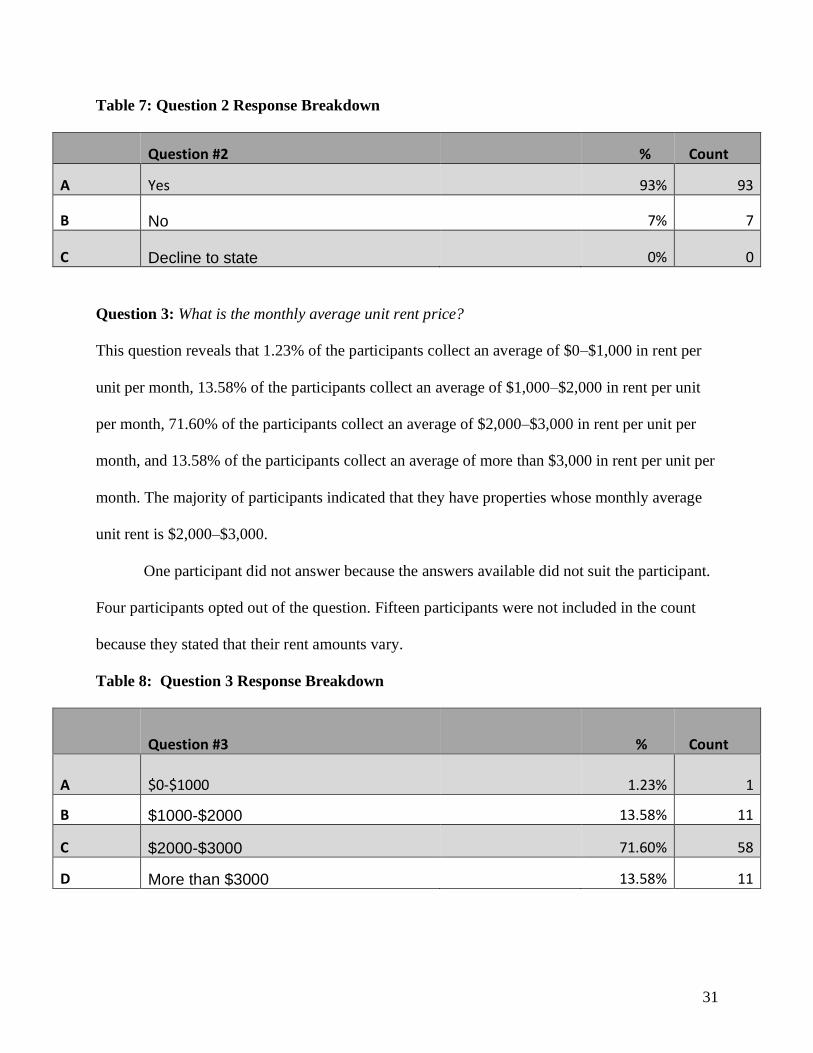
Question 3: What is the monthly average unit rent price?
This question reveals that 1.23% of the participants collect an average of $0–$1,000 in rent per
unit per month, 13.58% of the participants collect an average of $1,000–$2,000 in rent per unit
per month, 71.60% of the participants collect an average of $2,000–$3,000 in rent per unit per
month, and 13.58% of the participants collect an average of more than $3,000 in rent per unit per
month. The majority of participants indicated that they have properties whose monthly average
unit rent is $2,000–$3,000.
One participant did not answer because the answers available did not suit the participant.
Four participants opted out of the question. Fifteen participants were not included in the count
because they stated that their rent amounts vary.
Table 8: Question 3 Response Breakdown
Question #3 % Count
A $0-$1000 1.23% 1
B $1000-$2000 13.58% 11
C $2000-$3000 71.60% 58
D More than $3000 13.58% 11
32
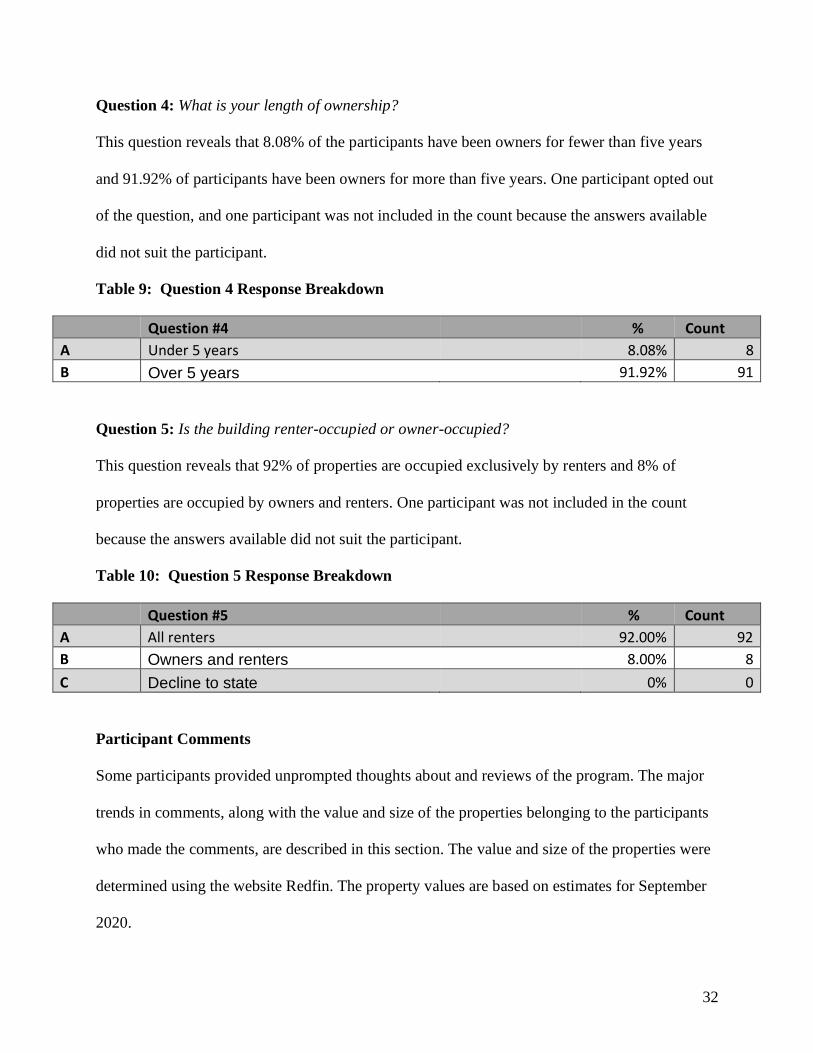
Question 4: What is your length of ownership?
This question reveals that 8.08% of the participants have been owners for fewer than five years
and 91.92% of participants have been owners for more than five years. One participant opted out
of the question, and one participant was not included in the count because the answers available
did not suit the participant.
Table 9: Question 4 Response Breakdown
Question #4 % Count
A Under 5 years 8.08% 8
B Over 5 years 91.92% 91
Question 5: Is the building renter-occupied or owner-occupied?
This question reveals that 92% of properties are occupied exclusively by renters and 8% of
properties are occupied by owners and renters. One participant was not included in the count
because the answers available did not suit the participant.
Table 10: Question 5 Response Breakdown
Question #5 % Count
A All renters 92.00% 92
B Owners and renters 8.00% 8
C Decline to state 0% 0
Participant Comments
Some participants provided unprompted thoughts about and reviews of the program. The major
trends in comments, along with the value and size of the properties belonging to the participants
who made the comments, are described in this section. The value and size of the properties were
determined using the website Redfin. The property values are based on estimates for September
2020.
33
Those who had positive feedback on the San Francisco MSSP managed or owned
buildings that had property values ranging from approximately $2.6 million to $5.8 million
dollars. Those who had negative feedback managed or owned buildings that had property values
ranging from approximately $1.9 million to $3.7 million dollars. There were three properties that
were not included in this breakdown because there was not enough data to generate an accurate
estimate and one property that could not be found on Redfin.
Those who had positive feedback managed or owned buildings with property sizes
ranging from 4,837 square feet to 9,684 square feet. Those who had negative feedback managed
or owned buildings with property sizes ranging from 3,200 square feet to 22,624 square feet.
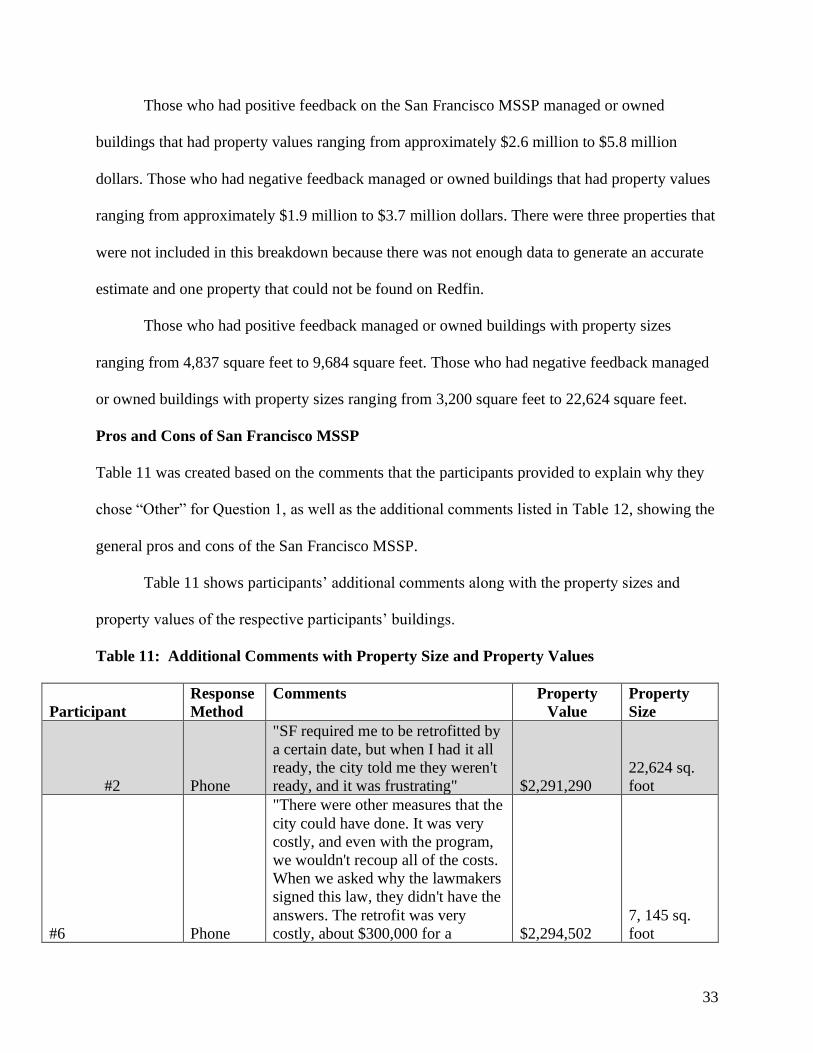
Pros and Cons of San Francisco MSSP
Table 11 was created based on the comments that the participants provided to explain why they
chose “Other” for Question 1, as well as the additional comments listed in Table 12, showing the
general pros and cons of the San Francisco MSSP.
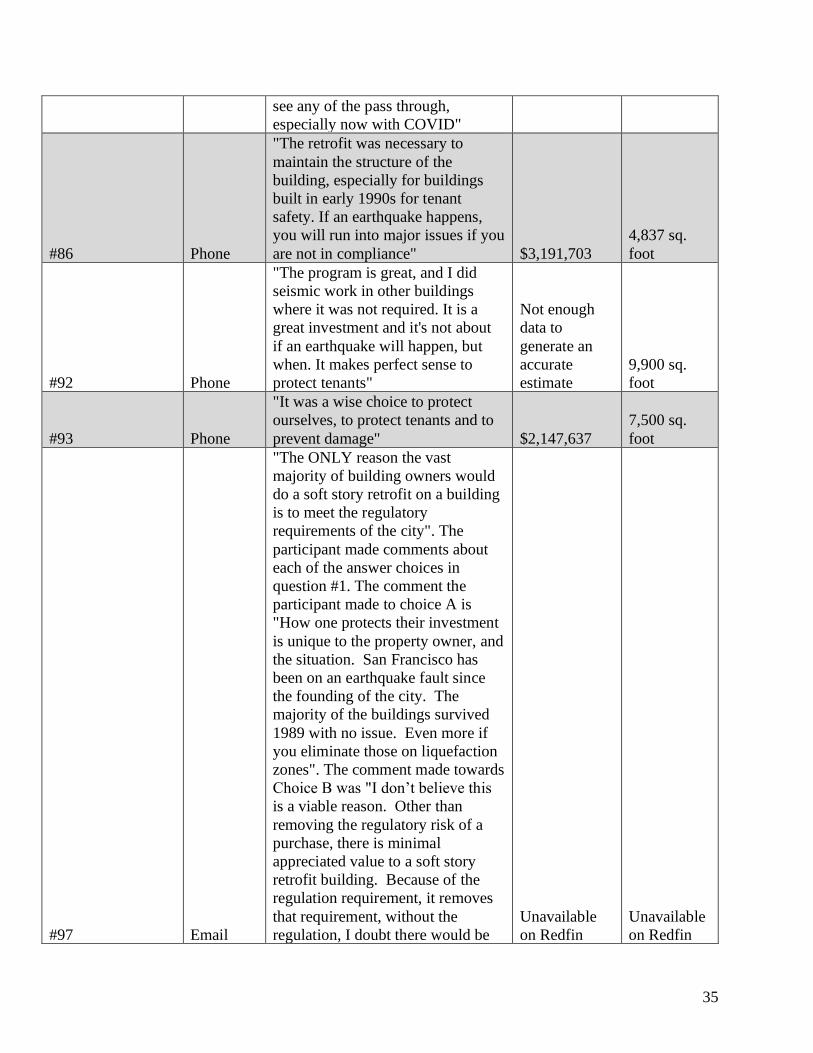
Table 11 shows participants’ additional comments along with the property sizes and
property values of the respective participants’ buildings.
Table 11: Additional Comments with Property Size and Property Values
Participant
Response
Method
Comments Property
Value
Property
Size
#2 Phone
"SF required me to be retrofitted by
a certain date, but when I had it all
ready, the city told me they weren't
ready, and it was frustrating" $2,291,290
22,624 sq.
foot
#6 Phone
"There were other measures that the
city could have done. It was very
costly, and even with the program,
we wouldn't recoup all of the costs.
When we asked why the lawmakers
signed this law, they didn't have the
answers. The retrofit was very
costly, about $300,000 for a $2,294,502
7, 145 sq.
foot
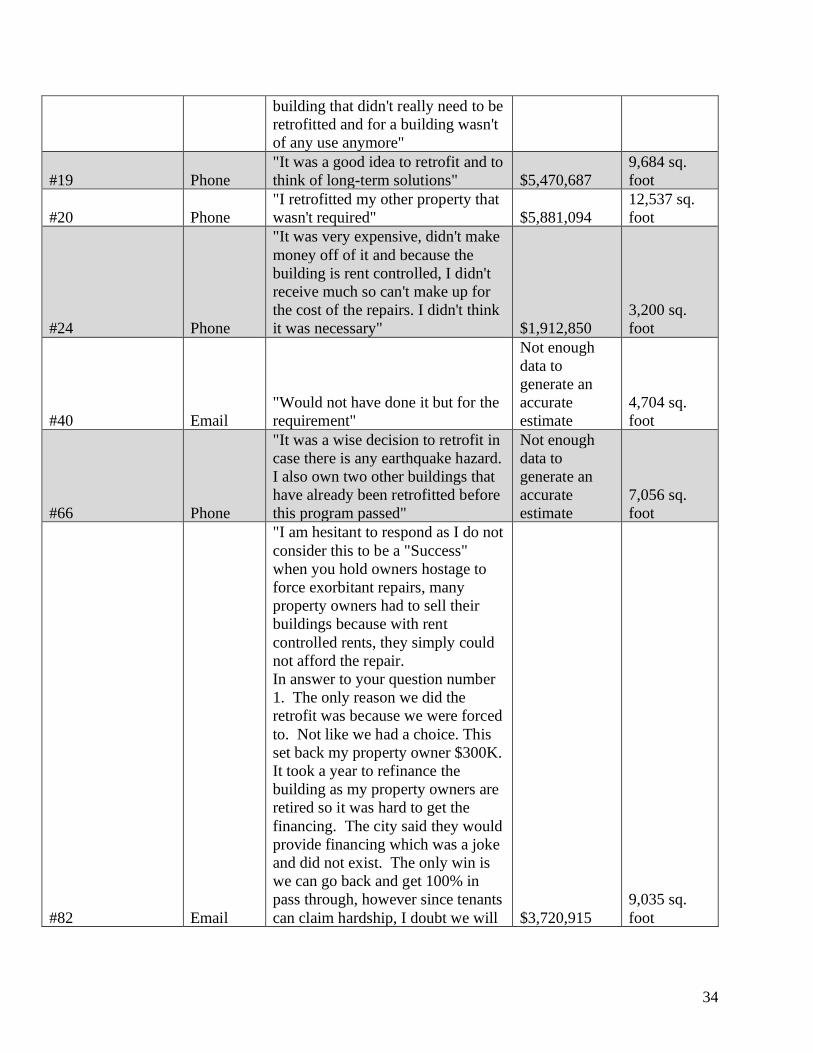
34
building that didn't really need to be
retrofitted and for a building wasn't
of any use anymore"
#19 Phone
"It was a good idea to retrofit and to
think of long-term solutions" $5,470,687
9,684 sq.
foot
#20 Phone
"I retrofitted my other property that
wasn't required" $5,881,094
12,537 sq.
foot
#24 Phone
"It was very expensive, didn't make
money off of it and because the
building is rent controlled, I didn't
receive much so can't make up for
the cost of the repairs. I didn't think
it was necessary" $1,912,850
3,200 sq.
foot
#40 Email
"Would not have done it but for the
requirement"
Not enough
data to
generate an
accurate
estimate
4,704 sq.
foot
#66 Phone
"It was a wise decision to retrofit in
case there is any earthquake hazard.
I also own two other buildings that
have already been retrofitted before
this program passed"
Not enough
data to
generate an
accurate
estimate
7,056 sq.
foot
#82 Email
"I am hesitant to respond as I do not
consider this to be a "Success"
when you hold owners hostage to
force exorbitant repairs, many
property owners had to sell their
buildings because with rent
controlled rents, they simply could
not afford the repair.
In answer to your question number
1. The only reason we did the
retrofit was because we were forced
to. Not like we had a choice. This
set back my property owner $300K.
It took a year to refinance the
building as my property owners are
retired so it was hard to get the
financing. The city said they would
provide financing which was a joke
and did not exist. The only win is
we can go back and get 100% in
pass through, however since tenants
can claim hardship, I doubt we will $3,720,915
9,035 sq.
foot
35
see any of the pass through,
especially now with COVID"
#86 Phone
"The retrofit was necessary to
maintain the structure of the
building, especially for buildings
built in early 1990s for tenant
safety. If an earthquake happens,
you will run into major issues if you
are not in compliance" $3,191,703
4,837 sq.
foot
#92 Phone
"The program is great, and I did
seismic work in other buildings
where it was not required. It is a
great investment and it's not about
if an earthquake will happen, but
when. It makes perfect sense to
protect tenants"
Not enough
data to
generate an
accurate
estimate
9,900 sq.
foot
#93 Phone
"It was a wise choice to protect
ourselves, to protect tenants and to
prevent damage" $2,147,637
7,500 sq.
foot
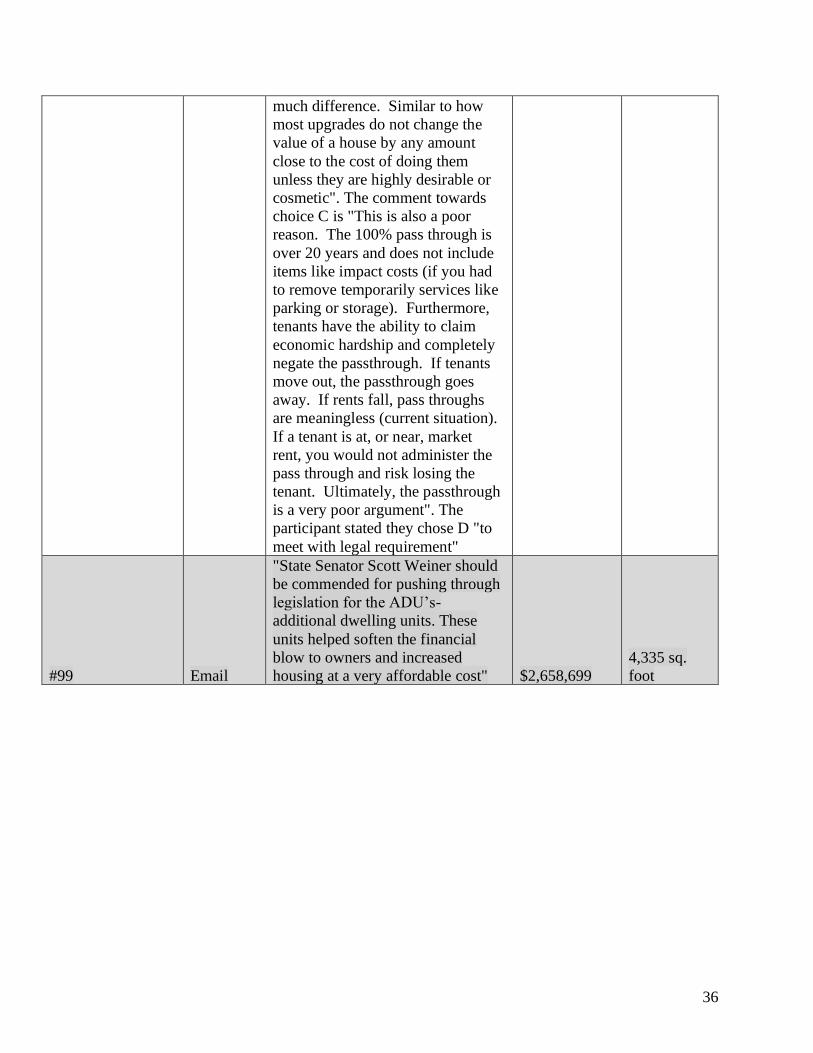
#97 Email
"The ONLY reason the vast
majority of building owners would
do a soft story retrofit on a building
is to meet the regulatory
requirements of the city". The
participant made comments about
each of the answer choices in
question #1. The comment the
participant made to choice A is
"How one protects their investment
is unique to the property owner, and
the situation. San Francisco has
been on an earthquake fault since
the founding of the city. The
majority of the buildings survived
1989 with no issue. Even more if
you eliminate those on liquefaction
zones". The comment made towards
Choice B was "I don’t believe this
is a viable reason. Other than
removing the regulatory risk of a
purchase, there is minimal
appreciated value to a soft story
retrofit building. Because of the
regulation requirement, it removes
that requirement, without the
regulation, I doubt there would be
Unavailable
on Redfin
Unavailable
on Redfin
36
much difference. Similar to how
most upgrades do not change the
value of a house by any amount
close to the cost of doing them
unless they are highly desirable or
cosmetic". The comment towards
choice C is "This is also a poor
reason. The 100% pass through is
over 20 years and does not include
items like impact costs (if you had
to remove temporarily services like
parking or storage). Furthermore,
tenants have the ability to claim
economic hardship and completely
negate the passthrough. If tenants
move out, the passthrough goes
away. If rents fall, pass throughs
are meaningless (current situation).
If a tenant is at, or near, market
rent, you would not administer the
pass through and risk losing the
tenant. Ultimately, the passthrough
is a very poor argument". The
participant stated they chose D "to
meet with legal requirement"
#99 Email
"State Senator Scott Weiner should
be commended for pushing through
legislation for the ADU’s-
additional dwelling units. These
units helped soften the financial
blow to owners and increased
housing at a very affordable cost" $2,658,699
4,335 sq.
foot
37
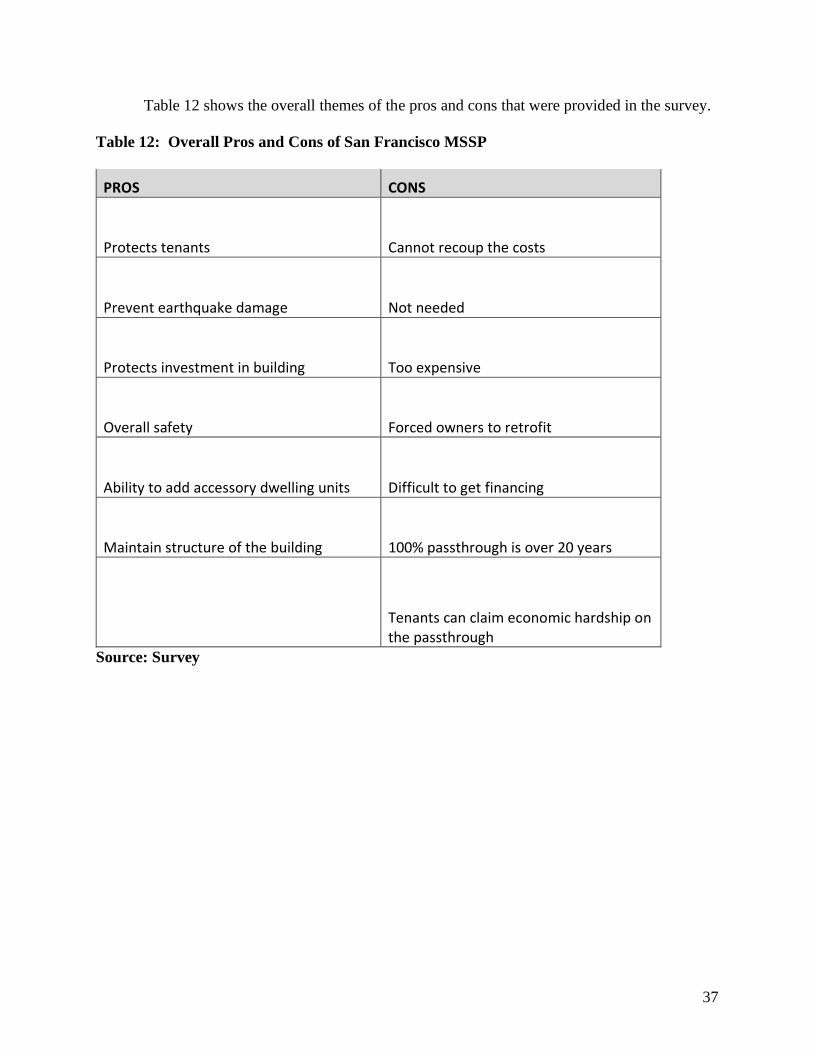
Table 12 shows the overall themes of the pros and cons that were provided in the survey.
Table 12: Overall Pros and Cons of San Francisco MSSP
PROS CONS
Protects tenants Cannot recoup the costs
Prevent earthquake damage Not needed
Protects investment in building Too expensive
Overall safety Forced owners to retrofit
Ability to add accessory dwelling units Difficult to get financing
Maintain structure of the building 100% passthrough is over 20 years
Tenants can claim economic hardship on the passthrough
Source: Survey
38
ANALYSIS
The main objective of this study was to identify common factors that influence owners’ decisions
to retrofit their buildings and analyze common answers. The majority of Tier 2 and Tier 3
buildings that were required to undergo retrofitting and receive CFCs were retrofitted by the set
deadlines, as shown in Table 3.
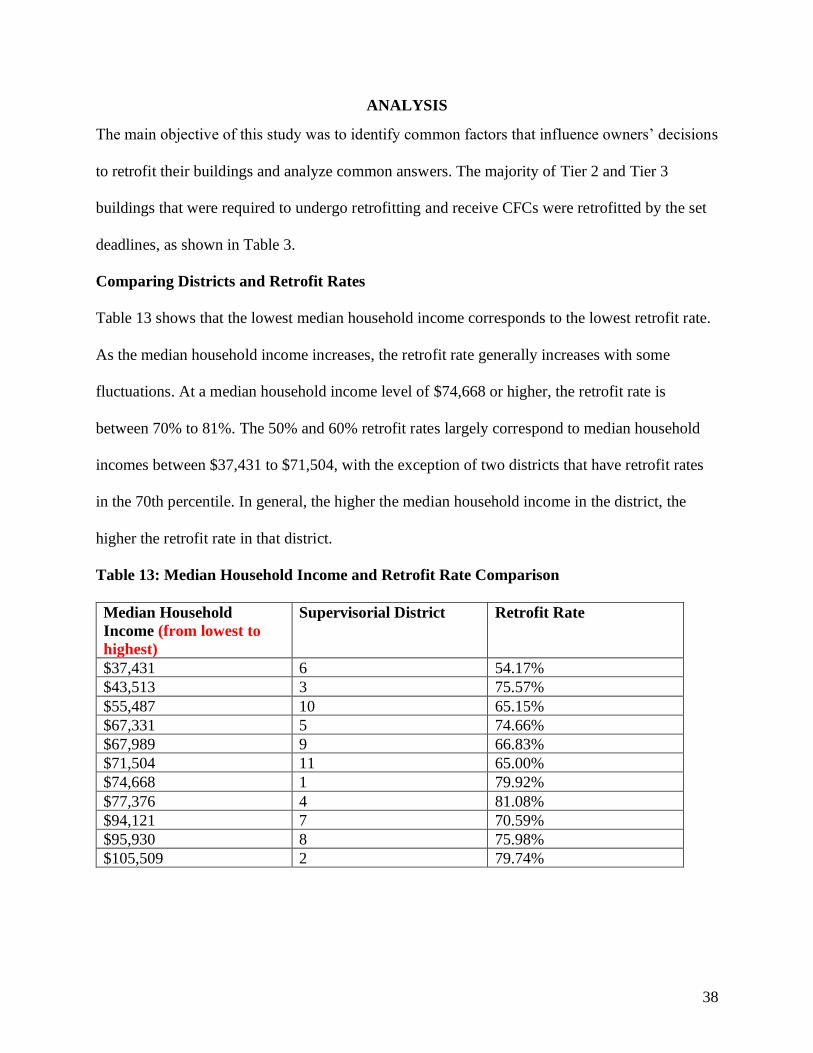
Comparing Districts and Retrofit Rates
Table 13 shows that the lowest median household income corresponds to the lowest retrofit rate.
As the median household income increases, the retrofit rate generally increases with some
fluctuations. At a median household income level of $74,668 or higher, the retrofit rate is
between 70% to 81%. The 50% and 60% retrofit rates largely correspond to median household
incomes between $37,431 to $71,504, with the exception of two districts that have retrofit rates
in the 70th percentile. In general, the higher the median household income in the district, the
higher the retrofit rate in that district.
Table 13: Median Household Income and Retrofit Rate Comparison
Median Household
Income (from lowest to
highest)
Supervisorial District Retrofit Rate
$37,431 6 54.17%
$43,513 3 75.57%
$55,487 10 65.15%
$67,331 5 74.66%
$67,989 9 66.83%
$71,504 11 65.00%
$74,668 1 79.92%
$77,376 4 81.08%
$94,121 7 70.59%
$95,930 8 75.98%
$105,509 2 79.74%
39
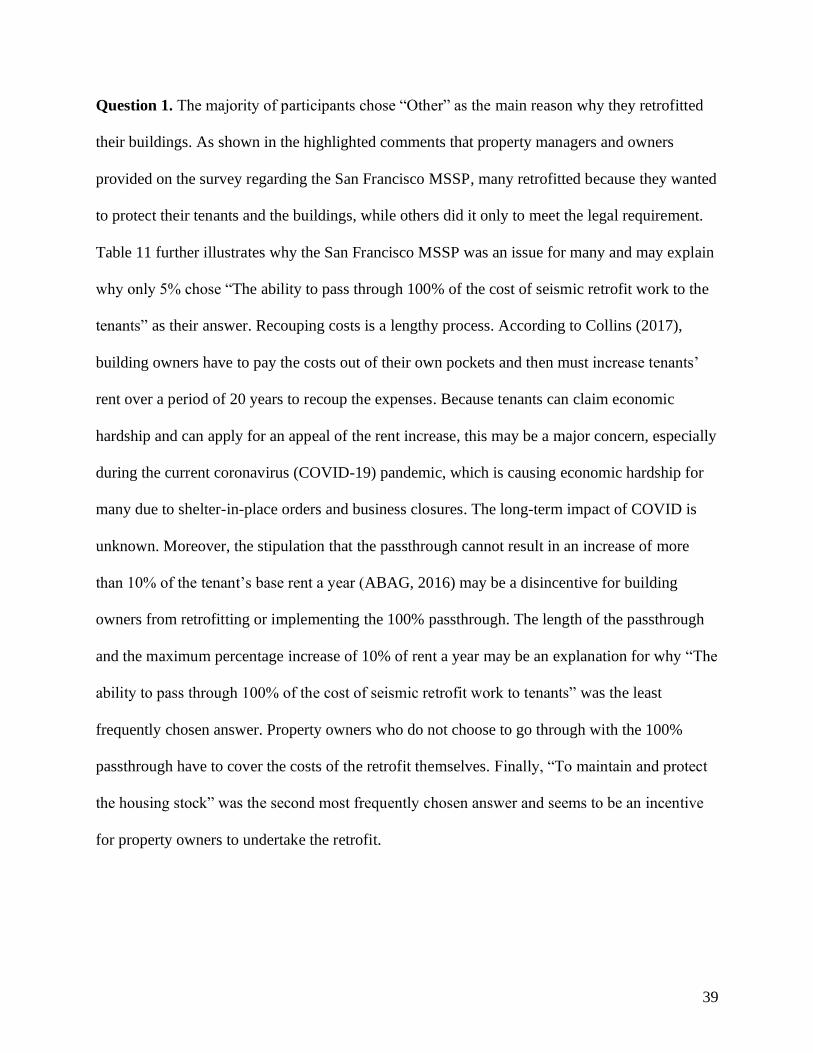
Question 1. The majority of participants chose “Other” as the main reason why they retrofitted
their buildings. As shown in the highlighted comments that property managers and owners
provided on the survey regarding the San Francisco MSSP, many retrofitted because they wanted
to protect their tenants and the buildings, while others did it only to meet the legal requirement.
Table 11 further illustrates why the San Francisco MSSP was an issue for many and may explain
why only 5% chose “The ability to pass through 100% of the cost of seismic retrofit work to the
tenants” as their answer. Recouping costs is a lengthy process. According to Collins (2017),
building owners have to pay the costs out of their own pockets and then must increase tenants’
rent over a period of 20 years to recoup the expenses. Because tenants can claim economic
hardship and can apply for an appeal of the rent increase, this may be a major concern, especially
during the current coronavirus (COVID-19) pandemic, which is causing economic hardship for
many due to shelter-in-place orders and business closures. The long-term impact of COVID is
unknown. Moreover, the stipulation that the passthrough cannot result in an increase of more
than 10% of the tenant’s base rent a year (ABAG, 2016) may be a disincentive for building
owners from retrofitting or implementing the 100% passthrough. The length of the passthrough
and the maximum percentage increase of 10% of rent a year may be an explanation for why “The
ability to pass through 100% of the cost of seismic retrofit work to tenants” was the least
frequently chosen answer. Property owners who do not choose to go through with the 100%
passthrough have to cover the costs of the retrofit themselves. Finally, “To maintain and protect
the housing stock” was the second most frequently chosen answer and seems to be an incentive
for property owners to undertake the retrofit.
40
Question 2. A common factor among those who retrofitted their buildings was that their
buildings were rent controlled. However, rent control may complicate paying for the retrofits
because the property owners are limited to a particular percentage increase in rent.
Question 3. The majority of those who retrofitted their buildings and were in compliance had an
average monthly unit rent between $2,000 and $3,000. The relatively high rental rates may be
particularly beneficial for those who choose to do the 100% passthrough, as they can increase
each tenant’s cost no more than 10% and may recoup the costs faster than those who have
monthly average unit rental rates of less than $1,000. In addition, those who have higher monthly
average unit rent prices may profit more from their properties than those who have the majority
of their tenants paying less in rent. With the current market rate and economy, some property
owners may be making little to no money from their buildings, depending on their average unit
rent price.
Question 4. Another common factor among those who retrofitted their buildings was that their
individual length of ownership was more than five years. Those who have owned rental
properties for that long may have bought the properties as long-term investments. Therefore,
retrofitting the buildings may protect their investments in the case of a disastrous earthquake.
Question 5. A common factor among the majority of those who retrofitted their properties was
that the properties were occupied by all renters. Those who chose to retrofit may have done so to
protect the tenants and avoid having placards placed on their buildings warning the tenants and
public that the owners or managers are not in compliance with the program. Non-compliance
may deter future tenants or encourage current tenants to move out.
41
Limitations
A limitation to the study was the amount of data collected. The sample size of the survey
was only 101 owners and managers. Although there were 2,963 properties that were retrofitted in
Tier 2 and Tier 3, only 678 properties out of the entire retrofitted property list had contact
information available online. Some property owners and managers whose contact information
was available online were unable to be contacted, as some of the published phone numbers were
disconnected. These owners and managers were not considered for the survey. A larger sample
size is necessary to provide a more accurate representation of program compliance and common
factors, which would be easier to achieve if the contact information for each of the properties
was easily accessible.
Second, the number of responses for each question was not equal, as some chose to opt
out of answering or the answers did not suit them. The response rate for each question varied.
Third, there may be bias in the survey results. Those who are small landlords may have a
harder time affording the retrofit costs than big businesses or bigger landlords. Therefore, those
small landlords, also known as “mom and pop” landlords, may be more inclined to view their
experiences as negative, because they did not think the risk justified the cost. On the other hand,
some of those who indicated that they had had positive experiences may have been able to afford
the cost of the retrofit and thus were likely to view their experiences more positively than those
who could not afford it.
Lastly, participants were not randomly selected. Only those owners and managers for
whom the researcher was able to find contact information were contacted. The findings thus
cannot be generalized to the entire population of those who retrofitted their buildings in Tier 2
and Tier 3. In addition, Tier 1 and Tier 4 were not included, meaning that the findings only
42
represent two tiers. This is not enough information to form a true representation of all the
retrofitted properties and those that are currently undergoing retrofitting.
43
CONCLUSION
The San Francisco MSSP was designed to protect the housing stock and increase the strength
and resilience of local buildings to ensure the safety of tenants. This research study helped to
identify the common factors influencing decisions among property owners and managers who
retrofitted their buildings. The findings reveal a number of benefits to the San Francisco MSSP,
such as the ability to protect tenants, add accessory dwelling units, and protect owners and
managers’ investments in their buildings. In retrospect, there are a number of concerns as well,
including the difficulty of the 100% passthrough and the high costs of retrofitting. While the
program seems to be beneficial for tenants, and to be designed to prevent damage from future
earthquakes, the current parameters of and assistance offered by the program are not perceived
by property owners to be helpful to them when they are forced to make these repairs.
Areas for Future Research
This research project focuses on the City of San Francisco. Further research could be done to
compare San Francisco to Oakland and Berkeley, nearby cities that also have soft story retrofit
programs. Another area of study would be to survey those who did not retrofit their buildings in
order to gain a deeper understanding of the reasons why they did not comply with the retrofitting
program.
44
REFERENCES
Arroyo, N. (2019, October 17). In S.F. mandatory retrofit program, about 1,200 buildings
noncompliant. San Francisco Public Press. Retrieved from
https://sfpublicpress.org/news/2019-10/in-sf-mandatory-retrofit-program-about-1200-
buildings-noncompliant
Association of Bay Area Governments. (2016, March). Resilience policy guidance document:
Soft-story retrofit program development. Retrieved from
https://abag.ca.gov/sites/default/files/soft_story_report_web_version_v2_1.pdf
Budget and Legislative Analyst. (2013, May). Policy analysis report. San Francisco Board of
Supervisors. Retrieved
from https://sfbos.org/sites/default/files/FileCenter/Documents/45523-
BLA.Socioeconomic%20Equity.nav.pdf
Burton, H., Rad, A., Yi, R., Gutierrez, Z., & Ojuri, D. (2019). Seismic collapse performance of
Los Angeles soft, weak, and open-front wall line woodframe structures retrofitted using
different procedures. Bulletin of Earthquake Engineering, 17(4), 2059–2091.
City of Berkeley. (n.d.). Soft story program: Regulations for potentially hazardous buildings
containing soft, weak or open front stories. Retrieved from
https://www.cityofberkeley.info/softstory/
Cobeen, K., Maffei, J., & Osteraas, J. (2019, January 30). Revisiting earthquake lessons: Wood
light-frame buildings. Retrieved from https://www.seaoc.org/news/436157/Revisiting-
Earthquake-Lessons
Collins, R. (2017). Rebate your retrofit. SF Apartment. Retrieved from
https://www.sfaa.org/Public/Magazine/07_2017/Rebate__Your__Retrofit.aspx.
Comerio, M. (1998). Disaster hits home. Berkeley, CA: University of California Press.
45
Comerio, M. (2000). Paying for the next big one. Issues in Science and Technology, 16(3), 65–
72.
Comerio, M. (2004). Public policy for reducing earthquake risks: A U.S. perspective. Building
Research & Information: Managing the Risks from Natural Hazards, 32(5), 403–413.
Data SF. (n.d.). Soft-story properties. Retrieved from https://data.sfgov.org/Housing-and-
Buildings/Soft-Story-Properties/beah-shgi
Hui, T. (2017). The cost of compliance. SF Apartment. Retrieved from
https://www.sfaa.org/Public/Magazine/07_2017/The_Cost_of_Compliance.aspx
Kang, H., Yi, Z., & Burton, H. (2019). Effect of the Los Angeles soft-story ordinance on the
post-earthquake housing recovery of impacted residential communities. Natural Hazards,
99(1), 161–188.
Lindt, J. W. V. D., Bahmani, P., Pryor, S. E., Mochizuki, G., Gershfeld, M., Pang, W., …
Rammer, D. (2014). Overview of the NEES-Soft Experimental Program for Seismic Risk
Reduction of Soft-Story Woodframe Buildings. In G. R. Bell & M. A. Card (Eds.),
Proceedings of the Structures Congress 2014 (2875–2885). American Society of Civil
Engineers. https://doi.org/10.1061/9780784413357.251
Liou, T., & Kapucu, N. (2014). Disasters and development: Lessons and implications from
global cases and issues. In N. Kapucu & T. Liou, T. (Eds.), Disaster and development:
Examining global issues and cases (455). Dordrecht, The Netherlands: Springer.
Los Angeles Housing Community Investment Department. (n.d.). The Seismic Retrofit Work
Program. Retrieved from http://hcidladev.lacity.org/seismic-retrofit
Pino, J. D., & Enright, J. (2019, March). The San Francisco soft-story ordinance. Structure
Magazine. Retrieved from https://www.structuremag.org/?p=14310
46
Porter, Keith A, & Cobeen, Kelly. (2012). Informing a retrofit ordinance: A soft-story case
study. In Structures Congress 2012 - Proceedings of the 2012 Structures Congress (pp.
1802-1813).
San Francisco Department of Building Inspection. (n.d.-a). Background of the Mandatory Soft
Story Program. Retrieved from https://sfdbi.org/background-mandatory-soft-story-
program
San Francisco Department of Building Inspection. (n.d.-b). Finance options for the Mandatory
Soft Story Program. Retrieved from https://sfdbi.org/finance-options-mandatory-soft-
story-program
San Francisco Department of Building Inspection. (n.d.-c). For property owners. Retrieved from
https://sfdbi.org/property-owners
San Francisco Department of Building Inspection. (n.d.-d). Housing unit production. Retrieved
from https://sfdbi.org/housing-unit-production
San Francisco Department of Building Inspection. (n.d.-e). Mandatory Soft Story Program.
Retrieved from https://sfdbi.org/softstory
San Francisco Department of Building Inspection. (n.d.-f). Received a violation? Retrieved from
https://sfdbi.org/received-violation
San Francisco Department of Building Inspection. (n.d.-g). Steps to program compliance.
Retrieved from https://sfdbi.org/steps-program-compliance
San Francisco Rent Board. (n.d.). Topic No. 309: Special rules for seismic work & other
improvements required by law. Retrieved from https://sfrb.org/topic-no-309-special-
rules-seismic-work
47
Samant, L. D., Porter, K., Cobeen, K., Tobin, L. T., Kornfield, L., Seligson, H., … Kidd, J.
(2009). Mitigating San Francisco’s soft-story building problem. ATC and SEI Conference
on Improving the Seismic Performance of Existing Buildings and Other Structures.
American Society of Civil Engineers. https://doi.org/10.1061/41084(364)106
Stark, K. (2019). Thousands of this type of building still at risk of collapse in Bay Area
earthquake. KQED Science. Retrieved from
https://www.kqed.org/science/1949350/thousands-of-one-type-of-building-still-at-risk-
of-collapse-in-bay-area-earthquake
Sylvia, R. D., & Sylvia, K. M. (2012). Program planning and evaluation for the public manager
(4th ed.). Long Grove, IL: Waveland Press.