What effect does Performance Management have on Motivation … Management... · 1 What effect does...
40
1 What effect does Performance Management have on Motivation in the Irish Civil Service? Angela Sheppard Higher Diploma in Personnel Management 15 th May 2009
Transcript of What effect does Performance Management have on Motivation … Management... · 1 What effect does...

1
What effect does Performance Management have on Motivation in the Irish
Civil Service?
Angela Sheppard
Higher Diploma in Personnel Management
15th
May 2009

2
Table of Contents
Abstract
Chapter 1 – Introduction
1.1 – Context of the Study...........................................................................Page 1
1.2 – Purpose of the Study...........................................................................Page 1
1.3 – Research Question..............................................................................Page 2
1.4 – Methodology.......................................................................................Page 2
1.5 – Structure of the Report........................................................................Page 2
Chapter 2 – Literature Review..............................................................................Page 3
Chapter 3 – Methodology
3.1 – Research Aims and Objectives............................................................Page 8
3.2 – Research Philosophy............................................................................Page 8
3.3 – Positivism and Interpretivism..............................................................Page 9
3.4 – Deduction and Induction......................................................................Page 9
3.5 – Qualitative and Quantitative................................................................Page 10
3.6 – Research Approach..............................................................................Page 11
3.7 – Data Collection....................................................................................Page 11
3.8 – Sample.................................................................................................Page 11
3.9 – Research Instrument............................................................................Page 12
3.10 – Data Analysis.....................................................................................Page 12
Chapter 4 – Findings
4.1 – Introduction..........................................................................................Page 13
4.2 – Description of the Sample....................................................................Page 13
4.3 – Response Rate......................................................................................Page 13
4.4 – Demographics.......................................................................................Page 13

3
4.4.1 – Table..................................................................................................Page 14
4.4.2 – Table..................................................................................................Page 14
4.5 – Data Analysis Methodology.................................................................Page 14
4.5.1 – Table..................................................................................................Page 15
4.6 – Hypothesis............................................................................................Page 15
4.6.1 – Table..................................................................................................Page 16
4.6.2 – Table..................................................................................................Page 17
4.6.3 – Table..................................................................................................Page 17
4.6.4 –Table...................................................................................................Page 18
4.6.5 – Table..................................................................................................Page 18
4.6.6 – Table..................................................................................................Page 19
4.6.7 – Table..................................................................................................Page 19
4.6.8 – Table..................................................................................................Page 20
4.6.9 – Table..................................................................................................Page 20
4.6.10 – Table................................................................................................Page 21
4.6.11 – Table................................................................................................Page 21
4.6.12 – Table................................................................................................Page 22
4.6.13 – Table................................................................................................Page 23
4.6.14 – Table................................................................................................Page 23
4.6.15 – Table................................................................................................Page 24
4.6.16 – Table................................................................................................Page 25
4.6.17 – Table................................................................................................Page 25
4.7 – Conclusion............................................................................................Page 26

4
Chapter 5 – Discussion
5.1 – Introduction..........................................................................................Page 27
5.2 – Themes and Patterns............................................................................Page 27
5.3 – Meaning of Results..............................................................................Page 29
5.4 – Conclusion...........................................................................................Page 29
Chapter 6 – Conclusion
6.1 – Introduction.........................................................................................Page 31
6.2 – Implications for Practice.....................................................................Page 32
6.3 – Implications for Research...................................................................Page 32
6.4 – Personal Reflections...........................................................................Page 33
Bibliography

5
Abstract:
This study examined whether there is a link between Performance Management and
Motivation. Literature on these topics was researched. The sample surveyed consisted of
150 Civil Servants of various grades in a government department. The study utilised a
Quantitative Questionnaire. Analysis of the results indicated that respondents did not
perceive that an individual would be motivated by Performance Management as
hypothesised. As this research was conducted in a Civil Service setting, future research in
the Private Sector may produce different results.

6
Chapter 1:
Introduction:
1.1 Context of the Study
The Irish Civil Service currently has a Performance Management process called Performance
Management and Development System (PMDS). This has been implemented in every
Government Department and is utilised by every level of staff. The appraisal section of this
system is very important from a Human Resources point of view as official records are kept
of each employee’s progress. If there are any issues arising, they can be dealt with in a
timely manner before these issues get out of hand.
It is not clear if there is a link between the PMDS process and motivation, and this study will
endeavour to establish if a link exists. This link would be a very useful tool for line managers
and could increase productivity.
1.2 Purpose of Study
The intention of this study is to find a link between performance management and motivation
particularly in a Government Department within the Irish Civil Service. It is hoped that any
links can be built upon to boost motivation and increase productivity. It is also intended that
this study will provide a greater understanding of motivation and its link to performance
management.
7
1.3 Research Question
This study is an investigation into the relationship between performance management and
motivation. Specifically to determine if the hypothesis An individual is motivated by
performance management can be supported.
1.4 Methodology
Due to the purpose and objective of this research and as the research approach will be
positivist and deductive, a Qualitative Methodology will be applied. The study will be
conducted on employees of a Government Department with data being collected by means of
a questionnaire using the Likert Scale.
1.5 Structure of the Report
This study is reported in six chapters. Chapter One provided an introduction to the topic to
be studied, the research question in posed in the study and the significance of the study.
Chapter Two offers a Literature Review on issues related to Motivation and Performance
Management. The research design and procedures for conducting the study are discussed in
Chapter Three. The findings are presented in Chapter Four. Critical discussion of the
findings of this study in the context of previous literature are put forward in Chapter Five.
And finally conclusions, along with implications for future practice and research are
discussed in Chapter Six.

8
Chapter 2:
Literature Review
Armstrong (2000) defines performance management as a strategic and integrated process that
delivers sustained success to organisations by improving the performance of people who
work in them and by developing the capabilities of individual contributors and teams. It is
suggested that performance management is integrated in two senses (Armstrong, 2000); first,
vertical integration, in terms of the alignment of business, team and individual objectives and
second, horizontal integration, linking different aspects of cross cutting activities, to achieve
a coherent approach to the management and development of people. Thus, any attempt to
develop performance measurement systems in the public sector must consider policy, practice
and people in an integrated manner (Rowley, 1997).
With the advent of Performance Management and Development System (PMDS) within the
Civil Service, it is not surprising that much debate and discussion have grown around the
topic. When done positively, appraisal has many benefits and the main one is that
performance should improve. Defining employees roles can help towards efficiently and
effectively managing time and resources. Structured roles are essential in large organisations
like the Civil Service in order to cut back on constant supervision and also to prevent
duplication of work.
Many studies have been done and much has been written on Performance Management and
Appraisals on how best to operate the system. This is essential to maintain the effective
implementation of PMDS and for staff to achieve their full potential within a role. This study
will attempt to reveal how PMDS effects motivation of staff and managers within a
government department.

9
Where people see appraisal as an administrative chore, they are likely to devote insufficient
time and attention to it and so experience disadvantages such as disagreements, strained
relationships and even poor appraisal ratings (Gillen, 1999). When PMDS is seen as merely
a form filling exercise the full potential of the system is not realised and has the potential to
become de-motivating. It is important therefore for managers and staff to discuss fully any
and all issues arising relating to the task.
Staff in some sections who have similar roles simply complete one form between them and
then “cut and paste” their own names to the top of the form. This can be very de-motivating
for staff who wish to further their careers as they often feel that their performance, no matter
how good, will never stand out from the crowd. When rewards are contingent on
performance, workers are finely attuned to issues of fairness, and a distribution of rewards
that is perceived as even slightly unfair can lead to significant problems (Greenberg).
People can benefit greatly from a well managed and well maintained Performance
Management System especially in large organisations. Where there had been the danger that
people could fall through the cracks of bureaucracy, now every staff member can use the
system to improve their day to day job and also boost opportunities for promotion. In large
organisations some staff would have little to do with line managers on a regular basis and so
this gives people a chance to meet and discuss work issues, whether to praise staff or for
disciplinary reasons.
Motivation is a combination of needs that influence behaviour and action (Kressler, 2003). If
an employee is to successfully accomplish a task in any organisation, he or she needs
motivation, performance capacity and development potential in order to activate skills,
experiences, talents and creative energies, and reach company goals.
Goals do four things: direct attention; mobilise task effort; encourage task persistence; and
facilitate development of task strategies (Locke; Locke & Latham). In other words, goals

10
provide us with a clear direction; inform us that we need to try hard; remind us that an end is
in sight; and encourage us to think about the process of reaching that end. Studies show that
workers given information about how they perform generally outperform workers who are
not given such feedback (Enzle & Ross; Harackiewicz). A combination of goals and feedback
has a more powerful effect on task interest and persistence than either goals or feedback
alone (Bandura & Cervone). When goals and feedback are combined, people know if they are
on the right path, and they know how much farther they need to go to reach their goal.
Many managers assume that motivation of employees will lead to an increase in productivity.
For workers who are "deeply involved with their work", this may be true (Mullins 1996), but
most evidence suggests that there is no strong correlation between positive motivation and
high productivity (Wilson & Rosenfeld 1990).
The problems caused by de-motivation are well understood. Frustration among employees
with unrewarding jobs can lead to withdrawn behaviour (Mullins 1996) which may harm a
firm's productivity. A lack of motivation increases the rate of absenteeism - which is usually
highest among workers doing mundane and repetitive jobs (Cully et al 1999) - and the rate of
employee turnover.
Motivational benefits such as flexible working hours are most commonly offered to
employees who are highly-skilled; it is been suggested that this is because firms are
especially keen to retain such employees, due to the difficulty and cost of replacing them
(Cully et al 1999).
Organisations can influence the behaviour of workers and activate their motives, whether it is
about specific tasks, or the achievement of particular goals. Motivation can be influenced by
personal or situational factors and it can change with changes in personal, social, or other
factors (Wiley, 1997). Motivation can also be governed by a need to please others (Kressler,
2003). Negative motivation or frustration arises when people are not treated equally. For

11
instance, it happens when someone is paid less than another person for the same job.
Frustration leads to avoidance and refusal. When staff try to affix blame for their unjust
situation, they are likely to blame external factors, such as a supervisor, the organization, or
the incentive system, rather their self (Taylor & Pierce). Over the long term, however,
workers are likely to simply change their perception of their deservedness, rather than
sustaining an increased effort level (Campbell & Pritchard).
Frederick W. Herzberg outlines two types of motivation in The Motivation to Work (1959),
namely intrinsic and extrinsic (cited in Kressler, 2003). Intrinsic motivation eventually leads
to satisfaction when it is fulfilled through challenge. Extrinsic motivation (hygiene factors)
leads to dissatisfaction when it is unfulfilled. When hygiene factors are met, a person is not
dissatisfied, but he or she is not satisfied. In other words, not being unhappy does not mean
that you are happy.
According to Herzberg, badly and inadequately structured working conditions lead to
dissatisfaction (cited in Kressler, 2003). They can be regulations, relationships with managers
and colleagues, communication, work intensity and pay. A good pay cheque can overcome
frustration, but it does not necessarily satisfy the worker. Quality of work, success,
recognition, career development and responsibility are examples of intrinsic factors that will
eventually lead to satisfaction. However, studies have shown that needs for salary,
recognition and responsibility can be both extrinsic and intrinsic motivators (Maidani, 1991,
cited in Wiley, 1997). Herzberg’s findings are relevant for companies with clearly defined
tasks and hierarchical structures, where people need others to motivate them (Kressler, 2003).
When people compare their reward-input ratio to others, it is much more likely that they will
perceive their ratio as too small rather than too big. This is because people generally have
exaggerated perceptions of their performance (Meyer); this is a fundamental cognitive bias.
On top of that, people generally are prone to compare their pay to others who are perceived as
comparable in performance, but who earn more (Martin). Given these tendencies, the odds

12
are good that they will be dissatisfied with their rewards and perceive themselves as unjustly
undercompensated.
It is important to create a link between reward and performance. Employees need to know
and understand exactly what has to be done so that a bonus will be achieved (Holtz, 2004).
In addition, the reward can be extended over many years to make the system enduring
(Persson, 1994). The connection between rewards and productivity, and motivation in
employment has been shown by Charles Murray and Gary Becker to be the best way to solve
the problem of lack of performance among employees (cited in Persson, 1994).
The organisation has to provide employees with a written proposition plan that shows what
their role in the company is and what they are expected to achieve. This plan should portray a
clear picture, but if it is not so, the employees could easily be misdirected, striving towards
wrong performance objectives. This will result in the organisation and staff receiving poor
evaluations (Fuller & Farrington, 1999). However, this problem can be solved by proper
communication. When any ambiguity is taken out of a role the staff member has the freedom
to work towards district goals and does not require constant supervision and does not need to
consult with their line manager any time any new task arises.
The performance appraisal process must enable top performance, not provide barriers to it. If
a great performer is put in a bad process, the process will eventually win, and not the person.
Well-designed information sources also play an important role in the working environment as
a whole (Fuller & Farrington,1999).

13
Chapter 3:
Methodology Chapter:
3.1. Research Aims & Objectives
In order to answer my question, I am going to study one government department. This
department uses a performance management system referred to as PMDS (Performance
Management Development System). The department has many different grades of staff and
all grades use the PMDS system. This report will investigate how PMDS links to the
Motivation of staff at all levels.
The reason for choosing one department has to do with time restrictions. The drawback of
this method is the fact that I might find certain answers that are specific to this department
and that cannot be generalised government departments, but on the other hand, different
departments have more or less the same HR policies. Furthermore, when collecting my frame
of reference, I took into consideration general theories that can help me come to conclusions
that might be applicable to other departments as well.
3.2. Research Philosophy
This chapter provides an overview of the research methodology which encompasses
discussion on the research philosophy of the qualitative/quantitative approaches and the
various research methods. The research undertaken in this study will be discussed in the
context of the above theories about research. A case will be presented for the philosophy
selected for this research, the approach to be taken and appropriateness of the research
methods employed. The criteria surrounding the quality of the research will also be
discussed.

14
3.3. Positivism & Interpretivism
Positivism is the theory that physical and social reality is independent of those who observe
it. According to positivists the observation of this reality, if unbiased, constitutes scientific
knowledge. Social scientists aim to discover the universal laws of society and human
conduct within it. This theory is a rational edifice built by social scientists to explain human
behaviour.
Interpretivism is the belief that social reality is constructed by the individuals who participate
in it. This reality is constructed differently by different individuals and individuals gradually
build their own understandings of the world through experience and maturation. According
to interpretivism, the mind is not a blank slate upon which knowledge is written. The
underlying assumption of Interpretivism is that the whole needs to be examined in order to
understand a phenomena. Social scientists use interpretivism in order to discover how
different people interpret the world in which they live. The theory looks at the sets of
meanings which people use to make sense of their world and behaviours. Interpretivism
proposes that there are multiple realities, not single realities of phenomena, and that these
realities can differ across time and place.
3.4. Deduction & Induction
Deductive reasoning works from the more general to the more specific. It starts with the
theory behind the topic being researched. That is then narrowed down into more a specific
hypotheses to be tested. Then it is narrowed down even further by collecting observations to
address the hypotheses. This ultimately leads the researcher to be able to test the hypotheses
with specific data. This will confirm (or not) the original theory. In other words, the
deductive position proposes hypotheses based on previous theories and tests these hypotheses
through observation and experimentation.

15
Inductive reasoning works the other way, moving from specific observations to broader
generalisations and theories. In inductive reasoning, the researcher begins with specific
observations and measures, begins to detect patterns and regularities, formulates some
tentative hypotheses to be explored, and finally ends up developing some general conclusions
or theories. In other words, the inductive approach poses research questions and devises
concepts and theories based on observation.
Inductive reasoning, by its very nature, is more open-ended and exploratory, especially at the
beginning. Deductive reasoning is more narrow in nature and is concerned with testing or
confirming hypotheses. Even though a particular study may look like it's purely deductive,
most social research involves both inductive and deductive reasoning processes at some time
in the project.
3.5. Qualitative & Quantitative
Qualitative analysis is data analysis where the aim is building theory. The Qualitative
Method is a research method that relies less on numbers and statistics but more on interviews,
observations, small numbers of questionnaires, focus groups, subjective reports and case
studies. It is used to gain an understanding of underlying reasons and motivations, and to
provide insights into the setting of a problem, generating ideas and/or hypotheses for later
quantitative research. Qualitative analysis uncovers prevalent trends in thought and opinion.
The goal of Quantitative analysis is to test a theory. Quantitative investigators begin with a
theoretically based hypothesis and collect previously established categories of data to test the
viability of that hypothesis. The Quantitative Method is a research method that relies less on
interviews, observations, small numbers of questionnaires, focus groups, subjective reports
and case studies but is much more focused on the collection and analysis of numerical data

16
and statistics. It is used to quantify data and generalise results from a sample to the
population of interest, and to measure the incidence of various views and opinions in a
chosen sample. Quantitative research is sometimes followed by qualitative research which is
used to explore some findings further.
3.6. Research Approach
This Management Report aims to discover what effect Performance Management has on
Motivation in the Public Sector. Therefore in order to test the level of motivation, the
research approach will be Quantitative in nature. As the research will be conducted in an
unbiased and independent manner the philosophical position is Positative. This report aims to
either confirm (or not) an original theory and so it is Deductive in nature.
3.7. Data Collection
The data for this Management Report was collected through a questionnaire which was
distributed to officers of various grades in a Government department.
3.8. Sample
This Questionnaire was given to 200 public servants of various grades and 150 completed
questionnaires were returned.
17
3.9. Research Instrument
The research instrument used was a Quantitative Questionnaire. Officers were firstly asked
their grade and then their length of service. They were then given a list of statements
regarding Performance Management and Motivation and were asked to state on a likert scale
how strongly they agreed or disagreed with each statement.
3.10. Data Analysis
The data collected was then analysed by using the statistical package SPSS.

18
Chapter 4:
Findings Chapter:
4.1 Introduction
This study explores respondents’ levels of perceived motivation as linked to Performance
Management. The organisation being surveyed is a Government Department. As this
research is Quantitative in nature, questionnaires using the likert scale were utilised. The
results were then converted to statistics using the SPSS statistical computer programme.
4.2 Description of the Sample
The population from which the sample was drawn consisted solely of employees of on
government department. The department surveyed has in excess of 100 offices countrywide
with a staff compliment of over 7000. A total of 150 employees participated in the study.
The participating sample of 150 employees represents 2.14% of this population. Three
grades of staff took part in the survey with varying lengths of service.
4.3 Response Rate
200 questionnaires were circulated at random within the government department being
surveyed and 150 fully completed questionnaires were returned. This response rate was 75%
of the sample being surveyed.
4.4 Demographics
The demographic characteristics of the sample are provided in Tables 4.4.1 & 4.4.2. Three
grades of staff were surveyed in order to obtain a balanced view of PMDS. Each grade
participates in the process and the grades of Executive Officer and Higher Executive Officer

19
have responsibility for conducting appraisal meetings with staff. PMDS has been operated in
this department for 10 years and 60% of the respondents have over 10 years service.
Therefore these respondents have experience of working in the department before PMDS was
introduced and will be able to compare the old appraisal system to PMDS.
Table 4.4.1
Grade
Frequency Percent Valid Percent
Cumulative
Percent
Valid Clerical Officer 68 45.3 45.3 45.3
Executive Officer 51 34.0 34.0 79.3
Higher Executive Officer 31 20.7 20.7 100.0
Total 150 100.0 100.0
Table 4.4.2
Length of Service in Dept
Frequency Percent Valid Percent
Cumulative
Percent
Valid Less than 1 year 3 2.0 2.0 2.0
1 - 3 years 18 12.0 12.0 14.0
4 - 6 years 23 15.3 15.3 29.3
7 - 10 years 15 10.0 10.0 39.3
More than 10 years 91 60.7 60.7 100.0
Total 150 100.0 100.0
4.5 Data Analysis Methodology
This study was designed to explore the relationship between performance management and
motivation. A Quantitative analysis approach was taken to analyse the data which was
conducted using SPSS software.
The following descriptive statistics produce means and standard deviations for variables. It
also shows the minimum and maximum value. The Likert scale questions were used to print
20
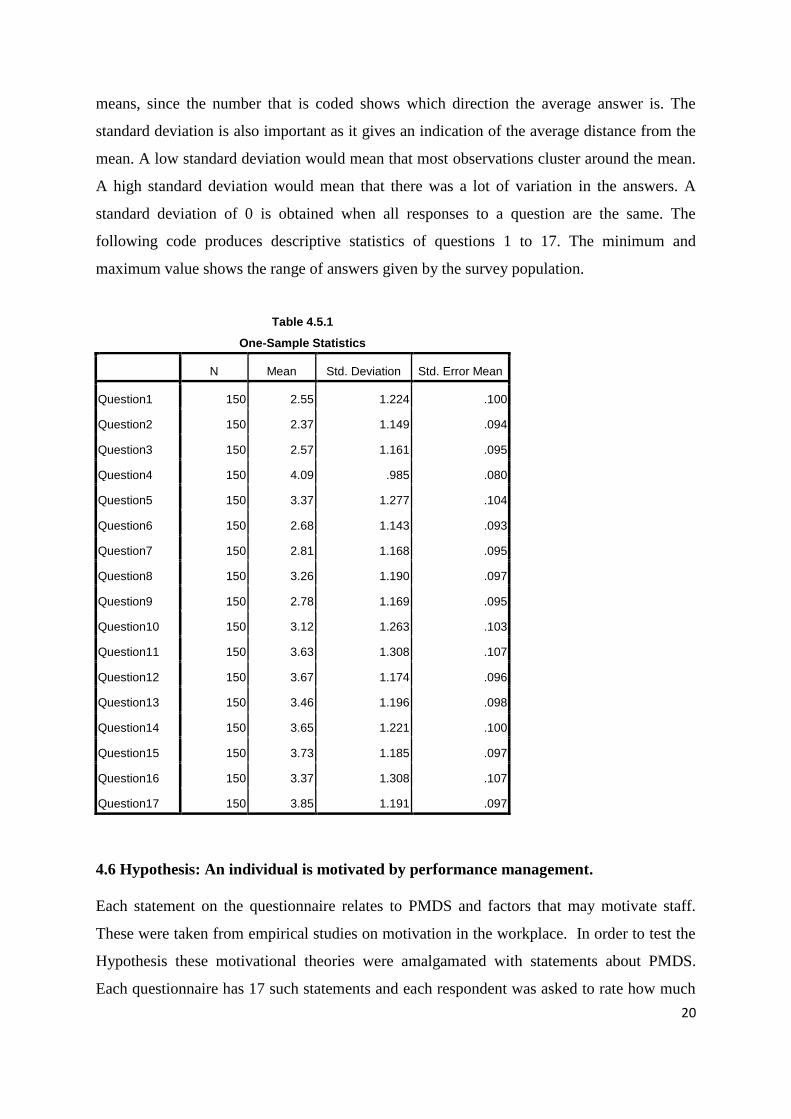
means, since the number that is coded shows which direction the average answer is. The
standard deviation is also important as it gives an indication of the average distance from the
mean. A low standard deviation would mean that most observations cluster around the mean.
A high standard deviation would mean that there was a lot of variation in the answers. A
standard deviation of 0 is obtained when all responses to a question are the same. The
following code produces descriptive statistics of questions 1 to 17. The minimum and
maximum value shows the range of answers given by the survey population.
Table 4.5.1
One-Sample Statistics
N Mean Std. Deviation Std. Error Mean
Question1 150 2.55 1.224 .100
Question2 150 2.37 1.149 .094
Question3 150 2.57 1.161 .095
Question4 150 4.09 .985 .080
Question5 150 3.37 1.277 .104
Question6 150 2.68 1.143 .093
Question7 150 2.81 1.168 .095
Question8 150 3.26 1.190 .097
Question9 150 2.78 1.169 .095
Question10 150 3.12 1.263 .103
Question11 150 3.63 1.308 .107
Question12 150 3.67 1.174 .096
Question13 150 3.46 1.196 .098
Question14 150 3.65 1.221 .100
Question15 150 3.73 1.185 .097
Question16 150 3.37 1.308 .107
Question17 150 3.85 1.191 .097
4.6 Hypothesis: An individual is motivated by performance management.
Each statement on the questionnaire relates to PMDS and factors that may motivate staff.
These were taken from empirical studies on motivation in the workplace. In order to test the
Hypothesis these motivational theories were amalgamated with statements about PMDS.
Each questionnaire has 17 such statements and each respondent was asked to rate how much
21
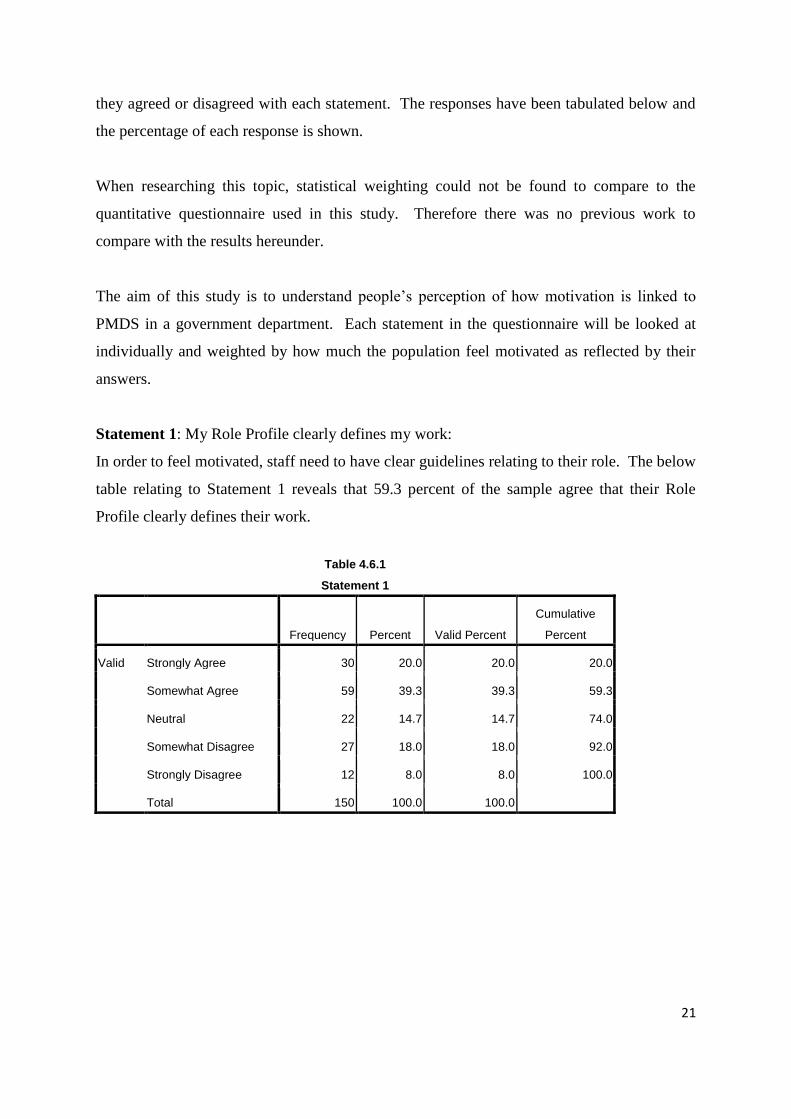
they agreed or disagreed with each statement. The responses have been tabulated below and
the percentage of each response is shown.
When researching this topic, statistical weighting could not be found to compare to the
quantitative questionnaire used in this study. Therefore there was no previous work to
compare with the results hereunder.
The aim of this study is to understand people’s perception of how motivation is linked to
PMDS in a government department. Each statement in the questionnaire will be looked at
individually and weighted by how much the population feel motivated as reflected by their
answers.
Statement 1: My Role Profile clearly defines my work:
In order to feel motivated, staff need to have clear guidelines relating to their role. The below
table relating to Statement 1 reveals that 59.3 percent of the sample agree that their Role
Profile clearly defines their work.
Table 4.6.1
Statement 1
Frequency Percent Valid Percent
Cumulative
Percent
Valid Strongly Agree 30 20.0 20.0 20.0
Somewhat Agree 59 39.3 39.3 59.3
Neutral 22 14.7 14.7 74.0
Somewhat Disagree 27 18.0 18.0 92.0
Strongly Disagree 12 8.0 8.0 100.0
Total 150 100.0 100.0

22
Statement 2: My Role Profile is linked to the District Plan:
Staff feel more motivated when they feel an affiliation with the organisation. 66 percent of
the respondents in this study agreed that their Role Profile is linked to the District Plan for
this department.
Table 4.6.2
Statement 2
Frequency Percent Valid Percent
Cumulative
Percent
Valid Strongly Agree 33 22.0 22.0 22.0
Somewhat Agree 66 44.0 44.0 66.0
Neutral 25 16.7 16.7 82.7
Somewhat Disagree 15 10.0 10.0 92.7
Strongly Disagree 11 7.3 7.3 100.0
Total 150 100.0 100.0
Statement 3: I have the tools and resources to do my job well:
Unless staff have the correct tools and means to complete their work to the best of their
ability, they cannot feel motivated. 57.3 percent of those surveyed felt they had the tools and
resources to do their job well.
Table 4.6.3
Statement 3
Frequency Percent Valid Percent
Cumulative
Percent
Valid Strongly Agree 25 16.7 16.7 16.7
Somewhat Agree 61 40.7 40.7 57.3
Neutral 27 18.0 18.0 75.3
Somewhat Disagree 27 18.0 18.0 93.3
Strongly Disagree 10 6.7 6.7 100.0
Total 150 100.0 100.0

23
Statement 4: There is a connection between pay and performance:
It is debatable whether or not pay is related to motivation, but when there is no monetary gain
for extra performance this can be de-motivating. According to the respondents in this study,
76 percent felt there was no link between pay and performance.
Table 4.6.4
Statement 4
Frequency Percent Valid Percent
Cumulative
Percent
Valid Strongly Agree 2 1.3 1.3 1.3
Somewhat Agree 10 6.7 6.7 8.0
Neutral 24 16.0 16.0 24.0
Somewhat Disagree 50 33.3 33.3 57.3
Strongly Disagree 64 42.7 42.7 100.0
Total 150 100.0 100.0
Statement 5: There is a connection between PMDS and promotion:
Self actualisation is a major factor influencing motivation and for many people this involves
opportunities for promotion. 50 percent of the respondents feel that there is no link between
PMDS and promotion.
Table 4.6.5
Statement 5
Frequency Percent Valid Percent
Cumulative
Percent
Valid Strongly Agree 11 7.3 7.3 7.3
Somewhat Agree 34 22.7 22.7 30.0
Neutral 30 20.0 20.0 50.0
Somewhat Disagree 38 25.3 25.3 75.3
Strongly Disagree 37 24.7 24.7 100.0
Total 150 100.0 100.0

24
Statement 6: My Core Competencies are applicable to my job:
There are certain core competencies required for every job and most of these require effort on
the part of the employee to accumulate. If these required competencies are not utilised fully
or are not actually applicable to the job, this can be demotivating for the employee. 50.7
percent of staff surveyed feel that their core competencies are applicable to their job.
Table 4.6.6
Statement 6
Frequency Percent Valid Percent
Cumulative
Percent
Valid Strongly Agree 21 14.0 14.0 14.0
Somewhat Agree 55 36.7 36.7 50.7
Neutral 36 24.0 24.0 74.7
Somewhat Disagree 27 18.0 18.0 92.7
Strongly Disagree 11 7.3 7.3 100.0
Total 150 100.0 100.0
Statement 7: I have agreed clearly defined goals with my supervisor:
Knowing what exactly is expected of you from your supervisor is very important, this needs
to be present in the relationship between staff and employees in order to keep staff motivated.
48 percent of respondents feel that they have clearly defined goals with their supervisor
through PMDS.
Table 4.6.7
Statement 7
Frequency Percent Valid Percent
Cumulative
Percent
Valid Strongly Agree 15 10.0 10.0 10.0
Somewhat Agree 57 38.0 38.0 48.0
Neutral 37 24.7 24.7 72.7
Somewhat Disagree 24 16.0 16.0 88.7
Strongly Disagree 17 11.3 11.3 100.0
Total 150 100.0 100.0

25
Statement 8: PMDS helps me to understand my job:
It is essential for staff to understand their job in order to remain motivated. 41.3 percent of
those surveyed do not agree that PMDS helps them to understand their job.
Table 4.6.8
Statement 8
Frequency Percent Valid Percent
Cumulative
Percent
Valid Strongly Agree 4 2.7 2.7 2.7
Somewhat Agree 47 31.3 31.3 34.0
Neutral 37 24.7 24.7 58.7
Somewhat Disagree 30 20.0 20.0 78.7
Strongly Disagree 32 21.3 21.3 100.0
Total 150 100.0 100.0
Statement 9: My training needs are met through PMDS:
As already stated, it is important that staff have the correct competencies to do their job well.
One way that this can be addressed through PMDS is to identify training needs with staff
through PMDS and provide timely and appropriate training. Of those surveyed, 50 percent
felt that their training needs were being met through PMDS.
Table 4.6.9
Statement 9
Frequency Percent Valid Percent
Cumulative
Percent
Valid Strongly Agree 16 10.7 10.7 10.7
Somewhat Agree 59 39.3 39.3 50.0
Neutral 32 21.3 21.3 71.3
Somewhat Disagree 28 18.7 18.7 90.0
Strongly Disagree 15 10.0 10.0 100.0
Total 150 100.0 100.0

26
Statement 10: My performance is continuously managed:
While performance management is an important factor in motivation, allowing staff some
autonomy is also important. This statement, when used in the context of PMDS relates more
to guiding the staff members performance to ensure they are working towards the agreed
goals. In this case 40.7 percent of respondents felt their performance was not being
continuously managed.
Table 4.6.10
Statement 10
Frequency Percent Valid Percent
Cumulative
Percent
Valid Strongly Agree 14 9.3 9.3 9.3
Somewhat Agree 42 28.0 28.0 37.3
Neutral 33 22.0 22.0 59.3
Somewhat Disagree 34 22.7 22.7 82.0
Strongly Disagree 27 18.0 18.0 100.0
Total 150 100.0 100.0
Statement 11: I feel the rating system is fair:
People need to feel that they are being treated fairly in relation to others in order to be
motivated. 60 percent of those surveyed feel the PMDS rating system is unfair.
Table 4.6.11
Statement 11
Frequency Percent Valid Percent
Cumulative
Percent
Valid Strongly Agree 12 8.0 8.0 8.0
Somewhat Agree 23 15.3 15.3 23.3
Neutral 25 16.7 16.7 40.0
Somewhat Disagree 39 26.0 26.0 66.0
Strongly Disagree 51 34.0 34.0 100.0
Total 150 100.0 100.0
27
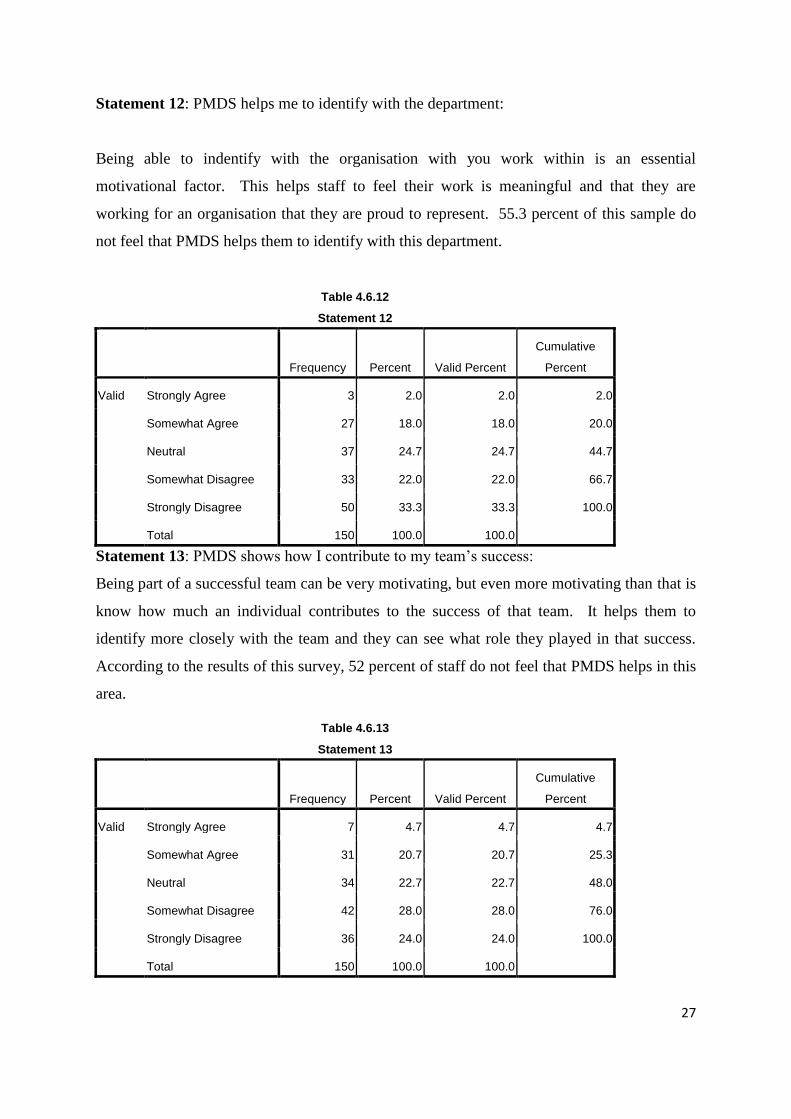
Statement 12: PMDS helps me to identify with the department:
Being able to indentify with the organisation with you work within is an essential
motivational factor. This helps staff to feel their work is meaningful and that they are
working for an organisation that they are proud to represent. 55.3 percent of this sample do
not feel that PMDS helps them to identify with this department.
Table 4.6.12
Statement 12
Frequency Percent Valid Percent
Cumulative
Percent
Valid Strongly Agree 3 2.0 2.0 2.0
Somewhat Agree 27 18.0 18.0 20.0
Neutral 37 24.7 24.7 44.7
Somewhat Disagree 33 22.0 22.0 66.7
Strongly Disagree 50 33.3 33.3 100.0
Total 150 100.0 100.0
Statement 13: PMDS shows how I contribute to my team’s success:
Being part of a successful team can be very motivating, but even more motivating than that is
know how much an individual contributes to the success of that team. It helps them to
identify more closely with the team and they can see what role they played in that success.
According to the results of this survey, 52 percent of staff do not feel that PMDS helps in this
area.
Table 4.6.13
Statement 13
Frequency Percent Valid Percent
Cumulative
Percent
Valid Strongly Agree 7 4.7 4.7 4.7
Somewhat Agree 31 20.7 20.7 25.3
Neutral 34 22.7 22.7 48.0
Somewhat Disagree 42 28.0 28.0 76.0
Strongly Disagree 36 24.0 24.0 100.0
Total 150 100.0 100.0

28
Statement 14: I get recognition for my work through PMDS:
In order to motivate staff, they must be given recognition for the work they have done.
PMDS provides a forum for this recognition, however, 56.7 percent of the sample feel that
they are not given this recognition through the PMDS process.
Table 4.6.14
Statement 14
Frequency Percent Valid Percent
Cumulative
Percent
Valid Strongly Agree 4 2.7 2.7 2.7
Somewhat Agree 31 20.7 20.7 23.3
Neutral 30 20.0 20.0 43.3
Somewhat Disagree 34 22.7 22.7 66.0
Strongly Disagree 51 34.0 34.0 100.0
Total 150 100.0 100.0
29
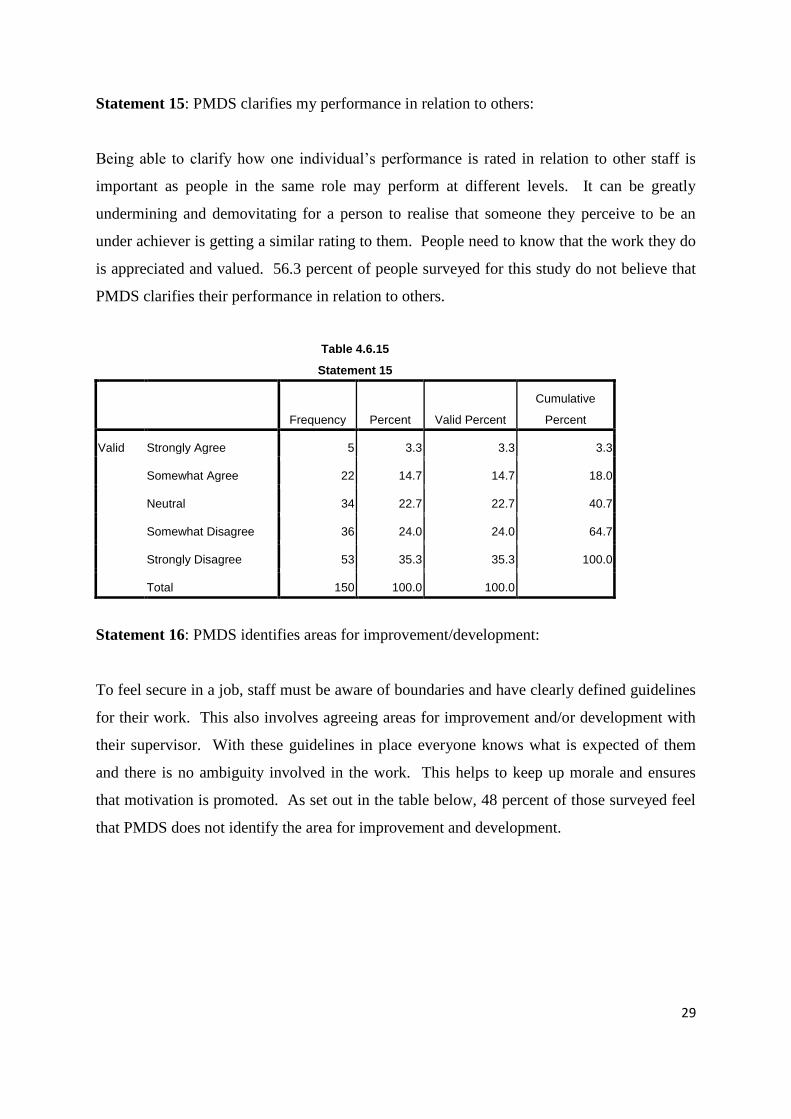
Statement 15: PMDS clarifies my performance in relation to others:
Being able to clarify how one individual’s performance is rated in relation to other staff is
important as people in the same role may perform at different levels. It can be greatly
undermining and demovitating for a person to realise that someone they perceive to be an
under achiever is getting a similar rating to them. People need to know that the work they do
is appreciated and valued. 56.3 percent of people surveyed for this study do not believe that
PMDS clarifies their performance in relation to others.
Table 4.6.15
Statement 15
Frequency Percent Valid Percent
Cumulative
Percent
Valid Strongly Agree 5 3.3 3.3 3.3
Somewhat Agree 22 14.7 14.7 18.0
Neutral 34 22.7 22.7 40.7
Somewhat Disagree 36 24.0 24.0 64.7
Strongly Disagree 53 35.3 35.3 100.0
Total 150 100.0 100.0
Statement 16: PMDS identifies areas for improvement/development:
To feel secure in a job, staff must be aware of boundaries and have clearly defined guidelines
for their work. This also involves agreeing areas for improvement and/or development with
their supervisor. With these guidelines in place everyone knows what is expected of them
and there is no ambiguity involved in the work. This helps to keep up morale and ensures
that motivation is promoted. As set out in the table below, 48 percent of those surveyed feel
that PMDS does not identify the area for improvement and development.

30
Table 4.6.16
Statement 16
Frequency Percent Valid Percent
Cumulative
Percent
Valid Strongly Agree 7 4.7 4.7 4.7
Somewhat Agree 46 30.7 30.7 35.3
Neutral 25 16.7 16.7 52.0
Somewhat Disagree 29 19.3 19.3 71.3
Strongly Disagree 43 28.7 28.7 100.0
Total 150 100.0 100.0
Statement 17: PMDS gives me a feeling of personal accomplishment:
Getting a feeling of personal accomplishment from work is one of the most
important factors when being motivated. Job satisfaction is surely one of the
things that any worker will strive towards. Helping staff to feel this about their
job is so important and can make such a difference to a person’s perception of
their job and the organisation in which they work. The study done on this
government department reveals that 64.7 percent of respondents did not feel that
PMDS contributes to their feeling of personal accomplishment.
Table 4.6.17
Statement 17
Frequency Percent Valid Percent
Cumulative
Percent
Valid Strongly Agree 6 4.0 4.0 4.0
Somewhat Agree 18 12.0 12.0 16.0
Neutral 29 19.3 19.3 35.3
Somewhat Disagree 37 24.7 24.7 60.0
Strongly Disagree 60 40.0 40.0 100.0
Total 150 100.0 100.0

31
4.7 Conclusion:
The data retrieved from the Quantitative Questionnaire used in this study was used to test the
Hypothesis that an individual is motivated by performance management. All of the
statements on the questionnaire related to motivation and how it was promoted by the PMDS
process.
The results were then tabulated using the SPSS Statistical Software package. This primary
research was then compared to the empirical research done in the literature review. Each
individual statement was analysed individually in order to simplify the reading of the
statistics achieved.
The percentages that pointed towards either motivation or de-motivation were highlighted to
show the reader of the piece which way the sample felt about each statement.

32
Chapter 5:
Discussion:
5.1 Introduction
Chapter 4 outlined how the primary data for this study was collected and showed the outcome
that resulted. The results from the Quantitative Questionnaire were then compiled through
the use of the Likert Scale and tabulated using SPSS statistical software package. Each
statement from the questionnaire was looked at individually and analysed by comparing it to
the empirical study done for the Literature Review.
In this chapter the results of the questionnaire will be discussed to find if there is a link
between Performance Management and Motivation. Each theme will be discussed and the
link between the Literature Review and the Findings Chapter will be highlighted to clarify the
themes.
The significance to the results will also be discussed in relation to the Literature Review. The
implications for research and practice will also be outlined in this chapter.
5.2 Themes & Patterns
The patterns observed in the findings chapter were that respondents agreed with statements
relating to the hard and fast rules of PMDS. When it came to determining the perceptions
staff had of the actual practice of PMDS, they answered less favourably. Any neutral
responses were not included in determining the results as they did not show which way
respondents felt in relation to the statements.

33
When these responses are looked at in relation to motivation theories as described in the
Findings Chapter this would show what PMDS was designed to act as a motivational tool.
According to this theory, staff utilising the PMDS process do not feel that it is a motivating
factor. This does not support the hypothesis that an individual is motivated by performance
management.
In general the study findings suggest that staff do not feel that there is a link between reward
and performance. According to Meyer (1975), people generally have exaggerated perceptions
of their performance. Martin (1981) states that people generally are prone to compare their
pay to others who are perceived as comparable in performance, but who earn more. Given
these tendencies, staff will feel de-motivated and under compensated through the use of the
current PMDS process.
The above could also be applied to the rating system used in PMDS. People did not feel that
this system was fair and as already stated, this is de-motivating for staff when they compare
themselves to others. Another reason that people may not think this rating system is fair is
that most staff will receive a rating of 3 out of 5 at every appraisal no matter how well they
feel they have done.
Staff did not feel they got recognition for their work through PMDS. Recognition in work is
an example of an intrinsic factor that will lead to job satisfaction. According to Maidani
(1991) recognition can be both an extrinsic and an intrinsic motivator, therefore this is an
important motivational factor. Staff in this particular government department do not feel that
this is supplied to them through PMDS.
When asked if PMDS clarified an individual’s performance in relation to others, the majority
answered that they felt that it did not. This all links back to negative motivation and
frustration which can arise when someone is paid less than another person for the same job.
This issued often arises in government departments. As per Taylor & Pierce (1999), when

34
staff try to affix blame for their unjust situation, they are likely to blame external factors, such
as a supervisor, the organization, or the incentive system, rather their self. If people perceive
that they are being treated unfairly they will become be-motivated and according to the
findings of this study, PMDS does not clarify people’s situation in this regard.
5.3 Meaning of Results
PMDS does not give staff in this government department a feeling of personal
accomplishment, according to the results of this study. According to Herzberg, badly and
inadequately structured working conditions lead to dissatisfaction (cited in Kressler, 2003).
When this is due to Performance Management procedures, staff do not feel motivated and
they become dissatisfied. When extrinsic motivation factors are met, a person is not
dissatisfied, but he or she is not satisfied. In other words, not being unhappy does not mean
that you are happy.
5.3 Conclusion
The significance of the preceding results is that it does not support the hypothesis that
performance management is linked to motivation. As this study was done on a government
department, it cannot be assumed that this would also apply to private industry. The PMDS
system in this government department appears to be used mainly for appraisal purposes.
It is referred to when officers are going forward for promotion. As long as an officer reaches
the required rating in their PMDS they are deemed eligible for promotion regardless of
whether they achieved an average score or an excellent score. This would infer that this has
led to the perception that it is not linked to promotion.

35
The same is true when an officer is in line for an incremental increase in their pay. If an
officer perceives that they are doing the same job as another for less money, this can be de-
motivating and can lead to the perception that PMDS is not linked to pay. It is true though
that bonuses are not given through the PMDS process. Also, if an officer is due an increment
and has reached the minimum acceptable level, they will receive the same increase in pay as
an officer who obtained an excellent score. This can be bad for morale and also can be very
de-motivating.

36
Chapter 6:
Conclusion:
6.1 Introduction
The purpose of this study was to examine how Performance Management affected Motivation
in a Government Department. Research was carried out to find out the benefits of
Performance Management and also the theories of Motivation. This study endeavoured to
find out whether Motivation was linked to Performance Management in the context of a
Government Department in the Irish Civil Service.
The research approach of this Management Report was conducted in an unbiased and
independent manner with a Positative philosophical position. The research conducted was
Quantitative in nature as it was to measure the level of motivation in the department. As the
report aimed to either confirm or not an original theory, it was deductive in nature. The
research was carried out via means of a Quantitative Questionnaire using the Likert Scale and
there were 150 respondents.
The results obtained were converted to statistics and tabulated using the SPSS Statistical
Software programme. This made the data easy to read and to understand. Each question on
the questionnaire was analysed individually and the theory from the Literature Review was
applied to each one. This was in order to deduct if this hypothesis could be supported or not.
These findings were then discussed and each theme was looked at in detail. Theories from
the Literature Review were again linked to the findings and the major themes were identified.
The hypothesis that an individual is motivated by performance management could not be
supported by the results obtained from this study.

37
6.2 Implications for Practice
This report showed that staff in a government department did not perceive PMDS to be
motivational. This could be due to the system its self or how it is managed. As it seen to not
be linked to pay and promotion, this may lead to people feeling that it is merely a “form
filling” practice and may be seen as a bit of a waste of time.
This is unfortunate, as having the opportunity to meet with a supervisor to discuss job
descriptions and agreeing a role profile is very important. PMDS also affords managers the
chance to meet with staff and discuss any issues at hand so that the staff member is fully
aware of their progress.
An approach must be taken by line managers which allows each employee feel that they are
being treated as an individual rather than just being asked to fill out a form for their personnel
file. Each member of staff should feel that a good rating is meaningful and is a true reflection
of their work within the department.
6.3 Implications for Research
This report did not find evidence that Performance Management leads to Motivation.
However, this research report surveyed one government department and cannot be used to
generalise about Performance Management. It could be inferred that Performance
Management in the Private Sector could be approached very differently. It may also be
perceived very differently in a different setting.
Before conclusively deducting if Motivation is linked to Performance Management, further
research should be done in the Private Sector. As PMDS is used in every government

38
department, it could be assumed that the results may be the same if they were to be surveyed.
Although this cannot be certain, as different departments may have different cultures.
6.4 Personal Reflection
From the beginning of this Management Research Report I found it to be quite challenging
but also very interesting. Just learning how to conduct research is so important and I feel that
I have learned a lot.
Motivation has always been a topic that interested me as what will motivate one person will
have no affect on another. There are so many questions and so many answers relating to this
topic that I feel that it could be inexhaustibly researched.

39
Bibliography:
Armstrong, M. (2000), Performance Management – Key Strategies and Practical Guidelines,
2nd ed., Kogan Page, London.
Bandura, A. & Cervone, D. 1983. Self-evaluative and self-efficacy mechanisms governing
the motivational effects of gal systems. Journal of Personality and Social Psychology,
45:1017-1028.
Campbell, D. & Pritchard, R. 1976. Motivation theory in industrial and organizational
psychology. In M. D. Dunnette (Ed.), Handbook of industrial and organizational psychology.
P 63-130. Chicago: Rand McNally.
Cully M, Dix G, O'Reilly A & Woodland S (1999), Britain at work: as depicted by the 1998
Workplace Employee Relations Survey. Routledge.
Denzin and YS Lincoln (Eds.) Handbook of Qualitative Research, Sage Publications,
Thousand Island, pp. 105-117.
Enzle, M. & Ross, J. 1978. Increasing and decreasing intrinsic interest with contingent
rewards: A test of cognitive evaluation theory. Journal of Experimental Social Psychology,
14:588-597.
Fuller, J. & Farrington, J. (1999). From Training to Performance Improvement: Navigating
the Transition. U.S.A.: Jossey-Bass/Pfeiffer.
Gillen, T. (1999) “The Appraisal Discussion” Management Shapers: Institute of Personnel
& Development.
Greenberg, J. 1982. Approaching equity and avoiding inequity in groups and organizations.
In J. Greenberg & R. Cohen (Eds.), Equity and justice in social behavior, p. 389-436. New
York: Academic Press.
Guba, EG and Lincoln, YS (1994), Competing Paradigms in Qualitative Research, in NK
Harackiewicz, J., 1979. The effects of reward contingency and performance feedback on
intrinsic motivation. Journal of Personality and Social Psychology, 37:1352-1363.
Herzberg, F (1959). The Motivation to Work. New York: John Wiley & Sons Inc.
Holtz, S. (2004). Corporate Conversations: A Guide to Crafting Effective and Appropriate
Internal Communications. U.S.A.: AMACOM.

40
Kressler, H. W. (2003). Motivate and Reward: Performance Appraisal and Incentive Systems
for Business Success. U.S.A.: Palgrave Macmillan.
Locke, E. 1967. Motivational effects of knowledge of results: Knowledge or goal setting.
Locke, E., & Latham, G. 1990. A theory of goal setting and task performance.
Martin, J. 1981. Relative deprivation: A theory of distributive jsutice for an era of shrinking
resources. In L. Cummings & B. Staw (Eds.), Research in Organizational Behavior, v. 3, p.
53-107. Greenwich, CT: JAI Press.
Meyer, H. 1975. The pay-for-performance dilemma. Organizational Dynamics, 3: 39-50.
Mullins, L J (1996), Management and Organisational Behaviour, 4th Edition. Pitman
Publishing.
Persson, B. (1994). Incitamentlöner. Stockholm: SNS Förlag.
Rowley, T. (1997), “Moving beyond dyadic ties: a network theory of stakeholder influences”,
Academy of Management Review, Vol. 22 No. 4, pp. 887-911.
Taylor, P. & Pierce, J. 1999. Effects of introducing a performance management system on
employees' subsequent attitudes and effort. Public Personnel Management, 28:423-452.
Wiley, C. (1997). What motivates employees according to over 40 years of motivation
surveys? International Journal of Manpower, 18(3), pp. 263-280.
Wilson C & Rosenfeld H (1990), Managing Organizations. McGraw-Hill.