Westpac Pillar 3 Report December 2017...Pillar 3 report Group structure Westpac Group December 2017...
20
December 2017
Transcript of Westpac Pillar 3 Report December 2017...Pillar 3 report Group structure Westpac Group December 2017...

December 2017

Pillar 3 report Table of contents
Westpac Group December 2017 Pillar 3 Report | 2
Structure of Pillar 3 report
Executive summary 3
Introduction 4
Group structure 5
Capital overview 7
Leverage ratio 10
Credit risk exposures 11
Securitisation 15
Appendix
Appendix I – APS330 Quantitative requirements 18
Disclosure regarding forward-looking statements 19
In this report references to ‘Westpac’, ‘Westpac Group’, ‘the Group’, ‘we’, ‘us’ and ‘our’ are to Westpac Banking Corporation and its controlled entities (unless the context indicates otherwise).
In this report, unless otherwise stated or the context otherwise requires, references to ‘$’, ‘AUD’ or ‘A$’ are to Australian dollars.
Any discrepancies between totals and sums of components in tables contained in this report are due to rounding.
In this report, unless otherwise stated, disclosures reflect the Australian Prudential Regulation Authority’s (APRA) implementation of Basel III.
Information contained in or accessible through the websites mentioned in this report does not form part of this report unless we specifically state that it is incorporated by reference and forms part of this report. All references in this report to websites are inactive textual references and are for information only.

Pillar 3 report Executive summary
Westpac Group December 2017 Pillar 3 Report | 3
31 December 2017 30 September 2017 31 December 2016
The Westpac Group at Level 2
Common equity Tier 1 capital ratio % 10.1 10.6 9.3
Additional Tier 1 capital % 2.1 2.1 1.6
Tier 1 capital ratio % 12.2 12.7 10.9
Tier 2 capital % 2.1 2.1 2.5
Total regulatory capital ratio % 14.3 14.8 13.4 -
APRA leverage ratio % 5.5 5.7 5.0
Westpac’s common equity Tier 1 (CET1) capital ratio was 10.1% at 31 December 2017. Consistent with the normal quarterly trend, capital generated for the quarter was more than offset by the payment of the 2017 final dividend (net of the dividend reinvestment plan) and portfolio growth. During the quarter, risk weighted assets (RWA) increased $6.1 billion, primarily due to modelling changes for credit risk RWA and portfolio growth. Credit quality improved across the portfolio partially offsetting these impacts.
$m 31 December 2017 30 September 2017 31 December 2016
Risk weighted assets at Level 2
Credit risk 355,865 349,258 357,842
Market risk 7,607 8,094 6,134
Operational risk 31,229 31,229 31,613
Interest rate risk in the banking book 11,585 11,101 10,561
Other 4,008 4,553 5,314
Total RWA 410,294 404,235 411,464
Total Exposure at Default 1,003,521 990,853 990,963
Total RWA increased $6.1 billion or 1.5% this quarter:
Credit risk RWA increased $6.6 billion or 1.9%:
Modelling changes added $4.2 billion to RWA mostly from:
o updates to models for small business in line with APRA guidance on the definition of default ($1.8 billion increase);
o changes in the modelling for credit cards and personal loans which include updated data for facilities in hardship ($1.7 billion increase); and
o reclassification of $6.6 billion of mortgage exposures to business related categories ($0.7 billion net RWA increase). The reclassification follows APRA industry guidance that where the purpose of a mortgage loan is business related these loans should be classified under business related categories. A summary of this reclassification is provided below;
Portfolio growth added $4.2 billion to RWA;
Mark-to-market related credit risk RWA increased $0.2 billion;
Improved credit quality across the portfolio, particularly in corporate lending, reduced RWA $1.7 billion; and
Foreign currency translation impacts, primarily related to NZ$ lending, decreased RWA $0.3 billion.
Non-credit RWA decreased $0.5 billion or 1.0%. Lower risk weighted assets for market risk ($0.5 billion) and other assets ($0.5 billion) was partially offset by an increase in interest rate risk in the banking book (IRRBB) ($0.5 billion) mostly from higher capital for credit spread risk for liquid assets.
Exposure at Default
Over the quarter, EAD increased $12.7 billion (up 1.3%), primarily driven by portfolio growth in residential mortgages ($4.4 billion), corporates ($2.8 billion), derivatives ($2.1 billion) and sovereigns ($1.4 billion)1.
Leverage Ratio
The leverage ratio represents the amount of Tier 1 capital relative to exposure2.1At 31 December 2017, Westpac’s leverage ratio was 5.5%. APRA has yet to prescribe any minimum leverage ratio requirements.
1 Movements exclude the impact of reclassifications this quarter.
2 As defined under Attachment D of APS110: Capital Adequacy

Pillar 3 report Executive summary
Westpac Group December 2017 Pillar 3 Report | 4
Reclassification of credit risk exposures
Asset class reclassifications in the December 2017 quarter impacted a number of the tables in this report. The impact on EAD and RWA of these reclassifications is summarised below.
Impacts
$b EAD RWA EAD RWA EAD RWA
Residential mortgages (6.6) (2.4) - - (6.6) (2.4)
Business Lending 3.1 1.6 (1.6) (0.9) 1.5 0.7
Small Business 2.6 0.7 2.0 1.3 4.6 2.0
Specialised lending 0.7 0.7 (0.3) (0.2) 0.4 0.5
Corporate 0.2 0.1 (0.1) (0.1) 0.1 -
Total - 0.7 - 0.1 - 0.8
Reclassification of:
Mortgages for a
business purpose
Exposures to small
businessTotal

Pillar 3 report Introduction
Westpac Group December 2017 Pillar 3 Report | 5
Westpac Banking Corporation is an Authorised Deposit-taking Institution (ADI) subject to regulation by the Australian Prudential Regulation Authority (APRA). APRA has accredited Westpac to apply advanced models permitted by the Basel III global capital adequacy regime to the measurement of its regulatory capital requirements. Westpac uses the Advanced Internal Ratings-Based approach (Advanced IRB) for credit risk and the Advanced Measurement Approach (AMA) for operational risk.
In accordance with APS330 Public Disclosure, financial institutions that have received this accreditation, such as Westpac, are required to disclose prudential information about their risk management practices on a semi-annual basis. A subset of this information must be disclosed quarterly.
In addition to this report, the regulatory disclosures section of the Westpac website1 contains the reporting requirements for:
Capital instruments under Attachment B of APS330; and
The identification of potential Global-Systemically Important Banks (G-SIB) under Attachment H of APS330 (disclosed annually).
Capital instruments disclosures are updated when:
A new capital instrument is issued that will form part of regulatory capital; or
A capital instrument is redeemed, converted into CET1 capital, written off, or its terms and conditions are changed.
1 http://www.westpac.com.au/about-westpac/investor-centre/financial-information/regulatory-disclosures/

Pillar 3 report Group structure
Westpac Group December 2017 Pillar 3 Report | 6
Westpac seeks to ensure that it is adequately capitalised at all times. APRA applies a tiered approach to measuring Westpac’s capital adequacy1 by assessing financial strength at three levels:
Level 1, comprising Westpac Banking Corporation and its subsidiary entities that have been approved by APRA as being part of a single 'Extended Licensed Entity' (ELE) for the purposes of measuring capital adequacy;
Level 2, the consolidation of Westpac Banking Corporation and all its subsidiary entities except those entities specifically excluded by APRA regulations. The head of the Level 2 group is Westpac Banking Corporation; and
Level 3, the consolidation of Westpac Banking Corporation and all its subsidiary entities.
Unless otherwise specified, all quantitative disclosures in this report refer to the prudential assessment of Westpac’s financial strength on a Level 2 basis2.
The Westpac Group
The following diagram shows the Level 3 conglomerate group and illustrates the different tiers of regulatory consolidation.
Level 1 Consolidation
Level 2 Consolidation
Level 3 Consolidation
Regulatory
non-consolidated
subsidiaries
Westpac
New Zealand Ltd
Other Westpac Level 2
subsidiaries
Westpac Banking
Corporation
Westpac Level 1
subsidiaries
Accounting consolidation3
The consolidated financial statements incorporate the assets and liabilities of all subsidiaries (including structured entities) controlled by Westpac. Westpac and its subsidiaries are referred to collectively as the ‘Group’. The effects of all transactions between entities in the Group are eliminated. Control exists when the parent entity is exposed to, or has rights to, variable returns from its involvement with an entity, and has the ability to affect those returns through its power over that entity. Subsidiaries are fully consolidated from the date on which control commences and they are no longer consolidated from the date that control ceases.
Group entities excluded from the regulatory consolidation at Level 2
Regulatory consolidation at Level 2 covers the global operations of Westpac and its subsidiary entities, including other controlled banking, securities and financial entities, except for those entities involved in the following business activities:
insurance;
acting as manager, responsible entity, approved trustee, trustee or similar role in relation to funds management;
non-financial (commercial) operations; or
special purpose entities to which assets have been transferred in accordance with the requirements of APS120 Securitisation.
Retained earnings and equity investments in subsidiary entities excluded from the consolidation at Level 2 are deducted from capital, with the exception of securitisation special purpose entities.
1 APS110 Capital Adequacy outlines the overall framework adopted by APRA for the purpose of assessing the capital adequacy of an ADI.
2 Impaired assets and provisions held in Level 3 entities are excluded from the tables in this report.
3 Refer to Note 35 of Westpac’s 2017 Annual Report for further details.

Pillar 3 report Group structure
Westpac Group December 2017 Pillar 3 Report | 7
Subsidiary banking entities
Westpac New Zealand Limited (WNZL), a wholly owned subsidiary entity, is a registered bank incorporated in New Zealand and regulated by the Reserve Bank of New Zealand. WNZL uses the Advanced IRB approach for credit risk and the AMA for operational risk. Other subsidiary banking entities in the Group include Westpac Bank-PNG-Limited and Westpac Europe Limited. For the purposes of determining Westpac’s capital adequacy subsidiary banking entities are consolidated at Level 2.
Restrictions and major impediments on the transfer of funds or regulatory capital within the Group
Minimum capital (‘thin capitalisation’) rules
Tax legislation in most jurisdictions in which the Group operates prescribes minimum levels of capital that must be retained in that jurisdiction to avoid a portion of the interest costs incurred in the jurisdiction ceasing to be tax deductible. Capital for these purposes includes both contributed capital and non-distributed retained earnings. Westpac seeks to maintain sufficient capital/retained earnings to comply with these rules.
Tax costs associated with repatriation
Repatriation of retained earnings (and capital) may result in tax being payable in either the jurisdiction from which the repatriation occurs or Australia on receipt of the relevant amounts. This cost would reduce the amount actually repatriated.
Intra-group exposure limits
Exposures to related entities are managed within the prudential limits prescribed by APRA in APS222 Associations with Related Entities1. Westpac has an internal limit structure and approval process governing credit exposures to related entities. This structure and approval process, combined with APRA’s prudential limits, is designed to reduce the potential for unacceptable contagion risk.
Prudential regulation of subsidiary entities
Certain subsidiary banking, insurance and trustee entities are subject to local prudential regulation in their own right, including capital adequacy requirements and investment or intra-group exposure limits. Westpac seeks to ensure that its subsidiary entities are adequately capitalised and adhere to regulatory requirements at all times. There are no capital deficiencies in subsidiary entities excluded from the regulatory consolidation at Level 2.
On 15 November 2017, the RBNZ advised WNZL of changes to its conditions of registration resulting from its review of WNZL’s compliance with the RBNZ’s ‘Capital Adequacy Framework (Internal Models Based Approach) (BS2B). The changes to WNZL’s conditions of registration came into effect on 31 December 2017 and increase the minimum Total Capital ratio, Tier 1 Capital ratio and Common Equity Tier 1 Capital ratio of WNZL and its controlled entities by 2%. WNZL has also undertaken to the RBNZ to maintain the Total Capital ratio of WNZL and its controlled entities above 15.1%. WNZL and its controlled entities retain an appropriate amount of capital to comply with the increased minimum ratios.
1 For the purposes of APS222, subsidiaries controlled by Westpac, other than subsidiaries that form part of the ELE, represent ‘related entities’. Prudential and internal limits apply to intra-group exposures between the ELE and related entities, both on an individual and aggregate basis.

Pillar 3 report Capital overview
Westpac Group December 2017 Pillar 3 Report | 8
Capital management strategy
Westpac’s approach to capital management seeks to balance the fact that capital is an expensive form of funding with the need to be adequately capitalised as an ADI. Westpac considers the need to balance efficiency, flexibility and adequacy when determining sufficiency of capital and when developing capital management plans.
Westpac evaluates these considerations through an Internal Capital Adequacy Assessment Process (ICAAP), the key features of which include:
the development of a capital management strategy, including consideration of regulatory minimums, capital buffers and contingency plans;
consideration of both economic and regulatory capital requirements;
a stress testing framework that challenges the capital measures, coverage and requirements including the impact of adverse economic scenarios; and
consideration of the perspectives of external stakeholders including rating agencies and equity and debt investors.
In light of APRA’s announcement on “unquestionably strong” capital on 19 July 2017, Westpac has ceased to use its preferred range for the CET1 ratio of 8.75% to 9.25% as a guide to managing capital levels. Westpac will revise its preferred range for the CET1 ratio once APRA finalises its review of the capital adequacy framework. In the interim, Westpac will seek to operate with a CET1 ratio of at least 10.5% in March and September as measured under the existing capital framework. This also takes into consideration:
current regulatory capital minimums and the capital conservation buffer (“CCB”), which together are the total CET1 requirement. In line with the above, the total CET1 requirement for Westpac is at least 8.0%, based upon an industry minimum CET1 requirement of 4.5% plus a capital buffer of at least 3.5% applicable to domestic systemically important banks (D-SIBs)
1;
stress testing to calibrate an appropriate buffer against a downturn; and
quarterly volatility of capital ratios due to the half yearly cycle of ordinary dividend payments.
Should the CET1 ratio fall below the total CET1 requirement, restrictions on the distribution of earnings will apply. This includes restrictions on the amount of earnings that can be distributed through dividends, Additional Tier 1 capital distributions and discretionary staff bonuses.
Westpac’s capital adequacy ratios
% 31 December 2017 30 September 2017 31 December 2016
The Westpac Group at Level 2
Common equity Tier 1 capital ratio 10.1 10.6 9.3
Additional Tier 1 capital 2.1 2.1 1.6
Tier 1 capital ratio 12.2 12.7 10.9
Tier 2 capital 2.1 2.1 2.5
Total regulatory capital ratio 14.3 14.8 13.4
The Westpac Group at Level 1
Common equity Tier 1 capital ratio 9.9 10.4 9.4
Additional Tier 1 capital 2.2 2.2 1.8
Tier 1 capital ratio 12.1 12.6 11.2
Tier 2 capital 2.3 2.4 2.8
Total regulatory capital ratio 14.4 15.0 14.0
Westpac New Zealand Limited’s capital adequacy ratios
% 31 December 2017 30 September 2017 31 December 2016
Westpac New Zealand Limited
Common equity Tier 1 capital ratio 11.5 11.1 10.9
Additional Tier 1 capital 2.8 2.9 -
Tier 1 capital ratio 14.3 14.0 10.9
Tier 2 capital 2.2 2.1 1.9
Total regulatory capital ratio 16.5 16.1 12.8
1 Noting that APRA may apply higher CET1 requirements for an individual ADI.

Pillar 3 report Capital overview
Westpac Group December 2017 Pillar 3 Report | 9
Capital requirements
This table shows risk weighted assets and associated capital requirements1 for each risk type included in the regulatory assessment of Westpac’s capital adequacy. More detailed disclosures on the prudential assessment of capital requirements are presented in the following sections of this report.234
31 December 2017 IRB Standardised Total Risk Total Capital
$m Approach Approach2 Weighted Assets Required1
Credit risk
Corporate 71,735 1,870 73,605 5,888
Business lending 35,035 1,030 36,065 2,885
Sovereign 1,526 965 2,491 199
Bank 6,105 42 6,147 492
Residential mortgages 126,091 5,435 131,526 10,522
Australian credit cards 6,358 - 6,358 509
Other retail 13,703 1,007 14,710 1,177
Small business 15,832 - 15,832 1,267
Specialised lending 57,675 429 58,104 4,648
Securitisation 4,425 - 4,425 354
Mark-to-market related credit risk3 - 6,602 6,602 528
Total 338,485 17,380 355,865 28,469
Market risk 7,607 608
Operational risk 31,229 2,498
Interest rate risk in the banking book 11,585 927
Other assets44,008 321
Total 410,294 32,823
30 September 2017 IRB Standardised Total Risk Total Capital
$m Approach Approach2 Weighted Assets Required1
Credit risk
Corporate 71,160 1,663 72,823 5,826
Business lending 34,638 1,036 35,674 2,854
Sovereign 1,505 960 2,465 197
Bank 5,905 89 5,994 480
Residential mortgages 127,825 4,785 132,610 10,609
Australian credit cards 5,665 - 5,665 453
Other retail 13,250 1,028 14,278 1,142
Small business 11,708 - 11,708 937
Specialised lending 57,081 385 57,466 4,597
Securitisation 4,167 - 4,167 333
Mark-to-market related credit risk3 - 6,408 6,408 513
Total 332,904 16,354 349,258 27,941
Market risk 8,094 648
Operational risk 31,229 2,498
Interest rate risk in the banking book 11,101 888
Other assets44,553 364
Total 404,235 32,339
1 Total capital required is calculated as 8% of total risk weighted assets.
2 Westpac’s Standardised risk weighted assets are categorised based on their equivalent IRB categories.
3 Mark-to-market related credit risk is measured under the standardised approach. It is also known as Credit Valuation Adjustment (CVA) risk.
4 Other assets include cash items, unsettled transactions, fixed assets and other non-interest earning assets.

Pillar 3 report Capital overview
Westpac Group December 2017 Pillar 3 Report | 10
31 December 2016 IRB Standardised Total Risk Total Capital
$m Approach Approach2 Weighted Assets Required1
Credit risk
Corporate 80,472 1,449 81,921 6,554
Business lending 33,821 1,277 35,098 2,808
Sovereign 1,687 1,136 2,823 226
Bank 6,240 58 6,298 504
Residential mortgages 126,083 4,449 130,532 10,443
Australian credit cards 5,806 - 5,806 465
Other retail 13,765 1,058 14,823 1,186
Small business 11,419 - 11,419 914
Specialised lending 57,199 397 57,596 4,608
Securitisation 4,104 - 4,104 328
Mark-to-market related credit risk3 - 7,422 7,422 594
Total 340,596 17,246 357,842 28,630
Market risk 6,134 491
Operational risk 31,613 2,529
Interest rate risk in the banking book 10,561 845
Other assets45,314 425
Total 411,464 32,920
1234
1 Total capital required is calculated as 8% of total risk weighted assets.
2 Westpac’s Standardised risk weighted assets are categorised based on their equivalent IRB categories.
3 Mark-to-market related credit risk is measured under the standardised approach. It is also known as Credit Valuation Adjustment (CVA) risk.
4 Other assets include cash items, unsettled transactions, fixed assets and other non-interest earning assets.
Pillar 3 report Leverage ratio disclosure
Westpac Group December 2017 Pillar 3 Report | 11
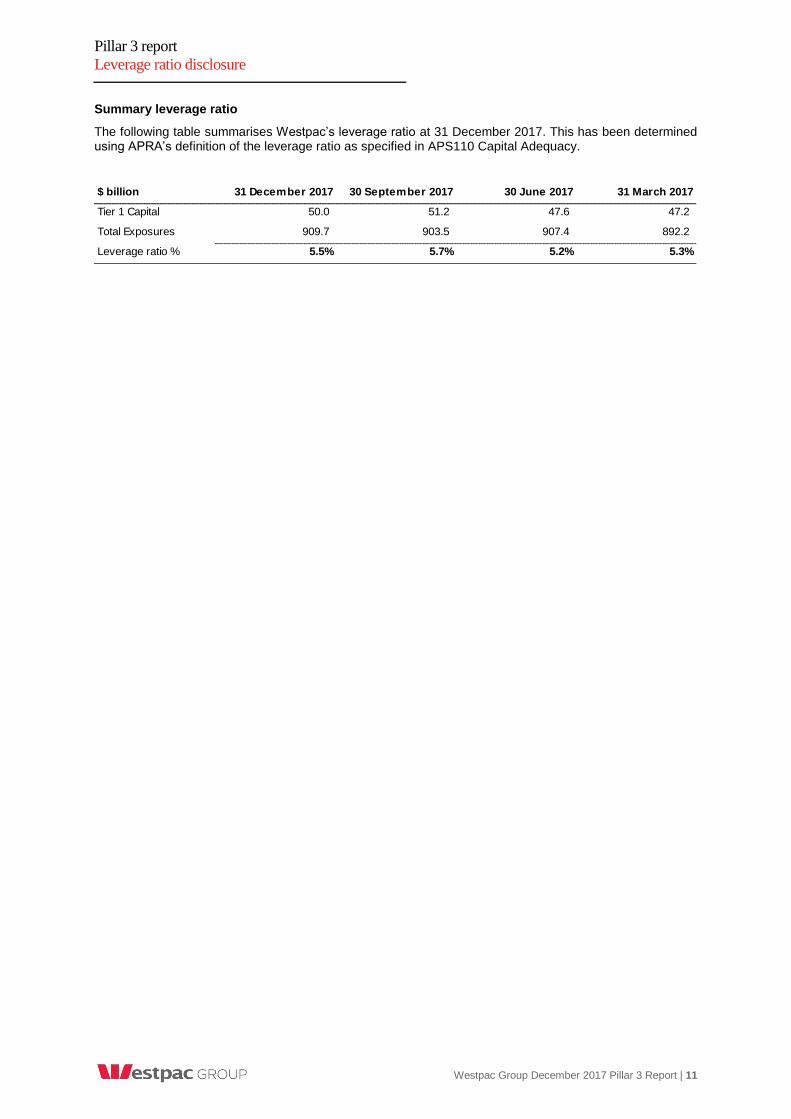
Summary leverage ratio
The following table summarises Westpac’s leverage ratio at 31 December 2017. This has been determined using APRA’s definition of the leverage ratio as specified in APS110 Capital Adequacy.
$ billion 31 December 2017 30 September 2017 30 June 2017 31 March 2017
Tier 1 Capital 50.0 51.2 47.6 47.2
Total Exposures 909.7 903.5 907.4 892.2
Leverage ratio % 5.5% 5.7% 5.2% 5.3%

Pillar 3 report Credit risk exposures
Westpac Group December 2017 Pillar 3 Report | 12
Summary credit risk disclosure12
Regulatory
Expected Specif ic Actual
Risk Regulatory Loss for Provisions Losses for
31 December 2017 Exposure Weighted Expected non-defaulted Impaired for Impaired the 3 months
$m at Default Assets Loss1 exposures Loans Loans ended
Corporate 129,663 71,735 565 431 176 94 -
Business lending 53,883 35,035 601 423 260 154 25
Sovereign 72,896 1,526 1 1 - - -
Bank 22,672 6,105 7 7 - - -
Residential mortgages 540,479 126,091 1,153 952 313 106 20
Australian credit cards 19,809 6,358 370 311 92 48 73
Other retail 17,760 13,703 590 451 318 135 89
Small business 32,724 15,832 450 320 150 77 25
Specialised Lending 67,897 57,675 833 605 158 54 1
Securitisation 27,486 4,425 - - - - -
Standardised2 18,252 17,380 - - 20 11 -
Total 1,003,521 355,865 4,570 3,501 1,487 679 233
Regulatory
Expected Specif ic Actual
Risk Regulatory Loss for Provisions Losses for
30 September 2017 Exposure Weighted Expected non-defaulted Impaired for Impaired the 12 months
$m at Default Assets Loss1 exposures Loans Loans ended
Corporate 126,747 71,160 594 458 215 93 384
Business lending 52,525 34,638 637 417 307 166 150
Sovereign 71,471 1,505 1 1 - - -
Bank 21,142 5,905 7 7 - - -
Residential mortgages 542,687 127,825 1,173 968 271 105 87
Australian credit cards 19,723 5,665 298 227 108 55 330
Other retail 17,929 13,250 527 380 296 139 395
Small business 27,421 11,708 300 191 118 51 73
Specialised Lending 67,109 57,081 849 600 208 94 68
Securitisation 26,712 4,167 - - - - -
Standardised2 17,387 16,354 - - 19 11 1
Total 990,853 349,258 4,386 3,249 1,542 714 1,488
Regulatory
Expected Specif ic Actual
Risk Regulatory Loss for Provisions Losses for
31 December 2016 Exposure Weighted Expected non-defaulted Impaired for Impaired the 3 months
$m at Default Assets Loss1 exposures Loans Loans ended
Corporate 135,750 80,472 976 540 848 408 (2)
Business lending 51,186 33,821 655 399 355 218 26
Sovereign 80,738 1,687 2 2 - - -
Bank 21,760 6,240 7 7 - - -
Residential mortgages 527,700 126,083 1,107 944 231 77 20
Australian credit cards 20,084 5,806 331 264 97 61 76
Other retail 18,709 13,765 568 443 215 124 90
Small business 26,907 11,419 314 197 109 47 18
Specialised Lending 67,663 57,199 971 596 303 114 25
Securitisation 24,091 4,104 - - - - -
Standardised2 16,375 17,246 - - 22 11 -
Total 990,963 357,842 4,931 3,392 2,180 1,060 253
1 Includes regulatory expected losses for defaulted and non-defaulted exposures.
2 Includes mark-to-market related credit risk.

Pillar 3 report Credit risk exposures
Westpac Group December 2017 Pillar 3 Report | 13
Exposure at Default by major type123
31 December 2017 On balance Total Exposure Average
$m sheet Non-market related Market related at Default 3 months ended1
Corporate 62,545 56,756 10,362 129,663 128,205
Business lending 40,228 13,655 - 53,883 53,204
Sovereign 68,253 1,934 2,709 72,896 72,184
Bank 14,184 1,928 6,560 22,672 21,907
Residential mortgages 462,360 78,119 - 540,479 541,583
Australian credit cards 9,975 9,834 - 19,809 19,766
Other retail 14,181 3,579 - 17,760 17,845
Small business 25,643 7,081 - 32,724 30,073
Specialised lending 52,308 14,584 1,005 67,897 67,503
Securitisation2 20,424 6,933 129 27,486 27,099
Standardised 13,893 1,154 3,205 18,252 17,820
Total 783,994 195,557 23,970 1,003,521 997,187
30 September 2017 On balance Total Exposure Average
$m sheet Non-market related Market related at Default 12 months ended3
Corporate 60,844 56,098 9,805 126,747 130,130
Business lending 38,784 13,741 - 52,525 51,174
Sovereign 67,083 1,895 2,493 71,471 73,758
Bank 13,386 1,794 5,962 21,142 20,992
Residential mortgages 463,363 79,324 - 542,687 531,347
Australian credit cards 9,794 9,929 - 19,723 19,960
Other retail 14,288 3,641 - 17,929 18,405
Small business 22,039 5,382 - 27,421 27,424
Specialised lending 51,847 14,308 954 67,109 67,310
Securitisation2 20,399 6,182 131 26,712 25,029
Standardised 13,738 1,163 2,486 17,387 16,499
Total 775,565 193,457 21,831 990,853 982,028
31 December 2016 On balance Total Exposure Average
$m sheet Non-market related Market related at Default 3 months ended4
Corporate 61,982 60,548 13,220 135,750 134,143
Business lending 37,526 13,660 - 51,186 50,024
Sovereign 75,195 2,107 3,436 80,738 75,829
Bank 13,494 2,120 6,146 21,760 21,607
Residential mortgages 447,976 79,724 - 527,700 523,630
Australian credit cards 10,279 9,805 - 20,084 20,114
Other retail 14,970 3,739 - 18,709 18,726
Small business 21,413 5,494 - 26,907 27,758
Specialised lending 52,261 14,427 975 67,663 67,832
Securitisation2 19,159 4,748 184 24,091 23,658
Standardised 13,074 1,291 2,010 16,375 15,951
Total 767,329 197,663 25,971 990,963 979,272
Off-balance sheet
Off-balance sheet
Off-balance sheet
1 Average is based on exposures as at 31 December 2017 and 30 September 2017.
2 The EAD associated with securitisations is for the banking book only.
3 Average is based on exposures as at 30 September 2017, 30 June 2017, 31 March 2017, 31 December 2016, and 30 September 2016.
4 Average is based on exposures as at 31 December 2016 and 30 September 2016.

Pillar 3 report Credit risk exposures
Westpac Group December 2017 Pillar 3 Report | 14
Loan impairment provisions
APS220 Credit Quality requires that Westpac report specific provisions and a General Reserve for Credit Loss (GRCL). All Individually Assessed Provisions (IAP) raised under Australian Accounting Standards (AAS) are classified as specific provisions. Collectively Assessed Provisions (CAP) raised under AAS are either classified into specific provisions or a GRCL.
A GRCL adjustment is made for the amount of GRCL that Westpac reports for regulatory purposes under APS220 in addition to provisions reported by Westpac under AAS. For capital adequacy purposes the GRCL adjustment is deducted from CET1. Eligible GRCL is included in Tier 2 capital.
31 December 2017 AAS Provisions GRCL Total Regulatory
$m IAPs CAPs Total Adjustment Provisions
Specif ic Provisions
for impaired loans 454 225 679 NA 679
for defaulted but not impaired loans NA 183 183 NA 183
General Reserve for Credit Loss NA 2,248 2,248 338 2,586
Total provisions for impairment charges 454 2,656 3,110 338 3,448
30 September 2017 AAS Provisions GRCL Total Regulatory
$m IAPs CAPs Total Adjustment Provisions
Specif ic Provisions
for impaired loans 480 234 714 NA 714
for defaulted but not impaired loans NA 175 175 NA 175
General Reserve for Credit Loss NA 2,230 2,230 332 2,562
Total provisions for impairment charges 480 2,639 3,119 332 3,451
31 December 2016 AAS Provisions GRCL Total Regulatory
$m IAPs CAPs Total Adjustment Provisions
Specif ic Provisions
for impaired loans 841 219 1,060 NA 1,060
for defaulted but not impaired loans NA 153 153 NA 153
General Reserve for Credit Loss NA 2,408 2,408 337 2,745
Total provisions for impairment charges 841 2,780 3,621 337 3,958

Pillar 3 report Credit risk exposures
Westpac Group December 2017 Pillar 3 Report | 15
Impaired and past due loans
The following tables disclose the crystallisation of credit risk as impairment and loss. Analysis of exposures 90 days past due not impaired, impaired loans, related provisions and actual losses is broken down by concentrations reflecting Westpac’s asset categories.
Items Specif ic Specif ic Actual
31 December 2017 past 90 days Impaired Provisions for Provisions to Losses for the
$m not impaired Loans Impaired Loans Impaired Loans 3 months ended
Corporate 72 176 94 53% -
Business lending 199 260 154 59% 25
Sovereign - - - - -
Bank - - - - -
Residential mortgages 2,783 313 106 34% 20
Australian credit cards - 92 48 52% 73
Other retail - 318 135 42% 89
Small business 136 150 77 51% 25
Specialised lending 258 158 54 34% 1
Securitisation - - - - -
Standardised 18 20 11 55% -
Total 3,466 1,487 679 46% 233
Items Specif ic Specif ic Actual
30 September 2017 past 90 days Impaired Provisions for Provisions to Losses for the
$m not impaired Loans Impaired Loans Impaired Loans 12 months ended
Corporate 57 215 93 43% 384
Business lending 238 307 166 54% 150
Sovereign - - - - -
Bank - - - - -
Residential mortgages 2,761 271 105 39% 87
Australian credit cards - 108 55 51% 330
Other retail - 296 139 47% 395
Small business 122 118 51 43% 73
Specialised lending 261 208 94 45% 68
Securitisation - - - - -
Standardised 19 19 11 58% 1
Total 3,458 1,542 714 46% 1,488
Items Specif ic Specif ic Actual
31 December 2016 past 90 days Impaired Provisions for Provisions to Losses for the
$m not impaired Loans Impaired Loans Impaired Loans 3 months ended
Corporate 250 848 408 48% (2)
Business lending 219 355 218 61% 26
Sovereign - - - - -
Bank - - - - -
Residential mortgages 2,613 231 77 33% 20
Australian credit cards - 97 61 63% 76
Other retail - 215 124 58% 90
Small business 118 109 47 43% 18
Specialised lending 94 303 114 38% 25
Securitisation - - - - -
Standardised 16 22 11 50% -
Total 3,310 2,180 1,060 49% 253

Pillar 3 report Securitisation
Westpac Group December 2017 Pillar 3 Report | 16
Banking book summary of securitisation activity by asset type
For the 3 months ended
31 December 2017 Amount Recognised gain or
$m securitised loss on sale
Residential mortgages 10,867 -
Credit cards - -
Auto and equipment f inance 1,436 -
Business lending - -
Investments in ABS - -
Other - -
Total 12,303 -
For the 12 months ended
30 September 2017 Amount Recognised gain or
$m securitised loss on sale
Residential mortgages 14,732 -
Credit cards - -
Auto and equipment f inance 2,508 -
Business lending - -
Investments in ABS - -
Other - -
Total 17,240 -
For the 3 months ended
31 December 2016 Amount Recognised gain or
$m securitised loss on sale
Residential mortgages 2,506 -
Credit cards - -
Auto and equipment f inance 120 -
Business lending - -
Investments in ABS - -
Other - -
Total 2,626 -

Pillar 3 report Securitisation
Westpac Group December 2017 Pillar 3 Report | 17
Banking book summary of on and off-balance sheet securitisation by exposure type
31 December 2017 Off-balance Total Exposure
$m Securitisation retained Securitisation purchased sheet at Default
Securities - 9,412 - 9,412
Liquidity facilities 33 - 881 914
Funding facilities 10,960 - 5,989 16,949
Underw riting facilities - - 82 82
Lending facilities - - 129 129
Warehouse facilities - - - -
Total 10,993 9,412 7,081 27,486
30 September 2017 Off-balance Total Exposure
$m Securitisation retained Securitisation purchased sheet at Default
Securities - 8,717 - 8,717
Liquidity facilities - - 1,016 1,016
Funding facilities 11,682 - 5,084 16,766
Underw riting facilities - - 82 82
Lending facilities - - 131 131
Warehouse facilities - - - -
Total 11,682 8,717 6,313 26,712
31 December 2016 Off-balance Total Exposure
$m Securitisation retained Securitisation purchased sheet at Default
Securities - 6,785 - 6,785
Liquidity facilities 84 - 1,117 1,201
Funding facilities 12,263 - 3,568 15,831
Underw riting facilities - - 90 90
Lending facilities - - 184 184
Warehouse facilities - - - -
Total 12,347 6,785 4,959 24,091
On balance sheet
On balance sheet
On balance sheet

Pillar 3 report Securitisation
Westpac Group December 2017 Pillar 3 Report | 18
Trading book summary of on and off-balance sheet securitisation by exposure type1
31 December 2017 Off-balance Total Exposure
$m Securitisation retained Securitisation purchased sheet at Default
Securities - 125 - 125
Liquidity facilities - - - -
Funding facilities - - - -
Underw riting facilities - - - -
Lending facilities - - - -
Warehouse facilities - - - -
Credit enhancements - - - -
Basis sw aps - - 51 51
Other derivatives - - 43 43
Total - 125 94 219
30 September 2017 Off-balance Total Exposure
$m Securitisation retained Securitisation purchased sheet at Default
Securities - 130 - 130
Liquidity facilities - - - -
Funding facilities - - - -
Underw riting facilities - - - -
Lending facilities - - - -
Warehouse facilities - - - -
Credit enhancements - - - -
Basis sw aps - - 54 54
Other derivatives - - 56 56
Total - 130 110 240
31 December 2016 Off-balance Total Exposure
$m Securitisation retained Securitisation purchased sheet at Default
Securities 10 98 - 108
Liquidity facilities - - - -
Funding facilities - - - -
Underw riting facilities - - - -
Lending facilities - - - -
Warehouse facilities - - - -
Credit enhancements - - - -
Basis sw aps - - 56 56
Other derivatives - - 67 67
Total 10 98 123 231
On balance sheet
On balance sheet
On balance sheet
1 EAD associated with trading book securitisation is not included in EAD by major type on page 13. Trading book securitisation exposure is captured and risk weighted under APS116 Capital Adequacy: Market Risk.

Pillar 3 report Appendix I - APS330 quantitative requirements
Westpac Group December 2017 Pillar 3 Report | 19
The following table cross-references the quantitative disclosure requirements outlined in Attachment C of APS330 to the quantitative disclosures made in this report.
APS330 reference Westpac disclosure Page
General Requirements
Paragraph 47 Summary leverage ratio 11
Attachment C
Table 3:
Capital Adequacy
(a) to (e) (f)
Capital requirements
Westpac’s capital adequacy ratios
Capital adequacy ratios of major subsidiary banks
9
8
8
Table 4:
Credit Risk - general disclosures
(a)
(b)
(c)
Exposure at Default by major type
Impaired and past due loans
General reserve for credit loss
13
15
14
Table 5:
Securitisation exposures
(a)
(b)
Banking Book summary of securitisation activity by asset type
Banking Book summary of on and off-balance sheet securitisation by exposure type
Trading Book summary of on and off-balance sheet securitisation by exposure type
16
17
18
Exchange rates
The following exchange rates were used in this Westpac Pillar 3 report, and reflect spot rates for the period end.
$ 31 December 2017 30 September 2017 31 December 2016
USD 0.7798 0.7844 0.7234
GBP 0.5794 0.5846 0.5891
NZD 1.0984 1.0867 1.0396
EUR 0.6528 0.6656 0.6869

Pillar 3 report
Disclosure regarding forward-looking statements
Westpac Group December 2017 Pillar 3 Report | 20
This report contains statements that constitute ‘forward-looking statements’ within the meaning of Section 21E of the US Securities Exchange Act of 1934.
Forward-looking statements are statements about matters that are not historical facts. Forward-looking statements appear in a number of places in this report and include statements regarding Westpac’s intent, belief or current expectations with respect to its business and operations, market conditions, results of operations and financial condition, including, without limitation, future loan loss provisions and financial support to certain borrowers. Words such as ‘will’, ‘may’, ‘expect’, ‘intend’, ‘seek’, ‘would’, ‘should’, ‘could’, ‘continue’, ‘plan’, ‘estimate’, ‘anticipate’, ‘believe’, ‘probability’, ‘risk’, ‘aim’ or other similar words are used to identify forward-looking statements. These forward-looking statements reflect Westpac’s current views with respect to future events and are subject to change, certain risks, uncertainties and assumptions which are, in many instances, beyond Westpac’s control, and have been made based upon management’s expectations and beliefs concerning future developments and their potential effect upon Westpac. There can be no assurance that future developments will be in accordance with Westpac’s expectations or that the effect of future developments on Westpac will be those anticipated. Actual results could differ materially from those expected, depending on the outcome of various factors, including, but not limited to:
the effect of, and changes in, laws, regulations, taxation or accounting standards or practices and government policy, particularly changes to liquidity, leverage and capital requirements;
regulatory investigations, litigation, fines, penalties, restrictions or other regulator imposed conditions, including as a result of our failure to comply with laws (such as financial crime laws), regulations or regulatory policy;
internal and external events which may adversely impact Westpac’s reputation;
information security breaches, including cyberattacks;
reliability and security of Westpac’s technology and risks associated with changes to technology systems;
the stability of Australian and international financial systems and disruptions to financial markets and any losses or business impacts Westpac or its customers or counterparties may experience as a result;
market volatility, including uncertain conditions in funding, equity and asset markets;
adverse asset, credit or capital market conditions;
the conduct, behaviour or practices of Westpac or its staff;
changes to Westpac’s credit ratings or to the methodology used by credit rating agencies;
levels of inflation, interest rates, exchange rates and market and monetary fluctuations;
market liquidity and investor confidence;
changes in economic conditions, consumer spending, saving and borrowing habits in Australia, New Zealand and in other countries in which Westpac or its customers or counterparties conduct their operations and Westpac’s ability to maintain or to increase market share, margins and fees, and control expenses;
the effects of competition in the geographic and business areas in which Westpac conducts its operations;
the timely development and acceptance of new products and services and the perceived overall value of these products and services by customers;
the effectiveness of Westpac’s risk management policies, including internal processes, systems and employees;
the incidence or severity of Westpac insured events;
the occurrence of environmental change (including as a result of climate change) or external events in countries in which Westpac or its customers or counterparties conduct their operations;
changes to the value of Westpac’s intangible assets;
changes in political, social or economic conditions in any of the major markets in which Westpac or its customers or counterparties operate;
the success of strategic decisions involving diversification or innovation, in addition to business expansion and integration of new businesses; and
various other factors beyond Westpac’s control.
The above list is not exhaustive. For certain other factors that may impact on forward-looking statements made by Westpac, refer to ‘Risk factors’ in Westpac’s 2017 Annual Report. When relying on forward-looking statements to make decisions with respect to Westpac, investors and others should carefully consider the foregoing factors and other uncertainties and events.
Westpac is under no obligation to update any forward-looking statements contained in this report, whether as a result of new information, future events or otherwise, after the date of this report.