Regional Economic Report - Westpac€¦ · Westpac Institutional Bank is a division of Westpac...
27
Regional Economic Report Winter 2007 First quarter 2008
Transcript of Regional Economic Report - Westpac€¦ · Westpac Institutional Bank is a division of Westpac...

Regional Economic ReportWinter 2007
W001111 (6/07)
W001111 Report cover.indd 1 20/6/07 5:22:19 PM
First quarter 2008
Contents
This issue was finalised on 14 March 2008
Westpac Institutional Bank is a division of Westpac Banking Corporation ABN 33 007 457 141. Information current as at date above. This information has been prepared without taking account of your objectives, financial situation or needs. Because of this you should, before acting on this information, consider its appropriateness, having regard to your objectives, financial situation or needs. Westpac's financial services guide can be obtained by calling 132 032, visiting www.westpac.com.au or visiting any Westpac Branch. The information may contain material provided directly by third parties, and while such material is published with permission, Westpac accepts no responsibility for the accuracy or completeness of any such material. Except where contrary to law, Westpac intends by this notice to exclude liability for the information. The information is subject to change without notice and Westpac is under no obligation to update the information or correct any inaccuracy which may become apparent at a later date. Westpac Banking Corporation is regulated for the conduct of investment business in the United Kingdom by the Financial Services Authority. If you wish to be removed from our e-mail, fax or mailing list please send an e-mail to [email protected] or fax us on +61 2 8254 6934 or write to Westpac Economics at Level 2, 275 Kent Street, Sydney NSW 2000. Please state your full name, telephone/fax number and company details on all correspondence. © 2008 Westpac Banking Corporation. Past performance is not a reliable indicator of future performance. The forecasts given in this document are predictive in character. Whilst every effort has been taken to ensure that the assumptions on which the forecasts are based are reasonable, the forecasts may be affected by incorrect assumptions or by known or unknown risks and uncertainties. The ultimate outcomes may differ substantially from these forecasts.
The Westpac Regional Economic Report is a quarterly publication produced by Westpac Economics
Editor:Justin Smirk, Senior Agribusiness EconomistEmail: [email protected]: www.westpac.com.auEmail: [email protected]
Executive summary 3
Macro overviewWorld growth 4Australian dollar 6Australian interest rates 8
Regional issuesCommodities: three separate trends 10China is a stronger support for bulk commodities 12
Commodity outlooksWheat and oilseeds 14Sugar, cotton and wool 16Beef and dairy 18Energy - crude oil and uranium 20
Summary forecast tablesAustralia – financial 22Commodity prices 23Summary of world output 24

3
First quarter 2008
The emerging world moves to the fore
Regional Economic Report
Past performance is not a reliable indicator of future performance. The forecasts given above are predictive in character. Whilst every effort has been taken to ensure that the assumptions on which the forecasts are based are reasonable, the forecasts may be affected by incorrect assumptions or by known or unknown risks and uncertainties. The results ultimately achieved may differ substantially from these forecasts.
The year has begun with promising rainfall across much of the country and strong prices for many of Australia’s commodity exports including record high prices for wheat. Now while we are quick to caution that market volatility has not gone away. In the case of wheat, record plantings and good seasonal conditions this year could see a significant fall in prices. It is also becoming clear that we are in the midst of a significant long running demand shock that is being driven by rising incomes in the emerging world economies. In fact, I feel we should subtitle this report, “the emergence of the developing world”.
The last time the emerging economies outperformed so starkly it all ended in tears. In the post Asian Crisis era, the emerging economies were in sync with the developed world and many have taken this to be the norm. But our view is that this era is actually an historical anomaly. In the past, emerging economies have had a growth path independent of the developed world. We agree that only a deep contraction in the US economy has the ability to fully unseat the formidable momentum in the emerging economies.
So why will it not all end in tears this time? A key theme you will find running through this report is our observation that most of the growth in the emerging world is not based on shallow mercantilist programmes. That is, China and India and other large developing regions are not export dependent as many suspect. Higher growth is due to the introduction of new technologies, the resulting rise in incomes, urbanisation and the associated strong investment growth. And as these countries have either high savings rates, rising foreign reserves, and/or very positive terms of trade, we believe they are mostly immune to the credit shocks that are sweeping the financial markets of the advanced economies.
Events in the emerging world mean that global commodity markets are experiencing a demand shock as opposed to a supply shock. So all commodities prices are being driven higher but not all are equal. We have probably seen the best in base metals prices for now, but rising incomes suggest that agricultural commodities will remain well supported, in particular grain prices as fodder demand rises rapidly as animal protein consumption accelerates. Also, government policies to stimulate biofuel production have added to the tightness in the energy and agri markets. But as this is a developing world demand shock, energy and steel prices will continue to rise and fertilizer cost will also be under pressure as agricultural production expands in response to higher output prices. So while Australian farmers can be heartened what looks to be the best global environment for agriculture since the 1980s, they will have to remain on the ball in the face of rising cost structures.
This positive global outlook is having another impact on farm costs in that it is boosting Australian incomes via a rising terms of trade. This has resulted in the unemployment rate falling to a 33-year low, rising wage pressures and broad inflationary impulse. With core inflation now above the RBA target band and expected to stay there well into 2010, unless there is a marked slowdown in economic activity it is clear that interest rates are set to move higher in Australia. While this may not come from the RBA, as the collapse in consumer sentiment suggests the household sector is finally responding to higher rates, higher market rates due to the on going credit crunch remain a significant risk. In additions, due to the factors mentioned above, the risk for rates still lies to the upside and so we should not be looking for the RBA to cut rates any time soon.
We remain positive on the Australia dollar despite some market scepticism. When the RBA raised rates in February and March, and then the Australian unemployment printing a 33-year low in February, the Australian dollar punched through US90c and made it as high as US95¢. US dollar weakness will remain in play through 2008 and robust commodities prices and higher interest rates should all conspire hold the AUD well above 90c for most of 2008.
Other key themes in this report are:
• Three different cycles for base metals, bulks and farm commodities.
• Wheat prices to moderate from record highs but still remain at very robust levels.
• Oilseeds getting a significant boost from biodiesel demand.
• Dairy prices to pull back from record highs but the demand outlook remains very positive.
• Sugar prices being held back by robust global production.
Justin Smirk, Senior Agribusiness Economist

World growth: emerging resilience
4
First quarter 2008 Regional Economic Report
The lead indicators of the advanced countries have softening for some time. In stark contrast, the emerging market (EM) outlook has remained buoyant. The gap between the two regions has opened to a level not seen since the mid 1990s. The previous period of emerging market out-performance ended in a rolling succession of crises from Latin America, to SE Asia, North Asia and Russia. Excess liquidity led to overheating (asset price and investment booms that became bubbles) and national balance sheet problems.
This time around EM balance sheets are formidably strong. If anything, savings are excessive. There is enormous scope to increase domestic spending without hitting an external financing constraint. The “adverse for growth” balance sheet adjustment that needs to happen is in the US (and arguably other Anglo offshoots).
We have continually shied away from overt membership of the “de-coupling” school, as that group is ahistorical. A glance at the longer run historical record shows that the 1998-2003 period was an anomaly - a coupling of convenience. In truth, Asia and the other key EM were extremely frail at this time, both in terms of balance sheets and psychology. They needed US demand badly to soak up the inventories built with the capacity overhang from the mistakes of the 1990s. In Asia domestic demand was weak, as evidenced by the deflation of asset prices and huge external surpluses driven by high savings and low investment. In Latam, fiscal problems were rife. The Middle East and Africa were struggling under an adverse terms of trade. Eastern Europe and Russia were still reeling from transition and sharp bouts of inflation.
Prior to this phase, coupling was hardly in evidence. The natural state of affairs was that low income economies with decent institutions grew consistently faster than the advanced group, and with little sensitivity to them as they adapted technology, built a productive and social capital stock from a low base, urbanised, raised incomes through productivity gains, thereby boosting consumption and services demand, with associated positive structural effects. The key was access to technology and capital - not external demand for manufactured goods. The sweetest growth elixir is not mercantile in flavour.
Our view is that the EM complex is again in the midst of an expansion along the above lines. We are willing to argue strongly that only a deep contraction in US activity will bring the EM down. Growth and balance sheet improvement is more broadly based across countries than at any other time in our sample set, which extends back to 1980. More countries have been growing above their trends rates for more consecutive years than ever before. At the same time the external account and fiscal troubles that created vulnerability in the 1990s have been alleviated on a broad front. IMF modelling argues that roughly 200bps of the narrowing in the EM bond spread can be ascribed directly to fundamentals, a massive positive change.
While this has been going on the US economy has decelerated in three successive years. Rolling four year correlations between activity in a broad sample of countries and the US are collapsing as a result. Powerful developmental forces are at play, creating endogenous momentum within economies through new consumption and investment patterns. The massive terms of trade stimulus evident outside East Asia will continue to fuel investment booms across large swathes of central Asia, the middle East, eastern Europe, Africa and Latam. Multinationals are reporting a wide margin of out-performance by their emerging market operations vis-a-vis the US. The issues currently plaguing advanced country financial systems are a peripheral matter for emerging world credit conditions. Liquidity growth (broad money) accelerated further in the EM following the August onset of the US-EU-UK-ANZ crunch.
This catalogue of observations argues that the current divergence of leading indicators between the advanced and EM is more fundamentally based than the comparison episode in the 1990s. While import growth in the advanced countries is certain to slow further, it is worth noting that the emerging world has already been dealing with a soft US economy for the two full years of the housing activity downturn. US import volumes grew just 2% in 2007 and we see something similar in 2008. These two outcomes represent the third and fourth weakest years for US imports in the last 18 years behind only 1991 and 2001. Domestic final sales grew 1.9% in 2007, just a tick higher than in 2001. And the EM accelerated. As important a factor as it has been in recent history there is clearly more to life than US demand.
The last time the EM out-performed so starkly ...
... it all ended in tears.
The post Crisis era is an anomaly ...
... not the norm.
Only a deep US activity contraction ...
... could unseat formidable EM momentum.

World growth pulse: quarterly*
0.94
0.96
0.98
1.00
1.02
1.04
Jun-00 Jun-01 Jun-02 Jun-03 Jun-04 Jun-05 Jun-06 Jun-07
ratio to trend
0
1
2
3
4
5
6%yr
World GDP* (rhs)
Leading index* (lhs)
US GDP (rhs)
Sources: Westpac Economics, IMF, OECD, CEIC. * Both proxies are around 80% of world total. LI adv 1qtr
Leading indicators of global growth
.94
.96
.98
.00
.02
.04
.06
Jun-94 Jun-96 Jun-98 Jun-00 Jun-02 Jun-04 Jun-06
ratio to trend
0.94
0.96
0.98
1.00
1.02
1.04
1.06
Proxy global*OECDDeveloping^
Sources: Westpac, OECD. * OECD plus developing sample, PPP weighted.^ Developing equals China, Brazil, India, Russia, Indonesia, South Africa
World growth: emerging resilience
Broad based growth equals resilience
-40
-30
-20
-10
0
10
20
30
40
1980 1985 1990 1995 2000 2005
-4
-2
0
2
4
6
8Sources: Westpac Economics, IMF
units
number of countries enjoying above average growth, relative to mean (sample=149, mean=79, lhs)
US GDP growth (rhs)
%ann
Broad based improvement in balance sheets
-30
-20
-10
0
10
20
30
1981 1986 1991 1996 2001 2006
-7
-6
-5
-4
-3
-2
-1
0
1Sources: Westpac Economics, IMF
units
number of countries improving current account (%GDP) over previous year, relative to average (sample=180, avg=81 lhs)
US current account (rhs)
%GDP
Rolling correlation of US and Chinese activity
-0.6
-0.4
-0.2
0.0
0.2
0.4
0.6
0.8
1.0
Dec-86 Dec-90 Dec-94 Dec-98 Dec-02 Dec-06
coeff
-0.6
-0.4
-0.2
0.0
0.2
0.4
0.6
0.8
1.0coeff
Sources: Westpac Economics, OECD
Liquidity remains easy around the globe
4
6
8
10
12
14
16
18
Jan-98 Jan-00 Jan-02 Jan-04 Jan-06 Jan-08
%yr
4
5
6
7
8
9%yr
Global proxy* (rhs)
OECD (rhs)
Sources; Westpac Economics, CEIC, OECD* GDP weighted index of OECD & the BRICs
Past performance is not a reliable indicator of future performance. The forecasts given above are predictive in character. Whilst every effort has been taken to ensure that the assumptions on which the forecasts are based are reasonable, the forecasts may be affected by incorrect assumptions or by known or unknown risks and uncertainties. The results ultimately achieved may differ substantially from these forecasts.
First quarter 2008
Chart 1. Chart 2.
Chart 3. Chart 4.
Chart 5. Chart 6.
5
Regional Economic Report
Broad based improvement in balance sheets
-30
-20
-10
0
10
20
30
1981 1986 1991 1996 2001 2006
-7
-6
-5
-4
-3
-2
-1
0
1Sources: Westpac Economics, IMF
units
number of countries improving current account (%GDP) over previous year, relative to average (sample=180, avg=81 lhs)
US current account (rhs)
%GDP

Australian dollar
6
First quarter 2008 Regional Economic Report
During the Christmas period and into 2008 we have doggedly maintained our medium term confidence in the outlook for the Australian dollar. Currency markets have been anxious to sell down the Aussie on any evidence of volatility, shaky global growth or weak US data. Conventional wisdom goes that because the AUD is a commodity/growth currency it is time to sell the Australian dollar (AUD) when signs of weakness in the advanced economies emerge, which is presumed to presage a global slowdown. In December the AUD was trading just below 88¢. Since then expectations for the US economy have deteriorated sharply. The extreme vulnerability of the US was exemplified by the US Federal Reserve’s decision to cut interest rates by 125 basis points in the space of eight days in January. Yet, today, the AUD stands just above 89¢ – an extremely resilient performance.
Our view is that the currency markets place too much reliance on the contagion effect from the weak US economy as it relates to the level, rather than the composition, of global growth. Global growth has been in the 4% to 5½% range for the last five years. Today, the developed world represents around half of global GDP (calculated on a purchasing power parity basis). With the advanced economies expanding at around 2% (average) in recent years, they contribute only 1 ppt of annual volume growth. The remainder comes from the developing world, where East Asia (including China) has averaged growth of around 9%, and the remainder have expanded at a 6% clip. In isolation, China’s 11.4% growth explained 35% (1.9ppts) of global growth in 2007. The rest of the developing world provided the remaining 2.4ppts.
Contributors to China’s 11.4% growth were broadly: consumption (4.3 ppts) investment (4.2 ppts) and net exports (3 ppts). We accept that an export slowdown will reduce the contribution of net exports to China’s growth but we do not anticipate much flow-on to consumption and investment. Capital formation has always been primarily oriented towards servicing domestic demand. No more than 10% of gross value added, or 20% of gross industrial sales, are accounted for by exporters. The US slowdown has been underway for two years and import demand has decelerated markedly already. China’s response so far? Acceleration. In 2008 we expect China’s growth to slow to 10.2%, with most of the fall from 11.4% being explained by a reduction in the contribution of net exports.
Market strategists are keen to point out the collapse in the OECD leading Indicator and its historical relationship with the Australian dollar. However, that index represents just one-fifth of global growth. A more broad based leading indicator covering emerging markets is required. Our weighted composite global leading indicator is one such measure. It has slowed only modestly, because the developing world remains strong. The story is substantially more balanced than the OECD indicator alone would imply. The rampant price gains in the bulk commodity complex highlight that the world is not suddenly grinding to a halt.
Our expectations that interest rate differentials would continue to support the AUD have been clearly vindicated. Markets were only giving a 15% probability of a rate hike by the RBA in February as recently as two weeks before the event. We always expected two more rate hikes in 2008. The cash rate differential with the US is set to widen by a further 1% over the next few months pushing the margin beyond the ten year high to 5%, compared to the recent peak of 4¾% in December 2003.
We do not yet see the end to the structural deterioration in the USD. Part of the long term correction to the current global imbalances must be continued weakness in the US dollar. Our view is that a further 4% to 5% fall in the USD against the Index through 2008 is likely, as the attractiveness of USD assets remains low. We look for the high yield commodity currencies and the high surplus Asian currencies to carry most of the adjustment.
Accordingly we maintain our constructive targets for the AUD in 2008 to hold above 90¢ US. However, we do accept that it will take time for markets to embrace our view of global growth. That will probably mean a more gradual upswing in the AUD through 2008 than would otherwise be the case.
We are still positive ...
... on the AUD in 2008 ...
... despite market scepticism ...
... towards “growth currencies”.
The market view has cobwebs on it.
USD weakness will remain in play.

Australian dollar
Past performance is not a reliable indicator of future performance. The forecasts given above are predictive in character. Whilst every effort has been taken to ensure that the assumptions on which the forecasts are based are reasonable, the forecasts may be affected by incorrect assumptions or by known or unknown risks and uncertainties. The results ultimately achieved may differ substantially from these forecasts.
First quarter 2008
Chart 1. Chart 2.
Chart 3. Chart 4.
Chart 5. Chart 6.
7
Regional Economic Report
AUD/EUR & AUD/NZD
0.45
0.50
0.55
0.60
0.65
0.70
0.75
Dec-97 Jul-99 Feb-01 Sep-02 May-04 Dec-05 Jul-07
EUR
1.0
1.1
1.2
1.3
1.4NZD
AUD/EUR (lhs)
AUD/NZD (rhs)
Source: Factset
AUD/EUR & AUD/NZD
0.45
0.55
0.65
0.75
0.85
0.95
Dec-97 Dec-00 Dec-03 Dec-06
USD
50
60
70
80
90
100
110JPY
AUD/USD (lhs)
AUD/JPY (rhs)
Source: Factset
Australian dollar: actual versus fitted
0.40
0.50
0.60
0.70
0.80
0.90
1.00
1.10
Jan-91 Jan-95 Jan-99 Jan-03 Jan-07
USD
0.40
0.50
0.60
0.70
0.80
0.90
1.00
1.10USD
fair value band (Feb point estimate 96¢)
AUD/USD actual
Source: Westpac Economics
AUD: elevated on a number of crosses
90
95
100
105
110
latest Mar-08 Jun-08 Sep-08 Dec-08 Mar-09
indexindex
90
95
100
105
110
AUD/USD AUD/NZDAUD/JPY AUD/EURAUD TWI
Source: Westpac Economics
Broad nominal USD trade weighted index
70
75
80
85
90
95
100
Feb-02 Feb-03 Feb-04 Feb-05 Feb-06 Feb-07 Feb-08 Feb-09
indexindex
70
75
80
85
90
95
100
actual/Westpac
index based at February 2002
Source: Westpac Economics, US Fed
-8.7% -7.2%-6.8%-4.2% -4.8% f/cDec-08
The AUD & the USD
0.45
0.50
0.55
0.60
0.65
0.70
0.75
0.80
0.85
0.90
0.95
Jun-90 Jun-93 Jun-96 Jun-99 Jun-02 Jun-05
USD65
75
85
95
105
115
125
index
AUD (lhs)
DXY index inverted (rhs)
Sources: Bloomberg & Westpac

Australian interest rates
8
First quarter 2008 Regional Economic Report
The collapse in Consumer Sentiment in March has prompted us to predict the end of the RBA's eight year tightening cycle that began in May 2002.
We had expected one final move in May due to our concerns with the likely high read for underlying inflation (to print on April 23) that would have made life very difficult for the RBA.
However, the collapse in Consumer Sentiment in March has prompted us to predict the end of the RBA's eight year tightening cycle that began in May 2002. Tightening cycles end when there is an unusually large (non linear if you like) response to one particular move. That extreme move appears to have occurred with the latest read on Consumer Sentiment. The Index fell by 9.1% to its lowest level since September 1993. Its fall over the last three months (21.1%) is the sharpest fall over three months that we have seen since the Index was first calculated in 1975.
Consumers have shown all the classic signs associated with a solid reduction in spending growth. Their favoured form of savings has become bank deposits and debt repayment. Their attitude towards house purchase is the second weakest reading since the question was included in 1995. There was an extraordinary response towards purchasing a motor vehicle – Sentiment fell by 22.5% – the lowest since the question was first included in 1995. The combination of consecutive rate hikes from levels that would already be assessed as contractionary and the independent rate hikes from mortgage lenders which stemmed from the sharp rise in the cost of wholesale funding has had that "non–linear" impact on confidence and spending intentions.
The signals from the Consumer Sentiment Index as the first real evidence that the rate hikes are having the "non–liner" effect is comparable with 1995. At that time the economy had appeared quite resilient to the 275 bp's of rate hikes in August – December 1994 and markets were predicting a further 300 bp's of hikes. However, the Consumer Sentiment Index collapsed in January 1995 and signalled that rates had peaked. Markets eventually priced out rate hikes and quickly moved to pricing in rate cuts. However, due to inflation remaining near the top of the target zone and residual fears of a wages "blow out" the RBA held rates steady for 20 months, only easing in August 1996. That was despite employment growth collapsing from 5% annual pace to eventually zero by mid 1996. It was only when inflation had clearly peaked and was moving towards the middle of the 2% – 3% base that the Bank decided to ease policy.
The lessons from 1995/96 are important for the current period. Unlike the US we believe that Australia has a genuine inflation problem. Only some components of inflation will respond to the sharp slowdown in demand that appears to be in store. Housing costs explain a considerable share of the blow out in underlying inflation from 2.9% in 2006 to 3.6% in 2007. Around half of that increase can be attributed to rents. Rising interest rates will further reduce building approvals – further tightening rental markets. Financial services have also contributed to the rise in inflation. These services are measured by the widening of the margin between retail deposit and loan rates. That widening has been due to banks seeking to offset the rise in the cost of funds for wholesale deposits. That process is continuing and can be expected to further pressure the current inflation measures.
Labour markets are also likely to hold up well. Businesses have been pressured by labour shortages for the last few years. They are likely to hoard labour when sales slow in light of the search and training costs they have already incurred.
In short the required slow down to reduce measured inflation is likely to prove frustratingly distant for the RBA. The fact inflation expectations are rising despite the slowdown in spending will trouble the RBA. We note that the recent Consumer Sentiment Report showed a very sharp deterioration in attitudes towards inflation. Inflation attitudes were more negative that even those on interest rates and conditions. That delicate balance between managing a soft landing while containing the recently break out in inflationary expectations will challenge the RBA and contain any temptations to cut rates too early.
We expect the RBA to be on hold for 2008 and probably most of 2009 until measured inflation has clearly moved inside the 2% – 3% target zone. Being more bold and cutting rates early would risk a rise in inflation and, worst still, feed into rising inflationary expectations.
As interest rates bite consumer sentiment fall.
Inflation risks remain high...
but consumers are responding by spending less...
and saving more...
The labour market is likely to hold up...
The labour market is likely to hold up...
meaning the RBA will not be cutting rates soon.

Australian interest rates
Past performance is not a reliable indicator of future performance. The forecasts given above are predictive in character. Whilst every effort has been taken to ensure that the assumptions on which the forecasts are based are reasonable, the forecasts may be affected by incorrect assumptions or by known or unknown risks and uncertainties. The results ultimately achieved may differ substantially from these forecasts.
First quarter 2008
Chart 1. Chart 2.
Chart 3. Chart 4.
Chart 5. Chart 6.
9
Regional Economic Report
0
2
4
6
8
Jun-01 Jun-02 Jun-03 Jun-04 Jun-05 Jun-06 Jul-07
%
0
2
4
6
8%
spread Aust 10yr bonds US 10yr bonds
Sources: Factset, Westpac Economics
Long bonds: spread blows out
3
4
5
6
7
8
Jun-01 Jun-02 Jun-03 Jun-04 Jun-05 Jun-06 Jun-07
%
3
4
5
6
7
8%
90day bbsw cash rate
Sources: RBA, Factset, Westpac Economics
Australia: interest rates / cost of funds
RBA responding to inflation problem
-2
0
2
4
6
8
10
Dec-95 Dec-98 Dec-01 Dec-04 Dec-07
%
-2
0
2
4
6
8
10%
headline CPI core CPI (avg RBA measure) cash rate
Sources: RBA, ABS, Westpac Economics
Household income surges
-6
-4
-2
0
2
4
6
8
10
Sep-81 Sep-86 Sep-91 Sep-96 Sep-02 Sep-07
% ann
-6
-4
-2
0
2
4
6
8
10
consumption household disposable income
Sources: ABS; Westpac Economics
% annreal
Jobs growth to reaccelerate 2008H1
-60
-50
-40
-30
-20
-10
0
10
20
30
Dec-83 Dec-87 Dec-91 Dec-95 Dec-99 Dec-03 Dec-07
% ann
-6
-4
-2
0
2
4
6% net
Westpac labour marketcomposite - adv 2 qtrs (lhs)
employment growth (rhs)
Sources: ACCI, Westpac, ABS
The US commercial paper market
70
80
90
100
110
120
3-Jan 28-Feb 25-Apr 20-Jun 15-Aug 10-Oct 5-Dec 30-Jan
index
Total
For. FinAsset-backed
Sources: US Fed, Westpac Economics
First data point is w/o Jan 3. Final data point is w/o Jan 30.

Commodities: three separate trends
The global story expounded on page 4 has significant implications, not just for the pace of global growth, but also its composition. And growth composition is arguably more important than levels for the determination of relative prices. The slowdown in the OECD has had a significant impact on base metal prices and this will continue as the advanced country slowdown unfurls. However, demand for the basic building blocks of an urbanising and developing economy looks set to remain very robust through our forecast horizon. If you add to this mix the impact that rising developing world incomes have had on the demand for higher protein foodstuffs, and you can see some obvious break out candidates emerging.
Industrial production in the OECD is holding up for now. While IP fell 0.2% in September, the first monthly decline in eight months, the 6mth annualised pace was still 4%, well above the 3%yr average since the 2002/03 downturn. Nevertheless, base metals have not avoided the pothole that is the US housing downturn. Copper prices peaked in May 2006 and we now know that the March quarter of 2006 was the first negative quarter for US dwelling investment. Other base metals took up the slack left open for speculative demand. Nickel and zinc prices peaked a year later while lead took until October 2007 to find its peak. The Westpac base metals index has fallen 29% from its June 2007 peak. As the US slows, so too the OECD leading indicator has tipped over suggesting demand for raw materials from the industrialised world is set moderate. While other factors do matter, and some are addressed below, we still think that a slowdown in OECD demand is the major negative for the base metal complex.
There has also been a steady rebuilding of base metal inventories. The Westpac base metals inventory index has risen 32%yr to January 2008 and is now back to a level just a little higher than its previous cyclical low in December 2000. We believe small changes in inventories at such low levels can have a significant impact on prices. If we are right with our OECD synopsis, then stocks will continue to rise in the first half of 2008 putting downward pressure on prices.
China is still important for the medium term outlook. However, its impact on growth in global demand for base metals will not be as large as it once was. Chinese net imports of base metals levelled out in 2007H2 and we suspect that a moderation in Chinese exports to the OECD will have a greater impact on demand for base metals relative to other commodities. Growth in Chinese net imports of base metals peaked at 33%yr in May 2007. Irrespective of last year’s policy initiatives on the energy conservation front, we see Chinese demand for base metals being neutral for prices until the later half of 2008 or even early 2009.
Amidst all this talk of the US dragging the globe down with it, energy, steel and iron prices continue to strengthen. These markets are clearly being driving by the rapid growth in demand associated with industrialisation and urbanisation, not just in China and India, but now also the Middle East, central and eastern Europe, central Asia and Latin America. In January spot steel prices were up 21%yr in Asia, US scrap steel prices are up 41%yr while global iron ore scrap prices are up 6%yr. Spot steaming coal prices, ex Newcastle, are up 76%yr. All this suggests that while the iron ore and coal producers may not get the 100% rise in contract prices some are now talking about, the rises will be very significant indeed. We have pencilled in a conservative 40% rise in coal/iron ore prices in 2008/09 with clear upside risks to this estimate.
Demand for soft commodities has also been boosted in recent years by rising incomes in the large emerging economies and petro-economies. Supply has been tight, inventories have fallen and prices have lifted. Demand growth will remain robust driven by the emerging markets as ongoing population and income growth and the associated urbanisation drives dietary changes. The supply response to previous price gains will be the key factor. Australia’s post drought bounce in grain production is a clear risk to prices. Rising US dairy production will also put some downward pressure on international dairy prices. Meat prices are expected to rise, helped by elevated feed costs, partly the result of biofuel expansion but also rising demand for fodder grains on top of extreme weather conditions in a number of producing nations.
We are watching oil prices closely as a guide to both the general health of global demand – if we are wrong about developing world demand for raw materials we expect it will show in oil prices first – and demand from petro-economies for soft commodities. A significant fall in oil prices, given that supply remains constrained, will be an early warning that we are too optimistic on the rigour of domestic demand outside the OECD.
The composition of world growth ...
... implies base metals will flounder ...
... as inventories build.
China is important for base metals ...
The softs are elevated - for now.
10
First quarter 2008 Regional Economic Report

Commodities: three separate trends
Past performance is not a reliable indicator of future performance. The forecasts given above are predictive in character. Whilst every effort has been taken to ensure that the assumptions on which the forecasts are based are reasonable, the forecasts may be affected by incorrect assumptions or by known or unknown risks and uncertainties. The results ultimately achieved may differ substantially from these forecasts.
First quarter 2008
Table 1. Chart 1.
Chart 2. Chart 3.
Chart 4. Chart 5.
11
Regional Economic Report
-8
-4
0
4
8
12
16
20
24
28
Apr-94 Apr-96 Apr-98 Apr-00 Apr-02 Apr-04 Apr-06
%6mth ann
-50
-25
0
25
50
75
100
125
150
175
%6mth ann
OECD leading indicator (lhs leading 2 months)
Westpac base metals index USD (rhs)
Sources: Westpac Economics, OECD
OECD leading index and base metal prices
20
60
100
140
180
220
260
300
340
380
Nov-87 Nov-91 Nov-95 Nov-99 Nov-03 Nov-07
index
0
20
40
60
80
100
120
140
160
stocks (rhs)
metals price index (lhs)
index
Sources: Factset, Bloomberg, Westpac Economics forecasts
Westpac LME metals inventories and prices
Iron prices rise as contracts are negotiated
20
30
40
50
60
70
80
90
100
110
Feb-91 Feb-94 Feb-97 Feb-00 Feb-03 Feb-06
USD/tonne
40
90
140
190
240
290
USD/tonne
HWWA iron ore & scrap steel index (rhs)
iron ore lump contract price (lhs)
Source: Westpac Economics, ABS, Bloomberg, Factset
10
15
20
25
30
35
1993 1995 1997 1999 2001 2003 2005 2007
% exports
10
15
20
25
30
35% exports
G7
BRICs and Petros
Sources: Statistics NZ, Westpac Economics.Share of NZ dairy exports
BRICs and petro-economies drive dairy trade
-15
-10
-5
0
5
10
15
20
Mar-99 Mar-01 Mar-03 Mar-05 Mar-07
%yr
-15
-10
-5
0
5
10
15
20%yr
Australia
US
EU-25
NZ
Sources: USDA, Dairy Australia, Statistics New Zealand, MDC. Dairy output
Traded dairy supply hit by Australian drought
-160
-130
-100
-70
-40
-10
20
50
80
110
Aug-95 Aug-97 Aug-99 Aug-01 Aug-03 Aug-05 Aug-07
%yr
-75075150225300375450525600675750
10mn tonnes
imports (rhs)exports (rhs) growth in net imports of metals (lhs)
Sources: Westpac Economics, CEIC
Chinese trade in base metals

China is a stronger support for bulks
Australian commodity prices
40
90
140
190
240
290
340
Sep-83 Sep-87 Sep-91 Sep-95 Sep-99 Sep-03 Sep-07
index
40
90
140
190
240
290
340index
Westpac commodities index
base metals index
bulks
Sources: Westpac Economics, Bloomberg, ABS
-1000
-500
0
500
1000
1500
2004 2005 2006 2007(e) 2008 (f) 2009 (f)
'000t yr
-6
-4
-2
0
2
4
6
8
%yr
others (lhs)Asia ex Japan & China (lhs)G7 (lhs)China (lhs)total (rhs)
Sources: AME, Westpac Economics
Growth in copper consumption • China has been a big factor in the global growth in copper consumption and grabs all the headlines.
• But note in the chart over, the G7 remains a significant swing factor in terms of copper demand. It represents a drag on copper demand in 2005 that outweighed the growth in Chinese demand that year. In 2008, we are again expecting the drag from the G7 to offset Chinese growth in demand which will see the year average growth in demand slow to 1.2% from 5.9% in 2007.
• Chinese demand growth is also expected to slow in 2008 as export manufacturing growth slows.
• Base metals prices are closely linked to global industrial demand. The slowdown in the US, and its flow on to the Europe and Japan will see a marked slowdown, if not stalling, in OECD industrial production in 2008. This will weigh on the demand for base metals that, for the near term, we do not expect growth in the developing world to make up.
• Bulk commodity prices – coal and iron ore – are still being boosted by the rapid urbanisation and strong investment demand in the developing world (led by China). Price rises of around 50% on average are at the bottom of expectations.
• Soft commodities (agri) and energy are being driven by rising incomes in the developing world – a very positive backdrop.
-40
-20
0
20
40
60
80
100
Dec-96 Dec-98 Dec-00 Dec-02 Dec-04 Dec-06
%yr
-60
-40
-20
0
20
40
60
80
100
120%yr
growth in net imports
Sources: Westpac Economics, CEIC
Chinese net imports of copper • Chinese imports of copper accelerated though the first half of 2007 to be up almost 50% in the year to May. Since then, while they have been volatile, imports have broadly tracked sideways.
• It is worth noting that through 2006, when China was a net exporter of unprocessed copper, prices fell 34% in a five month period.
• While we are not expecting a similar event to occur in 2008, we do expect China's net imports of copper to slow from the heady pace reached in 2007.
First quarter 2008 Regional Economic Report

China is a stronger support for bulks
• Growth in Chinese imports of iron ore and scrap peaked in early 2004 at 56%yr. Since then, the annual growth pace has slowed but at no point has it gone negative.
• After moderating in the first half of 2007, growth in iron ore and steel scrap imports accelerated again reaching a 26%yr pace in December.
• There is little to suggest, other they supply disruptions, that growth in Chinese imports of iron ore and steel scrap is about to slow meaningfully. As noted above, the investment outlook remains robust.
• When growth in OECD IP falls, or even just stalls, steel consumption in the G7 tends to contract. It did so in 2001 and 2005 and we are looking for a similar rate of contraction in 2008.
• Chinese demand being driven by strong investment activity, which is the result of the rapid urbanisation of the Chinese population. This long run structural event sets a very solid base outweighing such vagaries as export growth and the Olympics.
• Other developing nations, in particular the petro economies of the Middle East, are in the middle of a very strong investment cycle.
• Stong investment growth in the developing world will hold up the growth in the demand for steel, around 4% in 2008, despite the forecast contraction in G7 demand.
• This divergence between our outlook between base metals and bulk commodities is not a rare event in history. The long run history of copper and steel prices has shown a number of periods of divergence and in particular, where steel prices rose when copper prices were falling.
• It is first worth while noting that copper prices have been far more volatile than steel prices. Steel prices have tended to follow the longer run structural trend with much less year to year volatility.
• Copper prices exploded at the end of WWII but then with the end of the Korean War in 1956, prices collapsed more than 40% while steel prices rose a further 5%.
• More recently, in the period from 1982 to 1985, copper prices fell 17% while steel prices rose 24%.
• The urbanisation of China and India is far and away a larger structural demand shock compared to any that occurred in the 20th century.
-40
-20
0
20
40
60
80
100
120
140
2001 2003 2005 2007(e) 2009 (f)
Mt yr
-4
-2
0
2
4
6
8
10
12
14%yr
China (lhs) G7 (lhs)
non Japan & China Asia (lhs) others (lhs)
total (rhs)
Sources: Westpac Economics, AME
Growth in steel consumption
Chinese imports of steel inputs
-40
-20
0
20
40
60
80
May-1994 May-1997 May-2000 May-2003 May-06
% yr
-40
-20
0
20
40
60
80% yr
iron ore & scrap
Sources: Westpac Economics, CEIC
0
50
100
150
200
250
300
350
400
450
500
1896 1916 1936 1956 1976 1996
US$ index
0
50
100
150
200
250
300
350
400
450
500US$ index
steel (lhs)
copper (rhs)
Sources: Westpac Economics, USGS
Real copper vs. real steel
Regional Economic Report First quarter 2008

Wheat and oilseeds
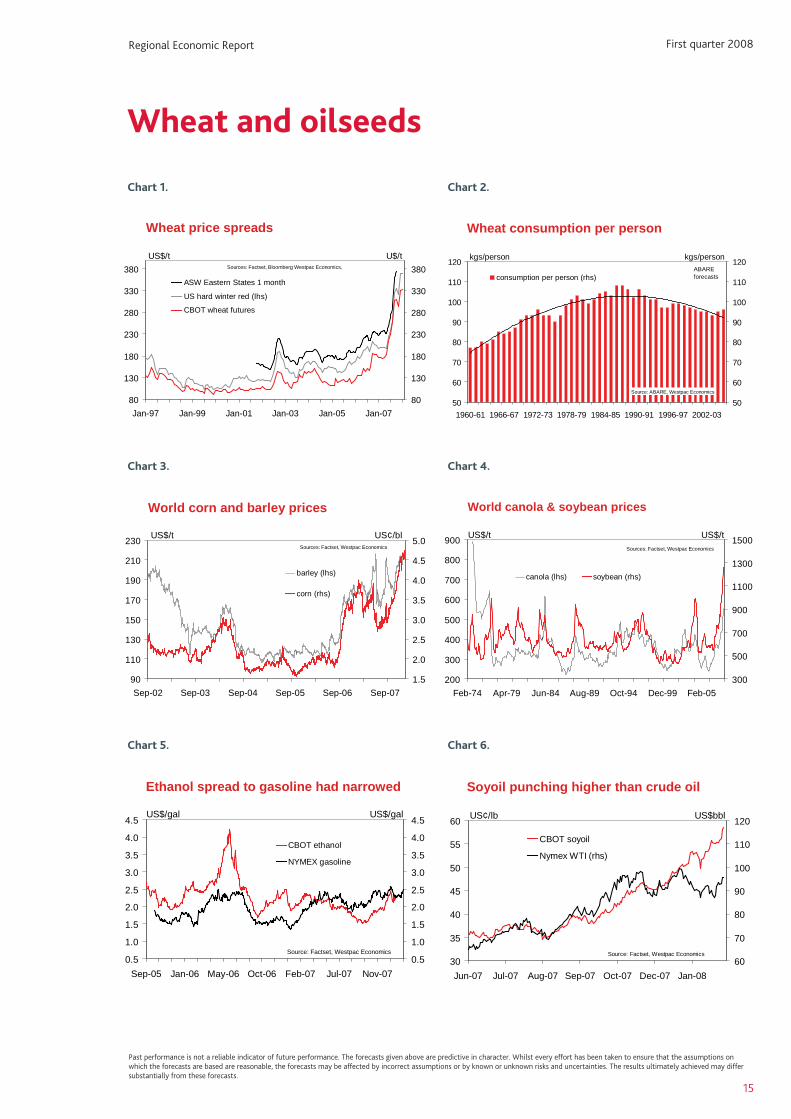
Grains, in particular wheat, has been the strongest performer for commodities in the second half of 2007. Wheat prices have more than doubled in the past year to a record US$11.53 a bushel in February as production failed to keep pace with demand and global inventories fell to a 30-year low. Prices soared in late 2007 following drought in Australia which saw output fall for the past two years, and production fell in Canada and the US. US farmers increased their allocation to corn last year at the expense of other grains, soybeans and cotton.
Low inventories and positive demand for food, feed plus still solid demand for feedstock of biofuel production, suggests we should hold a bias for higher prices over the medium term. As we have noted in this report, rising incomes in the developing world are a structural positive for agricultural commodity prices, in particular grains, due to rising feed demand to support rapidly
growing livestock production.
WheatThe most recent USDA wheat outlook has set a positive backdrop for grain prices. While it slightly lifted the forecast for global wheat production in 2007/08 to 603.6mt it also increased the outlook for demand. World wheat use for the current year is forecast to rise 2.5mt to 619.0mt due mostly to Canada reporting lower-than-expected wheat stocks suggesting higher-than-expected use of feed wheat or an error in some other part of the supply and demand estimates. In addition, world wheat disappearance, that is what the USDA can't account for, in 2007/08 was raised as local marketing year exports were increased 0.9mt more than imports. This boosts the wheat use in importing countries outside the USDA database. As a result, the USDA is forecasting world wheat ending stocks to fall 1.2mt.
But this does not mean wheat prices should end 2008 on a high note. The record high prices for wheat, and the breaking of more favourable weather conditions, suggests Australia wheat growers have the potential to plant their largest crop ever. And if 2008 turns out to be even an average year in terms of rainfall, this can easily translate into a record crop. Soil moisture conditions in many parts of northern New South Wales and Queensland states are the best in 20 years after the best December to February rainfall in almost nine years. But as we write this report parts of the country, including Western Australia, South Australia and Victoria, are still dry. So a large part of the country doesn't have the confidence of full soil moisture profiles.
Nevertheless, the Australia wheat crop is a potential negative for wheat prices. Just as most events in 2007 conspired to hold back production and boost prices, events could quickly reverse in 2008. In 2007, corn prices came under pressure as US corn acreage surged in response to record high prices in 2006. So while we remain positive for medium to longer-term outlook for wheat prices, we are looking for global prices to fall back from their current lofty highs.
OilseedsVegetable oil prices have posted record highs over the last few months. While high prices puts pressure on biodiesel profitability, this pressure should ease with the introduction of new mandatory admix requirements in many countries. There are also concerns that South American production will stagnate due to unfavourable growing conditions, while Indian rape/mustard seed production estimates are being ratcheted down. Despite a big lift in European and Canadian plantings, 2007/08 global canola production is expected be the same as 2006/07 at 48mt. With consumption rising again to 50mmt, stocks will fall further 30%, to 4mmt. The 2007/08 supply picture is looking even tighter. Oilworld estimates that European plantings will fall by 8% with Canada also likely shift plantings toward cereals.
While corn-based ethanol receives all the headlines in the food vs. fuel debate, the reality is that the most of world economies are diesel based rather than gasoline based. So the focus of most biofuel production is on biodiesel rather than ethanol. To date, there is no biodiesel contract to trade so hedgers and speculators have turned to Chicago soyoil for a biodiesel financial product. Except for the brief breakdown in crude oil recently, near month soyoil contracts and the spot month crude oil contract have been moving almost in lock step as crude oil has rallied to a high of US$99/barrel and soyoil to US47¢/lb. Soyoil appears to have changed from a grain contract to an energy contract. As long as the vegetable oil market remains tight, then this can continue. But if supply lifts significantly, this relationship can break down. This happened to sugar a few years ago when a rapid lift in production broke the short-lived link between oil prices, via Brazilian ethanol, and sugar prices.
Robust demand and not just a supply shock ...
... is driving grains prices to record highs.
The USDA has a very positive backdrop ...
... but the risk remain that high prices...
... will stimulate record wheat plantings.
The supply situation looks very tight ...
... as biodiesel demand accelerates.
14
First quarter 2008 Regional Economic Report
50
60
70
80
90
100
110
120
1960-61 1966-67 1972-73 1978-79 1984-85 1990-91 1996-97 2002-03
kgs/person
50
60
70
80
90
100
110
120kgs/person
consumption per person (rhs)ABARE forecasts
Source: ABARE, Westpac Economics
Wheat consumption per personWheat price spreads
80
130
180
230
280
330
380
Jan-97 Jan-99 Jan-01 Jan-03 Jan-05 Jan-07
U$/t
80
130
180
230
280
330
380
US$/t
ASW Eastern States 1 month
US hard winter red (lhs)
CBOT wheat futures
Sources: Factset, Bloomberg Westpac Economics,
Wheat and oilseeds
World canola & soybean prices
200
300
400
500
600
700
800
900
Feb-74 Apr-79 Jun-84 Aug-89 Oct-94 Dec-99 Feb-05
US$/t
300
500
700
900
1100
1300
1500US$/t
canola (lhs) soybean (rhs)
Sources: Factset, Westpac Economics
Ethanol spread to gasoline had narrowed
0.5
1.0
1.5
2.0
2.5
3.0
3.5
4.0
4.5
Sep-05 Jan-06 May-06 Oct-06 Feb-07 Jul-07 Nov-07
US$/gal
0.5
1.0
1.5
2.0
2.5
3.0
3.5
4.0
4.5US$/gal
CBOT ethanol
NYMEX gasoline
Source: Factset, Westpac Economics
Soyoil punching higher than crude oil
30
35
40
45
50
55
60
Jun-07 Jul-07 Aug-07 Sep-07 Oct-07 Dec-07 Jan-08
US¢/lb
60
70
80
90
100
110
120US$bbl
CBOT soyoil
Nymex WTI (rhs)
Source: Factset, Westpac Economics
World corn and barley prices
90
110
130
150
170
190
210
230
Sep-02 Sep-03 Sep-04 Sep-05 Sep-06 Sep-07
US¢/bl
1.5
2.0
2.5
3.0
3.5
4.0
4.5
5.0US$/t
barley (lhs)
corn (rhs)
Sources: Factset, Westpac Economics
Past performance is not a reliable indicator of future performance. The forecasts given above are predictive in character. Whilst every effort has been taken to ensure that the assumptions on which the forecasts are based are reasonable, the forecasts may be affected by incorrect assumptions or by known or unknown risks and uncertainties. The results ultimately achieved may differ substantially from these forecasts.
First quarter 2008
Chart 1. Chart 2.
Chart 3. Chart 4.
Chart 5. Chart 6.
15
Regional Economic Report
World canola & soybean prices
200
300
400
500
600
700
800
900
Feb-74 Apr-79 Jun-84 Aug-89 Oct-94 Dec-99 Feb-05
US$/t
300
500
700
900
1100
1300
1500US$/t
canola (lhs) soybean (rhs)
Sources: Factset, Westpac Economics
World canola & soybean prices
200
300
400
500
600
700
800
900
Feb-74 Apr-79 Jun-84 Aug-89 Oct-94 Dec-99 Feb-05
US$/t
300
500
700
900
1100
1300
1500US$/t
canola (lhs) soybean (rhs)
Sources: Factset, Westpac Economics

Sugar, cotton and wool
SugarThe downtrend in sugar prices, since the peak in February 2006, appears to have come to an end in the third quarter of 2007. Nevertheless, market fundamentals are not very exciting for sugar. While demand is growing at a healthy clip, supply is surging as the higher prices of 2005/06 spurred a significant increase in plantings. The resulting ballooning surplus is limiting the upside potential for sugar. Baring any extreme weather events, these negative fundaments will drive the market but there are a number of potential upside risks for prices.
Rising ethanol demand in Brazil is offering an increasingly attractive alternative market. Robust economic growth and the increasing popularity of flex-fuel cars, is boosting ethanol demand and providing a helpful offset to the currently oversupplied market.
India has become increasingly important in the global sugar market as it has shifted from being a net importer to a net exporter. While Indian supply is likely to hang over the market, low global prices means Indian exports are increasing reliant of subsidies.
Europe offers an upside risk as it reforms its sugar industry in response to its WTO obligations. But progress has been slow and it is unclear how quickly these developments will occur.
CottonCotton prices bottomed last April/May at just under US50¢/lb. Prices have since rallied to a high of around 74¢/lb and so far to date in February, cotton prices have averaged 70¢/lb.
For the third consecutive year, global cotton use outpaced production in 2007 due to rapid growth in China and India, the world's largest consumers of cotton. Rising disposable incomes has boosted domestic demand in both countries while the ending of the Multi-Fibre Agreement had solidified buoyant textile exports. China continues to be the main story in town in regards to demand with cotton use outstripping production every year since 2000 with the deficit being met by imports and stock drawdown.
The USDA is estimating cotton production to fall in 2008 due to a sharp reduction in cotton acreage in the US, the world's largest cotton exporter. US acreage is forecast to fall to its lowest since 1989 as cotton prices languish compare to the explosive gains in grain and oilseeds prices. Global cotton stocks remain at historically high levels but the stocks to consumption ratio is at its lowest level in 13 years and in China it is at its lowest level in 18 years.
WoolWool production is estimated to fall by 7% in 2007/08 following the selloff of stock in 2006/07 because of drought conditions in most of Australia. In-store stocks at the beginning of 2007/08 fell 28%. Lower stocks, combined with the forecast fall in production, means the overall supply of wool will be well down in 2007/08. Expectations of lower supply are likely to have been an important contributor to the upward movement in prices in recent months. Between July 2007 and January 2008 wool prices rose 20% hitting a peak of $9.62 on 15 January 2008.
The fortunes of wool still remain linked to the growth in demand in the industrialised world. The slowdown in the US and emerging risks to growth in Japan and Europe are all highlighted in the downturn in the OECD leading indictor. As always differing supply trends for differing microns will have some influence on price differentials for the varying categories over the next few years. Lack of plentiful and good quality pasture has contributed to an increase in the proportion of fine wool in the clip in 2007. This is in addition to the underlying upward trend in production of superfine wool (19.5 microns or less) over the past 15 years. The production of superfine wool accounted for almost 39% of the clip 2006/07 compared with 12% of the wool clip in 1995/96 and 18% in 2000/01.
Looking to 2008/09, overall the expectation is that wool supply will be slighter greater than it was in the previous year due to improved seasonal condition. But just how much will depend on just how much extra crop farmers put in this year to take advantage of record high grain prices.
The downtrend for sugar has been broken ...
... but prices still held down by robust production.
Cotton ended 2007 on a higher note.
US production to fall in 2008.
Falling wool production is a boon for prices.
Industrialised world demand is slowing.
High wheat prices are a positive for wool.
16
First quarter 2008 Regional Economic Report

0
10
20
30
40
50
60
70
80
Feb-84 Feb-87 Feb-90 Feb-93 Feb-96 Feb-99 Feb-02 Feb-05
US¢/lb
10
20
30
40
50
60
70
80
90
100US$/bl
spot sugar (lhs) spot crude oil (rhs)
Sources: Bloomberg, Westpac Economics
150
83
-23%
-40%
Oil boost to sugar was temporary
0
20
40
60
80
100
120
140
160
180
1971 1975 1979 1983 1987 1991 1995 1999 2003 2007
Mt
0
20
40
60
80
100
120
140
160
180Mt
stocks production consumption
Sources: ABARE, Westpac Banking Corporation
ABARE forecasts
Production easily outpacing demand
Sugar, cotton and wool
60
80
100
120
140
160
180
Dec-92 Dec-94 Dec-96 Dec-98 Dec-00 Dec-02 Dec-04 Dec-06
index
200
300
400
500
600
700
800
900index
India (lhs) China (rhs)
Sources: Factset, Westpac Economics
Production of cotton textiles
400
600
800
1000
1200
1400
1600
1980 1984 1988 1992 1996 2000 2004 2008
A¢/kg
0
200
400
600
800
1000kt
stocks (rhs)
eastern market indicator (lhs)
Sources: ABARE, Westpac Economics
ABARE forecasts
Wool stocks remain supportive of prices Wool still strong relative to cotton
0
1
2
3
4
5
6
7
8
9
10
Jan-86 Jan-90 Jan-94 Jan-98 Jan-02 Jan-06
ratio
0
1
2
3
4
5
6
7
8
9
10ratio
wool/cotton ratio price ratio
trend
Sources: Factset, Westpac Economics
30
40
50
60
70
80
90
100
110
1980-81 1986-87 1992-93 1998-99 2004-05
US¢/lb
5
15
25
35
45
55
65%
stocks to consumption ratio(rhs)cotton price (lhs)
Sources: ABARE, Westpac Economics
Falling cotton stocks supporting prices
Past performance is not a reliable indicator of future performance. The forecasts given above are predictive in character. Whilst every effort has been taken to ensure that the assumptions on which the forecasts are based are reasonable, the forecasts may be affected by incorrect assumptions or by known or unknown risks and uncertainties. The results ultimately achieved may differ substantially from these forecasts.
First quarter 2008
Chart 1. Chart 2.
Chart 3. Chart 4.
Chart 5. Chart 6.
17
Regional Economic Report

Beef and dairy
BeefABARE is forecasting the Australian average saleyard price for cattle to increase 1% in 2007/08. This view is primarily based on lower Australian beef production and increased demand for cattle as herd rebuilding slowly gets underway with improving seasonal conditions. The La Nina weather pattern continues to bring widespread rain to Eastern Australia and with it a return of confidence to the cattle market. It has been an incredible turnaround and many producers are now looking to capitalize on the pasture feed. However, feedlots remain under pressure. The number of cattle on feed in Australia declined 14% in the December quarter to be down 36% on a year ago as rising feed costs, high feeder cattle prices and falling export prices squeezed margins. We expect this squeeze to continue well into 2008. ABARE is forecasting Australian cattle slaughter to be down 3% in 2007/08.
International beef markets remain uncertain with the ‘on-again off-again’ re-entry of US beef exports into the major markets of Japan and Korea. Uncertainty has been increased with the EU banning all Brazilian beef until further notice on lack of traceability and food safety grounds Discussions continue on re-opening the Korean market to US ‘bone-in’ beef and relaxing the age restrictions on US beef entering Japan. Japanese and Korean demand for Australian beef is expected to soften from through 2008 as competition from US suppliers intensifies. The EU decision to ban Brazilian beef will open opportunities for Australian beef into the EU but will raise competition in secondary markets.
Reduced slaughtering and production in Australia lies behind a forecast 5% fall in total beef exports in 2007/08. Australian exports to Japan and Korea are forecast to fall by 6% and 17% respectively in 2007/08. This reflects the ongoing strength of the Australian dollar, rising feed costs with the follow on effects of reduced cattle of feed and thus reducing the supply of grainfed beef suitable for export to the Japanese and Korean markets. Increasing competition from US beef and other meats such as pork and chicken will provide on-going challenges for exports to the key Asian markets.
DairyWorld demand for dairy products over recent years has been boosted by rising incomes both in the developing economies of Asia and in the more traditional dairy consuming economies of the European Union and the United States. At the same time, demand from oil-producing nations has become increasingly important, as has Russian demand for butter. International prices jumped sharply higher through 2007, as strong demand met tight supply and depleted stocks.
The supply response to higher prices is starting to appear, especially from the United States. US milk production in the final quarter of 2007 was up 3.1% on the same period a year earlier; January production was up 1.9%. In combination with a weak US dollar, this has seen more competitive US dairy exports on the world market. This has contributed to international dairy product prices backing off their peaks in recent months. The USDA is forecasting US milk production to increase 2.7% in 2008 as a result of more cows and improving yield. The 1% projected herd increase comes in the face of soaring feed prices. Higher feed prices are expected to dampen US herd expansion and milk production growth in the second half of 2008.
In the EU, there is optimism around the coming production season following a mild winter. However, production quotas will prevent growth from exceeding 2% (the European Parliament is set to decide in February on a proposed 2% increase in production quotas starting 1 April 2008). Exports are likely to remain constrained by strong domestic demand, a lack of stocks, and the previous removal of export subsides. This combined with another fall in Australian production this season, despite recent rain, and tightening supplies from New Zealand at the tail end of the season is likely to prevent major falls in international dairy prices in 2008.
We expect 2008 to be a year of consolidation for international dairy prices, easing from their late 2007 peaks, but remaining elevated relative to historical averages. Despite easing from their peaks, 2007/08 average prices will be higher than in the previous year. ABARE is forecasting 2007/08 Australian farmgate prices to be 44 cents a litre, 33% higher than in the previous year.
Widespread rainfall has lifted cattle demand.
US is looking to re-enter the north Asian market.
Falling production will limit beef production.
Rising incomes in the emerging world...
... remain a structural positive for dairy prices.
European production gains will be limited.
18
First quarter 2008 Regional Economic Report

US market has weakened
60
70
80
90
100
110
120
130
140
Mar-97 Sep-98 Mar-00 Sep-01 Mar-03 Sep-04 Mar-06 Sep-07
US¢/kg
1.0
1.2
1.5
1.7
2.0
2.2
2.5
2.7
2.9
3.2
3.4US¢/lb
US import price of frozen Aus & NZ beef (lhs)
US beef futures
eastern young cattle indicator (rhs)
Source: Bloomberg, Factset, Westpac Economics
Beef demand is set to outgrow meat demand
2.4 2.4
3.5
1.3 1.4
2.01.7
2.3
1.92.1
0
1
2
3
4
total meat pork poultry bovine ovine
% per ann
0
1
2
3
4% per ann
1996 to 20062006 to 2015
Sources: FAO, ABARE, Westpac Economics
Beef and dairy
1000
1500
2000
2500
3000
3500
4000
4500
5000
5500
6000
Jan-05 Jun-05 Dec-05 May-06 Nov-06 Apr-07 Oct-07
USD/t
1000
1500
2000
2500
3000
3500
4000
4500
5000
5500
6000USD/t
Oceania Western Europe
Sources: ABARE, USDA-FAS, Bloomberg, Westpac Economics
Global powdered skim milk prices
Global dairy prices
500
1500
2500
3500
4500
5500
Jan-94 Jan-96 Jan-98 Jan-00 Jan-02 Jan-04 Jan-06 Jan-08
US$/t
500
1500
2500
3500
4500
5500
US$/t
skim milk powder buttercheese whole milk powder
Sources: ABARE, USDA, Westpac Economics
50
100
150
200
250
Jan-91 Jan-93 Jan-95 Jan-97 Jan-99 Jan-01 Jan-03 Jan-05 Jan-07
1997/98 = 100
50
100
150
200
250
1997/98 = 100
dairy index USD (lhs)
dairy index AUD (rhs)
Sources: ABARE, USDA-FAS, Bloomberg, Westpac Economics
Dairy price remain robust despite AUD
Cattle slaughterings down to August
1.0
1.5
2.0
2.5
3.0
3.5
4.0
4.5
Sep-97 Sep-99 Sep-01 Sep-03 Sep-05 Sep-07
'000
550
575
600
625
650
675
700
725
AUDkg
number of beef slaughters (rhs)
eastern young cattle indicator(lh )
Sources: ABS, Bloomberg, Westpac Economics
Past performance is not a reliable indicator of future performance. The forecasts given above are predictive in character. Whilst every effort has been taken to ensure that the assumptions on which the forecasts are based are reasonable, the forecasts may be affected by incorrect assumptions or by known or unknown risks and uncertainties. The results ultimately achieved may differ substantially from these forecasts.
First quarter 2008
Chart 1. Chart 2.
Chart 3. Chart 4.
Chart 5. Chart 6.
19
Regional Economic Report

Emerging demand supporting crude oil
20
First quarter 2008 Regional Economic Report
Energy prices have continued to soar despite a building market conviction that the US is close to, if not in, a recession. This is an interesting concurrence of events – you would have thought that energy demand would be sensitive to growth. And the spike in energy prices is not just in oil. Thermal coal ex Newcastle rose more than 44% inside a month to $131/t in late February. However, we have to leave our analysis on coal prices for another time, focussing here on oil alone. Here we seek to highlight a key theme we have been developing: that economic growth from non-OECD economies are offsetting advanced country growth.
Global demand for oil surged in 2004 with growth in demand averaging around an extra 3 million barrels per day (mbpd). This helped to push oil prices up through the US$50/barrel level in 2004Q3. But note that when demand stalled near the end of 2005, prices continued to rise, hitting a high of US$61 in late June 2006. Since then, consumption growth has been averaging a little more than 1mbp and the price has risen through US$100.
It is very revealing to see where the growth in demand has come from. In 2004, the OECD was consuming an extra 1½mbpd while non-OECD demand grew at a massive 2.3mbpd. This non-OECD demand was lifted by a surge in Chinese demand (0.8mbp) plus a 0.3mbp rise in the Middle East and a very chunky 1.1mbpd contribution from the remainder. In 2004, China was at the peak of a very aggressive investment cycle. Since then, Chinese demand growth has moderated and in 2007, it grew at just 0.3mbpd. This, however, more than offset the 0.1mbp fall in OECD demand. 2007 also saw Middle East demand grow at 0.3mbp – a rather interesting situation where high oil prices are boosting incomes to an extent that outweighs the effect of higher prices on demand – while demand from the rest of the non-OECD grew 1.1mbpd. This is why global oil demand continued to grow despite demand collapsing in the OECD.
The composition of growth, and the price of oil, also have an impact on demand. As non-OECD development accelerated in the second half of the 1990s, the oil intensity of their output increased. The ratio of oil consumption growth to economic growth in the non-OECD peaked at 1.7 in 1998. In the same year, oil prices bottomed at close to US$11. Since then non-OECD oil intensity has eased as oil prices have risen. 2004 was the last big year for non-OECD intensity (1) due to the surge in Chinese investment. We suspect that while higher oil prices will prevent oil intensity from returning to those levels, it can remain firm. In the OECD, oil intensity peaked in 2003 only to moderate as oil prices rose. It went negative in 2006 as these economies responded to higher prices. Positive oil intensity in the non-OECD means oil demand can still grow at close to 1mbpd on our current economic growth forecasts. It is also worthwhile noting that despite higher prices, OECD oil consumption lifted in 2007Q4.
The story gets more complex when we introduce the supply side. From late 2002 to 2003Q3, demand exceeded supply resulting in a significant drawdown of stocks. Nevertheless, oil prices did not vary much from US$30. However from 2003Q4 to 2006Q6, when the price of oil peaked around US$60, inventories grew as supply exceeded demand. There were many “supply shocks” around this time, Hurricane Katrina & the Alaskan pipeline break to name two, but they were not enough to drag supply below demand. We suspect that it was the threat of supply shocks, and ongoing geopolitical concerns, that led to a speculative rise in prices at this time.
Demand did exceed supply through most of 2007 with the gap widening in the last quarter. Supply lifted in 2007Q4, but it was not enough to match the rise in demand. So while we can speculate about how much of the rise through $100 was due to financial activity, demand must have played a significant role. With the least price sensitive section of the global economy driving oil demand, and marginal growth in oil supply dependent on non-traditional sources, or OPEC, the market will tighten further in 2009. We expect that prices will pull back to around $90 in 2008 as the northern hemisphere winter ends, and speculative activity shifts direction, but by 2009H2 prices should be back through $100.
There was a surge in supply in 2007Q4 (1.2mbpd). Is this a sign of things to come? Even with oil prices at US$100, some OPEC members still appear to support a cut in quotas. OPEC supply may rise as the Saudi’s lift production by stealth, but it may not be as large as it otherwise could be. And disruptions to supply remain an ongoing risk. In addition, growth in non-OPEC supply is increasingly dependant on non-crude sources such as bio-fuels, condensates, synthetic crude etc, all of which have a higher cost of production than most crude.
Prices are up ...
... despite lower demand from the OECD.
... and will do so again this year.
Supply ...
... speculation, and the Saudis.
The three S’s.

Emerging demand supporting crude oil
Past performance is not a reliable indicator of future performance. The forecasts given above are predictive in character. Whilst every effort has been taken to ensure that the assumptions on which the forecasts are based are reasonable, the forecasts may be affected by incorrect assumptions or by known or unknown risks and uncertainties. The results ultimately achieved may differ substantially from these forecasts.
First quarter 2008
Chart 1. Chart 2.
Chart 3. Chart 4.
Chart 5. Chart 6.
21
Regional Economic Report
Growth in oil consumption
-4
-3
-2
-1
0
1
2
3
4
1981 1985 1989 1993 1997 2001 2005
mbpd
-4
-3
-2
-1
0
1
2
3
4mbpd
Middle East
China
non-OECD ex China & ME
OECD
Sources: Facstet, Westpac
Oil demand stronger in 2005 than 2006
0
10
20
30
40
50
60
70
80
90
100
Dec-92 Dec-95 Dec-98 Dec-01 Dec-04 Dec-07
US$bb
-1
0
1
2
3
4
5mbpd
yr change oil demand (rhs)
demand (lhs)
Sources: Facstet, Westpac Economics
OECD demand firmed in 2007Q4
-2
-1
0
1
2
3
4
5
Dec-97 Dec-99 Dec-01 Dec-03 Dec-05 Dec-07
mbpd
-2
-1
0
1
2
3
4
5mbpd
Chinanon-OECD ex China
OECD
Sources: Facstet, Westpac Economics
Demand exceeded supply in 2007
65
70
75
80
85
90
95
Dec-92 Dec-95 Dec-98 Dec-01 Dec-04 Dec-07
mbpd
-40
-30
-20
-10
0
10mbpd
4qtr surplus/deficit (rhs)
demand (lhs)
supply (lhs)
Sources: Facstet, Westpac Economics
demand > supply
Growth in oil supply
-3
-2
-1
0
1
2
3
4
5
Dec-97 Dec-99 Dec-01 Dec-03 Dec-05 Dec-07
mbpd
-3
-2
-1
0
1
2
3
4
5mbpdThe RestFmr Soviet Union OPECNorth America
Sources: Facstet, Westpac Economics. Through the year.
Non-OECD oil intensity remains positive
0
10
20
30
40
50
60
70
80
90
100
1992 1994 1996 1998 2000 2002 2004 2006 2008
US$bb
-0.5
0.0
0.5
1.0
1.5
2.0%
OECD oil intensity* (rhs)
Non OECD oil intensity* (rhs)
crude oil price (lhs)
Sources: Facstet, Westpac Economics
* growth in consumption relative to economic growth

22
First quarter 2008
Past performance is not a reliable indicator of future performance. The forecasts given above are predictive in character. Whilst every effort has been taken to ensure that the assumptions on which the forecasts are based are reasonable, the forecasts may be affected by incorrect assumptions or by known or unknown risks and uncertainties. The results ultimately achieved may differ substantially from these forecasts.
Financial forecasts – Australia
Interest rate forecasts
Latest (Mar 14) Jun 08 Sep 08 Dec 08 Mar 09 Jun 09Cash 7.25 7.25 7.25 7.25 7.25 7.2590 Day Bill 7.85 8.25 8.15 8.00 7.25 7.153 Year Bond 6.20 6.60 6.65 6.55 6.50 6.3010 Year Bond 6.02 6.42 6.60 6.40 6.20 6.0010 Year Spread to US (bps) 254 272 280 250 205 175
Currency forecasts
Latest (Mar 14) Jun 08 Sep 08 Dec 08 Jun 09 Dec 09AUD vsAUD index* 100 100.23 100.22 100.22 96.66 100.23USD 0.9373 0.94 0.95 0.96 0.95 0.95JPY 92.89 95 97 95 93 92EUR 0.5980 0.61 0.62 0.62 0.60 0.59NZD 1.152 1.18 1.17 1.17 1.19 1.20CAD 0.9273 0.91 0.94 0.92 0.90 0.89 GBP 0.4640 0.46 0.46 0.46 0.44 0.44CHF 0.9357 0.96 0.98 0.98 0.97 0.95DKK 4.460 4.52 4.60 4.58 4.47 4.43SEK 5.656 5.70 5.74 5.66 5.59 5.58NOK 4.783 4.79 4.87 4.80 4.63 4.75ZAR 7.436 7.11 7.09 7.06 7.06 7.06 SGD 1.291 1.26 1.27 1.24 1.19 1.17HKD 7.294 7.30 7.37 7.44 7.36 7.36PHP 38.75 37.88 38.05 38.21 37.34 37.69THB 29.32 28.54 28.91 28.10 26.91 26.56MYR 2.964 3.00 2.97 2.97 2.81 2.78CNY 6.645 6.64 6.61 6.56 6.21 6.17IDR 8665 8469 8465 8458 8322 8275TWD 28.81 27.95 28.31 27.60 26.61 26.28KRW 934 864 872 855 833 820INR 37.94 36.01 36.49 35.19 33.71 33.27*Nominal trade weighted index, with latest data compiling the base. Weights from Reserve Bank of Australia. A reading above (below) 100 indicates a rise (fall) in the AUD. ^Approximate market forward price for AUD/USD, not a forecast. Sources: Bloomberg, Westpac Economics.
Regional Economic Report

23
First quarter 2008
Commodity price forecasts
Past performance is not a reliable indicator of future performance. The forecasts given above are predictive in character. Whilst every effort has been taken to ensure that the assumptions on which the forecasts are based are reasonable, the forecasts may be affected by incorrect assumptions or by known or unknown risks and uncertainties. The results ultimately achieved may differ substantially from these forecasts.
latest*** Jun-08 Sep-08 Dec-08 Mar-09 Jun-09 Sep-09 Dec-09all commodities index# 246 272 276 277 276 256 253 246bulk commodities index# 234 361 384 386 378 322 317 317iron ore (USD/t)* 54 77 83 85 85 77 77 77coal (USD/t)* 71 116 123 123 118 96 93 93WCFI**# 325 276 268 268 271 271 269 257crude oil (USD/bbl) NYMEX 105 90 85 90 95 100 105 95gold (USD/oz) 982 880 890 890 880 870 850 800base metals index# 285 234 228 235 242 239 228 221copper (USD/t) 8520 7200 6900 7000 7300 7200 6500 6300aluminium (USD/t) 3147 2500 2400 2600 2700 2600 2600 2600nickel (USD/t) 32620 27000 26000 26000 27000 28000 27000 26000zinc (USD/t) 2646 2200 2250 2300 2500 2400 2300 2200lead (USD/t) 3143 2500 2500 2600 2300 2200 2000 1900rural commodities index# 168 145 142 129 123 120 120 119wool AUD¢/kg 997 979 979 948 947 895 914 934wheat USD¢/bu 1127 900 875 750 700 700 700 700sugar USD¢/lb 14 14.0 13.0 12.0 11.0 10.0 10.0 10.0cotton USD¢/lb 84 72 72 71 69 67 66 65
levels % change annual averages 2006 2007 2008 2009 2006 2007 2008 2009all commodities index# 188 212 263 258 25.7 12.7 24.2 -2.2bulk commodities index# 219 224 341 333 11.0 2.0 52.5 -2.3iron ore (USD/t)* 44 51 75 79 25.0 16.2 47.9 5.5coal (USD/t)* 74 69 108 100 4.2 -6.3 55.9 -7.7ave coking price (USD/t) 98 84 127 107 5.2 -14.5 51.2 -15.5ave thermal price (USD/t) 48 51 85 91 -2.1 8.1 65.4 6.4WCFI**# 215 259 275 267 38.6 20.6 6.4 -3.0crude oil (USD/bbl) NYMEX 67 73 90 99 17.6 7.7 24.1 9.7gold (USD/oz) 610 703 890 850 36.0 15.3 26.6 -4.5base metals index# 225 277 236 232 67.1 22.9 -14.7 -1.8copper (USD/t) 6695 7121 7131 6825 86.5 6.4 0.1 -4.3aluminium (USD/t) 2585 2653 2536 2625 35.8 2.6 -4.4 3.5nickel (USD/t) 23550 36609 26803 27000 60.3 55.5 -26.8 0.7zinc (USD/t) 3251 3260 2298 2350 134.1 0.3 -29.5 2.3lead (USD/t) 1281 2569 2607 2100 33.6 100.5 1.5 -19.5rural commodities index# 85 112 142 120 18.4 32.1 26.4 -15.1wool AUD¢/kg 814 988 986 923 6.3 21.4 -0.2 -6.4wheat USD¢/bu 415 640 874 700 25.9 54.4 36.5 -19.9sugar USD¢/lb 15 10 13 10 47.0 -31.7 27.6 -20.4cotton USD¢/lb 54 59 72 67 4.7 9.6 21.1 -7.2# Chain weighted index: weights are Australian export shares. * Average Australian export prices fob – Source ABS 5432.0 Merchandise Trade Exports. ** WCFI – Westpac commodities futures index. *** Weekly averages except for bulks. Sources for all tables: Westpac Economics, Bloomberg, ABS.
Commodity futures contracts Futures contracts latest*** 3rd 6th 9th 12th 18th 24thcrude oil (USD/bbl) NYMEX 105 105 103 102 100 99 98gold (USD/oz) COMEX 982 985 995 1007 1029 n/a n/aaluminium (USD/t) LME 3147 3146 3171 3184 3183 3178 3173copper (USD/t) LME 8520 8437 8344 8238 8129 7917 7713nickel (USD/t) LME 32620 32392 32541 32530 32192 31188 30057zinc (USD/t) LME 2646 2617 2623 2623 2616 2594 2567lead (USD/t) LME 3143 3097 3090 3070 3044 n/a n/a
Regional Economic Report
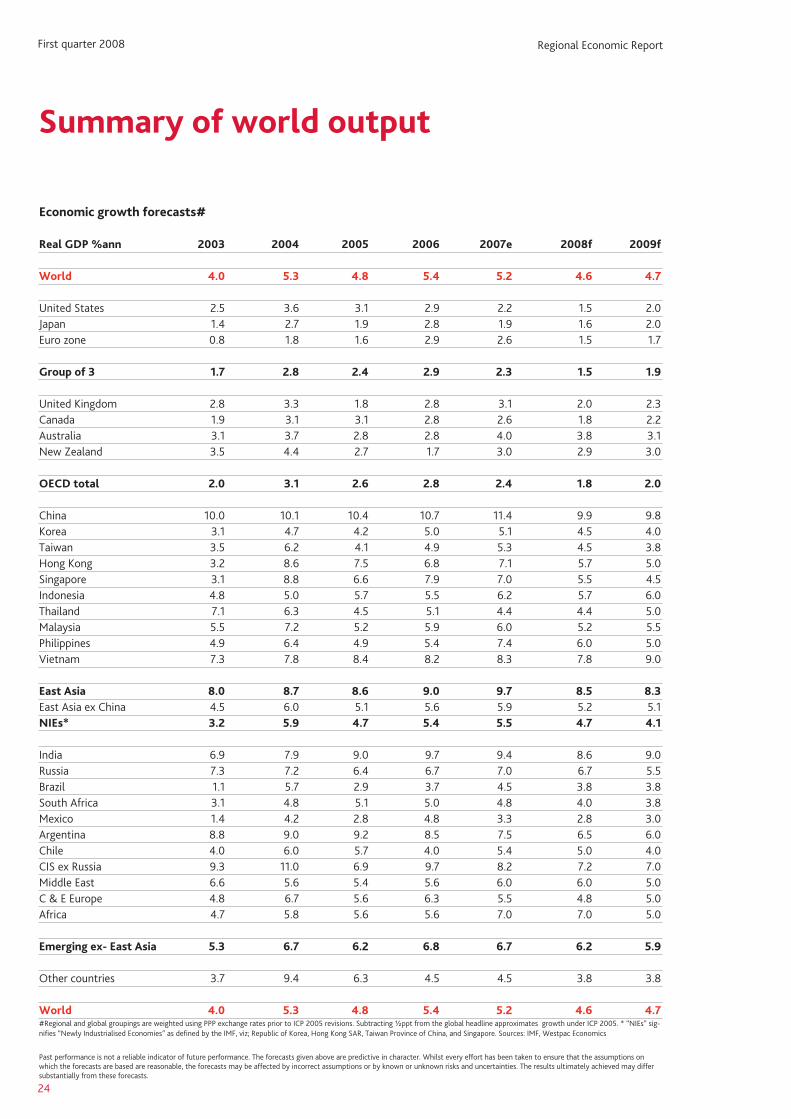
24
First quarter 2008
Summary of world output
Past performance is not a reliable indicator of future performance. The forecasts given above are predictive in character. Whilst every effort has been taken to ensure that the assumptions on which the forecasts are based are reasonable, the forecasts may be affected by incorrect assumptions or by known or unknown risks and uncertainties. The results ultimately achieved may differ substantially from these forecasts.
Economic growth forecasts#
Real GDP %ann 2003 2004 2005 2006 2007e 2008f 2009f World 4.0 5.3 4.8 5.4 5.2 4.6 4.7
United States 2.5 3.6 3.1 2.9 2.2 1.5 2.0Japan 1.4 2.7 1.9 2.8 1.9 1.6 2.0Euro zone 0.8 1.8 1.6 2.9 2.6 1.5 1.7
Group of 3 1.7 2.8 2.4 2.9 2.3 1.5 1.9 United Kingdom 2.8 3.3 1.8 2.8 3.1 2.0 2.3Canada 1.9 3.1 3.1 2.8 2.6 1.8 2.2Australia 3.1 3.7 2.8 2.8 4.0 3.8 3.1New Zealand 3.5 4.4 2.7 1.7 3.0 2.9 3.0
OECD total 2.0 3.1 2.6 2.8 2.4 1.8 2.0 China 10.0 10.1 10.4 10.7 11.4 9.9 9.8Korea 3.1 4.7 4.2 5.0 5.1 4.5 4.0Taiwan 3.5 6.2 4.1 4.9 5.3 4.5 3.8Hong Kong 3.2 8.6 7.5 6.8 7.1 5.7 5.0Singapore 3.1 8.8 6.6 7.9 7.0 5.5 4.5Indonesia 4.8 5.0 5.7 5.5 6.2 5.7 6.0Thailand 7.1 6.3 4.5 5.1 4.4 4.4 5.0Malaysia 5.5 7.2 5.2 5.9 6.0 5.2 5.5Philippines 4.9 6.4 4.9 5.4 7.4 6.0 5.0Vietnam 7.3 7.8 8.4 8.2 8.3 7.8 9.0 East Asia 8.0 8.7 8.6 9.0 9.7 8.5 8.3East Asia ex China 4.5 6.0 5.1 5.6 5.9 5.2 5.1NIEs* 3.2 5.9 4.7 5.4 5.5 4.7 4.1 India 6.9 7.9 9.0 9.7 9.4 8.6 9.0Russia 7.3 7.2 6.4 6.7 7.0 6.7 5.5Brazil 1.1 5.7 2.9 3.7 4.5 3.8 3.8South Africa 3.1 4.8 5.1 5.0 4.8 4.0 3.8Mexico 1.4 4.2 2.8 4.8 3.3 2.8 3.0Argentina 8.8 9.0 9.2 8.5 7.5 6.5 6.0Chile 4.0 6.0 5.7 4.0 5.4 5.0 4.0CIS ex Russia 9.3 11.0 6.9 9.7 8.2 7.2 7.0Middle East 6.6 5.6 5.4 5.6 6.0 6.0 5.0C & E Europe 4.8 6.7 5.6 6.3 5.5 4.8 5.0Africa 4.7 5.8 5.6 5.6 7.0 7.0 5.0 Emerging ex- East Asia 5.3 6.7 6.2 6.8 6.7 6.2 5.9
Other countries 3.7 9.4 6.3 4.5 4.5 3.8 3.8
World 4.0 5.3 4.8 5.4 5.2 4.6 4.7#Regional and global groupings are weighted using PPP exchange rates prior to ICP 2005 revisions. Subtracting ½ppt from the global headline approximates growth under ICP 2005. * “NIEs” sig-nifies “Newly Industrialised Economies” as defined by the IMF, viz; Republic of Korea, Hong Kong SAR, Taiwan Province of China, and Singapore. Sources: IMF, Westpac Economics
Regional Economic Report

Notes
First quarter 2008
25
Regional Economic Report

Notes
26
First quarter 2008 Regional Economic Report

Corporate directory
This issue was finalised on 14 March 2008
Publication enquiries, Economics, Telephone (61-2) 8254 8720, [email protected]
SydneyLevel 2, 275 Kent StreetSydney NSW 2000Telephone (61-2) 8254 8372Facsimile (61-2) 8254 6934
Bill EvansGlobal Head of Economics
Andrew HanlanSenior Economist
Matthew HassanSenior Economist
Huw McKaySenior International Economist
Justin SmirkSenior Economist
Anthony ThompsonSenior Economist
SydneyLevel 29, Westpac Place275 Kent Street Sydney NSW 2000 Telephone (61-2) 9220 1083Facsimile (61-2) 8253 0955
Graham JenningsChief Executive, Regional and Agribusiness BankingTelephone (61-2) 9220 1083
Barry RuddyNational Manager, Agribusiness BankingTelephone (61-2) 6363 7601
Rick AylettRegional General Manager, Regional and Agribusiness Banking VIC/TASTelephone (61) 427 249 059
Rodney KellyRegional General Manager, Regional and Agribusiness Banking QLD/NTTelephone (61-7) 4688 6063
Ben MariniRegional General Manager, Regional and Agribusiness Banking WA/SATelephone (61-8) 9426 2831
Steve HannanRegional General Manger, Regional and Agribusiness Banking NSW/ACT. Telephone (61-2) 6584 3263
Peter WillshireHead of Regional Business ServicesTelephone (61-8) 9426 2565
Westpac regional and agribusiness bankingWestpac economics