WESTERN REGIONAL RESEARCH PUBLICATION · WESTERN REGIONAL RESEARCH PUBLICATION ... is located in...
22
WESTERN REGIONAL RESEARCH PUBLICATION W-1133 Benefits and Costs of Resource Policies Affecting Public and Private Land Papers from the Annual Meeting Salt Lake City, Utah, February 14-15,2005 Eighteenth Interim Report July 2005 Compiled by: Steven D. Shultz Department of Agribusiness and Applied Economics North Dakota Agricultural Experiment Station North Dakota State University Fargo, ND, 58105 Page 1 of 433
Transcript of WESTERN REGIONAL RESEARCH PUBLICATION · WESTERN REGIONAL RESEARCH PUBLICATION ... is located in...
WESTERN REGIONAL RESEARCH PUBLICATION
W-1133 Benefits and Costs of Resource Policies Affecting
Public and Private Land
Papers from the Annual Meeting Salt Lake City, Utah, February 14-15,2005
Eighteenth Interim Report July 2005
Compiled by: Steven D. Shultz
Department of Agribusiness and Applied Economics North Dakota Agricultural Experiment Station
North Dakota State University Fargo, ND, 58105
Page 1 of 433
User Fees and the Demand for OHV Recreation
Thomas P. ~ o l m e s ' and Jeffrey E. ~ n ~ l i n '
1 Southern Research Station, USDA Forest Service, Research Triangle Park, NC
' Department ofResource Economics, Universiv ofNevada, Reno, NV
Abstract
The recent boom in the demand for off-highway vehicle (OHV) recreation has created an
important policy issue for public land managers who are concerned with the impacts of
OHV use on environmental quality. Within the past few years, the U.S. Forest Service
has recognized the need for greater authority in managing these recreation areas and has
proposed to amend OHV regulations. However, not much is known about the demand
for OHV recreation or how various policy tools might be applied to improve the
management of OHV sites. One means of protecting environmental quality and restoring
areas damaged by unauthorized OHV use is to make use of funds collected through the
recreational user fee program to restore and maintain OHV areas. A second method
would be to make use of volunteers from OHV clubs and other riders to help protect
OHV sites. To help address and evaluate these issues, data were collected at three OHV
sites in North Carolina. The demand for OHV recreation was estimated using standard
and simulation-based, random parameter count data models. Econometric results from
the random parameter models indicated that the most avid OHV riders did not think that
user fees were an appropriate method to manage OHV recreation. In contrast, riders who
volunteer to maintain trails and OHV areas are more avid riders. Consequently, it seems
Page 413 of 433
that the encouragement of volunteer effort and labor could be a viable and productive
means to improve trail maintenance and environmental protection at OHV sites.
1. Introduction
Off-highway vehicle (OHV) use on public lands is becoming a major policy issue for the
U.S. Forest Service and other land management agencies. The demand for OHV use on
public land is not new - motorcycles have been used off-road for almost a century
(Havlick 2002). Because dirt bikes are relatively difficult to ride, the demand for this
type of recreation is relatively stable. However, the change in technology from two-
wheeled to four wheeled vehicles has dramatically altered the demand for OHV use.
This is evident in the boom in popularity for four-wheel drive (4WD, SUV) and all-
terrain vehicle (ATV) use on public lands.
OHV recreation has become an important policy issue on public lands because these
vehicles can have negative impacts on the environment by increasing soil erosion,
decreasing water quality and impairing wildlife and visual aesthetics. Attempts to
regulate OHV use on public lands are not new. Executive Orders E.O. 1 1644 (1 972) and
E.O. 11989 (1977) addressed safety and environmental concerns with OHVs by
authorizing the Forest Service to manage OHV use so as to protect the land as well as the
safety of all users of those lands. Within the past few years, however, the Forest Service
has recognized the need for greater authority in managing these recreation areas and has
proposed to amend the OHV regulations in an attempt to mitigate unacceptable
environmental damage to Forest Service lands (USDA Forest Service 2004).
Page 414 of 433
One means of protecting environmental quality and restoring areas damaged by
unauthorized OHV use is to make use of funds collected through the recreational user fee
program authorized in 2004. This program gives federal agencies the authority to collect
user fees at certain sites and invest the revenues at the site where they were collected.
Collected fees could be used to close trails where environmental impacts are
unacceptable, or to perform trail improvements that would help protect environmental
quality .
Another approach to protecting environmental quality and restoring areas damaged by
unauthorized OHV use is to collaborate with trail riding clubs and organizations that
provide volunteers for trail maintenance. Because people who use OHV trails have a
stake in maintaining access to those areas, trail riding organizations have traditionally
participated in protecting the quality of, and access to, the riding environment.
We are unaware of any published studies that evaluate the economic demand for, or value
of, OHV use on public lands. In this paper, we present analysis of OHV demand and
consumer surplus at three Forest Service sites in North Carolina. Empirical estimates are
obtained using standard and simulation-based random parameter count data models in
order to evaluate respondent heterogeneity. We are particularly interested in
understanding how the avidity of OHV users (as proxied by the number of OHV trips) is
related to two key policy variables: (1) whether or not the collection of user fees is an
Page 415 of 433
appropriate way to manage OHV recreation, and (2) whether or not the respondent has
ever volunteered to conduct trail maintenance.
The paper is organized as follows. In section 2, we describe the study area and the data
collection method. In section 3, we describe the empirical methods we used. In section
4, we present our results and in section 5 we present the conclusions of our study.
2. Study Area and Data Collection
The three study sites are all located in the National Forests of North Carolina and allow
opportunities for trail bikes, ATV and 4WD use. Two of the sites are in the mountains of
western North Carolina and the third site is in the Piedmont physiographic region. The
Upper Tellico is a premier regional site located in the Nantahala National Forest. This
site is highly scenic and the steep, rugged trails are designed for use by experienced riders
only. The other mountain site, Brown Mountain, is located in the Pisgah National Forest,
contains less severe terrain and offers recreational opportunities for beginning to
advanced riders. The third site, Badin Lake, is located in the Uwharrie National Forest.
Although not as high in elevation as the other two sites, Badin Lake contains an
abundance of steep, rocky terrain and opportunities for all classes of riders.
Data were collected using a paper and pencil survey that was administered on-site to
riders as they were exiting the trail system during the summer of 2000. Volunteers from
local trail riding organizations were used to collect the data. Respondents were asked to
enumerate the total number of trips they made to each of the OHV sites during each of
Page 416 of 433
the previous three years. Although this procedure may induce some degree of recall bias,
the number of trips taken to sites is relatively small, which would mitigate possible recall
bias. Data for the three years were pooled for analysis.
Respondents provided information regarding the origin of their current trip, which
allowed us to compute travel costs (estimated as $0.34 per mile). In addition, questions
were asked to respondents regarding their riding experience, skill, type of vehicle used,
OHV related expenses, age, education, and income. Respondents were also asked two
questions that would help us evaluate possible means for protecting and restoring
environmental quality at OHV sites. First, respondents were asked "Have you ever
volunteered to maintain OHV trails?" Second, respondents were asked "Do you think
that user fees can be a good tool to manage public recreation areas?"
3. Empirical Methods
During the past decade, there has been an explosion of interest in the use of count data
models to estimate the demand for outdoor recreation (e.g., see Englin et al. 2003). In
contrast to earlier Hotelling-Clawson-Knetsch travel cost models that used ordinary least
squares regression methods, count data models emphasize the non-negative, integer
nature of the data on the number of trips taken and are most useful when the per person
counts are small. This condition is met with count data for OHV recreation.
A second development during the past decade has been the development of simulation-
based econometric methods that allow the estimation of respondent preference
Page 417 of 433
heterogeneity via random parameters. This is accomplished by replacing integrals of
large dimensions in the probability density function with simulated counterparts
(GouriQoux and Monfort 1996). The use of simulation for investigating preference
heterogeneity has been applied most frequently in discrete choice analysis (Train 2003).
However, similar methods can be applied to other econometric models. In this paper, we
use simulation-based methods to investigate preference heterogeneity in count data
models of recreation demand.
Random parameters are estimated using what is known as a 'mixed function', which is
the weighted average of several functions and a mixing distribution provides the weights
(Train 2003). Perhaps the best known mixed function count data model is the negative
binomial (NegBin) model. In the NegBin model, the mean h of the Poisson distribution
is considered a random variable and the mixing distribution is the gamma density
(Cameron and Trivedi 1986). The fit obtained with the NegBin model is often superior to
the Poisson fit because the NegBin accounts for overdispersion of the data (i.e. it allows
the variance to exceed the mean). As pointed out by Mullahy (1997), unobserved
heterogeneity, or population mixing, implies overdispersion of the data, but
overdispersion does not necessarily imply heterogeneity. For example, the zero-inflated
Poisson model accounts for overdispersion in the data (Haab and McConnell 1996), but
does not imply unobserved heterogeneity in the conditional mean.
One limitation of the NegBin model is that it assumes that heterogeneity arises solely in
the mean event rate of the Poisson parameter h. More recent models have been
Page 418 of 433
developed to account for heterogeneity in the mean event rate and the regression
parameters p. If the mixing h c t i o n g(P) is discrete, where P takes only a limited
number of classes, it is referred to as a latent class (or finite mixture) model. Wedel and
others (1 993) developed a latent class Poisson model to account for heterogeneity in
count data parameters p across market segments. If the mixing distribution is continuous,
rather than discrete, heterogeneity in the parameters of count data regressions can be
modeled as randomly distributed parameters (Greene 2002).
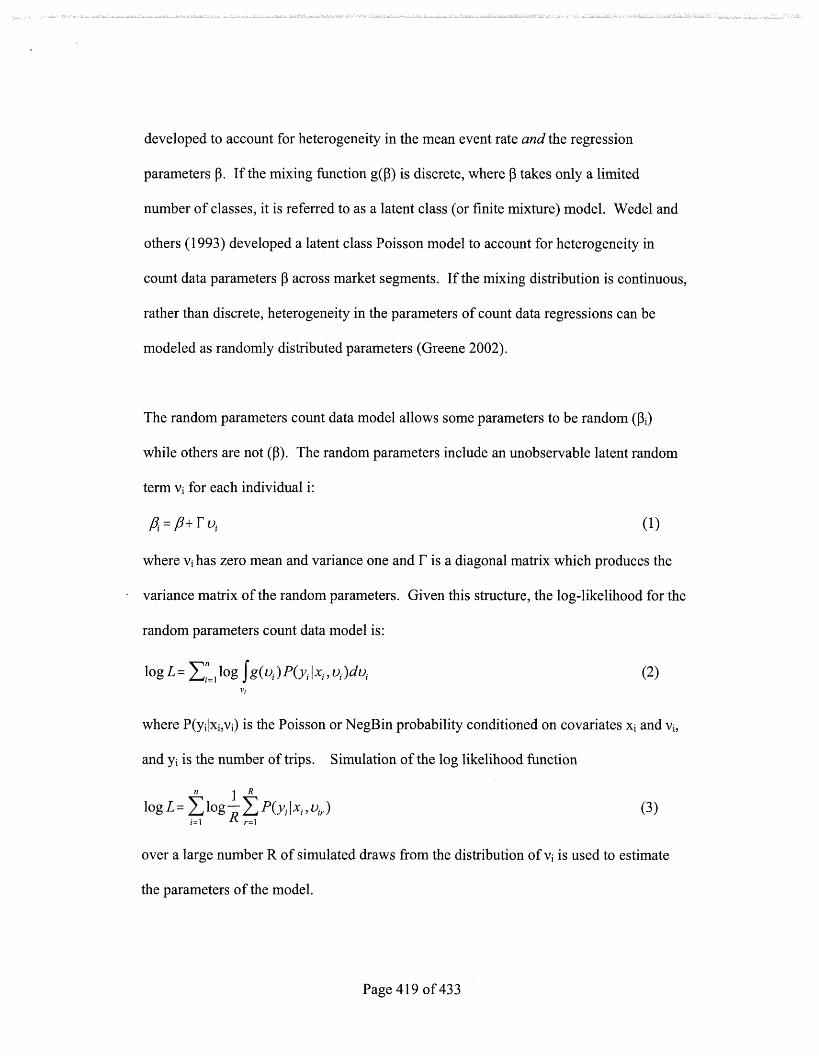
The random parameters count data model allows some parameters to be random (Pi)
while others are not (P). The random parameters include an unobservable latent random
term vi for each individual i:
,q=ptrui (1)
where vi has zero mean and variance one and I-' is a diagonal matrix which produces the
variance matrix of the random parameters. Given this structure, the log-likelihood for the
random parameters count data model is:
where P(yi/xi,vi) is the Poisson or NegBin probability conditioned on covariates xi and vi,
and yi is the number of trips. Simulation of the log likelihood function
over a large number R of simulated draws from the distribution of vi is used to estimate
the parameters of the model.
Page 4 19 of 433
Economic theory does not provide guidance on which parameters of the model should be
specified as random and which ones should not. Consequently, to simplify the
presentation, we only specify our two policy variables as having random parameters.
Randomness in the parameters of a count data model of recreational trips reveals
information on the relationship between the variable and the number of trips taken by the
respondent. We interpret the randomness, then, as an indication of how the 'avidity' of
recreational users changes with respect to the policy variables. This is consequential for
policy analysis because, ceteris paribus, people who are more avid participants in a sport
are more likely to be concerned about potential changes to the recreational resource. In
our analysis, potential changes include expanded scope for utilizing user fees to pay for
environmental protection at recreation sites and the use of volunteer effort to maintain the
recreational environment.
4. Results
Surveys were completed for 357 respondents. A profile of the characteristics of OHV
riders in western North Carolina shows that, on average, riders are generally young (32
years), predominantly male (88%), and middle-class ($50,100 annual income) (Table 1).
ATVs (52%) and four wheel drive vehicles (55%) are much more commonly used than
are trail bikes (19%). A very small proportion of riders are handicapped (2%) and a
significant proportion of riders have received injuries that required medical attention
(13%). A moderate number of riders reported that drinking alcoholic beverages at OHV
sites is a typical part of their OHV trip (21%). Respondents have, on average, nearly a
decade of riding experience (9.8 years) and self-reported their skill level as mid-way
Page 420 of 433
between Intermediate and Advanced. Average annual expenses incurred in pursuit of
OHV riding were about $1,8 1 1 and riders spent about $7,053 on their most recent OHV
purchase.
Count data models were estimated for each of the study sites (Tables 2 ,3 and 4). The
statistical fit, as measured by one minus the likelihood ratio, was better for the random
parameter models than for the nonrandom parameter models. In particular, the random
parameter Poisson model was found to have the best fit at all three sites. The dispersion
parameter in the NegBin model was found to be significantly different than zero at
Brown Mountain and Badin Lake. The value of the dispersion parameter was much
smaller in the random parameter NegBin model than in the nonrandom parameter model.
The random parameter NegBin model did not converge for the Upper Tellico site.
Parameter estimates on the travel cost variable were negative and statistically significant
at the 0.05 level or greater in each of the model specifications. In addition, a number of
socio-economic and behavioral variables were found to have a statistically significant
impact on the demand for OHV trips. Parameter estimates from the random parameter
Poisson models for each site (the best-fit models) provide insight into the factors that
influence OHV demand. Different factors have varying impact on recreation demand
depending on the site considered. For example, consider the factors that influence the
demand for trips to Upper Tellico, which is considered to be a premier regional OHV
destination. Estimates from the random parameter Poisson model demonstrate that riders
participate more frequently at this site if they are older, more experienced, better
Page 42 1 of 43 3
educated and with higher income levels. In contrast, at the other two sites, younger riders
with lower incomes participate more frequently. Apparently, the OHV market can be
segmented based on rider characteristics. Presumably, rider characteristics influence the
type of riding experience that is being sought at each of the OHV sites.
Statistically significant random parameters were estimated for the mean and standard
deviation of the two policy variables. Four of the five random parameter estimates for
the mean value of the USER FEE variable were negative, indicating that people who
thought that user fees can be a good tool to manage public recreation areas were less avid
riders, on average. Conversely, more avid riders did not think that user fees can be a
good management tool. In the one instance that a positive random parameter estimate
was found for the USER FEE variable, the estimate was not statistically significant at the
0.10 level and the magnitude of the parameter estimate was close to zero, indicating that
feelings about user fees did not have any impact on avidity in that model.
All five random parameter estimates for the mean value of VOLUNTEER were positive
and statistically significant at the 1 percent level. This result suggests that people who
volunteer to help maintain OHV areas and trails are, in general, more avid riders. It
seems that the volunteer labor and effort supplied by this group of riders could be
encouraged and applied to help protect and restore environmental quality at OHV sites.
Estimates of the standard deviation of the random parameters can be used to understand
respondent heterogeneity regarding the relationship between the policy variables and
Page 422 of 433
OHV trip frequency (Table 5). At two of the three study sites, the vast majority (85%-
88%) of riders who think that user fees are a good management tool are less avid riders.
Conversely, only a small percentage (12- 15%) of respondents who think that user fees are
a good management tool are avid riders. At the third site, what people think about user
fees does not seem to be strongly related to trip frequency. These results suggest that
increased reliance on user fees to protect and restore OHV areas will not likely gain the
support of the more avid users. However, at all of the study sites, the majority of people
(53-78%) who volunteer to help maintain and restore OHV areas are more avid riders.
This result provides further support for the idea that volunteers could be an important
resource for managing OHV areas on public land.
Estimates of consumer surplus show that the value of OHV riding varies dramatically
across the western North Carolina sites included in the analysis (Table 6). This variation
is likely due to differences in site characteristics. For example, Upper Tellico is
considered to be a premier regional site with many scenic attributes and extremely
challenging trails. The value of this site for OHV use is reflected in the consumer surplus
estimate ($333.33/ trip). At the other end of the spectrum, the Brown Mountain site is
considered to be more favorable to beginning riders, for which more substitutes would be
available, and the consumer surplus estimate is considerably smaller ($27.03/ trip). The
characteristics of the Badin Lake site would fall in between the two other sites in terms of
difficulty, which is captured by a moderate consumer surplus estimate ($55.00/ trip).
Page 423 of 433
5. Conclusions
OHV recreation on public land is growing rapidly, largely due to the advent of ATVs
(Havlick 2002). As OHVs can cause negative impacts to the environment, as well as to
other riders, it is essential that public land management agencies take appropriate steps to
assure the protection of the environment, restore the environment where it has been
damaged, and provide safe riding conditions. Proposed revisions of OHV regulations by
the USDA Forest Service demonstrate that this agency has recognized the need to
improve the management of OHV recreation sites.
In this paper, we have provided estimates of the demand for, and value of, OHV
recreation at three sites in western North Carolina using standard and simulation-based
count data models. In addition to travel cost, a number of socio-economic and behavioral
characteristics were shown to influence the demand for OHV recreation. Income, age,
and education influence the demand for OHV recreation, but have different impacts at
different sites. The segmentation of demand across sites is likely due to the
characteristics of the sites. A better understanding of what types of riders choose to ride
more frequently at various sites could help managers protect and improve important site
characteristics. Alternatively, data could be pooled across sites to estimate a single
visitation demand function. Heterogeneity in parameter values across sites could then be
identified using the simulation-based random parameter models.
The random parameter count data models we estimated fit the data better than the
nonrandom parameter models and, consequently, represent a promising new tool for
Page 424 of 433
modeling recreation trip count data. Random parameters were estimated for two policy
variables related to the protection and restoration of OHV recreation areas. It was
discovered that increased implementation of new user fees in western North Carolina
may meet resistance from more avid riders. That is, the riders who think that user fees
are a good management tool are the less avid riders. In contrast, riders who volunteer to
maintain trails and OHV areas are, in general, more avid riders. It seems that the
encouragement of volunteer labor and effort could be a viable and productive means to
improve trail maintenance and environmental protection at OHV sites. We suggest that
strategies utilizing this approach, such as providing user fee vouchers for volunteers,
should be evaluated through future research endeavors.
Page 425 of 433
References
Cameron, A.C., and P. Trivedi. 1986. Econometric models based on count data:
comparisons and applications of some estimators and tests. Journal of Applied
Econometrics 1 :29-53.
Englin, J.E., T.P. Holmes and E.O. Sills. 2003. Estimating forest recreation demand
using count data models. In, E.O. Sills and K.L. Abt (eds.), Forests in a Market
Economy. Dordrecht, The Netherlands: Kluwer Academic Publishers.
Gourikroux, C. and A. Monfort. 1996. Simulation-based econometric methods. Oxford:
Oxford University Press.
Greene, W.H. 2002. LIMDEP Econometric modeling guide. Plainview, NY:
Econometric Sof ware, Inc.
Haab, T.C. and K.E. McConnell. 1996. Count data models and the problem of zeros in
recreation demand analysis. American Journal of Agricultural Economics 78: 89- 102.
Mullahy, J. 1997. Heterogeneity, excess zeros, and the structure of count data models.
Journal o m l i e d Econometrics 12: 337-350.
Page 426 of 433
Train, K.E. 2003. Discrete choice methods with simulation. Cambridge: Cambridge
University Press.
USDA Forest Service. 2004. Travel management; designated routes and areas for motor
vehicle use. Washington, DC; Federal Register 36 CFR 212,251,261, and 295.
Wedel, M., W.S. Desarbo, J.R. Bult, and V. Ramaswamy. 1993. A latent class Poisson
regression model for heterogeneous count data. Journal of Applied Econometrics 8: 397-
411.
Page 427 of 433
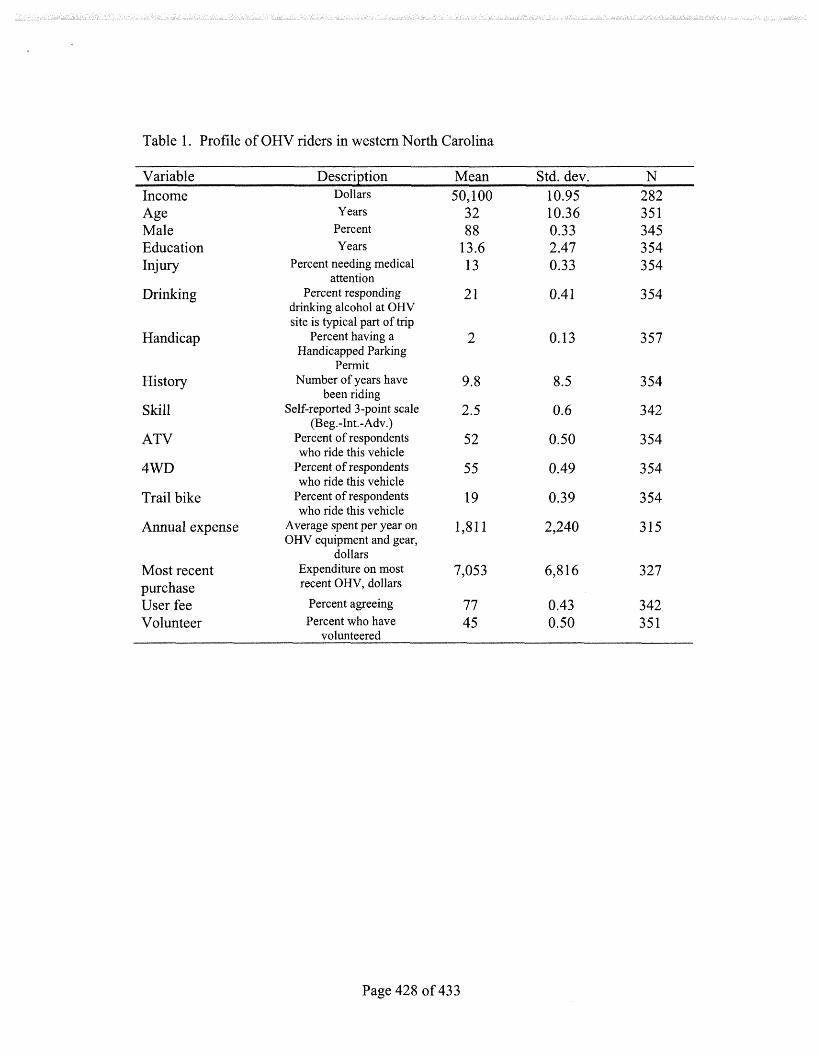
Table 1. Profile of OHV riders in western North Carolina
Variable Descrintion Mean Std. dev. N Dollars Years
Male Percent Education Years
Injury Percent needing medical attention
Drinking Percent responding drinking alcohol at OHV site is &pica1 part of trip
Handicap Percent having a Handicapped Parking
Permit History Number of years have
been riding Skill Self-reported 3-point scale
(Beg.-1nt.-Adv.) ATV Percent of respondents
who ride this vehicle 4WI> Percent of respondents
who ride this vehicle Trail bike Percent of respondents
who ride this vehicle Annual expense Average spent per year on
OHV equipment and gear, dollars
Most recent purchase
Expenditure on most recent OHV, dollars
User fee Percent agreeing Volunteer Percent who have
volunteered
Page 428 of 433
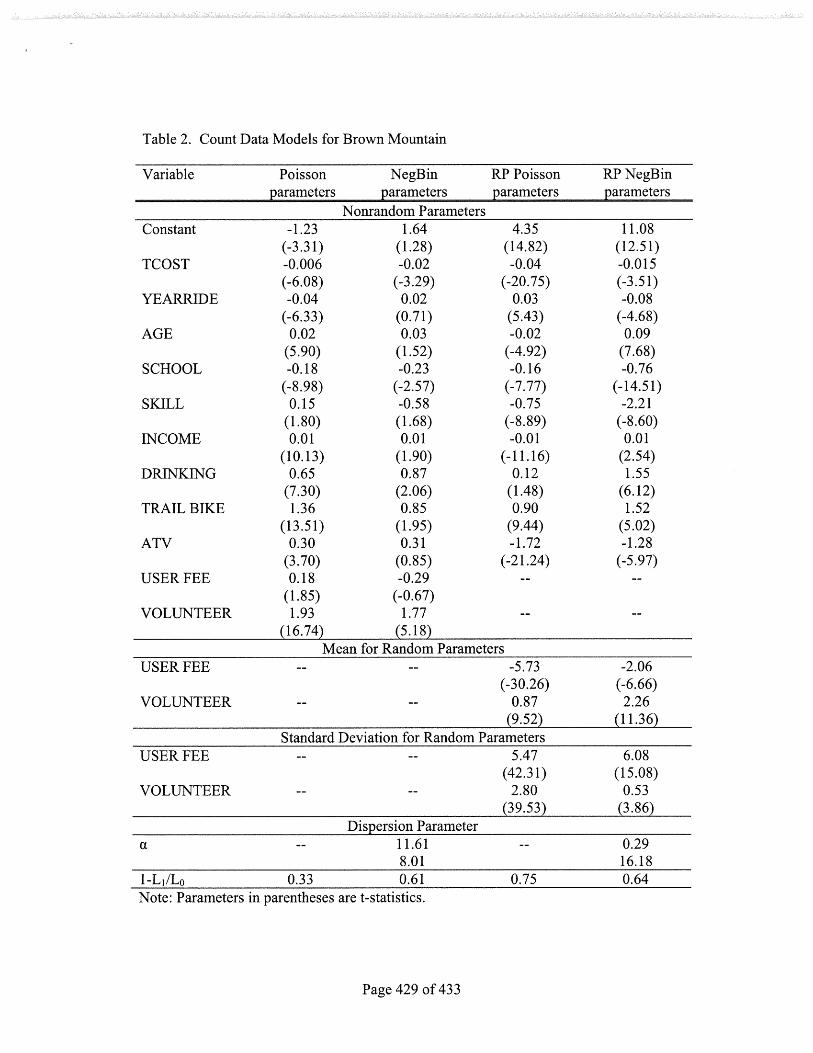
Table 2. Count Data Models for Brown Mountain
Variable Poisson NegBin RP Poisson RP NegBin
Nonrandom Parameters Constant -1.23 1.64 4.35 1 1.08
(-3.3 1) (1.28) (14.82) (12.5 1) TCOST -0.006 -0.02 -0.04 -0.0 15
(-6.08) (-3 -29) (-20.75) (-3.51) YEARRIDE -0.04 0.02 0.03 -0.08
(-6.33) (0.7 1) (5.43) (-4.68) AGE 0.02 0.03 -0.02 0.09
(5.90) (1.52) (-4.92) (7.68) SCHOOL -0.18 -0.23 -0.16 -0.76
(-8.98) (-2.57) (-7.77) (-14.51) SKILL 0.15 -0.58 -0.75 -2.2 1
(1.80) (1 -68) (-8.89) (-8.60) INCOME 0.01 0.01 -0.0 1 0.01
(10.13) (1 -90) (-11.16) (2.54) DFUNKJNG 0.65 0.87 0.12 1.55
(7.3 0) (2.06) (1.48) (6.12) TRAIL BII(IE: 1.36 0.85 0.90 1.52
(13.51) (1.95) (9.44) (5.02) ATV 0.30 0.3 1 -1.72 -1.28
(3.70) (0.85) (-2 1.24) (-5.97) USER FEE 0.18 -0.29 -- - -
(1 35 ) (-0.67) VOLUNTEER 1.93 1.77 -- - -
(16.74) (5.18) Mean for Random Parameters
USER FEE -- -- -5.73 -2.06 (-30.26) (-6.66)
VOLUNTEER - - -- 0.87 2.26 (9.52) (1 1.36)
Standard Deviation for Random Parameters USER FEE -- -- 5 -47 6.08
(42.3 1) (1 5.08) VOLUNTEER -- -- 2.80 0.53
(39.53) (3.86) Dispersion Parameter
a -- 11.61 -- 0.29 8.01 16.18
1 -L1/Lo 0.33 0.6 1 0.75 0.64 Note: Parameters in parentheses are t-statistics.
Page 429 of 433
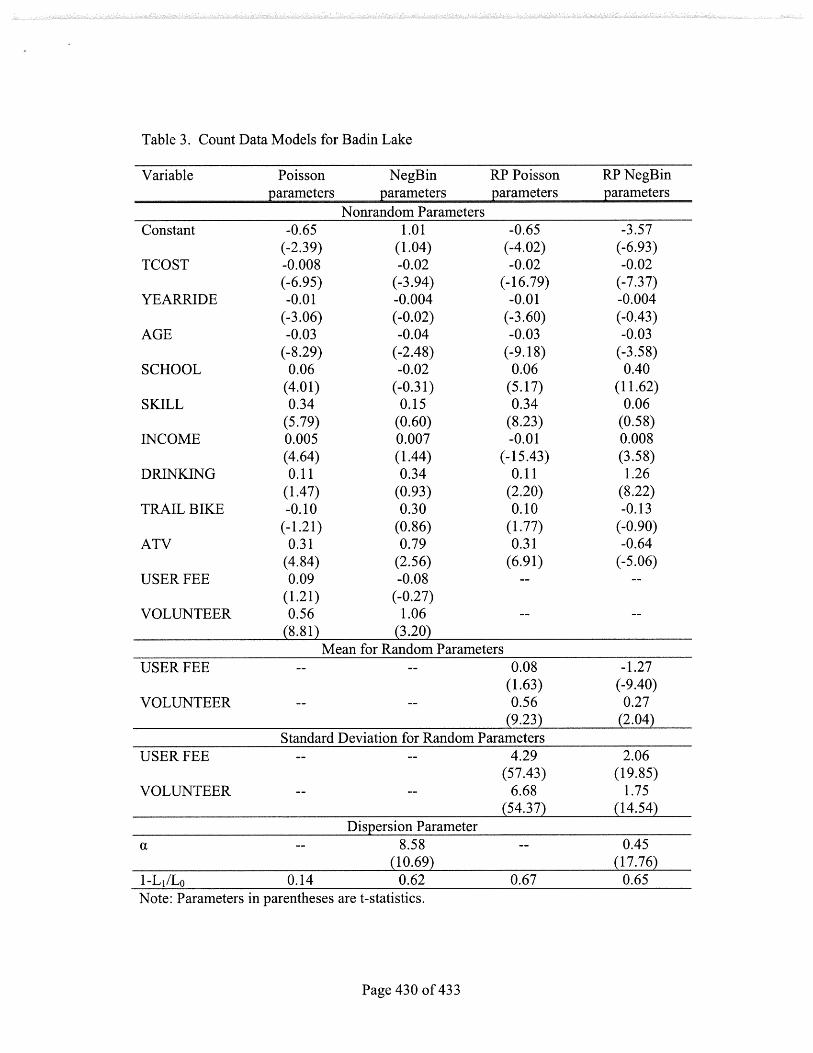
Table 3. Count Data Models for Badin Lake
Variable Poisson NegBin RP Poisson RP NegBin
Nonrandom Parameters Constant -0.65 1.01 -0.65 -3.57
(-2.39) (1.04) (-4.02) (-6.93) TCOST -0.008 -0.02 -0.02 -0.02
(-6.95) (-3.94) (-16.79) (-7.37) YEARRIDE -0.01 -0.004 -0.0 1 -0.004
(-3.06) (-0.02) (-3.60) (-0.43) AGE -0.03 -0.04 -0.03 -0.03
(-8.29) (-2.48) (-9.1 8) (-3.58) SCHOOL 0.06 -0.02 0.06 0.40
(4.01) (-0.3 1) (5.17) (1 1.62) SKILL 0.34 0.15 0.34 0.06
(5.79) (0.60) (8.23) (0.58) INCOME 0.005 0.007 -0.01 0.008
(4.64) (1.44) (- 1 5.43) (3.58) DRrNKING 0.1 1 0.34 0.1 1 1.26
(1.47) (0.93) (2 -20) (8.22) TRAIL BIKE -0.10 0.30 0.10 -0.13
(- 1.2 1) (0.86) (1.77) (-0.90) ATV 0.3 1 0.79 0.3 1 -0.64
(4.84) (2.56) (6.91) (-5.06) USER FEE 0.09 -0.08 -- - -
(1.21) (-0.27) VOLUNTEER 0.56 1.06 -- - -
Mean for Random Parameters USER FEE - - -- 0.08 -1.27
(1.63) (-9.40) VOLUNTEER - - -- 0.56 0.27
(9.23) (2.04) Standard Deviation for Random Parameters
USER FEE -- -- 4.29 2.06 (57.43) (1 9.85)
VOLUNTEER - - -- 6.68 1.75 (54.37) (14.54)
Dispersion Parameter
Note: Parameters in parentheses are t-statistics.
Page 430 of 433
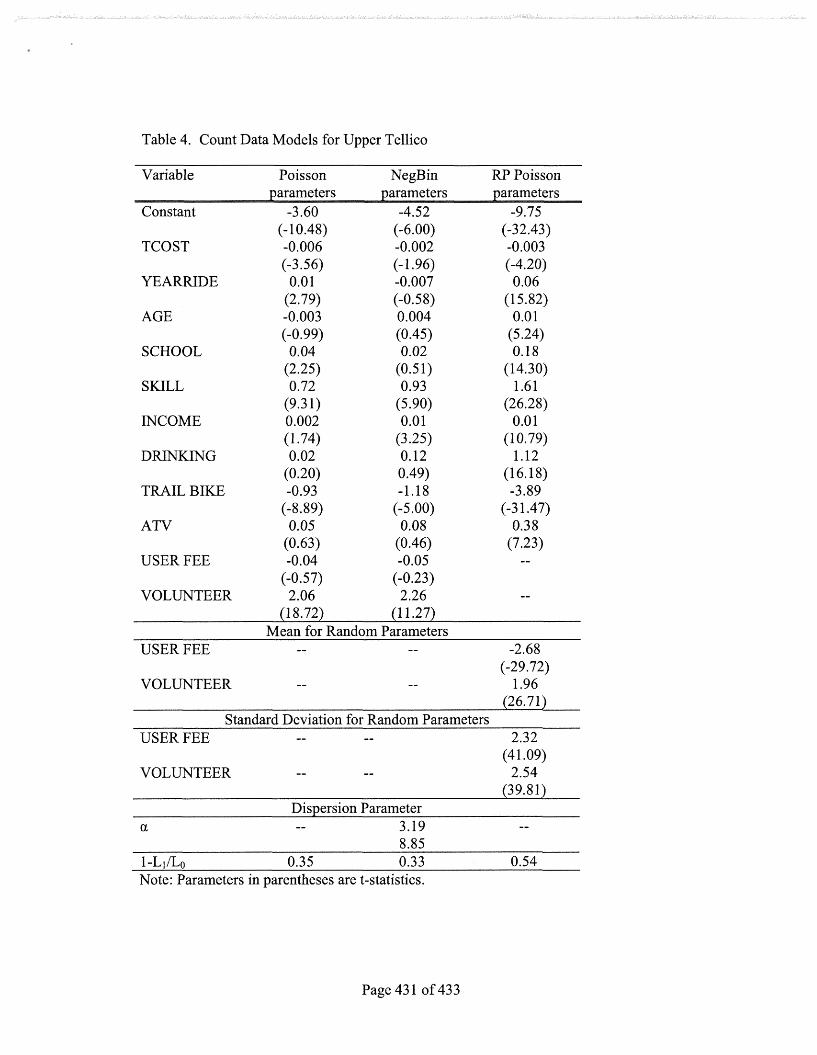
Table 4. Count Data Models for Upper Tellico
Variable Poisson NegBin RP Poisson
Constant -3.60 -4.52 -9.75 (- 10.48) (-6.00) (-32.43)
TCOST -0.006 -0.002 -0.003 (-3.56) (- 1.96) (-4.20)
YEARRIDE 0.01 -0.007 0.06 (2.79) (-0.58) (1 5.82)
AGE -0.003 0.004 0.0 1 (-0.99) (0.45) (5.24)
SCHOOL 0.04 0.02 0.18 (2.25) (0.5 1) (14.30)
SKILL 0.72 0.93 1.61 (9.3 1) (5.90) (26.28)
INCOME 0.002 0.01 0.0 1 (1.74) (3.25) (1 0.79)
D r n K I N G 0.02 0.12 1.12 (0.20) 0.49) (16.18)
TRAIL BIKE -0.93 -1.18 -3.89 (-8.89) (-5.00) (-3 1.47)
ATV 0.05 0.08 0.38 (0.63) (0.46) (7.23)
USER FEE -0.04 -0.05 -- (-0.57) (-0.23)
VOLUNTEER 2.06 2.26 -- (1 8.72) (1 1.27)
Mean for Random Parameters USER FEE -- -- -2.68
(-29.72) VOLUNTEER -- - - 1.96
(26.71) Standard Deviation for Random Parameters
USER FEE -- --
VOLUNTEER - - --
Dispersion Parameter a -- 3.19 --
8.85 1 -LI/Lo 0.35 0.33 0.54 Note: Parameters in parentheses are t-statistics.
Page 43 1 of 433
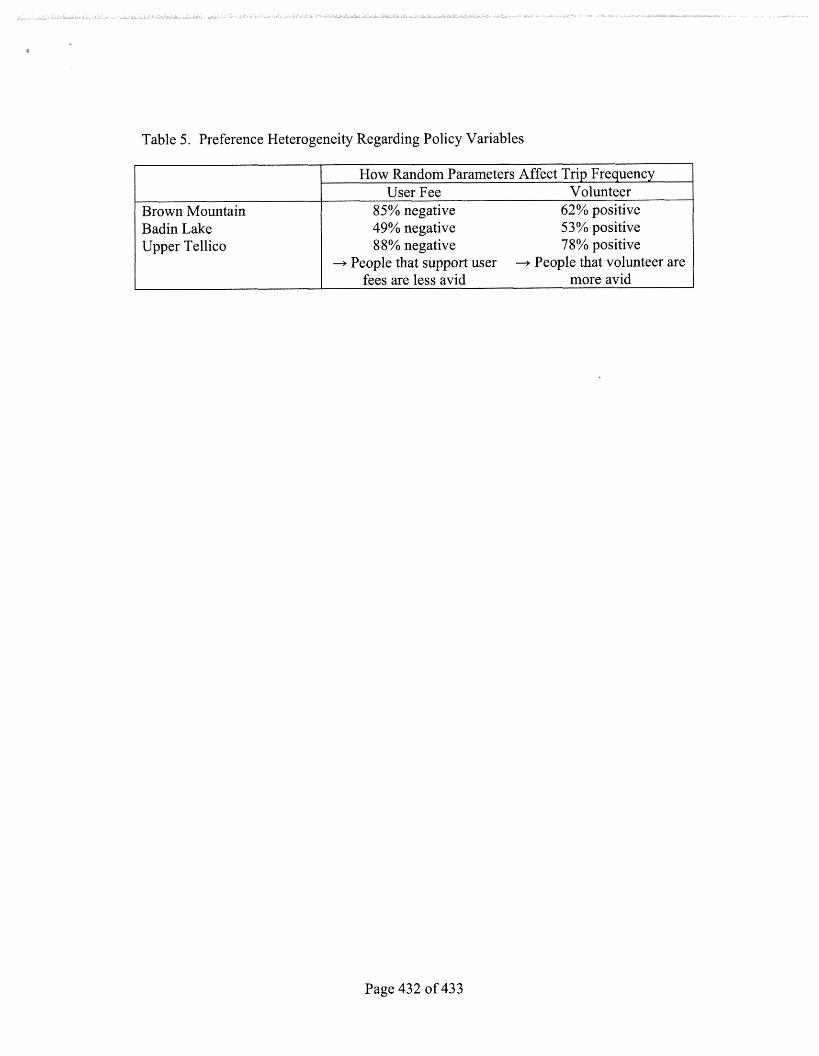
Table 5. Preference Heterogeneity Regarding Policy Variables
Page 432 of 433
Brown Mountain Badin Lake Upper Tellico
How Random Parameters Affect Trip Frequency User Fee Volunteer
85% negative 62% positive 49% negative 53% positive 88% negative 78% positive
-+ People that support user -+ People that volunteer are fees are less avid more avid
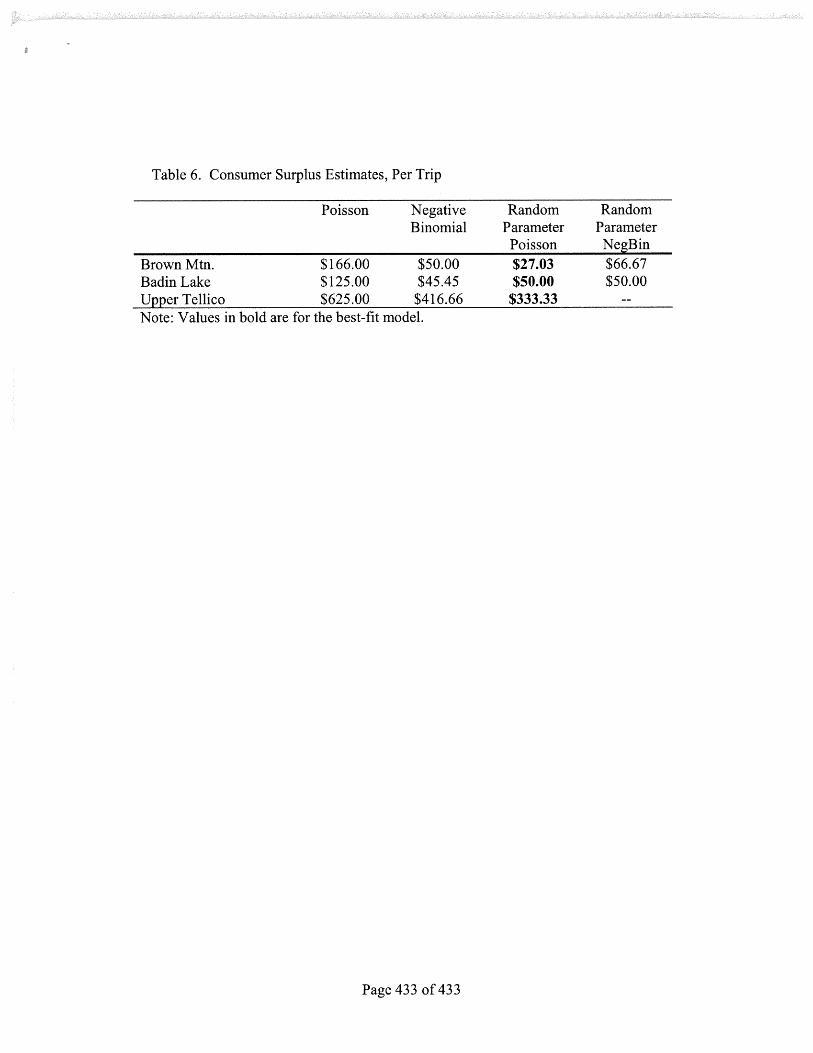
Table 6. Consumer Surplus Estimates, Per Trip
Poisson Negative Random Random Binomial Parameter Parameter
Poisson NerrBin Brown Mtn. $166.00 $50.00 $27.03 $66.67 Badin Lake $125.00 $45.45 $50.00 $50.00 Upper Tellico $625 .OO $416.66 $333.33 -- Note: Values in bold are for the best-fit model.
Page 433 of 433