WEST SIDE MOBILITY STUDY - …apps.roads.maryland.gov/webprojectlifecycle/AW518_11/htdocs...WEST...
114
WEST SIDE MOBILITY STUDY July 2009 1 EXECUTIVE SUMMARY The West Side Mobility Study is a joint study being conducted by the Maryland State Highway Administration (SHA) and the Virginia Department of Transportation (VDOT) to evaluate potential improvements along the Capital Beltway, I-270 Spurs, and I-270 mainline between the VDOT High Occupancy Toll (HOT) Lanes Project and I-370 / Intercounty Connector (ICC). The study evaluated improvements that could increase capacity, improve traffic operations, and provide a managed lanes network to connect the adjacent facilities that are currently under construction. The existing conditions were analyzed and long-term, short-term, and mid-term improvements were developed. The 14-mile long study corridor was divided into six distinct sections. Starting from the south, these sections include the following: 1. Capital Beltway in Virginia from the HOT Lane Project to the American Legion Bridge 2. American Legion Bridge 3. Capital Beltway in Maryland from the American Legion Bridge to the I-270 West Spur 4. I-270 West Spur 5. I-270 mainline from the I-270 Spurs to the I-370 interchange 6. I-270 East Spur. Traffic analyses for the existing and 2030 No-Build conditions indicated that significant portions of the study corridor will operate at level of service (LOS) E or F during the peak periods. In the southbound direction during the AM peak period, five out of 13 highway segments (portions of highway between the interchanges within the study limits) are operating at LOS E or F, including: • I-495 from Clara Barton Parkway to MD 190 (2 segments). • I-270 West Spur from I-495 split to Democracy Boulevard (1 segment). • I-270 mainline from MD 189 to MD 28 (1 segment). • I-270 mainline from Shady Grove Road to I-370 (1 segment). In the northbound direction during the PM peak period, eight out of 13 highway segments are operating at LOS E or F, including: • I-495 from Clara Barton Parkway to Cabin John Parkway (1 segment). • Entire I-270 West Spur (3 segments). • I-270 mainline from Y-Split to I-370 (4 segments). The situation would deteriorate further by 2030 under the No-Build conditions. In the southbound direction during the AM peak period, seven out of 13 highway would be operating at LOS E or F, including: • American Legion Bridge to I-270 West Spur (4 segments). • I-270 West Spur between I-495 and Democracy Boulevard (1 segment). • I-270 mainline between MD 189 and MD 28 (1 segment). • I-270 mainline between Shady Grove Road and I-370 (1 segment). . In the northbound direction during the PM peak period, nine out of 13 highway segments would be operating at LOS E or F, including: • I-495 between Clara Barton Parkway and Cabin John Parkway (2 segments).
-
Upload
hoangthuan -
Category
Documents
-
view
214 -
download
1
Transcript of WEST SIDE MOBILITY STUDY - …apps.roads.maryland.gov/webprojectlifecycle/AW518_11/htdocs...WEST...

WEST SIDE MOBILITY STUDY
July 2009 1
EXECUTIVE SUMMARY
The West Side Mobility Study is a joint study being conducted by the Maryland State Highway Administration (SHA) and the Virginia Department of Transportation (VDOT) to evaluate potential improvements along the Capital Beltway, I-270 Spurs, and I-270 mainline between the VDOT High Occupancy Toll (HOT) Lanes Project and I-370 / Intercounty Connector (ICC). The study evaluated improvements that could increase capacity, improve traffic operations, and provide a managed lanes network to connect the adjacent facilities that are currently under construction. The existing conditions were analyzed and long-term, short-term, and mid-term improvements were developed. The 14-mile long study corridor was divided into six distinct sections. Starting from the south, these sections include the following:
1. Capital Beltway in Virginia from the HOT Lane Project to the American Legion Bridge 2. American Legion Bridge 3. Capital Beltway in Maryland from the American Legion Bridge to the I-270 West Spur 4. I-270 West Spur 5. I-270 mainline from the I-270 Spurs to the I-370 interchange 6. I-270 East Spur.
Traffic analyses for the existing and 2030 No-Build conditions indicated that significant portions of the study corridor will operate at level of service (LOS) E or F during the peak periods. In the southbound direction during the AM peak period, five out of 13 highway segments (portions of highway between the interchanges within the study limits) are operating at LOS E or F, including:
• I-495 from Clara Barton Parkway to MD 190 (2 segments). • I-270 West Spur from I-495 split to Democracy Boulevard (1 segment). • I-270 mainline from MD 189 to MD 28 (1 segment). • I-270 mainline from Shady Grove Road to I-370 (1 segment).
In the northbound direction during the PM peak period, eight out of 13 highway segments are operating at LOS E or F, including:
• I-495 from Clara Barton Parkway to Cabin John Parkway (1 segment). • Entire I-270 West Spur (3 segments). • I-270 mainline from Y-Split to I-370 (4 segments).
The situation would deteriorate further by 2030 under the No-Build conditions. In the southbound direction during the AM peak period, seven out of 13 highway would be operating at LOS E or F, including:
• American Legion Bridge to I-270 West Spur (4 segments). • I-270 West Spur between I-495 and Democracy Boulevard (1 segment). • I-270 mainline between MD 189 and MD 28 (1 segment). • I-270 mainline between Shady Grove Road and I-370 (1 segment).
. In the northbound direction during the PM peak period, nine out of 13 highway segments would be operating at LOS E or F, including:
• I-495 between Clara Barton Parkway and Cabin John Parkway (2 segments).
WEST SIDE MOBILITY STUDY
July 2009 2
• I-270 West Spur (3 segments). • I-270 mainline between Y-Split interchange and MD 28 (4 segments).
Seven long-term alternatives were developed that would provide additional capacity throughout the study corridor. The new capacity would be created by widening the existing roadway and providing a managed lane system for the full length of the study corridor. The interchanges within the project limits would be modified to accommodate the widened and reconfigured mainline, and in some locations, provide access to the managed lanes (High Occupancy Vehicle - HOV, HOT, Express Toll Lane - ETL). The long-term alternatives would have significant costs ranging from $1.04 to $2.65 billion and extensive property impacts due to the mainline widening and interchange improvements. Due to the extensive costs and impacts associated with the long-term alternatives, short-term and mid-term improvements were then considered. The short-term improvements focused on localized congestion points and modifications that could improve system-wide traffic operations with limited or no widening. These improvements were modeled in CORSIM to determine the affect on local and system-wide traffic operations. In general, some of the short-term improvements could provide some modest improvement to the overall system traffic operations. Five mid-term improvements were considered that would provide increased capacity and a managed lane network throughout the study corridor with little or no widening. The mid-term improvements included restriping the existing highway to provide an additional lane in each direction; peak period shoulder use; use of reversible lanes to add capacity in the peak direction; and conversion of the existing HOV lanes on the I-270 Spurs and mainline to managed lanes. The restriping improvement appeared to provide the most benefits of all of the mid-term improvements, but there were a number of design and operational concerns with narrowing the lanes and shoulders to provide the additional capacity. These concerns would need to be studied in more detail before the restriping improvement could be implemented. The West Side Mobility Study recommendations include completing more detailed studies of the following items:
Long-Term Improvements: Alternatives 1, 4, and 5/5A/5B. Short-Term Improvements: Extending acceleration/deceleration lanes on ramp/slip ramp entrances; converting the HOV lanes on the I-270 West Spur to general purpose or managed lanes. It may also be possible to evaluate the short-term improvements as a separate study that could potentially be completed sooner. Mid-Term Improvements: Restriping option.

WEST SIDE MOBILITY STUDY
July 2009 3
TABLE OF CONTENTS
Executive Summary .................................................................................................................1 Table of Contents.....................................................................................................................3 List of Figures and Tables........................................................................................................4 A. Introduction..........................................................................................................................6 B. Existing Conditions ..............................................................................................................7
1. Virginia Capital Beltway ..............................................................................................7 2. American Legion Bridge..............................................................................................7 3. Maryland Capital Beltway............................................................................................7 4. I-270 West Spur ..........................................................................................................8 5. I-270 Mainline..............................................................................................................8 6. I-270 East Spur ...........................................................................................................8 7. Traffic Conditions ........................................................................................................8
C. Long-Term Improvements ...................................................................................................16 1. Introduction .................................................................................................................16 2. Range of Alternatives..................................................................................................16 3. Alternative 1 ................................................................................................................20 4. Alternative 2 ................................................................................................................25 5. Alternative 3 ................................................................................................................29 6. Alternative 4 ................................................................................................................31 7. Alternative 5 ................................................................................................................39 8. Alternative 5A / 5B ......................................................................................................44 9. Summary.....................................................................................................................45
D. Short-Term Improvements ..................................................................................................46 1. Introduction .................................................................................................................46 2. Potential Improvements ..............................................................................................46 3. Traffic Analysis............................................................................................................46 4. Summary ....................................................................................................................51
E. Mid-Term Improvements .....................................................................................................52 1. Introduction .................................................................................................................52 2. Potential Improvements ..............................................................................................52 3. Restriping Option ........................................................................................................55 4. Summary ....................................................................................................................63
F. Conclusions .........................................................................................................................64 Appendix A – Alternative 4 Engineering Display Sheets .........................................................65 Appendix B – CORSIM Results for Short-Term Improvements ...............................................66

WEST SIDE MOBILITY STUDY
July 2009 4
LIST OF FIGURES AND TABLES Figures Figure A-1 – Location Map Figure B-1 – Existing Typical Section – Virginia Capital Beltway Figure B-2 – Existing Typical Section – American Legion Bridge Figure B-3 – Existing Typical Section – Maryland Capital Beltway Figure B-4 – Existing Typical Section – I-270 West Spur Figure B-5 – Existing Typical Section – I-270 Mainline Figure B-6 – Existing Typical Section – I-270 East Spur Figure C-1 – Long-Term Alternatives – Virginia Capital Beltway (alt. 1 – 5) Figure C-2 – Long-Term Alternatives – American Legion Bridge (alt. 1) Figure C-3 – Long-Term Alternatives – Maryland Capital Beltway (alt. 1) Figure C-4 – Long-Term Alternatives – I-270 West Spur (alt. 1) Figure C-5 – Long-Term Alternatives – I-270 Mainline – ‘Y’ Split to Montrose Road (alt. 1) Figure C-6 – Long-Term Alternatives – I-270 Mainline – Montrose Road to I-370 (alt. 1) Figure C-7 – Long-Term Alternatives – American Legion Bridge (alts. 2 – 5) Figure C-8 – Long-Term Alternatives – Maryland Capital Beltway (alts. 2 -5) Figure C-9 – Long-Term Alternatives – I-270 West Spur (alt. 2) Figure C-10 – Long-Term Alternatives – I-270 Mainline – ‘Y’ Split to Montrose Road (alt. 2) Figure C-11 – Long-Term Alternatives – I-270 Mainline – Montrose Road to I-370 (alt. 2) Figure C-12 – Long-Term Alternatives – I-270 West Spur (alt. 3 – 5) Figure C-13 – Long-Term Alternatives – I-270 Mainline – ‘Y’ Split to Montrose Road (alts. 3, 4) Figure C-14 – Long-Term Alternatives – I-270 Mainline – Montrose Road to I-370 (alt. 3) Figure C-15 – Long-Term Alternatives – I-270 Mainline – Montrose Road to I-370 (alt. 4) Figure C-16 – Long-Term Alternatives – I-270 Mainline – ‘Y’ Split to Montrose Road (alt. 5) Figure C-17 – Long-Term Alternatives – I-270 Mainline – Montrose Road to I-370 (alt. 5) Figure D-1 – Potential Short-Term Improvements Location Map Figure E-1 – Mid-Term Improvements Restriping – Capital Beltway Figure E-2 – Mid-Term Improvements Restriping – I-270 West Spur Figure E-3 – Mid-Term Improvements Restriping – I-270 Mainline Figure E-4 – Mid-Term Improvements Restriping – Peak Period Left Shoulder Use Figure E-5 – Mid-Term Improvements Restriping – Peak Period Right Shoulder Use Figure E-6 – Reversible Lane / Movable Barrier Typical Section Figure E-7 – Mid-Term Improvements Decision Flow Chart Figure E-8 – Mid-Term Improvements Restriping – American Legion Bridge Restriping Options Figure E-9 – Mid-Term Improvements Reduced Restriping Typical Section under Overpasses

WEST SIDE MOBILITY STUDY
July 2009 5
Figure E-10 – Curves with Limited Horizontal Sight Distance Figure E-11 – Mid-Term Improvements – Potential Lane Configuration / Operation Tables Table B-1 – HCS Assumptions Table B-2 – Percentage of Trucks and Buses Table B-3A – I-270 Northbound HOV/GP/CD Volume Distributions Table B-3B – I-270 Southbound HOV/GP/CD Volume Distributions Table B-4 – Capacity Thresholds for HOV, GP, CD Lanes – Existing and 2030 No-Build Table B-5 – Capacity Calculations – Existing Conditions Table B-6 – Capacity Calculations – 2030 No-Build Condition Table C-1 – Matrix of Alternatives for I-270 Mainline Table C-2 – Matrix of Alternatives for I-270 Spurs Table C-3 – Lane Configurations by Section Table C-4 – Capacity Thresholds for ETL, GP, and CD Lanes – 2030 Build Alternatives 1, 2, 3
and 4 Table C-5 – Capacity Calculations – 2030 Build Alternative 1 Table C-6 – Capacity Calculations – 2030 Build Alternative 2 Table C-7 – Capacity Calculations – 2030 Build Alternative 4 Table C-8 – Capacity Thresholds for HOV, GP, and CD Lanes – 2030 Build Alternative 5 Table C-9 – Capacity Calculations – 2030 Build Alternative 5 Table D-1 – Causes and Potential Improvements to Alleviate Recurring Congestion Table D-2 – Traffic Affects of Potential Southbound Short-Term Improvements Table D-3 – Traffic Affects of Potential Northbound Short-Term Improvements Table E-1 – Feasibility of Localized Widening to Provide Adequate Horizontal Sight Distance
through Curves Table E-2 – Technical Studies Evaluating the Use of Narrow Lanes and Shoulders on Freeways Table E-3 – Responses to AASHTO Survey Table E-4 – Typical Lane Width Design Values Table E-5 – Preliminary Cost Estimates for Restriping Alternative

WEST SIDE MOBILITY STUDY
July 2009 6
A. INTRODUCTION The Maryland State Highway Administration (SHA) and Virginia Department of Transportation (VDOT) are currently studying and/or constructing improvements to the Capital Beltway, I-270, and I-370. In Virginia, VDOT in partnership with Fluor and Transurban, is constructing the Capital Beltway High Occupancy Toll (HOT) Lanes Project, which extends from I-95 / I-395 to the Dulles Toll Road. These improvements will provide two additional mainline lanes in each direction, which will be operated as HOT lanes. The project is anticipated to be completed in 2013. SHA is completing the I-270 Multi-Modal Corridor Study, which considers added capacity and Express Toll Lanes (ETL) on I-270 from north of I-370 to Frederick. The study completed a Public Hearing in June 2009 with selection of a locally preferred alternative to follow. SHA is also constructing the Intercounty Connector (ICC) between I-370 and I-95; the ICC will be a tolled roadway and the first section is scheduled to open by 2011. The combination of these three projects will leave a “gap” along the Capital Beltway, I-270 Spurs, and I-270 mainline where no capacity improvements or managed lanes are provided. As a result, SHA and VDOT initiated the West Side Mobility Study to evaluate potential improvements to provide additional capacity and a managed lane network along the Capital Beltway and I-270, including the I-270 West and East Spurs, between the VDOT HOT Lanes Project and I-370 / ICC, a total distance of 14 miles. The project location is shown in Figure A-1. The study included an evaluation of short-term, mid-term, and long-term improvements focusing on traffic operations, impacts, and cost. The long-term alternatives would include mainline widening, roadway modifications, and interchange improvements to provide additional capacity and a managed lanes network along the entire study corridor. Seven long-term improvements were evaluated for engineering feasibility, cost, impacts, and traffic operations. The short-term improvements would include small-scale, low impact improvements to alleviate specific causes of recurring congestion, such as modifications to acceleration and deceleration lanes; changes to slip ramp operation on the I-270 mainline; conversion of the existing High Occupancy Vehicles (HOV) lanes on the I-270 West Spur to general purpose lanes; and modifications to the northbound split between the I-270 West Spur and I-495. These options were evaluated to determine the localized and overall system impact that would result from the improvements. The mid-term improvements would include providing additional capacity without large-scale widening or capital investment, such as restriping the highway to provide an additional lane in each direction; peak period shoulder use; reversible lanes, and conversion of the existing HOV lanes on I-270 to HOT or other managed lanes. The evaluation of mid-term improvements considered engineering feasibility, traffic operational issues, cost, and potential revenue generation.

0 2,000 4,000
Scale in feet
6,000 8,000
Copyright ADC The Map PeoplePermitted Use No. 20903122Expiration: 03/31/10
WEST SIDE MOBILITY STUDYB
E L T W AY
CAPITAL
MARYLAND
V I R G I N I A
270INTERSTATE
3
4
5
6
2
1
N
5 (see Figure 2B)Capital Beltway from Virginia HOT Lanes (north of Dulles TollRoad) to American Legion Bridge (approximately 2.5 miles)
American Legion Bridge (approximately 0.4 miles, 2,000 LF)
Capital Beltway from American Legion Bridge to 1-270 WestSpur (approximately 3.6 miles)
I-270 West Spur - from the Capital Beltway to the I-270 “Y”Split Interchange (approximately 1.5 miles)
I-270 East Spur - from north of Grosvenor Lane to I-270 “Y”Split Interchange (approximately 1.9 miles)
I-270 from the West Spur to I-370 (approximately 7 miles)
Section 1
Section 2
Section 3
Section 4
Section 5
Section 6
270INTERSTATE
270INTERSTATE
370INTERSTATE
495INTERSTATE
495INTERSTATE
WEST SIDE MOBILITY STUDYWEST SIDE MOBILITY STUDY
LOCATION MAP
Date:
JULY 2009
Figure:
A-1
BE L T W A
Y
CAPITAL
MARYLAND
V I R G I N I A
VDOTVirginia Department of TransportationMaryland
Transportation
Authority
SM
Maryland Department of Transportation

WEST SIDE MOBILITY STUDY
July 2009 7
B. EXISTING CONDITIONS The West Side Mobility Study extends from just north of the Dulles Toll Road interchange along the Capital Beltway in Virginia to the I-370 interchange along I-270 in Maryland. These limits include six distinct highway sections:
1. Virginia portion of the Capital Beltway (Dulles Toll Road to American Legion Bridge) 2. American Legion Bridge 3. Maryland portion of the Capital Beltway (American Legion Bridge to I-270 West Spur) 4. I-270 West Spur 5. I-270 Mainline (I-270 Spurs to I-370) 6. I-270 East Spur
These sections are described below and shown in Figure A-1. 1. Virginia Capital Beltway – North of Dulles Toll Road to the American Legion Bridge Section 1 includes the portion of the Capital Beltway in Virginia between the VDOT HOT Lanes Project and the American Legion Bridge, a distance of 2.7 miles. Upon completion of the VDOT HOT Lanes Project, this section will consist of six lanes per direction at the southern limits transitioning to four lanes in each direction near the SR 193 interchange. There is an auxiliary (fifth) lane in each direction between the George Washington Memorial Parkway interchange and the American Legion Bridge. In addition, there is a collector-distributor (CD) road along the outer loop (southbound) between the George Washington Memorial Parkway interchange and SR 193 interchange. This section includes the George Washington Memorial Parkway and SR 193 interchanges. The existing typical section is shown in Figure B-1. 2. American Legion Bridge Section 2 includes the American Legion Bridge, which spans the Potomac River between Maryland and Virginia, a distance of 0.4 miles. The bridge consists of five lanes in each direction with three-foot offsets from the bridge parapets. The right-most lane in each direction is an auxiliary lane between the George Washington Memorial Parkway and Clara Barton Parkway interchanges. The existing typical section is shown in Figure B-2. 3. Maryland Capital Beltway – American Legion Bridge to I-270 West Spur Section 3 includes the portion of the Capital Beltway in Maryland between the American Legion Bridge and the I-270 West Spur, a distance of 3.6 miles. This section generally consists of four mainline lanes in each direction; however, there are auxiliary lanes at several locations in both directions (five lanes are provided in each direction between the American Legion Bridge and the Clara Barton Parkway interchange). Additional auxiliary lanes are also provided between the MD 190 and I-270 West Spur interchanges. This section includes the Clara Barton Parkway, MD 190 / Cabin John Parkway, and I-495 / I-270 West Spur interchanges. The existing typical section is shown in Figure B-3.

Not to scaleFigureDate
JULY 2009
WEST SIDE MOBILITY STUDYB
E L T W AY
CAPITAL
MARYLAND
V I R G I N I A
270INTERSTATE
146'
12'
Shldr.
12'
Shldr.
12'
Shldr.
12'
Shldr.
48'
4 x 12' GP Lanes
48'
4 x 12' GP Lanes
2' Median
EXISTING TYPICAL SECTION -VIRGINIA CAPITAL BELTWAY
NOTES
• There is a 3-lane CD Road along the outer loop between the George Washington Parkway and SR 193. B-1

Not to scaleFigureDate
JULY 2009
WEST SIDE MOBILITY STUDYB
E L T W AY
CAPITAL
MARYLAND
V I R G I N I A
270INTERSTATE
134'
3' Offset3' Offset 3' Offset3' Offset
60'
5 x 12' GP Lanes
60'
5 x 12' GP Lanes
2' Median
EXISTING TYPICAL SECTION -AMERICAN LEGION BRIDGE
B-2

Not to scaleFigureDate
JULY 2009
WEST SIDE MOBILITY STUDYB
E L T W AY
CAPITAL
MARYLAND
V I R G I N I A
270INTERSTATE
138'
10'
Shldr.
10'
Shldr.
10'
Shldr.
10'
Shldr.
48'
4 x 12' GP Lanes
48'
4 x 12' GP Lanes
2' Median
EXISTING TYPICAL SECTION -MARYLAND CAPITAL BELTWAY
B-3

WEST SIDE MOBILITY STUDY
July 2009 8
4. I-270 West Spur Section 4 includes the I-270 West Spur between the Capital Beltway and I-270 mainline, a total distance of 1.5 miles. The section generally consists of three lanes in each direction, but an auxiliary (fourth) lane is provided in the southbound direction between the Y-Split and Democracy Boulevard interchanges. The left lane is designated as a peak period HOV lane, southbound in the AM and northbound in the PM. This section includes the Democracy Boulevard and Westlake Terrace interchanges. The Westlake Terrace interchange only provides north-oriented direct access ramp to/from the HOV lanes. The existing typical section is shown in Figure B-4. 5. I-270 Mainline Section 5 includes the I-270 mainline between the I-270 Spurs and the I-370 interchange, a distance of 7 miles. The section can be subdivided between CD Road and non-CD Road portions. The non-CD Road portion extends from the Y-Split interchange to just south of the Montrose Road interchange and generally consists of six lanes in each direction. The CD Road portion extends from just south of the Montrose Road interchange through the I-370 interchange and generally consists of four mainline lanes and two CD Road lanes in each direction. The CD Road is separated from the mainline by a concrete traffic barrier. The left mainline lane in each direction is designated as a peak period HOV lane, southbound in the AM and northbound in the PM. This section includes the Y-Split, Montrose Road, MD 189, MD 28, Shady Grove Road, and I-370 interchanges. The existing typical section is shown in Figure B-5. 6. I-270 – East Spur Section 6 includes the I-270 East Spur between the Capital Beltway and the I-270 mainline, a distance of 2.2 miles. The section generally consists of three lanes in each direction, but an auxiliary (fourth) lane is provided in both directions between the Y-Split and Rockledge Drive interchanges. The left lane is designated as a peak period HOV lane, southbound in the AM and northbound in the PM. This section includes the Rockledge Drive and MD 187 interchanges. The existing typical section is shown in Figure B-6. 7. Traffic Conditions A feasibility / planning level traffic analysis was performed for the existing (year 2006), 2030 No-Build, and 2030 Long-Term Build Alternatives to evaluate the current conditions and the proposed managed lane system to connect the Virginia HOT lanes to the ICC and to the I-270 Multi-Modal Corridor Study. The existing and No-Build analyses are discussed in this section and the 2030 Build analyses are discussed in Chapter C, Long-Term Improvements. Traffic analyses were performed only for the mainline segments of I-495 between SR 193 in Virginia and the I-270 West Spur, then extending along the I-270 West Spur and along I-270 to the I-370 Interchange. Due to the preliminary nature of the study, ramp merges, diverges, and

Not to scaleFigureDate
JULY 2009
WEST SIDE MOBILITY STUDYB
E L T W AY
CAPITAL
MARYLAND
V I R G I N I A
270INTERSTATE
118' - 126'
10'
Shldr.
10'
Shldr.
16'
Shoulder
16'
Shoulder
12'
HOV Ln.
12'
HOV Ln.
24'
2 x 12' GP Lanes
24'
2 x 12' GP Lanes
2' Median
NOTES• Additional SB lane from 'Y' split to Democracy Blvd.
Narrow Paved Shoulder (2') fromDemocracy Blvd. to I-495 Merge
EXISTING TYPICAL SECTION -I-270 WEST SPUR
B-4

Not to scaleFigureDate
JULY 2009
WEST SIDE MOBILITY STUDYB
E L T W AY
CAPITAL
MARYLAND
V I R G I N I A
270INTERSTATE
186'
10'
Shldr.
10'
Shldr.
10'
Shldr.
10'
Shldr.
12'
HOV Ln.
12'
HOV Ln.
60'
5 x 12' GP Lanes
60'
5 x 12' GP Lanes
2' Median
'Y' SPLIT TO MONTROSE ROAD
214'
10'
Shldr.
10'
Shldr.
10'
Shldr.
10'
Shldr.
10'
Shldr.
10'
Shldr.
12'
HOV Ln.
12'
HOV Ln.
24'
2 x 12' CD Lanes
36'
3 x 12' GP Lanes
36'
3 x 12' GP Lanes
24'
2 x 12' CD Lanes
2' Median 2' Barrier2' Barrier 2' Offset2' Offset
MONTROSE ROAD TO I-370
EXISTING TYPICAL SECTION -I-270 MAINLINE
B-5

FigureDate
JULY 2009
BE L T W A
Y
CAPITAL
MARYLAND
V I R G I N I A
Not to scale
WEST SIDE MOBILITY STUDY 270INTERSTATE
114'
10'
Shldr.
10'
Shldr.
10'
Shldr.
10'
Shldr.
12'
HOV Ln.
12'
HOV Ln.
24'
2 x 12' GP Lanes
24'
2 x 12' GP Lanes
2' Median
EXISTING CONDITIONS
EXISTING TYPICAL SECTION -
I-270 EAST SPUR
B-6

WEST SIDE MOBILITY STUDY
July 2009 9
weave analyses were not performed. In addition, no traffic analyses were completed for the I-270 East Spur. Traffic Analysis Methodology Capacity analyses for all mainline freeway segments were conducted using the methodology presented in the 2000 Highway Capacity Manual (HCM). Specifically, the volume/capacity (v/c) ratio and corresponding Level of Service (LOS) were calculated for each mainline segment within the project area. The assumptions used in calculating the capacity thresholds in HCS are shown in Table B-1. The assumptions were applied for existing (2006), 2030 No-Build and all 2030 Build Alternatives. Table B-1: HCS Assumptions
Parameter Value used in HCS I-270 Mainline from I-495 (including I-270 East and West Spurs) to I-370: 70 mph I-270 CD lanes: 60 mph I-495 from VA 193 to I-270 West Spur: 70 mph
Free-flow Speed
Loop Ramps: 30 MPH; (25 MPH for I-495 interchanges) Directional Ramps: 50 MPH
Peak-Hour Factor (PHF) 0.95
Terrain Type Level terrain for the entire project limits
Percent RVs 0% (Assuming RVs are included as part of % trucks/buses)
Driver Population Factor 1.00
Interchange Density 1.00 interchange/mile
Interstate Highway Designation Urban freeway
The free-flow speeds were based on speed data that had been collected as part of SHA’s Capital Beltway CORSIM Study. For that project, free flow speeds were obtained using GPS along the entire Maryland portion of the Beltway and also along the southern portion of I-270. Based on concerns expressed by SHA’s Office of Traffic and Safety and Travel Forecasting Division, the Peak Hour Factor (PHF) value of 0.95 was closely examined. Due to the lack of 15-minute data for the traffic volume collected along I-495 and I-270, a sensitivity analysis was performed to assess the validity of the assumed value. The analysis revealed that in general, the v/c ratio is linearly correlated to PHF. For more congested sections of I-495 and I-270, the change in v/c ratio for a change in PHF is 1 to 1 (i.e. a 10% increase in PHF decreases the v/c ratio by 10%). However, for less congested sections, a 10% increase in PHF decreases the v/c ratio in the range of 4 to 5%. The variation in v/c ratios for PHF values greater than or less than 0.95 is within 2 to 6% of the v/c ratios obtained by choosing the traditional PHF value of 0.95.
WEST SIDE MOBILITY STUDY
July 2009 10
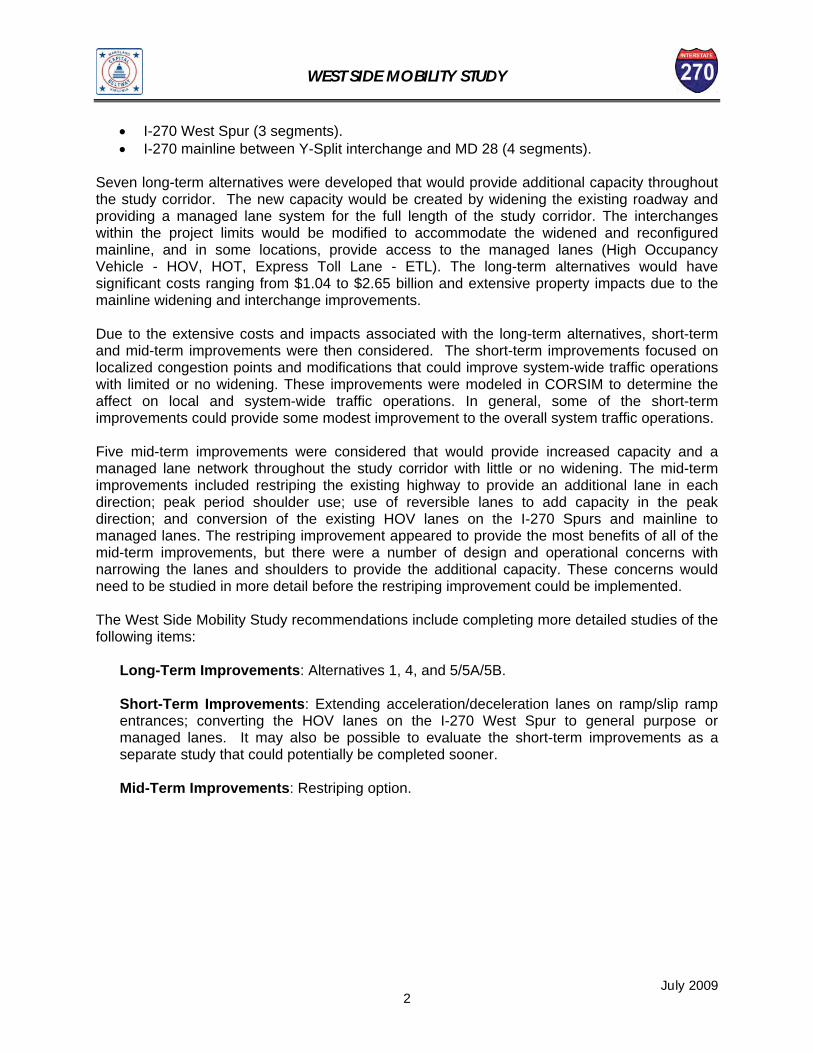
Hence, choosing a PHF value of 0.95 was considered appropriate for both congested and non-congested sections of I-495 and I-270. SHA’s Travel Forecasting Division confirmed that the 0% RV assumption is reasonable for this analysis and is consistent with the assumptions for the I-270 Multi-Modal Corridor Study. The percentage of trucks and buses along the mainline during the AM and PM peak periods are shown in Table B-2. These values were obtained based on 48-hour traffic counts conducted along I-270 within the project limits in March and August 2006. Since, there are no truck restrictions in the managed lanes (build alternatives), the truck percentages within the managed lanes were assumed to be the same as the corresponding section of general purpose lanes. The percentage of trucks and buses along the ramps were based on the corresponding mainline section. For example, for all interchanges along the I-495 inner loop, the percentage of trucks/buses assumed for all entry and exit ramps during AM Peak is 6%, the same truck percentage are shown in Table B-2 for the general purpose lanes of the inner loop.
Table B-2: Percentage of Trucks and Buses
Existing (2006), 2030 No-Build, Build Alternates 1-5 AM Peak1 PM Peak2
Location GPL ETL GPL ETL I-495 Inner Loop 6% 6% 7% 7% I-495 Outer Loop 7% 7% 5% 5%
I-270 NB 8% 8% 5% 5% I-270 SB 6% 6% 5% 5%
I-270 West Spur NB 5% 5% 5% 5% I-270 West Spur SB 5% 5% 5% 5% I-270 East Spur NB 8% 8% 5% 5% I-270 East Spur SB 6% 6% 5% 5%
GPL = General Purpose Lane ETL = Express Toll Lane 1 6 to 9 AM 2 4 to 7 PM Existing Traffic Year 2006 is considered the existing condition for purposes of this study. The traffic volumes for the existing condition, which are based on traffic counts conducted along I-270. Along I-270 from south of Montrose Road to north of I-370, there are general purpose (GP), High Occupancy Vehicle (HOV), and Collector-Distributor (CD) lanes. Based on Year 2005 traffic data collected along I-270 at various locations between Montrose Road and I-370, the percentage of the total volume between the GP, HOV and CD Road lanes was calculated. The I-270 HOV/GP/CD Road volume distributions are shown in Tables B-3A and B-3B on the next page.

WEST SIDE MOBILITY STUDY
July 2009 11
Table B-3A: I-270 Northbound HOV/GP/CD Volume Distributions
Existing (2006) AM Peak1 PM Peak2
GP CD HOV GP CD Montrose Rd. to MD 189 66% 34% 14% 52% 34% MD 189 to MD 28 67% 33% 14% 56% 30% MD 28 to Shady Grove Rd. 56% 44% 12% 53% 35% Shady Grove Rd. to I-370 57% 43% 10% 44% 46%
1 6 to 9 AM 2 4 to 7 PM Table B-3B: I-270 Southbound HOV/GP/CD Volume Distributions
Existing (2006) AM Peak1 PM Peak2
HOV GP CD GP CD I-370 to Shady Grove Rd. 15% 63% 22% 59% 41% Shady Grove Rd. to MD 28 13% 58% 29% 75% 25% MD 28 to MD 189 12% 56% 32% 66% 34% MD 189 to Montrose Rd. 12% 50% 38% 60% 40%
1 6 to 9 AM 2 4 to 7 PM To calculate the volume/capacity ratios for the segments along I-270 and I-495 within the project limits, the adjusted capacity thresholds were calculated using HCS+. The capacity thresholds were calculated for GP and CD Road lanes for truck percentages ranging from 5 to 8 percent (in accordance with the truck percentage values identified in Table B-2). Since trucks over 5 tons gross vehicle weight are prohibited in the HOV lanes, the thresholds calculated for the HOV lanes are based on zero percent trucks. For the HOV lane(s), thresholds were calculated for one and two lane scenarios. For CD Road lanes, thresholds were calculated for one to three-lane scenarios. For GP lanes, thresholds were calculated for two to six-lane scenarios. To calculate the threshold for a single lane (HOV or CD Road lane), a two-lane facility was assumed and speed reductions were applied based on two-lane highway methodology assuming 100 percent no-passing zones. Then the corresponding throughput was divided by two to determine a single lane throughput. The LOS values associated with the capacity thresholds were also identified. The LOS boundaries are based on HCM Freeway methodology. The capacity thresholds and related LOS values for the existing condition are shown in Table B-4. The total volume; the volume distribution between the HOV, general purpose, and CD Road lanes; the v/c ratios; and LOS values for various freeway segments along I-270 and I-495 within the limits of the project under the existing (2006) condition are shown in Table B-5. The existing typical sections for each highway segment are shown in Figures B-1 through B-6.

WEST SIDE MOBILITY STUDY
July 2009 12
As shown in Table B-5, several segments of the mainline operate at LOS E or F during the peak period based on the existing highway capacity constraints. In the southbound direction, during the AM peak period, these segments include:
• I-495 from Cabin John Parkway to MD 190 (LOS F) • I-270 West Spur from I-270 West Spur / I-495 split to Democracy Boulevard (LOS F) • I-270 mainline from Shady Grove Road to I-370 (LOS E).
In the northbound direction, during the PM peak period, these segments include:
• Entire West Spur (LOS F) • I-270 mainline from Montrose Road to MD 28 (LOS E or F).
2030 No Build Year 2030 was considered the future year in which the No-Build and Build (long-term) Alternatives would be analyzed. These volumes were based on the Land Use 7.0 forecast. As a point of comparison, the I-270 Multi-Modal Corridor Study was based on the Land Use 6.4a forecasts. In addition, the traffic volumes for the No-Build and Build Alternatives are based on the assumption that the 2030 Build 2+1 condition for the I-270 Multi-Modal Corridor Study will be in place (i.e., two Express Toll Lanes (ETL) per direction along I-270 in Montgomery County from I-370 to the north and one ETL per direction along I-270 in Frederick County to I-70). The capacity thresholds and related LOS values for the 2030 No-Build are shown in Table B-4. The total volume; the volume distribution between the HOV, general purpose, and CD Road lanes; the v/c ratios; and LOS values for various freeway segments along I-270 and I-495 within the limits of the project under the 2030 No-Build condition are shown in Table B-6. In 2030, there would be congestion and bottlenecks in both directions during the peak periods. In the southbound direction, during the AM peak, there would be bottlenecks on the following segments:
• I-495 between Cabin John Parkway and MD 190 • I-270 West Spur between I-495 and Democracy Boulevard.
Six out of 13 highway segments between interchanges would be failing in the southbound direction. In the northbound direction, during the PM peak, there would be bottlenecks on the following segments:
• I-495 between Clara Barton Parkway and Cabin John Parkway • I-270 West Spur between I-495 and Democracy Boulevard • I-270 mainline between MD 189 and MD 28
Nine of the 13 highway segments between interchanges would be failing in the northbound direction.

WEST SIDE MOBILITY STUDY
July 2009 13
Table B-4: Capacity Thresholds for HOV, GP, CD Lanes – Existing and 2030 No-Build
0.95 0.95 0.950 5 1
70 70 60Level Level Level
Unadjusted Capacity 2,400 Unadjusted Capacity 2,400 Unadjusted Capacity 2300HCS LOS Thresholds HCS LOS Thresholds HCS LOS Thresholds Adjusted Flow Rates Adjusted Flow Rates Adjusted Flow Rates
1 2 LOS 2 3 4 5 6 LOS 1 2 3 LOS0 0 A 0 0 0 0 0 A 0 0 0 A
715 1429 B # 1429 2144 2858 3573 4288 B 625 1249 1872 B1112 2337 C # 2337 3506 4675 5844 7012 C 1022 2043 3063 C1596 3283 D # 3283 4924 6566 8207 9848 D 1476 2951 4425 D1986 3987 E # 3987 5981 7974 9968 11962 E 1909 3817 5723 E2233 4451 F # 4451 6676 8901 11127 13352 F 2175 4350 6522 F
0.95 0.95 0.950 6 1
70 70 60Level Level Level
Unadjusted Capacity 2,400 Unadjusted Capacity 2,400 Unadjusted Capacity 2300HCS LOS Thresholds HCS LOS Thresholds HCS LOS Thresholds Adjusted Flow Rates Adjusted Flow Rates Adjusted Flow Rates
1 2 LOS 2 3 4 5 6 LOS 1 2 3 LOS0 0 A 0 0 0 0 0 A 0 0 0 A
680 1422 B # 1422 2133 2844 3556 4267 B 625 1249 1872 B1112 2326 C # 2326 3489 4652 5815 6978 C 1022 2043 3063 C1596 3267 D # 3267 4900 6534 8167 9801 D 1476 2951 4425 D1986 3968 E # 3968 5952 7936 9920 11904 E 1909 3817 5723 E2233 4429 F # 4429 6644 8858 11073 13287 F 2175 4350 6522 F
0.95 0.95 0.950 7 1
70 70 60Level Level Level
Unadjusted Capacity 2,400 Unadjusted Capacity 2,400 Unadjusted Capacity 2300HCS LOS Thresholds HCS LOS Thresholds HCS LOS Thresholds Adjusted Flow Rates Adjusted Flow Rates Adjusted Flow Rates
1 2 LOS 2 3 4 5 6 LOS 1 2 3 LOS0 0 A 0 0 0 0 0 A 0 0 0 A
680 1415 B # 1415 2123 2831 3538 4246 B 625 1249 1872 B1112 2315 C # 2315 3472 4630 5787 6945 C 1022 2043 3063 C1596 3251 D # 3251 4877 6502 8128 9753 D 1476 2951 4425 D1986 3949 E # 3949 5923 7897 9872 11846 E 1909 3817 5723 E2233 4408 F # 4408 6611 8815 11019 13223 F 2175 4350 6522 F
0.95 0.95 0.950 8 1
70 70 60Level Level Level
Unadjusted Capacity 2,400 Unadjusted Capacity 2,400 Unadjusted Capacity 2300HCS LOS Thresholds HCS LOS Thresholds HCS LOS Thresholds Adjusted Flow Rates Adjusted Flow Rates Adjusted Flow Rates
1 2 LOS 2 3 4 5 6 LOS 1 2 3 LOS0 0 A 0 0 0 0 0 A 0 0 0 A
680 1409 B # 1409 2113 2817 3521 4226 B 625 1249 1872 B1112 2304 C # 2304 3456 4608 5759 6911 C 1022 2043 3063 C1596 3235 D # 3235 4853 6471 8089 9706 D 1476 2951 4425 D1986 3930 E # 3930 5895 7859 9824 11789 E 1909 3817 5723 E2233 4386 F # 4386 6580 8773 10966 13159 F 2175 4350 6522 F
Measured FF Speed Measured FF SpeedTerrain Terrain Terrain
%Trucks %Trucks %Trucks
GP
Measured FF Speed
PHF
HCS Assumptions and Calculated Maximum Flow Rates By LOS Threshold - 8% Trucks
Terrain Terrain
PHF PHF
%Trucks %Trucks %Trucks
HOV CD
Measured FF Speed Measured FF Speed Measured FF SpeedTerrain
HCS Assumptions and Calculated Maximum Flow Rates By LOS Threshold - 7% TrucksHOV GP CD
PHF PHF PHF
GPPHF
HOV CDHCS Assumptions and Calculated Maximum Flow Rates By LOS Threshold - 5% Trucks
%TrucksMeasured FF Speed
Terrain
PHFPHF%Trucks %Trucks
Measured FF SpeedTerrain
Measured FF SpeedTerrain
HCS Assumptions and Calculated Maximum Flow Rates By LOS Threshold - 6% TrucksHOV GP CD
PHF PHF PHF%Trucks %Trucks
Measured FF Speed Measured FF Speed Measured FF Speed%Trucks
Terrain Terrain Terrain

WEST SIDE MOBILITY STUDY
July 2009 14
Table B-5: Capacity Calculations – Existing Conditions
# LanesResulting
Vol.HCS Adj. Capacity v/c LOS # Lanes
ResultingVol.
HCS Adj. Capacity v/c LOS # Lanes
ResultingVol.
HCS Adj. Capacity v/c LOS # Lanes
ResultingVol.
HCS Adj. Capacity v/c LOS # Lanes
ResultingVol.
HCS Adj. Capacity v/c LOS # Lanes
ResultingVol.
HCS Adj. Capacity v/c LOS
# Lanes Vol. Capacity v/c LOS # Lanes Vol. Capacity v/c LOS # Lanes Vol. Capacity v/c LOS # Lanes Vol. Capacity v/c LOS # Lanes Vol. Capacity v/c LOS # Lanes Vol. Capacity v/c LOS
Assumption for Truck Percentages: Assumption for Truck Percentages:AM Peak PM Peak AM Peak PM Peak
I-495 6% 7% I-495 7% 5%I-270 Spur 5% 5% I-270 Spur 5% 5%I-270 8% 5% I-270 6% 5%
B0.70 C
0.00 A
3 24%
0.00
8,550
6,100
HOV
1,944 6,522 0.30
AI-270 Y-Split I-495
- 2,233 0.00 AA
Rockledge Drive MD 187
4,429 88% -
2 88% - 4,429
100% - 6,580 0.00
0.003 100% - 6,580
- 4,429 0.00A 2
1 12%
0.00 21
- 2,233 0.00
A
88%
12% - 2,233
1 AMD 187
Rockledge Drive
3
12%I-270 Y-Split
3 100% - 6,580 0.00 A
A
C 8,100 4 76% 6,156 8,815 VA 193
8,773 0.37
4,350 0.79
B 2 43% 2,473 4,350 0.57
9,025 11,019 0.82 DShady Grove Road
George Washington
5,750 4 57% 3,278
8,773 0.50
4,350 0.69
D 9,025 B 2 44% 3,432
8,050 8,815 0.91 EMD 28
Clara Barton Parkway
7,800 4 56% 4,368
8,773 0.70
4,350 0.71
D 8,050 C 2 33% 3,020
9,700 8,815 1.10 FMD 189
Cabin John Parkway
9,150 4 67% 6,131
8,773 0.68
0.69
D 9,700 C 2 34% 3,094
9,650 11,019 0.88 DMontrose Road MD 190
9,100 4 66% 6,006
9,650 5 100%
4 100%
4 100%
5 100%
CI-270 Y-Split
I-495/I-270 West Spur
9,125 6 100% 9,125 13,159
0.66 C B 2 F87% 4,698 4,451 1.065,400 1 13% 702 2,233 0.31
Democracy Boulevard
4,425 3 100% 4,425 6,676
0.28 A 3 C87% 4,111 6,676 0.62
10,725
2,233
1,404 2,233
13% 1,261
6,644
West Lake Terrace
3,750 3 100% 3,750 6,676 0.56 C 4,725
0.31 B 0.70 C3 87% 4,698 6,676
#'s
in R
ed a
re fr
om F
ield
Cou
nts,
#'s
in B
lack
are
ass
umed
63%
702 2,233
1 13% 614 #'s
in R
ed a
re fr
om F
ield
Cou
nts
#'s
in B
lack
are
ass
umed
15% 1,478
12% 1,293
4,875
MD 190Montrose
Road
6,676 0.73 CDemocracy Boulevard
8,875 11,073 0.80 0.63 CI-495/I-270 West Spur I-270 Y-Split
4,875 3 100%
Interchange
AM Peak Period - Northbound (2006 Existing)
TotalVolume
HOV GP Lanes CD Lanes
% of Tot% of Tot
(2006 Count)% of Tot
(2006 count)
I-495A
MD 1873 100% - 0.00
A100% -
6,676
A100% - 6,676 0.00
6,676 0.00
I-270 Y-Split3Rockledge
Drive3
Interchange
AM Peak Period - Southbound (2006 Existing)HOV GP Lanes CD Lanes
% of Tot (2006 Count)
% of Tot (2006 Count)
% of Tot (2006 Count)
Total Volume
VA 193 I-3709,150 5
#'s
in R
ed a
re fr
om F
ield
Cou
nts,
#'s
in B
lack
are
ass
umed
100% 9,150 11,073 0.83 1Shady Grove Road
9,700 1MD 28
10,775 1
-
2 88% -
D 9,850
D
D
5 100%
A 2
0.00 A
88%
I-270 Y-Split
- 2,233
- 2,233
0.00 AMD 187
1 12%Rockledge Drive
1 12%
- 4,451 0.00 A
4,451 0.00 A
4,451 0.00
0.00
GW Parkway8,975
A 2 88%
8,875
West Lake Terrace
I-370
I-495
I-4951 12% - 2,233
2,233 C 3
0.56 C 3
0.66
2,233
0.33 B
D 2 29%
E 3 22%6,206 2,167 6,522
E 2 32%
0.93
6,034 6,644 0.91
5 100%Clara Barton Parkway
8,225 4 100%Cabin John Parkway
8,525
8,975 11,073 0.81 D
% of Tot
4 3,599 8,901 B
2,233
58% 5,626 6,644 0.85 2,813 4,350 0.65 C
8,225 8,858 0.93 E 0.58 C 3 4,350
D 4,076 4,350 50% 5,363 6,644 0.81 38%
56%MD 189
5 100% 8,525 11,073 0.77 2,233 0.58 C
10,800
1 12%
1 13% 9,396
0.79
11,019
7,450 11,019
1,287
5,400 1 13%
% of Tot
PM Peak Period - Southbound (2006 Existing)
B
PM Peak Period - Northbound (2006 Existing)HOV
% of Tot (2006
0.68 C
TotalVolume % of Tot % of Tot
7,900
I-370Shady Grove
Road
GP Lanes
4 5,325
0.40
7,100
59%
% of Tot
0.383
0.60 C
41% 6,522 2,501
2 1,775 B
D3,448
0.94 E
7,900
5 100% 9,150
4 100%
0.788,550 GW Parkway
VA 1935 100%7,450
#'s
in R
ed a
re fr
om F
ield
Cou
nts,
#'s
in B
lack
are
ass
umed5 100%
Interchange
Clara Barton Parkway
MD 190I-495/I-270 West Spur
5,350 1 12% 642 2,233
D 4,350 0.41MD 28
4,350 0.63
25%
34%
8,901 75%
2 2,754 5,346 8,901 8,100
4,860 8,100
4 66%
Montrose Road
11,019 0.83 D 6
0.90 E CCabin John Parkway MD 189
5 100% 9,050 11,019 0.82 D 0.74 D8,901 0.55 C 2 3,240 4,350 40%
8,901 0.44West Lake Terrace
3,250 8,901 3,250 4
0.29 A 2 88%I-270 Y-Split
4
4,300
#'s
in R
ed a
re fr
om F
ield
Cou
nts,
#'s
in B
lack
are
ass
umed
4,708 4,451 1.06 F 3,900
8,815
60%4
100%88% 4,444 4,451 1.00 Democracy Boulevard
5,050 1 12% 606 2,233 0.27 A
F
2West Lake Terrace
I-495/I-270 West Spur
5,750 1 12% 690 2,233 0.31
E
Democracy Boulevard
5 88% 10,208
1.1488% 5,060 4,451 AI-270 Y-Split
MD 19011,600 1 12% 1,392 2,233 0.62
2
C
100%
100%
E
0.74100% 11,127 8,200
0.90
3
7,500 13,352 0.56
11,127 0.92 E
6,676
8,200
4,300
5
8,901
11,127
8,901
George Washington
4 5,655
8,150
7,550
100%Cabin John Parkway
48,050 4,350
Clara Barton Parkway
4
5
E
E
E
52% 6,578 6,676
0.89
0.99 E
4,350
4,301
30%
0.991,771 2,233 0.79 D 3 8,050 2 34%
3,885 12,950 1 14% 1,813
C8,150
7,550
100%
0.85100%D 23 56% 7,252 6,676 1.09 F
5 87% 11,073 0.85 D
2
C
0.64 C
C
6,676
3
0.73
8,700
100%
C 35%0.64
D
B
0.37 B
MD 28
VA 193
11,350 1 12% 1,362 2,233 0.61
2,233 0.81
3 53% 6,016
0.47 B8,901 365% 6,522 3,045 0.49 B 1.163 4,840 6,676 0.72
Shady Grove Road
11,000 1 10%
#'s
in R
ed a
re fr
om F
ield
Cou
nts
#'s
in B
lack
are
ass
umed
MD 189
Montrose Road
12,650 1 14%
FI-370
C 2 46% 5,060 44%1,100 2,233 4,350
35%
9,050
9,150
3,973 4,350 0.91E0.90 2C
3,900
7,500 C
0.60
GP Lanes CD Lanes Total Volume
CD LanesInterchange

WEST SIDE MOBILITY STUDY
July 2009 15
Table B-6: Capacity Calculations – 2030 No-Build Condition
# LanesResulting
Vol.HCS Adj. Capacity v/c LOS # Lanes
ResultingVol.
HCS Adj. Capacity v/c LOS # Lanes
ResultingVol.
HCS Adj. Capacity v/c LOS # Lanes
ResultingVol.
HCS Adj. Capacity v/c LOS # Lanes
ResultingVol.
HCS Adj. Capacity v/c LOS # Lanes
ResultingVol.
HCS Adj. Capacity v/c LOS
# LanesResulting
Vol.HCS Adj. Capacity v/c LOS # Lanes
ResultingVol.
HCS Adj. Capacity v/c LOS # Lanes
ResultingVol.
HCS Adj. Capacity v/c LOS # Lanes
ResultingVol.
HCS Adj. Capacity v/c LOS # Lanes
ResultingVol.
HCS Adj. Capacity v/c LOS # Lanes
ResultingVol.
HCS Adj. Capacity v/c LOS
Assumptions for Truck Percentages: Assumptions for Truck Percentages:AM Peak PM Peak AM Peak PM Peak
I-495 6% 7% I-495 7% 5%I-270 Spur 5% 5% I-270 Spur 5% 5%I-270 8% 5% I-270 6% 5%
10,825
TotalVolume
- 6,676 0.00
0.57 C1
Interchange
AM Peak Period - Northbound (2030 No Build)
% of Tot (2006 Count)
% of Tot (2006 count)
HOV GP Lanes CD Lanes
% of Tot (2006 Count)
TotalVolume
I-270 Y-Split3 100%Rockledge
Drive3 100%
- 2,233
12% - 2,233
12%
88% - 4,429 0.00 A
100% 8,525 8,858 0.96
- 4,429 0.00 A
A4,429 0.00
2,233 0.58
50% 5,500
87%
6,644
9,831 11,073 0.66
0.83
C
100% 9,250 11,073 0.84
100% 9,200 11,073 0.83
1,299
MD 190
Clara Barton Parkway
Montrose Road
9,200 D5
5
10,300
15% 1,613 2,233
13% 1,469 2,233
13% 1,268 2,233
12%
A
0.00 A
0.00 A 2
88%
-
2
2 88%
100% 5,050 6,676 0.76
6,676 0.74
2,233 0.00- 12%
44% 3,454 4,350
1I-270 Y-SplitRockledge
Drive
MD 187
I-4951
6 100% 9,475
1
4,350 2 33%
13,159 0.72
2
A
0.00 A
2
11,019 0.89
4 100%
0.00
A
5
5 100%
4,350 2 34%
2,655 43%
3,145
4,350
D
D
88%
12% - 2,233
0.0012% - 2,233
12% - 2,233 88%
A
A
- 4,451 0.00
4,451 0.00-
9,875 11,019
6,676 0.90
6,676 1.11
I-270 Y-Split
1
1
1
6,747
6,029
7,434
52%14%
- 6,580
11,019
8,250 0.94
0.87
3 100%
3 100%I-270 Y-Split
MD 1909,550
Democracy Boulevard
VA 193
I-495
MD 187Rockledge
Drive0.00
11,019
0.90
GP Lanes
-
A
0.00 A
8,815
9,350
0.00 A
0.30
100%
HOV
D0.85
E
666
6,580
0.35
0.81
0.96
6,676
5,742 4,451
10,692 11,127
2
1.01
46%
2F
0.83 3 56% 2F
3 34% 4,412 4,350
3,983
% of Tot (2006 Count)
3
56%
6,125 1
% of Tot (2006 Count)
GP Lanes CD Lanes
Interchange
AM Peak Period - Southbound (2030 No Build)
#'s
in R
ed a
re fr
om F
ield
Cou
nts,
#'s
in B
lack
are
ass
umed
63% 6,773 10,750 1
HOV
% of Tot (2006 Count)
VA 193 I-37011,475 F5 100% 11,475 11,073 1.04
GW Parkway58% 5,655
32%6,644 0.91 E 2
D
6,644 1.02 F 3Shady Grove Road
MD 28
0.72 D
3
1
E100% 10,300 11,073 0.935
0.36 B
4 6,062
9,750
3,464
2
E
0.65 C
C 3 4,350
6,644 0.85
Cabin John Parkway MD 189
38% 4,180 2,233 0.59 C
#'s
in R
ed a
re fr
om F
ield
Cou
nts
#'s
in B
lack
are
ass
umed
9,250 D
0.80 D
311,000 1 12% 1,320
8,525
4,350 0.96 E
11,300 1 5 0.89
6,522
29% 2,828 4,350
D
22% 2,365
D 2
0.80 DB 3 87% 5,329
5,350 1 13%
6,676 13% 796 2,233 0.36
696 2,233
I-495/I-270 West Spur
West Lake Terrace
5,050 D3Democracy Boulevard
I-270 Y-Split
100% 4,200 6,676 0.31 B 0.70 C3 87% 4,655 6,676 Democracy Boulevard
4,200 C3 0.63
4,950 D3 100% 4,950 B 25,600 1 13% 728
10,050
F87% 4,872 4,451 1.092,233 0.33
E
Clara Barton Parkway
7,695
1.20
5 100% 10,050
10,550
0.94
11,019 0.91
4 100%
8,815 10,550 4
8,815 MD 28
0.95
I-270 Y-Split
6,105 8,773 0.70
West Lake Terrace
I-495/I-270 West Spur
8,350
9,250 C 0.72 DMD 190
9,475 C
4 66% Cabin John Parkway
E10,350 5 100% 11,019
100%
E
F
10,350
8,350 C 0.71 D4 67% 6,231 8,773 0.71 3,069
#'s
in R
ed a
re fr
om F
ield
Cou
nts,
#'s
in B
lack
are
ass
umed
George Washington
C B0.87 D 3 24% 2,430 6,522 0.3710,125 4 76% 8,815 VA 193
7,850 4 56% 4,396 8,773 0.50 B 0.79 DShady Grove Road
6,175 4 57%I-370
Montrose Road
MD 1899,300
0.61
3 100% - 6,580
3,520 8,773 0.40 B
CD Lanes
% of Tot (2006 Count)Interchange
PM Peak Period - Northbound (2030 No Build)
% of Tot (2006 Count)
TotalVolume
% of Tot (2006 Count) Interchange
PM Peak Period - Southbound (2030 No Build)
% of Tot (2006 Count)
% of Tot (2006 Count)
% of Tot (2006 Count)
Total Volume
HOV GP Lanes CD Lanes
6,650
3,650
4,425
8,475
7,800
8,250
4
100%
59% 3,924
75% 5,325
66%
4
4I-370
8,901 0.44 B 3
8,901 0.60 C 2
#'s
in R
ed a
re fr
om F
ield
Cou
nts,
#'s
in B
lack
are
ass
umed
GW ParkwayShady Grove
Road9,850 D 7,100 4
5 100%
5 100% B
34% 2,805 4,350
0.42 B41% 2,727 6,522
25%
0.645,445 CCabin John Parkway MD 189
9,875 E 8,250
4
Clara Barton Parkway
40%8,901 0.56 C 2
0.61MD 28
8,901
9,850
Montrose Road
I-270 Y-Split4,375 4
7,800 6D
A F2
5,038 4,451 1.13
88%0.65 5
2,233
D3,300 4,350 0.76
Democracy Boulevard
1.29
60%
4,350
B100% 4,375 8,901 0.49
4,950
13,352 0.58 C
B100% 3,650 8,901 0.41
1,775
C 2
0.41
9,350
5,725 1
8,250
9,550
2 88%
5,550 1 1.10
12% 687 2,233
4,884 4,451 12%
0.31
88%
E
0.66
A F
3B F
West Lake Terrace
4,425 6,676
0.76
West Lake Terrace
I-495/I-270 West Spur
6,525 1 12% 783 2,233
2,233 C
8,901
5 100% 8,475 11,127
C100%
0.981,817 2,233
DI-270 Y-Split
MD 19012,150 1 12% 1,458
8,725 E8,725 4 100%
E
F
9,350 5George Washington
D
1.01
D100% 7,825 8,901 0.88
Cabin John Parkway
7,825 4Clara Barton Parkway
0.84
65%
13,275 1 14% 1,859 2,233
10,875 4
4,350
2,233
0.92 E
0.92
F
4,350
30%
0.61 C 3 53%
1.275,269 6,676 7,069 8,901
100% 9,350 11,127
2 0.79 D 3 35% 3,806 6,522 0.58 C
MD 28
VA 193
11,375 1 12% 1,365 Shady Grove Road
11,975 1 10%I-370
#'s
in R
ed a
re fr
om F
ield
Cou
nts
#'s
in B
lack
are
ass
umed
MD 189
Montrose Road
12,975 1
I-495/I-270 West Spur
1,198 2,233 0.54 C 3 44%
2Rockledge Drive
5,509 4,350 0.79
#'s
in R
ed a
re fr
om F
ield
Cou
nts,
#'s
in B
lack
are
ass
umed
D
35%
0.002 88% - 4,451
I-4952 88%
MD 187A
-
0.00
A
A
3,981 E 2
I-4956,676 0.00 A
- 6,676 MD 187
3 100%

WEST SIDE MOBILITY STUDY
July 2009 16
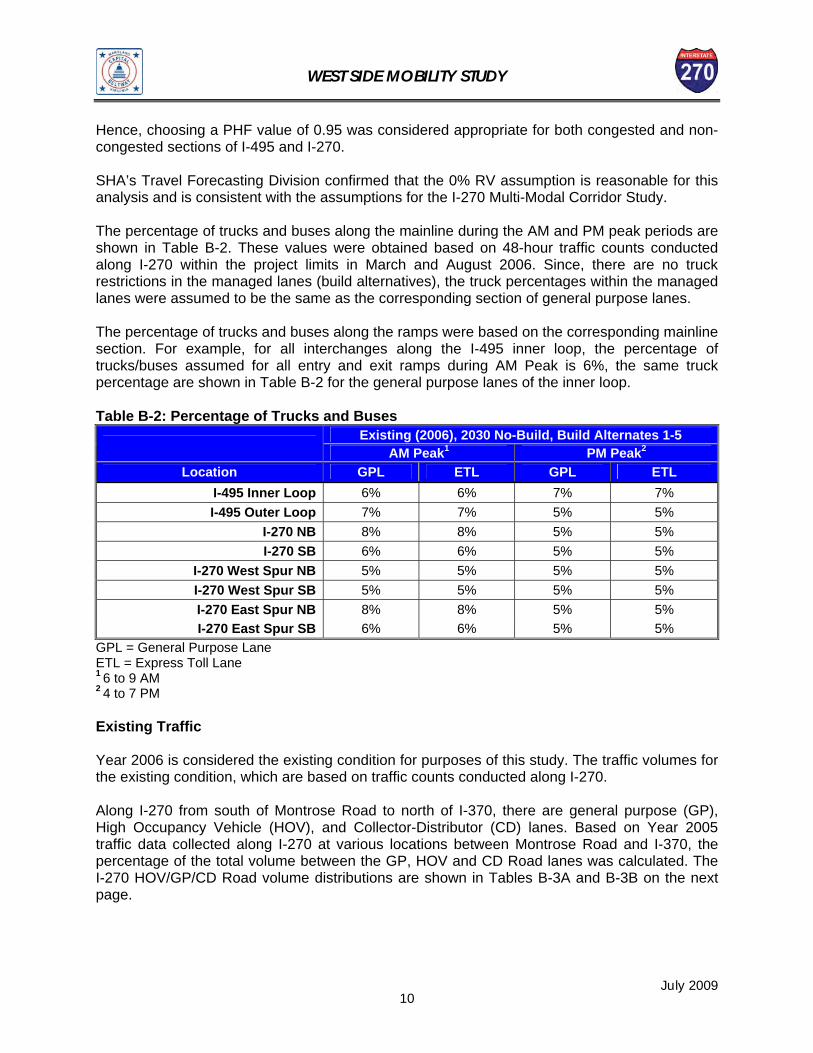
C. LONG-TERM IMPROVEMENTS 1. Introduction The long-term alternatives would provide permanent additional capacity throughout the study corridor. It was anticipated that this new capacity would be provided by widening the existing roadway and it would be operated as a managed lane system. The interchanges within the project limits would be modified to accommodate the widened and reconfigured mainline, and in some locations, they would provide direct access to the managed lanes. The managed lane (HOV, HOT, ETL) system would consist of one or two managed lanes in each direction and would connect the VDOT HOT lanes with the Express Toll (ETL) lanes planned as part of the I-270 Multi-Modal Corridor Study and the Intercounty Connector, which is currently under construction. 2. Range of Alternatives A wide array of options were considered for the long-term alternatives due to the variety of existing typical sections and constraints that exist within each section of the study area. Along the Capital Beltway, there were two proposed typical sections for the long-term alternatives: a one-lane and a two-lane managed system. However, the physical footprint for all of the alternatives was the same and it included widening for two lanes per direction in Virginia and widening for one lane per direction on the American Legion Bridge and in Maryland. The widening in Maryland was constrained by the right-of-way, proximity to sensitive environmental features, and proximity to adjacent residences. Along I-270 and the I-270 Spurs, all possible scenarios were briefly identified to determine the most feasible and viable typical sections to carry forward. Two matrices were developed to summarize these typical section scenarios and assist in justifying which options should be studied further. The matrices crossed the number of managed lanes, the location of the barrier, and the conversion of existing lane operations to present all of the possible options. The matrices are presented in Table C-1 and Table C-2. The matrices identify five alternatives that were selected for more detailed evaluation and provided justification for why particular options were not recommended to be studied further. After detailed development of the five selected alternatives, two additional alternatives, which were variations of Alternative 5, were also considered. All of these alternatives were evaluated based on lane configuration, traffic operations, impacts, and cost. The lane configurations by alternative and section are presented in Table C-3 and a detailed discussion of each alternative is summarized in the following sections.

WEST SIDE MOBILITY STUDY
July 2009 17
Table C-1: Matrix of Alternatives for I-270 Mainline 1-LANE MANAGED SYSTEM 2–LANE MANAGED SYSTEM
Convert Existing HOV Lane to Managed Lane
Convert Existing HOV and 1 GP Lane to Managed Lanes
Convert Existing HOV to Managed Lane and ADD 1 Managed Lane
REMOVE
Barrier Separated CD Road
Scenario A • 6 lanes (1 Managed & 5 GP) • Unnecessary to remove existing CD Road barrier • Most likely require 2-lane Managed Lane system
Scenario B • 6 lanes (2 Managed & 4 GP) • Would include barrier between Managed and GP lanes
(relocation of barrier between GP lanes and CD Road)
Scenario C • 7 lanes (2 Managed & 5 GP ) • Could use either a barrier or a buffer between the Managed
and GP lanes
MAINTAIN
Barrier Separated CD Road
Scenario D • 6 lanes (1 Managed & 3 GP & 2 CD) • Use buffer separation between Managed and GP • Conversion of HOV lane to Managed is only action required
Scenario E • 6 lanes (2 Managed & 2 GP & 2 CD) • Would include either barrier or buffer separations between
Managed and GP lanes • Poor use of existing pavement because of lane distribution
Scenario F • 7 lanes (2 Managed & 3 GP & 2 CD) • Could use either a barrier or a buffer between the Managed
and GP lanes
Note: Between Montrose Road and the Y-Split Interchange, where there is no existing CD Road, the No-Build Alternative would be 5 GP & 1 Managed and only Build Alternatives, (2) and (3) would be considered. Potential scenarios to carry forward:
Alternative #1: No Build Alternative #2: 2 Managed and 4 GP (move barrier separation from CD road to Managed Lanes) Alternative #3: with option 1 – 2 Managed and 5 GP (move barrier separation from CD road to Managed Lanes) Alternative #4: with option 3 – 2 Managed and 5 GP (move barrier separation from CD road to Managed Lanes) but provide reduced CD Road Alternative #5: with option 2 – 2 Managed and 3 GP and 2 CD (maintain CD barrier separation and NO separation for Managed Lanes)
Eliminate from further study because there is no need to
remove CD barrier if there are no changes to the typical section
Carry forward as No-Build ALTERNATIVE #1 Eliminate from further study because there
would only be 2 GP lanes
2 - without barrier between Managed and GP lanes
Carry forward as build alternative
ALTERNATIVE #5
1 - with barrier between Managed and GP lanes
Eliminate from
further study because it would have 3 separated
roadways
2 - without barrier between Managed and GP lanes
Eliminate from further
consideration because it would be narrower section
than existing
1 - With barrier between Managed and GP lanes
Carry forward as build
alternative ALTERNATIVE #2
2 - without barrier between Managed and GP lanes
Eliminate from
further study because it there would be no separation for 7
lanes
1 - with barrier between Managed and GP lanes
Carry forward as build alternative
ALTERNATIVE #3
3 - with barrier between Managed and GP lanes and Reduced CD road separation
Carry forward as build alternative
ALTERNATIVE #4

WEST SIDE MOBILITY STUDY
July 2009 18
Table C-2: Matrix of Alternatives for I-270 Spurs Convert Existing HOV Lane
to Managed Lane Convert Existing HOV and
1 GP Lane to Managed Lanes Convert Existing HOV to Managed Lane
and Add 1 Managed Lane
Scenario AA • 3 lanes (1 Managed & 2GP) • Use buffer separation between Managed and GP lanes • Conversion of HOV lane to Managed is only action required
Scenario BB • 3 lanes (2 Managed & 1 GP) • Reduces GP lanes to 1 per direction • Cannot have only 1 GP lane per direction
Scenario CC • 4 lanes (2 Managed & 2 GP) • Could use either a barrier or a buffer between the Managed
and GP lanes
Note: Along the SB I-270 West Spur, between the Y-Split Interchange and Democracy Boulevard, there are three GP lanes. In the No-Build Alternative, there would be three GP lanes and one Managed Lane. In the Build Alternative, there would be three GP lanes and two Managed Lanes. Potential scenario to carry forward:
(AA) No-Build (CC) Build Alternative with options 1 and 2
Carry forward as No-Build Eliminated from further study because only one GP lane would be provided in each
direction
Carry forward as build alternative with options 1 - with barrier between Managed and GP lanes 2 - without barrier between Managed and GP lanes

WEST SIDE MOBILITY STUDY
July 2009 19
Table C-3: Lane Configurations by Section (per direction) Section 1 Section 2 Section 3 Section 4 Section 5
I-270 (from Y-Split to I-370) (7 miles) Concept
Description Capital Beltway
Virginia (2.7 miles)
American Legion Bridge
(0.4 miles)
Capital Beltway Maryland (3.6 miles)
I-270 West Spur (1.5 miles) Existing - No CD
Y Split to Montrose Existing - With CD Montrose to I-370
Existing / No Build
HOV and GP lanes 4 GP 5 GP 4 GP 1 HOV 2 or 3 GP
1 HOV 5 GP
1 HOV 3 GP
Barrier Separation 2 CD
Alternative 1
1-ML with buffer between ML and GP in all Sections1
2 HOT or Transition Lanes
4 GP
Add 1 ML 5 GP
Add 1 ML 4 GP
Convert HOV to ML
2 or 3 GP
Convert HOV to ML 5 GP
Convert HOV to ML 3 GP
Barrier Separation 2 CD
Alternative 2 2-ML with barrier between ML and GP in Sections 4-5
Same as above
Add 1 ML Convert 1GP to
ML 4 GP
Add 1 ML Convert 1GP to
ML 3 GP
Convert HOV to ML
Barrier Separated 2 or 3 GP
Convert HOV to ML Convert 1 GP to ML Barrier Separation
4 GP
Convert HOV to ML Convert 1 GP to ML Barrier Separation
4 GP (remove existing separation between GP& CD)
Alternative 3
2-ML with barrier between ML and
GP in Sections 4-5
Same as above
Same as above
Same as above
Convert HOV to ML Add 1 ML
Barrier Separated 2 or 3 GP
Convert HOV to ML Add 1 ML
Barrier Separation 5 GP
Convert HOV to ML Add 1 ML
Barrier Separation 5 GP
Alternative 4
2-ML with barrier between ML and GP & buffer between GP and CD in Sections 4-5
Same as above
Same as above
Same as above
Same as above Same as above Convert HOV to ML Add 1 ML
Barrier Separation 3 GP
Buffer between GP & CD 2 CD
Alternative 5 Reduced A2 Reduced B3
2-ML by restriping 4-lane road to 5 lanes. Maintain barrier between CD and GP in
Section 5
Same as above
Same as above
Same as above
Same as above Convert HOV to ML Add 1 ML
5 GP
Convert HOV to ML Add 1 ML by restriping the
existing 4-lane road to 5 lanes 3 GP
Barrier Separated 2 CD
Notes: 1 Locations where barrier-separation is not designated between Managed Lanes (ML) and GP, it is assumed there will be a 4-foot buffer separation. 2 Alternative 5 Reduced A would not include direct access interchanges at Montrose Road or Gude Drive. 3 Alternative 5 Reduced B would not include any direct access interchanges on I-270 and would provide the same improvements as Alternative 1 on the West Spur.

WEST SIDE MOBILITY STUDY
July 2009 20
3. Alternative 1 Description Alternative 1 would provide a one-lane managed lane system in each direction throughout the study corridor. The proposed improvements for each section are described below. Capital Beltway As described in section 2 above, the improvements for the Capital Beltway would require the same amount of widening for each long-term alternative. These improvements are described in Alternative 1, but would apply for all long-term alternatives. However, the alternatives do vary in number of managed and general purpose lanes on the American Legion Bridge and on the Capital Beltway in Maryland. The section of the Capital Beltway located in Virginia would directly abut the Virginia HOT lane system, which will extend along I-495 from the Springfield (I-95 / I-395) interchange to just north of the Dulles Toll Road. The Virginia HOT lane system will consist of two HOT lanes and four general purpose lanes in each direction. The HOT lanes will be separated from the remainder of the highway by a four-foot painted buffer. Vehicles will not be allowed to cross the painted buffer, but access for the HOT lanes will be provided at interchanges via direct access ramps from the cross roads. To match the Virginia HOT system, the Virginia portion of the Capital Beltway would need to be widened by two lanes per direction resulting in six-lane section per direction. To match the proposed widening for the American Legion Bridge, one lane would need to add (outer loop) and drop (inner loop) within the George Washington Memorial Parkway interchange. This section of the Capital Beltway could be utilized as a transition area between the VDOT HOT lanes and the Maryland managed lanes if the operational configurations are not consistent. The transition would allow drivers some distance to maneuver into the proper lanes between the two operating systems. For instance, if the Maryland managed lanes are operated as Express Toll Lanes (ETL) where all vehicles are required to pay a toll, this section of the Capital Beltway would allow HOV vehicles in the VDOT HOT lanes an area to merge out of the median lanes prior to the start of tolling in Maryland. Similarly, this section of the Capital Beltway could allow HOV users from Maryland to merge into the VDOT HOT lanes. If the operational approach is the same between the two systems, with both utilizing HOT lanes, then this section of the Capital Beltway could provide a continuous HOT system between Maryland and Virginia. This lane configuration in Virginia would be utilized with all build alternatives. The American Legion Bridge would be widened to accommodate one extra lane per direction, resulting in a total of six lanes per direction plus full shoulders. This alternative would provide one managed lane, four general purpose lanes, and one auxiliary lane per direction across the bridge. The section of the Capital Beltway located in Maryland between the American Legion Bridge and the I-270 West Spur would be widened by one lane in each direction resulting in a total of five lanes per direction. This alternative would provide one managed lane and four general purpose lanes per direction.

WEST SIDE MOBILITY STUDY
July 2009 21
I-270 Mainline / I-270 West Spur / I-270 East Spur There would be no widening on the I-270 Spurs or mainline, but the existing peak period HOV lanes would be converted to managed lanes. This would provide one managed lane and two to three general purpose lanes on the I-270 West Spur; one managed lane and two to three general purpose lanes on the I-270 East Spur; one managed lane and five general purpose lanes on the I-270 mainline south of Montrose Road; and one managed lane, three general purpose lanes, and two CD Road lanes on I-270 north of Montrose Road. The proposed typical sections for Alternative 1 are shown in Figures C-1 through C-6. Managed Lanes Access Access to the managed lanes would be provided at specified at-grade locations and through direct access ramps at several interchanges. At-grade access would be provided at the southern end of the system, south of the American Legion Bridge in Virginia. An additional at-grade access would be located along the Capital Beltway in Maryland between the MD 190 and I-270 West Spur / I-495 interchanges. Direct access ramps would be provided at the existing Westlake Terrace interchange. The existing HOV access ramps would be converted to managed lanes access ramps. As with the existing condition, only north oriented ramps would be provided. Traffic Analysis Under Alternative 1, one managed lane would be added to the Capital Beltway in Maryland. Along the I-270 West Spur and mainline the existing HOV lane would be converted to a managed lane. As a general policy, it was assumed that SHA would allow HOV vehicles to use the managed lanes at no cost and there would be no truck restrictions in the managed lanes. Hence, all of the existing HOV volumes would use the managed lanes in Alternative 1. It was also assumed that some of the traffic in the general purpose lanes would use the managed lanes in the future for potential time savings, including trucks. Therefore, the capacity thresholds and related LOS values for managed lanes are different from the existing HOV lanes. However, the capacity values would remain the same for general purpose lanes and CD Road lanes because the physical configuration of the highway would not change. The capacity thresholds and related LOS values for Alternative 1, including the managed lanes are shown in Table C-4. The total volume; the volume distribution between the managed lanes, general purpose lanes, and CD Road lanes; v/c ratios; and LOS values for the freeway segments along I-270 and I-495 within the limits of the project for Alternative 1 are shown in Table C-5. In the southbound direction, during the AM peak, 4 of 13 highway segments would fail and there would be bottlenecks on the following segments:
• I-495 between Cabin John Parkway and MD 190 • I-270 West Spur between I-495 and Democracy Boulevard
This would be two fewer failing highway segments than the No-Build and would eliminate the bottleneck on the I-270 mainline between MD 189 and MD 28. In the northbound direction, during the PM peak, 6 of 13 highway segments would fail and there would be bottlenecks on the following segments:
• I-270 West Spur between I-495 and Democracy Boulevard

WEST SIDE MOBILITY STUDY
July 2009 22
• I-270 mainline between MD 189 and MD 28 This would be three fewer failing highway segments than the No-Build and would eliminate the bottleneck on I-495 between Clara Barton Parkway and Cabin John Parkway. Cost / Impacts Preliminary property and environmental impacts were estimated based on an assumed right-of-way / limit-of-disturbance that was offset 25 feet from the proposed limit of grading or outside edge of retaining wall. It was assumed that property displacements would result when the edge of a building was ten feet or less from the proposed right-of-way line. The proposed improvements would result in impacts to 70 properties along the Capital Beltway, including four residential displacements. The widening along the Capital Beltway could impact five wetlands / Waters of the U.S. and approximately 3.2 acres of park. The cost is estimated at over $1.04 billion (2008 dollars), which is the lowest cost of the long-term alternatives analyzed. Note that over $800 million of the estimated cost is associated with the widening of the Capital Beltway and American Bridge alone, which would be included in all alternatives. Status / Conclusion Alternative 1 would provide a nominal operational improvement compared to the No-Build and would also result in the least impacts and lowest cost of all long-term alternatives. However, Alternative 1 would only provide a one-lane managed lane system through the study corridor, which may not operate as effectively as a two-lane system because motorists would not be able to pass a vehicle traveling at a slower speed or one that was stopped on the shoulder. Due to the projected operational improvement and the lower cost and impacts compared to other long-term alternatives, it was determined that Alternative 1 should be evaluated in greater detail in a subsequent planning study.

WEST SIDE MOBILITY STUDY
July 2009 23
Table C-4: Capacity Thresholds for ETL, GP, & CD Lanes – 2030 Build Alternatives 1, 2, 3 & 4
0.95 0.95 0.955 5 1
65 70 60Level Level Level
Unadjusted Capacity 2,350 Unadjusted Capacity 2,400 Unadjusted Capacity 2,300HCS LOS Thresholds HCS LOS Thresholds HCS LOS Thresholds Adjusted Flow Rates Adjusted Flow Rates Adjusted Flow Rates
1 Lane 2 Lanes LOS 2 Lanes 3 Lanes 4 Lanes 5 Lanes 6 Lanes LOS 1 Lane 2 Lanes 3 Lanes LOS0 0 A 0 0 0 0 0 A 0 0 0 A
659 1318 B # 1429 2144 2858 3573 4288 B 625 1249 1872 B1085 2171 C # 2337 3506 4675 5844 7012 C 1022 2043 3063 C1558 3116 D # 3283 4924 6566 8207 9848 D 1476 2951 4425 D1938 3876 E # 3987 5981 7974 9968 11962 E 1909 3817 5723 E2179 4358 F # 4451 6676 8901 11127 13352 F 2175 4350 6522 F
0.95 0.95 0.956 6 1
65 70 60Level Level Level
Unadjusted Capacity 2,350 Unadjusted Capacity 2,400 Unadjusted Capacity 2,300HCS LOS Thresholds HCS LOS Thresholds HCS LOS Thresholds Adjusted Flow Rates Adjusted Flow Rates Adjusted Flow Rates
1 Lane 2 Lanes LOS 2 Lanes 3 Lanes 4 Lanes 5 Lanes 6 Lanes LOS 1 Lane 2 Lanes 3 Lanes LOS0 0 A 0 0 0 0 0 A 0 0 0 A
656 1312 B # 1422 2133 2844 3556 4267 B 625 1249 1872 B1080 2160 C # 2326 3489 4652 5815 6978 C 1022 2043 3063 C1550 3101 D # 3267 4900 6534 8167 9801 D 1476 2951 4425 D1929 3857 E # 3968 5952 7936 9920 11904 E 1909 3817 5723 E2168 4337 F # 4429 6644 8858 11073 13287 F 2175 4350 6522 F
0.95 0.95 0.957 7 1
65 70 60
Level Level LevelUnadjusted Capacity 2,350 Unadjusted Capacity 2,400 Unadjusted Capacity 2,300HCS LOS Thresholds HCS LOS Thresholds HCS LOS Thresholds Adjusted Flow Rates Adjusted Flow Rates Adjusted Flow Rates
1 Lane 2 Lanes LOS 2 Lanes 3 Lanes 4 Lanes 5 Lanes 6 Lanes LOS 1 Lane 2 Lanes 3 Lanes LOS0 0 A 0 0 0 0 0 A 0 0 0 A
653 1305 B # 1415 2123 2831 3538 4246 B 625 1249 1872 B1075 2150 C # 2315 3472 4630 5787 6945 C 1022 2043 3063 C1543 3086 D # 3251 4877 6502 8128 9753 D 1476 2951 4425 D1919 3839 E # 3949 5923 7897 9872 11846 E 1909 3817 5723 E2158 4316 F # 4408 6611 8815 11019 13223 F 2175 4350 6522 F
0.95 0.95 0.958 8 1
65 70 60Level Level Level
Unadjusted Capacity 2,350 Unadjusted Capacity 2,400 Unadjusted Capacity 2,300HCS LOS Thresholds HCS LOS Thresholds HCS LOS Thresholds Adjusted Flow Rates Adjusted Flow Rates Adjusted Flow Rates
1 Lane 2 Lanes LOS 2 Lanes 3 Lanes 4 Lanes 5 Lanes 6 Lanes LOS 1 Lane 2 Lanes 3 Lanes LOS0 0 A 0 0 0 0 0 A 0 0 0 A
650 1301 B # 1409 2113 2817 3521 4226 B 625 1249 1872 B1070 2139 C # 2304 3456 4608 5759 6911 C 1022 2043 3063 C1536 3071 D # 3235 4853 6471 8089 9706 D 1476 2951 4425 D1910 3820 E # 3930 5895 7859 9824 11789 E 1909 3817 5723 E2148 4295 F # 4386 6580 8773 10966 13159 F 2175 4350 6522 F
Terrain
%Trucks
Terrain Terrain
%Trucks %TrucksMeasured FF SpeedMeasured FF Speed Measured FF Speed
ETL General Purpose Collector-Distributor (CD)PHF PHF PHF
HCS Assumptions and Calculated Maximum Flow Rates By LOS Threshold - 5% Trucks
HCS Assumptions and Calculated Maximum Flow Rates By LOS Threshold - 6% TrucksETL General Purpose Collector-Distributor (CD)
PHF PHF PHF%Trucks %Trucks %Trucks
Measured FF Speed Measured FF Speed Measured FF SpeedTerrain Terrain Terrain
HCS Assumptions and Calculated Maximum Flow Rates By LOS Threshold - 7% TrucksETL General Purpose Collector-Distributor (CD)
PHF PHF PHF%Trucks %Trucks %Trucks
Measured FF Speed Measured FF Speed Measured FF Speed
Terrain Terrain Terrain
HCS Assumptions and Calculated Maximum Flow Rates By LOS Threshold - 8% TrucksETL General Purpose Collector-Distributor (CD)
PHF PHF PHF%Trucks %Trucks %Trucks
Measured FF Speed Measured FF Speed Measured FF SpeedTerrain Terrain Terrain

WEST SIDE MOBILITY STUDY
July 2009 24
Table C-5: Capacity Calculations – 2030 Build Alternative 1
# LanesForecast
Vol.HCS Adj. Capacity v/c LOS # Lanes
ResultingVol.
HCS Adj. Capacity v/c LOS # Lanes
ResultingVol.
HCS Adj. Capacity v/c LOS # Lanes
ForecastVol.
HCS Adj. Capacity v/c LOS # Lanes
ResultingVol.
HCS Adj. Capacity v/c LOS # Lanes
ResultingVol.
HCS Adj. Capacity v/c LOS
# Lanes Vol. Capacity v/c LOS # Lanes Vol. Capacity v/c LOS # Lanes Vol. Capacity v/c LOS # Lanes Vol. Capacity v/c LOS # Lanes Vol. Capacity v/c LOS # Lanes Vol. Capacity v/c LOS
Truck Percentages Truck PercentagesAM Peak PM Peak AM Peak PM Peak
I-495 6% 7% I-495 7% 5%I-270 Spur 5% 5% I-270 Spur 5% 5%I-270 8% 5% I-270 6% 5%
0.53 C
0.17 A
0.81
0.79
D
100%
2
4,451 0.00 - 2
7,875
2
A
C
100% -
100%
4,451 0.00 A
A0.00
4
5C
0.62 C4,051 6,522 35%
4
D 11,127 0.71
100% 7,225 8,901
5
#'s
in R
ed a
re fr
om F
ield
Cou
nts,
#'s
in B
lack
are
ass
umed
5
5
3
11,575
8,650
9,600
4,650
3,875
4,550
9,050
9,425
I-495
Clara Barton Parkway
1 2,179 0.65 C
1
0.00
Interchange
1
0.00 A
2
MD 1871 2,158 - A 2
0.00
A 2 100% - 4,429
100% 4,429
0.00 A
D 3
1.16 F
0.92
D
0.87
A
D
11,073
0.76 D
D6,676
3
0.87 D
E
1.11 F
0.83
B0.40
D0.81
0.75 24% 2,598 6,522
3,696 6,580 10,675 4,350 0.67 C
VA 193
27,950
1
9,400 1
1
1
11,475 1
11,500 1
2 100%
3
60%
100%
F
9,050 1
MD 190
1,425
0.94
0.91
35%
1,425
375 2,179
2,179
2,179
1,725 1,600 2,179 0.73
0.731,600 2,179
0.00 A1
1 0.00 A
2,179 0.601,300 C
1 1,300 2,179 0.60 C
C
1 1,300
1,300 2,179 0.60
1.14
0.62 C
1 1,350 2,179 0.62 C
1
C
2,168
1
2,179
2,179
#'s
in R
ed a
re fr
om F
ield
Cou
nts,
#'s
in B
lack
are
ass
umed
2,158
2,158 0.741
1
1
1
0.63
1,350 2,148
1
0.00
2,168
0.62
A
C
C
C
0.00
0.63
A
1
1
1,350 2,148
1,400 0.65
0.65
C
A
0.16 A
0.16
C
C
2,168
350 2,148 0.16
1,700 2,168 0.78
1,400 2,168 0.65
1
2,168
1
1
1
1,400 2,168
19,900
11,073 0.80
E8,858 0.91
Interchange
AM Peak Period - Northbound (2030 Alternative 1)
% of GP+CD (2006 Count)
% of GP+CD (2006 Count)
TotalVolume
1 D 100%Clara Barton Parkway
6
5
650 2,168
100% 12,200 13,287
1
11,073
11,019
8,815
5
5
7,675
A 100%
11,019 100%
100%
2,158
76%
0.74
1,600 D
D
4
2,158
2,158
2,158
-
0.74
0.82
D0.74
8,227
D
100%
9,825 4
1,600 1
1 1,775
10,825
44%
33% 0.62 Cabin John Parkway
C Clara Barton Parkway
4,350
2,904 George Washington
650
34%
11,425
1
1
1,600 MD 190
4,350
10,750 2,158 0.30
0.74
0.74
0.782,168 1,700
11,073
1,600 2,168 MD 28
11,000 1MD 189
Gude Drive
9,850
8,050
E
8,100
4,175
8,900
9,500 11,073
4,850
8,600
0.86
6,525 West Lake Terrace
11,350
VA 193
MD 190
12,200
9,450 Cabin John Parkway
10,000
2,746
9,275
C
0.67
4,350
1
Rockledge Drive
2
2,158
2,168
2A
5
2,904
2,690 D
2
#'s
in R
ed a
re fr
om F
ield
C
ount
s, #
's in
Bla
ck a
re
assu
med
43%
2
44%
4,386
1,600
650
1,600
0.00
0.30
0.30
0.30
0.74
2,179 0.75
2,158
2,179
A
A
A
D
100%
100%
5
5
100%4
0.00-
2 100%
7,605
60% 5,925
3
3
100%1
1
1 A
A
A
2,158
0.00
0.00
2,158 0.00
0.00 100% - 4,451 2
2
5
2,158 20.00
D
650 2,179
D
3
4,451 100% - 2
4,451
49% 5,133
65% 6,676
4,451
5,925
11,127 10,450
5,425 4,451
51%20.77
6,676
6,676
0.89
A
F
1.02 F
A
D
40% 3,950
A
A
0.91 E4,350
4,350
1.14 F
E
2
2
2,158 0.00 A 100%1
0.76
A
A
100% 5,075 4,451
ETL
0.78
100%
1,350
0.60
100%
1
8,575
9,525 100%
0.85
0.82
7,475 8,815
9,025
11,019
11,019
11,019
0.81
D
D
1,750
1,600 2,158 0.74
GP Lanes
ETL
1,600
0.76 11,100 1 1,600 2,168
I-270 Y-Split
-
100%
100% 4,386
4,386
D
-
D
A
0.7513,223 100% 9,950
2 0.00
6
-
0.74 D
F
3 67%
0.00
10,750
0.00 4,429
CD LanesETL GP Lanes CD Lanes
% of GP+CD (2006 Count)Interchange
AM Peak Period - Southbound (2030 Alternative 1)
% of GP+CD (2006 Count)
GP Lanes
2,168 10.92I-370
#'s
in R
ed a
re fr
om F
ield
Cou
nts,
#'s
in B
lack
are
ass
umed
100%
6,580 56%
4
100%
5
5 100%
5
1.02
1,600 2,168
D0.74
74% 6,771 0.36
0.63
100%
100%
2,168 1,600
0.74 D BGW Parkway
Shady Grove Road
10,600 D 9,900 6,644
6,644 3
D
C25,561 0.84 D
0.6936% 2,988 4,350
D 3
0.80
D 3 6,644
D
E4,350
0.94 E 2 34%
D0.81
0.74 D
2,807 6,580 0.43 B
8,450
0.9357% 5,358
10,750
2
6,522
33% 2,739 4,350
2 43% 4,042
26% 2,379
2
Montrose Road
9,850 D 1
#'s
in R
ed a
re fr
om F
ield
C
ount
s, #
's in
Bla
ck a
re
assu
med
D
D
3 6,644 64%
3,230 4,350
2,148 1.09
D 5 100% 9,650
0.78
350
I-495/I-270 West Spur
5,200 F
350
4,451
1
At-Grade Access
I-270 Y-Split100%
2,168 1,475 Democracy Boulevard
I-270 Y-Split
4,525 E2
0.54 C
West Lake Terrace
3 100% 5,050 0.68
5,325 E I-495/I-270 West Spur
1,150 2,148
100%
1
1 2,148 0.69 C
1
1 650 2 4,451
Democracy Boulevard
0.94
5,700 0.30
0.305,800 A
2
4,175 100% 0.94
C1
4,451 5,150 2
5,050 3 100%A
2,168
5
#'s
in R
ed a
re fr
om F
ield
Cou
nts,
#'s
in B
lack
are
ass
umed
0.76
6,676
6,270 6,644 66%
5,312
11,019
100%
Montrose Road
10,966
67% 5,461
1,475
1,325
9,575 5
11,019 3 66%
At-Grade Access
D 0.63 C 5
10,100
MD 28
MD 1899,475 2,148 1,325
1,325
1
Gude Drive7,925 3,696
2,148 0.62 C
0.62
5,330
2,148 3C
3
CShady Grove Road
6,275 3 57%I-370
56%
1
3 0.56
Interchange (2006 Count) (2006 Count)Total
VolumeGP Lanes CD LanesETL
D8,350 11,019
MD 187Rockledge
Drive
I-270 Y-Split
I-495
13,325
Shady Grove Road
12,075
VA 193 I-3709,950 D
GW Parkway10,100
B
2,158 0.00
8,900
Gude Drive
4,350
D
2,179 D
2,118 4,350 0.49 C
Shady Grove Road
7,200
PM Peak Period - Northbound (2030 Alternative 1) PM Peak Period - Southbound (2030 Alternative 1)CD Lanes
B
2
B
(2006 Count)
9,150
6,700
8,815
B 3
100%
59% 3,157
75% 4,388
(2006 Count)
B
4
4 8,901 0.49
0.43
8,901 0.47
3,861
60% 4,215
0.348,901 0.35 6,522 41% 2,194
BClara Barton Parkway Gude Drive
9,075 D 7,150 34% 1,989 4,350 66%
0.34
2 0.46
4,350 25% 1,463
BCabin John Parkway MD 28
10,625 D 8,325
4 8,901
2,810 4,350 0.65 CMD 190 MD 189
10,175 D 8,325 4
2 40%
C 2 22% 1,546 78% 5,480 8,901 0.62 0.36 BAt-Grade Access
Montrose Road
10,175 D 7,825 5
#'s
in R
ed a
re fr
om F
ield
C
ount
s, #
's in
Bla
ck a
re
assu
med
4,350
12,150
C100% 6,525 11,127 0.595
1.22
1.22
0.86
I-495/I-270 West Spur
I-495/I-270 West Spur
5,725 1Democracy BoulevardWest Lake
Terrace6,900
5,425
I-270 Y-Split
6,075 1 650
2,179 1
I-270 Y-SplitWest Lake
Terrace
At-Grade Access
Democracy Boulevard
A
A
2,179
1
1
1
1 B
B0.52
E0.94
0.526,676
4,451
100% 3,500 6,676
100% 4,175
100%2,179
375 1
3,500 1,150
3
1 1,700 2,179
5,342 4,350
C0.68
0.78
1,475
1,625
0.75
1.23 F
4,095
40% 3,950
D
D 2
C100% 7,625 11,127 0.692,179 0.65
Cabin John Parkway
1
1.04
#'s
in R
ed a
re fr
om F
ield
C
ount
s, #
's in
Bla
ck a
re
assu
med
6,676
0.89
0.17
0.650.94 E
D100% 8,675 11,127 0.78
0.17
13,025 39% 4,446 4,350 F61% 6,954 6,676 0.751,625 3D
2F
375
1,625
2,179 1
E
C100% 8,000 11,127 0.72C1,425 2,179
1I-370
MD 28
MD 189
Montrose Road
1
I-495
VA 193
4,451
I-270 Y-Split
MD 187Rockledge
Drive1
3
I-270 Y-Split2 100%2,179
George Washington
A
5 C65% 7,524 11,127 0.68
- 0.00
2,179 I-495
Total Volume
Total Volume
Rockledge Drive
2,179 MD 187
C0.56
2
4,451
6,580
6,580 0.81
0.74
0.83
D

WEST SIDE MOBILITY STUDY
July 2009 25
4. Alternative 2 Description Alternative 2 would provide a two-lane managed lane system in each direction throughout the study corridor. The proposed improvements for each section are described below. Capital Beltway The section of the Capital Beltway in Virginia would provide two HOT / transition lanes and four general purpose lanes per direction as described in Alternative 1. The American Legion Bridge would be widened to accommodate one extra lane per direction, and this alternative would also include converting one general purpose lane to a managed lane to provide two managed lanes, three general purpose lanes, and one auxiliary lane per direction. This lane configuration would be utilized for Alternatives 2 through 5. The section of the Capital Beltway located in Maryland between the American Legion Bridge and I-270 West Spur would be widened by one lane in each direction, and this alternative would also include converting one general purpose lane to a managed lane to provide two managed lanes and three general purpose lanes per direction. This lane configuration would be utilized for Alternatives 2 through 5. I-270 West Spur The I-270 West Spur would be widened slightly to accommodate a concrete traffic barrier between the median lane, which would be converted from a peak period HOV lane to a managed lane, and the general purpose lanes. Only minimal widening would be required to accommodate the barrier because the existing 16-foot wide median shoulder, which is comprised of full depth pavement, would be reduced to a four-foot shoulder. The total number of lanes on the I-270 West Spur would be maintained, with two general purpose lanes and one managed lane per direction, except in the southbound direction between the Y-Split and Democracy Boulevard interchanges where an auxiliary (fourth) lane is provided. I-270 Mainline The I-270 mainline between the Y-Split interchange and the start of the CD Road system south of Montrose Road would be widened to accommodate a concrete traffic barrier between the left two lanes and the right four lanes in each direction. The left two lanes in each direction would be converted from a peak period HOV lane and general purpose lane to managed lanes. Within the CD Road section, from south of Montrose Road to I-370, the roadway would be reconfigured to remove the existing concrete traffic barrier between the general purpose lanes and CD Road and provide a concrete traffic barrier between the left two lanes and the remainder of the highway. The left two lanes in each direction would be converted from a peak period HOV lane and general purpose lane to two managed lanes. The CD Road would be completely removed. I-270 East Spur The I-270 East Spur would be widened to accommodate a concrete traffic barrier between the median lane, which would be converted from a peak period HOV lane to a managed lane, and the general purpose lanes. The total number of lanes on the I-270 East Spur would be the same as the existing condition.

WEST SIDE MOBILITY STUDY
July 2009 26
The proposed typical sections for Alternative 2 are shown in Figures C-1, and C-7 through C-11. Managed Lanes Access Access to the managed lanes would be provided at specified at-grade locations and through direct access ramps at several interchanges. At-grade access would be provided at the southern end of the system, south of the American Legion Bridge in Virginia. An additional at-grade access would be located along the Capital Beltway in Maryland between the MD 190 and I-270 West Spur / I-495 interchanges. Direct access ramps would be provided at the existing Westlake Terrace, Montrose Road, and I-370 interchanges, and at a new direct access only interchange with Gude Drive. The existing Westlake Terrace HOV access ramps would be converted to managed lanes access ramps; the Montrose Road and I-370 interchanges would be modified to include direct access ramps; and only new direct access ramps would be provided at Gude Drive (no general purpose ramps). The direct access ramps would provide a direct link between the managed lanes and cross roads. Traffic Analysis Under Alternative 2, one lane would be added and one general purpose lane would be converted to managed lanes along the Capital Beltway. On the I-270 West Spur, the HOV lane would be converted to a managed lane. On the I-270 mainline, the existing HOV lane and one general purpose lane would be converted to managed lanes. As a result, the existing HOV volumes would use the managed lanes and some of the existing general purpose volumes would use the managed lanes for potential time savings, especially with one less general purpose lane provided on the mainline. The capacity thresholds and related LOS values for Alternative 2 are shown in Table C-4. The total volume; the volume distribution between the managed lanes and general purpose lanes; the v/c ratios; and LOS values for the freeway segments along I-270 and I-495 within the limits of the project for Alternative 2 are shown in Table C-6. In the southbound direction, during the AM peak, 7 of 13 highway segments would fail and there would be bottlenecks on the following segments:
• I-495 between Cabin John Parkway and MD 190 • I-270 West Spur between I-495 and Democracy Boulevard • I-270 mainline between MD 189 and MD 28
This would be one more failing highway segment than the No-Build and would not eliminate any bottlenecks. In the northbound direction, during the PM peak, 9 of 13 highway segments would fail and there would be bottlenecks on the following segments:
• I-270 West Spur between I-495 and Democracy Boulevard • I-270 mainline between MD 189 and MD 28
This would be the same number of failing highway segments as the No-Build and would eliminate the bottleneck on I-495 between Clara Barton Parkway and Cabin John Parkway.

WEST SIDE MOBILITY STUDY
July 2009 27
Cost / Impacts Preliminary property and environmental impacts were estimated based on an assumed right-of-way / limit-of-disturbance that was offset 25 feet from the proposed limit of grading or outside edge of retaining wall. It was assumed that property displacements would result when the edge of a building was ten feet or less from the proposed right-of-way line. The proposed improvements would result in impacts to 193 properties, including 18 displacements (17 residential and one commercial). The widening along the Capital Beltway, I-270 Spurs, and the I-270 mainline could impact 79 wetlands / Waters of the U.S. and approximately 14.4 acres of park. The cost is estimated at $2.17 billion (2008 dollars). Status / Conclusion Alternative 2 would not provide an operational improvement compared to the No-Build and it would result in more impacts and substantially higher cost than Alternative 1. However, Alternative 2 would provide a two-lane managed lane system through the study corridor, which may be more preferable than the one-lane system proposed in Alternative 1. Due to the lack of improved traffic operations and the significant cost and impacts, it was determined that Alternative 2 would not be considered for further study at this time.

WEST SIDE MOBILITY STUDY
July 2009 28
Table C-6: Capacity Calculations – 2030 Build Alternative 2
# LanesForecast
Vol.HCS Adj. Capacity v/c LOS # Lanes
ResultingVol.
HCS Adj. Capacity v/c LOS # Lanes
ResultingVol.
HCS Adj. Capacity v/c LOS # Lanes
ForecastVol.
HCS Adj. Capacity v/c LOS # Lanes
ResultingVol.
HCS Adj. Capacity v/c LOS # Lanes
ResultingVol.
HCS Adj. Capacity v/c LOS
# LanesForecast
Vol.HCS Adj. Capacity v/c LOS # Lanes
ResultingVol.
HCS Adj. Capacity v/c LOS # Lanes
ResultingVol.
HCS Adj. Capacity v/c LOS # Lanes
ForecastVol.
HCS Adj. Capacity v/c LOS # Lanes
ResultingVol.
HCS Adj. Capacity v/c LOS # Lanes
ResultingVol.
HCS Adj. Capacity v/c LOS
Assumptions for Truck Percentages: Assumptions for Truck Percentages:AM Peak PM Peak AM Peak PM Peak
I-495 6% 7% I-495 7% 5%I-270 Spur 5% 5% I-270 Spur 5% 5%I-270 8% 5% I-270 6% 5%
PM Peak Period - Southbound (2030 Alternative 2)
Total Volume
Total Volume
ETL
4,429
100% - 4,429
4,451 0.00 A
4,451 0.00 A
I-495
MD 1871
1
- 2,179 0.00 A
0.62 C65% 7,508 13,352 0.56 4,043 6,522 C 3
0.88 D
100% 6,625 6,676 0.99 E
100% 7,825 8,901
3
2,100 4,358 0.48 B 4
1,900 B
6VA 193
Interchange
11,550
8,525
9,925
4,600
4,250
Gude Drive
7,625
6,525
Clara Barton Parkway
2 4,358 0.44
2George Washington
0.00 A
A- 4,429 0.00
0.00 A100%
0.40
2
1
1
E
100% 7,950
B0.75 D 3 24% 2,604 6,522
100% 6,025 6,611 0.91
2,158 0.00 A
E
-
8,815 0.90
2,158 0.00 A 2
C
0.002,168 A
2,168 0.00
8,246 11,019
100%2 0.00 100%
5 76%
D
3,275 4,358 0.75
3,275 4,358 0.75
D
D
100%
3,100 4,316
100%
3,100 4,316 0.72
A
0.72
11,525 2
2
D
4,316
4
3,275 4,358 0.75
0.50
0.34
1,100
0.00 A
2 2,725
1
2
2 2,250
2
1
2
1
1
2,168
A
0.00
2,275 4,295 0.53
2,575 4,295 0.60
0.642,750 4,295
C
1,125 2,148
775 2,148 0.36 B
B
0.52 C
B
A
1,925 4,337 0.44 B
1,925 4,337 0.44
775 4,337 0.18
775 2,148 0.36
2
2
2
2
2
Interchange
AM Peak Period - Northbound (2030 Alternative 2)
% of GP+CD (2006 Count)
% of GP+CD (2006 Count)
TotalVolume
ETL GP Lanes
2,168
4,337
12,000 7,900 8,858
7,850 8,858 0.89
3,125
3,125
3,125
4
1,375
9,150
3,400 12,775
2 0.74
0.74
0.63 C
100%
4,316 0.72 D
4,316 0.72
2,158
4
3
D
D4,316
2
D
0.00 A
0.72
0.72
D
3
4
C
B0.32
4,316
4,337
3,225
4,337
3,125
2,168 1,375
3,225 MD 190
0.89MD 189
4
4
100%
100%
At-Grade Access
9,825 100% 9,050 11,073 0.82
Montrose Road
DI-270 Y-Split
0.99
D
VA 19312,200 100% 12,200 6
2GW Parkway
Shady Grove Road
13,287 0.92
2,125 4,337 0.49 B 11,175 Clara Barton Parkway Gude Drive
B1,925 4,337 0.44
10,975 E
I-495/I-270 West Spur
Cabin John Parkway
11,125
1
1
15,750
2
2
100% 6,975
10,850
C 11,075
B
Clara Barton ParkwayGeorge
Washington
VA 193
4,451 0.92
6,375 100% 4,400
100% 4,075 6,050
8,773
0.61
0.92
0.68
8,773
8,773
10,700
2
2
10,700
211,175
4 100%
-
5,925
4 100%
4 5,350
5,350
100%
8,773
2
I-270 Y-Split
C
1
20.61
8,773
8,773
-
8,250
4,386
5,825
PM Peak Period - Northbound (2030 Alternative 2)
3,175 4,316 0.74
Rockledge Drive
0.00
9,925
A
I-495
MD 187
CD Lanes
0.40
0.75
4,386
3,500
-
100%
100%
4,451
0.83
0.79
5,050
A
11,019
0.797,000 8,815
6,611
7,275
4
4
100%
100%
100%
4
ETL
2 100%
2 100%
3,100 4,316
6
1
4
2 3
0.00 A
0.00 A
0.001
2
2
2,158
2,158
2,158
-
1.13
0.93
0.938,901
8,901
8,550
5,050 4,451
8,275
E
A
0.62
0.77 4
0.77
2C
D
0.75
E0.94
0.00
E
2A 0.00
100% - 4,451 0.00
4,451 100% A
4,300 4,451 0.97
8,901
8,901
4,451
8,901 0.96
A
E0.99
0.94
A
E
0.75
D
1.13
0.00
0.88
2 100% - 4,386
Interchange
AM Peak Period - Southbound (2030 Alternative 2)
I-370E 11,700 2
CD Lanes ETL GP Lanes CD Lanes
% of GP+CD (2006 Count)
9,300 F
4
3 100% 7,375 6,644 1.11
3,275
4 100%
0.74
100%
100%
0.76 D
D3,225
8,425
% of GP+CD (2006 Count)
0.76 D4,337 3,275
8,858 7,900
0.95 E
0.89 D
8,858
100% 8,850 8,858 1.00
#'s
in R
ed a
re fr
om F
ield
Cou
nts,
#'s
in B
lack
are
ass
umed
C
2,750 C 4
4
C
4,337 4 7,900 8,858 0.89 DCabin John Parkway MD 28
9,775 D 11,200 2 4,337 D 4 8,858 0.90100% 7,975 E
8,775 8,858 100% 0.99 ED 4
0.78 D 5 D100% 9,375 11,073 I-495/I-270 West Spur
5,175 E
9,825
2 4,451 Democracy Boulevard
4,850 E2
1
0.85
1,700 2,168 0.78 0.706,676 3
0.98
52
West Lake Terrace
West Lake Terrace
5,200 E2 100% 4,075
C4,675
C
100% 6,676
4,675
0.70
100%
I-270 Y-Split
Democracy Boulevard
9,250 D
4,451
0.80
1
1
4 100%
2 100%
1,375 4,316
0.63
5 0.85 D9,325
4
100%
#'s
in R
ed a
re fr
om F
ield
Cou
nts,
#'s
in B
lack
are
ass
umed
E4,375
11,019
4,451
Montrose Road
At-Grade Access
8,675 C2MD 190
C4,295 0.64
0.86 D
8,050
7,575
0.91 E8,815
8,815
5,575 0.64
C
Gude Drive8,100
MD 288,325
2,750 4,295 0.64
2MD 189
Shady Grove Road
6,075
2
2
I-495
% of GP+CD (2006 Count)
% of GP+CD (2006 Count)
MD 187
Interchange
Rockledge Drive
I-270 Y-Split
100%I-370
100%
2
7,925
2,575 4,295 0.60
GP Lanes CD Lanes
13,223 0.59 C
% of GP+CD (2006 Count)
% of GP+CD (2006 Count)
BGW Parkway
Shady Grove Road
10,450 D8,815 0.837,275 D
100%
C
100% 4,700 8,901 0.53 C
100% 4,700 0.534Clara Barton Parkway
8,901
TotalVolume
GP Lanes
VA 193 I-3709,925 D
4,358 0.63
0.59
7,425
1
7,425
4
7,275
0.444 100% 3,950 8,901 2,575
2
C
2 4,358
2 2,575 4,358
C2,725 Cabin John Parkway MD 28
10,375 D
8,925 D
4D
4,358 MD 190 MD 189
4
10,100 DAt-Grade Access
Montrose Road
8,815
B
0.7511,127
0.530.63 C4,358
4,358
2,725
6,676
0.48
6,676
11,127
0.52
0.72 5,025 7,750 4 100%C0.63
#'s
in R
ed a
re fr
om F
ield
Cou
nts,
#'s
in B
lack
are
ass
umed
100% 4,700
B5,375
C
C
0.56
8,901
8,901
I-495/I-270 West Spur
5,650 1 1,350 Democracy Boulevard
6,400 1
1,350 5 100%0.31I-270 Y-Split
5 8,750 C0.52
C2,179
3 100% 3,500 750 2,179 BF
10,100
1,350 2,179 C0.62
2,179 B
West Lake Terrace
West Lake Terrace
6,725 1 1,675 2,179 D
3
0.52 B
I-270 Y-Split
Democracy Boulevard
11,725 2 3,375 4,358
F 0.86 D4,575 2 100%1 750 2,179 0.34 BI-495/I-270 West Spur
E
3,825
100% 3,500
9,075 52 750 4,358 0.17 A
1,900 4,358 3,250 4,358 9,075
E4 100%D
8,800 8,901 MD 190
DMontrose Road
At-Grade Access
12,050 2 4
100% 8,325
DMD 189
11,800 2 3,250 4,358
4,451
2 1,900 4,358
8,901 B2
0.44 B
0.81100% 7,175 0.44
MD 28Cabin John
ParkwayD
D100% 7,325 8,901 0.829,225 4
Shady Grove Road
11,675 2I-370
11,550 2Gude Drive
I-495
D 4 100% 8,400
#'s
in R
ed a
re fr
om F
ield
Cou
nts,
#'s
in B
lack
are
ass
umed
100%
100%
8,350
100%
100%
2 100%MD 187
Rockledge Drive
I-270 Y-Split
1
2
I-270 Y-Split2 100%- 2,179 0.00 A1
2 100% -
100% - 2
Rockledge Drive
- 2,179
35%
- 4,451 0.00 A

WEST SIDE MOBILITY STUDY
July 2009 29
5. Alternative 3 Description Alternative 3 would provide a two-lane managed lane system in each direction throughout the study corridor. The proposed improvements for each section are described below. Capital Beltway The section of the Capital Beltway in Virginia would provide two HOT / transition lanes and four general purpose lanes per direction as described in Alternative 1. The American Legion Bridge would be widened similar to Alternative 2 to accommodate one extra lane per direction, and this alternative would also include converting one general purpose lane to a managed lane to provide two managed lanes, three general purpose lanes, and one auxiliary lane per direction. The section of the Capital Beltway located in Maryland between the American Legion Bridge and I-270 West Spur would be widened by one lane in each direction, and this alternative would also include converting one general purpose lane to a managed lane to provide two managed lanes and three general purpose lanes per direction, similar to Alternative 2. I-270 West Spur The I-270 West Spur would be widened to accommodate one additional lane and a concrete traffic barrier between the median two lanes, which would be operated as managed lanes, and the general purpose lanes. The HOV lane would be converted to a managed lane. I-270 Mainline The I-270 mainline between the Y-Split interchange and the start of the CD Road system south of Montrose Road would be widened to provide an additional lane and a concrete traffic barrier between the left two lanes and the right five lanes in each direction. The left two lanes in each direction would be managed lanes. One general purpose lane in each direction would be converted to a managed lane. Within the CD Road section, from south of Montrose Road to I-370, the roadway would be reconfigured and widened to remove the existing concrete traffic barrier between the general purpose lanes and CD Road and provide an additional lane and a concrete traffic barrier between the left two lanes and the remainder of the highway. The left two lanes in each direction would be managed lanes. One general purpose lane in each direction would be converted to a managed lane. The CD Road would be completely removed. I-270 East Spur The I-270 East Spur would be widened to accommodate a concrete traffic barrier between the median lane, which would be converted from a peak period HOV lane to a managed lane, and the general purpose lanes. The total number of lanes on the I-270 East Spur would be the same as the existing condition, similar to Alternative 2. The proposed typical sections for Alternative 3 are shown in Figures C-1, C-7, C-8, and C-12 through C-14.

WEST SIDE MOBILITY STUDY
July 2009 30
Managed Lanes Access Access to the managed lanes would be provided at specified at-grade locations and through direct access ramps at several interchanges. At-grade access would be provided at the southern end of the system, south of the American Legion Bridge in Virginia. An additional at-grade access would be located along the Capital Beltway in Maryland between the MD 190 and I-270 West Spur / I-495 interchanges. Direct access ramps would be provided at the existing Westlake Terrace, Montrose Road, and I-370 interchanges and at a new direct access only interchange with Gude Drive. The existing Westlake Terrace HOV access ramps would be converted to managed lanes access ramps; the Montrose Road and I-370 interchanges would be modified to provide direct access ramps; and only new direct access ramps would be provided at Gude Drive (no general purpose ramps). The direct access ramps would provide a direct link between the managed lanes and cross roads. Traffic Analysis Traffic analyses were not completed for Alternative 3 because the lane configuration was very similar to Alternative 4 and therefore it can be expected to operate the same as Alternative 4. The Alternative 4 traffic analysis indicated that in the southbound direction, during the AM peak, 6 of 13 highway segments would be failing and there would be bottlenecks on the following segments:
• I-495 between Cabin John Parkway and MD 190 • I-270 West Spur between I-495 and Democracy Boulevard
This would be the same number of failing highway segments as the No-Build and would eliminate the bottleneck on the I-270 mainline between MD 189 and MD 28. In the northbound direction, during the PM peak, 4 of 13 highway segments would be failing and there would be a bottleneck on the I-270 West Spur between I-495 and Democracy Boulevard. This would be five fewer failing highway segments than the No-Build and would eliminate the bottlenecks on I-495 between Clara Barton Parkway and Cabin John Parkway and on the I-270 mainline between MD 189 and MD 28. A new bottleneck would be created north of the I-270 Spurs due to the additional capacity provided on the I-270 West Spur that would feed additional traffic to the I-270 mainline. Cost / Impacts Preliminary property and environmental impacts were estimated based on an assumed right-of-way / limit-of-disturbance that was offset 25 feet from the proposed limit of grading or outside edge of retaining wall. It was assumed that property displacements would result when the edge of a building was ten feet or less from the proposed right-of-way line. The proposed improvements would result in impacts to 266 properties, including 18 displacements (17 residential and one commercial). The widening along the Capital Beltway, I-270 Spurs, and the I-270 mainline could impact 114 wetlands / Waters of the U.S. and approximately 14.4 acres of park. The cost is estimated at $2.27 billion (in 2008 dollars).

WEST SIDE MOBILITY STUDY
July 2009 31
Status / Conclusion Alternative 3 would provide similar operational improvements as Alternative 4 and would result in the same impacts and cost. However, Alternative 3 would not provide any separation between the general purpose and CD Road lanes, effectively eliminating the CD Road. A buffer separation would be provided with Alternative 4. Since Alternative 3 would have similar improvements and impacts to Alternative 4, but it would lack the separation between the general purpose and CD Road lanes, it was determined that Alternative 3 would not be considered for further study at this time. 6. Alternative 4 Alternative 4 would provide a two-lane managed lane system in each direction throughout the study corridor. Detailed engineering for the mainline and interchanges was completed for Alternative 4 because it would provide the widest typical section and therefore result in the highest impacts and cost. A more thorough description of the alternative is provided below, which includes the typical section for the mainline sections as well as details of proposed interchange improvements and managed lane access locations. In addition, display sheets showing the proposed Alternative 4 improvements are provided in Appendix A. Description Capital Beltway The section of the Capital Beltway in Virginia would provide two HOT / transition lanes and four general purpose lanes per direction as described in Alternative 1. The American Legion Bridge would be widened to accommodate one extra lane per direction, and this alternative would also include converting one general purpose lane to a managed lane to provide two managed lanes, three general purpose lanes, and one auxiliary lane per direction, similar to Alternatives 2 and 3. The section of the Capital Beltway located in Maryland between the American Legion Bridge and I-270 West Spur would be widened by one lane in each direction, and this alternative would include converting one general purpose lane to a managed lane to provide two managed lanes and three general purpose lanes per direction, similar to Alternatives 2 and 3. I-270 West Spur The I-270 West Spur would be widened to accommodate one additional lane and a concrete traffic barrier between the median two lanes, which would be operated as managed lanes, and the general purpose lanes. The HOV lane would be converted to a managed lane. I-270 Mainline The I-270 mainline between the Y-Split interchange and the start of the CD Road system south of Montrose Road would be widened to provide an additional lane. The left two lanes in each direction would be operated as managed lanes and separated from the right five lanes by a four-foot buffer. The HOV lane would be converted to a managed lane.

WEST SIDE MOBILITY STUDY
July 2009 32
Within the CD Road section, from south of Montrose Road to I-370, the mainline would be reconfigured and widened to provide an additional lane. The left two lanes in each direction would be operated as managed lanes and separated from the general purpose lanes by a concrete traffic barrier. The HOV lane would be converted to a managed lane. The concrete barrier between the mainline and CD Road would be removed and the general purpose and CD Road lanes would be separated by a four-foot buffer. The reconfiguration of the mainline would require many of the overpasses with piers located between the general purpose lanes and CD Road lanes to be reconstructed. These overpasses are specifically noted in the interchange improvements described below. I-270 East Spur The I-270 East Spur would be widened to accommodate a concrete traffic barrier between the median lane, which would be converted from a peak period HOV lane to a managed lane, and the general purpose lanes. The total number of lanes on the I-270 East Spur would be the same as the existing condition, similar to Alternatives 2 and 3. The proposed typical sections for Alternative 4 are shown in Figures C-1, C-7, C-8, C-12, C-13, and C-15. Managed Lanes Access Access to the managed lanes would be provided at specified at-grade locations and through direct access ramps at several interchanges. At-grade access would be provided at the southern end of the system, south of the American Legion Bridge in Virginia. An additional at-grade access would be located along the Capital Beltway in Maryland between the MD 190 and I-270 West Spur / I-495 interchanges. Direct access ramps would be provided at the existing Westlake Terrace, Montrose Road, and I-370 interchanges and at a new direct access only interchange with Gude Drive. The direct access ramps would provide a direct link between the managed lanes and cross roads. These interchange configurations are described in more detail below. Interchanges The existing 15 interchanges located in the study limits would be modified to accommodate the widened mainline typical sections and reconfigured as needed to provide direct access to the managed lanes or other ramp enhancements. In addition, Alternative 4 would include one new direct access interchange with Gude Drive. The interchange improvements are described in detail below. The typical section for new and reconfigured interchange ramps would be consistent throughout the project, regardless of the type: loop, directional, flyover, or direct access. On one-lane ramps the section would include a 4-foot left shoulder, a 15-foot lane, and a 10-foot right shoulder. On multi-lane ramps the shoulders would be maintained at 4 feet and 10 feet and the lane widths would be reduced to 12 feet per lane. More detailed study could determine if the ramp typical sections need to be modified to address sight distance limitations. The design speed for all loop ramps would range from 25 to 30 mph. The design speed on all directional, flyover, and direct access ramps would generally range from 35 to 50 mph.

WEST SIDE MOBILITY STUDY
July 2009 33
SR 193 / Georgetown Pike Interchange The SR 193 interchange ramps would be adjusted to accommodate the widened mainline. The SR 193 Bridge over the Capital Beltway would be reconstructed to accommodate the widened mainline. No direct access ramps would be provided for the managed lanes. George Washington Memorial Parkway Interchange The George Washington Memorial Parkway interchange ramps would be adjusted to accommodate the widened mainline. The George Washington Memorial Parkway Bridges over the Capital Beltway would be reconstructed to accommodate the widened mainline. No direct access ramps would be provided for the managed lanes. Clara Barton Parkway Interchange The Clara Barton Parkway interchange ramps would be adjusted to accommodate the widened mainline. No direct access ramps would be provided for the managed lanes. MD 190 / Cabin John Parkway Interchange The MD 190 and Cabin John Parkway interchange ramps would be adjusted to accommodate the widened mainline. The MD 190 Bridge over the Capital Beltway would be reconstructed to accommodate the widened mainline. No direct access ramps would be provided for the managed lanes. I-270 West Spur / I-495 Interchange The I-270 West Spur / I-495 Interchange would be designed to accommodate future managed lane direct ramps along the Capital Beltway. The outer loop overpass bridge would be reconstructed to accommodate the widened I-270 West Spur typical section. The inner loop within the interchange would be shifted toward the outside to accommodate a future managed lane structure in the median (Capital Beltway median over the northbound direction of the I-270 West Spur) and also to avoid widening toward the outer loop because Thomas Branch runs directly parallel to the Beltway within the interchange. The widening along the inner loop would result in displacements to four residential properties. Democracy Boulevard The existing interchange ramps would be adjusted to accommodate the widened mainline typical section. No direct access ramps would be provided for the managed lanes. Westlake Terrace The Westlake Terrace interchange would provide the same configuration as the existing condition where by the HOV direct access ramps would be converted to direct access ramps to the managed lanes. No additional ramp movements would be added to the interchange and it would only provide access to / from the north. MD 187 / Rockledge Boulevard The existing MD 187 and Rockledge Drive interchanges are constructed as one combined interchange with complimentary ramp movements to/from I-270. The existing interchange ramps would be adjusted to accommodate the widened mainline typical section. The MD 187 and Rockledge Drive bridges over the I-270 East Spur would be reconstructed to accommodated the widened mainline. No direct access ramps would be provided for the managed lanes.

WEST SIDE MOBILITY STUDY
July 2009 34
Y-Split The Y-split interchange would retain a similar layout to the existing interchange, with HOV ramps converted to managed lane ramps. However, the widened mainline, and proposed design for two-lane ramps, require the reconstruction of the ramp structures to replace all existing structures in the center of the interchange. Montrose Road The Montrose Road interchange would be modified to provide four new direct access ramps for the managed lanes. To accommodate the direct access, left turn lanes, as well as a signalized intersection, would be added to Montrose Road. The left turn lanes would require widening the Montrose Road overpass. The addition of the direct access intersection would cause conflicting maneuvers with the existing weaving areas between the loop ramps on Montrose Road. To eliminate this conflict, the existing northwest and southeast loop ramps would be removed and replaced with left turn spurs that would tie to the existing outer directional ramps. The remaining existing loop ramps in the northeast and southwest quadrants, and all existing directional ramps, would be modified to accommodate the widened mainline typical section. The Montrose Road Bridge over I-270 would have to be reconstructed to accommodate the reconfigured interchange and widened and reconfigured mainline. MD 189 / Great Falls Road The existing interchange ramps would be adjusted to accommodate the widened mainline typical section. The existing MD 189 Bridge over I-270 would be reconstructed to accommodate the widened and reconfigured mainline. No direct access ramps would be provided for the managed lanes. MD 28 / West Montgomery Avenue The existing interchange ramps would be adjusted to accommodate the widened mainline typical section. The existing MD 28 Bridge over I-270 would be reconstructed to accommodate the widened and reconfigured mainline. No direct access ramps would be provided for the managed lanes. Gude Drive A new interchange would be provided with Gude Drive. The interchange would only provide direct access for the managed lanes; no interchange ramps would be provided for general purpose lanes. The four direct access ramps would be located in the median of I-270 and would tie to the Gude Drive Bridge over I-270, which would have to be reconstructed to accommodate the widened and reconfigured mainline. The segment of I-270 north and south of Gude Drive is surrounded by commercial and residential properties. For this reason, the mainline approaches to Gude Drive would be enclosed with retaining walls in both the northbound and southbound directions to minimize impacts to these properties. Shady Grove Road The existing interchange ramps would be adjusted to accommodate the widened mainline typical section. The existing Shady Grove Road Bridge over I-270 would be reconstructed to accommodate the widened and reconfigured mainline. No direct access ramps would be provided for the managed lanes.

WEST SIDE MOBILITY STUDY
July 2009 35
I-370 Interchange The I-270 / I-370 interchange, located at the northern end of the project, is a four-leg directional interchange. Five different options were developed for proposed modifications to this interchange, which involved different ramp configurations and alignments. Multiple options were evaluated to determine what configurations would best balance the geometric and operational requirements of the system-to-system (I-270 / I-370 / ICC) connection and the environmental and property impacts that would result from widening the highways and increasing the footprint of the interchange. The figures included in the Appendix show two of the potential interchange configurations that were studied in more detail. Both of the interchange configurations shown in Appendix A would provide the same general improvements (though the specific engineering details for each interchange would vary). Direct access ramps would be provided for both directions of I-270 to allow managed lane movements to and from the east side of I-370, heading to and from the ICC. The existing ramps providing access for the general purpose lanes would be modified to accommodate the widened mainline and direct access ramps. Due to the complex design of flyover ramps at I-370, the proposed design would require the reconstruction of three existing bridges, as well as the addition of five new ramp bridges. The existing I-270 bridge over I-370 would need to be widened to accommodate the widened mainline typical section. The north side of the I-370 interchange would be enclosed by retaining walls on both the I-270 northbound and southbound roadways to minimize impacts to existing communities. In addition, the interchange options were all developed to integrate with the interchange and mainline improvements being considered as part of the I-270 Multi-Modal Corridor Study, which included direct access ramps between I-370/ICC and the managed lanes being considered as part of the I-270 Multi-Modal Corridor Study, north of this interchange. Bridge Overpasses In addition to the interchange structures, several overpasses would have to be reconstructed to accommodate the widened and reconfigured mainline. These would include Old Dominion Drive and Live Oak Drive over the Capital Beltway in Virginia; Persimmon Tree Road and Bradley Boulevard over the Capital Beltway in Maryland; and Wooten Parkway over the I-270 mainline. Traffic Analysis Under Alternative 4, one lane would be added and one general purpose lane would be converted to a managed lane to create two managed lanes in each direction along the Capital Beltway. The existing HOV lane along the I-270 West Spur and I-270 mainline would be converted to a managed lane and one additional barrier-separated managed lane would be constructed. The managed lanes and general purpose lanes would be separated by a concrete traffic barrier. In the CD Road section of the I-270 mainline, the general purpose and CD Road lanes would be separated by a buffer. The capacity thresholds and related LOS values for the Alternate 4 are shown in Table C-4. The total volume; the volume distribution between the managed lanes, general purpose lanes, and CD Road lanes; the v/c ratios; and LOS values for various freeway segments along I-270 and I-495 within the limits of the project are shown in Table C-7 for Alternative 4.

WEST SIDE MOBILITY STUDY
July 2009 36
In the southbound direction, during the AM peak, 6 of 13 highway segments would be failing and there would be bottlenecks on the following segments:
• I-495 between Cabin John Parkway and MD 190 • I-270 West Spur between I-495 and Democracy Boulevard
This would be the same number of failing highway segments as the No-Build and would eliminate the bottleneck on the I-270 mainline between MD 189 and MD 28. In the northbound direction, during the PM peak, 4 of 13 highway segments would be failing and there would be a bottleneck on the I-270 West Spur between I-495 and Democracy Boulevard. This would be five fewer failing highway segments than the No-Build and would eliminate the bottlenecks on I-495 between Clara Barton Parkway and Cabin John Parkway and on the I-270 mainline between MD 189 and MD 28. A new bottleneck would be created north of the I-270 Spurs due to the additional capacity provided on the I-270 West Spur that would allow additional traffic to the I-270 mainline. Cost / Impacts Preliminary Impacts Preliminary property and environmental impacts were estimated based on an assumed right-of-way / limit-of-disturbance that was offset 25 feet from the proposed limit of grading or outside edge of retaining wall. It was assumed that property displacements would result when the edge of a building was ten feet or less from the proposed right-of-way line. The proposed improvements would result in impacts to 266 properties, including 18 displacements (17 residential and one commercial). The widening along the Capital Beltway, I-270 Spurs, and the I-270 mainline could impact 114 wetlands / Waters of the U.S. and approximately 14.4 acres of park. Impact Minimization Analysis Additional investigation was conducted to identify potential modifications to the Alternative 4 typical section that could minimize the number and size of property displacements. There were four general locations with extensive impacts where these modifications were considered: along the Capital Beltway inner loop just south and within the I-495 / I-270 West Spur interchange; the southwest quadrant of the MD 28 / West Montgomery Avenue interchange; along southbound I-270 south of Gude Drive; and along southbound I-270 north of I-370. Four residential displacements would result from the proposed improvements in the vicinity of the I-495 / I-270 West Spur interchange. After reviewing the proposed alignment and interchange configurations, it was determined that the impacts associated with these improvements could not be reduced without shifting the entire alignment of the Capital Beltway toward the outer loop, which, as noted in the interchange descriptions above, would directly impact Thomas Branch. SHA had previously determined that the Thomas Branch should not be further impacted by widening of the Beltway due to the floodplain elevations and the adjacent residences. Several residential buildings would be impacted by the I-270 widening and interchange improvements in the southwest quadrant of the MD 28 interchange. There were three options that could eliminate these displacements: elimination of the assumed 10-foot buffer from the proposed right-of-way line; a reduction of the southbound median general purpose shoulder

WEST SIDE MOBILITY STUDY
July 2009 37
from ten feet to four feet; or a reduction of the southbound right general purpose shoulder from twelve feet to six feet. Due to the preliminary nature of this study, a decision was not made on the optimal minimization effort. Several buildings along the southbound roadway would be impacted by the I-270 widening and new interchange at Gude Drive. These impacts could be reduced but not eliminated by reducing all of the shoulders in the southbound direction to 4 feet. This would likely eliminate direct displacements, but would still result in impacts to the parking areas of adjacent buildings. Several buildings north of the I-370 interchange would be displaced by the proposed widening and interchange improvements. The number of displacements could be reduced to match the displacements from similar improvements proposed as part of the I-270 Multi-Modal Corridor Study assuming the 10-foot offset from the proposed right-of-way line were eliminated. The 10-foot offset was not included in the I-270 Multi-Modal Corridor Study. Preliminary Cost The cost is estimated at $2.65 billion (2009 dollars) or $2.27 billion in 2008 dollars, which is the highest cost of all long-term alternatives. Status / Conclusion Alternative 4 would provide some operational improvements compared to the No-Build; however, it would require the most significant widening and interchange modifications and would result in the largest impacts and highest cost of all long-term alternatives being considered. Due to the operational improvements provided by this alternative and the two-lane managed lane system and associated interchange improvements, it was determined that Alternative 4 should be evaluated in greater detail in a subsequent planning study.

WEST SIDE MOBILITY STUDY
July 2009 38
Table C-7: Capacity Calculations – 2030 Build Alternative 4
# LanesForecast
Vol.HCS Adj. Capacity v/c LOS # Lanes
ResultingVol.
HCS Adj. Capacity v/c LOS # Lanes
ResultingVol.
HCS Adj. Capacity v/c LOS # Lanes
ForecastVol.
HCS Adj. Capacity v/c LOS # Lanes
ResultingVol.
HCS Adj. Capacity v/c LOS # Lanes
ResultingVol.
HCS Adj. Capacity v/c LOS
# LanesForecast
Vol.HCS Adj. Capacity v/c LOS # Lanes
ResultingVol.
HCS Adj. Capacity v/c LOS # Lanes
ResultingVol.
HCS Adj. Capacity v/c LOS # Lanes
ForecastVol.
HCS Adj. Capacity v/c LOS # Lanes
ResultingVol.
HCS Adj. Capacity v/c LOS # Lanes
ResultingVol.
HCS Adj. Capacity v/c LOS
Assumptions for Truck Percentages: Assumptions for Truck Percentages:AM Peak PM Peak AM Peak PM Peak
I-495 6% 7% I-495 7% 5%I-270 Spur 5% 5% I-270 Spur 5% 5%I-270 8% 5% I-270 6% 5%
Total Volume
A1 - 2,179
- 6,676 0.00
4,451 0.0020.00 A
2
Total Volume
ETL
B
3,850
4,800
PM Peak Period - Southbound (2030 Alternative 4)
2,000 4,358
3
2,125 4,358 0.49 B 4
2,125 0.49
-
100% -
4,451 100%
0.80 C65% 7,556 11,127 0.68 4,069 5,100
0.88 D
100% 6,350 6,676 0.95 E
100% 7,875 8,901
11,625
8,475
10,000
4,975
9,125
A100% - 4,408 0.00
- 4,408
1 0.00 A 22,158
A1 2,158 0.00 A 2 0.00100%
B0.75 D 3 24% 2,598 6,522 0.40
D
100% 8,000 8,815
100% 5,850 6,611 0.88
0.91 E
3
3
3,780
76%
4
3
43%
D56% 3,200
2,644
2,442 4,350 4,958 0.304,295
8,350 2
1,300
2,125
2
2,125
13,223
0.778,525 11,019
0.838,815
6,950 0.79
6,676
2
4,358
D
61%3,325
6,676
5,643
2
100%
D4,316
1
0.74
3
3,300
3,325
5
A
D3,300 4,358
4,358
B
3
2
2
0.00
3,200
2,158
3,000
3
- 4,451
4,451
A0.00
0.79
C 1.06
D 0.81
4,590 51%2
0.87
0.00
0.66
60%
4,410 6,676
6,676
5,280 6,676
5,280
D
1
1
VA 193F
I-495
MD 187
2,125
2,179 A
4,358
B
0.00
4,358 0.49
- 2,179
0.46
0.20
0.47
4,358
4,358 B
4,358
4,358
2
0.30 B
0.30 B
2 1,325
0.37 B
2
4,358 B0.30
2
2 1,600 4,358
22
100% 4,300
100%
100%
3,200 4,316 0.74 1,325
3,200 4,316
6,611 0.855,650 D
875
4,316
E4,451
8,075 2
2,050
D
4,358
0.74
0.69
0.37
0.37
2,050 4,295 0.48 B
4,295 0.47 B
0.37 B
4,295 0.30 A
A
A
875 4,295 0.20 A
0.49 B
0.20 A
2
2
2
2,125 4,337
2
2
2
2
3,000
2
Interchange
AM Peak Period - Northbound (2030 Alternative 4)
% of GP+CD (2006 Count)
% of GP+CD (2006 Count)
TotalVolume
100% 12,250 13,287
4,337 0.37 B
6
4
1,600 4,337
100% 8,900 8,858
A- 6,611 0.00A
C
8,227 11,019
3 100%
5
4,337
0.37
B
3,200 4,316 0.74 D
1,600
B
1,600
2,158
D
4,337
0.74
4,316 0.37
0.77
0.74
4,337
0.00
0.69
4,316 0.71
4,337
4,316 0.74
3,075
1A
MD 187
10,825
I-495A
VA 193
0.87
0.88
0.82
34%
I-270 Y-Split
0.75
0.81
2
0.68
100% 7,775 8,858 MD 190
4,337 0.49 B
2,125 4,337
12,200 2
Clara Barton Parkway Gude Drive
VA 19312,250 E
11,600 4,337 9,250
3,325
2
100% 9,025 11,073
100% 7,700 8,858
244% 4,350 0.682,970 Clara Barton Parkway
2George Washington
11,075 4,350
C0.57 9,050
C0.57 44%
2
2
6,580
100% 3,625 4,451
A
0.374,295 1,600 B
0.002,168
3 57%
56%
A 2
3,780
100%
100%
3
-
2
3 100% -
6,580
A0.00
0.004,386
4,386
2 0.97
0.97
0.74
11,127
7,175
0.301,300
1,600 4,295
4,295
-
2,158 0.00
0.76
0.76
0.74
0.76
0.76
0.76
1
2,158 1
0.00
3
3
D
3
0.85
0.82
4,350
39%
2
40% 3,520 4,350
D
0.79
E
A A
A100% -
100% - 6,676
0.00
7,275
1 100%
2,168 0.00
2,168
PM Peak Period - Northbound (2030 Alternative 4)
3,200
CD Lanes
D2,970
A
4,350
3,608 4,350
2
40% 3,520
2
D
6,025
10,750
3,325
2
2
2
4,337 0.77
6,800
% of GP+CD (2006 Count)
Rockledge Drive
I-270 Y-Split
Interchange
6,850
2
0.63
1.070.49 B
3,300 0.836,644
64%0.77
0.91
0.99
0.00
AM Peak Period - Southbound (2030 Alternative 4)
I-370
67% 5,544
4,337 3,300
2
0.35E 3 B
CD Lanes GP Lanes CD Lanes
% of GP+CD (2006 Count)
ETL
% of GP+CD (2006 Count)Interchange
ETL GP Lanes
1.00
0.92
0.49 B
F
3
3 100% 7,125 6,644
0.76 D11,575
2
0.76 D 3 6,644 74% 6,586
E 2
0.6836% 4,350
GW ParkwayShady Grove
Road11,025 F
5
100% 4,575 4,451 1.03
CD 2
#'s
in R
ed a
re fr
om F
ield
C
ount
s, #
's in
Bla
ck a
re
assu
med
2
D
3,103
D3,325 4,337 3 D5,296 6,644 0.80 DCabin John Parkway MD 28
9,825 D 11,550 3 6,644 0.7157% 4,688 0.81C 2 43% 3,537 4,350 MD 189
9,900 D4
4
2 12,450 2
5,450
2
D 3 6,023 6,644 66% 4,350
26% 2,314 6,522
33% 2,731 4,350
34%
2,979
0.71 DAt-Grade Access
Montrose Road
9,900 D 13,425 2 3,225
D
D 5 100% 10,200
6,676 0.58 C3 100%
West Lake Terrace
11,073 0.92 E
C
E2 100% 0.81
2
I-495/I-270 West Spur
5,450 FDemocracy Boulevard
875 4,337 0.20 A
875 4,295
4,500 D
2,793 6,580
5,625 3,625 4,451 2,000
2
C
0.42 B 2,107 4,350 0.48 C
West Lake Terrace
D I-495/I-270 West Spur
3,850
3 100% 6,676 0.583,850 Democracy Boulevard
9,775 C10,966 0.705 100% 7,725
2 100% 4,451 0.994,425
Montrose Road
At-Grade Access
9,075 D CMD 190
C
6,580
6,580
#'s
in R
ed a
re fr
om F
ield
Cou
nts,
#'s
in B
lack
are
ass
umed
I-270 Y-Split
3 66% 0.61MD 189
8,700 D 0.5667%
5,132
0.90 E
10,750 5 100% 11,019 9,150 0.83 D
0.86
7,975
7,550 4,350 0.78 2
Cabin John Parkway
D
3,200 2 33%
8,815 4
11,175 4
100%
4,316 2 100% 8,815
2
1,300 2
Shady Grove Road
6,500 I-370
2
Gude Drive8,050
MD 28
GP Lanes CD Lanes
MD 187Rockledge
Drive
I-270 Y-Split
I-495
InterchangeTotal
Volume
GP Lanes
A 6,580
ETL
% of GP+CD (2006 Count)
0.001
3 59% 0.461,600 4,358 0.37 BVA 193 I-370
9,950 D6 9,950 0.75
75% 4,463
B
% of GP+CD (2006 Count)
3
6,676 0.67 C
% of GP+CD (2006 Count)
0.42 BGW Parkway
Shady Grove Road
10,475 D 7,550 3 2 0.44 BClara Barton Parkway Gude Drive
8,850 D 7,275 3 6,676 0.59 C 2 0.60 BCabin John Parkway MD 28
10,375 D 7,700 3 6,676 0.57 C60% 3,825
2,132 5,100
25% 1,488 3,400
3 78% 5,265 1,325 MD 190 MD 189
10,150 D
D2 8,815 0.81
8,815 0.79 D 2
C2
#'s
in R
ed a
re fr
om F
ield
C
ount
s, #
's in
Bla
ck a
re
assu
med
22% 1,485 3,400
41%
34% 2,023 3,400
0.44
0.7540% 2,550 3,400
BAt-Grade Access
Montrose Road
10,150 D 8,050 5 100% 6,000 11,127 0.54 CI-495/I-270 West Spur
5,925 2 1,625 4,358
1,625 4,316 0.38
Democracy Boulevard
I-270 Y-Split
5,925 2 1,625 4,358 B E2
0.45
4,451 0.97
B 2
4,451
4,300 C
B
A
B
West Lake Terrace
West Lake Terrace
7,300 2
3 100% 2,975 6,676
0.45 B
I-270 Y-Split
Democracy Boulevard
12,400 2 3,225 4,358 D
3
0.88 D2 100%I-495/I-270 West Spur
52 875 4,358 0.20 A
3,925 4,451 2 875 4,358 0.20 A
0.83
3,133 4,350 5,818 2D
2D
65%
DMontrose Road
At-Grade Access
12,575 2 D
100% 8,250 11,127 0.74
0.799,125 42 2,125 4,358 0.49 B 7,000
#'s
in R
ed a
re fr
om F
ield
Cou
nts,
#'s
in B
lack
are
ass
umed
6,676
6,676
66%
100%
3,927
8,901
100% 2,975 6,676
3,068
2
2
0.72 D
D0.81 Clara Barton Parkway
2
D George Washington
MD 189 MD 19012,275 2 3,325 4,358 35%
MD 28Cabin John
ParkwayD
D100% 7,125 8,901 0.809,250 4
Shady Grove Road
12,300 2I-370
12,100 Gude Drive
12,125 2
100%
#'s
in R
ed a
re fr
om F
ield
Cou
nts,
#'s
in B
lack
are
ass
umed
4
4
4
100%
100%
100%
49%
60%
I-270 Y-Split
1
4,300
3
9,175
2 100%
5
4,358
D
-
I-4952 100%
MD 187Rockledge
Drive
A
0.00 A
I-270 Y-Split3 100%0.00 ARockledge
Drive
#'s
in R
ed a
re fr
om F
ield
Cou
nts,
#'s
in B
lack
are
ass
umed
#'s
in R
ed a
re fr
om F
ield
C
ount
s, #
's in
Bla
ck a
re
assu
med
#'s
in R
ed a
re fr
om F
ield
C
ount
s, #
's in
Bla
ck a
re
assu
med
35%5 C 3
D

WEST SIDE MOBILITY STUDY
July 2009 39
7. Alternative 5 Description This alternative would have the same interchange improvements and direct access locations as described in Alternative 4. Alternative 5 would provide a two-lane managed lane system in both directions throughout the study corridor; however, the additional capacity in the I-270 mainline corridor would be provided by restriping the section in each direction between the median barrier and outside barrier separating the CD Road from the general purpose lanes. The improvements are described below. Capital Beltway The section of the Capital Beltway in Virginia would provide two HOT / transition lanes and four general purpose lanes per direction as described in Alternative 1. The American Legion Bridge would be widened to accommodate one extra lane per direction, and this alternative would also include converting one general purpose lane to a managed lane to provide two managed lanes, three general purpose lanes, and one auxiliary lane per direction, similar to Alternatives 2, 3, and 4. The section of the Capital Beltway located in Maryland between the American Legion Bridge and I-270 West Spur would be widened by one lane in each direction, and this alternative would include converting one general purpose lane to a managed lane to provide two managed lanes and three general purpose lanes per direction, similar to Alternatives 2, 3, and 4. I-270 West Spur The I-270 West Spur would be widened to accommodate one additional lane and a concrete traffic barrier between the median two lanes, which would be operated as managed lanes, and the general purpose lanes. The HOV lane would be converted to a managed lane. I-270 Mainline The I-270 mainline between the Y-Split interchange and the start of the CD Road system south of Montrose Road would be widened to provide an additional lane. The left two lanes in each direction would be operated as managed lanes and separated from the right five lanes by a four-foot buffer. The HOV lanes would be converted to managed lanes. Within the CD Road section, from south of Montrose Road to I-370, the mainline would be restriped to provide an additional lane and a two-foot buffer between the left two lanes, which would be operated as managed lanes, and the remainder of the highway. In order to accommodate the additional lane and two-foot buffer on the mainline, the median shoulder would be reduced to a two-foot offset and the right shoulder would be reduced to nine feet. The HOV lanes would be converted to managed lanes. I-270 East Spur The I-270 East Spur would be widened to accommodate a concrete traffic barrier between the median lane, which would be converted from a peak period HOV lane to a managed lane, and the general purpose lanes. The total number of lanes on the I-270 East Spur would be the same as the existing condition, similar to Alternatives 2 and 3.

WEST SIDE MOBILITY STUDY
July 2009 40
The proposed typical sections for Alternative 5 are shown in Figures C-1, C-7, C-8, C-12, C-16, and C-17. Managed Lanes Access Access to the managed lanes would be provided at specified at-grade locations and through direct access ramps at several interchanges. At-grade access would be provided at the southern end of the system, south of the American Legion Bridge in Virginia. An additional at-grade access would be located along the Capital Beltway in Maryland between the MD 190 and I-270 West Spur / I-495 interchanges. Direct access ramps would be provided at the existing Westlake Terrace, Montrose Road, and I-370 interchanges, and at a new direct access only interchange with Gude Drive. The existing Westlake Terrace HOV access ramps would be converted to managed lanes access ramps; the Montrose Road and I-370 interchanges would be modified to provide direct access ramps; and only direct access ramps would be provided at Gude Drive (no general purpose ramps). The direct access ramps would provide a direct link between the managed lanes and cross roads. Traffic Analysis Under Alternative 5, one lane would be added and one general purpose lane would be converted to a managed lane to create two managed lanes in each direction along the Capital Beltway. The existing HOV lane along the I-270 West Spur and I-270 mainline would be converted to a managed lane and one additional managed lane would be constructed. The managed lanes and general purpose lanes would be separated by a painted buffer along the I-270 mainline. The volumes would be the same between Alternatives 4 and 5. However, for Alternative 5, the capacities would be reduced due to the reduction in shoulder widths. Alternative 5 would provide two-foot left offset, a none-foot right shoulder, and a two-foot buffer between the managed and general purpose lanes. The capacity thresholds and related LOS values for Alternative 5 are shown in Table C-8. The total volume; the volume distribution between the managed lanes, general purpose lanes, and CD Road lanes; the v/c ratios; and LOS values for various freeway segments along I-270 and I-495 within the limits of the project under the 2030 Build Alternative 5 are shown in Table C-9. In the southbound direction, during the AM peak, 7 of 13 highway segments (between interchanges) would be failing and there would be bottlenecks on the following segments:
• I-495 between Cabin John Parkway and MD 190 • I-270 West Spur between I-495 and Democracy Boulevard
This would be one more failing highway segment than the No-Build. The bottleneck on the I-270 mainline between MD 189 and MD 28 would be eliminated. In the northbound direction, during the PM peak, 5 of 13 highway segments (between interchanges) would be failing and there would be bottlenecks on the following segments:
• I-495 between Clara Barton Parkway and Cabin John Parkway • I-270 West Spur between I-495 and Democracy Boulevard
This would be four fewer failing highway segments than the No-Build and would eliminate the bottleneck on the I-270 mainline between MD 189 and MD 28. A new bottleneck would be

WEST SIDE MOBILITY STUDY
July 2009 41
created north of the I-270 Spurs due to the additional capacity provided on the I-270 West Spur that would feed additional traffic to the I-270 mainline. Cost / Impacts Preliminary property and environmental impacts were estimated based on an assumed right-of-way / limit-of-disturbance that was offset 25 feet from the proposed limit of grading or outside edge of retaining wall. It was assumed that property displacements would result when the edge of a building was ten feet or less from the proposed right-of-way line. The proposed improvements would result in impacts to 193 properties, including 18 displacements (17 residential and one commercial). The widening along the Capital Beltway, I-270 Spurs, and mainline could impact 79 wetlands / Waters of the U.S. and approximately 14.4 acres of park. These impacts are the same as Alternative 2. The cost is estimated at $2.09 billion (in 2008 dollars). Status / Conclusion Alternative 5 would provide some operational improvements compared to the No-Build, but less than Alternative 4 due to the narrow shoulders. Alternative 5 would result in significant impacts and high cost. Due to the operational improvements provided by this alternative and the two-lane managed lane system and associated interchange improvements, as well as the reduced impacts along I-270 compared with Alternative 4, it was determined that Alternative 5 should be evaluated in greater detail in a subsequent planning study.

WEST SIDE MOBILITY STUDY
July 2009 42
Table C-8: Capacity Thresholds for HOV, GP, and CD Lanes – 2030 Build Alternative 5
0.95 0.95 0.955 5 1
65 65 60Level Level Level
Unadjusted Capacity 2,350 Unadjusted Capacity 2,400 Unadjusted Capacity 2,300HCS LOS Thresholds HCS LOS Thresholds HCS LOS Thresholds Adjusted Flow Rates Adjusted Flow Rates Adjusted Flow Rates
1 Lane 2 Lanes LOS 2 Lanes 3 Lanes 4 Lanes 5 Lanes 6 Lanes LOS 1 Lane 2 Lanes 3 Lanes LOS0 0 A 0 0 0 0 0 A 0 0 0 A
659 1318 B ## 1429 2144 2858 3573 4288 B 625 1249 1872 B1085 2171 C ## 2337 3506 4675 5844 7012 C 1022 2043 3063 C1558 3116 D ## 3283 4924 6566 8207 9848 D 1476 2951 4425 D1938 3876 E ## 3987 5981 7974 9968 11962 E 1909 3817 5723 E2179 4358 F ## 4451 6676 8901 11127 13352 F 2175 4350 6522 F
0.95 0.95 0.956 6 1
65 70 60Level Level Level
Unadjusted Capacity 2,350 Unadjusted Capacity 2,400 Unadjusted Capacity 2,300HCS LOS Thresholds HCS LOS Thresholds HCS LOS Thresholds Adjusted Flow Rates Adjusted Flow Rates Adjusted Flow Rates
1 Lane 2 Lanes LOS 2 Lanes 3 Lanes 4 Lanes 5 Lanes 6 Lanes LOS 1 Lane 2 Lanes 3 Lanes LOS0 0 A 0 0 0 0 0 A 0 0 0 A
656 1312 B ## 1422 2133 2844 3556 4267 B 625 1249 1872 B1080 2160 C ## 2326 3489 4652 5815 6978 C 1022 2043 3063 C1550 3101 D ## 3267 4900 6534 8167 9801 D 1476 2951 4425 D1929 3857 E ## 3968 5952 7936 9920 11904 E 1909 3817 5723 E2168 4337 F ## 4429 6644 8858 11073 13287 F 2175 4350 6522 F
0.95 0.95 0.957 7 1
65 70 60
Level Level LevelUnadjusted Capacity 2,350 Unadjusted Capacity 2,400 Unadjusted Capacity 2,300HCS LOS Thresholds HCS LOS Thresholds HCS LOS Thresholds Adjusted Flow Rates Adjusted Flow Rates Adjusted Flow Rates
1 Lane 2 Lanes LOS 2 Lanes 3 Lanes 4 Lanes 5 Lanes 6 Lanes LOS 1 Lane 2 Lanes 3 Lanes LOS0 0 A 0 0 0 0 0 A 0 0 0 A
653 1305 B ## 1415 2123 2831 3538 4246 B 625 1249 1872 B1075 2150 C ## 2315 3472 4630 5787 6945 C 1022 2043 3063 C1543 3086 D ## 3251 4877 6502 8128 9753 D 1476 2951 4425 D1919 3839 E ## 3949 5923 7897 9872 11846 E 1909 3817 5723 E2158 4316 F ## 4408 6611 8815 11019 13223 F 2175 4350 6522 F
0.95 0.95 0.958 8 1
65 70 60Level Level Level
Unadjusted Capacity 2,350 Unadjusted Capacity 2,400 Unadjusted Capacity 2,300HCS LOS Thresholds HCS LOS Thresholds HCS LOS Thresholds Adjusted Flow Rates Adjusted Flow Rates Adjusted Flow Rates
1 Lane 2 Lanes LOS 2 Lanes 3 Lanes 4 Lanes 5 Lanes 6 Lanes LOS 1 Lane 2 Lanes 3 Lanes LOS0 0 A 0 0 0 0 0 A 0 0 0 A
650 1301 B ## 1409 2113 2817 3521 4226 B 625 1249 1872 B1070 2139 C ## 2304 3456 4608 5759 6911 C 1022 2043 3063 C1536 3071 D ## 3235 4853 6471 8089 9706 D 1476 2951 4425 D1910 3820 E ## 3930 5895 7859 9824 11789 E 1909 3817 5723 E2148 4295 F ## 4386 6580 8773 10966 13159 F 2175 4350 6522 F
Measured FF Speed Measured FF Speed Measured FF SpeedTerrain Terrain Terrain
PHF PHF PHF%Trucks %Trucks %Trucks
HCS Assumptions and Calculated Maximum Flow Rates By LOS Threshold - 8% TrucksETL General Purpose Collector Distributor (CD)
Measured FF Speed Measured FF Speed Measured FF Speed
Terrain Terrain Terrain
PHF PHF PHF%Trucks %Trucks %Trucks
HCS Assumptions and Calculated Maximum Flow Rates By LOS Threshold - 7% TrucksETL General Purpose Collector Distributor (CD)
Measured FF Speed Measured FF Speed Measured FF SpeedTerrain Terrain Terrain
PHF PHF PHF%Trucks %Trucks %Trucks
HCS Assumptions and Calculated Maximum Flow Rates By LOS Threshold - 6% TrucksETL General Purpose Collector Distributor (CD)
Measured FF Speed Measured FF Speed Measured FF SpeedTerrain Terrain Terrain
PHF PHF PHF%Trucks %Trucks %Trucks
HCS Assumptions and Calculated Maximum Flow Rates By LOS Threshold - 5% TrucksETL General Purpose Collector Distributor (CD)

WEST SIDE MOBILITY STUDY
July 2009 43
Table C-9: Capacity Calculations – 2030 Build Alternative 5
# LanesForecast
Vol.HCS Adj. Capacity v/c LOS # Lanes
ResultingVol.
HCS Adj. Capacity v/c LOS # Lanes
ResultingVol.
HCS Adj. Capacity v/c LOS # Lanes
ForecastVol.
HCS Adj. Capacity v/c LOS # Lanes
ResultingVol.
HCS Adj. Capacity v/c LOS # Lanes
ResultingVol.
HCS Adj. Capacity v/c LOS
# Lanes Vol. Capacity v/c LOS # Lanes Vol. Capacity v/c LOS # Lanes Vol. Capacity v/c LOS # Lanes Vol. Capacity v/c LOS # Lanes Vol. Capacity v/c LOS # Lanes Vol. Capacity v/c LOS
Assumptions fo Truck Percentages: Assumptions fo Truck Percentages:AM Peak PM Peak AM Peak PM Peak
I-495 6% 7% I-495 7% 5%I-270 Spur 5% 5% I-270 Spur 5% 5%I-270 8% 5% I-270 6% 5%
#'s
in R
ed a
re fr
om F
ield
Cou
nts,
#'s
in B
lack
are
ass
umed
#'s
in R
ed a
re fr
om F
ield
C
ount
s, #
's in
Bla
ck a
re
assu
med
#'s
in R
ed a
re fr
om F
ield
C
ount
s, #
's in
Bla
ck a
re
assu
med
35%5 C 3
D
A
0.00 A
I-270 Y-Split3 100%0.00 ARockledge
Drive-
I-4952 100%
MD 187Rockledge
Drive
I-270 Y-Split
1
4,300
3
9,175
2 100%
5
4,358
D
100%
#'s
in R
ed a
re fr
om F
ield
Cou
nts,
#'s
in B
lack
are
ass
umed
4
4
4
100%
100%
100%
49%
60%Shady Grove Road
12,300 2I-370
12,100 Gude Drive
12,125 2MD 28
Cabin John Parkway
D
D100% 7,125 8,901 0.809,250 4
D George Washington
MD 189 MD 19012,275 2 3,325 4,358 35%
2
2
0.72 D
D0.81 Clara Barton Parkway
2
6,676
6,676
66%
100%
3,927
8,901
100% 2,975 6,676
3,068
0.799,125 42 2,125 4,358 0.49 B 7,000
#'s
in R
ed a
re fr
om F
ield
Cou
nts,
#'s
in B
lack
are
ass
umed
DMontrose Road
At-Grade Access
12,575 2 D
100% 8,250 11,127 0.74
0.83
3,133 4,350 5,818 2D
2D
65%
3,925 4,451 2 875 4,358 0.20 A D2 100%I-495/I-270 West Spur
52 875 4,358 0.20 A
B
I-270 Y-Split
Democracy Boulevard
12,400 2 3,225 4,358 D
3
0.88
B
West Lake Terrace
West Lake Terrace
7,300 2
3 100% 2,975 6,676
0.45
0.45
4,451 0.97
B 2
4,451
4,300 C
B
A
Democracy Boulevard
I-270 Y-Split
5,925 2 1,625 4,358 B E2
0.54 CI-495/I-270 West Spur
5,925 2 1,625 4,358
1,625 4,316 0.38
BAt-Grade Access
Montrose Road
10,150 D 8,050 5 100% 6,000 11,127
34% 2,023 3,400
0.44
0.7540% 2,550 3,400
0.79 D 2
C2
#'s
in R
ed a
re fr
om F
ield
C
ount
s, #
's in
Bla
ck a
re
assu
med
22% 1,485 3,400
41%
MD 190 MD 18910,150 D
D2 8,815 0.81
8,815 3 78% 5,265 1,325
2,132 5,100
25% 1,488 3,400
0.57 C60% 3,825
2 0.60 BCabin John Parkway MD 28
10,375 D 7,700 3 6,676
BClara Barton Parkway Gude Drive
8,850 D 7,275 3 6,676 0.59 C
0.42 BGW Parkway
Shady Grove Road
10,475 D 7,550 3 2 0.4475% 4,463
B
(2006 Count)
3
6,676 0.67 C
(2006 Count)
VA 193 I-3709,950 D6 9,950 0.75 3 59% 0.461,600 4,358 0.37 B
TotalVolume
GP Lanes
A 6,580
ETL(2006 Count)
0.001
GP Lanes CD Lanes
MD 187Rockledge
Drive
I-270 Y-Split
I-495
Interchange
2
1,300 2
Shady Grove Road
6,500 I-370
2
Gude Drive8,050
MD 28
8,815 4
11,175 4
100%
4,316 2 100% 8,815 7,975
7,550 4,350 0.78 2
Cabin John Parkway
D
3,200 2 33% 0.90 E
10,750 5 100% 11,019 9,150 0.83 D
0.86
I-270 Y-Split
3 66% 0.61MD 189
8,700 D 0.5667%
5,132
Montrose Road
At-Grade Access
9,075 D CMD 190
C
6,580
6,580
#'s
in R
ed a
re fr
om F
ield
Cou
nts,
#'s
in B
lack
are
ass
umed
2 100% 4,451 0.994,425
0.583,850 Democracy Boulevard
9,775 C10,966 0.705 100% 7,725
3,850
3 100% 6,676
C
0.42 B 2,107 4,350 0.48 C
West Lake Terrace
D I-495/I-270 West Spur
4,500 D
2,793 6,580
5,625 3,625 4,451 2,000
2
I-495/I-270 West Spur
5,450 FDemocracy Boulevard
875 4,337 0.20 A
875 4,295
West Lake Terrace
11,073 0.92 E
C
E2 100% 0.81
2
D
D 5 100% 10,200
6,676 0.58 C3 100%
0.71 DAt-Grade Access
Montrose Road
9,900 D 13,425 2 3,225
4,350
26% 2,314 6,522
33% 2,731 4,350
34%
2,979
D 3 6,023 6,644 66%
5,450
2
MD 1899,900 D4
4
2 12,450 2
0.81C 2 43% 3,537 4,350 3 6,644 0.7157% 4,688
Cabin John Parkway MD 28
9,825 D 11,550
3 D5,296 6,644 0.80 DD3,325 4,337
CD 2
#'s
in R
ed a
re fr
om F
ield
C
ount
s, #
's in
Bla
ck a
re
assu
med
2
D
3,103
GW ParkwayShady Grove
Road11,025 F
5
100% 4,575 4,451 1.03
E 2
0.6836% 4,350
0.76 D 3 6,644 74% 6,586
F
3
3 100% 7,125 6,644
0.76 D11,575
2
ETL GP Lanes
1.00
0.92
0.49 B
CD Lanes GP Lanes CD Lanes
% of GP+CD (2006 Count)
ETL
% of GP+CD (2006 Count)Interchange
0.35E 3 B
0.91
0.99
0.00
AM Peak Period - Southbound (2030 Alternative 5)
I-370
67% 5,544
4,337 3,300
2 0.63
1.070.49 B
3,300 0.836,644
64%0.77
0.77
6,800
(2006 Count)
Rockledge Drive
I-270 Y-Split
Interchange
6,850
2
D
6,025
10,750
3,325
2
2
2
4,337
D2,970
A
4,350
3,608 4,350
2
40% 3,520
2
7,275
1 100%
2,168 0.00
2,168
PM Peak Period - Northbound (2030 Alternative 5)
3,200
CD Lanes
E
A A
A100% -
100% - 6,676
0.00
0.85
0.82
4,350
39%
2
40% 3,520 4,350
D
0.79
0.00
3
3
D
3
1
2,158 1
2,158 0.00
0.76
0.76
0.74
0.76
0.76
0.76
11,127
7,175
0.301,300
1,600 4,295
4,295
-
2 0.97
0.97
0.74
6,580
A0.00
0.004,386
4,386
3,780
100%
100%
3
-
2
3 100% -
3 57%
56%
A 2
A
0.374,295 1,600 B
0.002,168
6,580
100% 3,625 4,451
11,075 4,350
C0.57 9,050
C0.57 44%
2
2
244% 4,350 0.682,970 Clara Barton Parkway
2George Washington
3,325
2
100% 9,025 11,073
100% 7,700 8,858
12,200 2
Clara Barton Parkway Gude Drive
VA 19312,250 E
11,600 4,337 9,250
100% 7,775 8,858 MD 190
4,337 0.49 B
2,125 4,337
VA 193
0.87
0.88
0.82
34%
I-270 Y-Split
0.75
0.81
2
0.68 3,075
1A
MD 187
10,825
I-495A
0.00
0.69
4,316 0.71
4,337
4,316 0.74
2,158
D
4,337
0.74
4,316 0.37
0.77
0.74
4,337
4,337
0.37
B
3,200 4,316 0.74 D
1,600
B
1,600
A
C
8,227 11,019
3 100%
5
A- 6,611 0.00
4,337 0.37 B
6
4
1,600 4,337
100% 8,900 8,858
3,000
2
Interchange
AM Peak Period - Northbound (2030 Alternative 5)
% of GP+CD (2006 Count)
% of GP+CD (2006 Count)
TotalVolume
100% 12,250 13,287
2
2
2
2
2
2
2
2,125 4,337
0.49 B
0.20 A
875 4,295 0.20 A
B
4,295 0.30 A
A
A
B
4,295 0.47 B
0.37
0.37
2,050 4,295 0.48
0.37
875
4,316
E4,451
8,075 2
2,050
D
1,325
3,200 4,316
6,611 0.855,650 D
0.74
2
100% 4,300
100%
100%
3,200 4,316 0.74
2 1,600 4,358
2
0.37 B
2
4,358 B0.30
2
B
4,358
4,358
2
0.30 B
0.30 B
2 1,325
0.46
0.20
0.47
4,358
4,358
2,125
2,179 A
4,358
B
0.00
4,358 0.49
- 2,179
D
1
1
VA 193F
I-495
MD 187
0.87
0.00
0.66
60%
4,410 6,676
6,676
5,280 6,676
5,280 0.79
C 1.06
D 0.81
4,590 51%2
- 4,451
4,451
A0.00
3
2
2
0.00
3,200
2,158
3,000
3
A
D3,300 4,358
4,358
B
3
3,300
3,325
5
4,358
0.69
2
100%
D4,316
1
0.74
6,676
2
4,358
D
61%3,325
6,676
5,643
13,223
0.778,525 11,019
0.838,815
6,950 0.79
8,350 2
1,300
2,125
2
2,125
2,644
2,442 4,350 4,958 0.304,295
3
3
3,780
76%
4
3
43%
D56% 3,200 D
100% 8,000 8,815
100% 5,850 6,611 0.88
0.91 E
B0.75 D 3 24% 2,598 6,522 0.40
A1 2,158 0.00 A 2 0.00100% - 4,408
1 0.00 A 22,158 A100% - 4,408 0.00
11,625
8,475
10,000
4,975
9,125
0.88 D
100% 6,350 6,676 0.95 E
100% 7,875 8,901
0.80 C65% 7,556 11,127 0.68 4,069 5,100
-
100% -
4,451 100%
3
2,125 4,358 0.49 B 4
2,125 0.49
2
Total Volume
ETL
B
3,850
4,800
PM Peak Period - Southbound (2030 Alternative 5)
2,000 4,358
4,451 0.0020.00 A
Total Volume
A1 - 2,179
- 6,676 0.00

WEST SIDE MOBILITY STUDY
July 2009 44
8. Alternatives 5A / 5B Description In an attempt to reduce costs, two variations of Alternative 5 were considered. The first, Alternative 5A, would eliminate the direct access interchanges at Montrose Road and Gude Drive. The second, Alternative 5B, would eliminate all direct access interchanges along I-270 and would scale back the I-270 West Spur improvements to those described in Alternative 1. Traffic Analysis No additional traffic analyses were completed for Alternatives 5A and 5B. It is assumed that the mainline would operate similar to Alternative 5. Cost / Impacts The proposed Alternative 5A improvements would result in impacts to 115 properties, including 15 displacements (14 residential and one commercial). The widening along the Capital Beltway, I-270 Spurs, and the I-270 mainline could impact 49 wetlands / Waters of the U.S. and approximately 14.4 acres of park. The cost for Alternative 5A is estimated at $1.66 billion (in 2008 dollars). The proposed Alternative 5B improvements would result in impacts to 70 properties, including 4 residential displacements. The widening along the Capital Beltway could impact 5 wetlands / Waters of the U.S. and approximately 3.2 acres of park. These are the same impacts as Alternative 1. The cost for Alternative 5B is estimated at $1.1 billion (in 2008 dollars). Status / Conclusion Alternatives 5A and 5B would provide the same traffic operational improvements and result in fewer impacts than Alternative 5, but would still include significant cost. In addition, Alternatives 5A and 5B would provide fewer direct access locations for the managed lanes, which may reduce the operational effectiveness of the managed lane system. Due to the operational improvements provided by these alternatives and the two-lane managed lane system, as well as the reduced impacts along the I-270 West Spur and the I-270 mainline compared with Alternative 5, it was determined that Alternatives 5A and 5B should be evaluated in greater detail in a subsequent planning study.

WEST SIDE MOBILITY STUDY
July 2009 45
9. Summary The long-term alternatives would provide additional capacity and a managed lanes system along the Capital Beltway and I-270 between the Virginia HOT Lanes and I-370, which were SHA’s primary goals for evaluating improvements within the study corridor. However, the long-term alternatives would require widening along some or all segments of highway within the study limits. The widening would result in property impacts, displacements, and environmental impacts. In addition, the roadway and interchange improvements would be costly to implement, with a cost range between $1.04 billion (2008 dollars) for Alternative 1 and $2.27 billion (2008 dollars) for Alternative 4. The long-term alternatives would have significant cost and impacts to implement the improvements along the Capital Beltway, I-270 Spurs, and I-270 mainline, but several of the long-term alternatives would also result in improved traffic operations compared with a future No-Build scenario. Therefore, it was determined that several of the alternatives should be evaluated further as part of a subsequent planning study. Alternative 1, Alternative 4, Alternative 5, Alternative 5A, and Alternative 5B will all be considered further. Alternatives 2 and 3 would not offer the operational improvements as the other alternatives, especially when considering associated cost and impacts. These alternatives will not be evaluated further. Given the cost and impacts associated with all of the long-term alternatives, it was also determined that smaller, less costly, and less impactive improvements should be evaluated. These short and mid-term improvements are presented in Chapters D and E.

LEGEND
Managed Lanes (HOV, HOTor ETL)
Existing Pavement
New Pavement
Converted General Purposeto Managed Lane
FigureDate
JULY 2009
BE L T W A
Y
CAPITAL
MARYLAND
V I R G I N I A
Not to scale
270INTERSTATE
WEST SIDE MOBILITY STUDY
146'
12'
Shldr.
12'
Shldr.
12'
Shldr.
12'
Shldr.
48'
4 x 12' GP Lanes
48'
4 x 12' GP Lanes
2' Median
EXISTING CONDITIONS
194'
28' Widening 28' Widening
10'
Shldr.
10'
Shldr.
10'
Shldr.
10'
Shldr.2 x 12' Managed /GP Lanes
2 x 12' Managed /GP Lanes
24' 24'
2' Median4' Buffer 4' Buffer
48'
4 x 12' GP Lanes
48'
4 x 12' GP Lanes
• Add 2 Managed / GP lanes in each direction
ALTERNATIVES 1, 2, 3, 4, and 5
NOTES• There is a 3-lane CD Road along the outer loop between the George Washington Parkwayand SR 193.
LONG-TERM ALTERNATIVES -VIRGINIA CAPITAL BELTWAY
C-1

LEGEND
Managed Lanes (HOV, HOTor ETL)
Existing Pavement
New Pavement
Converted General Purposeto Managed Lane
FigureDate
JULY 2009
BE L T W A
Y
CAPITAL
MARYLAND
V I R G I N I A
Not to scale
270INTERSTATE
WEST SIDE MOBILITY STUDY
134'
3' Offset3' Offset 3' Offset3' Offset
60'
5 x 12' GP Lanes
60'
5 x 12' GP Lanes
2' Median
EXISTING CONDITIONS
202'
34'
Widening
34'
Widening
12'
Shldr.
12'
Shldr.
12'
Shldr.
12'
Shldr.
12'
Aux. Ln.
12' 12'
Managed
Lane
Managed
Lane
12'
Aux. Ln.
2' Median4' Buffer 4' Buffer
48'
4 x 12' GP Lanes
48'
4 x 12' GP Lanes
• Add 1 Managed lane in each direction plus full shoulders
ALTERNATIVE 1
LONG-TERM ALTERNATIVES -AMERICAN LEGION BRIDGE
C-2
LEGEND
Managed Lanes (HOV, HOTor ETL)
Existing Pavement
New Pavement
Converted General Purposeto Managed Lane
FigureDate
JULY 2009
BE L T W A
Y
CAPITAL
MARYLAND
V I R G I N I A
Not to scale
270INTERSTATE
WEST SIDE MOBILITY STUDY
138'
10'
Shldr.
10'
Shldr.
10'
Shldr.
10'
Shldr.
48'
4 x 12' GP Lanes
48'
4 x 12' GP Lanes
2' Median
EXISTING CONDITIONS
170'
16'
Widening
16'
Widening
10'
Shldr.
10'
Shldr.
10'
Shldr.
10'
Shldr.
12' 12'
2' Median4' Buffer 4' Buffer
48'
4 x 12' GP Lanes
48'
4 x 12' GP Lanes
• Add 1 Managed lane in each direction• Buffer between Managed lane and GP
ALTERNATIVE 1
Managed
Lane
Managed
Lane
LONG-TERM ALTERNATIVES -MARYLAND CAPITAL BELTWAY
C-3

LEGEND
Managed Lanes (HOV, HOTor ETL)
Existing Pavement
New Pavement
Converted General Purposeto Managed Lane
FigureDate
JULY 2009
BE L T W A
Y
CAPITAL
MARYLAND
V I R G I N I A
Not to scale
270INTERSTATE
WEST SIDE MOBILITY STUDY
118' - 126'
118' - 126'
10'
Shldr.
10'
Shldr.
10'
Shldr.
10'
Shldr.
16'
Shoulder
16'
Shoulder
16'
Shoulder
16'
Shoulder
12'
12'
HOV Ln.
12'
12'
HOV Ln.
24'
2 x 12' GP Lanes
24'
2 x 12' GP Lanes
24'
2 x 12' GP Lanes
24'
2 x 12' GP Lanes
2' Median
2' Median
EXISTING CONDITIONS
ALTERNATIVE 1• Convert existing HOV to Managed lane
NOTES• Additional SB lane from 'Y' split to Democracy Blvd.
Narrow Paved Shoulder (2') fromDemocracy Blvd. to I-495 Merge
Narrow Paved Shoulder (2') fromDemocracy Blvd. to I-495 Merge
Managed
Lane
Managed
Lane
LONG-TERM ALTERNATIVES -I-270 WEST SPUR
C-4

LEGEND
Managed Lanes (HOV, HOTor ETL)
Existing Pavement
New Pavement
Converted General Purposeto Managed Lane
FigureDate
JULY 2009
BE L T W A
Y
CAPITAL
MARYLAND
V I R G I N I A
Not to scale
270INTERSTATE
WEST SIDE MOBILITY STUDY
186'
10'
Shldr.
10'
Shldr.
10'
Shldr.
10'
Shldr.
12'
HOV Ln.
12'
HOV Ln.
60'
5 x 12' GP Lanes
60'
5 x 12' GP Lanes
2' Median
186'
10'
Shldr.
10'
Shldr.
10'
Shldr.
10'
Shldr.
12'12' 60'
5 x 12' GP Lanes
60'
5 x 12' GP Lanes
2' Median
EXISTING CONDITIONS
ALTERNATIVE 1• Convert existing HOV to Managed lane
Managed
Lane
Managed
Lane
LONG-TERM ALTERNATIVES -I-270 MAINLINE - 'Y' SPLIT
TO MONTROSE ROAD
C-5

LEGEND
Managed Lanes (HOV, HOTor ETL)
Existing Pavement
New Pavement
Converted General Purposeto Managed Lane
FigureDate
JULY 2009
BE L T W A
Y
CAPITAL
MARYLAND
V I R G I N I A
Not to scale
270INTERSTATE
WEST SIDE MOBILITY STUDY
214'
214'
10'
Shldr.
10'
Shldr.
10'
Shldr.
10'
Shldr.
10'
Shldr.
10'
Shldr.
10'
Shldr.
10'
Shldr.
10'
Shldr.
10'
Shldr.
10'
Shldr.
10'
Shldr.
12'
HOV Ln.
12'
12'
HOV Ln.
12'
24'
2 x 12' CD Lanes
24'
2 x 12' CD Lanes
36'
3 x 12' GP Lanes
36'
3 x 12' GP Lanes
36'
3 x 12' GP Lanes
36'
3 x 12' GP Lanes
24'
2 x 12' CD Lanes
24'
2 x 12' CD Lanes
2' Median
2' Median
2' Barrier
2' Barrier
2' Barrier
2' Barrier
2' Offset
2' Offset
2' Offset
2' Offset
EXISTING CONDITIONS
ALTERNATIVE 1
• There is an additional SB CD Lane from I-370 to Shady Grove.
NOTES
• Convert existing HOV to Managed lane
Managed
Lane
Managed
Lane
LONG-TERM ALTERNATIVES -I-270 MAINLINE - MONTROSE ROAD
TO I-370
C-6

LEGEND
Managed Lanes (HOV, HOTor ETL)
Existing Pavement
New Pavement
Converted General Purposeto Managed Lane
FigureDate
JULY 2009
BE L T W A
Y
CAPITAL
MARYLAND
V I R G I N I A
Not to scale
270INTERSTATE
WEST SIDE MOBILITY STUDY
Inside Shoulders Vary From 6' to 10'
202'
34'
Widening
34'
Widening
12'
Shldr.
12'
Shldr.
10'
Shldr.
12'
Shldr.
24' 24'
2 x 12'Managed Lanes
2 x 12'Managed Lanes
Aux. Ln. Aux. Ln.
12' 12'
2' Median4' Buffer 4' Buffer
36'
3 x 12' GP Lanes
36'
3 x 12' GP Lanes
• Add 1 Managed lane• Convert 1 GP to Managed lane
ALTERNATIVES 2, 3, 4, and 5
134'
3' Offset3' Offset 3' Offset3' Offset
60'
5 x 12' GP Lanes
60'
5 x 12' GP Lanes
2' Median
EXISTING CONDITIONS
LONG-TERM ALTERNATIVES -AMERICAN LEGION BRIDGE
C-7

LEGEND
Managed Lanes (HOV, HOTor ETL)
Existing Pavement
New Pavement
Converted General Purposeto Managed Lane
FigureDate
JULY 2009
BE L T W A
Y
CAPITAL
MARYLAND
V I R G I N I A
Not to scale
270INTERSTATE
WEST SIDE MOBILITY STUDY
170'
16'
Widening
16'
Widening
10'
Shldr.
10'
Shldr.
10'
Shldr.
10'
Shldr.
2' Median4' Buffer 4' Buffer
36'
3 x 12' GP Lanes
36'
3 x 12' GP Lanes
• Add 1 Managed lane• Convert 1 GP to Managed lane• Buffer between Managed lane and GP
ALTERNATIVES 2, 3, 4, and 5
138'
10'
Shldr.
10'
Shldr.
10'
Shldr.
10'
Shldr.
48'
4 x 12' GP Lanes
48'
4 x 12' GP Lanes
2' Median
EXISTING CONDITIONS
24' 24'
2 x 12'Managed Lanes
2 x 12'Managed Lanes
LONG-TERM ALTERNATIVES -MARYLAND CAPITAL BELTWAY
C-8

LEGEND
Managed Lanes (HOV, HOTor ETL)
Existing Pavement
New Pavement
Converted General Purposeto Managed Lane
FigureDate
JULY 2009
BE L T W A
Y
CAPITAL
MARYLAND
V I R G I N I A
Not to scale
270INTERSTATE
WEST SIDE MOBILITY STUDY
134'
118' - 126'
10'
Shldr.
10'
Shldr.
10'
Shldr.
10'
Shldr.
10'
Shldr.
10'
Shldr.
16'
Shoulder
16'
Shoulder
12'
12'
HOV Ln.
12'
12'
HOV Ln.
24'
2 x 12' GP Lanes
24'
2 x 12' GP Lanes
24'
2 x 12' GP Lanes
24'
2 x 12' GP Lanes
2' Median 2' Barrier2' Barrier
2' Median
EXISTING CONDITIONS
ALTERNATIVE 2• Convert existing HOV to Managed lane• Barrier between Managed lane and GP
NOTES• Additional SB lane from 'Y' split to Democracy Blvd.
Narrow Paved Shoulder (2') fromDemocracy Blvd. to I-495 Merge
Narrow Paved Shoulder (2') fromDemocracy Blvd. to I-495 Merge
4' Offset4' Offset 4' Offset4' Offset
3' - 7' Widening 3' - 7' Widening
Managed
Lane
Managed
Lane
LONG-TERM ALTERNATIVES -I-270 WEST SPUR
C-9

LEGEND
Managed Lanes (HOV, HOTor ETL)
Existing Pavement
New Pavement
Converted General Purposeto Managed Lane
FigureDate
JULY 2009
BE L T W A
Y
CAPITAL
MARYLAND
V I R G I N I A
Not to scale
270INTERSTATE
WEST SIDE MOBILITY STUDY
186'
10'
Shldr.
10'
Shldr.
10'
Shldr.
10'
Shldr.
12'
HOV Ln.
12'
HOV Ln.
60'
5 x 12' GP Lanes
60'
5 x 12' GP Lanes
2' Median
214'
10'
Shldr.14'
Widening
14'
Widening
10'
Shldr.
10'
Shldr.
10'
Shldr.
10'
Shldr.
10'
Shldr.
24' 24' 48'
4 x 12' GP Lanes
48'
4 x 12' GP Lanes
2' Median2' Barrier 2' Barrier2' Offset 2' Offset
EXISTING CONDITIONS
•
• Barrier between Managed lane and GP
Convert HOV to Managed lane• Convert 1 GP to Managed lane
ALTERNATIVE 2
2 x 12'Managed Lanes
2 x 12'Managed Lanes
LONG-TERM ALTERNATIVES -I-270 MAINLINE - 'Y' SPLIT
TO MONTROSE ROAD
C-10

LEGEND
Managed Lanes (HOV, HOTor ETL)
Existing Pavement
New Pavement
Converted General Purposeto Managed Lane
FigureDate
JULY 2009
BE L T W A
Y
CAPITAL
MARYLAND
V I R G I N I A
Not to scale
270INTERSTATE
WEST SIDE MOBILITY STUDY
214'
10'
Shldr.
10'
Shldr.
10'
Shldr.
10'
Shldr.
10'
Shldr.
10'
Shldr.
12'
HOV Ln.
12'
HOV Ln.
24'
2 x 12' CD Lanes
36'
3 x 12' GP Lanes
36'
3 x 12' GP Lanes
24'
2 x 12' CD Lanes
2' Median 2' Barrier2' Barrier 2' Offset2' Offset
EXISTING CONDITIONS
• There is an additional SB CD Lane from I-370 to Shady Grove.
214'
10'
Shldr.
10'
Shldr.
10'
Shldr.
10'
Shldr.
10'
Shldr.
10'
Shldr.
24' 24' 48'
4 x 12' GP Lanes
48'
4 x 12' GP Lanes
2' Median2' Barrier 2' Barrier2' Offset 2' Offset
•
• Barrier between Managed lane and GP
Convert HOV to Managed lane• Convert 1 GP to Managed lane
ALTERNATIVE 2
NOTES
2 x 12'Managed Lanes
2 x 12'Managed Lanes
LONG-TERM ALTERNATIVES -I-270 MAINLINE - MONTROSE ROAD
TO I-370
C-11

LEGEND
Managed Lanes (HOV, HOTor ETL)
Existing Pavement
New Pavement
Converted General Purposeto Managed Lane
FigureDate
JULY 2009
BE L T W A
Y
CAPITAL
MARYLAND
V I R G I N I A
Not to scale
270INTERSTATE
WEST SIDE MOBILITY STUDY
NOTES
158'
10'
Shldr.
10'
Shldr.
10'
Shldr.
10'
Shldr.
24'24'24'
2 x 12' GP Lanes
24'
2 x 12' GP Lanes
2' Median 2' Barrier2' Barrier 4' Offset4' Offset4' Offset 4' Offset
ALTERNATIVES 3, 4, and 5• Convert HOV to Managed lane• Add 1 Managed lane• Barrier between Managed lane and GP
16'
Widening
16' - 24'
Widening
• Additional SB lane from 'Y' split to Democracy Blvd.
• Widening ranges are due to variances in existing shoulder widths along Spur.
118' - 126'
10'
Shldr.
10'
Shldr.
16'
Shoulder
16'
Shoulder
12'
HOV Ln.
12'
HOV Ln.
24'
2 x 12' GP Lanes
24'
2 x 12' GP Lanes
2' Median
EXISTING CONDITIONSNarrow Paved Shoulder (2') fromDemocracy Blvd. to I-495 Merge
2 x 12'Managed Lanes
2 x 12'Managed Lanes
LONG-TERM ALTERNATIVES -I-270 WEST SPUR
C-12

LEGEND
Managed Lanes (HOV, HOTor ETL)
Existing Pavement
New Pavement
Converted General Purposeto Managed Lane
FigureDate
JULY 2009
BE L T W A
Y
CAPITAL
MARYLAND
V I R G I N I A
Not to scale
270INTERSTATE
WEST SIDE MOBILITY STUDY
242'
10'
Shldr.
10'
Shldr.
10'
Shldr.
10'
Shldr.
24' 24'60'
5 x 12' GP Lanes
60'
5 x 12' GP Lanes
2' Median
10'
Shldr.
10'
Shldr.
2' Barrier 2' Barrier4' Offset 4' Offset
ALTERNATIVES 3 and 4
28'
Widening
28'
Widening
•• Add 1 Managed lane• Barrier between Managed lane and GP• Buffer between GP and CD
Convert HOV to Managed lane
186'
10'
Shldr.
10'
Shldr.
10'
Shldr.
10'
Shldr.
12'
HOV Ln.
12'
HOV Ln.
60'
5 x 12' GP Lanes
60'
5 x 12' GP Lanes
2' Median
EXISTING CONDITIONS
2 x 12'Managed Lanes
2 x 12'Managed Lanes
• If desired, all shoulders, excluding those adjacent to the median, could be widened to 12'.This alteration would increase Alternative 4 to a 274' section.
NOTE
LONG-TERM ALTERNATIVES -I-270 MAINLINE - 'Y' SPLIT
TO MONTROSE ROAD
C-13

LEGEND
Managed Lanes (HOV, HOTor ETL)
Existing Pavement
New Pavement
Converted General Purposeto Managed Lane
FigureDate
JULY 2009
BE L T W A
Y
CAPITAL
MARYLAND
V I R G I N I A
Not to scale
270INTERSTATE
WEST SIDE MOBILITY STUDY
4' Offset 4' Offset
242'
10'
Shldr.
10'
Shldr.
10'
Shldr.
10'
Shldr.
24' 24'60'
5 x 12' GP Lanes
60'
5 x 12' GP Lanes
2' Median
10'
Shldr.
10'
Shldr.
2' Barrier 2' Barrier
ALTERNATIVE 3
• There is an additional SB CD Lane from I-370 to Shady Grove
• If desired, all shoulders, excluding those adjacent to the median, could be widened to 12'.This alteration would increase Alternative 4 to a 274' section.
NOTES
•• Add 1 Managed lane
Convert HOV to Managed lane
• Barrier between Managed lane and GP
14'
Widening
14'
Widening
214'
10'
Shldr.
10'
Shldr.
10'
Shldr.
10'
Shldr.
10'
Shldr.
10'
Shldr.
12'
HOV Ln.
12'
HOV Ln.
24'
2 x 12' CD Lanes
36'
3 x 12' GP Lanes
36'
3 x 12' GP Lanes
24'
2 x 12' CD Lanes
2' Median 2' Barrier2' Barrier 2' Offset2' Offset
EXISTING CONDITIONS
2 x 12'Managed Lanes
2 x 12'Managed Lanes
LONG-TERM ALTERNATIVES -I-270 MAINLINE - MONTROSE ROAD
TO I-370
C-14

LEGEND
Managed Lanes (HOV, HOTor ETL)
Existing Pavement
New Pavement
Converted General Purposeto Managed Lane
FigureDate
JULY 2009
BE L T W A
Y
CAPITAL
MARYLAND
V I R G I N I A
Not to scale
270INTERSTATE
WEST SIDE MOBILITY STUDY
4' Offset 4' Offset
250'
10'
Shldr.
10'
Shldr.
10'
Shldr.
10'
Shldr.
24' 24'36'
3 x 12' GP Lanes
36'
3 x 12' GP Lanes
2' Median 4' Reduced CD Buffer4' Reduced CD Buffer
10'
Shldr.
10'
Shldr.
2' Barrier 2' Barrier
ALTERNATIVE 4
• There is an additional SB CD Lane from I-370 to Shady Grove
• If desired, all shoulders, excluding those adjacent to the median, could be widened to 12'.This alteration would increase Alternative 4 to a 274' section.
NOTES
•• Add 1 Managed lane
Convert HOV to Managed lane
• Barrier between Managed lane and GP• Buffer between GP and CD
18'
Widening
18'
Widening
24'
2 x 12' CD Lanes
24'
2 x 12' CD Lanes
214'
10'
Shldr.
10'
Shldr.
10'
Shldr.
10'
Shldr.
10'
Shldr.
10'
Shldr.
12'
HOV Ln.
12'
HOV Ln.
24'
2 x 12' CD Lanes
36'
3 x 12' GP Lanes
36'
3 x 12' GP Lanes
24'
2 x 12' CD Lanes
2' Median 2' Barrier2' Barrier 2' Offset2' Offset
EXISTING CONDITIONS
2 x 12'Managed Lanes
2 x 12'Managed Lanes
LONG-TERM ALTERNATIVES -I-270 MAINLINE - MONTROSE ROAD
TO I-370
C-15

LEGEND
Managed Lanes (HOV, HOTor ETL)
Existing Pavement
New Pavement
Converted General Purposeto Managed Lane
FigureDate
JULY 2009
BE L T W A
Y
CAPITAL
MARYLAND
V I R G I N I A
Not to scale
270INTERSTATE
WEST SIDE MOBILITY STUDY
186'
10'
Shldr.
10'
Shldr.
10'
Shldr.
10'
Shldr.
12'
HOV Ln.
12'
HOV Ln.
60'
5 x 12' GP Lanes
60'
5 x 12' GP Lanes
2' Median
EXISTING CONDITIONS
218'
16'
Widening
16'
Widening
10'
Shldr.
10'
Shldr.
10'
Shldr.
10'
Shldr.
24' 24'
2' Median4' Buffer 4' Buffer
60'
5 x 12' GP Lanes
60'
5 x 12' GP Lanes
• Convert HOV to Managed lane• Add 1 Managed lane• Buffer between Managed lane and GP
ALTERNATIVE 5
2 x 12'Managed Lanes
2 x 12'Managed Lanes
LONG-TERM ALTERNATIVES -I-270 MAINLINE - 'Y' SPLIT
TO MONTROSE ROAD
C-16

LEGEND
Managed Lanes (HOV, HOTor ETL)
Existing Pavement
New Pavement
Converted General Purposeto Managed Lane
FigureDate
JULY 2009
BE L T W A
Y
CAPITAL
MARYLAND
V I R G I N I A
Not to scale
270INTERSTATE
WEST SIDE MOBILITY STUDY
214'
214'
10'
Shldr.
10'
Shldr.
10'
Shldr.
10'
Shldr.
10'
Shldr.
10'
Shldr.
10'
Shldr.
10'
Shldr.
12'
HOV Ln.
12'
HOV Ln.
22' 22'
24'
2 x 12' CD Lanes
24'
2 x 12' CD Lanes
36'
3 x 12' GP Lanes
33'
3 x 11' GP Lanes
9'
Shldr.
9'
Shldr.
36'
3 x 12' GP Lanes
33'
3 x 11' GP Lanes
24'
2 x 12' CD Lanes
24'
2 x 12' CD Lanes
2' Median
2' Median2' Buffer 2' Buffer
2' Barrier2' Barrier
2' Barrier 2' Barrier
2' Offset2' Offset
2' Offset2' Offset
2' Offset2' Offset
EXISTING CONDITIONS
ALTERNATIVE 5•• Add 1 Managed lane by restriping
Convert HOV to Managed lane
• Buffer between Managed lane and GP
2 x 11'Managed Lanes
2 x 11'Managed Lanes
• There is an additional SB CD Lane from I-370 to Shady Grove
NOTES
LONG-TERM ALTERNATIVES -I-270 MAINLINE - MONTROSE ROAD
TO I-370
C-17

WEST SIDE MOBILITY STUDY
July 2009 46
D. SHORT-TERM IMPROVEMENTS 1. Introduction The long-term improvements would have a high cost, result in right-of-way and environmental impacts, and require several years to be implemented. Because of these factors, improvements were investigated that could be implemented relatively quickly, within one to two years, and at a lower cost. These improvements would focus on localized congestion points and identify modifications that could improve system-wide traffic operations but would require limited or no widening.
2. Potential Improvements SHA conducted peak period observations along the study corridor to determine the locations and causes of recurring traffic congestion. The observations were conducted during four weekdays, two days in the southbound direction during the AM peak period, January 15 and 16, 2008, and two days in the northbound direction during the PM peak period, February 5 and 7, 2008. The field observations generally indicated the following locations of recurring congestion: Southbound (AM Peak Period) –
1. Capital Beltway in Maryland prior to the exit to MD 190. 2. I-270 West Spur prior to the merge from Democracy Boulevard. 3. I-270 West Spur general purpose lanes. 4. I-270 mainline approaching the Y-Split interchange. 5. I-270 mainline at the slip ramps entering the mainline from the CD Road. 6. I-270 CD Road at the entrance ramp from eastbound MD 28.
Northbound (PM Peak Period) –
7. Capital Beltway in Maryland at the I-270 West Spur / I-495 split. 8. I-270 West Spur at the merge from Democracy Boulevard. 9. I-270 West Spur general purpose lanes. 10. I-270 mainline just beyond the mainline / CD Road split. 11. I-270 CD Road north of MD 189. 12. I-270 CD Road between Shady Grove Road and I-370.
After identifying the locations of recurring congestion, the causes of the congestion were considered along with modifications that could potentially alleviate the congestion and improve overall traffic operations. These potential causes and possible improvements are shown on Table D-1. 3. Traffic Analysis All potential short-term improvements presented in Table D-1 were considered and the following solutions were determined to be feasible and should be analyzed using the existing CORSIM network for the study corridor:
1. Southbound Improvement 1 – Extend deceleration lane on shoulder of I-495 (improvement a in Table D-1).
2. Southbound Improvement 2 – Operate the HOV lane on the I-270 West Spur as a peak period HOT or general purpose lane (improvement c in Table D-1).

WEST SIDE MOBILITY STUDY
July 2009 47
Table D-1: Potential Causes and Possible Improvements to Alleviate Congestion Location of Congestion Potential Cause of
Congestion Possible Modifications to Alleviate
Congestion Southbound (AM Peak Period)
1. Capital Beltway in Maryland prior to the exit to MD 190
Congestion on the exit ramp to MD 190 backs onto the mainline
a) Extend deceleration lane on shoulder of I-495
b) Modify the ramp terminal intersections 2. I-270 West Spur general
purpose lanes HOV lane is underutilized while general purpose lanes are congested
c) Operate the HOV lane as a peak period HOT or general purpose lane
3. I-270 West Spur prior to the merge from EB Democracy Boulevard
Heavy volume of merging traffic from the Democracy Boulevard eastbound entrance ramp
d) Extend acceleration lane on shoulder of the I-270 West Spur to the I-495 / I-270 West Spur interchange
4. I-270 mainline approaching the Y-Split interchange
Congestion backs from congestion on I-270 West Spur (2 and 3 above)
e) See modifications to 2 and 3 above
5. I-270 mainline at the slip ramps entering the mainline from the CD Road
Merging traffic from the CD Road onto mainline.
f) Extend the slip ramp acceleration lanes on the outside shoulder
g) Eliminate the slip ramp entrance north of MD 28
h) Convert the slip ramp south of Gude Drive to a two-lane entrance and eliminate the slip ramp entrance north of MD 28
6. I-270 CD Road at the entrance ramp from eastbound MD 28
Heavy entering volume from MD 28 i) Extend acceleration lane for the CD Road entrance ramp on the right shoulder of the I-270 mainline
Northbound (PM Peak Period) 7. Capital Beltway in Maryland
south of the I-495 / I-270 West Spur interchange
The two general purpose lanes to the I-270 West Spur are congested and cause congestion to queue back into Virginia
j) Modify the split to provide four lanes to the I-270 West Spur and three lanes to I-495. The leftmost lane to I-495 would act as a shared lane that would provide access to both I-270 West Spur and I-495
k) Operate the HOV lane as a peak period HOT or general purpose lane
l) Extend the addition of the left (HOV) lane further south in the median shoulder
8. I-270 West Spur prior to the merge from Democracy Boulevard
Heavy volume of merging traffic from Democracy Boulevard westbound entrance ramp
m) Operate the HOV lane as a peak period HOT or general purpose lane
n) Add general purpose lane in the median shoulder
o) Make the entrance from westbound Democracy Boulevard a lane addition
9. I-270 West Spur general purpose lanes
HOV lane is underutilized while general purpose lanes are congested
p) Operate the HOV lane as a peak period HOT or general purpose lane
10. I-270 mainline just north of the mainline / CD Road split
There is no clear cause for this congestion
q) None
11. I-270 CD Road north of MD 189
Weaving section between CD Road slip ramps
r) Close one of the slip ramps from the mainline to the CD Road
12. I-270 CD Road between Shady Grove Road and I-370
Weaving section between CD Road slip ramps
s) Close one of the slip ramps from the CD Road to the mainline

WEST SIDE MOBILITY STUDY
July 2009 48
3. Southbound Improvement 3 – Extend acceleration lane to the I-270 West Spur / I-495 interchange (improvement d in Table D-1).
4. Southbound Improvement 4 – Extend the slip ramp acceleration lanes on the right shoulder of the I-270 mainline by 1,000 feet (improvement f in Table D-1).
5. Southbound Improvement 5 – Close the northern of two consecutive slip ramp entrances between MD 28 and Gude Drive (improvement g in Table D-1).
6. Southbound Improvement 6 – Extend acceleration lane for MD 28 ramp on right shoulder of CD Road by 1,000 feet (improvement i in Table D-1).
7. Northbound Improvement 1 – Modify the I-270 West Spur / I-495 split to provide four lanes to the I-270 West Spur and three lanes to I-495. The leftmost lane to I-495 would act as a shared lane that would provide access to both I-270 West Spur and I-495 (improvement j in Table D-1).
8. Northbound Improvement 2 – Convert HOV lane on the I-270 West Spur to a general purpose lane (improvement m in Table D-1).
9. Northbound Improvement 3 – Extend the left HOV lane further south on the median shoulder of I-495 and convert HOV to a general purpose lane (improvement l in Table D-1).
10. Northbound Improvement 4 – Extend the left HOV lane further south on the median shoulder of I-495.
The locations of these improvements are shown on Figure D-1. The ten improvements were analyzed in CORSIM to determine the affect on average delay per vehicle and total delay for all vehicles in both the localized area (i.e. in the vicinity of the congestion point) and for the total system (i.e. the full study corridor). The results of these analyses are presented in Table D-2 and Table D-3. Note that positive (+) percentages indicate longer delays and negative (-) percentages indicate shorter delays. The traffic analyses indicated that several of the potential short-term improvements would improve traffic operations in the localized area and/or the total system. However, the system-wide improvements would be relatively modest regardless of what improvements or combination of improvements would be implemented. The largest reduction in delay in the southbound direction would result from implementing improvements 1, 2, 4, and 6, which involve extending acceleration/deceleration lanes and converting the HOV lane on the I-270 West Spur to a general purpose lane. The delay per vehicle and total delay for all vehicles would decrease by 12 and 14 percent, respectively, for the total system. The largest reduction in delay in the northbound direction would result from implementing improvement 3, which would involve converting the HOV lane on the I-270 West Spur to a general purpose lane and extending the addition of the lane further south on I-495. The delay per vehicle and total delay for all vehicles would decrease by 7 percent.

WEST SIDE MOBILITY STUDY
0 2,000 4,000
Scale in feet6,000 8,000
BE L T W A
Y
CAPITAL
MARYLAND
V I R G I N I A
270INTERSTATE
495INTERSTATE
495INTERSTATE
370INTERSTATE
270INTERSTATE
270INTERSTATE
270INTERSTATE
N
Modeled in CORSIM
Not Modeled
extend deceleration lane to MD 190SB 1
convert HOV lane on I-270 West Spur as GP laneSB 2
extend acceleration lane from Democracy BoulevardSB 3
extend acceleration lane for slip ramps from CD Road to mainlineSB 4
close northern slip ramp between Gude Drive and MD 28SB 5
extend acceleration lane from MD 28 on CD RoadSB 6provide additional lane on I-270 West Spur between I-495 andDemocracy BoulevardNB 1
convert HOV lane on I-270 West Spur as HOT or GP laneNB 2
extend left HOV lane on I-495 further south and convert HOV to GP
extend left HOV lane on I-495 further south
SB - modify MD 190 ramp terminal intersections
NB - close specific slip ramps
both directions - utilize ramp metering on Democracy Boulevardentrance ramps
NB 3
NB 4
8
9
10
SB 1
SB 2
SB 3
SB 4
SB 5
SB 6
NB 1
NB 2
NB 3
NB 48
9
10
WEST SIDE MOBILITY STUDYWEST SIDE MOBILITY STUDY
POTENTIAL SHORT-TERM IMPROVEMENTS
LOCATION MAP
Date:
JULY 2009
Figure:
D-1
BE L T W A
Y
CAPITAL
MARYLAND
V I R G I N I A
VDOTVirginia Department of TransportationMaryland
Transportation
Authority
SM
Maryland Department of Transportation

WEST SIDE MOBILITY STUDY
July 2009 49
Table D-2: Traffic Affects of Potential Southbound Short-Term Improvements
Localized Total System (Mainline GP Lanes) Comments
Improvement Avg. Delay (min/veh-mile)
Total Delay (veh-hour)
Avg. Delay (min/veh-mile)
Total Delay (veh-hour)
Existing - - 0.56 4,742
Southbound Improvement 1 0% (GP) 0% (GP) 0.54
(-4%) 4,637 (-2%)
• May require additional model runs to ensure consistency and correct results.
• May require additional field observations to determine cause of congestion.
• Would eliminate right shoulder pull-off area for 500’.
Southbound Improvement 2
-5% (GP) -36% (CD)
-16% (GP) -29% (CD)
0.51 (-9%)
4,394 (-7%)
• Both I-270 Mainline and CD Road are improved more than 10% in travel time and speed.
Southbound Improvement 3 +29% (GP) +28% (GP) 0.57
(+2%) 4,842 (+2%)
• The ramp merging point would be too close to I-495 merging downstream, which would deteriorate traffic.
Southbound Improvement 4
-3% (GP) -30% (CD)
-2% (GP) -23% (CD)
0.52 (-7%)
4,451 (-6%)
• Nominal improvements on I-270 mainline. • CD Road improved about 20% in travel time
and speed. • Would eliminate right shoulder pull off areas
for 1,000’ Southbound Improvement 5
+2% (GP) +125% (CD)
+2% (GP) +106% (CD)
0.62 (+11%)
5,231 (+10%)
• The heavy merge after combining two slip ramps would deteriorate traffic operations.
Southbound Improvement 6 -19% (CD) -15% (CD) 0.54
(-4%) 4,661 (-2%)
• Slight improvement on I-270 CD Road. But it would not solve the congestion on MD 28 EB Ramp.
• Would eliminate right shoulder for 1,000’ Southbound All Improvements combined - - 0.52
(-7%) 4,513 (-5%)
SB Improvements 1, 2, 4, and 6 only - - 0.48
(-14%) 4,171 (-12%)

WEST SIDE MOBILITY STUDY
July 2009 50
Table D-3: Traffic Affects of Potential Northbound Short-Term Improvements
Localized Total System (Mainline GP Lanes) Comments
Improvement Avg. Delay (min/veh-mile)
Total Delay (veh-hour)
Avg. Delay (min/veh-mile)
Total Delay (veh-hour)
Existing - - 1.39 11,819
Northbound Improvement 1
+82% (I-270) -14% (I-495)
+85% (I-270) -5% (I-495)
1.38 (-1%)
11,658 (-1%)
• The overall system has very slight improvement.
• Traffic in the additional lane would need to merge into the mainline before the exit to EB Democracy Blvd., merely relocating the bottleneck further north from I-270/I-495 split.
Northbound Improvement 2
-33% (I-270) -36% (I-495)
-30% (I-270) -32% (I-495)
1.37 (-1%)
11,494 (-3%)
• The additional capacity would improve both the I-270 West Spur and I-495 inner loop south of the I-270 West Spur / I-495 split.
• However, the overall system has slight improvement due to the limited downstream capacity.
Northbound Improvement 3
+8% (I-270) -43% (I-495)
+17% (I-270) -37% (I-495)
1.29 (-7%)
11,018 (-7%)
• I-495 inner loop south of I-270 split is improved with this extension.
• The extended left lane carries more traffic to I-270 West Spur and causes more delay on I-270 West Spur.
Northbound Improvement 4
-7% (I-270) -30% (I-495)
-7% (I-270) -30% (I-495)
• Total system operations (speeds) would improve slightly during the peak hour, but the LOS would not be improved.
NB All Improvements 1, 2, and 3 combined This scenario was not run because Improvement 1 and Improvement 2 are not likely to be implemented together.
NB Improvements 2 and 3 only No need to run this scenario because Improvement 2 is embedded within Improvement 3.

WEST SIDE MOBILITY STUDY
July 2009 51
4. Summary Following an evaluation of the existing congestion throughout the study corridor and the short-term improvements that could be implemented to alleviate the congestion, SHA analyzed the affect that the feasible short-term improvements could have on traffic operations. The evaluation of these potential short-term improvements indicated that some improvements, or combination of improvements, would result in modest improvements in system-wide traffic operations. It would be desirable to improve traffic operations for the entire study corridor and provide a comprehensive system-wide improvement, which would not result from implementation of one or more short-term improvements. However, because several of the short-term improvements, and/or combination of short-term improvements would provide some benefit to local and system-wide traffic operations, it was determined that these improvements should be considered further. Due to the preliminary nature of the study, it has not been determined if the short-term improvements would be evaluated along with the long-term alternative and mid-term improvements as part of a subsequent planning study or if they would be investigated as part of an independent study. In addition, the short-term improvements could potentially be funded through a variety federal programs, and if any of the improvements are chosen to be implemented, such funding sources could be considered.

WEST SIDE MOBILITY STUDY
July 2009 52
E. MID-TERM IMPROVEMENTS 1. Introduction Due to the high cost and impacts associated with the long-term alternatives, it was determined that an intermediate approach should be investigated. Therefore, a series of mid-term improvements were considered that would provide increased capacity and a managed lanes network throughout the study corridor, but would require little or no widening. The mid-term improvements would be more extensive than the short-term improvements and would therefore take longer to implement, but would be less costly and impactive than the long-term alternatives. Several methods were considered to provide additional capacity within the existing highway typical section. The operational characteristics of the potential mid-term alternatives were considered and then the preferred approach was evaluated in greater detail as discussed below. 2. Potential Improvements SHA considered five mid-term improvements that could provide increased capacity and a managed lane system throughout the study corridor. Restriping The existing highway, with the exception of the I-270 East Spur, would be restriped to provide one additional lane in each direction. The additional lane would be created by narrowing the width of the existing lanes and shoulders. In general, restriping would result in 11-foot lanes, a 2-foot median offset, a 9-foot outside shoulder, and a 2-foot buffer between the managed lanes and general purpose lanes. The existing HOV lanes on the I-270 West Spur and I-270 mainline would be converted to managed lanes. The resulting typical section would provide a one-lane managed system on the Capital Beltway and I-270 West Spur and a two-lane managed system on the I-270 mainline. The proposed typical sections for restriping are shown in Figures E-1 through E-3. Peak Period Left Shoulder Use Along the Capital Beltway, I-270 West Spur, and I-270 mainline, the existing left shoulder would be used as a travel lane during the peak periods only. This lane would provide additional capacity when it is required, but maintain the left shoulder for breakdowns, enforcement, and incident management during non-peak periods. The existing highway would be modified to permanently reduce the left two lanes in each direction from 12-feet wide to 11-feet wide, which would provide room for a 11-foot peak period lane with a 1-foot offset from the median concrete traffic barrier. The right shoulder would not be narrowed. The existing HOV lanes on the I-270 West Spur would be converted to general purpose lanes and the peak period shoulder lane could be operated as a managed lane. The existing HOV lanes on the I-270 mainline could be converted to general purpose lanes or maintained as managed lanes. Throughout the corridor the peak period shoulder lane could be operated as a managed lane, providing a one-lane managed system on the Capital Beltway and the I-270 West Spur and a one or two-lane managed system on the I-270 mainline.

LEGEND
Existing Pavement
New Pavement
Managed Lanes(HOV, HOT or ETL)
FigureDate
JULY 2009
BE L T W A
Y
CAPITAL
MARYLAND
V I R G I N I ANot to scale
WEST SIDE MOBILITY STUDY 270INTERSTATE
138'
10'
Shldr.
10'
Shldr.
10'
Shldr.
10'
Shldr.
48'
4 x 12' GP Lanes
48'
4 x 12' GP Lanes
2' Median
EXISTING CONDITIONS
138'
9'
Shldr.
9'
Shldr.
44'
4 x 11' GP Lanes
44'
4 x 11' GP Lanes
2' Median
RESTRIPING - 11' Lanes With Reduced Right Shoulderand Managed Lanes Buffer
2' Offset2' Offset2' Buffer 2' Buffer
11'
Mgd. Ln.
11'
Mgd. Ln.
MID-TERM IMPROVEMENTS
RESTRIPING - CAPITAL BELTWAY
E-1

LEGEND
Existing Pavement
New Pavement
Managed Lanes(HOV, HOT or ETL)
FigureDate
JULY 2009
BE L T W A
Y
CAPITAL
MARYLAND
V I R G I N I ANot to scale
WEST SIDE MOBILITY STUDY 270INTERSTATE
NOTES• Additional SB lane from 'Y' split to Democracy Blvd.
118' - 126'
118' - 126'
10'
Shldr.
10'
Shldr.
10'
Shldr.
10'
Shldr.
16'
Shoulder
16'
Shoulder
12'
HOV Ln.
12'
HOV Ln.
24'
2 x 12' GP Lanes
24'
2 x 12' GP Lanes
24'
2 x 12' GP Lanes
24'
2 x 12' GP Lanes
2' Median
2' Median2' Offset 2' Offset
EXISTING CONDITIONS
RESTRIPING OR LEFT SHOULDER USE OR RIGHT SHOULDER USE
Narrow Paved Shoulder (2') fromDemocracy Blvd. to I-495 Merge
2' Buffer 2' Buffer
12'
Mgd. Ln.
12'
Mgd. Ln.Mgd. or
GP Lane
Mgd. or
GP Lane
12' 12'
MID-TERM IMPROVEMENTS
RESTRIPING - I-270 WEST SPUR
E-2

LEGEND
Existing Pavement
New Pavement
Managed Lanes(HOV, HOT or ETL)
FigureDate
JULY 2009
BE L T W A
Y
CAPITAL
MARYLAND
V I R G I N I ANot to scale
WEST SIDE MOBILITY STUDY 270INTERSTATE
214'
10'
Shldr.
10'
Shldr.
10'
Shldr.
10'
Shldr.
10'
Shldr.
10'
Shldr.
12'
HOV Ln.
12'
HOV Ln.
24'
2 x 12' CD Lanes
36'
3 x 12' GP Lanes
36'
3 x 12' GP Lanes
24'
2 x 12' CD Lanes
2' Median 2' Barrier2' Barrier 2' Offset2' Offset
EXISTING CONDITIONS
• There is an additional SB CD Lane from I-370 to Shady Grove.
NOTES
214'
10'
Shldr.
9'
Shldr.
9'
Shldr.
10'
Shldr.
24'
2 x 12' CD Lanes
33'
3 x 11' GP Lanes
33'
3 x 11' GP Lanes
24'
2 x 12' CD Lanes
2' Median 2' Barrier2' Barrier 2' Offset2' Offset
LEFT SHOULDER USE
2' Offset 2' Offset2' Buffer 2' Buffer
11'
Mgd. Ln.
11'
Mgd. Ln.Mgd. or
GP Lane
Mgd. or
GP Lane
11' 11'
MID-TERM IMPROVEMENTS
RESTRIPING - I-270 MAINLINE
E-3

WEST SIDE MOBILITY STUDY
July 2009 53
The shoulder lane would be designated as opened or closed through the use of static signs and lane-use control signals mounted over the lane. Similar lane-use signals are used on I-66 in Northern Virginia and other highways that employ peak period shoulder use. The proposed typical section for peak period left shoulder use on the Capital Beltway is shown in Figure E-4. Similar lane and shoulder width adjustments would occur on the I-270 West Spur and I-270 mainline. Peak Period Right Shoulder Use Along the Capital Beltway, I-270 West Spur, and I-270 mainline, the existing right shoulder would be used as a travel lane during the peak periods only. This would provide additional capacity when it is required but maintain the right shoulder for breakdowns, enforcement, and incident management during non-peak periods. The existing highway would be modified to reduce the right lane in each direction from 12-feet wide to 11-feet wide, which would provide room for an 11-foot peak period lane and zero right shoulder. The remaining lanes and left shoulder would not be narrowed. Further investigation would be required to determine if the existing HOV lanes on the I-270 West Spur and I-270 mainline would be converted to managed lanes when the peak period shoulder lane is in operation. Similarly, operating the left lane on the Capital Beltway as a managed lane when the peak period shoulder lane is in operation would also have to considered. Additional investigation would also be needed to determine how the peak period shoulder lane would operate within the CD Road section of the I-270 mainline where slip ramp entrances and exits are currently utilize portions of the right shoulder. The shoulder lane would be designated as opened or closed through the use of static signs and lane-use control signals mounted over the lane. Similar lane-use signals are used on I-66 in Northern Virginia and other highways that employ peak period shoulder use. The proposed typical section for peak period right shoulder use on the Capital Beltway is shown in Figure E-5. Similar lane and shoulder width adjustments would occur on the I-270 West Spur and I-270 mainline. Reversible Lanes The use of reversible lanes along the I-270 mainline and I-270 Spurs was previously investigated by SHA. The reversible lane system would extend from south of Father Hurley Boulevard along the I-270 mainline to just north of the Capital Beltway on both I-270 Spurs. During the peak period, one lane in the non-peak direction would be operated as a contra-flow lane for peak direction traffic. The contra-flow lane would be separated from the non-peak direction traffic by a movable barrier and from the peak direction by the median. The movable barrier would by placed along the lane line between the left and second to left lanes when deployed and against the median barrier when not deployed. The widths of the contra-flow lane, adjacent non-peak direction lanes, and median shoulder would all have to be reduced slightly to accommodate the movable barrier. When the movable barrier is deployed, the contra-flow lane would not have a right shoulder and the non-peak traffic would not have a left shoulder. The movable barrier would be positioned through the use of one or more barrier moving machines. During non-peak periods, the existing highway configuration would be provided (i.e. no contra-flow lanes).

FigureDate
JULY 2009
BE L T W A
Y
CAPITAL
MARYLAND
V I R G I N I A
LEGEND
Existing Pavement
New Pavement
Managed Lanes(HOV, HOT or ETL)
BE L T W A
Y
CAPITAL
MARYLAND
V I R G I N I ANot to scale
WEST SIDE MOBILITY STUDY 270INTERSTATE
138'
10'
Shldr.
10'
Shldr.
10'
Shldr.
10'
Shldr.
48'
4 x 12' GP Lanes
48'
4 x 12' GP Lanes
2' Median
EXISTING CONDITIONS
138'
10'
Shldr.
10'
Shldr.
11'
GP Lane
11'
GP Lane
24'
2 x 12' GP Lanes
24'
2 x 12' GP Lanes
2' Median
LEFT SHOULDER USE
1' Offset1' Offset
11'
Mgd. Ln.
11'
Mgd. Ln. Mgd. or
GP Lane
Mgd. or
GP Lane
11'11'
MID-TERM IMPROVEMENTS -PEAK PERIOD LEFT SHOULDER USE
E-4

FigureDate
JULY 2009
LEGEND
Existing Pavement
New Pavement
Managed Lanes(HOV, HOT or ETL)
Not to scaleB
E L T W AY
CAPITAL
MARYLAND
V I R G I N I A
WEST SIDE MOBILITY STUDY 270INTERSTATE
138'
10'
Shldr.
10'
Shldr.
10'
Shldr.
10'
Shldr.
48'
4 x 12' GP Lanes
48'
4 x 12' GP Lanes
2' Median
EXISTING CONDITIONS
PeakPeriodLane
PeakPeriodLane
138'
10'
Shldr.
10'
Shldr.
24'
2 x 12' GP Lanes
24'
2 x 12' GP Lanes
11'
GP Ln.
11'
GP Ln.
22'
2 x 11' GP Lanes
22'
2 x 11' GP Lanes
2' Median
RIGHT SHOULDER USE
NOTES• There is a 3-lane CD Road along the outer loop between the George Washington Parkwayand SR 193.
1' Offset1' Offset
MID-TERM IMPROVEMENTS -PEAK PERIOD RIGHT SHOULDER USE
E-5

WEST SIDE MOBILITY STUDY
July 2009 54
The proposed typical sections for the reversible lanes are shown in Figure E-6. The full study is detailed in the I-270 Movable Barrier Feasibility Technical Memorandum prepared by SHA in 2007. Convert HOV Lanes to Managed Lanes This improvement would convert the existing HOV lanes on the I-270 Spurs and I-270 mainline to managed lanes. All existing lane and shoulder widths would be maintained. There would be no improvements to the Capital Beltway. The managed lanes would likely be operated full time, as opposed to the peak period and peak direction operation of the existing HOV lanes. The resulting system would provide a one-lane managed lane system on the I-270 Spurs and I-270 mainline but no managed lanes on the Capital Beltway. In addition, this improvement would provide no capacity increase on any section of the study corridor. Preliminary Evaluation of Mid-Term Improvements SHA considered these five potential mid-term improvements and determined that both reversible lanes and conversion of the existing HOV lanes to managed lanes would not be considered further. The use of reversible lanes was not preferred because it required the use of a movable barrier system, which included many operational concerns such as time to deploy the barrier; operation at the Y-Split interchange; storage and maintenance of the movable barrier machines, etc. In addition, the movable barrier would require median crossovers and other physical and signing modifications. In addition, it would provide improvements along the I-270 mainline and I-270 Spurs, but would not provide any improvement along the Capital Beltway. Conversion of the HOV lanes on the I-270 Spurs and I-270 mainline was not considered further because it would not provide an improvement along the Capital Beltway and would only provide managed lanes along the I-270 Spurs and I-270 mainline. Restriping and peak period shoulder use were considered further. Figure E-7 provides a flow chart that was used to determine the alternative that would appear to provide the most benefits and the general form that the preferred alternative should take. Following the bold red line shown in Figure E-7, the following decisions were made:
1. New capacity should be operated full time and not just during the peak periods. Full time capacity would accommodate additional traffic outside of the traditional AM and PM peak periods, which is especially important on the Capital Beltway where heavy traffic volumes can occur during any period of the day or week. Full time operation would also be less confusing to users, especially non-frequent users of the corridor.
2. New capacity should be operated as managed lanes. This decision would allow at least
some of the highway lanes to be managed during the peak periods, which would generally maintain free flow or congestion-free travel in these lanes. If the new lanes were not managed, projected traffic demand indicated that they would become congested during the peak periods relatively soon after opening.

REVERSIBLE LANE /MOVABLE BARRIERTYPICAL SECTION
�
�
12-foot travel lanes
12-foot shoulders
�
�
5 lanes peak direction
3 lanes non-peak direction
EXISTING OPERATION
8 GENERAL PURPOSE LANES WITH FULL SHOULDERS
NEUTRAL OPERATION WITH MOVABLE BARRIER
OPTION 1
PLACE MOVABLE BARRIER ONE-FOOT OFFSET FROM LEFTMOST LANE LINE.
CONTRA-FLOW LANE TO USE LEFTMOST LANE AND MEDIAN SHOULDERNOTES:
Northbound Collector-Distributor lanes from south of Montrose Road to MD 124.
Southbound Collector-Distributor lanes from I-370 to south of Montrose Road.
Blue striping and direction arrow for contra-flow lane shown to
indicate potential contra-flow path and not actual pavement markings.
Median shoulders are 10' - 12' wide on the East Spur and 16' wide on the
West Spur. Dimensions for the median shoulder with the reversible options
would vary accordingly from those shown on this sheet for I-270 mainline.
12'
Shoulder
12'
Shoulder
12'
Shoulder
12'
Shoulder
12'
Shoulder
12'
Shoulder
12'
Shoulder
12'
Shoulder
12'
Shoulder
8'
Shoulder
8'
Shoulder
8'
Shoulder
8'
Shoulder
8'
Shoulder
8'
Shoulder
12'
Shoulder
12'
Shoulder
12'
Shoulder
48'
4 General Purpose Lanes
48'
4 General Purpose Lanes
36'
3 General Purpose Lanes
24'
2 Collector-Distributor Lanes
24'
2 Collector-Distributor Lanes
24'
2 Collector-Distributor Lanes
24'
2 Collector-Distributor Lanes
24'
2 Collector-Distributor Lanes
24'
2 Collector-Distributor Lanes
48'
4 General Purpose Lanes
48'
4 General Purpose Lanes
48'
4 General Purpose Lanes
12'
Shoulder
9.5'
Shoulder
2'
2'
2'
2'
2'
2'
2'
2'
238'
238'
238'
12'
Shoulder
9.5'
Shoulder
12'
Shoulder
8' Shld.
1.5' Offset
12' Lane
2'
1.5'1.5'
1'1' Offset
9.5'
Shoulder
9.5'
Lane
E-6
1.5'1.5' 1'
FigureDate
JULY 2009
WEST SIDE MOBILITY STUDYB
E L T W AY
CAPITAL
MARYLAND
V I R G I N I A
270INTERSTATE

E-7
FigureDate
JULY 2009
WEST SIDE MOBILITY STUDYB
E L T W AY
CAPITAL
MARYLAND
V I R G I N I A
MID-TERM IMPROVEMENTSDECISION FLOW CHART
270INTERSTATE
New
lanes operated
full-time or during
peak period
only?
New lanes
operated as
General Purpose
or Managed
Lanes?
Maintain
full lane
widths or
1 Full
shoulder?
Provide
managed lane
enforcement
or full right
shoulder?
New lanes
operated as
General Purpose
or Managed
Lanes?
Maintain
full lane
widths or
1 full
shoulder?
Maintain
full lane
widths or
1 full
shoulder?
Maintain
full lane
widths or
1 full
shoulder?
Provide
managed lane
enforcement
or full right
shoulder?
Operate one lane in each
direction as a peak period
managed lane.
Add new lane in each
direction on the left
shoulder.
Restripe highway to add
one lane in each direction.
Operate one lane in each
direction as a peak period
general-purpose lane.
Restripe highway to add
one lane in each direction.
Add one lane in each
direction on left shoulder.
Operate one lane in each
direction as a peak period
managed lane.
Add one lane in each
direction on right shoulder.
Operate one lane in each
direction as a peak period
managed lane.
Operate one lane in each
direction as a full-time
general-purpose lane.
Provides four-foot wide
shoulders only.
Provides four-foot wide
shoulders only.
Provides four-foot wide
shoulders only.Does not provide left
shoulder.
Restripe highway to add
one lane in each direction.
Operate one lane in each
direction as a full-time
managed lane.
Provides four-foot wide
shoulders only.
Does not provide left
shoulder
Does not provide right
shoulder
Does not provide right
shoulder
Does not provide left
shoulder
Restripe highway to add
one lane in each direction.
Add one new lane in each
direction on left shoulder.
Operate the new lane as
full-time general-purpose
lane.
Does not provide left shoulder
Add one new lane in each
direction on left shoulder.
Operate one lane in each direction
as a full-time managed lane.
Add one new lane in each
direction on right shoulder.
Operate one lane in each
direction as a full-time
managed lane.
Peak Period
Only
Full-
Time
General Purpose
Lanes
Managed
Lanes
Full
Shoulder
Full Lane
Widths
Full
Shoulder
Full Lane
Widths
Full Right
Shoulder
EnforcementEnforcement
Full ShoulderFull Lane Widths
Full Right
Shoulder
Full ShoulderFull Lane Widths
General Purpose Lanes Managed Lanes
Operate the new lane as
a peak period general-
purpose lane.
Key Decisions:
Should the new lanes be operatedfull-time or only during peak periods?
Should the new lanes be operated asgeneral-purpose lanes or as managedlanes (HOV/HOT/ETL)?
Should the reconfigured mainlinemaintain full (12') lane widths or onefull (10') shoulder?
If the new lanes are operated asmanaged lanes, does a left shoulderhave to be maintained for enforcementor should a full right shoulder pull-offarea be provided?
1
2
3
4
1
2 2
3 3 3 3
4 4

WEST SIDE MOBILITY STUDY
July 2009 55
3. It is preferable to maintain at least one full shoulder as opposed to maintaining all lanes widths and reducing the shoulder widths. A full shoulder would provide an area for vehicles to pull off the mainline lanes during breakdowns or incidents and would allow space for police enforcement.
4. It is preferable to maintain a full right shoulder as opposed to a full left shoulder because
right shoulders are a more commonly used area for vehicle breakdowns, incident management, and police enforcement.
As a result of these decisions, SHA determined that restriping would be the preferred mid-term improvement. The general characteristics of the restriping improvement, which would include narrowed lanes and left shoulders, are shown in Figures E-1 through E-3. Note that in addition to the physical modifications required for implementation of the restriping improvement, or any of the other mid-term improvements considered, Active Traffic Management (ATM) techniques would also have to be employed. ATM consists of an array of strategies used to address the operation of highways. Elements of ATM could include variable speed limits; increased road monitoring through CCTV cameras, traffic loops, and roadside speed detectors; increased incident management; emergency pull-off areas; and increased roadway lighting. The use of ATM may help to alleviate the operational concerns associated with narrowing lanes and narrowing or eliminating shoulders. ATM has been successfully employed throughout Europe and is being extensively applied to motorways in the United Kingdom, especially where peak period shoulder use has been implemented. 3. Preferred Mid-Term Improvement – Restriping The restriping improvement was identified as the preferred approach for a mid-term improvement. However, when adding capacity to freeways, a number of design and operational issues must be considered before restriping could be implemented. In addition, it is important to understand the potential cost of restriping and associated improvements as well as the revenue that could be generated by the managed lanes, assuming an HOT or ETL operation. Description As described in the previous section, restriping would provide one additional lane in each direction throughout the study corridor by narrowing the existing lanes, median shoulder, and the right shoulder. The typical sections for the restriping improvement are shown in Figures E-1 through E-3. Active Traffic Management (ATM) would also be employed, but the extent and methods of an ATM system would be considered further in a more detailed study. Design and Operational Concerns Implementing the restriping improvement would raise a number of design and operational concerns, including the following:
1. Typical section on the American Legion Bridge. 2. Typical sections under bridge overpasses, particularly when bridge piers are located
adjacent to the shoulder. 3. Horizontal sight distance resulting from narrowing the left shoulder. 4. The use of narrow (less than 12-feet wide) lanes on interstates/freeways.

WEST SIDE MOBILITY STUDY
July 2009 56
5. Potential operational strategies for the managed lanes. Typical Section on the American Legion Bridge The American Legion Bridge currently provides five lanes in each direction with 3-foot offsets from the outside and median bridge parapets. The right lane in each direction is an auxiliary lane between the Clara Barton Parkway and George Washington Memorial Parkway interchanges. The existing typical section is shown in Figure B-2 and it does not provide sufficient width to obtain an addition lane as shown in the restriping typical section, Figure E-1. There are three solutions for this concern and two would provide one additional through lane per direction. The first solution would be to narrow the auxiliary (right) lanes and two median lanes in each direction to 10-feet wide and reduce the offsets from the bridge parapets to 1-foot. The right two mainline lanes, commonly used by large trucks, would remain 12 feet wide. The reduction of lane and offset widths would allow for a new 10-foot wide lane to be added in the median. This option is shown in Figure E-8. The use of 10-foot wide lanes on interstates is not common and could result in operational concerns such as lower free flow speeds and increased collisions, including sideswipe and barrier impact collisions associated with vehicles leaving the travel lane. The second solution would be to convert the existing auxiliary (right) lanes to through lanes. This would not require any reduction to the existing typical section on the structure, but it would require widening upstream and downstream of the American Legion Bridge to provide acceleration and deceleration lanes to/from the Clara Barton Parkway and George Washington Memorial Parkway interchanges. This widening would occur within or adjacent to parkland owned by the National Park Service. This type of modification would also raise operational concerns because the heavy volumes on the mainline of the Capital Beltway could make merging from the acceleration lanes difficult, which in turn could congest traffic on the Clara Barton Parkway and George Washington Parkway approaching the Beltway. The third solution would be to maintain the existing typical section on the bridge as four through lanes and one auxiliary lane per direction. When the adjacent Beltway sections are restriped to provide five through lanes, the bridge would operate as a bottleneck. The fifth lane on both sides of the bridge would be dropped at the adjacent interchanges; this configuration could result in a discontinuous managed lane system. Typical Sections under Bridge Overpasses There are 21 overpasses within the study limits. Most of these bridges have median bridge piers that are wider than the median traffic barrier and, therefore, result in slightly narrower median shoulders on the mainline under the overpasses. The proposed restriping improvement would provide a two-foot left offset. Under 14 of the 16 overpasses located in Maryland, the left offset would be reduced to one foot and the right shoulder would be reduced to eight feet. The highway would be shifted toward the outside approaching and following an overpass to provide the proposed typical section, which is shown in Figure E-9. If additional offset is required from the median barrier, the right shoulder would have to be further reduced under the overpasses. Additional information would be needed from VDOT to evaluate the overpasses located in Virginia, but it is likely that the same condition would exist on the Capital Beltway in Virginia and the same adjustments would have to be made.

FigureDate
JULY 2009
LEGEND
Existing Pavement
New Pavement
Managed Lanes(HOV, HOT or ETL)
Not to scaleB
E L T W AY
CAPITAL
MARYLAND
V I R G I N I A
WEST SIDE MOBILITY STUDY 270INTERSTATE
134'
134'
3' Offset
1' Offset
3' Offset
1' Offset 1' Offset1' Offset
3' Offset 3' Offset
48'
4 x 12' GP Lanes AuxiliaryLane
AuxiliaryLane
12' 12'
Auxiliary
Lane
Auxiliary
Lane
10'10'
48'
4 x 12' GP Lanes
30'
3 x 10' GP Lanes
30'
3 x 10' GP Lanes
24'
2 x 12' GP Lanes
24'
2 x 12' GP Lanes
2' Median
2' Median
EXISTING CONDITIONS
RESTRIPING
OPTION A
MID-TERM IMPROVEMENTSAMERICAN LEGION BRIDGE
RESTRIPING OPTIONS
E-8

FigureDate
JULY 2009
LEGEND
Existing Pavement
New Pavement
Managed Lanes(HOV, HOT or ETL)
Not to scaleB
E L T W AY
CAPITAL
MARYLAND
V I R G I N I A
WEST SIDE MOBILITY STUDY 270INTERSTATE
138'
8'
Shldr.
8'
Shldr.
50' 50'
Overpass
60' 60'
33'
3 x 11' GP Lanes
33'
3 x 11' GP Lanes
4' Median
Reduced Typical Section at Median Bridge Piers
Lane Transition at Median Bridge Pier
2' Offset2' Offset
11'
Mgd. Ln.
11'
Mgd. Ln. Mgd. or
GP Lane
Mgd. or
GP Lane
11'11'
9' 8'
57' 57'
9' 8'
6' 8'
60:1 Taper
60:1 Taper60:1 Taper
60:1 Taper
57' 57'
MedianBridge Pier
2' Buffer 2' Buffer
MID-TERM IMPROVEMENTSREDUCED RESTRIPING TYPICAL SECTION
UNDER OVERPASSES
E-9

WEST SIDE MOBILITY STUDY
July 2009 57
Horizontal Sight Distance Resulting from Narrowing the Left Shoulder The proposed restriping typical section would reduce the left shoulder to a 2-foot offset, which would reduce the horizontal sight distance for the left lane through the winding sections of the study corridor. In the existing condition, there are four curves with a horizontal stopping sight distance less than that required to meet a 60-mph design speed. With the proposed restriping improvements, there would be nine curves with a horizontal sight distance less than that required to meet a 60-mph design speed, including five curves less than 50 mph. These curves are shown in Figure E-10. Horizontal curves with reduced sight distance could affect the operations of the highway by resulting in lower free-flow speeds; additional sideswipe and rear end collisions; and other erratic traffic maneuvering resulting from drivers avoiding objects or other vehicles in the left lane or median offset. To avoid the potential operational affects of reduced horizontal sight distance, the feasibility of localized widening was evaluated to provide sufficient offsets from the median barrier to meet a 60-mph design speed. The details of these horizontal curves, the amount of widening required to meet a 60-mph design speed, and the impacts or issues associated with the localized widening are presented in Table E-1. As shown in the table, the horizontal curves along the Capital Beltway between SR 193 and MD 190 would have the shortest horizontal sight distance, but would also require the most widening and largest impact to meet a 60-mph design speed. Use of Narrow Lanes on Interstates/Freeways Lane widths of less than 12 feet wide are not commonly provided on interstates and freeways generally for permanent applications. Nor are a combination of narrowed lanes and shoulders used. As a result, there is not a thorough understanding of the potential operational effects that narrowed lane and shoulder widths could have on freeway operations. Therefore, data gathering and a literature search were conducted on the use of narrow lanes and shoulders on interstates and freeways around the country. The research included a review of applicable design guidelines; relevant technical reports and studies on similar applications; a survey of AASHTO members; and a scan of international design practice. Applicable Design Guidelines AASHTO guidance provided in A Policy on Geometric Design of Highways and Streets (2004) requires 12-foot lanes on freeway. There are no exceptions provided for reduced lanes widths. The Federal Highway Administration’s Mitigation Strategies for Design Exceptions (2007) states that design exceptions are required for any lane widths on freeways less than 12 feet. Technical Studies on the Use of Narrow Lanes and Shoulder on Freeway Six technical reports were identified through the Transportation Research Information Search (TRIS) that were related to the use of narrow lanes and/or shoulders on freeways. These reports are summarized in Table E-2. The research in the reports indicated that traffic operations and safety were improved, worsened, or unchanged depending on the specific roadway; therefore, the reports did not provide definitive evidence of the effect that narrow lanes and shoulders have on freeway operations or safety.

0 2,000 4,000
Scale in feet
6,000 8,000
Copyright ADC The Map PeoplePermitted Use No. 20903122Expiration: 03/31/10
WEST SIDE MOBILITY STUDYB
E L T W AY
CAPITAL
MARYLAND
V I R G I N I A
270INTERSTATE
3
4
5
6
2
1
Existing
55 mph
70 mph
45 mph
55 mph
55 mph
70 mph
45 mph
55 mph
60 mph 50 mph
50 mph 45 mph
65 mph 55 mph
50 mph 45 mph
65 mph 55 mph
~0.45 miles SB
~0.4 miles SB
~0.5 miles NB
~0.5 miles NB
~1.0 miles SB
~0.75 miles NB
~0.6 miles SB
~0.4 miles SB
~0.55 miles NB
DESIGN SPEED
Restriping
Option
C
A
I
D
B
E
F
G
H
C
A
I
D
B
E
F
G
H
N
5 (see Figure 2B)Capital Beltway from Virginia HOT Lanes (north of Dulles TollRoad) to American Legion Bridge (approximately 2.5 miles)
American Legion Bridge (approximately 0.4 miles, 2,000 LF)
Capital Beltway from American Legion Bridge to 1-270 WestSpur (approximately 3.6 miles)
I-270 West Spur - from the Capital Beltway to the I-270 “Y”Split Interchange (approximately 1.5 miles)
I-270 East Spur - from north of Grosvenor Lane to I-270 “Y”Split Interchange (approximately 1.9 miles)
I-270 from the West Spur to I-370 (approximately 7 miles)
Section 1
Section 2
Section 3
Section 4
Section 5
Section 6
CURVES WITH LIMITEDHORIZONTAL SIGHT DISTANCE
WEST SIDE MOBILITY STUDYWEST SIDE MOBILITY STUDY
Date:
JULY 2009
Figure:
E-10
BE L T W A
Y
CAPITAL
MARYLAND
V I R G I N I A
VDOTVirginia Department of TransportationMaryland
Transportation
Authority
SM
Maryland Department of Transportation

WEST SIDE MOBILITY STUDY
July 2009 58
Table E-1: Feasibility of Localized Widening to Provide Adequate Horizontal Sight Distance through Curves Curve Location Length Horizontal Sight Distance Potential Impacts/Issues Associated
with Localized Widening
A VA – I-495 SB between Old Dominion Drive and SR 193 2,075’ With 2’ median offset – 535’ (55 mph D.S.)
3’ median offset would meet 60 mph D.S. No widening needed; outside shoulder may have to be narrowed to 9±’ wide
B VA – I-495 NB just south of SR 193 2,675’ With 2’ median offset – 535’ (55 mph D.S.)
3’ median offset would meet 60 mph D.S. No widening needed; outside shoulder may have to be narrowed to 9±’ wide
C VA – I-495 SB between SR 193 and George Washington Pkwy.
2,300’
With 2’ median offset – 340’ (40 mph D.S.) With 10’ median offset – 490’ (50 mph D.S.)
Would require significant reduction or elimination of outside shoulder
Outside shoulder widening would impact CD Road and barrier
D VA – I-495 NB between George Washington Pkwy. and ALB
2,600’
With 2’ median offset – 343’ (40 mph D.S.) With 10’ median offset – 493’ (50 mph D.S.)
Would require significant reduction or elimination of outside shoulder
Outside shoulder widening would require reconstruction of GW Pkwy bridge over the Beltway
E MD – I-495 SB between Clara Barton Pkwy. and Cabin John Pkwy.
5,425’ With 2’ median offset – 391’ (45 mph D.S.) With 10’ median offset – 562’ (55 mph D.S.)
Would require widening of bridge over Clara Barton Pkwy
F MD – I-495 NB within Cabin John Pkwy. interchange 3,850’
With 2’ median offset – 337’ (40 mph D.S.) With 10’ median offset – 485’ (50 mph D.S. – same as today)
Would require significant reduction or elimination of outside shoulder
Outside shoulder widening would require widening of I-495 bridges
G MD – I-495 SB between MD 190 and I-270 West Spur 3,125’ With 2’ median offset – 458’ (50 mph D.S.)
6’ median offset would meet 60 mph D.S. No widening needed; outside shoulder may have to 6±’ wide
H I-270 West Spur SB between I-495 and Democracy Blvd. 2,225’
With 2’ median offset – 334’ (40 mph D.S.) With 10’ median offset – 480’ (50 mph D.S. – same as today)
No widening needed; outside shoulder could be widened without major impacts
I I-270 West Spur NB between Democracy Blvd. and Y-Split interchange
2,900’ With 2’ median offset – 441’ (50 mph D.S.) 7’ median offset would meet 60 mph D.S.
Would require minor adjustment of Democracy Blvd. ramps to accommodate widening for shoulder
D.S. – design speed

WEST SIDE MOBILITY STUDY
July 2009 59
Table E-2: Studies Evaluating the Use of Narrow Lanes and Shoulders on Freeways Study / Report Summary / Description
Safety Impacts of Design Element Trade-Offs – NCHRP 15-27. Anticipated completion Fall 2008. By Nikiforos Stamatiadis.
Study objectives: (1) quantify safety and operational impacts of design elements trade-offs and their associated risks and (2) develop guidelines to assist designers in making reasonable choices among possible design element trade-offs.
Use of Shoulders and Narrow Lanes to Increase Freeway Capacity – NCHRP Report 369 (1995) by J.E. Curren.
Research proved that shoulder use increases capacity. Of the 5 corridors that implemented shoulder use and narrow lanes, 3 had significant increases in accident rates; 2 had decreases in accident rates. Report recommends that shoulder use and narrow lanes be used for widening in areas typically not longer than 1 mile, to provide lane continuity and balance. Although 1-mile segment is recommended, report acknowledges that if traffic flow can be maintained with the alteration, accident levels should not show significant increase. Accident increases appeared to be caused by speed variances between lanes as well as between lanes and ramps.
Report suggests that width reduction should be (1) convert lanes to 11 feet, (2) reduce / use inside shoulder, (3) reduce / use outside shoulder.
Mitigation Strategies for Design Exceptions – July 2007 by FHWA.
FHWA-compiled mitigation strategies for implementing design exceptions and minimizing their effects. Generally, drivers shy away from the barrier when there are narrow shoulders and away from cars in adjacent lanes; they have a lessened sense of comfort in narrow lanes. Drivers tend to drive 1.9 mph slower in 11’ lanes and 6.6 mph slower in 10’ lanes. Speeds also drop slightly if lanes are adjacent to a narrow shoulder. Report recommends certain features be added to freeways with narrow lane/shoulders to increase driver comfort: Road-Narrows signs, wide pavement markings, delineators, improved lighting, and emergency pull off area.
Safety Effects of Narrow Lanes and Shoulder-Use to Increase Capacity of Urban Freeways – TRR #1897 (2004) by K M Bauer, D W Harwood, and K R Richard, and W E Hughes.
Before and after evaluation of accident frequency on California freeways that added a lane by decreasing lane widths or reducing insider shoulder width. Results showed overall accidents increased significantly on segments converted from 4 to 5 lanes, while accidents barely increased on segments converted from 5 to 6 lanes. Results specify that any increase in accidents could not be directly attributed to narrow lane widths and shoulder use, because increase in accidents may have been caused by the simultaneous introduction of HOV lanes, which typically traveled at higher speeds than the adjacent lanes.
Effect of Narrow Lanes on the Capacity of Motorways: A Trial in the Paris Region-Proceedings of the 3rd International Symposium on Highway Capacity: Copenhagen, Denmark, June 1998 by S Cohen.
Study narrowed lanes to reduce the space needed to provide same number of lanes. Implemented in 1996 for a 2.5 km segment. Study found that capacity was almost maintained and congestion levels were equivalent.
California Experience with Inside Shoulder Removal – TRR # 1122 (1987) by T Urbanik and C R Bonilla.
Details safety impacts experienced when California added HOV capacity by reducing inside shoulder and narrowing lanes. Summary documented that the changes either did not change or decreased the overall accident rates. Segments with decreased accident rates thought to be caused by reduction in congestion.

WEST SIDE MOBILITY STUDY
July 2009 60
AASHTO Survey An email survey was distributed to AASHTO members to determine where narrow lanes and/or shoulders had been used on interstates/freeways within the United States. Fifteen states responded to the survey. Eight of the responding states do not have reduced lane widths on interstates, while seven states do have reduced lanes widths. A summary of the responses to the AASHTO survey are provided in Table E-3. In addition to the fifteen states that responded to the AASHTO survey, both Florida and California have interstates with narrowed lanes and shoulders. The Florida Department of Transportation (FDOT) recently opened the 95Express project in Miami-Dade County with future expansion planned for Broward County. The project provided additional capacity and managed lanes on I-95 without widening. The additional lane was provided by narrowing the several of the existing lane to 11-feet wide and reducing the width of the median shoulder. In the Los Angeles region, the California Department of Transportation (CALTRANS) operates many HOV facilities that include hundreds of miles where the width of lanes and median shoulder have been reduced to provide needed capacity within the existing highway footprint. Washington State was one of the respondents to the AASHTO survey. WsDOT recently opened the SR 167 HOT lanes near Seattle. This project converted the one existing HOV lane in each direction to a HOT lane and reduced lane widths to provide a painted buffer separation between the HOT and general purpose lanes. International Design Practice The International Symposium on Highway Geometric Design Practices provided an overview of lane widths on freeways for 21 nations. The range for standard lane width ranged from 11’-6” to 12’-4”. These widths are presented in Table E-4. Potential Operational Strategies for the Managed Lanes The mid-term restriping improvement would provide one managed lane in each direction on the Capital Beltway and I-270 Spurs and two managed lanes per direction on the I-270 mainline. The potential lane configuration is shown in Figure E-11. It was not determined what type of managed lane or operational strategy would be used for the managed lanes; however, several options were identified. The tie-in with the VDOT HOT Lane project would have to be considered with any operational scenarios, including an effective transition if a non-HOT approach is chosen. These strategies include the following:
• HOV: Operate the managed lanes as HOV lanes. The occupancy requirement could be two persons similar to the existing requirement, three persons similar to the proposed VDOT HOT lanes, or some higher number such as seven persons, which would apply to registered vanpools.
• HOT: Operate the managed lanes as HOT lanes. HOV users would be permitted in the
lane without charge, but single occupancy vehicles (SOV) could pay a toll to use the lane. The occupancy requirement for HOV would have to be determined (2+, 3+, 7+, etc.).
• ETL: Operate the managed lanes as Express Toll Lanes (ETL). All users would have to
pay a toll to use the lane.

I-370 to Shady GroveMetro Station & ICC
Gude Drive
I-270 East Spur
MD 187
RockledgeDrive
1
Capital Beltway fromVirginia HOT Lanes(north of Dulles TollRoad) to AmericanLegion Bridge (approx.
2.7 miles)
2 American Legion Bridge(approximately 0.4 miles)
3Capital Beltway fromAmerican Legion Bridgeto 1-270 West Spur(approximately 3.6 miles)
4I-270 West Spur - from theCapital Beltway to the I-270“Y” Split Interchange(approximately 1.5 miles)
5I-270 from the“Y” split to I-370(approximately 7 miles)
MD
VA
SR 193
GeorgeWashingtonMemorialParkway
AmericanLegionBridge
Potomac River
ClaraBarton
Parkway
MD 190
DemocracyBoulevard
West LakeTerrace
I-270 West Spur
I-270 "Y" Split
Montrose Road
MD 189
MD 28
ShadyGroveRoad
I-495
N
270INTERSTATE
495INTERSTATE
495INTERSTATE
Figure:Date:
JULY 2009
WEST SIDE MOBILITY STUDYB
E L T W AY
CAPITAL
MARYLAND
V I R G I N I A
270INTERSTATE
General Purpose (GP) Lane # of General Purpose (GP) Lanes
LEGEND
HOT Lane
Managed Lane
# of HOT Lanes
# of Managed Lanes
CD Road Lane # of CD Road Lanes
3
2
2
3
Note: Managed Lanes would beseparated from the remainderof the mainline by a 2' buffer.
CD roads would be barrierseparated from the rest ofthe mainline.
Note: Managed Lanes would be separated fromthe remainder of the mainline by a 2' buffer.
Note: The Managed Lanes would be separated fromthe remainder of the mainline by a 2' buffer.
Add
1la
ne
per
dir
ecti
on
Add
Managed
Lane
Conve
rtH
OV
toM
anag
edLa
ne
&ad
dM
anag
edLa
ne
Conve
rtH
OV
toM
anaged
Lane
&add
Managed
Lane
Locations for open at-gradeaccess to / from the ManagedLanes along the I-270 mainlinewould have to be determined.
Open at-grade access to / from theManaged Lanes would be locatedbetween the MD 190 and I-270Winterchanges
Open at-grade access will belocated between SR 193 andthe American Legion Bridge
E-11
MID-TERM IMPROVEMENTS - POTENTIALLANE CONFIGURATION / OPERATION
I-270 West Spur Interchange
I-270
I-495
3
3
3
3
311
1 1
1 1 66
3
3
I-270 "Y" Split Interchange
I-270WestSpur I-270 East Spur
I-270
1
1
1
1 1
2
34 3
65
2 2
I-370 Interchange
I-370
To ICC
I-270
2
2
22
2
2
2
2
2
2
1
1
1
1
1
3
3 3
3
2
2
4
2
7
6
West Lake Terrace Interchange
I-270
West LakeTerrace
4
1
3
1
22
22
Proposed Managed laneconfiguration withMD widening
SR 193
Old DominionDrive
GWParkway
I-495
2
4
55
6
6
5
4
5
5
4
1 1
6
4
11
1
1
3
11
11
HOV HOV
5
5
6
5
5
4
3
3
33
33
3 3
5
5
6
5
5
6
4
2
2
2
2
2
2
1
1
1
1
1
1
2
2
2
2
2
2
1
1
1
1
1
1
1
1
6
2
2
2
2
3
2
2
2
3
3
3
2
2
3
4
4
3

WEST SIDE MOBILITY STUDY
July 2009 61
Table E-3: Responses to AASHTO Survey
State Response
Arizona • 11’ wide lanes are used in a few locations where space is at a premium, especially on structures
• No freeways with reduced shoulder widths exist today, however, some are being considered for future projects
Illinois • Reduced lane widths on short portions of I-55, I-64, and I-70 near St. Louis • Reduced lane widths on a ¼ mile segment of I-90/I-94 near downtown Chicago • Trucks are permitted in the narrowed lanes • Reduced shoulder widths are used in some locations • Design exceptions were required for the narrowed shoulders
Kentucky • Reduced lanes and shoulder widths are used on a couple Ohio River bridge crossings (lane and shoulder width reduced to add additional lane of capacity)
• Design exceptions were required to narrow the lanes/shoulders • Trucks are permitted in the narrowed lanes
Louisiana • No freeway lanes with reduced widths • Reduced or eliminated shoulders on some freeways (no shoulders on the I-10
bridge at Whiskey Bay) Michigan • No freeway lanes with reduced widths
• Reduced shoulders widths are used in some short sections Mississippi • No freeway lanes with reduced widths
• Reduced shoulder widths or no shoulders are used in isolated sections • Trucks are permitted in all lanes
Montana • No freeway lanes with reduced widths • 6’ wide outside shoulders in some locations due to constraints of adjacent terrain
Oregon • No freeway lanes with reduced widths • Reduced median shoulder widths in some locations, but full outside shoulders provided• Design exceptions are required for reduced shoulder widths
South Dakota • No freeways with reduced lane or shoulder widths
Texas • 11’ wide lanes are present in some urban areas • Design exceptions were required for the narrower lanes • Trucks are permitted in the narrowed lanes • No freeway shoulders with reduced widths
Utah • Reduced lane widths used on 7 miles if I-215 (Salt Lake City) • 2’ wide median shoulders used on portions of I-15 (full outside shoulders provided)
Vermont • No freeways with reduced lane or shoulder widths
Washington • 11’ wide lanes are used on I-90, I-405, and SR 167 • SR 167 has 11’ wide lanes with 2’ wide inside and 8’ wide outside shoulders.
Design exception from FHWA required implementation of safety measures • Additional information provided on ATM and the ROD for I-90
West Virginia • No freeways with reduced lane or shoulder widths
Wisconsin • 11’ wide lanes are present on 3.5 miles of I-94 near Madison • Reduced shoulder widths (< 10’ wide for right shoulders; < 6’ wide for median
shoulders on 4 lane freeways; < 10’ wide median shoulders on 6 lane freeways) for over 100 miles including some locations where both shoulders are reduced
• Design exceptions are required and Wisconsin has an established procedure

WEST SIDE MOBILITY STUDY
July 2009 62
Table E-4: Typical Lane Width Design Values
Country Freeway Lane Width Brazil 12’ -4” China 11’-6” to 12’-4”
Czech Republic 11’-6” to 12’-4” Denmark 11’-6” France 11’-6”
Germany 11’-6” to 12’-4” Greece 11’-6” to 12’-4” Hungary 12’ -4” Indonesia 11’-6” to 12’-4”
Israel 12’ -4” Japan 11’-6” to 12’-4”
Netherlands 11’-6” Portugal 12’ -4”
South Africa 12’-0” Spain 11’-6” to 12’-4”
Switzerland 3.75 to 4.0 m United Kingdom 11’-10”
Venezuela 11’-8” Yugoslavia (current nations) 11’-6” to 12’-4”
• HOV Plus HOT: Operate the new lanes as HOT lanes, but maintain the existing HOV lanes. This particular scenario would only apply on the I-270 mainline and Spurs where there are existing HOV lanes and a proposed two-lane managed facility. On the Capital Beltway, the one managed lane per direction would be operated as an HOT lane. The occupancy requirements for HOV vehicles would have to be determined (2+, 3+, 7+, etc.).
• HOV Plus ETL: Operate the new lanes as ETL, but maintain the existing HOV lanes.
This particular scenario would only apply on the I-270 mainline and Spurs where there are existing HOV lanes and a proposed two-lane managed facility. On the Capital Beltway, the one managed lane would be operated as an ETL. The occupancy requirements for HOV vehicles would have to be determined (2+, 3+, 7+, etc.).
The operational scenarios will be studied in greater detail as the study moves forward. Cost A preliminary cost estimate was developed for the restriping improvement. Costs were developed that did and did not include localized widening to improve horizontal sight distance. These costs are summarized in Table E-5.

WEST SIDE MOBILITY STUDY
July 2009 63
Table E-5: Preliminary Cost Estimates for Restriping Improvement (in 2008 dollars) Without Localized
Widening ($ M) With Localized Widening
($ M) Category 1 (MOT) $21.2 $25.2 Category 2 (Earthwork) $1.9 $2.1 Category 3 (Drainage / SWM) $21.4 $25.5 Category 4 (Structures) $0.0 $8.8 Category 5 (Pavement) $37.1 $38.4 Category 6 (Shoulders) $13.9 $13.9 Category 7 (Landscaping) $0.5 $0.6 Category 8 (Traffic) $7.9 $7.9 Category 8 (Utilities) $5.2 $7.1 Localized Widening (CPM) $0.0 $27.3 Subtotal $109.1 $156.7 Contingency (40%) $43.7 $62.7 Neat Construction $152.8 $219.4 Admin / Overhead (15%) $22.9 $32.9 Preliminary Engineering (15%) $27.1 $38.9 Total $202.8 $291.2
4. Summary Mid-term improvements would provide additional capacity and a managed lane system throughout the study corridor, but would not incur the expense or impacts associated with the long-term improvements. The mid-term improvement that appears to offer the most benefits would include restriping the highway to provide one extra lane in each direction. The existing lane and shoulder widths would be reduced to accommodate the additional lane within the existing highway typical section. This restriping improvement should be investigated further. There are numerous design and operational concerns associated with reducing the lane and shoulder widths within the study corridor. These issues were considered in this initial evaluation, but they would have to be more thoroughly investigated and addressed as the restriping improvement is carried forward in planning and design. Continued investigation of similar projects in other states and countries should be conducted to understand the lessons learned and best approaches to apply these types of modifications. Coordination with FHWA would be essential to ensure that the proposed physical typical section adjustments could pass a design exception. In addition, the implementation of managed lanes within the study corridor will have to be further considered. More detailed study will be needed to evaluate the type of managed lane system (HOV, HOT, ETL) that should be utilized on these facilities, as well as the connection to the proposed systems on either end of the project limits. Technical considerations such as tolling systems (HOT or ETL), enforcement, and access will also need to be addressed in detail. Finally, detailed traffic analysis would have to be completed to understand the affect that the restriping alternative would have on highway operations, especially compared to a no-build condition.

WEST SIDE MOBILITY STUDY
July 2009 64
F. CONCLUSIONS The West Side Mobility Study examined a full range of alternatives that could be implemented to increase capacity and provide a managed lane network on the Capital Beltway and I-270 between the VDOT HOT Lanes Project and the I-270 / I-370 interchange. These improvements included long-term alternatives that would provide additional capacity through widening of the mainline, modifications to existing interchanges, and construction of new direct access interchanges; short-term improvements that would focus on localized solutions to relieve specific congestion points; and mid-term improvements that would provide increased capacity and a managed lanes network within the existing highway typical section. Seven long-term alternatives were evaluated in this study and all of them would require widening along some or all segments of highway within the study limits. Due to the preliminary nature of the study, detailed engineering was completed for the one alternative that would provide the largest footprint and impacts (Alternative 4). Traffic analyses were completed for four alternatives (1, 2, 4, and 5) and the results were applied to the other three alternatives. The widening would result in property impacts, displacements, and environmental impacts. Preliminary environmental impacts were quantified for wetlands / Waters of the U.S. and parks adjacent to the highway; however, additional environmental impacts could be expected. General costs were prepared for all seven of the alternatives and they offer a cost range between $1.04 billion (in 2008 dollars) for Alternative 1 and $2.65 billion for Alternative 4 (in 2009 dollars; $2.27 billion in 2008 dollars). Generally, the long-term alternatives would improve future traffic operations compared to a No-Build scenario, but congestion would persist in multiple locations along the mainline. Of the seven long-term alternatives evaluated, it was determined that Alternative 1, 4, 5, 5A, and 5B would provide additional capacity and a managed lane network along with improvements to the traffic operations and should be studied further. Alternatives 2 and 3 would not offer as great a benefit and will not be studied further. A series of short-term improvements were considered that could be implemented to alleviate some of the existing congestion. These improvements were analyzed to determine the affect that they could have on traffic operations. The evaluation of potential short-term improvements indicated that some improvements, or combination of improvements, would result in modest benefits to the system-wide traffic operations. The short-term improvements could be evaluated further as part of a subsequent planning study or broken out as a separate study that could potentially be implemented sooner. Five mid-term improvements were considered and the restriping option appeared to offer the most benefits by providing one full-time, extra lane per direction. However, the existing lane and shoulder widths would be reduced to accommodate an additional lane in each direction within the existing highway typical section. There are a number of design and operational concerns associated with reducing the lane and shoulder widths and these issues were considered in this initial study, but they would have to be more thoroughly investigated and addressed as the restriping improvement is carried forward in planning and design. Finally, the implementation of a managed lane strategy within the study corridor would have to be considered further, along with detailed traffic analyses and revenue analyses for all of these strategies.

WEST SIDE MOBILITY STUDY
July 2009 65
APPENDIX A –
LONG-TERM ALTERNATIVE 4 DISPLAY SHEETS

WEST SIDE MOBILITY STUDY
July 2009 66
APPENDIX B –
CORSIM RESULTS FOR SHORT-TERM IMPROVEMENTS

WEST SIDE MOBILITY STUDY AND I-270 FEASIBILITY STUDY
Potential Short-term Improvement Comparisons Southbound AM Peak Hour
Localized Total System (Mainline GP)
Avg. Delay
(min/veh-mile)
Total Delay
(veh-hour)
Avg. Delay
(min/veh-mile)
Total Delay
(veh-hour)
Comments
Existing - - 0.56 4742
SB Improvement 1: Capital Beltway in Maryland SB extend deceleration lane on the shoulder from the MD 190 exit by 500’
0% (GP) 0% (GP) 0.54 (-4%)
4637 (-2%)
• Recommend additional model runs to ensure consistency and correct results.
• Consider more field observations to determine cause of congestion.
• Would eliminate right shoulder pull-off area for 500’
SB Improvement 2: I-270 West Spur convert the HOV lane as a general purpose lane
-5% (GP)
-36% (CD)
-16% (GP)
-29% (CD)
0.51 (-9%)
4394 (-7%)
• Both I-270 Mainline and CD Road are improved more than 10% in travel time and speed.
SB Improvement 3: I-270 West Spur extend acceleration lane from the Democracy Blvd ramp to the I-270 West Spur / I-495 Interchange
+29% (GP) +28% (GP) 0.57 (+2%)
4842 (+2%)
• The ramp merging point would be too close to I-495 merging downstream, which would deteriorate traffic.
SB Improvement 4: I-270 Mainline SB (multiple locations) extend slip ramp acceleration lanes on the right shoulder of mainline by 1000’
-3% (GP)
-30% (CD)
-2% (GP)
-23% (CD)
0.52 (-7%)
4451 (-6%)
• Nominal improvements on I-270 Mainline. • CD Road improved about 20% in travel time and
speed. • Would eliminate right shoulder pull off areas for
1000’
SB Improvement 5: I-270 Mainline SB Close the northern of two consecutive slip ramp entrances between MD 28 and Gude Drive
+2% (GP)
+125% (CD)
+2% (GP)
+106% (CD)
0.62 (+11%)
5231 (+10%)
• The heavy merge after combining two slip ramps would deteriorate traffic operations.
SB Improvement 6: I-270 CD Road SB extend acceleration lane for MD 28 ramp on right shoulder by 1000’
-19% (CD) -15% (CD) 0.54 (-4%)
4661 (-2%)
• Slight improvement on I-270 CD Road. But it would not solve the congestion on MD 28 EB Ramp.
• Would eliminate right shoulder pull-off area for 1000’
SB All Improvements Combined - - 0.52 (-7%)
4513 (-5%)
SB Improvements 1, 2, 4, and 6 only 0.48
(-14%) 4171
(-12%)
Pink – worse than existing Green – better than existing M:\projects\2006\06094_sha_ppd\Task 02\Traffic\Shortterm(AM) Improvements.doc

SB Improvement 1: Capital Beltway in Maryland SB – extend deceleration lane in the shoulder from the MD 190 exit.
MOE Existing SB Improvement 1 Impact Area 1 (Mainline): I-495 OL from I-270 to Clara Barton Pkwy (3.2 miles)
Travel time (mainline) 3.3 min 3.3 min Speed (mainline) 30 mph 30 mph Density (mainline) 58 vpmpl 58 vpmpl
LOS (mainline) F F Impact Area 2 (Exit Ramp):
Speed (exit-ramp) 22 mph 33 mph Density (exit -ramp) 46.7 vpmpl 32.7 vpmpl
LOS (exit -ramp) F C Impact Area 1 Avg. Delay 0.19 Min/Veh-Mile 0.19 Min/Veh-Mile Impact Area 1 Total Delay 70 Veh-Hour 70 Veh-Hour Total System Avg. Delay 0.56 Min/Veh-Mile 0.54 Min/Veh-Mile Total System Total Delay 4742 Veh-Hour 4637 Veh-Hour
Comments: • Recommend additional model runs to ensure consistency and correct results. • Consider more field observations to determine cause of congestion.
Extend 500ft Deceleration Lane Length

SB Improvement 2: I-270 West Spur – designate the HOV lane on the I-270 West spur (both directions) as a general purpose lane.
MOE Existing SB Improvement 2 Impact Area 1 (Mainline): I-270 Mainline SB from MD 28 to Beltway (6.0 miles)
Travel time 13.8 min 13.4 min Speed 26 mph 27 mph Density 75 vpmpl 73 vpmpl
LOS F F Impact Area 1 Avg. Delay 1.45 Min/Veh-Mile 1.38 Min/Veh-Mile Impact Area 1 Total Delay 1508 Veh-Hour 1484 Veh-Hour
Impact Area 2 (CD): I-270 CD Road SB (5.5 miles) Travel time 16.3 min 12.6 min
Speed 20 mph 26 mph Density 65 vpmpl 55 vpmpl
LOS F F Impact Area 2 Avg. Delay 2.0 Min/Veh-Mile 1.28 Min/Veh-Mile Impact Area 2 Total Delay 883 Veh-Hour 626 Veh-Hour Total System Avg. Delay 0.56 Min/Veh-Mile 0.51 Min/Veh-Mile Total System Total Delay 4742 Veh-Hour 4394 Veh-Hour
Comments: • Both I-270 Mainline and CD Road are improved more than 10% in travel time and speed.
Convert HOV lane to general purpose lane

SB Improvement 3: I-270 West Spur – extend acceleration lane from the Democracy Blvd ramp to the I-270 West Spur / I-495 Interchange
MOE Existing SB Improvement 3 Impact Area (Mainline): I-270 Mainline SB from East Spur to Beltway (1.9 miles)
Travel time 4.1 min 4.7 min Speed 28 mph 24 mph Density 71 vpmpl 73 vpmpl
LOS F F Impact Area Avg. Delay 1.26 Min/Veh-Mile 1.63 Min/Veh-Mile Impact Area Total Delay 341 Veh-Hour 435 Veh-Hour Total System Avg. Delay 0.56 Min/Veh-Mile 0.57 Min/Veh-Mile Total System Total Delay 4742 Veh-Hour 4842 Veh-Hour
Comments: • The ramp merging point would be too close to the I-495 merge downstream. • Improvement would deteriorate traffic operations.
Extend Acceleration Lane to the Structure

SB Improvement 4: I-270 Mainline SB (multiple locations) – extend slip ramp acceleration lanes in the right shoulder of mainline
MOE Existing SB Improvement 4 Impact Area 1 (Mainline): I-270 Mainline SB parallel with CD Road (5.6 miles)
Travel time 12.1 min 11.9 min Speed 28 mph 28 mph Density 68 vpmpl 65 vpmpl
LOS F F Impact Area 1 Avg. Delay 1.29 Min/Veh-Mile 1.25 Min/Veh-Mile Impact Area 1 Total Delay 1445 Veh-Hour 1415 Veh-Hour
Impact Area 2 (CD): I-270 CD Road SB (5.5 miles) Travel time 16.3 min 13.1 min
Speed 20 mph 25 mph Density 65 vpmpl 56 vpmpl
LOS F F Impact Area 2 Avg. Delay 2.0 Min/Veh-Mile 1.4 Min/Veh-Mile Impact Area 2 Total Delay 883 Veh-Hour 663 Veh-Hour Total System Avg. Delay 0.56 Min/Veh-Mile 0.52 Min/Veh-Mile Total System Total Delay 4742 Veh-Hour 4451 Veh-Hour
Comments: • Nominal improvements on I-270 Mainline. • CD Road improved about 20% in travel time and speed.
Extend All Slip Ramp Acceleration Lanes to 1000 ft.

SB Improvement 5: I-270 Mainline SB – Close the northern of two consecutive slip ramp entrances between MD 28 and Gude Drive.
MOE Existing SB Improvement 5 Impact Area 1 (Mainline): I-270 Mainline SB from MD 117 to MD 28 (4.9 miles)
Travel time 8.5 min 8.6 min Speed 35 mph 34 mph Density 54 vpmpl 56 vpmpl
LOS F F Impact Area 1 Avg. Delay 0.86 Min/Veh-Mile 0.88 Min/Veh-Mile Impact Area 1 Total Delay 915 Veh-Hour 934 Veh-Hour
Impact Area 2 (CD): I-270 CD Road SB from Begin to MD 28 (2.4 miles) Travel time 7.4 min 13.7 min
Speed 20 mph 11 mph Density 58 vpmpl 99 vpmpl
LOS F F Impact Area 2 Avg. Delay 2.0 Min/Veh-Mile 4.5 Min/Veh-Mile Impact Area 2 Total Delay 364 Veh-Hour 751 Veh-Hour Total System Avg. Delay 0.56 Min/Veh-Mile 0.62 Min/Veh-Mile Total System Total Delay 4742 Veh-Hour 5231 Veh-Hour
Comments: • Volumes from two slip ramps would be combined onto one slip ramp. • Heavy merge would deteriorate traffic operations.
Close the Northern Slip Ramp, North of MD 28

SB Improvement 6: I-270 CD Road SB – extend acceleration lane for MD 28 ramp into right shoulder.
MOE Existing SB Improvement 6 Impact Area 1 (CD): I-270 CD Road SB from SGR to MD 189 (2.5 miles)
Travel time (CD Road) 6.7 min 5.8 min Speed (CD Road) 22 mph 25 mph Density (CD Road) 72 vpmpl 62 vpmpl
LOS (CD Road) F F Impact Area 1 Avg. Delay 1.72 Min/Veh-Mile 1.4 Min/Veh-Mile Impact Area 1 Total Delay 378 Veh-Hour 321 Veh-Hour Impact Area 2 (On-Ramp):
Speed (on-ramp) 8 mph 10 mph Density (on-ramp) 173 vpmpl 160 vpmpl
LOS (on-ramp) F F Total System Avg. Delay 0.56 Min/Veh-Mile 0.54 Min/Veh-Mile Total System Total Delay 4742 Veh-Hour 4661 Veh-Hour
Comments:
• Slight improvement on I-270 CD Road. • Does not solve the congestion on MD 28 EB Ramp.
Extend On-ramp Acceleration Lane by 1000 ft.

WEST SIDE MOBILITY STUDY AND I-270 FEASIBILITY STUDY
Potential Short-term Improvement Comparisons
Northbound – PM Peak Hour
Localized Total System (Mainline GP)
Avg. Delay(min/veh-
mile) Total Delay(veh-hour)
Avg. Delay(min/veh-
mile)
Total Delay
(veh-hour)
Comments
Existing - - 1.39 11,819
NB Improvement 1: West Spur / I-495 Split I-270 provide 4 lanes to I-270 west spur and 3 lanes to I-495
+82% (I-270) -14% (I-495)
+85% (I-270) -5% (I-495)
1.38 (-1%)
11,658 (-1%)
• The overall system has very slight improvement. • Traffic in the additional lane would need to merge
into mainline before the exit to Democracy EB, merely relocating the bottleneck further north from I-270/I-495 diverge.
NB Improvement 2: I-270 West Spur convert HOV lane on the I-270
West spur as a general purpose lane
-33% (I-270) -36% (I-495)
-30% (I-270) -32% (I-495)
1.37 (-1%)
11,494 (-3%)
• The additional capacity would improve both I-270 west spur and I-495 inner loop south of I-270 split.
• However, the overall system has slight improvement due to the limited downstream capacity.
NB Improvement 3: Capital Beltway Extend the left HOV lane further
south on the left shoulder and convert HOV to general purpose lane
+8% (I-270) -43% (I-495)
+17% (I-270) -37% (I-495)
1.29 (-7%)
11,018 (-7%)
• I-495 inner loop south of I-270 split is improved with this extension.
• The extended left lane carries more traffic to west spur and causes more delay on I-270 west spur.
NB Improvement 4: Capital Beltway Extend the left HOV lane further
south on the left shoulder
-8% (I-270) -36% (I-495)
7% (I-270) -31% (I-495)
1.29 (-7%)
11,022 (-7%)
• I-495 inner loop south of I-270 split is improved (less than Improvement 3) with this extension.
• This option also slightly improves I-270 west spur.
NB All Improvements Combined This scenario would not be run because Improvement 1 and Improvement 2 are not likely to be implemented together.
NB Improvements 2 and 3 only No need to run this scenario because Improvement 2 is embedded within Improvement 3.
pink – worse than existing green – better than existing M:\projects\2006\06094_sha_ppd\Task 02\Traffic\Shortterm(PM) Improvements.doc

NB Improvement 1: Modify the I-270 west spur / I-495 split, provide 4 lanes to I-270 west spur and 3 lanes to I-495.
MOE Existing NB Improvement 1 Impact Area 1 (I-270): I-270 NB from I-495 to Democracy EB Ramp (0.8 mile) Travel time (mainline) 1.6 min 2.3 min
Speed (mainline) 30 mph 21 mph Density (mainline) 54 vpmpl 61 vpmpl
LOS (mainline) F F Impact Area 1 Avg. Delay 1.1 Min/Veh-Mile 2.0 Min/Veh-Mile Impact Area 1 Total Delay 118 Veh-Hour 218 Veh-Hour
Impact Area 2 (I-495): I-495 Inner Loop from VA 193 to I-270 Split (5.4 miles) Travel time (mainline) 11.9 min 11.5 min
Speed (mainline) 27.1 mph 28.0 mph Density (mainline) 62 vpmpl 61 vpmpl
LOS (mainline) F F Impact Area 2 Avg. Delay 1.4 Min/Veh-Mile 1.2 Min/Veh-Mile Impact Area 2 Total Delay 1591 Veh-Hour 1512 Veh-Hour Total System Avg. Delay 1.39 Min/Veh-Mile 1.38 Min/Veh-Mile Total System Total Delay 11,819 Veh-Hour 11,658 Veh-Hour
Comments:
• The overall system has very slight improvement. • Traffic in the additional lane would need to merge into mainline before the exit to Democracy EB,
merely relocating the bottleneck further north from I-270/I-495 diverge. .
Provide 4 Lanes to I-270 West Spur

NB Improvement 2: I-270 West Spur – designate the HOV lane on the I-270 West spur as a general purpose lane.
MOE Existing NB Improvement 2 Impact Area 1 (I-270): I-270 NB from I-495 to Westlake Terrace (1.5 miles) Travel time (mainline) 3.1 min 2.5 min
Speed (mainline) 29 mph 36 mph Density (mainline) 58 vpmpl 53 vpmpl
LOS (mainline) F F
Impact Area 1 Avg. Delay 1.2 Min/Veh-Mile 0.8 Min/Veh-Mile Impact Area 1 Total Delay 239 Veh-Hour 168 Veh-Hour
Impact Area 2 (I-495): I-495 Inner Loop from VA 193 to I-270 Split (5.4 miles) Travel time (mainline) 11.9 min 9.6 min
Speed (mainline) 27.1 mph 33.6 mph Density (mainline) 62 vpmpl 51 vpmpl
LOS (mainline) F F
Impact Area 2 Avg. Delay 1.4 Min/Veh-Mile 0.9 Min/Veh-Mile Impact Area 2 Total Delay 1591 Veh-Hour 1084 Veh-Hour
Total System Avg. Delay 1.39 Min/Veh-Mile 1.37 Min/Veh-Mile Total System Total Delay 11,819 Veh-Hour 11,494 Veh-Hour
Comments: • The additional capacity would improve both I-270 west spur and I-495 inner loop south
of I-270 split. • However, the overall system has slight improvement due to the limited downstream
capacity.
Convert HOV lane to general purpose lane

NB Improvement 3: Extend the addition of the left lane further south and designate the lane as general purpose lane
MOE Existing NB Improvement 3 Impact Area 1 (I-270): I-270 NB from I-495 to Westlake Terrace (1.5 miles) Travel time (mainline) 3.1 min 3.3 min
Speed (mainline) 29 mph 27 mph Density (mainline) 58 vpmpl 73 vpmpl
LOS (mainline) F F Impact Area 1 Avg. Delay 1.2 Min/Veh-Mile 1.3 Min/Veh-Mile Impact Area 1 Total Delay 239 Veh-Hour 280 Veh-Hour
Impact Area 2 (I-495): I-495 Inner Loop from VA 193 to I-270 Split (5.4 miles) Travel time (mainline) 11.9 min 9.3 min
Speed (mainline) 27.1 mph 34.9 mph Density (mainline) 62 vpmpl 48 vpmpl
LOS (mainline) F F Impact Area 2 Avg. Delay 1.4 Min/Veh-Mile 0.8 Min/Veh-Mile Impact Area 2 Total Delay 1591 Veh-Hour 999 Veh-Hour Total System Avg. Delay 1.39 Min/Veh-Mile 1.29 Min/Veh-Mile Total System Total Delay 11,819 Veh-Hour 11,018 Veh-Hour
Comments: • I-495 inner loop south of I-270 split is improved with this extension. • The extended left lane carries more traffic to west spur and causes more delay.
Convert HOV lane to general purpose lane
Extend the addition of the left lane (as general purpose lane) further south

NB Improvement 4: Extend the addition of the left lane further south and designate the lane as HOV lane
MOE Existing NB Improvement 3 Impact Area 1 (I-270): I-270 NB from I-495 to Westlake Terrace (1.5 miles) Travel time (mainline) 3.1 min 2.9 min
Speed (mainline) 29 mph 31 mph Density (mainline) 58 vpmpl 58 vpmpl
LOS (mainline) F F Impact Area 1 Avg. Delay 1.2 Min/Veh-Mile 1.1 Min/Veh-Mile Impact Area 1 Total Delay 239 Veh-Hour 223 Veh-Hour
Impact Area 2 (I-495): I-495 Inner Loop from VA 193 to I-270 Split (5.4 miles) Travel time (mainline) 11.9 min 9.9 min
Speed (mainline) 27.1 mph 32.5 mph Density (mainline) 62 vpmpl 52 vpmpl
LOS (mainline) F F Impact Area 2 Avg. Delay 1.4 Min/Veh-Mile 0.9 Min/Veh-Mile Impact Area 2 Total Delay 1,591 Veh-Hour 1,097 Veh-Hour Total System Avg. Delay 1.39 Min/Veh-Mile 1.29 Min/Veh-Mile Total System Total Delay 11,819 Veh-Hour 11,022 Veh-Hour
Comments: • I-495 inner loop south of I-270 split is improved (less than Improvement 3). • This option also slightly improves the I-270 west spur.
Extend the addition of the left lane (as HOV lane) further south