![Analysis of Elastic GeomechanicalProperties derived .... 8 Issue... · predicted for wellbore stability to be assured. According to [1], the oil industry spends billionsof dollars](https://static.fdocuments.in/doc/165x107/5ec2765cbe7c67133c5e1e49/analysis-of-elastic-geomechanicalproperties-derived-8-issue-predicted.jpg)
Wellbore Stability and Predicted Cuttings Volume in ...
11
1. INTRODUCTION Similar to mining and tunnelling industries, the oil and gas industry has long acknowledged that instability of subsurface excavations can pose serious problems affecting the timing, risk management and economics of a project. With the oil and gas industry exploring reservoirs under increasingly difficult geological conditions and with complex recovery techniques becoming standard, wellbore stability analysis needs to reflect these challenging environments and account for difficult geological conditions, such as drilling in depleted formations, highly deviated wells or laminated formations. Challenging conditions can also be encountered in other applications dealing with subsurface integrity issues and “reservoir containment geomechanics” (Schultz et al., 2016) such as geothermal fields (Moeck and Bakers, 2011; Ghassemi, 2012) and carbon dioxide sequestration (Streit and Hillis, 2004; Rutqvist, 2012; Zoback and Gorelick, 2012; Altman et al., 2014). The availability of methods for real-time wellbore imaging, caving monitoring and managed wellbore pressure combined with real-time wellbore stability prediction can provide a robust tool for the planning and management of wells under difficult conditions (Willson et al., 2007). Pre-drill and real-time wellbore stability prediction consists of predicting any possible instability around the wellbore and is principally based on the stress concentration around the wellbore versus the formation strength. Depending on the mud weight, wellbore instability can result in lost circulation, breakouts or hole closure and even in loss of the open- hole section due to stuck and damaged drill pipe (Lang et al., 2011). Conventional pre-drill wellbore stability analysis considers the linear elastic or poroelastic response of the rock and has been well documented in published literature (e.g. Zoback 2007). Wellbore collapse is expected to occur at a point surrounding the wellbore whenever the elastic/poroelastic stress satisfies the failure criterion of the rock. Although failure criteria, such as Mohr-Coulomb or Drucker-Prager, can inform the onset of plastic yielding, these analyses are usually conservative in predicting the mud weight window (Chen and Abousleiman, 2017). For a more appropriate representation of the formation response and hence a better determination of the minimum mud weight, advanced elastoplastic constitutive models which take ARMA 20-1864 Wellbore Stability and Predicted Cuttings Volume in Deviated Wellbores and Bedded Formations Tsopela A., Bere A., Dutko M. and Kato J. Rockfield Software Ltd., Ethos, Kings Road, Prince of Wales Dock, Swansea Waterfront, SA1 8AS, UK Copyright 2020 ARMA, American Rock Mechanics Association This paper was prepared for presentation at the 54 th US Rock Mechanics / Geomechanics Symposium held in Golden, CO, USA, 28 June-1 July 2020. This paper was selected for presentation at the symposium by an ARMA Technical Program Committee based on a technical and critical review of the paper by a minimum of two technical reviewers. The material, as presented, does not necessarily reflect any position of ARMA, its officers, or members. Electronic reproduction, distribution, or storage of any part of this paper for commercial purposes without the written consent of ARMA is prohibited. Permission to reproduce in print is restricted to an abstract of not more than 200 words; illustrations may not be copied. The abstract must contain conspicuous acknowledgement of where and by whom the paper was presented ABSTRACT: The success of hydrocarbon recovery from the subsurface relies on wellbore stability usually provided by suitable mud-weight. Too low can cause breakout and wellbore collapse; too high can cause fractures (breakdown), and thereby giving rise to an operating mud-weight window (MWW). The MWW forms part of the operator’s well planning process and is sensitive to in- situ stress estimates, well trajectory and formation material properties. Analytical calculations can estimate the onset of damage around a wellbore; however, this has two inherent limitations in not being able to capture 1) complex stress distribution around wellbores deviated from the in-situ stress direction and/or in non-homogeneous formations, and 2) material softening/hardening due to formation damage and redistribution of stress influencing further damage or stability/instability. 3-dimensional numerical modelling has the capability of capturing stress conditions around wellbores of any orientation, while additionally considering constitutive material models that can capture both heterogeneous characteristics (including bedding plane effects) and post-yield strength softening/hardening. Therefore, with efficient modelling techniques it is possible to capture detailed wellbore stability due to a range of well trajectories and formation anisotropy. By careful consideration of the results it is possible to provide beneficial information for drilling, such as predicted cuttings volume and safe MWW. Such modelling and result assessment techniques are available in the Elfen wellbore software; paper provides detailed assessment of both wellbore deviation and formation heterogeneity with an aim to enhancing current wellbore stability assessments.
Transcript of Wellbore Stability and Predicted Cuttings Volume in ...

1. INTRODUCTION
Similar to mining and tunnelling industries, the oil and
gas industry has long acknowledged that instability of
subsurface excavations can pose serious problems
affecting the timing, risk management and economics of
a project. With the oil and gas industry exploring
reservoirs under increasingly difficult geological
conditions and with complex recovery techniques
becoming standard, wellbore stability analysis needs to
reflect these challenging environments and account for
difficult geological conditions, such as drilling in
depleted formations, highly deviated wells or laminated
formations. Challenging conditions can also be
encountered in other applications dealing with
subsurface integrity issues and “reservoir containment
geomechanics” (Schultz et al., 2016) such as geothermal
fields (Moeck and Bakers, 2011; Ghassemi, 2012) and
carbon dioxide sequestration (Streit and Hillis, 2004;
Rutqvist, 2012; Zoback and Gorelick, 2012; Altman et
al., 2014).
The availability of methods for real-time wellbore
imaging, caving monitoring and managed wellbore
pressure combined with real-time wellbore stability
prediction can provide a robust tool for the planning and
management of wells under difficult conditions (Willson
et al., 2007). Pre-drill and real-time wellbore stability
prediction consists of predicting any possible instability
around the wellbore and is principally based on the
stress concentration around the wellbore versus the
formation strength. Depending on the mud weight,
wellbore instability can result in lost circulation,
breakouts or hole closure and even in loss of the open-
hole section due to stuck and damaged drill pipe (Lang
et al., 2011).
Conventional pre-drill wellbore stability analysis
considers the linear elastic or poroelastic response of the
rock and has been well documented in published
literature (e.g. Zoback 2007). Wellbore collapse is
expected to occur at a point surrounding the wellbore
whenever the elastic/poroelastic stress satisfies the
failure criterion of the rock. Although failure criteria,
such as Mohr-Coulomb or Drucker-Prager, can inform
the onset of plastic yielding, these analyses are usually
conservative in predicting the mud weight window
(Chen and Abousleiman, 2017). For a more appropriate
representation of the formation response and hence a
better determination of the minimum mud weight,
advanced elastoplastic constitutive models which take
ARMA 20-1864
Wellbore Stability and Predicted Cuttings Volume
in Deviated Wellbores and Bedded Formations
Tsopela A., Bere A., Dutko M. and Kato J.
Rockfield Software Ltd., Ethos, Kings Road, Prince of Wales Dock, Swansea Waterfront, SA1 8AS, UK
Copyright 2020 ARMA, American Rock Mechanics Association
This paper was prepared for presentation at the 54th US Rock Mechanics / Geomechanics Symposium held in Golden, CO, USA, 28 June-1 July 2020. This paper was selected for presentation at the symposium by an ARMA Technical Program Committee based on a technical and critical review of the paper by a minimum of two technical reviewers. The material, as presented, does not necessarily reflect any position of ARMA, its officers, or members. Electronic reproduction, distribution, or storage of any part of this paper for commercial purposes without the written consent of ARMA is prohibited. Permission to reproduce in print is restricted to an abstract of not more than 200 words; illustrations may not be copied. The abstract must contain conspicuous acknowledgement of where and by whom the paper was presented
ABSTRACT: The success of hydrocarbon recovery from the subsurface relies on wellbore stability usually provided by suitable
mud-weight. Too low can cause breakout and wellbore collapse; too high can cause fractures (breakdown), and thereby giving rise
to an operating mud-weight window (MWW). The MWW forms part of the operator’s well planning process and is sensitive to in-
situ stress estimates, well trajectory and formation material properties. Analytical calculations can estimate the onset of damage
around a wellbore; however, this has two inherent limitations in not being able to capture 1) complex stress distribution around
wellbores deviated from the in-situ stress direction and/or in non-homogeneous formations, and 2) material softening/hardening
due to formation damage and redistribution of stress influencing further damage or stability/instability. 3-dimensional numerical
modelling has the capability of capturing stress conditions around wellbores of any orientation, while additionally considering
constitutive material models that can capture both heterogeneous characteristics (including bedding plane effects) and post-yield
strength softening/hardening. Therefore, with efficient modelling techniques it is possible to capture detailed wellbore stability due
to a range of well trajectories and formation anisotropy. By careful consideration of the results it is possible to provide beneficial
information for drilling, such as predicted cuttings volume and safe MWW. Such modelling and result assessment techniques are
available in the Elfen wellbore software; paper provides detailed assessment of both wellbore deviation and formation
heterogeneity with an aim to enhancing current wellbore stability assessments.
into account the nonlinear hardening or softening
behaviour of the rock are necessary.
Due to their depositional history, many sedimentary
rocks are characterised by laminated structures, most
commonly bedding planes. Numerous experimental
studies have shown that such formations exhibit
anisotropy in stiffness and strength (e.g. Bonnelye et al.,
2017). In the case of extended reach wells, bedding-
related wellbore instability can become a significant
drilling obstacle; common considerations of
homogeneous rock may fail to describe failure under
these conditions (Ong and Roegiers, 1993). In-situ
observations and experimental results (Willson et al.,
1999; Ask and Ask, 2007; Lang et al., 2011; Tellez et
al., 2012; Labiouse and Vietor, 2014; Konstantinovskaya
et al., 2016; Mehrabian et al., 2018) have shown that, in
the presence of bedding planes yielding occurs at the
corners of the wellbore unlike the conventional
breakouts, and the dominant mechanism is buckling of
the exposed bedding leading to subsequent fracturing at
the maximum curvature (Okland and Cook, 1998).
While there exists some semi-analytical solutions
considering both strain hardening/softening response
(Chen et al., 2012; Gaede et al., 2013; Chen and
Abousleiman, 2017) and planes of weakness (Zhang,
2013; Zhou et al., 2018), these are usually limited to
specific types of rock, well orientations or stress
conditions. In addition, there are several numerical
models dealing with wellbore stability under complex
conditions, however only a few of them are able to
accurately account for the post-yield redistribution of
stress around the wellbore and capture further potential
damage or stability. Efficient numerical modelling used
for wellbore stability analysis can capture the
mechanism, location and extent of plastic yielding
around the wellbore in a range of well trajectories and
formation heterogeneities. Consideration of the results
provides beneficial information for drilling, such as
operating mud weight window and predicted cuttings
volume; these can be provided post-yield based on the
continuous calculation of the dynamically changing
stresses around the wellbore. Such modelling and result
assessment techniques are available in the Elfen
wellbore software. In the following study, Elfen
wellbore software is used to assess wellbore stability in
both deviated wells and heterogeneous formations
providing insight into the different instability
mechanisms and estimates of operational parameters
with an emphasis on cuttings volume prediction making
use of the software modelling capabilities. Firstly, a
vertical wellbore is considered under different stress and
pressure conditions reproducing theoretical rupture
modes proposed by Etchecopar et al. (1999). Rock
heterogeneity is then considered by introducing planes
of weakness in the model. Lastly, the wellbore trajectory
is modified to estimate the effect of wellbore inclination
and angle of attack on the deviated wellbore stability.
2. MODEL SET-UP
Elfen wellbore software is used for the set-up of the
model and the numerical simulations. The purpose of the
wellbore model is to reproduce rupture modes around
the wellbore given different stress conditions and mud
weight magnitudes, and to explore the effects of varying
formation strength and well orientation. The model used
in this study is three-dimensional (3D) and is based on
the model presented in Willson et al. (2007).
2.1. Model Geometry The model consists of a 9.5 inches diameter wellbore, 50
inches long with the boundaries of the domain extending
to 95 inches (10×well diameter). As a reference case, the
wellbore is considered vertical and aligned with the
principal stress directions.
Fig. 1. Model geometry.
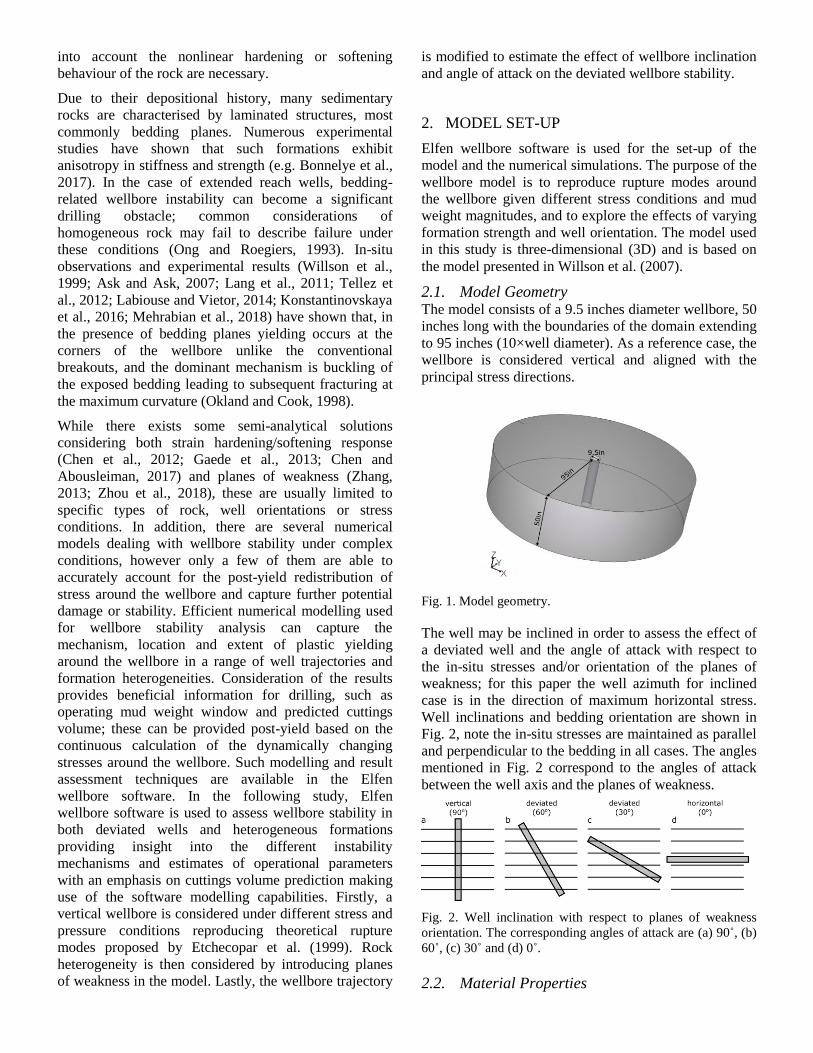
The well may be inclined in order to assess the effect of
a deviated well and the angle of attack with respect to
the in-situ stresses and/or orientation of the planes of
weakness; for this paper the well azimuth for inclined
case is in the direction of maximum horizontal stress.
Well inclinations and bedding orientation are shown in
Fig. 2, note the in-situ stresses are maintained as parallel
and perpendicular to the bedding in all cases. The angles
mentioned in Fig. 2 correspond to the angles of attack
between the well axis and the planes of weakness.
Fig. 2. Well inclination with respect to planes of weakness
orientation. The corresponding angles of attack are (a) 90˚, (b)
60˚, (c) 30˚ and (d) 0˚.
2.2. Material Properties
The material properties used in the model represent a
sandstone including ±10% stochastically varying
elasticity and strength defined by Mohr-Coulomb elasto-
plasticity and a Rankine tension cut-off. To capture the
post-yield response of the material, strain softening is
also accounted for by gradual degradation of the
cohesion, friction angle and dilation angle as a function
of the plastic strain.
To estimate the effect of strength heterogeneity on
wellbore response, planes of weakness (PoW) are
included in some of the analyses presented in this study.
The PoW properties are represented by 1) elasticity
factors normal and tangential to the planes of weakness
which are defined as a factor of the host rock Young’s
and shear moduli, and 2) the plastic properties in terms
of cohesion and friction angle are in the range of values
used in the study from Zhang (2013). The properties of
the planes of weakness together with the host rock
properties are summarised in Table 1, it should be noted
that the tensile strength across PoW is considered zero.
Table 1. Host rock properties
Host Rock Elastic Properties
Young’s Modulus, E (psi) 3e6
Poisson’s Ratio, v (-) 0.2
Density, ρ (g/cc) 0.0058
Host Rock Plastic Properties
Cohesion, c (psi) 865
Friction Angle, ϕ (°) 30
Dilatancy, ψ, (°) 30
Uniaxial Compressive Strength, UCS (psi) 2995
Tensile Strength, σt (psi) 217
Planes of Weakness Elastic Properties
Stiffness Ratio Normal to PoW, Ew/E (-) 0.5
Stiffness Ratio Tangential to PoW, Gw/G (-) 0.5
Cohesion, cw (psi) 200
Friction Angle, ϕw (°) 15
Tensile Strength, σt (psi) 0
2.3. Initial Conditions In order to reproduce the basic rupture patterns a vertical
well, aligned with a principal stress is considered.
According to Etchecopar et al. (1999), under
compressional stress states there are six theoretical
rupture modes occurring in vertical wellbore sub-aligned
to one principal stress direction as shown in Fig. 3. A1
and A2 rupture modes correspond to the common
wellbore breakouts with the tangential stress at the
wellbore exceeding the strength of the rock. B1 and B2
modes result from excessive vertical stress relatively to
the internal pressure. Excessive internal pressure
relatively to external stress causes the C1 and C2 rupture
modes that are believed to form due to elastic
deformation in the unruptured parts of the wellbore,
without producing cavings.
Focusing on A1, B1 and C1 rupture modes and based on
the state of the drilling stresses responsible for each
rupture mode, it is possible to establish the initial in-situ
stress state and maximum mud weight for each case.
Using Anderson’s classification (Anderson, 1905), mode
A1 is the result of thrusting stress regime while B1 and
C1 are the result of an extensional stress regime. The
values of the total principal stresses are summarised in
Table 2.
Table 2. Principal stress magnitudes and stress ratio values for
A1, B1, C1 rupture modes
A1 B1 C1
Vertical stress, σv (psi) isotropic and anisotropic
10195.7 12744.8 12744.8
Max horizontal stress, σH
(psi) – aligned N-S
isotropic and anisotropic
12744.8 10195.7 10195.7
Min horizontal stress, σh
(psi)
isotropic
12744.8 10195.7 10195.7
anisotropic
11744.8 9800.7 9800.7
In-situ Pore Pressure,
Pform (psi) 8131.09 8131.09 8131.09
Max mud weight, Pmud
(psi) 9000 9000 12000
Fig. 3. Shear rupture modes around a vertical wellbore (after
Etchecopar et al. (1999)).
The subsequent analyses accounting for planes of
weakness and deviated wells are performed under the
stress state of the first configuration, A1.
2.4. Loading Loading of the wellbore includes the increase of the mud
pressure during the excavation of the well, a period of
constant pressure higher than the formation pressure
(overbalance) and a subsequent decrease of the pressure
to the formation pressure value. The loading curves for
each case considered are shown in Fig. 4. The sensitivity
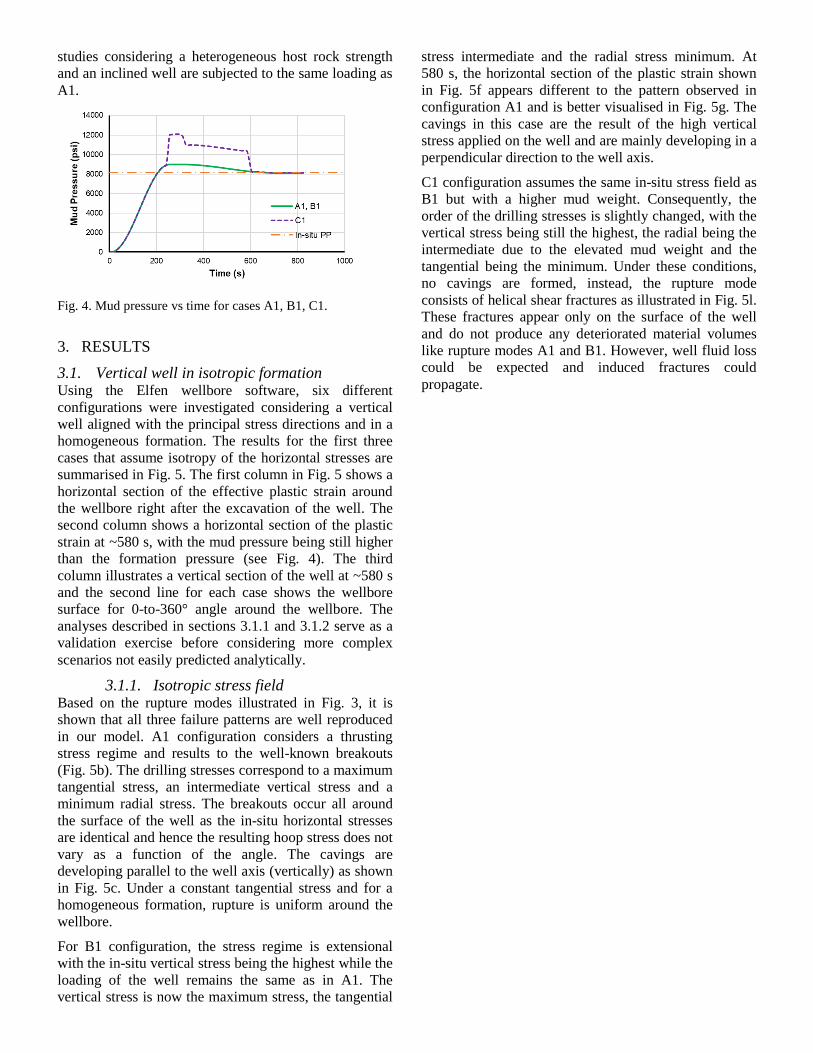
studies considering a heterogeneous host rock strength
and an inclined well are subjected to the same loading as
A1.
Fig. 4. Mud pressure vs time for cases A1, B1, C1.
3. RESULTS
3.1. Vertical well in isotropic formation Using the Elfen wellbore software, six different
configurations were investigated considering a vertical
well aligned with the principal stress directions and in a
homogeneous formation. The results for the first three
cases that assume isotropy of the horizontal stresses are
summarised in Fig. 5. The first column in Fig. 5 shows a
horizontal section of the effective plastic strain around
the wellbore right after the excavation of the well. The
second column shows a horizontal section of the plastic
strain at ~580 s, with the mud pressure being still higher
than the formation pressure (see Fig. 4). The third
column illustrates a vertical section of the well at ~580 s
and the second line for each case shows the wellbore
surface for 0-to-360° angle around the wellbore. The
analyses described in sections 3.1.1 and 3.1.2 serve as a
validation exercise before considering more complex
scenarios not easily predicted analytically.
3.1.1. Isotropic stress field Based on the rupture modes illustrated in Fig. 3, it is
shown that all three failure patterns are well reproduced
in our model. A1 configuration considers a thrusting
stress regime and results to the well-known breakouts
(Fig. 5b). The drilling stresses correspond to a maximum
tangential stress, an intermediate vertical stress and a
minimum radial stress. The breakouts occur all around
the surface of the well as the in-situ horizontal stresses
are identical and hence the resulting hoop stress does not
vary as a function of the angle. The cavings are
developing parallel to the well axis (vertically) as shown
in Fig. 5c. Under a constant tangential stress and for a
homogeneous formation, rupture is uniform around the
wellbore.
For B1 configuration, the stress regime is extensional
with the in-situ vertical stress being the highest while the
loading of the well remains the same as in A1. The
vertical stress is now the maximum stress, the tangential
stress intermediate and the radial stress minimum. At
580 s, the horizontal section of the plastic strain shown
in Fig. 5f appears different to the pattern observed in
configuration A1 and is better visualised in Fig. 5g. The
cavings in this case are the result of the high vertical
stress applied on the well and are mainly developing in a
perpendicular direction to the well axis.
C1 configuration assumes the same in-situ stress field as
B1 but with a higher mud weight. Consequently, the
order of the drilling stresses is slightly changed, with the
vertical stress being still the highest, the radial being the
intermediate due to the elevated mud weight and the
tangential being the minimum. Under these conditions,
no cavings are formed, instead, the rupture mode
consists of helical shear fractures as illustrated in Fig. 5l.
These fractures appear only on the surface of the well
and do not produce any deteriorated material volumes
like rupture modes A1 and B1. However, well fluid loss
could be expected and induced fractures could
propagate.
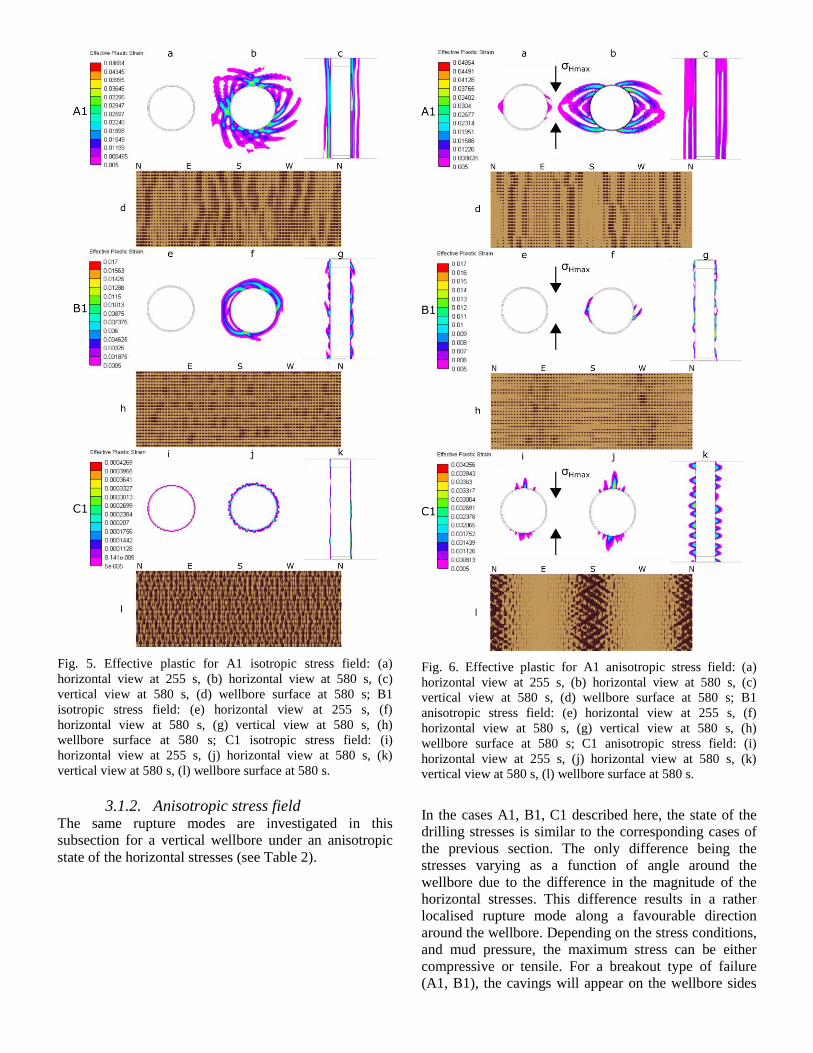
Fig. 5. Effective plastic for A1 isotropic stress field: (a)
horizontal view at 255 s, (b) horizontal view at 580 s, (c)
vertical view at 580 s, (d) wellbore surface at 580 s; B1
isotropic stress field: (e) horizontal view at 255 s, (f)
horizontal view at 580 s, (g) vertical view at 580 s, (h)
wellbore surface at 580 s; C1 isotropic stress field: (i)
horizontal view at 255 s, (j) horizontal view at 580 s, (k)
vertical view at 580 s, (l) wellbore surface at 580 s.
3.1.2. Anisotropic stress field The same rupture modes are investigated in this
subsection for a vertical wellbore under an anisotropic
state of the horizontal stresses (see Table 2).
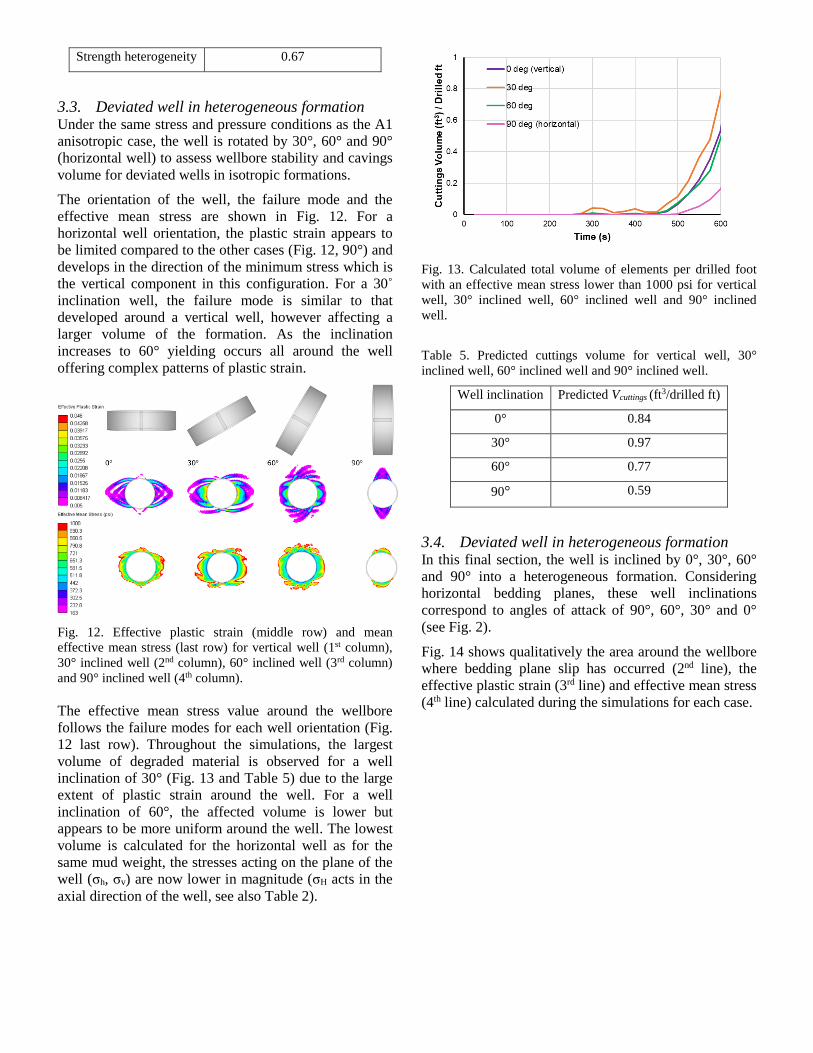
Fig. 6. Effective plastic for A1 anisotropic stress field: (a)
horizontal view at 255 s, (b) horizontal view at 580 s, (c)
vertical view at 580 s, (d) wellbore surface at 580 s; B1
anisotropic stress field: (e) horizontal view at 255 s, (f)
horizontal view at 580 s, (g) vertical view at 580 s, (h)
wellbore surface at 580 s; C1 anisotropic stress field: (i)
horizontal view at 255 s, (j) horizontal view at 580 s, (k)
vertical view at 580 s, (l) wellbore surface at 580 s.
In the cases A1, B1, C1 described here, the state of the
drilling stresses is similar to the corresponding cases of
the previous section. The only difference being the
stresses varying as a function of angle around the
wellbore due to the difference in the magnitude of the
horizontal stresses. This difference results in a rather
localised rupture mode along a favourable direction
around the wellbore. Depending on the stress conditions,
and mud pressure, the maximum stress can be either
compressive or tensile. For a breakout type of failure
(A1, B1), the cavings will appear on the wellbore sides

parallel to the maximum in-situ stress (E-W) where the
tangential stress is expected to be a maximum. For the
rupture mode observed in C1, the fractures will develop
on the wellbore sides parallel to the minimum in-situ
stress (N-S) where the tangential stress is expected to be
a minimum.
Indeed, for A1 configuration (Fig. 6a, b, c, d), the
breakouts are located in the E-W direction as shown in
Fig. 6d, similarly for B1 (Fig. 6e, f, g, h). To reproduce
the rupture mode observed in C1, the mud weight was
increased by ~3,000 psi compared to the previous cases.
For a high mud pressure, the wellbore is expected to fail
in tension at the location of the maximum tensile stress
(direction N-S). It can be seen in Fig. 6i, j, k that small
fractures are developing as a result of the increased mud
weight applied. However, because of the large difference
between the vertical (σ1) and minimum horizontal stress
(σ3), these fractures initiate as shear fractures on the
surface of the well as shown in Fig. 5l.
During the simulation for the cases presented above, it
was possible to calculate the continuously changing
stresses around the wellbore and capture the post-yield
behaviour of the material. It was therefore possible to
track and calculate the volume of the elements around
the wellbore initially yielding and subsequently
experiencing strain softening. As the wellbore surface
becomes damaged a criterion is used to determine the
elements that no longer support high stresses and their
volumes are calculated. This corresponds to both the
deteriorated material around the wellbore and also
undamaged cavings that are ‘separated’ from the
wellbore surface; hence this calculation can provide an
estimation of the additional expected cavings volume
under specific conditions (in excess of the drilled
wellbore). The criterion used for the calculation of the
elements volume considers the elements characterised by
an effective mean stress < 1000 psi. The evolution of the
effective mean stress for the isotropic case A1 is shown
in Fig. 7. The first three snapshots correspond to the
different timings during the simulation: i) before drilling,
ii) right after excavation, ii) during overbalance. The last
snapshot of Fig. 7 shows the area around the wellbore
with an effective stress < 1000 psi corresponding to the
deteriorated and detached material volume.
Fig. 7. Left: Evolution of the effective mean stress for the
isotropic case A1 (t = 0, 255, 580 s). Right: Area around the
wellbore characterised by an effective mean stress lower than
1000 psi.
Fig. 8 compares the effective mean stress at 580 s for all
the theoretical rupture modes described above and Fig. 8
shows the evolution of the calculated volumes during the
simulations.
Fig. 8. Area around the wellbore characterised by an effective
mean stress lower than 1000 psi for A1 isotropic, anisotropic
stress field, B1 isotropic, anisotropic stress field, C1 isotropic,
anisotropic stress field.
As expected, both Fig. 8 and Fig. 9 show that the largest
volume of deteriorated material is produced for case A1
under an isotropic horizontal stress field. Generally, the
development of cavings parallel to the well axis
(vertically) leads to larger volumes of deteriorated
material while the C1 rupture mode produces minimal
amount of deteriorated material with most of the
deformation taking place on the surface of the well.
Fig. 9. Calculated total volume of elements per drilled foot
with an effective mean stress < 1000 psi for A1, B1, C1 under
isotropic and anisotropic stress field.
Quantitatively, considering case A1 at t = 580 s and for
an isotropic horizontal stress field, it is possible to
calculate the following:
Vcuttings = Vwell + Vbreakout = 0.491 + 0.601 = 1.09 ft3/drilled
foot
where Vwell = π r2 h/l, is the wellbore volume per drilled
foot, with r, h and l being the radius, height and length

of the wellbore respectively. Vbreakout is the volume of
elements per drilled foot with an effective mean stress <
1000 psi
This estimation can be useful in providing information
regarding the extent of damage around the well and the
actual diameter of the well. Nevertheless, it should be
noted that the results concerning predicted cutting
volumes are presented to allow a direct comparison
between the configurations considered and are not
necessarily representative of in-situ conditions. In future
work and based on this study, it is important that these
values are validated and calibrated against real data
coming from calipers or wellbore image logs.
The volumes calculated for each case shown in Fig. 9
can give an estimation of the dominant rupture mode
depending on the in-situ conditions. The predicted
cuttings volumes are summarised in Table 3.
Table 3. Predicted cuttings volume for A1, B1, C1 under
isotropic and anisotropic stress field.
Predicted Vcuttings (ft3/drilled ft)
A1 isotropic 1.09
A1 anisotropic 0.84
B1 isotropic 0.54
B1 anisotropic 0.56
C1 isotropic 0.49
C1 anisotropic 0.49
3.2. Vertical well in heterogeneous formation Planes of weakness are introduced in the model to
account for strength anisotropy of the formation. The in-
situ conditions and mud pressure are the same as A1
anisotropic case (see Table 2). The least onerous case is
considered initially where the vertical well is drilled
perpendicularly to the planes of weakness (see Fig. 2a).
This means that the angle of attack is 90°. Rotation of
the well in a heterogeneous formation is described in
Section 3.4.
The calculated effective plastic strain and effective mean
stress for a vertical well drilled in a homogeneous and
heterogeneous formation (PoW) are illustrated in Fig.
10.
Fig. 10. Effective plastic strain and mean effective mean stress
for well in homogeneous formation (left column) and well in
heterogeneous formation (right column).
Compared to the homogeneous host rock case, when
PoW are introduced in the model yielding occurs both in
the minimum and maximum stress directions with higher
but more localised deformation in the direction of the
maximum stress. The observed plastic strain in this
direction is associated with localised slip along the
bedding planes. Keeping in mind, that the specific
bedding orientation is not expected to cause serious
problems during drilling as no significant amount of slip
occurs, the volume of the cavings is lower than the
homogeneous formation case (Fig. 11 and Table 4). This
is the result of the difference in the elastic behaviour
between the two cases. Deformation is accommodated
by the “softer” planes of weakness in the normal and
tangential direction, resulting in local stress reduction
which does not significantly contribute to the volume
calculation.
Fig. 11. Calculated total volume of elements per drilled foot
with an effective mean stress < 1000 psi for well in
homogeneous formation and well in heterogeneous formation.
Table 4. Predicted cuttings volume for well in homogeneous
formation and well in heterogeneous formation.
Predicted Vcuttings (ft3/drilled ft)
Strength homogeneity 0.84
Strength heterogeneity 0.67
3.3. Deviated well in heterogeneous formation Under the same stress and pressure conditions as the A1
anisotropic case, the well is rotated by 30°, 60° and 90°
(horizontal well) to assess wellbore stability and cavings
volume for deviated wells in isotropic formations.
The orientation of the well, the failure mode and the
effective mean stress are shown in Fig. 12. For a
horizontal well orientation, the plastic strain appears to
be limited compared to the other cases (Fig. 12, 90°) and
develops in the direction of the minimum stress which is
the vertical component in this configuration. For a 30˚
inclination well, the failure mode is similar to that
developed around a vertical well, however affecting a
larger volume of the formation. As the inclination
increases to 60° yielding occurs all around the well
offering complex patterns of plastic strain.
Fig. 12. Effective plastic strain (middle row) and mean
effective mean stress (last row) for vertical well (1st column),
30° inclined well (2nd column), 60° inclined well (3rd column)
and 90° inclined well (4th column).
The effective mean stress value around the wellbore
follows the failure modes for each well orientation (Fig.
12 last row). Throughout the simulations, the largest
volume of degraded material is observed for a well
inclination of 30° (Fig. 13 and Table 5) due to the large
extent of plastic strain around the well. For a well
inclination of 60°, the affected volume is lower but
appears to be more uniform around the well. The lowest
volume is calculated for the horizontal well as for the
same mud weight, the stresses acting on the plane of the
well (σh, σv) are now lower in magnitude (σH acts in the
axial direction of the well, see also Table 2).
Fig. 13. Calculated total volume of elements per drilled foot
with an effective mean stress lower than 1000 psi for vertical
well, 30° inclined well, 60° inclined well and 90° inclined
well.
Table 5. Predicted cuttings volume for vertical well, 30°
inclined well, 60° inclined well and 90° inclined well.
Well inclination Predicted Vcuttings (ft3/drilled ft)
0° 0.84
30° 0.97
60° 0.77
90° 0.59
3.4. Deviated well in heterogeneous formation In this final section, the well is inclined by 0°, 30°, 60°
and 90° into a heterogeneous formation. Considering
horizontal bedding planes, these well inclinations
correspond to angles of attack of 90°, 60°, 30° and 0°
(see Fig. 2).
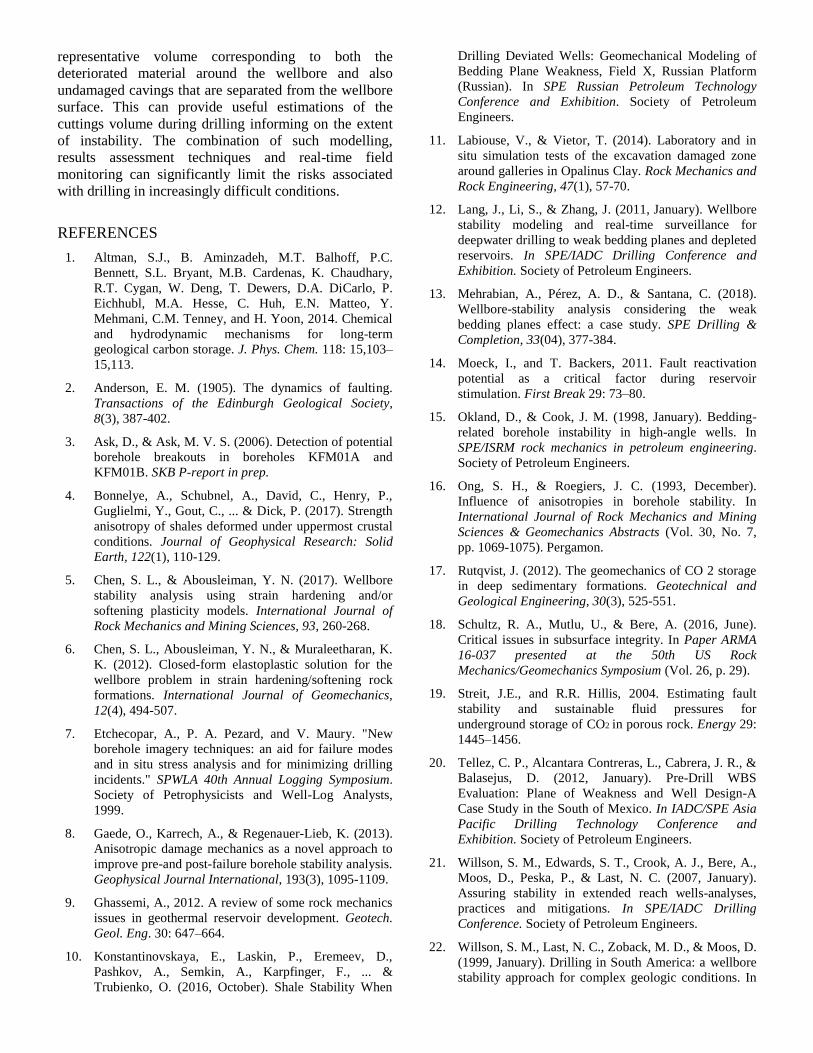
Fig. 14 shows qualitatively the area around the wellbore
where bedding plane slip has occurred (2nd line), the
effective plastic strain (3rd line) and effective mean stress
(4th line) calculated during the simulations for each case.
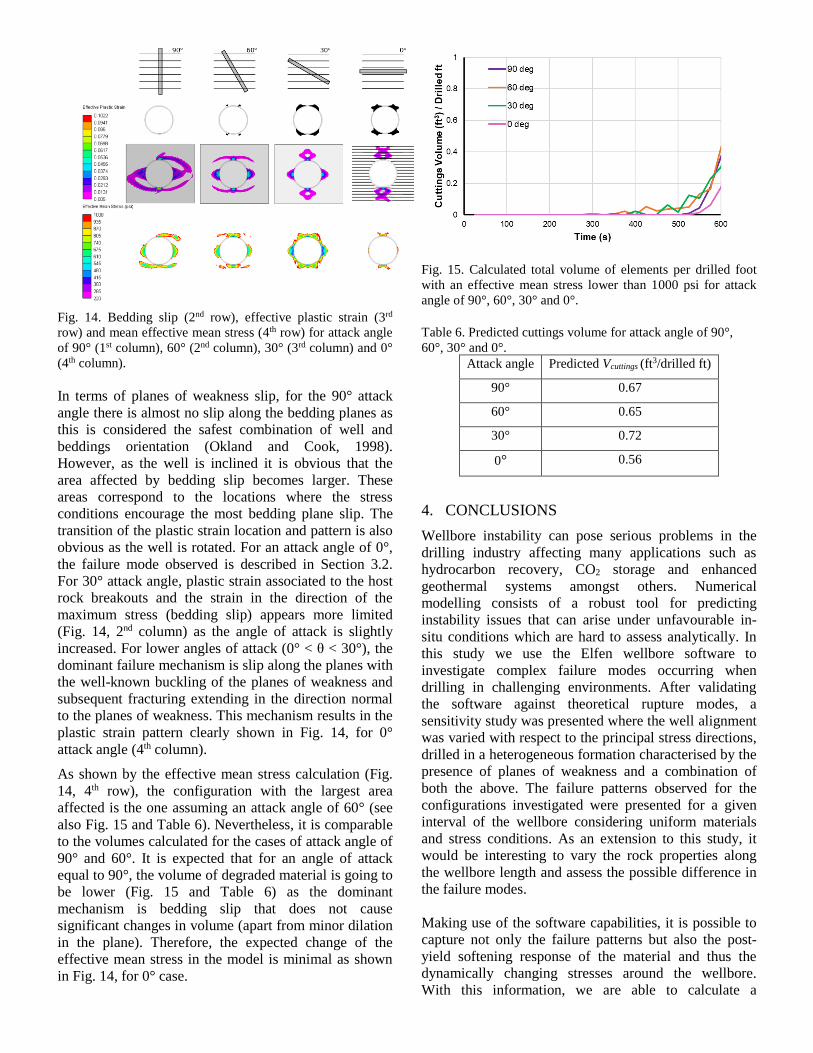
Fig. 14. Bedding slip (2nd row), effective plastic strain (3rd
row) and mean effective mean stress (4th row) for attack angle
of 90° (1st column), 60° (2nd column), 30° (3rd column) and 0°
(4th column).
In terms of planes of weakness slip, for the 90° attack
angle there is almost no slip along the bedding planes as
this is considered the safest combination of well and
beddings orientation (Okland and Cook, 1998).
However, as the well is inclined it is obvious that the
area affected by bedding slip becomes larger. These
areas correspond to the locations where the stress
conditions encourage the most bedding plane slip. The
transition of the plastic strain location and pattern is also
obvious as the well is rotated. For an attack angle of 0°,
the failure mode observed is described in Section 3.2.
For 30° attack angle, plastic strain associated to the host
rock breakouts and the strain in the direction of the
maximum stress (bedding slip) appears more limited
(Fig. 14, 2nd column) as the angle of attack is slightly
increased. For lower angles of attack (0° < θ < 30°), the
dominant failure mechanism is slip along the planes with
the well-known buckling of the planes of weakness and
subsequent fracturing extending in the direction normal
to the planes of weakness. This mechanism results in the
plastic strain pattern clearly shown in Fig. 14, for 0°
attack angle (4th column).
As shown by the effective mean stress calculation (Fig.
14, 4th row), the configuration with the largest area
affected is the one assuming an attack angle of 60° (see
also Fig. 15 and Table 6). Nevertheless, it is comparable
to the volumes calculated for the cases of attack angle of
90° and 60°. It is expected that for an angle of attack
equal to 90°, the volume of degraded material is going to
be lower (Fig. 15 and Table 6) as the dominant
mechanism is bedding slip that does not cause
significant changes in volume (apart from minor dilation
in the plane). Therefore, the expected change of the
effective mean stress in the model is minimal as shown
in Fig. 14, for 0° case.
Fig. 15. Calculated total volume of elements per drilled foot
with an effective mean stress lower than 1000 psi for attack
angle of 90°, 60°, 30° and 0°.
Table 6. Predicted cuttings volume for attack angle of 90°,
60°, 30° and 0°.
Attack angle Predicted Vcuttings (ft3/drilled ft)
90° 0.67
60° 0.65
30° 0.72
0° 0.56
4. CONCLUSIONS
Wellbore instability can pose serious problems in the
drilling industry affecting many applications such as
hydrocarbon recovery, CO2 storage and enhanced
geothermal systems amongst others. Numerical
modelling consists of a robust tool for predicting
instability issues that can arise under unfavourable in-
situ conditions which are hard to assess analytically. In
this study we use the Elfen wellbore software to
investigate complex failure modes occurring when
drilling in challenging environments. After validating
the software against theoretical rupture modes, a
sensitivity study was presented where the well alignment
was varied with respect to the principal stress directions,
drilled in a heterogeneous formation characterised by the
presence of planes of weakness and a combination of
both the above. The failure patterns observed for the
configurations investigated were presented for a given
interval of the wellbore considering uniform materials
and stress conditions. As an extension to this study, it
would be interesting to vary the rock properties along
the wellbore length and assess the possible difference in
the failure modes.
Making use of the software capabilities, it is possible to
capture not only the failure patterns but also the post-
yield softening response of the material and thus the
dynamically changing stresses around the wellbore.
With this information, we are able to calculate a
representative volume corresponding to both the
deteriorated material around the wellbore and also
undamaged cavings that are separated from the wellbore
surface. This can provide useful estimations of the
cuttings volume during drilling informing on the extent
of instability. The combination of such modelling,
results assessment techniques and real-time field
monitoring can significantly limit the risks associated
with drilling in increasingly difficult conditions.
REFERENCES
1. Altman, S.J., B. Aminzadeh, M.T. Balhoff, P.C.
Bennett, S.L. Bryant, M.B. Cardenas, K. Chaudhary,
R.T. Cygan, W. Deng, T. Dewers, D.A. DiCarlo, P.
Eichhubl, M.A. Hesse, C. Huh, E.N. Matteo, Y.
Mehmani, C.M. Tenney, and H. Yoon, 2014. Chemical
and hydrodynamic mechanisms for long-term
geological carbon storage. J. Phys. Chem. 118: 15,103–
15,113.
2. Anderson, E. M. (1905). The dynamics of faulting.
Transactions of the Edinburgh Geological Society,
8(3), 387-402.
3. Ask, D., & Ask, M. V. S. (2006). Detection of potential
borehole breakouts in boreholes KFM01A and
KFM01B. SKB P-report in prep.
4. Bonnelye, A., Schubnel, A., David, C., Henry, P.,
Guglielmi, Y., Gout, C., ... & Dick, P. (2017). Strength
anisotropy of shales deformed under uppermost crustal
conditions. Journal of Geophysical Research: Solid
Earth, 122(1), 110-129.
5. Chen, S. L., & Abousleiman, Y. N. (2017). Wellbore
stability analysis using strain hardening and/or
softening plasticity models. International Journal of
Rock Mechanics and Mining Sciences, 93, 260-268.
6. Chen, S. L., Abousleiman, Y. N., & Muraleetharan, K.
K. (2012). Closed-form elastoplastic solution for the
wellbore problem in strain hardening/softening rock
formations. International Journal of Geomechanics,
12(4), 494-507.
7. Etchecopar, A., P. A. Pezard, and V. Maury. "New
borehole imagery techniques: an aid for failure modes
and in situ stress analysis and for minimizing drilling
incidents." SPWLA 40th Annual Logging Symposium.
Society of Petrophysicists and Well-Log Analysts,
1999.
8. Gaede, O., Karrech, A., & Regenauer-Lieb, K. (2013).
Anisotropic damage mechanics as a novel approach to
improve pre-and post-failure borehole stability analysis.
Geophysical Journal International, 193(3), 1095-1109.
9. Ghassemi, A., 2012. A review of some rock mechanics
issues in geothermal reservoir development. Geotech.
Geol. Eng. 30: 647–664.
10. Konstantinovskaya, E., Laskin, P., Eremeev, D.,
Pashkov, A., Semkin, A., Karpfinger, F., ... &
Trubienko, O. (2016, October). Shale Stability When
Drilling Deviated Wells: Geomechanical Modeling of
Bedding Plane Weakness, Field X, Russian Platform
(Russian). In SPE Russian Petroleum Technology
Conference and Exhibition. Society of Petroleum
Engineers.
11. Labiouse, V., & Vietor, T. (2014). Laboratory and in
situ simulation tests of the excavation damaged zone
around galleries in Opalinus Clay. Rock Mechanics and
Rock Engineering, 47(1), 57-70.
12. Lang, J., Li, S., & Zhang, J. (2011, January). Wellbore
stability modeling and real-time surveillance for
deepwater drilling to weak bedding planes and depleted
reservoirs. In SPE/IADC Drilling Conference and
Exhibition. Society of Petroleum Engineers.
13. Mehrabian, A., Pérez, A. D., & Santana, C. (2018).
Wellbore-stability analysis considering the weak
bedding planes effect: a case study. SPE Drilling &
Completion, 33(04), 377-384.
14. Moeck, I., and T. Backers, 2011. Fault reactivation
potential as a critical factor during reservoir
stimulation. First Break 29: 73–80.
15. Okland, D., & Cook, J. M. (1998, January). Bedding-
related borehole instability in high-angle wells. In
SPE/ISRM rock mechanics in petroleum engineering.
Society of Petroleum Engineers.
16. Ong, S. H., & Roegiers, J. C. (1993, December).
Influence of anisotropies in borehole stability. In
International Journal of Rock Mechanics and Mining
Sciences & Geomechanics Abstracts (Vol. 30, No. 7,
pp. 1069-1075). Pergamon.
17. Rutqvist, J. (2012). The geomechanics of CO 2 storage
in deep sedimentary formations. Geotechnical and
Geological Engineering, 30(3), 525-551.
18. Schultz, R. A., Mutlu, U., & Bere, A. (2016, June).
Critical issues in subsurface integrity. In Paper ARMA
16-037 presented at the 50th US Rock
Mechanics/Geomechanics Symposium (Vol. 26, p. 29).
19. Streit, J.E., and R.R. Hillis, 2004. Estimating fault
stability and sustainable fluid pressures for
underground storage of CO2 in porous rock. Energy 29:
1445–1456.
20. Tellez, C. P., Alcantara Contreras, L., Cabrera, J. R., &
Balasejus, D. (2012, January). Pre-Drill WBS
Evaluation: Plane of Weakness and Well Design-A
Case Study in the South of Mexico. In IADC/SPE Asia
Pacific Drilling Technology Conference and
Exhibition. Society of Petroleum Engineers.
21. Willson, S. M., Edwards, S. T., Crook, A. J., Bere, A.,
Moos, D., Peska, P., & Last, N. C. (2007, January).
Assuring stability in extended reach wells-analyses,
practices and mitigations. In SPE/IADC Drilling
Conference. Society of Petroleum Engineers.
22. Willson, S. M., Last, N. C., Zoback, M. D., & Moos, D.
(1999, January). Drilling in South America: a wellbore
stability approach for complex geologic conditions. In
Latin American and Caribbean petroleum engineering
conference. Society of Petroleum Engineers.
23. Zhang, J. (2013). Borehole stability analysis accounting
for anisotropies in drilling to weak bedding planes.
International journal of rock mechanics and mining
sciences, 60, 160-170.
24. Zhou, J., He, S., Tang, M., Huang, Z., Chen, Y., Chi, J.,
... & Yuan, P. (2018). Analysis of wellbore stability
considering the effects of bedding planes and
anisotropic seepage during drilling horizontal wells in
the laminated formation. Journal of Petroleum Science
and Engineering, 170, 507-524.
25. Zoback, M. D. (2010). Reservoir geomechanics.
Cambridge University Press.
26. Zoback, M.D., and S.M. Gorelick, 2012. Earthquake
triggering and large-scale geologic storage of carbon
dioxide. Proc. US Nat. Acad. Sci. 109: 10,164–10,168.