Well Testing Program to Determine Well and Reservoir...
90
Well Testing Program to Determine Well and Reservoir Characteristics Tony Menzies Senior Advisor, Reservoir Engineering Chevron Geothermal Services Company, Philippines Exploration Drilling and Early Stage Geothermal Reservoir Characterization ITB Geothermal Workshop Bandung, Indonesia 4-5 March, 2013
Transcript of Well Testing Program to Determine Well and Reservoir...

Well Testing Program to Determine
Well and Reservoir Characteristics
Tony Menzies Senior Advisor, Reservoir Engineering
Chevron Geothermal Services Company, Philippines
Exploration Drilling and Early Stage Geothermal Reservoir Characterization ITB Geothermal Workshop
Bandung, Indonesia
4-5 March, 2013

Objective
Present and discuss the tests/surveys that are normally included in a well testing program during exploration/early stage geothermal development to characterize the well and reservoir conditions – Actual program will be project specific and based
on local conditions and constraints
– The tests and surveys that will be discussed are not “new”; they have been used and refined by reservoir engineers in the geothermal industry over many years
– References are provided that contain additional background information and further details on some of the examples shown

Outline
Basic Principles
Potential Challenges
Tests / Surveys and Timing
– Wireline Survey Equipment
Testing During Drilling
Completion Injection Tests
Shut-in Surveys During Well Heat-Up
Well Flow Testing
Multiple Well Flow Test

Basic Principles
To well test or
production system
Pressure Distribution
Testing program required to:
Define individual well
characteristics
Provide information on the reservoir
for development of conceptual and
numerical models

Basic Principles
Cannot “see” the geothermal reservoir to directly
measure reservoir parameters
– Pipeline on open ground – we can measure diameter,
length, pressure drop and flow
– Pipeline through a hill – we can measure flow and pressure
drop but need to assume diameter and/or length or develop
a testing procedure to determine the unknown parameters
Basic Principles
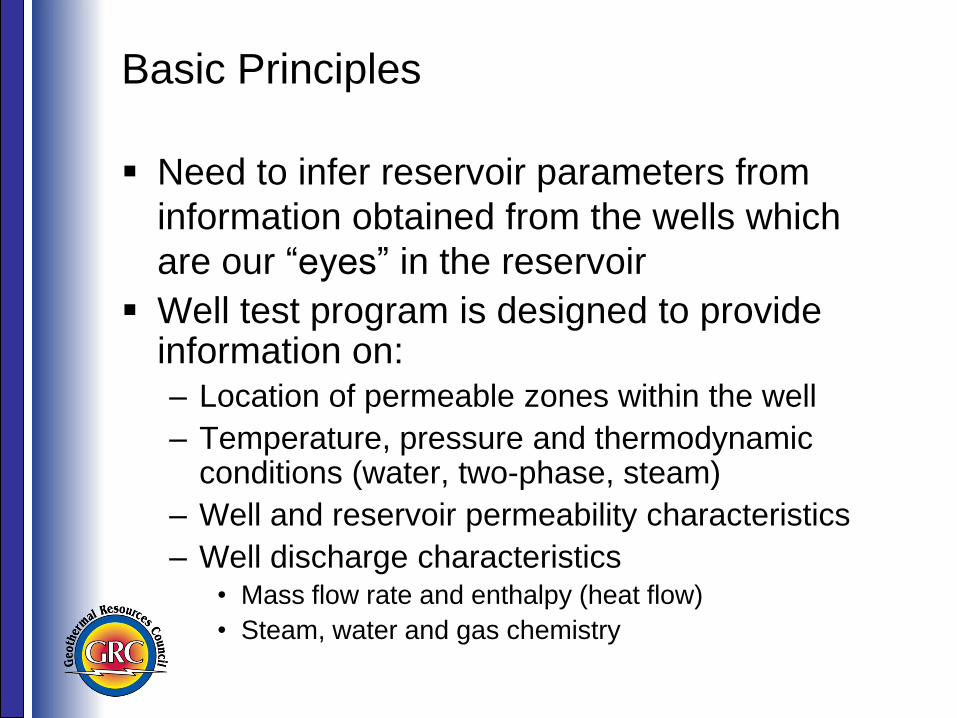
Need to infer reservoir parameters from
information obtained from the wells which
are our “eyes” in the reservoir
Well test program is designed to provide information on: – Location of permeable zones within the well
– Temperature, pressure and thermodynamic conditions (water, two-phase, steam)
– Well and reservoir permeability characteristics
– Well discharge characteristics • Mass flow rate and enthalpy (heat flow)
• Steam, water and gas chemistry

Basic Principles
Well test program generally consists of a
combination of surface and sub-surface tests
and surveys
Aim is to develop models of the wells that can
then be used to construct conceptual and
numerical models of the reservoir
– Requires integration of the well test data with all
other available data (geology, geophysics,
geochemistry, drilling data, etc)
Potential Challenges
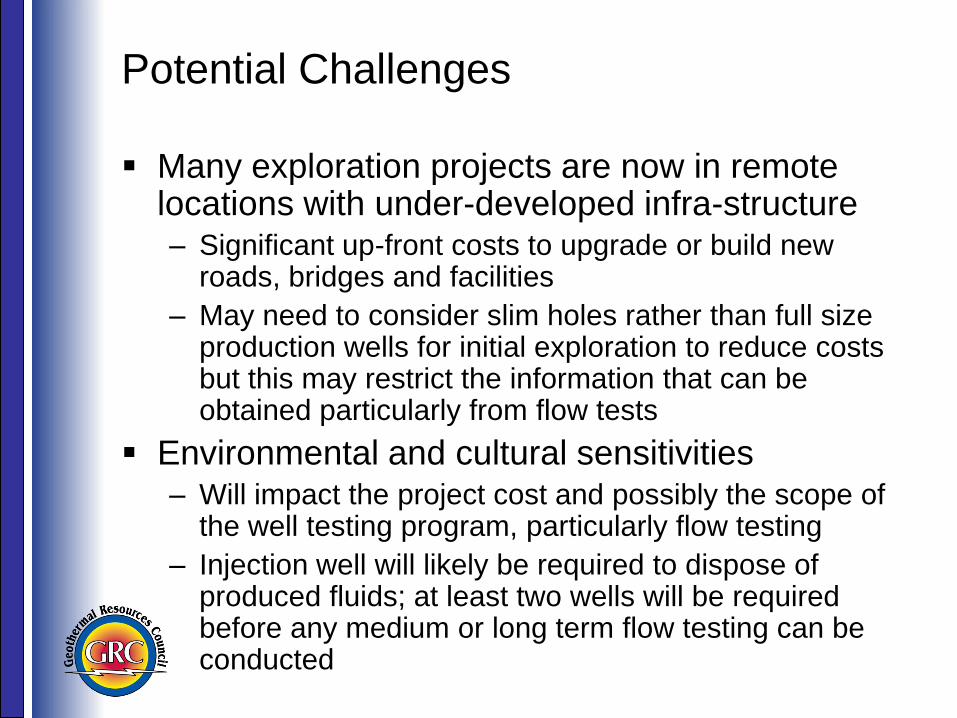
Many exploration projects are now in remote locations with under-developed infra-structure – Significant up-front costs to upgrade or build new
roads, bridges and facilities
– May need to consider slim holes rather than full size production wells for initial exploration to reduce costs but this may restrict the information that can be obtained particularly from flow tests
Environmental and cultural sensitivities – Will impact the project cost and possibly the scope of
the well testing program, particularly flow testing
– Injection well will likely be required to dispose of produced fluids; at least two wells will be required before any medium or long term flow testing can be conducted

Tests/Surveys and Timing
During Drilling (in addition to MWD Data)
– Static Formation Temperature Tests (SFTT)
– Pressure and temperature surveys
– Pressure while Drilling (PWD)
– Flow testing and/or injection testing
– Geophysical logs (Fracture identification, Natural
Gamma, etc)
– Coring (continuous, short or sidewall)
Cost and risk to the well need to be carefully
considered but may be justified for exploration

Tests/Surveys and Timing
Injection Tests at Well Completion
– Multi-rate injection tests
– Pressure/Temperature/Spinner (PTS) surveys
– Pressure transient tests (pressure falloff, multi-
rate)
Shut-in Pressure/Temperature (PT) Surveys
– Conducted at regular intervals to monitor well
heat-up (eg. 1, 3, 6, 12, 24 day shut)

Tests/Surveys and Timing
Individual Well Flow Testing
– Techniques to initiate flow
– Flow, enthalpy and chemistry measurements vs
wellhead pressure and time
– Flowing PTS surveys
– Pressure buildup test
Multiple Well Flow Test
– Flow at higher production levels than single well
test and measure the effect on the reservoir
• Requires production, injection and observation wells
– Tracer tests to determine the interconnection
between injection and production wells
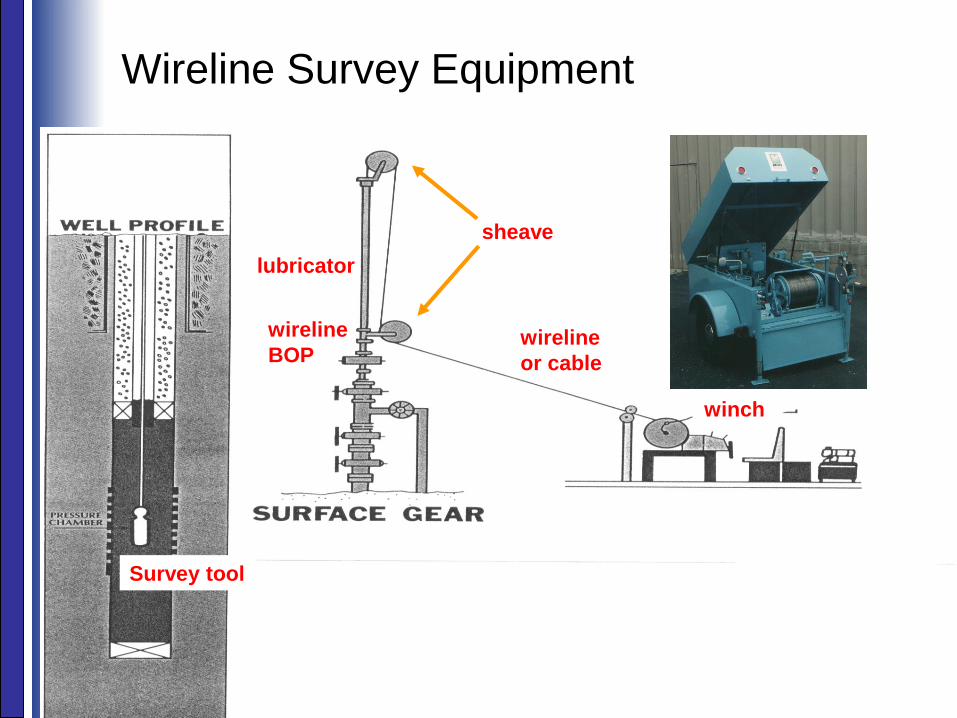
Wireline Survey Equipment
12
winch
wireline
or cable
sheave
lubricator
wireline
BOP
Survey tool

Wireline Survey Equipment
Lihir Island
Papua New Guinea (1986)

Wireline Survey Equipment
Pressure/Temperature/Spinner (PTS) Tool Dieng, Indonesia (1987)
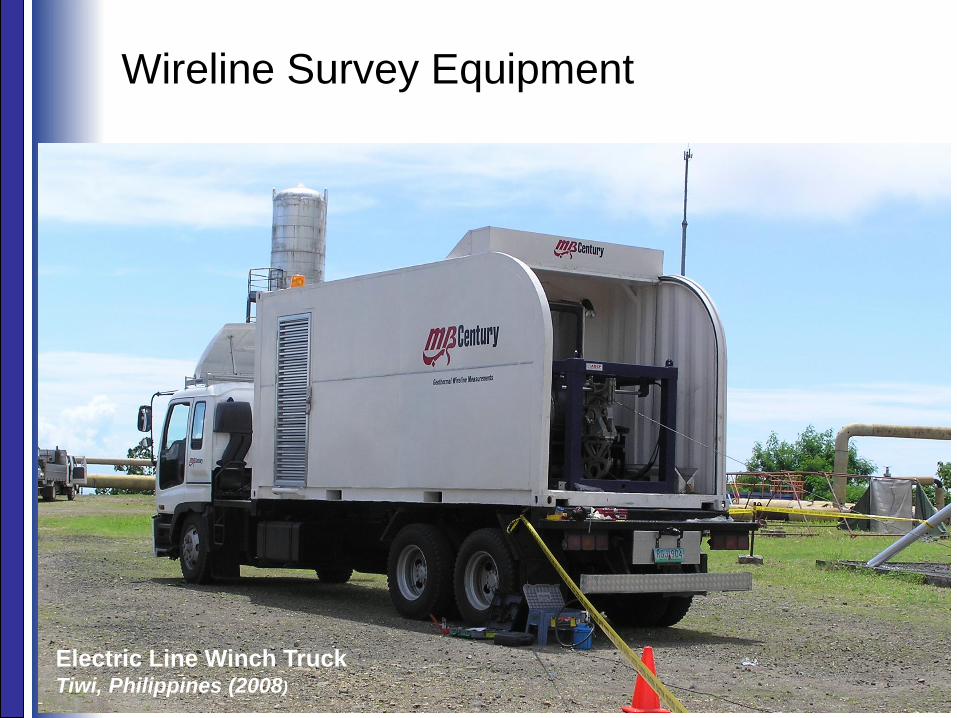
Wireline Survey Equipment
Electric Line Winch Truck Tiwi, Philippines (2008)

Testing During Drilling
Static Formation Temperature Tests
Downhole Pressure Surveys
Pressure while Drilling

Static Formation Temperature Test (SFTT)
Can provide information on static reservoir
temperatures
Analysis assumes formation is cooled
conductively by circulation of drilling fluids
– Best results obtained with full circulation
Heat-up is monitored after some period of
circulation and analyzed to provide estimate of
static reservoir temperature
Requires 12 to 24 hours of rig time and is run
in open hole; need to consider cost and risk

SFTT Example (use of “Horner” Method)
Number of analysis techniques in literature that provide corrections to the basic “Horner” method and the method developed by Brennand (1984) has proven to be reliable and easy to use
tp = circulation time
Δt = time since circulation stopped

Downhole Pressure/Temperature Surveys
Conducting repeat downhole pressure and
temperature surveys may provide information
on how conditions are changing as the well is
being drilled
This may be useful if there are zones in the
reservoir that are not well connected and are
therefore not in equilibrium
Once well is completed, “cross flow” (upflow or
downflow) may occur and it may no longer be
possible to measure the true in-situ conditions

Pressure Changes with Depth Dench (1982)
“Perched”
Aquifer
Geothermal
Reservoir
Transition Zone If well is open to both
the “perched” aquifer
and the geothermal
reservoir, downflow
will occur due to the
difference in pressure
Pressure while Drilling (PWD) Data
2400
2600
2800
3000
3200
3400
3600
3800
4000
4200
4400
4600
0 200 400 600 800 1000 1200 1400 1600 1800 2000
Pressure (psi)
Ve
rti
ca
l D
ep
th (
ft)
Reservoir Pressure Profile
Full Hydrostatic Wellbore
Modeled Bottomhole Pressure
Feed Zone Depths
Bulalo Well BHP
Prod Hole Pumps Off
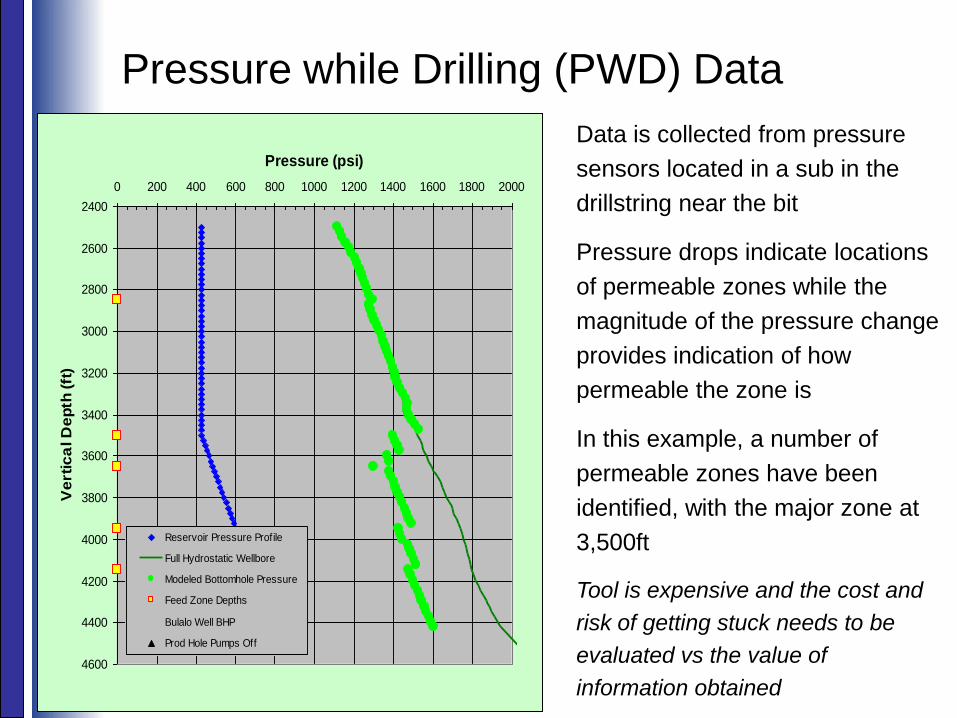
Data is collected from pressure
sensors located in a sub in the
drillstring near the bit
Pressure drops indicate locations
of permeable zones while the
magnitude of the pressure change
provides indication of how
permeable the zone is
In this example, a number of
permeable zones have been
identified, with the major zone at
3,500ft
Tool is expensive and the cost and
risk of getting stuck needs to be
evaluated vs the value of
information obtained

Completion Injection Tests
Pressure/Temperature/Spinner (PTS)
Multi-rate Injection Tests
Pressure Transient Tests

Injection Tests at Well Completion
A series of tests are conducted to determine
the location of permeable zones and to
provide an estimate of the well’s permeability
Tests include:
– Temperature or PTS surveys while injecting
– Multi-rate injectivity test
• Obtain “Injectivity Index“
– Pressure transient data analysis
• Estimate “transmissivity” and “skin” factor from analysis of
pressure falloff (PFO) and multi-rate data

Typical Completion Test Program

PTS/Temperature Surveys While Injecting
Surveys are run while injecting water at two different rates, if possible – max (≈30bpm) and 10-15bpm
Purpose is to locate the permeable zones from the temperature and spinner responses – May see different responses at the two rates
Where injected water is flowing, temperature is low
Where there is no flow, water is heated by rock and temperature increases
Can have many different situations if multiple permeable zones are present

Temperature Profiles While Injecting
Single zone
at TD Single zone
within well
Two zones
accepting
Two zones
one inflowing
increasing temperature

Injecting PTS Survey, Bul-104 (Mak-Ban)
Bul-104 PTS
-10
-9
-8
-7
-6
-5
-4
-3
-2
-1
0
0 500 1000 1500 2000 2500 3000 3500 4000 4500 5000 5500 6000 6500 7000 7500 8000 8500 9000 9500 10000 10500 11000
Depth (MD, ft)
Flu
id S
pe
ed
(ft
/s)
100
110
120
130
140
150
160
170
180
190
200
210
220
230
240
250
Te
mp
era
ture
(°F
)
10-3/4" TB 10-3/4" TOL 13-3/8" Shoe8-5/8" TOL 10-3/4" Shoe 7" TOL8-5/8" Shoe 7" Shoe Observed Fluid SpeedObserved Temperature
Sidetrack Point
Permeable Zones
Increasing
temperature as
fluid leaves the
well

Multi-Rate Injection Test
Inject water at a number of flow rates while
monitoring downhole pressures
Plot pressure at the end of each step vs flow
rate
Normally get straight line and slope provides
measure of overall well “Injectivity Index”
– May get changes in slope if fracture pressure is
exceeded or if shallow zones start accepting at high
flow rates

Multi-Rate Injection Test, Bar-08RD (Tiwi)

Multi-Rate Injection Test, Bar-08RD (Tiwi)

Thermal and Multiple Zone Effects on
Injectivity Test D
ep
th
Pressure
Reservoir
Pressure (Pres)
Pwb1 while
injecting at W1
Pwb2 while
injecting at W2
Zone 1
Zone 2
Under injection, pressure gradient initially changes due to lower temperatures
Injecting at W1;
– Zone 1, Pwb1 < Pres inflow
– Zone 2, Pwb1 > Pres outflow of all injected water + inflow from Zone 1
– Fluid flowing in at Zone 1 is likely to be hot, which will cause density changes and affect the pressure measurements
Injecting at W2;
– Zone 1, Pwb1 > Pres partial outflow of injected water
– Zone 2, Pwb1 > Pres partial outflow of injected water

Thermal and Multiple Zone Effects on
Injectivity Test
Acuña (1994) describes a technique for correcting the measured pressure data when two zones are present, with inflow and outflow occurring at the upper zone and the associated thermal effects
To use the method, both temperature and pressure data need to be measured during the injectivity and pressure falloff tests – Now commonly available due to use of PTS tool
Care still needs to be taken to check the quality of the data before applying these corrections
Pressure Transient Analysis
Pressure changes measured during the multi-
rate injection test and after injection stops can
be analyzed to provide additional information
on overall reservoir properties and well
conditions
– Permeability-thickness (kh) or transmissivity
– Presence of fractures
– Outer boundary conditions (???)
– Well “skin” factor
• Near wellbore damage (positive)
• Presence of fractures (negative)
– Wellbore storage effects

Pressure Falloff Test, Bul-104 (Mak-Ban)
Bul-104 Diagnostic Plot
1.E-01
1.E+00
1.E+01
1.E+02
1.E+03
1.E-03 1.E-02 1.E-01 1.E+00 1.E+01
dt (hours)
dP
(p
si)
Pressure Pressure Derivative Pressure (fit) Pressure derivative (fit)
Storage and skin model
Homogeneous
Infinite-acting
Storage, STB/psi 0.7165
Skin -3.604 +- 0.091
Permeability-thickness, md-ft 66170 +- 2.6%
Initial Pressure, psia 1895 +- 1.5

Multi-Rate Analysis, Bul-104 (Mak-Ban) Not always possible to get a good match to all the
steps in the multi-rate analysis
Generally see improvement during injection
35
P2 < P1 at the same injection rate
Indicates that well injectivity was
improving
measured
calculated

Shut-in Surveys During Well
Heat-Up

Shut-in Pressure / Temperature Surveys
After the well is completed, downhole surveys are run to monitor temperature and pressure changes while well is heating up
Data provide information on: – Permeable zone locations
– Thermodynamic conditions at the feedzones and in the wellbore (steam, gas, two-phase or water)
– Presence of flow in the wellbore (up or down)
And on reservoir conditions: – Temperature inversion, indicating outflow
– Conductive gradient, indicating low permeability
– Convective gradient, indicating reservoir conditions

Island Arc Type Geothermal System
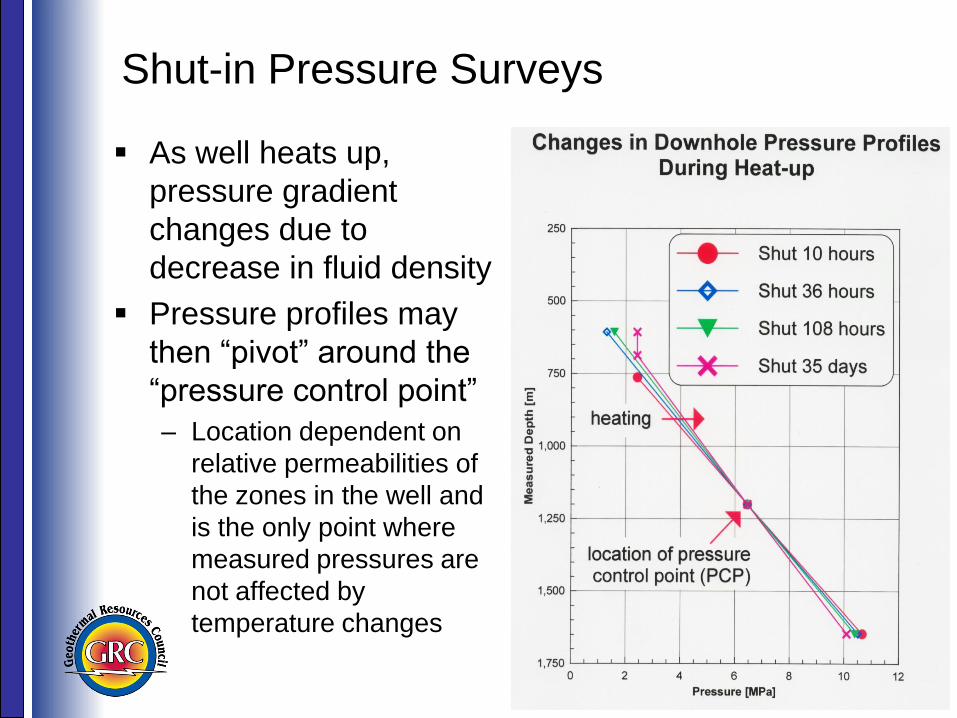
Shut-in Pressure Surveys
As well heats up,
pressure gradient
changes due to
decrease in fluid density
Pressure profiles may
then “pivot” around the
“pressure control point”
– Location dependent on
relative permeabilities of
the zones in the well and
is the only point where
measured pressures are
not affected by
temperature changes
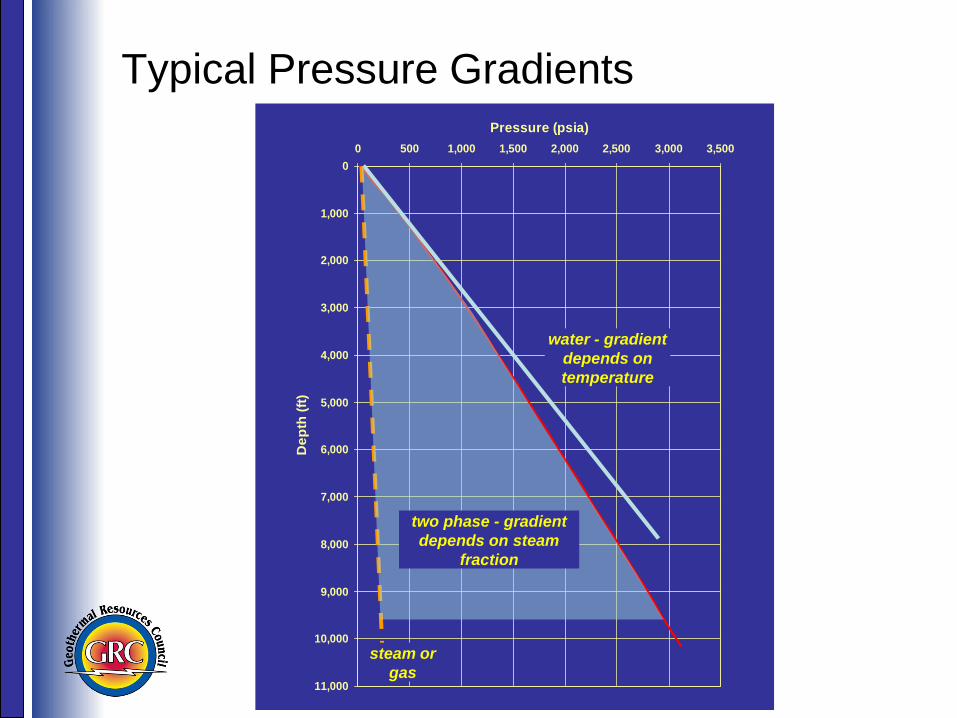
Typical Pressure Gradients
0
1,000
2,000
3,000
4,000
5,000
6,000
7,000
8,000
9,000
10,000
11,000
0 500 1,000 1,500 2,000 2,500 3,000 3,500
Pressure (psia)
De
pth
(ft
)
steam or
gas
water - gradient
depends on
temperature
two phase - gradient
depends on steam
fraction
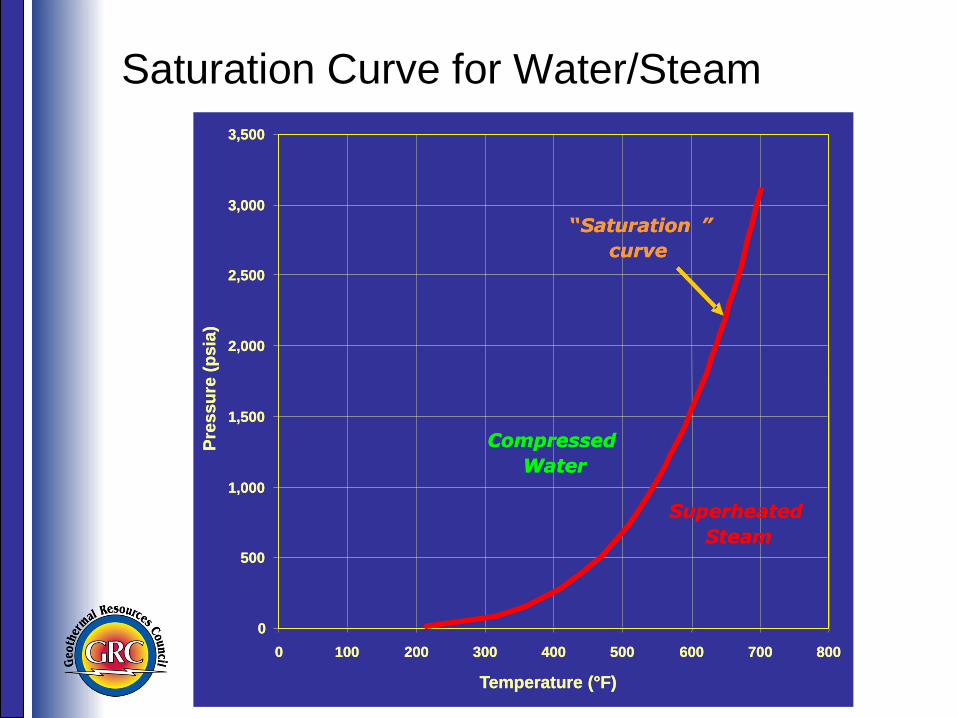
Saturation Curve for Water/Steam
0
500
1,000
1,500
2,000
2,500
3,000
3,500
0 100 200 300 400 500 600 700 800
Temperature (°F)
Pre
ssu
re (
psia
)
Compressed
Water
Superheated
Steam
“ Saturation ”
curve
0
500
1,000
1,500
2,000
2,500
3,000
3,500
0 100 200 300 400 500 600 700 800
Temperature (°F)
Pre
ssu
re (
psia
)
Compressed
Water
Superheated
Steam
“ Saturation ”
curve

42
Boiling-Point-Depth Curves
0
1,000
2,000
3,000
4,000
5,000
6,000
7,000
8,000
9,000
10,000
11,000
0 100 200 300 400 500 600 700 800
Temperature (°F)
De
pth
fro
m w
ate
r le
ve
l (f
t)
0
1,000
2,000
3,000
4,000
5,000
6,000
7,000
8,000
9,000
10,000
11,000
0 500 1,000 1,500 2,000 2,500 3,000 3,500
Pressure (psia)
De
pth
fro
m w
ate
r le
ve
l (f
t)
Compressed
Water
“Saturation”
two-phase
curve

Heat-Up Surveys from OW-911A and OW-912 (Olkaria,
Kenya), Axelsson and Steingrímsson (2012)
On saturation
steam or two-
phase zone

44
Downhole Surveys, Nag-01 (Tiwi)
-6000
-5500
-5000
-4500
-4000
-3500
-3000
-2500
-2000
-1500
-1000
-500
0
500
0 100 200 300 400 500 600
Temperature (degF)
MD
/Ele
va
tio
n (
ft)
6-Jun-72
5-Oct-73
13-Mar-74
12-Nov-76
14-Apr-78
13-Jun-80
22-Mar-84
7-Mar-86
20-Sep-88
11-Oct-91
BPD
-6000
-5500
-5000
-4500
-4000
-3500
-3000
-2500
-2000
-1500
-1000
-500
0
500
0 500 1000 1500 2000 2500
Pressure (psig)
MD
/Ele
va
tio
n (
ft)
6-Jun-72
5-Oct-73
13-Mar-74
12-Nov-76
14-Apr-78
13-Jun-80
22-Mar-84
7-Mar-86
20-Sep-88
11-Oct-91
BPD
Tmeas < TBPD
= single phase water

45
Downhole Surveys, Nag-06 (Tiwi)
-6000
-5500
-5000
-4500
-4000
-3500
-3000
-2500
-2000
-1500
-1000
-500
0
500
0 100 200 300 400 500 600
Temperature (degF)
MD
/Ele
va
tio
n (
ft)
26-May-75
22-Apr-76
8-Nov-76
12-Jul-77
13-Jan-79
24-Jan-85
BPD
-6000
-5500
-5000
-4500
-4000
-3500
-3000
-2500
-2000
-1500
-1000
-500
0
500
0 500 1000 1500 2000 2500
Pressure (psig)
MD
/Ele
va
tio
n (
ft)
26-May-75
22-Apr-76
8-Nov-76
12-Jul-77
13-Jan-79
24-Jan-85
BPD
Tmeas = TBPD
= two-phase or steam
46
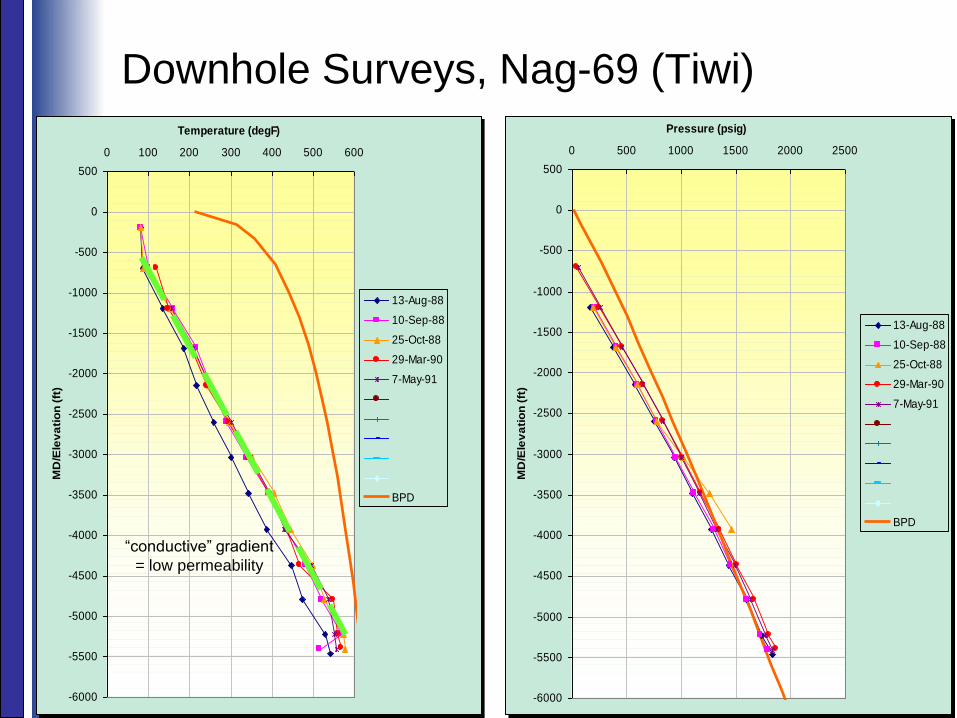
Downhole Surveys, Nag-69 (Tiwi)
-6000
-5500
-5000
-4500
-4000
-3500
-3000
-2500
-2000
-1500
-1000
-500
0
500
0 100 200 300 400 500 600
Temperature (degF)
MD
/Ele
va
tio
n (
ft)
13-Aug-88
10-Sep-88
25-Oct-88
29-Mar-90
7-May-91
BPD
-6000
-5500
-5000
-4500
-4000
-3500
-3000
-2500
-2000
-1500
-1000
-500
0
500
0 500 1000 1500 2000 2500
Pressure (psig)
MD
/Ele
va
tio
n (
ft)
13-Aug-88
10-Sep-88
25-Oct-88
29-Mar-90
7-May-91
BPD
“conductive” gradient
= low permeability

Typical Temperature Profile -1
0
1,000
2,000
3,000
4,000
5,000
6,000
7,000
8,000
9,000
10,000
11,000
0 100 200 300 400 500 600 700 800
Temperature (°F)
De
pth
fro
m w
ate
r le
ve
l (f
t)What is this part of the
reservoir like?
What are the fluid
conditions like here?
….. and here?

0
1,000
2,000
3,000
4,000
5,000
6,000
7,000
8,000
9,000
10,000
11,000
0 100 200 300 400 500 600 700 800
Temperature (°F)
De
pth
fro
m w
ate
r le
ve
l (f
t)
What is this part of the
reservoir like?
Why are these
temperatures declining?
Typical Temperature Profile -2

0
1,000
2,000
3,000
4,000
5,000
6,000
7,000
8,000
9,000
10,000
11,000
0 100 200 300 400 500 600 700 800
Temperature (°F)
De
pth
fro
m w
ate
r le
ve
l (f
t)
What is this part of the
reservoir like?
What are the fluid
conditions like here?
Typical Temperature Profile -3
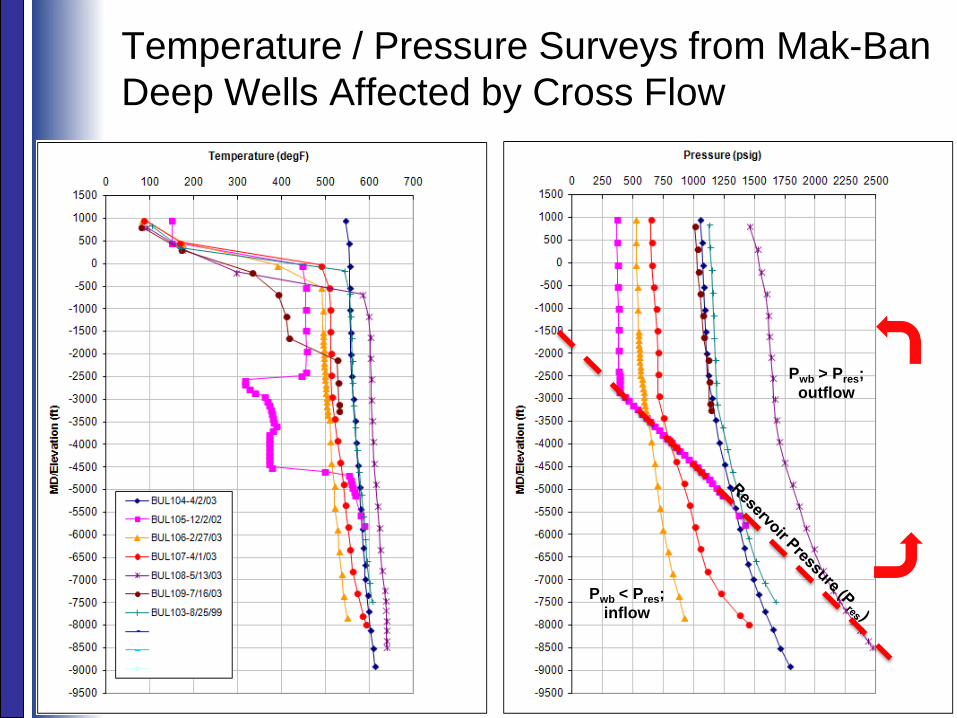
Temperature / Pressure Surveys from Mak-Ban
Deep Wells Affected by Cross Flow
Pwb > Pres;
outflow
Pwb < Pres;
inflow

Well Flow Testing
Well Flow Testing - Objectives
When the well has heated sufficiently, it will be flow tested to obtain information on well productivity and fluid chemistry
The flow test equipment required will depend on the well completion (slim or full size), environmental requirements, etc.
If the well cannot self flow, it may be necessary to use additional equipment to initiate flow
Initial flow test may be to a sump and may only last for a few hours / days if the discharge water cannot be disposed of – May need to inject back into the well from the sump
Longer term flow tests may require drilling of a second well so discharged water can be injected
Well Flow Testing - Objectives
Measure total mass flow and discharge enthalpy at various wellhead pressures and as function of time – Steam and brine flows at specified pressures
Gas (NCG) and fluid chemistry
Downhole thermodynamic conditions from flowing PT and/or PTS surveys – Are the feed zones single phase water, two phase
or single phase steam?
– Are there cool inflows?
– Where is flashing (boiling) occurring? in the well or reservoir?
– Is superheating occurring?

Well Flow Testing - Objectives
Measured data will help determine plant
design and operating parameters
– Pipeline sizing
– Optimum separation/inlet pressures
– Gas processing capacity
– Corrosion/scaling mitigation requirements
Determine production and injection well
requirements
Provide information on reservoir conditions to
incorporate in conceptual and numerical
modeling

Initiating Well Flow
This may be an issue in exploration,
particularly at higher elevations where liquid
levels can be expected to be deep in the well
Required when wells are unable to flow
spontaneously because:
– Downhole temperatures are well below boiling-
point-depth (BPD) curve - need to lift off significant
water before flashing will occur
– Low temperatures near surface which will cause
heat loss as fluid flows up the well
– No build-up in wellhead pressure even though well
is hot

Initiating Well Flow
Methods used are designed to remove or
lighten the water column to allow boiling to
occur and the well to flow or to heat up shallow
casing
Common methods include:
– Airlifting/Nitrogen injection using coiled tubing
– Compression using air compressor
– Steam or two-phase injection from package boiler
or nearby well
– Others (swabbing, etc)
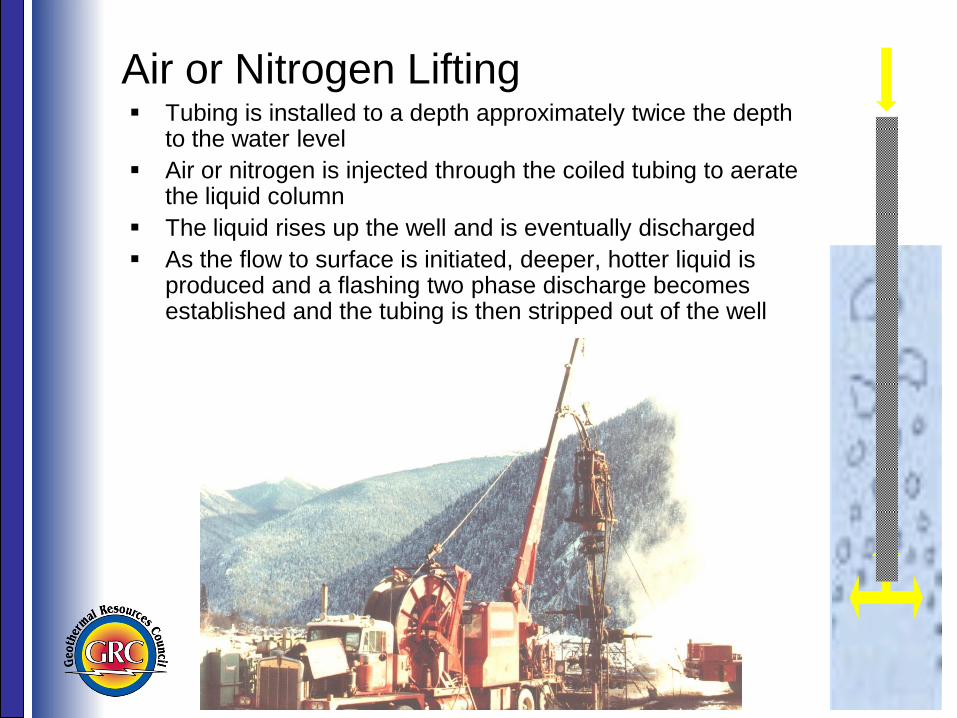
Air or Nitrogen Lifting Tubing is installed to a depth approximately twice the depth
to the water level
Air or nitrogen is injected through the coiled tubing to aerate the liquid column
The liquid rises up the well and is eventually discharged
As the flow to surface is initiated, deeper, hotter liquid is produced and a flashing two phase discharge becomes established and the tubing is then stripped out of the well

Well Flow Testing - Techniques
Measurement of flow is difficult due to the
nature of two phase steam/water flow
Number of techniques now considered
standard in the geothermal industry:
– James “lip pressure” method
– Separator
– Chemical tracer techniques
– “Other” techniques
• Variations on James Method – Japan, Russia
• Two phase orifice plates

James “Lip Pressure” Method
Based on experiments undertaken by Russell
James in Wairakei, New Zealand, involving critical
flow of steam water mixtures to the atmosphere
From the experimental data, an equation relating
“lip” pressure measured at the end of a discharge
pipe to enthalpy and massflow was developed
1.102t
0. 96
t ph
pACw

James “Lip Pressure” Method
To solve for both enthalpy and massflow, require
second relationship which is then solved
simultaneously with the James equation
Can use:
– Weirbox to measure separated water flow
• relationship to total flow and enthalpy based on mass and
energy balance at atmospheric pressure
– Orifice to measure total two-phase flow
• relationship between orifice ∆p, total flow and enthalpy based
on relationship developed by James from experimental data
Weirbox method considered to be more accurate
than orifice method
60

James “Lip Pressure” Method
Easy to construct and set up in remote locations
Provides total flow and enthalpy data with satisfactory accuracy
Can be instrumented to provide continuous data

James “Lip Pressure” Method
Tongonan
Philippines
Dixie Valley
USA
Las Tres Virgenes
Mexico
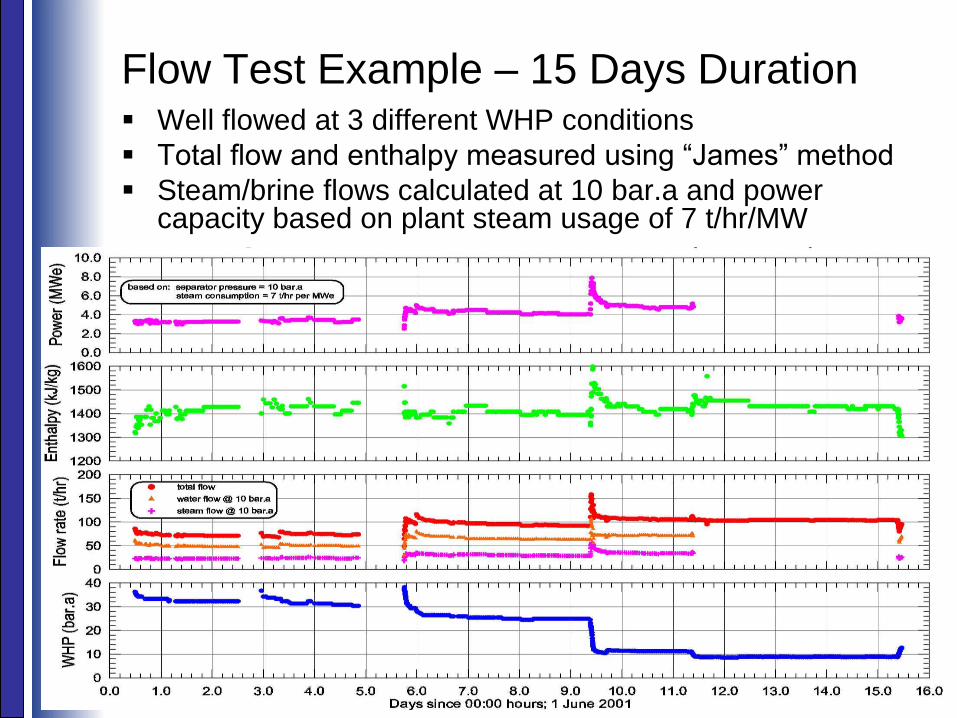
Flow Test Example – 15 Days Duration Well flowed at 3 different WHP conditions
Total flow and enthalpy measured using “James” method
Steam/brine flows calculated at 10 bar.a and power capacity based on plant steam usage of 7 t/hr/MW

Deliverability
Curve Example
Flow and enthalpy data plotted vs Wellhead Pressure to define the Deliverability Characteristics
Indicates that well can provide max initial steam flow of 33 t/hr; equivalent to a Power Capacity of 4.7MW
Flowing Surveys (PT or PTS)
Flowing surveys are run to provide
information on:
– Location of permeable zones
– Relative production from each zone (PTS survey)
– Thermodynamic conditions within the well
• Where is flashing occurring; in the formation or the
wellbore?
• What are the thermodynamic conditions of the inflow
fluids; two-phase, single phase water or steam?
– Level of pressure drawdown and estimate of
“Productivity Indexes” for the well and the
individual zones

Thermodynamic Changes During Flow
Compressed Water: Temperature remains
constant as pressure declines
Pressure gradient is liquid
Two-Phase: Temperature is a function
of pressure and declines as pressure declines
Pressure gradient less than liquid and is a function of steam fraction
Saturated or Superheated Steam: Temperature on or above
(if superheated) saturation
Pressure gradient for dry steam
Compressed
Water
Superheated
Steam Two-phase
Region
600°F
500°F
400°F

Typical Pressure Gradients
0
1,000
2,000
3,000
4,000
5,000
6,000
7,000
8,000
9,000
10,000
11,000
0 500 1,000 1,500 2,000 2,500 3,000 3,500
Pressure (psia)
De
pth
(ft
)
steam or
gas
water - gradient
depends on
temperature
two phase - gradient
depends on steam
fraction

Flowing P/T
Survey Example
Simple example showing flow from a 250°C single phase liquid source, with flashing at 1,200m (VD)
Pressure gradient changes from water to two phase and temperature starts to decline along with pressure above the flash point

Flowing PTS Analysis, Bul-112 (Mak-Ban) (Acuna and Arcedera, 2005; Regulacion, 2006)
Enthalpy (orange) profile is calculated from the pressure profile,
corrected for friction
Massflow (black)profile is calculated from the enthalpy and fluid
velocity profiles
Change inflow parameters (massflow and enthalpy) until the best
match is obtained to all the profiles
80 k
ph,
1200 B
TU
/lb
90 k
ph,
275 B
TU
/lb
125 k
ph,
275 B
TU
/lb
100 k
ph,
600 B
TU
/lb
50 k
ph,
600 B
TU
/lb
50 k
ph,
600 B
TU
/lb
50 k
ph,
550 B
TU
/lb
0
100
200
300
400
500
600
700
800
900
0
500
1000
1500
2000
2500
3000
3500
4000
4500
5000
5500
6000
6500
7000
7500
8000
8500
9000
9500
10000
10500
Depth (MD, ft)
Flu
id S
peed
(ft
/s)
Mass F
low
(kp
h)
0
100
200
300
400
500
600
700
800
900
Pre
ssu
re (
psia
)
En
thalp
y (
btu
/lb
)
Observed Vel Simulated Vel Observed Mass Simulated Mass Observed P Simulated P Observed H Simulated H
Cool inflows as
shown by change in
pressure gradient

Superheated Steam Well, Mat-23 (Tiwi)
Well encountered both deep liquid and shallow steam conditions
Flowing PTS indicates well only flows from steam zone and condition is superheated steam even though liquid level is only 300ft below production zone
Mat-23 has been a stable producer since mid 1990’s
Under shut-in conditions
• Tmeas = Tsatn
Under flowing conditions
• Tmeas > Tsatn
• TSH = Tmeas – Tsatn ≈ 55 degF
Menzies et al. (2010)
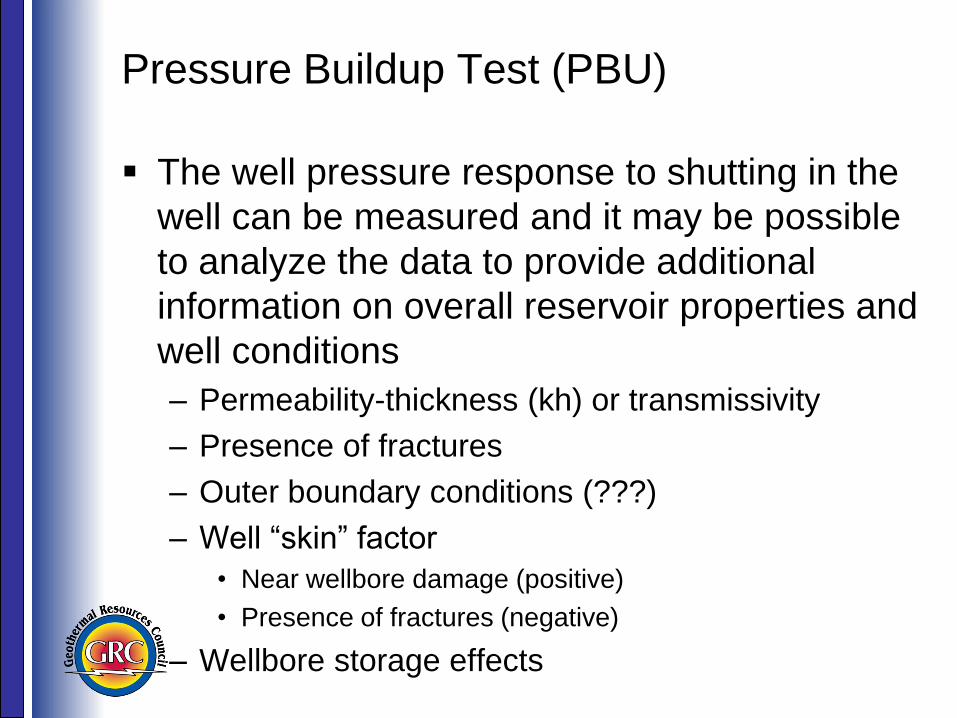
Pressure Buildup Test (PBU)
The well pressure response to shutting in the
well can be measured and it may be possible
to analyze the data to provide additional
information on overall reservoir properties and
well conditions
– Permeability-thickness (kh) or transmissivity
– Presence of fractures
– Outer boundary conditions (???)
– Well “skin” factor
• Near wellbore damage (positive)
• Presence of fractures (negative)
– Wellbore storage effects
Pressure Buildup Test (PBU)
A pressure tool is run downhole to the desired measuring depth prior to shutting in the well, if possible, or as quickly as possible after the well is shut-in – If well produced dry or superheated steam, the wellhead
pressure can be monitored instead
Best results are obtained if the well produced from single phase liquid or steam zones as the fluid properties are then known
If two-phase conditions are present, the fluid compressibility, viscosity, etc need to be corrected to in-situ conditions and this may not be well understood so results will be less definitive
If there are wellbore effects, such as crossflow, where flow continues from one zone to another after shut-in, then it is unlikely that the data will provide useful information on reservoir properties
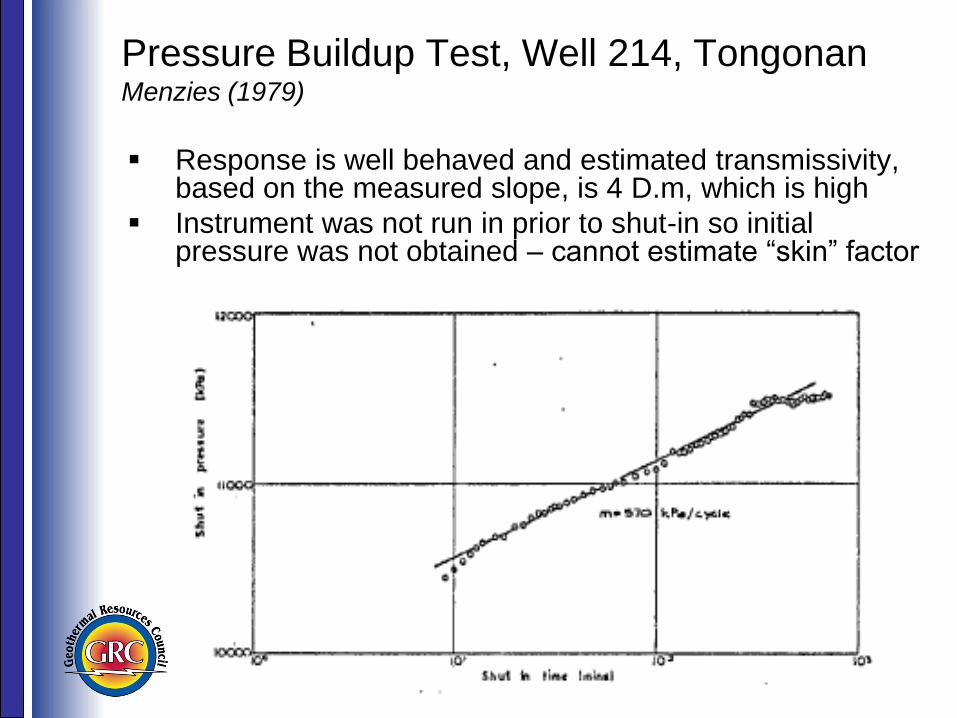
Pressure Buildup Test, Well 214, Tongonan Menzies (1979)
Response is well behaved and estimated transmissivity, based on the measured slope, is 4 D.m, which is high
Instrument was not run in prior to shut-in so initial pressure was not obtained – cannot estimate “skin” factor

Pressure Buildup Test, Well 401, Tongonan Menzies (1979)
Response initially well behaved but starts to cycle after 3 hours due to crossflow in the wellbore
Based on initial response, estimated transmissivity is 4.5 D.m
Initial shape suggests wellbore storage / skin type response

Multiple Well Flow Test

Multiple Well Flow Test - Objectives
Once sufficient wells are drilled, a multiple well flow test may be run to measure the impact of additional production on the reservoir
The test is normally conducted for 1 to 6 months
During the test, production parameters from all wells are monitored to determine how the mass flow and enthalpy are changing with time
Reservoir pressures are also monitored in observation wells (if available) to monitor how the reservoir responds to production and/or injection
A tracer test may also be conducted to check on communication between injection and production wells

Multiple Well Flow Test - Objectives
The pressure responses are analyzed to determine average reservoir flow capacity (transmissivity) and storage capacity (storativity) – Qualitative analysis is also important - which wells are
affecting the observation well(s) and how much impact are they having
– Results can be used to calibrate an analytical model of the field that can be used to forecast field behavior if the reservoir produces single phase liquid or steam
The changes in production parameters and the measured pressure data can also be used to calibrate a reservoir simulation model to provide the ability to do initial forecast runs – Has more flexibility than an analytical model and can be
used if two-phase conditions are present

Pressure Monitoring Equipment
Due to the high downhole temperatures, there are limited equipment options for long term downhole pressure monitoring
Best option is to use capillary tubing in the well connected to a transducer/datalogger at the surface – The capillary tubing and chamber are run into the
well to desired depth
– System is purged with inert gas (helium or nitrogen)
These systems are used in many geothermal fields for long term pressure monitoring

Capillary Tubing Installation

Multiple Well Test; Zunil, Guatemala Menzies (1990)
Test conducted from
March to November
1989 and involved
all six ZCQ- wells as
production and/or
observation wells
The test provided
information on the
resource that was
later used to justify a
24MW development
that started
operations in 1999

Multiple Well Test; Zunil, Guatemala Menzies (1990)

Example 3: Calculated temperature contours compared to measured data,
Numerical Model, Zunil Geothermal Field

Matches Using Numerical Model
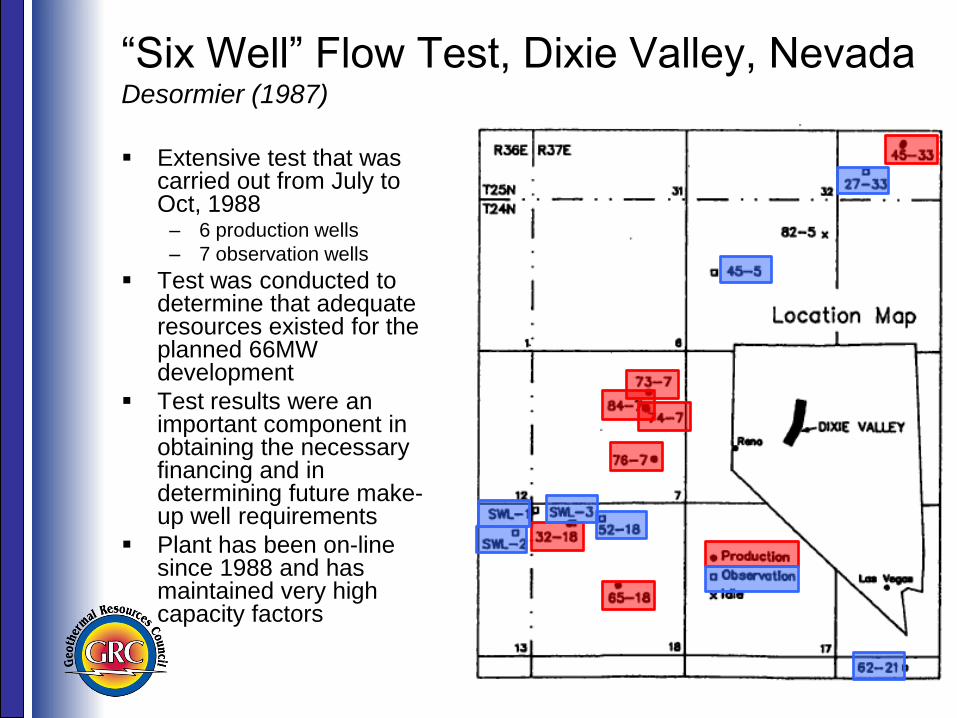
“Six Well” Flow Test, Dixie Valley, Nevada Desormier (1987)
Extensive test that was carried out from July to Oct, 1988
– 6 production wells
– 7 observation wells
Test was conducted to determine that adequate resources existed for the planned 66MW development
Test results were an important component in obtaining the necessary financing and in determining future make-up well requirements
Plant has been on-line since 1988 and has maintained very high capacity factors

Cross Section, Dixie Valley

“Six Well” Flow Test, Dixie Valley, Nevada Desormier (1987)

“Six Well” Flow Test, Dixie Valley, Nevada Match to Observation Well Response
o measured
simulated

References
Acuña, J.A.: Measurement Of Injectivity Indexes In Geothermal Wells With Two Permeable Zones, Proc. 19th Workshop on Geothermal Reservoir Engineering, Stanford University, Stanford, California (January 15-20, 1994)
Acuña, J.A. and Arcedera, B.A.: Two-Phase Flow Behavior and Spinner Data Analysis in Geothermal Wells, Proc. World Geothermal Congress, Antalya, Turkey (24-29 April 2005)
Axelsson, G. and Steingrímsson, B.: Logging, Testing and Monitoring Geothermal Wells, Presented at “Short Course on Geothermal Development and Geothermal Wells”, Santa Tecla, El Salvador (March 11-17, 2012)
Brennand, A.W.: A Method For The Analysis of Static Formation Temperature Tests, Proc. 6th New Zealand Geothermal Workshop, Auckland, New Zealand (1984)
Dench, N.D.: Interpretation of Fluid Pressure Measurements in Geothermal Wells, 2nd New Zealand Geothermal Workshop, Auckland, New Zealand (1980)
Desormier, W.L.: Dixie Valley Six Well Flow Test, Geothermal Resources Council, Transactions, Vol. 11 (October 1987)

References
Grant, M.A. and Bixley, P.F.: Geothermal Reservoir Engineering, 2nd Edition, Academic Press (2011)
Menzies, A.J.: Transient Pressure Testing, Proc. 1st New Zealand Geothermal Workshop, Auckland, New Zealand (1979)
Menzies, A.J., Granados, E.E., Sanyal, S.K., Mink. L.L., Mérida-I., L. and A. Caicedo-A., A.: An Integrated Test Program for the Definition Of a High Temperature Geothermal Reservoir: A Case Study From the Zunil Geothermal Field, Guatemala, Geothermal Resources Council Transactions, Vol. 14, Part II (August 1990)
Menzies, A.J, Villaseñor, L., Sunio, E and Lim, W.: Characteristics of the Matalibong Steam Zone, Tiwi Geothermal Field, Philippines, Proc. World Geothermal Congress, Bali, Indonesia (25-29 April 2010)
Regulacion, R.E.: Analysis of Flowing Pressure-Temperature-Spinner Survey on Geothermal Well Bulalo-112, Mak-Ban Field, Philippines, Proc. 27th Annual PNOC-EDC Geothermal Conference, Makati City, Philippines (March 8-9, 2006)

End of Presentation
Thank you