
Mysterious connection of Elizabeth Riley ... - John Riley, Sr.

2007 Annual Report
We’ll help you get
THERE

Getting THERE can start here. One of the biggest obstacles to getting there issimply making sense of all the options.MassMutual’s Web site is a great first step youcan take on your own. Not only can you learnabout our products, services and people, you canuse some innovative tools to help make sense oflife insurance, retirement savings and more. And you can do it all quickly, from anywhere,anytime – which takes care of a couple of other obstacles.
Some things you can do at MassMutual.com:• Discover the “Top 10 Questions” to help you
get there.
• Take the next step after major events such aschanging jobs, buying a home, losing a loved one orstarting a business.
• View and manage your MassMutual retirementsavings account.
• Calculate how much life insurance you might need.
• Study up on financial markets.
• Learn some financial strategies for your business.
• Investigate a career with MassMutual.
• Find a MassMutual financial professional officenear you.

1
There is a place where you feel good about your future. Where you’re confidentthat you’re taking smart steps today, for tomorrow. Where you’re comfortablethat you’re doing all you can for yourself and the people you care about.
When it comes to your financial life, getting there doesn’t mean reaching somefar-off destination. There is having peace of mind right now. Because you’re notjust thinking about the things you really should do. You’re actually doing them.
It’s a great place to be. And, at MassMutual, we’ll help you get there.
Hello. Are you
Table of ContentsLetter to Policyholders 2 MassMutual – Helping you get THERE 6 Business Highlights 20
Financial Statements 26 General Agencies and Other Offices 84 Senior Management 87
Board of Directors 88
MassMutual Financial Group is a marketing name for Massachusetts Mutual Life Insurance Company(MassMutual) and its affiliated companies and sales representatives. Securities offered throughregistered representatives of MML Investors Services, Inc., 1295 State Street, Springfield, MA 01111.
THERE

If you’re like most people, taking care of yourinsurance and retirement needs isn’t the first thingyou think of in the morning. But it may be whatkeeps you up at night.
Sometimes, no matter how badly we want to takeaction and put those worries to rest, we just can’tseem to make it happen on our own. Maybe wedon’t have enough information. Maybe we havetoo much. If you’re looking for someone to workwith you on your own terms and at your own pace, Ibelieve that MassMutual and its affiliates can helpyou move forward.
2
Stuart H. Reese, Chairman,President and Chief Executive Officer

When we say, “We’ll help you get there,” we’re nottalking about some far-off destination – we’retalking about that next step, the action you mayneed to take today to help secure your familytomorrow. Our goal is to help our clients take thenext step that’s right for them, whether thatinvolves a product purchase or not.
We do this through local financial professionalswho spend time and listen to you tell them aboutyourself and your unique financial needs. That isalso true when our client is a company. With a401(k) plan, for example, we focus onunderstanding what keeps individuals from saving for retirement, and then finding or building the right mix of tools and information to help them take action.
For example, our advanced analytics allow us tohelp plan participants manage their retirementsavings more simply and more effectively.
As a mutual company, we measureaccomplishments a little differently, because we’re owned by our members. Yes, we need todeliver strong financial results on a yearly basis,and we certainly did that in 2007.
THERE
3
“We’re here because you can’t
by yourself.”always get

For example:
• Dividends to eligible participating policyholderswere $1.37 billion, a 12 percent increase.
• Premium and other deposits totaled $29.4 billion,up 12 percent.
• All major business segments saw double-digitsales growth.
• Assets under management by MassMutual andits family of companies, which include the assetsmanaged by our subsidiaries OppenheimerFunds,Babson Capital Management and Baring AssetManagement, rose 11 percent to $505.4 billion.
• Statutory total adjusted capital totaled $10.3billion, up 9 percent.
Just as important, we continue to invest energy inmaintaining our mutual form of ownership, so wecan continue to offer you the strength, stability, andlong-term focus you have come to expect fromMassMutual. My goal is to ensure that all of ourbusinesses directly support our core insuranceoperations and reinforce a product portfoliodesigned to meet our policyholders’ and customers’needs over the long term. We work closely withour Board of Directors throughout the year insupport of our goals.
In 2007, we enhanced several of our core productslike whole life insurance, disability incomeinsurance, and retirement annuities, givingMassMutual policyholders the flexibility to useproven products – backed by our exceptionalfinancial strength – to address some of the newrisks and responsibilities of today’s economicenvironment. For example, MassMutual provides a
4
Dividends to Policyholders (in Millions)
$1,098$996
$1,155$1,226
$1,373
’07’03 ’04 ’05 ’06

Half PageA
MassMutual Financial Group’s Enterprise-wide MeasuresIn Millions 2007 2006 % ChangeAssets Under Management $505,445 $455,723 11%Worldwide Insurance In Force 502,571 472,512 6%Premium & Other Deposits 29,438 26,268 12%
Sales:U.S. Insurance Group 1,513 1,350 12%Retirement 5,953 5,023 19%
Financial Highlights
Premium & Other Deposits(in Billions)
$20$23
$25 $26$29
’07’03 ’04 ’05 ’06
Assets Under Management(in Billions)
$285$326
$396$456
$505
’07’03 ’04 ’05 ’06
Worldwide Insurance In Force(in Billions)
$415 $433 $447 $473$503
’07’03 ’04 ’05 ’06
We’ll help you get
THERESM

Financial Highlights
Consolidated Statutory Results*
In Millions 2007 2006 % Change
Dividends to Policyholders $ 1,373 $ 1,226 12%
Net Gain from Operations 656 561 17%
U.S. Whole Life Sales 269 256 5%
Life Company Assets 131,491 122,155 8%
Life Company Liabilities 123,487 115,128 7%
Total Adjusted Capital 10,294 9,428 9%
* These consolidated results of Massachusetts Mutual Life Insurance Company also include its U.S.-domiciled wholly-owned subsidiaries: MMLBay State Life Ins. Co., C.M. Life Ins. Co., CM Benefit Ins. Co. and CM Assurance Co. Copies of the separate company audited statutory financialstatements are available to policyholders upon written request. CM Benefit Ins. Co. and CM Assurance Co. were liquidated in the fourth quarter of2006. The results of these subsidiaries are included in the consolidated statutory financial statements through the date of liquidation.
Life Company Assets(in Billions)
$97$108 $114
$122$131
’07’03 ’04 ’05 ’06
Total Adjusted Capital(in Millions)
$7,753 $7,978$8,787
$9,428$10,294
’07’03 ’04 ’05 ’06
U.S. Whole Life Sales(in Millions)
$182$214 $207
$256 $269
’07’03 ’04 ’05 ’06

managed account program that allows clientsgreater flexibility to help meet their wealth andincome needs in retirement.
We continued to expand our nationwide network oflocal financial professionals, and to strengthen ourcommitment to training and supporting them. Werealize that many, if not most, of our customersneed and want a trusted ally to help them movetheir financial strategy forward. MassMutual isideally positioned to help them take that next step.
In addition to our business success, I am proud ofthe community contributions MassMutual and ourfinancial professionals make in our home officeregion, across the country and around the world.Our Corporate Responsibility Report is nowavailable at MassMutual.com and provides acomplete picture of these numerous philanthropicand community programs.
I am thankful to the MassMutual policyholders andcustomers who place their confidence inMassMutual. We are committed to doing our partto help you get there. I also thank the policyholdersand customers who let us highlight their stories inthis report. Your stories inspire us.
If you are not yet a MassMutual customer, we hopethis report motivates you to take a look at us andtake the next step – whether that means visitingMassMutual.com, contacting one of our localoffices, or simply sharing this report with someoneyou trust to get a second opinion. I believe that ifyou give MassMutual a chance to get to know youand your financial needs, you could be well on yourway to getting past the obstacles you face, andmaybe to getting a better night’s sleep.
February 22, 2008
We’ll help you get
THERE
5
Stuart H. ReeseChairman, President and Chief Executive Officer
SM

But we also see the obstacles in your way.You don’t have enough time. It’s tooconfusing. So many choices. Who do you trust?
We understand what can prevent you fromtaking action. We don’t think you or anyoneelse should let that stand in the way ofbuilding your financial future.
At MassMutual, we strive to remove thoseobstacles from your path. We help simplify theprocess and present you with meaningful,manageable next steps you can take with ease andconfidence. So you’re moving in the right direction.And you know it.
How we help you get thereExperienced people. Exceptional products. And arealistic, needs-based approach to your financialstrategy. It’s not about fitting you into a category orrushing you into a sale. We work closely with youto understand your unique situation and goals, andhelp you understand your options. Then, we helpyou focus on the right thing to do right now. Andwe work to establish a long-term relationship, sowe can continue providing help with that next stepthroughout your life.
6

Half PageB
THERE
We picture a worldwhere everyone is

MEET Mark:When Mark and Kathy Wendling met with MassMutualfinancial professional, Thomas Waring, Jr., they decided toget life insurance. They were young and healthy, building ahouse, starting a family. No one expected that only daysafter Riley was born, Kathy would die. She was 28.
Mark is now a full-time dentist, a partner in a busy dentalgroup. Riley’s kindergarten teacher says she is a delight tohave in the classroom. Later this year, Mark plans tomarry his fiancé, Katie Bajak. Riley is helping with thewedding plans.
Shown left to right: Riley and Mark Wendling, Katie Bajak.
“Riley turned five a few months
ago and began kindergarten in the
fall. It’s been a long and difficult
journey, but having the financial
freedom that life insurance
provided gave me the chance to
focus on what I love, and what was
important to me – my daughter.”
Mark S. Wendling, D.D.S.

The people helping you get thereMassMutual and its family of companies isthousands of dedicated men and womenworldwide. We’re the local financial professionalsyou can get to know and work with one-on-one.We’re the forward-thinking experts who developinnovative products and ideas. We’re thesupportive customer service representatives wholet you know you’re not alone.
We are one of the most respected life insurancecompanies in the world. And we’ve been helpingpeople like you get there since 1851. Today, weserve individuals and businesses worldwide with abroad product portfolio of life insurance, annuities,long-term care insurance, disability incomeinsurance, executive benefits, investment products,retirement plans and more.
With the right people on your side, the obstacles inyour way may not seem so big. You can get pastthem and get there. In fact, we believe everyone can.
THERE
7
We picture a worldwhere everyone is

For many, the most satisfying ”there”is knowing your family will be financially secure if you’re not around.
If you have a spouse, child, life partner, orbusiness partner, it’s natural to wonder whatwould happen to them if something happensto you. That’s life.
Knowing the people you care about are financiallyprotected – that’s life insurance. At MassMutual,we sold our first life insurance policy in 1851. Andmore than 156 years later, we’re still helping toprovide financial security to those who seek it.
Starting with LifeWhole life insurance is at the heart of our company,our strategy, our insurance portfolio, and ourmutual ownership. For many of our policyholders,whole life insurance is also at the heart of theirfinancial strategy, providing not only protection forthose left behind, but the flexibility to meet avariety of financial needs throughout their lives.
MassMutual offers a broad range of choices inaddition to whole life because choosing the right lifeinsurance is the first step to getting there. In otherwords, start here. And once you know your lovedones or your business will be protected, you canmove on to your other financial needs and goals.
8

THERENext time your child asks,
yet?”“Are we
just smile and say, “Absolutely.”
Half PageC

MEET Jason and Karen:Karen E. Smith is president of Troy Belting & Supply Co.in Watervliet, New York. Her son, Jason, is an officer ofthe company’s Board of Directors and serves as powergeneration manager. Working with MassMutualfinancial professional Todd McDonald, the Smith familyused MassMutual life insurance products to build theirbusiness succession plan.
Employing more than 70 people, Troy Belting sells powertransmission, power distribution, material handling,motor sales and service, and related specialized equipment and services to the industrial, mining andcommercial markets of the northeastern United States.
“The Monday morning after my husband
passed away, we gathered our employees
together and told them, ‘Everything will be
fine.’ I cannot express how much it meant to
be able to say that to them. George always
said, ‘We are stewards of our family’s
business for the next generation.’”
Karen E. Smith, President,
Troy Belting & Supply Co.

Making Sense of LifeThere are so many choices. And so many ways lifeinsurance can contribute to a smarter financialstrategy. But with a little help, determining theright products and coverage can be much simplerthan you think. Wherever you live or work, you cansit down with a MassMutual financial professionaland feel confident that you’re receiving helpfuladvice and service – and that you’re taking a smartfirst step.
Affording LifeWe believe even people who think they can’t affordlife insurance can’t afford to go without it. In mostcases, you can achieve a level of protection nomatter what your budget. Part of our approach is tohelp you understand the value of life insurance andfind a next step that you can manage.
MassMutual is so dedicated to this notion that in2002 we launched the innovative LifeBridgeSM FreeLife Insurance Program. The program provides free
term life insurance, paying the premiums forparents or guardians who meet certain eligibilityrequirements. If an insured parent or guardian diesduring the 10-year term, the $50,000 benefit fundsa trust serviced by our trust company to pay foreligible dependent children’s educational expenses.As of year-end 2007, we’ve given away more than$390 million worth of life insurance coveragethrough the LifeBridge program.
For a LifetimeEssentially, life insurance is a promise you make tofinancially protect your family, business or estate.And MassMutual helps you keep your promise. Our financial strength and stability through theyears is evidence you can lean on to believe we willbe there for you and your family far into the future.
9
THERENext time your child asks,
yet?”“Are we
just smile and say, “Absolutely.”

If one thing is certain today, it’s that you can’tbe certain about what will happen tomorrow.You can, however, be certain that you’vetaken action to help protect yourself and yourfamily from a number of life’s risks.
What if you become disabled?It can be remarkably comforting to know that thelifestyle you’ve worked so hard to give your familywon’t be taken away in the blink of an eye.MassMutual offers disability income insurance tohelp protect a portion of your earnings should youbecome unable to work due to the potentiallydevastating effects of disability. One ofMassMutual’s innovative products can even helpyou protect the retirement contributions you wouldhave made to your retirement savings in the eventthat you become totally disabled.
What if you or a loved one needs long-termor special care?If you or a loved one can no longer liveindependently because of a chronic, long-termmedical condition, the costs can be staggering. Thissituation is becoming more and more common ashealth care costs rise, people live longer, andfamilies take on more financial responsibility forhealth care expenses. MassMutual can cover youor a loved one, helping pay the costs of necessary
10

THERE
Where there’s a risk, there’s a
Half PageD

MEET Rick:Rick Guerra has been married 25 years and is thefather of three “beautiful daughters, who look liketheir mother.” As a new car sales manager, Rick washonored for his exceptional work in sales, training,and customer satisfaction.
Prior to Rick’s stroke, he and his wife bought theirdream house. Today, they still live there, thanks inpart to his MassMutual disability income insurance.
Rick’s unexpected challenge has changed his life.These days, he hopes his story can help others realizethe importance of preparing for the unexpectedturns life can take. So along with insurance help,MassMutual financial professional Pete Lewis isalso helping Rick share his story more broadly.
“My uncle taught me to save 10 percent of
every dollar I earned. He also said I needed
two kinds of insurance: life and disability
income. When I had a stroke at age 45, I was
really scared, but I also knew I was lucky to
have taken my uncle’s advice.”
Rick Guerra, San Antonio, TX

medical and personal care, and helping protectretirement savings and other financial assets in atime of need.
In addition, if you’re caring for a person with adisability or other special need, health issues areonly the beginning. Life’s challenges may alsoinclude earning or supplementing an income,creating a safe and accessible living environment,fulfilling special equipment needs, and increasingpersonal independence. MassMutual’s SpecialCareSM
program provides access to information, specialistsand financial solutions through our nationalnetwork of trained Special Care Planners.
What if you have employees to look out for?If you’re a business owner or employer, you knowthe determination and passion it takes to besuccessful. Building an enterprise and guiding itthrough the ups and downs of today’s businessclimate is a heroic undertaking. MassMutual canhelp along the way. Through our network offinancial professionals, we can help you build long-term succession plans and provide benefits for
employees. Plus, our Executive Benefits programincludes insurance solutions that can help attractand retain talented professionals, as well asaddress the more complicated financial needs ofyour executives.
What if your needs change?Most MassMutual insurance products are with youfor the long haul. Our goal is to build and maintaina product suite that is in touch with the manyneeds of our customers. Additionally, we train ourfinancial professionals to look after your needsthroughout your life, helping you navigate whateverchanges may come your way.
11
THERE
Where there’s a risk, there’s a

Retirement can seem so far away. And whenyou consider how much you’ll need to save, itcan appear even more distant. But that’s okay.Because you don’t get to retirement in onegiant leap. You keep taking deliberate, smartsteps in the right direction – steps that makeyou feel confident you have a good plan inplace. That’s when you’re truly there.
MotivatingAbove all else, MassMutual strives to help you actnow. Our products and people will help demystifyretirement planning through every stage of your life.So obstacles fade. Your next step becomes clear.And planning for retirement is no longer somethingyou just think about. It’s something you do.
EmpoweringGenerally, you take advantage of MassMutual’sretirement products, including 401(k) plans andpension plans, through your employer. So it’s ourjob to work closely with retirement plan advisorswho assist business owners and benefits managersat companies of all shapes and sizes. We equipthese professionals with quality products,dedicated support services and innovativeeducational materials so they can, in turn, helpemployees become actively involved in retirementplanning decisions.
12

THEREisn’t arriving at your retirement destination.
It’s being on the right path.
Half PageE

MEET Bill and Jennie:Bill Karns and Jennie Wine oversee Rodda Paint'sbenefits and 401(k) plan. Rodda employs more than350 people in 45 locations throughout Oregon,Washington, Alaska and Idaho.
Working collaboratively, MassMutual and the plan'sthird-party financial advisor deliver personalized, one-on-one enrollment assistance and investmenteducation to Rodda Paint employees.
Shown left to right: Bill Karns, Jennie Wine,MassMutual’s Mitch Haber.
“We knew that our employees' own
retirement savings would be vital to their
overall success in meeting their retirement
needs, but they just weren't saving enough.
Today, nearly 90 percent of Rodda Paint
employees are participating in our
plan – compared to 47 percent six years
ago. Better still, the average savings rate
has also increased.”
Bill Karns, Human Resources Director, Rodda Paint

LearningHow do we help turn thoughts into action? We’vemade it a top priority to better understand howpeople think, and act, when saving for retirement.Through research we’ve sponsored, we betterunderstand the challenges people face. Whatobstacles are in the way. What it will take to getyou to begin. And what will keep you engagedgoing forward. As a result, the products we offerand the tools we use to communicate with you arecustomized to your needs and aimed at making thewhole process easier.
For example, we launched a new paper-based Gapand Income Statement for retirement planparticipants that uses your individual personal dataand assumptions to estimate whether you will havea sufficient account balance, combined with aSocial Security benefit, to replace 90 percent ofyour current income at normal retirement age. Wealso developed plan participant uses for a first-of-its-kind hand-held enrollment device called thee4SM. It allows you to explore your options andenroll in your company’s retirement plan at the pushof a button.
Our online retirement planning program, TheJourneySM, puts account management tools andinvestment information right at your fingertips. It’sdesigned to give you just what you need to moveforward – whether you want to steer your plan allby yourself, get a detailed road map or let us domost of the driving.
13
THEREisn’t arriving at your retirement destination.
It’s being on the right path.

At the point of retirement, there’s a dramaticchange of gears financially. After years andyears of working for your money, you switchto years and years of your money working foryou. It’s a critical moment. And, atMassMutual, we’re right there with you.
Your RetirementWill you sit back and relax, surrounded by family, orembark on a more active and adventurous lifestyle?Will you move into your dream home or walk into asecond career? Will you do all of the above?Retirement is like starting a whole new financiallife, complete with new priorities, needs and goals.And just like when you first started saving for theretirement of your dreams, MassMutual can helpyou take the next steps in funding the retirement ofyour reality.
14

THERE
When you realize your retirementsavings will pay off, you’re
Half PageF

MEET Carey:Carey Ann Smith is a retired nurse educator too energetic to simply stop working. This natural nurturer now provides house-sitting, errand andnanny/babysitting services.
To prepare her for a new stage in life, Carey'sMassMutual financial professional did a thoroughfinancial review. Because she had a pension, Careyneeded less – not more – income from her IRA whenshe retired. MassMutual has tools that evaluate manyoptions to help determine the best fit for each client’sneeds. So instead of receiving unnecessary income,Carey adjusted her IRA withdrawal rate in order tobetter meet her current income needs.
And, if Carey decides to pursue a new direction, she can adjust her income plan accordingly.
“When I retired, I knew I needed help.
I met with my financial professional to
help figure out my future income needs.
I also told her that I needed a new car.
She helped me to figure out my income
plan and I was even able to buy the car
within my budget.”
Carey Ann Smith, retired

Your Income So many things have changed in your life since youfirst started saving. The result is, your incomeneeds may be different than you anticipated. And itcan be difficult to determine exactly how muchyou’ll need and for how long. MassMutual willwork closely with you and your financialprofessional as you approach and enter intoretirement. We offer a number of programs andservices that can help you generate a steady,reliable stream of income for your needs today andfor years to come, including help managing accountwithdrawals over the length of your retirement.This innovative suite of offerings gives youflexibility and choices, not just when you’re savingfor your retirement, but also when you get there.And if you haven’t quite reached your accumulationgoal, we can help with that, too.
Your Future Changing savings into income isn’t a one-time deal.We’ll stay with you throughout your retirement years,so as your needs change, your income plan can aswell. One of our investment advisor programs guidesyou throughout your retirement by recommending theright withdrawals to help keep pace with your needsover the years. And we can help you take care ofother important financial needs after retirement, likeensuring your loved one has income or leaving alegacy for your children.
15
THERE
When you realize your retirementsavings will pay off, you’re

When you choose to work with a specificfinancial professional and company, you’reputting quite a bit of trust in their ability toperform for you today and stay with you forthe long term. It’s a big decision. So when wesay, “We’ll help you get there,” why shouldyou believe it?
ExperienceNot many companies have been around for 156years. We’re proud of what that says about ourexperience and our stability. We’ve grown andthrived – surviving wars, depressions, recessionsand changing market conditions. And while we’veadapted and expanded our offerings along theway, our main focus has never wavered. We are acompany that helps people like you take the nextstep toward a more secure financial future. And our rich history is proof that this approach is effective.
16

Half PageG
THEREWe’ve been here helping people get
for 156 years.

MEET THE Dickersons:Andrew Jackson Dickerson, “Jack,” met Gwen whenthey were 12. They married at 18 and had four children.He became a board certified surgeon, and when theymoved to Waynesville, North Carolina, he was the firstsurgeon in the area.
Over the years, Dr. Dickerson gave back to his family,his community, and the world. He volunteered forHabitat for Humanity and Rotary International.
As a medical student in 1950, he bought his first wholelife insurance policies from Joe Mickey. Fifty-sevenyears later, Joe’s son, John, a third-generationMassMutual agent, handled the claims.
Shown left to right: Beverly, Gwen and Marty Dickerson.
“Daddy left a legacy in so many ways. He
was a surgeon in a small town who treated
everyone with dignity. I remember he once
performed an appendectomy in trade for a
pony for me. And I didn’t even know until
recently that he’d bought a life insurance
policy so he could leave a legacy to
Bowman Gray Medical School.”
Marty Dickerson, daughter of
Dr. Andrew J. Dickerson

StrengthWhy should you care about our financial strengthratings? Because they’re a key indicator of our abilityto deliver on our long-term promises to you, likepaying a life insurance benefit or an annuity payment.And they can give you reason to believe the moneyyou entrust with us is being handled expertly. We’reproud that our ratings1 are among the highest of anycompany in any industry.
A.M. Best Company: A++ (Superior)
Fitch Ratings: AAA (Exceptionally Strong)
Moody's Investors Service: Aa1 (Excellent)
Standard & Poor's: AAA (Extremely Strong)
MutualMutual is not just part of our name. It’s part of ourhistory, our future and our everyday commitment toyou. In simplest terms, if you have a participatinglife insurance policy issued by MassMutual, youshare in the ownership of the company. AtMassMutual, we ensure that your interests aretaken very seriously and that declared dividendsare paid to eligible policyholders and notshareholders. In short, it’s just one more wayMassMutual maintains its strength, stability andcontinuity for you.
17
THEREWe’ve been here helping people get
for 156 years.
1 Ratings are subject to change. This information is current as of February 22, 2008. Ratings apply to Massachusetts Mutual Life InsuranceCompany and its subsidiaries, C.M. Life Insurance Company and MML Bay State Life Insurance Company.

All of us at MassMutual share a strong beliefthat doing business the right way will help uscontinue to serve our customers far into thefuture. As an industry leader, we strive to seta good example for our peers by being anexceptional corporate citizen. We want you tohave both confidence and pride in thecompany you call your own.
Ethical StandardsSo many rely on us for their financial future, and wetake that responsibility very seriously. You musttrust us for the relationship to work. So we strictlyadhere to the laws and regulations that govern ourbusiness. We instill high ethical standards in ouremployees. And we strive to act with the utmostintegrity across all areas of our business.
Giving BackMassMutual supported a number of local andnational charities through monetary donations andcorporate sponsorships of nearly $6 million in 2007.We also give back in a number of other ways. Forinstance, we provide free life insurance for eligibleparents and guardians through the LifeBridgeSM FreeLife Insurance Program. Our education programsprovide scholarships to deserving students. And wemotivate and empower our financial professionalsacross the country to get involved in their localcommunities, too, so they can make a differencewhere you live.
18

Being GreenToday, being environmentally responsible is morethan just a good idea. It’s essential to ourcompany’s long-term growth and stability. We’rededicated to reducing our “environmental footprint”through activities such as recycling and utilizingenergy-efficient building materials and practices.We encourage conservation in the workplace,engaging employees to share and pursue their own“green” ideas.
We also strive to be an industry leader inintroducing technologies that can reduce paper use,such as online forms and “electronic” policies. Forexample, with help from The Conservation Fund’s GoZeroSM program, MassMutual is driving awarenessof its electronic prospectus delivery option availableto retirement plan sponsors and participants. Forevery plan sponsor who replaced paper deliverywith e-prospectus delivery in 2007, MassMutualmade a donation to The Conservation Fund to planta tree in a protected forest on their behalf.
A Great Place to WorkOur success and our ability to serve your needsdepend on having talented, dedicated andmotivated employees. Which is why we’veconstructed a workplace experience that hasearned us national recognition as a WorkingMother 100 Best Company (October 2007) and thatranks us among America’s Most AdmiredCompanies® in our industry category according toFortune magazine (April 30, 2007).
19
THEREHelping you get
is a great responsibility.
� 42% Education
� 19% Health and Human Services
� 17% Matching Gifts
� 14% Civic and Community
� 8% Arts and Culture
MassMutual’s 2007 Community Contribution

2007 Business HighlightsInsurance• Dividends to eligible participating policyholders
were $1.37 billion, a 12 percent increase and thelargest ever for the company since it was foundedin 1851.
• Introduced a flexible new entry in the whole lifeinsurance marketplace, further expanding ourportfolio and continuing to offer product optionsthat help our customers take action in addressingtheir financial needs and the needs of those whodepend on them.
• Further strengthened our leading position in theexecutive protection market by enhancing ourdisability income insurance products to provideadditional flexibility and increased coverage limits.
• Underwent a rigorous, independent assessmentof individually owned life insurance, annuitiesand long term care products by an impartial thirdparty in renewing our membership in theInsurance Marketplace Standards Association,the premier standards-setting organization for the life insurance marketplace.
• Approximately 1.8 million domestic individual lifeinsurance policies in force at year-end.
• More than $356 billion of individual life insurance coverage in force.
• More than $1.3 billion in death benefit claims paid.
• MassMutual continued as DALBAR’s top-rankedsite for financial professionals, while earning the“Excellent” designation for its consumer Web site– MassMutual.com.
• MassMutual’s continued support of its CareerAgency distribution system helped grow thenumber of financial professionals to more than4,400 in 2007, a 7 percent increase over theprevious year.
• The number of women in our network of financialprofessionals increased by 9 percent asMassMutual continues to empower women to achieve success with their personal andbusiness finances.
20

Retirement• MassMutual announced sponsorship of the PBS
documentary – “Retirement Revolution®” –which aims to raise awareness of retirementpreparation for Americans.
• MassMutual released a study revealing fixedincome annuities as a new asset class for creatingretirement income plans, and also introduced twonew annuities to the market in 2007.
• As of January 2008, MassMutual had leadingfinancial strength ratings when compared toother companies that issue variable annuitieswith a full suite of living benefits features.
• MassMutual offers a program that combinesinvestments, annuities and withdrawal guidancein one integrated package to deliver lifetimeretirement income in a single account – one ofthe few programs of this type in the industry.
• The company expanded its institutionalretirement sales and service team to supportboth strong growth and its network of strategicdistribution relationships.
• MassMutual earned a 2007 Annual Call CenterExcellence Award in the “Best in Class CallCenter” category (staff of less than 500). Theaward, sponsored by the International Quality &Productivity Center, recognizes superior thinking,creativity, and execution.
• Introduced a new bundled small plan producttargeting defined contribution retirement planswith $1 million-to-$5 million in assets. The newplan helps optimize participation and savingsbehavior with simplified administration for theplan sponsor.
• Introduced the SmartArchitectureSM InvestmentProgram, supported by a robust third-partycertification program, and a Fiduciary Warranty,all designed to offer plan sponsors and financialadvisors help in fulfilling their fiduciaryresponsibilities.
• Developed MassMutual RetireSmartSM, a suite ofautomatic features (automatic enrollment, assetallocation, and deferral increase) that helpsretirement plan participants get closer to theirretirement goals with enhanced simplicity.
21

Investment Management The MassMutual Financial Group of companiesincludes a number of respected investmentmanagement companies. If you have an insurancepolicy or retirement plan with us, your money isoften managed by these industry leaders. Or, theycan serve you and other investors independently.Their presence in the MassMutual FinancialGroup enhances our overall financial strength and stability.
OppenheimerFunds, Inc.One of the nation’s largest and most respectedinvestment management companies,OppenheimerFunds has been helping investorsrealize their financial goals for nearly a half century.OppenheimerFunds and its controlled affiliates offera broad range of products and services toindividuals, corporations and institutions.
• In October 2007, OppenheimerFunds Chairmanand CEO John V. Murphy was named Chairman ofthe Investment Company Institute (ICI), thenational association of U.S. investmentcompanies, including mutual funds, closed-endfunds, exchange-traded funds (ETFs), and unitinvestment trusts (UITs).
• Four portfolio managers were named to Barron’sannual Top 100 Portfolio Manager rankings inAugust 2007, marking the ninth consecutive yearfour or more managers have been named to thisprestigious list.2
22
2 OppenheimerFunds, Inc. has had at least four portfolio managers ranked in Barron's/Value Line annual survey "Top 100 Fund Managers"for each of the past nine years. Surveys were published 8/13/07, 8/14/06, 8/15/05, 8/16/04, 8/4/03, 7/29/02, 7/23/01, 7/17/00 and 7/19/99.Surveys are of qualifying portfolio managers; scores assigned based on performance and volatility of the Fund managed, versus peergroup. Barron's is a trademark of Dow Jones, L.P.
Investment Management Sales(in Millions)
$28,609$38,222
$62,967
$79,487
$104,950
’07’03 ’04 ’05 ’06

Babson Capital Management LLCBabson Capital is a full-service investment advisorthat creates investment strategies and solutions forinstitutions and other sophisticated investors.
• In a year where the industry saw significantvolatility, and specifically the challenges in thecredit markets, Babson Capital had another strongsales year, growing assets managed and servicedby 10 percent to $120.2 billion.
• Babson’s Mezzanine and Private Equity Groupcompleted its 100th realization since its inception15 years ago.
Baring Asset Management LimitedBaring is an international investment managementfirm with investment skills, clients and businesslocations spanning world markets.
• Baring’s exceptional year-over-year earningsgrowth measured over 100 percent.
• In 2007, Baring won more than 60 newinstitutional clients worldwide.
Cornerstone Real Estate Advisers LLCCornerstone, MassMutual’s real estate managementand advisory firm, manages real estate assets forinsurance companies, public and corporate pensionplans, Taft-Hartley plans, endowments and foundations.
• Launched a global real estate securities fund aspart of its initiative to expand into global realestate markets.
• Completed sales of assets from CornerstoneRotational Venture, which had invested in officeand apartment projects in selected U.S. marketsstarting in 2004, returning all capital to investors inaddition to returns that exceeded projections.
MassMutual International LLCMassMutual International (MMI) is the holdingcompany for MassMutual’s international insuranceand selected investment subsidiaries. MMI hasexpanded over the past decade through theacquisition of several well-established firms and nowoffers insurance and other financial products to morethan 1.9 million people in Japan, Taiwan, Hong Kong,Macau, Luxembourg and Chile.
• Total insurance sales of more than $2.4 billion.
• More than $22 billion in assets undermanagement, up 25 percent over 2006.
• Total premium over $4.6 billion, a 15 percentincrease over 2006.
23

Investment PhilosophyMassMutual’s seasoned investmentprofessionals apply a value-driven investmentapproach to identify investment opportunities.Their broad expertise allows us to consider awide range of asset types. Our goal is toprovide exceptional results for our policyholdersdespite the unpredictable market conditionsthat may prevail.
We believe that diversification – both across andwithin asset types – is extremely important andlimits exposure to any particular asset type oreconomic event at any point in time. We anticipatethat adherence to our disciplined investmentapproach and a long-term focus will continue toprovide for the best interests of our policyholders.
BondsMassMutual invests in public and private bonds,resulting in a portfolio that is well diversified acrossindustries and issuers to help reduce credit risk.Private bonds and loans diversify across differentissuers and provide considerable value to theportfolio as most offer some combination of higheryields, protective covenants and call-protectionfeatures. Almost 91 percent of the bond portfolio isinvestment grade based on ratings by the NationalAssociation of Insurance Commissioners (NAIC).
24
Half PageH
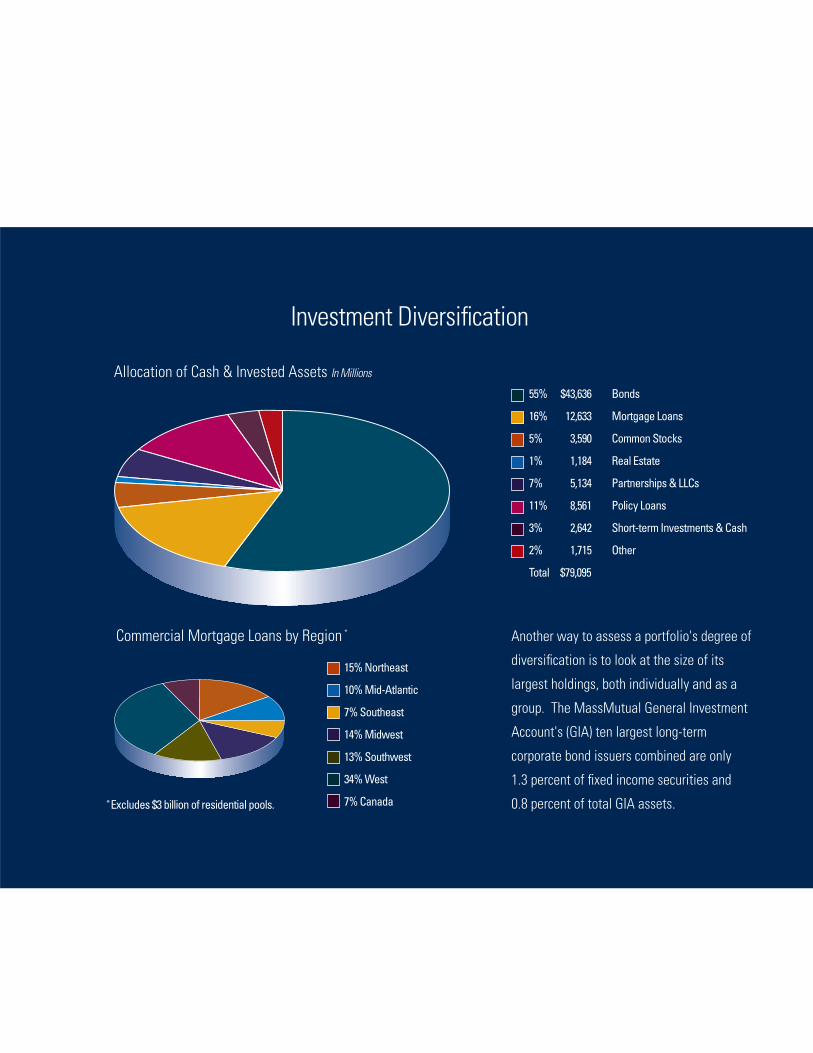
Investment Diversification
Another way to assess a portfolio's degree of
diversification is to look at the size of its
largest holdings, both individually and as a
group. The MassMutual General Investment
Account's (GIA) ten largest long-term
corporate bond issuers combined are only
1.3 percent of fixed income securities and
0.8 percent of total GIA assets.
Allocation of Cash & Invested Assets In Millions
55% $43,636 Bonds
16% 12,633 Mortgage Loans
5% 3,590 Common Stocks
1% 1,184 Real Estate
7% 5,134 Partnerships & LLCs
11% 8,561 Policy Loans
3% 2,642 Short-term Investments & Cash
2% 1,715 Other
Total $79,095
Commercial Mortgage Loans by Region *
15% Northeast
10% Mid-Atlantic
7% Southeast
14% Midwest
13% Southwest
34% West
7% Canada*Excludes $3 billion of residential pools.

Credit Quality* In Millions
Statement Value %
Aaa/Aa/A $29,244 67.0%
Baa 10,376 23.8%
Ba 1,783 4.1%
B 1,748 4.0%
Caa & lower 410 0.9%
In or near default 75 0.2%
Total $43,636 100.0%
* Public rating agency equivalents based on NAIC classifications.
Investment Quality
Allocation of Bonds In Millions
90.8% $39,620 Investment Grade
9.2% 4,016 Non-Investment Grade

Commercial Mortgage LoansOur direct lending expertise in commercialmortgages serves us well in identifyingopportunities. Commercial mortgage loans arediversified geographically and by property type, with most of the loans on buildings such as offices,apartments, shopping malls and hotels.MassMutual’s commercial mortgage loan portfolioperformed well during 2007 and at year-end therewere no loans in default.
Equities and Real EstatePublic and private equities are held directly andthrough partnerships, limited liability companies,and funds. Private equity in particular has providedsignificant benefits to the portfolio for many years,both directly through ownership and indirectlythrough attractive lending opportunities that arisefrom these business relationships.
Directly owned real estate is diversifiedgeographically to insulate the portfolio fromdownturns in local or regional economies.Commercial real estate historically has producedgood cash flow and enjoys certain tax advantages.In addition to directly owned real estate,MassMutual invests in real estate funds,partnerships, and real estate investment trusts.
Investment Risk ManagementInvestment risk management is a high priority. We monitor and analyze exposures to variousinvestment risks, employing a rigorous managementprocess for our assets to optimize policyholdervalue while ensuring our ability to meet ourobligations. In keeping with our obligation toprovide timely payment, MassMutual maintains astrong liquidity position. Liquidity is routinelyaddressed as part of the ongoing managementprocess and through periodic liquidity stress testing.
25

The management of Massachusetts Mutual LifeInsurance Company (MassMutual) is responsible forthe integrity and objectivity of the accompanyingconsolidated statutory financial statements ofMassMutual and its United States of America-domiciled life insurance subsidiaries (the Company),including estimates and judgments reflected inthem, and believes they fairly present theconsolidated financial condition of the Company inaccordance with statutory accounting principles.The Company engages independent publicaccountants to audit the fair presentation of itsfinancial statements and disclosures. Copies of theseparate company audited statutory financialstatements can be obtained by contactingMassachusetts Mutual Life Insurance Company,Corporate Communications, 1295 State Street,Springfield, MA 01111.
Management is responsible for the design andimplementation of the internal controls designed toprovide reasonable assurance that assets aresafeguarded, financial transactions are properlyrecorded and relevant matters are appropriatelydisclosed. These controls include appropriateseparation of duties, specified delegation ofauthority, and established policies and procedures
that are clearly communicated throughout theCompany.
Based on financial reporting risk assessments,management updates process documentation,identifies key controls and performs tests of theoperating effectiveness of the key controls. Inaddition, MassMutual’s professional staff ofinternal auditors monitors and evaluates theCompany’s control structure through periodicreviews and tests of the control aspects ofaccounting, financial, and operating activities.
An Audit Committee of the Board of Directors ofMassMutual, consisting of directors who are notofficers or employees of the Company, meetsperiodically with management, the independentpublic accountants, and the internal auditors toexercise its oversight responsibilities with respectto accounting controls, preparation of financialstatements, and the roles of the independent publicaccountants and the internal auditors.
The accompanying financial statements include theresults of MassMutual, C.M. Life InsuranceCompany, MML Bay State Life Insurance Company,CM Assurance Company, and CM Benefit InsuranceCompany.3
26
Management’s Responsibility for Financial Statements
3 The Company liquidated CM Assurance Company and CM Benefit Insurance Company in the fourth quarter of 2006. The results of thesesubsidiaries are included in the consolidated statutory financial statements through the date of liquidation.

Massachusetts Mutual Life Insurance Company and Subsidiaries CONSOLIDATED STATUTORY STATEMENTS OF FINANCIAL POSITION
December 31, 2007 2006
(In Millions)Assets:
Bonds $ 43,636 $ 43,976 Preferred stocks 167 270 Common stocks – subsidiaries and affiliates 2,786 2,684 Common stocks – unaffiliated 804 1,204 Mortgage loans 12,633 11,077 Policy loans 8,561 8,032 Real estate 1,184 1,275 Partnerships and limited liability companies 5,134 3,956 Derivatives and other invested assets 1,548 1,044 Cash, cash equivalents and short-term investments 2,642 1,015
Total invested assets 79,095 74,533
Investment income due and accrued 764 715 Other than invested assets 1,405 1,338
Total assets excluding separate accounts 81,264 76,586
Separate account assets 50,227 45,569
Total assets $ 131,491 $ 122,155
Liabilities:
Policyholders’ reserves $ 61,538 $ 59,887 Liabilities for deposit-type contracts 4,266 3,599 Contract claims and other benefits 259 248 Policyholders’ dividends 1,391 1,245 General expenses due or accrued 734 752 Federal income taxes 47 133 Asset valuation reserve 1,596 1,784 Securities sold under agreements to repurchase 2,102 1,183 Commercial paper 250 - Other liabilities 1,257 855
Total liabilities excluding separate accounts 73,440 69,686
Separate account liabilities 50,047 45,442
Total liabilities 123,487 115,128
Surplus 8,004 7,027
Total liabilities and surplus $ 131,491 $ 122,155
See notes to consolidated statutory financial statements.
27

Massachusetts Mutual Life Insurance Company and Subsidiaries CONSOLIDATED STATUTORY STATEMENTS OF INCOME
Years Ended December 31,
2007 2006(In Millions)
Revenue:
Premium income $ 13,236 $ 13,043 Net investment income 4,934 4,473 Fees and other income 574 504
Total revenue 18,744 18,020
Benefits and expenses:
Policyholders’ benefits 12,029 11,373 Change in policyholders’ reserves 2,715 3,049 General insurance expenses 1,141 1,178 Commissions 550 548 State taxes, licenses and fees 136 127
Total benefits and expenses 16,571 16,275
Net gain from operations before dividends and federal income taxes 2,173 1,745
Dividends to policyholders 1,373 1,226
Net gain from operations before federal income taxes 800 519
Federal income tax expense (benefit) 144 (42)
Net gain from operations 656 561
Net realized capital (losses) gains, after tax and transfers to interest maintenance reserve (455) 249
Net income $ 201 $ 810
See notes to consolidated statutory financial statements.
28

Massachusetts Mutual Life Insurance Company and Subsidiaries CONSOLIDATED STATUTORY STATEMENTS OF CHANGES IN SURPLUS
Years Ended December 31,
2007 2006(In Millions)
Surplus, beginning of year $ 7,027 $ 6,688
Increase (decrease) due to: Net income 201 810 Change in net unrealized capital gains (losses) 372 (10) Change in net unrealized foreign exchange capital gains 63 47 Change in asset valuation reserve 188 (266) Change in nonadmitted assets (89) (128) Change in net deferred income taxes 316 (57) Prior period adjustments (88) (57) Other 14 -
Net increase 977 339
Surplus, end of year $ 8,004 $ 7,027
See notes to consolidated statutory financial statements.
29

Massachusetts Mutual Life Insurance Company and Subsidiaries CONSOLIDATED STATUTORY STATEMENTS OF CASH FLOWS
Years Ended December 31,
2007 2006(In Millions)
Cash from operations: Premium and other income collected $ 13,819 $ 13,572 Net investment income 4,938 4,200 Benefit payments (11,878) (11,202) Net transfers to separate accounts (1,070) (1,219) Commissions and other expenses (1,839) (1,714) Dividends paid to policyholders (1,227) (1,153) Federal and foreign income taxes paid (272) (25)
Net cash from operations 2,471 2,459
Cash from investments:Proceeds from investments sold, matured, or repaid:
Bonds 15,882 15,652 Common stocks - unaffiliated 962 1,232 Mortgage loans 1,847 2,295 Real estate 382 157 Other 880 1,377
Total investment proceeds 19,953 20,713
Cost of investments acquired: Bonds (15,664) (18,194) Common stocks - unaffiliated (561) (1,205) Mortgage loans (3,311) (3,863) Real estate (189) (154) Other (2,342) (2,407)
Total investments acquired (22,067) (25,823)
Net increase in policy loans (529) (542) Net cash from investments (2,643) (5,652)
Cash from financing and other sources: Net deposits (withdrawals) on deposit-type contracts 488 (1,026) Commercial paper issued 249 - Net securities sold under agreements to repurchase 919 939 Other cash provided 151 133
Net cash from financing and other sources 1,807 46
Net change in cash, cash equivalents and short-term investments 1,635 (3,147) Cash, cash equivalents and short-term investments, beginning of year 1,015 4,162 Cash, cash equivalents and short-term investments nonadmitted (8) -Cash, cash equivalents and short-term investments, end of year $ 2,642 $ 1,015
See notes to consolidated statutory financial statements.
30

Notes to Consolidated Statutory Financial Statements
1. Nature of operations
MassMutual Financial Group (“MMFG”) is comprised of Massachusetts Mutual Life Insurance Company(“MassMutual”) and its subsidiaries. MMFG is a global, diversified financial services organization providinglife insurance, disability income insurance, long-term care insurance, annuities, retirement and savings products, investment management, mutual funds, and trust services to individual and institutional customers. MassMutual is organized as a mutual life insurance company.
2. Summary of significant accounting policies and practices
a. Basis of presentation
The consolidated statutory financial statements include the accounts of MassMutual and its wholly owned United States of America (“U.S.”) domiciled life insurance subsidiary (collectively, the “Company”): C.M. Life Insurance Company (“C.M. Life”), as well as its indirect subsidiary, MML Bay State Life InsuranceCompany, which is wholly owned by C.M. Life. Other entities comprising MMFG are accounted for under the equity method in accordance with statutory accounting principles. All intercompany transactions and balances for these consolidated entities have been eliminated. Statutory financial statements filed withregulatory authorities are not presented on a consolidated basis.
Two additional insurance subsidiaries, CM Assurance Company (“CM Assurance”) and CM Benefit Insurance Company (“CM Benefit”) had never issued any insurance policies or collected any premium. OnSeptember 29, 2006, CM Assurance and CM Benefit surrendered their Certificates of Authority and Compliance to the State of Connecticut Insurance Department. The Company liquidated these companies in the fourth quarter of 2006. The results of these subsidiaries are included in the consolidated statutory financial statements of the Company through the date of liquidation.
The consolidated statutory financial statements have been prepared in conformity with the statutoryaccounting practices of the National Association of Insurance Commissioners (“NAIC”) and the accounting practices prescribed or permitted by the Commonwealth of Massachusetts Division of Insurance (“Division”); and for the wholly owned U.S. domiciled life insurance subsidiaries, the State of Connecticut Insurance Department (“Department”).
Statutory accounting practices are different in some respects from financial statements prepared in accordance with U.S. generally accepted accounting principles (“GAAP”). The more significant differences between statutory accounting principles and GAAP are as follows: (a) certain acquisition costs,such as commissions and other variable costs, that are directly related to acquiring new business, are charged to current operations as incurred, whereas GAAP generally capitalizes these expenses and amortizes them based on profit emergence over the expected life of the policies or over the premium payment period; (b) statutory policy reserves are based upon the Commissioners’ Reserve ValuationMethod or net level premium method and prescribed statutory mortality, morbidity and interest assumptions, whereas GAAP reserves would generally be based upon the net level premium method or theestimated gross margin method, with estimates of future mortality, morbidity and interest assumptions; (c) bonds are generally carried at amortized cost, whereas GAAP generally reports bonds at fair value; (d)deferred income taxes, which provide for book versus tax temporary differences, are subject to limitation and are charged to surplus, whereas GAAP would generally include the change in deferred taxes in net income; (e) payments received for universal and variable life insurance products and variable annuities arereported as premium income and changes in reserves, whereas GAAP would treat these payments asdeposits to policyholders’ account balances; (f) majority-owned non-insurance subsidiaries and variable interest entities where the company is the primary beneficiary and certain controlled entities are accounted for using the equity method, whereas GAAP would consolidate these entities; (g) surplus notes are reportedin surplus, whereas GAAP would report these notes as liabilities; (h) assets are reported at “admitted asset” value and “nonadmitted assets” are excluded through a charge against surplus, whereas GAAP records these assets net of any valuation allowance; (i) reinsurance reserve credits are reported as a reduction of policyholders’ reserves and liabilities for deposit-type contracts, whereas GAAP would report these balances as an asset; (j) an asset valuation reserve (“AVR”) is reported as a contingency reserve to stabilizesurplus against fluctuations in the carrying value of stocks, real estate investments, partnerships, limitedliability companies (“LLCs”), and certain credit related derivative instruments as well as credit-related
31

Notes to Consolidated Statutory Financial Statements (continued)
declines in the value of bonds and mortgage loans, whereas GAAP does not record this reserve; (k) after-tax realized capital gains and losses which result from changes in the overall level of interest rates for alltypes of fixed-income investments and interest-related hedging activities are deferred into the interestmaintenance reserve (“IMR”) and amortized into revenue, whereas GAAP reports these gains and losses asrevenue; (l) changes in the fair value of derivative financial instruments are recorded as changes in surplus,whereas GAAP generally reports these changes as revenue unless deemed an effective hedge; (m)comprehensive income is not presented, whereas GAAP presents changes in unrealized capital gains and losses, minimum pension liability, and foreign currency translations as other comprehensive income; (n) embedded derivatives are recorded as part of the underlying contract, whereas GAAP would identify andbifurcate certain embedded derivatives from the underlying contract or security and account for themseparately; and (o) certain group annuity and universal life contracts which do not pass through allinvestment gains to contract holders are maintained in the separate accounts, whereas GAAP reports these contracts in the general account assets and liabilities of the Company.
The preparation of financial statements requires management to make estimates and assumptions that impact the reported amounts of assets and liabilities, the disclosure of contingent assets and liabilities as ofthe date of the consolidated statutory financial statements, and the reported amounts of revenues and expenses during the reporting periods. The most significant estimates include those used in determiningthe carrying values of investments, the liabilities for future policyholders’ reserves and deposit-typecontracts, and the amount of investment valuation reserves on mortgage loans, real estate held for sale, other-than-temporary impairments and the liability for taxes. Future events including, but not limited to, changes in the levels of mortality, morbidity, interest rates, persistency and asset valuations and defaults, could cause actual results to differ from the estimates used in the consolidated statutory financial statements. Although some variability is inherent in these estimates, management believes the amounts presented are appropriate.
b. Corrections of errors and reclassifications
In 2007, the Company recorded an adjustment that was attributable to the recognition of net investmentincome on partnerships and LLCs in a cumulative negative capital position for the years 2001 through2006. This adjustment reduced surplus by $100 million through prior period adjustments and increased surplus by $100 million through change in net unrealized capital gains, resulting in no net impact onsurplus.
In addition to the item noted above, changes to net surplus included a $5 million increase attributable to a correction of variable universal life reserves, a $5 million increase related to the reporting of tax settlements with the federal government, a $5 million increase attributable to the overstatement of the dividendaccumulation liability, a $4 million increase attributable to reinsurance rate errors, $1 million of various other adjustments, partially offset by a $5 million decrease attributable to annuity related reserves, and a $3 million decrease attributable to the establishment of a liability for postemployment benefits for employeeseverance plans.
As a result of this activity, the Company recorded, in the Consolidated Statutory Statements of Changes inSurplus, a net decrease of $88 million through prior period adjustments and an increase of $100 millionthrough the change in net unrealized capital gains.
During 2006, the Company recorded a net decrease to surplus of $114 million attributable to corrections ofprior year errors. The Company recorded $57 million through prior period adjustments, a component of changes in surplus, $41 million through the change in nonadmitted assets, and $16 million through the change in net unrealized capital gains. The $16 million decrease was attributable to a pricing error thatresulted in an overstatement in the carrying value of common stock and surplus as of December 31, 2005.
In 2006, prior period adjustments of $57 million included $18 million attributable to the establishment of a liability for post employment benefits for home office employee severance plans and $30 millionattributable to the correction in non-traditional life insurance reserves related to errors in a prior yearmortality study and mortality factors.
32

Notes to Consolidated Statutory Financial Statements (continued)
In 2006, the Company recorded tax corrections which decreased surplus by $48 million, of which $41million was recorded through surplus as a change in nonadmitted assets, and $7 million was recorded through prior period adjustments. In 2002 and 2003, the Company had incorrectly recorded its net deferredtax asset and federal income tax liability. The correction of these items to the net deferred tax asset in 2006 was nonadmitted. These errors relate to the reporting of tax settlements with the federal government and theadjustment to taxes following the submission of the Company’s 2001 federal income tax return.
Certain 2006 balances have been reclassified to conform to the current year presentation.
c. Bonds
Generally, bonds are valued at amortized cost using the constant yield interest method. Bond transactionsare recorded on a trade date basis, except for private placement bonds which are recorded on the fundingdate.
The fair value of bonds is based on values provided by the NAIC’s Securities Valuation Office (“SVO”) when available. If SVO values are not available, quoted market values provided by other third-partyorganizations are used. If quoted market values are unavailable, fair value is estimated by discounting expected future cash flows using current market rates applicable to yield, credit quality and maturity of the investment or using quoted market values for comparable investments.
For fixed income securities that do not have a fixed schedule of payments, such as asset-backed, mortgage-backed and structured securities, the effect on amortization or accretion is revalued quarterly based on the current estimated cash flows, using either the prospective or retrospective adjustment methodologies, consistently applied by type of security. Certain high quality fixed income securities follow the retrospective method of accounting. Under the retrospective method, the recalculated effective yieldequates the present value of the actual and anticipated cash flows, including new prepayment assumptions, to the original cost of the investment. Prepayment assumptions are based on borrower constraints andeconomic incentives such as the original term, age and coupon of the loan as affected by the interest rateenvironment. The current carrying value is then increased or decreased to the amount that would haveresulted had the revised yield been applied since inception, and investment income is correspondinglydecreased or increased. The Company has elected to use the book value as of January 1, 1994 as the costfor applying the retrospective adjustment method to securities purchased prior to that date. All other fixedsecurities, such as floating rate bonds and interest only securities follow the prospective method of accounting. Under the prospective method, the recalculated future effective yield equates the carrying value of the investment to the present value of the anticipated future cash flows.
Portfolios of asset-backed securities, including residential mortgage-backed securities, are evaluated on a periodic basis using scenarios customized by collateral type, performing sensitivity analysis on defaults as loan to values change, and on defaults as prepayments change using default curves under various scenarios. We combine scenario analysis with a monthly surveillance process in which we compare actual delinquencies and defaults to expectations established at the time securities are acquired and expectationsconsidering current market conditions, and perform a statistical review of troubled loan exposures to creditsupport on a transaction-by-transaction basis.
Management utilized a combination of external vendor prices, broker quotations and internal models for purposes of deriving fair value. Internal inputs used in the determination of fair value included estimates of prepayment speeds, default rates, discount rates, collateral values and cash flow priority, among others.Fair values resulting from internal models are those expected to be paid by a willing market participant.
The carrying values of bonds, mortgage-backed and asset-backed securities are written down to fair value when a decline in value is considered to be other-than-temporary. The Company considers the followingfactors in the evaluation of whether a non-interest related decline in value is other-than-temporary: (a) the financial condition and near-term prospects of the issuer; (b) the likelihood that the Company will be ableto collect all amounts due according to the contractual terms of a debt security in effect at the date ofacquisition; (c) the Company’s ability and intent to hold the investment for a period of time sufficient toallow for an anticipated recovery in value; and (d) the period and degree to which the market value has been below cost. The Company considers the following factors in the evaluation of whether an interest
33

Notes to Consolidated Statutory Financial Statements (continued)
related decline in value is other-than-temporary: (a) the Company’s near-term intent to sell; (b) theCompany’s contractual and regulatory obligations; and (c) the Company’s ability to hold the investmentuntil anticipated recovery of the cost of the investment. The Company conducts a quarterly managementreview of all bonds including those in default, not-in-good standing, or valued below 80% of cost. The Company also considers other qualitative and quantitative factors in determining the existence of other-than-temporary impairments including, but not limited to, unrealized loss trend analysis and significant short-term changes in value. If the impairment is other-than-temporary, a direct write-down is recognized in realized capital losses and a new cost basis is established.
d. Preferred stocks
Generally, preferred stocks in good standing are valued at amortized cost. Preferred stocks not in goodstanding are valued at the lower of amortized cost or fair value. Fair values of preferred stocks are basedon published market values, where available. For preferred stocks without readily ascertainable market values, the Company has determined an estimated fair value using broker-dealer quotations or internalmodels.
e. Common stocks - subsidiaries and affiliates
Common stocks of unconsolidated subsidiaries, including MassMutual Holding LLC (“MMHLLC”), areaccounted for using the equity method. The Company accounts for the value of its investment in its subsidiary, MMHLLC, at its underlying GAAP net equity, adjusted for certain nonadmitted assets.Operating results, less dividend distributions, for MMHLLC are reflected as net unrealized capital gains inthe Consolidated Statutory Statements of Changes in Surplus. Dividend distributions by MMHLLC arerecorded in net investment income. Dividend distributions to the Company are limited to MassMutual’sequity in MMHLLC. The cost basis of common stocks - subsidiaries and affiliates is adjusted for impairments deemed to be other-than-temporary and the impairment policy is consistent with commonstocks - unaffiliated.
f. Common stocks - unaffiliated
Common stocks, including warrants, are valued at fair value with unrealized capital gains and losses included as a change in surplus. Common stock transactions are recorded on a trade date basis.
The fair value of common stocks is based on values provided by the SVO when available. If SVO values are not available, quoted market values provided by other third-party organizations are used. If quotedmarket values are unavailable, fair value is estimated by using internal models.
The cost basis of common stocks is adjusted for impairments deemed to be other-than-temporary. The Company considers the following factors in the evaluation of whether a decline in value is other-than-temporary: (a) the financial condition and near-term prospects of the issuer; (b) the Company’s ability and intent to hold the investment for a period of time sufficient to allow for an anticipated recovery in value;and (c) the period and degree to which the value has been below cost. The Company conducts a quarterly management review of issuers whose common stock is not-in-good standing or valued below 80% of cost. The Company also considers other qualitative and quantitative factors in determining the existence of other-than-temporary impairments including, but not limited to, unrealized loss trend analysis andsignificant short-term changes. If the impairment is other-than-temporary, a direct write-down to fair value is recognized in realized capital losses and a new cost basis is established.
g. Mortgage loans
Mortgage loans are valued at the unpaid principal balance of the loan, net of unamortized premium and discount, non-refundable commitment fees and mortgage interest points, and valuation allowances. Themortgage loan portfolio is comprised of commercial mortgage loans, including mezzanine loans, and residential mortgage loan pools. Mezzanine loans are loans secured by a pledge of direct or indirect equity interest in an entity that owns real estate. Residential mortgage loan pools are pools of homogeneousresidential mortgage loans substantially backed by Federal Housing Administration and VeteransAdministration guarantees.
34

Notes to Consolidated Statutory Financial Statements (continued)
The fair value of mortgage loans is estimated by discounting expected future cash flows using currentinterest rates for similar loans with similar credit risk. For non-performing loans, the fair value is the estimated collateral value of the underlying real estate.
When, based upon current information and events, it is probable that the Company will be unable to collectall amounts of principal and interest due according to the contractual terms of the mortgage loan agreement,a valuation allowance is established for the excess of the carrying value of the mortgage loan over its fair value. Collectibility and estimated recoveries are assessed on a loan-by-loan basis considering all events and conditions relevant to the loan. This evaluation is inherently subjective as it requires estimates that aresusceptible to significant revisions as more information becomes available, as changes occur in the marketor as negotiations with the borrowing entity evolve. Changes to the valuation allowance are recorded as unrealized capital losses in surplus.
When an event occurs resulting in an impairment that is other-than-temporary, a direct write-down isrecognized in realized capital losses and a new cost basis is established. An impairment is deemed other-than-temporary when foreclosure proceedings or other procedures leading to the acquisition of thecollateral are initiated, the acquisition of the collateral is probable, and a reasonable estimate of the collateral value has been determined.
Interest income earned on impaired loans is accrued on the outstanding principal balance of the loan based on the loan’s contractual coupon rate. Interest is not accrued for impaired loans more than 60 days past due, for loans delinquent more than 90 days, or when collection is improbable. The Company continuallymonitors mortgage loans where the accrual of interest has been discontinued, and will resume the accrual of interest on a mortgage loan when the facts and circumstances of the borrower and property indicate that the payments will continue to be received per the terms of the original mortgage loan agreement or modified mortgage loan agreement.
h. Policy loans
Policy loans are carried at the outstanding loan balance less amounts unsecured by the cash surrender value of the policy. At issuance, policy loans are fully secured by the cash surrender value of the policy.Unsecured amounts can occur when subsequent charges are incurred on the underlying policy without the receipt of additional premium. Unsecured amounts were $1 million as of December 31, 2007 and 2006,which were non-admitted. Policy loans earn interest calculated based upon either a fixed or a variableinterest rate. Variable rate policy loans are adjusted at least annually and their fair value approximates the carrying value. For loans issued with a fixed interest rate, fair value is estimated by discounting expected future cash flows using current interest rates for similar loans with similar credit risk. Accrued investmentincome on policy loans more than 90 days past due is included in the unpaid balance of the policy loan.
i. Real estate
Investment real estate, which the Company has the intent to hold for the production of income, and real estate occupied by the Company are carried at depreciated cost, less encumbrances. Depreciated cost is adjusted for impairments whenever events or changes in circumstances indicate the carrying amount of theasset may not be recoverable, with the impairment being included in realized capital losses. Depreciation iscalculated using the straight-line method over the estimated useful life of the real estate holding, not toexceed 40 years. Depreciation expense is included in net investment income.
Real estate held for sale is carried at the lower of depreciated cost or fair value, less selling costs. Real estate classified as held for sale is not depreciated. Adjustments to the carrying value of real estate held for sale are recorded when fair value less selling costs is below depreciated cost and are included in realized capital losses.
Real estate acquired in satisfaction of debt is recorded at the lower of cost or fair value at the date of foreclosure.
35

Notes to Consolidated Statutory Financial Statements (continued)
Fair value is generally estimated using the present value of expected future cash flows discounted at a ratecommensurate with the underlying risks. The Company also obtains external appraisals for a rotatingsample of properties on an annual basis.
j. Partnerships and limited liability companies
Partnerships and LLCs, except for investments in partnerships which generate low income housing taxcredits (“LIHTC”), are accounted for using the equity method with the change in the equity value of the underlying investment recorded in surplus. When it appears probable that the Company will be unable torecover the outstanding carrying value of an investment, or there is evidence indicating an inability of the investee to sustain earnings to justify the carrying value of the investment, an other-than-temporaryimpairment is recognized in realized capital losses for the excess of the carrying value over the estimated fair value of the investment. The estimated fair value is determined by assessing the value of the partnership or LLC’s underlying assets, cash flow, current financial condition and other market factors.Distributions not deemed to be a return of capital are recorded in net investment income when received provided there are undistributed earnings in the partnerships or LLCs.
Investments in partnerships, which generate LIHTCs, are carried at amortized cost unless consideredimpaired. Under the amortized cost method, the excess of the carrying value of the investment over itsestimated residual value is amortized into income during the period in which tax benefits are allocated. For determining impairments in partnerships which generate LIHTC, the Company uses the present value of all future benefits, the majority of which are tax credits, discounted at the risk-free rate of 4.25% and comparesthe result to its current book value. Impairments are recognized as realized capital losses.
k. Derivatives and other invested assets
Derivatives and other invested assets consist of investments in derivative financial instruments and othermiscellaneous investments.
The Company uses derivative financial instruments in the normal course of business to manage risks, primarily to reduce interest rate and duration imbalances determined in asset/liability analyses. The Company also uses a combination of derivatives and fixed income investments to create syntheticinvestment positions. These combined investments are created opportunistically when they are economically more attractive than the replicated instrument or when the replicated instrument is unavailable. Some of the synthetic assets are considered replicated asset transactions as defined under statutory accounting principles. The Company’s derivative strategy employs a variety of derivativefinancial instruments, including interest rate swaps, currency swaps, equity and credit default swaps, options, interest rate caps and floors, forward contracts, and financial futures. Investment risk is assessed ona portfolio basis and individual derivative financial instruments are not designated in hedging relationships;therefore, as allowed by accounting rules, the Company specifically and intentionally made the decision notto apply hedge accounting.
Derivative financial instruments are carried at estimated fair value, which is based primarily upon quotations obtained from independent sources. Changes in the fair value of these instruments are recordedas unrealized capital gains and losses in surplus. Gains and losses realized on the termination, closing orassignment of contracts are recorded as realized capital gains and losses. Amounts receivable and payable are accrued.
l. Cash, cash equivalents and short-term investments
The Company considers all highly liquid investments purchased with maturities of three months or less tobe cash and cash equivalents.
Short-term investments, which are carried at amortized cost, consist of all highly liquid investments purchased with maturities of greater than three months and less than or equal to 12 months. Investments inmoney market mutual funds and securities purchased under agreements to resell are classified as short-terminvestments.
36

Notes to Consolidated Statutory Financial Statements (continued)
The Company has entered into contracts for securities purchased under agreements to resell whereby theCompany purchases securities and simultaneously agrees to resell the same or substantially the samesecurities. Securities purchased under agreements to resell are accounted for as collateralized loans, with the cash paid for the securities included in the Consolidated Statutory Statements of Cash Flows as a short-term investment. The underlying securities are not recorded as investments owned by the Company, butinstead serve as collateral related to these short-term investments. The difference between the amount paidand the amount at which the securities will be subsequently resold is reported as interest income in netinvestment income. At purchase, the Company requires collateral in the form of securities having a fair value of a minimum of 102% of the securities’ purchase price. If at anytime the fair value of the collateraldeclines to less than 100% of the securities’ purchase price, the counterparty is obligated to provideadditional collateral to bring the total collateral held by the Company to at least 102% of the securities’ purchase price.
The carrying value for these instruments approximates the fair value reported in the Consolidated Statutory Statements of Financial Position.
m. Securities lending
The Company participates in securities lending whereby certain securities are loaned to third-party brokers. The lending is either fee-based with securities as collateral or requires cash collateral. The Company retains control over loaned securities, which remain assets of the Company, and are not removed from the accounting records. The Company has the ability to sell the securities while on loan and has the right to terminate a lending agreement at any time without penalty.
Under fee-based lending, the Company’s policy requires that a minimum of 102% of the fair value of the loaned securities be held in securities separately at third-party institutions as collateral. The collateral may include U.S. Treasury securities, agency bonds, agency mortgage-backed securities and investment gradecorporate bonds. If at any time the fair value of the collateral declines to less than 102% of the loaned securities’ fair value, the counterparty is obligated to provide additional collateral to bring the total collateral held on behalf of the Company to at least 102% of the loaned securities’ fair value. The Company does not record or have use of the collateral. Fees received for loaning the securities, net of directexpenses, are recorded in net investment income.
Under cash collateral lending, the Company’s policy requires a minimum of 102% of the fair value of theloaned securities be held in cash collateral, which is recorded in other liabilities as a payable and in assets as cash on the Consolidated Statutory Statements of Financial Position. Interest received on investment ofthe cash collateral, net of a rebate rate paid to the borrower, is recorded in net investment income.
n. Investment income due and accrued
Accrued investment income consists primarily of interest and dividends. Interest is recognized on an accrual basis and dividends are recorded as earned on the ex-dividend date. Due and accrued income is notrecorded on: (a) bonds in default; (b) impaired bonds and mortgage loans more than 60 days past due; (c) bonds and mortgage loans delinquent more than 90 days or where collection of interest is improbable; (d)rent in arrears for more than 90 days; and (e) policy loan interest due and accrued in excess of the cashsurrender value of the underlying contract.
o. Other than invested assets
Other than invested assets primarily includes deferred and uncollected premium, deferred taxes,reinsurance recoverables, fixed assets, and goodwill.
Fixed assets are included in other than invested assets at cost less accumulated depreciation and amortization. Depreciation is determined using the straight-line method over the estimated useful lives of the assets. Estimated lives range from one to ten years for leasehold improvements and three to ten years for all other fixed assets. Most unamortized software and office equipment are nonadmitted assets.
37

Notes to Consolidated Statutory Financial Statements (continued)
Goodwill, which consists of a management contract assumed when the ownership of an affiliate was transferred to the Company in 2006, was $3 million, net of accumulated amortization of $8 million, as of December 31, 2007. The goodwill will be amortized as unrealized capital losses through 2008. In those instances when goodwill results from the purchase of a subsidiary, it shall be amortized as unrealizedcapital losses over the period in which the acquiring entity benefits economically, not to exceed ten years. Alternatively, had the goodwill resulted from certain types of assumption reinsurance it would be amortized to operations over the period in which the assuming entity benefits economically, not to exceed ten years.
Deferred premium and uncollected premium are included in other than invested assets. Deferred premiumis the portion of premium not earned at the reporting date, net of loading. Loading is an amount obtainedby subtracting the net premium from the gross premium and generally includes allowances for acquisition costs and other expenses. Deferred premium adjusts for the overstatement created in the calculation of reserves as the reserve computation assumes the entire year’s net premium is collected annually at the beginning of the policy year and does not take into account installment or modal payments.
Uncollected premium is gross premium that is due and unpaid as of the reporting date, net of loading. Netpremium is the amount used in the calculation of reserves. The change in loading is included as an expense and is not shown as a reduction to premium income.
Ordinary new business and ordinary renewal business consist of the basic amount of premium required onthe underlying life and annuity individual insurance policies.
p. Nonadmitted assets
Assets designated as nonadmitted by the NAIC include furniture, certain electronic data processingequipment, unamortized software, the amount of the deferred tax asset that will not be realized by the end of the next calendar year, the pension plan asset, the interest maintenance reserve in a net asset position, certain investments in partnerships for which audits are not performed, certain intangible assets, certainother receivables, advances and prepayments, and related party amounts outstanding greater than 90 daysfrom the due date. Such amounts are excluded from the Consolidated Statutory Statements of FinancialPosition.
q. Separate accounts
Separate account assets and liabilities represent segregated funds administered and invested by theCompany for the benefit of individual and group variable annuity, variable life and other insurance policyholders to meet specific investment objectives. Separate account assets consist principally ofmarketable securities reported at fair value and are not available to satisfy liabilities that arise from anyother business of the Company. The Company receives administrative and investment advisory fees fromthese accounts.
Separate accounts reflect two categories of risk assumption: non-guaranteed separate accounts for whichthe policyholder assumes the investment risk; and guaranteed separate accounts for which the Company contractually guarantees either a minimum return or minimum account value to the policyholder. Premiumincome, benefits and expenses of the separate accounts are included in the Consolidated Statutory Statements of Income. Investment income and realized and unrealized capital gains and losses on the assets of separate accounts accrue to policyholders and, accordingly, are not recorded in the Consolidated Statutory Statements of Income.
The Company may transfer investments from the general account to seed separate accounts. Investments transferred to separate accounts are transferred at fair market value on the date the transaction occurs. Gains related to the transfer are deferred to the extent that the Company maintains a proportionate interest in the separate account. The deferred gain is recognized as the Company’s ownership decreases or when the separate account sells the underlying asset during the normal course of business. Losses associated with these transfers are recognized immediately.
38

Notes to Consolidated Statutory Financial Statements (continued)
r. Policyholders’ reserves
Policyholders’ reserves provide amounts adequate to discharge estimated future obligations in excess ofestimated future premium on policies in force.
Reserves for life insurance contracts are developed using accepted actuarial methods computed principally on the net level premium and the Commissioners’ Reserve Valuation Method bases using the AmericanExperience and the 1941, 1958, 1980 and 2001 Commissioners’ Standard Ordinary mortality tables withassumed interest rates. Reserves for disability riders associated with life contracts are calculated usingmorbidity rates from the 1952 Period 2 Intercompany Disability Table.
Reserves for individual annuities are developed using accepted actuarial methods computed principally under the Commissioners’ Annuity Reserve Valuation Method using applicable interest rates and mortalitytables, primarily, 1971 and 1983 Individual Annuity Mortality, 1994 Minimum Guaranteed Death Benefit, and Annuity 2000.
Disability income policy reserves are generally calculated using the two year preliminary term, net level premium and fixed net premium methods, and actuarially accepted morbidity tables using the 1964 Commissioners’ Disability Table and the 1985 Commissioners’ Individual Disability Table A with assumed interest rates in accordance with applicable statutes and regulations.
Disabled life claim reserves are generally calculated using actuarially accepted methodology and actuarially accepted morbidity tables using the 1964 Commissioners’ Disability Table and 1985 Commissioners’ Individual Disability Tables A and C with assumed interest rates in accordance withapplicable statutes and regulations.
Unpaid claims and claim expense reserves are related to disability and long-term care claims with long-tailpayouts. Unpaid disability claim liabilities are projected based on the average of the last three disabilitypayments paid prior to the valuation date. Claim expense reserves are based on an analysis of the unitexpenses related to the processing and examination of new and ongoing claims. Interest accrued onreserves is calculated by applying NAIC prescribed interest rates to the average reserves by incurral year.
Tabular interest, tabular less actual reserves released, and tabular cost for all life and annuity contracts and supplementary contracts involving life contingencies are determined in accordance with NAIC annualstatement instructions. Traditional life, permanent and term products use a formula that applies a weighted-average interest rate determined from a seriatim valuation file to the mean average reserves. Universal life, variable life, group life insurance, annuity and supplemental contracts use a formula which applies a weighted-average credited rate to the mean account value.
The Company waives deduction of deferred fractional premium at death and returns any portion of the finalpremium beyond the date of death. Reserves are computed using continuous functions to reflect these practices.
The same reserve methods applied to standard policies are used for substandard reserve calculations that are based on a substandard mortality rate (a multiple of standard reserve tables).
The Company had total life insurance in force of $421,997 million and $402,480 million as of December31, 2007 and 2006, respectively. Of this total, the Company had $43,448 million and $42,286 million of life insurance in force as of December 31, 2007 and 2006, respectively, for which the gross premium was less than the net premium according to the standard valuation set by the Division and the Department. The gross premium is less than the net premium needed to establish the reserves because the statutory reservesmust use industry standard mortality tables, while the gross premium calculated in pricing uses mortality tables that reflect both the Company’s experience and the transfer of mortality risk to reinsurers.
Certain variable universal life and universal life products issued by the Company offer guaranteed minimum death benefits (“GMDBs”). GMDBs provide a death benefit if the contract holder dies and thecontract value is less than a guaranteed amount specified in the contract. This amount is based on the premium paid less amounts withdrawn or contract value on a specified anniversary date. The liability for
39

Notes to Consolidated Statutory Financial Statements (continued)
GMDBs is included in policyholders’ reserves and the related change in this liability is included in changein policyholders’ reserves.
Certain individual variable annuity products issued by the Company offer GMDBs and guaranteed living benefits (“VAGLBs”). The primary types of VAGLBs offered by MassMutual are guaranteed minimum accumulation benefits (“GMABs”) and guaranteed minimum income benefits (“GMIBs”). The liabilitiesfor GMDBs and VAGLBs are included in policyholders’ reserves and the related changes in theseliabilities are included in change in policyholders’ reserves. The Company’s GMDB and VAGLB reserves are calculated in accordance with actuarial guidelines.
Annuity GMDBs provide a death benefit if the contract value is less than the guaranteed minimum amount.Some contracts provide that guarantee upon the contract owner’s death while others provide it upon the annuitant’s death. This amount may be based on a return of premium (the premium paid less amountswithdrawn), a roll-up (an accumulation of premium at a specified interest rate adjusted for withdrawals), areset (the contract value on a specified anniversary date adjusted for subsequent withdrawals, which isallowed to decrease when reset), or a ratchet (the contract value on a specified anniversary date adjusted for subsequent withdrawals, which is never allowed to decrease when reset). For an annuity contract, a declinein the stock market causing the contract value to fall below the specified amount will increase the netamount at risk, which is the GMDB in excess of the contract value.
In general, VAGLBs require adherence to limitations required by a Company approved asset allocation strategy. Election of a VAGLB is generally only available at contract issue.
GMABs provide the annuity contract holder with a guaranteed minimum account value at the end of the products guarantee period. If the account value is below that guarantee at the end of the period, the account value is increased to the guaranteed level and the contract continues from that point. Options for the guarantee period are ten and 20 years.
GMIBs provide the annuity contract holder with a guaranteed minimum payment when the contract is annuitized. The GMIB would be beneficial to the contract holder if the contract holder’s account valuewould otherwise not provide a higher annuitization value using currently offered rates at the time ofannuitization.
All policyholders’ reserves and accruals are based on the various estimates discussed previously and are presented net of reinsurance. Management believes that these liabilities and accruals will be sufficient, in conjunction with future revenues, to meet future anticipated obligations of policies and contracts in force.
s. Liabilities for deposit-type contracts
Reserves for funding agreements, dividend accumulations, premium deposit funds, investment-typecontracts such as supplementary contracts not involving life contingencies, and certain structuredsettlement annuities are based on account value or accepted actuarial methods using applicable interest rates. Fair value is estimated by discounting expected future cash flows using current market rates.
t. Policyholders’ dividends
The liability for policyholders’ dividends includes the estimated amount of annual dividends and settlement dividends expected to be paid to policyholders in the following year. Policyholders’ dividends incurred are recorded in the Consolidated Statutory Statements of Income. Dividends expected to be paid topolicyholders in the following year are approved annually by MassMutual’s Board of Directors. The allocation of these dividends to policyholders reflects the relative contribution of each group of participating policies to surplus and considers, among other factors, investment returns, mortality andmorbidity experience, expenses, and income tax charges. Settlement dividends are an extra dividend payable at termination of a policy upon maturity, death, or surrender.
40

Notes to Consolidated Statutory Financial Statements (continued)
u. Asset valuation reserve
The Company maintains an asset valuation reserve (“AVR”). The AVR is a contingency reserve to stabilize surplus against fluctuations in the statement value of common stocks, real estate investments,partnerships and LLCs as well as credit-related declines in the value of bonds, mortgage loans, and certainderivatives. The AVR is reported in the Consolidated Statutory Statements of Financial Position and the change in AVR is reported in the Consolidated Statutory Statements of Changes in Surplus.
v. Securities sold under agreements to repurchase
The Company has entered into contracts for securities sold under agreements to repurchase whereby the Company sells securities and simultaneously agrees to repurchase the same or substantially the samesecurities. Securities sold with agreement to repurchase are accounted for as collateralized borrowings with the proceeds from the sale of the securities recorded as a liability and the underlying securities recorded as an investment by the Company. Earnings on these investments are recorded as investment income and the difference between the proceeds and the amount at which the securities will be subsequently reacquired is amortized as interest expense, a component of investment expense which is reported in net investment income on the Consolidated Statutory Statements of Income.
The Company provides collateral, as dictated by the agreements, to the counterparty in exchange for a loan amount. If the fair value of the securities sold becomes less than the loan amount, the counterparty may require additional collateral.
w. Other liabilities
Other liabilities primarily include liabilities related to collateral held on derivative contracts, other payable items, and amounts held for agents.
x. Commercial paper
The Company issues commercial paper in the form of unsecured notes in minimum denominations of $250thousand up to a total aggregation of $1 billion. These Notes have maturities up to a maximum of 270 daysfrom the date of issue and are sold at par less a discount representing an interest factor or, if interestbearing, at par. The Notes are not redeemable or subject to voluntary prepayments by the Company.Interest on the Notes is calculated using a 360-day year based on the actual number of days elapsed.Commercial paper is reported as a liability on the Company's Consolidated Statement of Financial Position.Due to the short-term nature of the Notes, the carrying value is assumed to approximate fair value.
y. Participating contracts
Participating contracts issued by the Company represented 63% and 62% of the Company’s policyholders’reserves and liabilities for deposit-type contracts as of December 31, 2007 and 2006, respectively.
z. Reinsurance
The Company enters into reinsurance agreements with other insurance companies in the normal course ofbusiness in order to limit its insurance risk. Such transfers do not relieve the Company of its primary liability and, as such, failure of reinsurers to honor their obligations could result in losses. The Company reduces this risk by evaluating the financial condition of reinsurers and monitoring for possible concentrations of credit risk. Premium income, benefits to policyholders, and policyholders’ reserves are stated net of reinsurance. Premium, benefits and reserves related to reinsured business are accounted for onbases consistent with those used in accounting for the original policies issued and the terms of thereinsurance contracts. The Company records a receivable for reinsured benefits paid and reducespolicyholders’ reserves for the portion of insurance liabilities that are reinsured. Commissions and expense allowances on reinsurance ceded and modified coinsurance reserve adjustments on reinsurance ceded arerecorded as revenue.
41

Notes to Consolidated Statutory Financial Statements (continued)
aa. Premium and related expense recognition
Life insurance premium revenue is generally recognized annually on the anniversary date of the policy andexcess premium for flexible products is recognized when received. Annuity premium is recognized asrevenue when received. Disability income premium is recognized as revenue when due. Commissions and other costs related to issuance of new policies, and policy maintenance and settlement costs are charged tocurrent operations when incurred. Surrender fee charges on certain life and annuity products are recorded as a reduction of benefits and expenses.
bb. Realized and unrealized capital gains and losses
Realized capital gains and losses, net of taxes, exclude gains and losses deferred into the interest maintenance reserve (“IMR”) and gains and losses of the separate accounts. Realized capital gains andlosses are recognized in net income and are determined using the specific identification method.
All after-tax realized capital gains and losses which result from changes in the overall level of interest ratesfor all types of fixed-income investments and interest-related derivative activities are deferred into the IMRand amortized into revenue. These interest-related gains and losses are amortized into net investment income using the grouped method over the remaining life of the investment sold or, in the case ofderivative financial instruments, over the remaining life of the underlying asset.
Unrealized capital gains and losses are recorded as a change in surplus.
3. New accounting standards
Adoption of new accounting standards
In December 2007, the NAIC issued Statement of Statutory Accounting Principles (“SSAP”) No. 97, “Investments in Subsidiary, Controlled and Affiliated Entities (“SCAs”), A Replacement of SSAP No. 88.”SSAP No. 97 made clarifications and provided additional guidance to SSAP No. 88. The most significantclarification was related to the requirement that SCAs, including downstream noninsurance holding companies, receive an unqualified U.S. GAAP opinion or receive an unqualified opinion on financial statements prepared inaccordance with a foreign GAAP that includes an audited footnote reconciliation of the foreign GAAP to U.S. GAAP to be admitted assets. A limited exception to this audit requirement was provided to downstream noninsurance holding companies, which would allow the downstream noninsurance holding company not to be audited when certain requirements are met. Provided that the entities owned by an unaudited downstream noninsurance holding company receive U.S. GAAP audits, they are permitted to be an admitted asset. Assets of an unaudited downstream holding company would be nonadmitted. This statement is effective for fiscal year 2007. The adoption of this statement did not result in an impact on the Company.
In December 2006, the NAIC issued SSAP No. 96, “Settlement Requirements for Intercompany Transactions, An Amendment to SSAP No. 25 – Accounting for and Disclosures about Transactions with Affiliates and Other Related Parties” with an effective date of January 1, 2007. This statement establishes a statutory aging threshold for admission of loans and advances to related parties outstanding as of the reporting date. In addition, this statement establishes an aging threshold for admission of receivables associated with transactionsfor services provided to related parties outstanding as of the reporting date. SSAP No. 96 requires thattransactions between related parties be in writing and that written agreements provide for the timely settlementof amounts owed, with a specific due date. Amounts outstanding greater than 90 days from the due date are required to be nonadmitted. Adoption of this statement did not result in an impact to the Company’sconsolidated financial condition or results of operations.
In September 2006, the NAIC issued SSAP No. 95, “Exchanges of Nonmonetary Assets, A Replacement of SSAP No. 28 – Nonmonetary Transactions” with an effective date of January 1, 2007. SSAP No. 95 establishes statutory accounting principles for nonmonetary transactions. Specific statutory requirements for certain types of nonmonetary transactions are addressed in other statements. Accounting for nonmonetary transactions shallgenerally be based on the fair values of the assets or services involved. Adoption of this statement did not result in an impact to the Company’s consolidated financial condition or results of operations.
42

Notes to Consolidated Statutory Financial Statements (continued)
4. Investments
The Company maintains a diversified investment portfolio. Investment policies limit concentration in any assetclass, geographic region, industry group, economic characteristic, investment quality, or individual investment.
a. Bonds
The carrying value and fair value of bonds were as follows:
December 31, 2007 Gross Gross
Carrying Unrealized Unrealized Fair Value Gains Losses Value
(In Millions)
U. S. government $ 4,978 $ 389 $ 4 $ 5,363 All other governments 123 24 - 147 States, territories and possessions 36 - 1 35 Special revenue 4,470 62 19 4,513 Public utilities 1,641 50 20 1,671Industrial and miscellaneous 29,639 727 652 29,714Credit tenant loans 198 11 - 209 Parent, subsidiaries and affiliates 2,551 6 82 2,475
Total $ 43,636 $ 1,269 $ 778 $ 44,127
December 31, 2006 Gross Gross
Carrying Unrealized Unrealized Fair Value Gain s Losses Value
(In Millions)
U. S. government $ 4,738 $ 224 $ 12 $ 4,950 All other governments 101 21 - 122 States, territories and possessions 36 - 1 35 Special revenue 5,415 58 47 5,426 Public utilities 1,628 47 23 1,652Industrial and miscellaneous 29,644 655 301 29,998Credit tenant loans 216 12 - 228 Parent, subsidiaries and affiliates 2,198 5 118 2,085
Total $ 43,976 $ 1,022 $ 502 $ 44,496
The table below sets forth the Securities Valuation Office ratings for the bond portfolio along with what theCompany believes were the equivalent rating agency designations:
December 31, 2007 2006
NAIC Equivalent Rating Carrying % of Carrying % ofClass Agency Designation Value Total Value Total
($ In Millions)
1 Aaa/Aa/A $ 29,244 67% $ 29,559 67% 2 Baa 10,376 24 10,571 24 3 Ba 1,783 4 1,854 4 4 B 1,748 4 1,464 3 5 Caa and lower 410 1 305 1 6 In or near default 75 - 223 1
Total $ 43,636 100% $ 43,976 100%
43

Notes to Consolidated Statutory Financial Statements (continued)
As a result of the continuing decline in the credit markets, certain bonds may have a credit quality which is lower than the December 31, 2007 NAIC class and equivalent rating agency designations in the abovetable.
The following table summarizes the carrying value and fair value of bonds as of December 31, 2007 bycontractual maturity. Expected maturities may differ from contractual maturities because borrowers may have the right to call or prepay obligations with or without prepayment penalties. Securities that are notdue on a single maturity date are included as of the final maturity.
Carrying Fair Value Value
(In Millions)
Due in one year or less $ 1,900 $ 1,895 Due after one year through five years 9,224 9,396 Due after five years through ten years 12,124 12,242Due after ten years 20,388 20,594
Total $ 43,636 $ 44,127
The proceeds from sales, gross realized capital gain and loss activity on sales and other-than-temporaryimpairments on bonds were as follows:
Years Ended December 31, 2007 2006
(In Millions)
Proceeds from sales $ 4,763 $ 7,356 Gross realized capital gains on sales 102 93Gross realized capital losses on sales (48) (92) Other-than-temporary impairments (538) (36)
Of the $538 million of other-than-temporary impairments, 47% were determined based on internally developed models.
Portions of realized capital gains and losses which were determined to be interest related were deferred intothe IMR.
The book values of investments are written down when a decline in value is considered to be other-than-temporary. Through December 31, 2007, the Company recognized $538 million of impairment losses. TheCompany employs a systematic methodology to evaluate other-than-temporary impairments. The methodology to evaluate declines in value utilizes a quantitative and qualitative process ensuring that available evidence concerning the declines is evaluated in a disciplined manner.
44

Notes to Consolidated Statutory Financial Statements (continued)
The following is an analysis of the fair values and gross unrealized losses aggregated by bond category and length of time that the securities were in a continuous unrealized loss position as of December 31, 2007 and2006.
December 31, 2007 Less than 12 months 12 months or longer
Fair Unrealized Number
of Fair Unrealized Number
of Value Losses Issuers Value Losses Issuers
($ In Millions)
U. S. government $ 222 $ 1 9 $ 160 $ 3 120 All other governments 25 - 1 2 - 1 States, territories and possessions - - 2 33 1 3 Special revenue 716 1 37 986 18 101 Public utilities 163 3 62 408 17 100Industrial and miscellaneous 8,545 422 1,848 5,812 217 835 Credit tenant loans 50 - 4 - - - Parent, subsidiaries and affiliates 461 62 20 55 1 3
Total $ 10,182 $ 489 1,983 $ 7,456 $ 257 1,163Note – The unrealized losses in this table do not include $40 million of unrealized losses related to foreigncurrency amounts recorded in surplus, but do include $8 million of unrealized losses on NAIC category 6 bonds.
For industrial and miscellaneous the majority of the unrealized losses less than 12 months as of December31, 2007 were in residential mortgage-backed securities and resulted from the widening of credit spreads and the continuing decline in the credit markets. Deterioration of underlying collateral or downgrades ofcredit ratings may lead to further declines in value.
December 31, 2006 Less than 12 months 12 months or longer
Fair Unrealized Number
of Fair Unrealized Number
of Value Losses Issuers Value Losses Issuers
($ In Millions)
U. S. government $ 624 $ 3 53 $ 242 $ 8 153 All other governments - - - - - - States, territories and possessions - - - 34 1 3 Special revenue 1,604 15 45 1,088 32 109 Public utilities 187 2 35 607 22 65Industrial and miscellaneous 4,905 65 594 7,323 255 564 Credit tenant loans 39 - 4 25 - 3 Parent, subsidiaries and affiliates 121 114 7 91 1 4
Total $ 7,480 $ 199 738 $ 9,410 $ 319 901Note – The unrealized losses in this table do not include $6 million of unrealized losses related to foreign currencyamounts recorded in surplus, but do include $22 million of unrealized losses on NAIC category 6 bonds.
For U.S. government and special revenue investments, the unrealized losses as of December 31, 2006 wereprimarily caused by increases in interest rates since original purchase. The unrealized loss for a period of 12 months or more for special revenue investments amounted to $32 million. These investments are of thehighest credit quality rating and are backed by the U.S. government or government sponsored agencies. For U.S. governments, $8 million was in an unrealized loss position for a period of 12 months or more. Thecontractual terms of these investments are guaranteed by the full faith and credit of the U.S. government and cannot be settled for less than par at maturity.
For industrial and miscellaneous and public utilities, the majority of the unrealized losses as of December31, 2006 were due to changes in interest rates and were spread across multiple industry sectors with no
45

Notes to Consolidated Statutory Financial Statements (continued)
single sector experiencing a disproportionate amount of losses as compared to other sectors. For these investments, $277 million was in an unrealized loss position for a period of 12 months or more.
Based on the Company’s policies for the evaluation of impairments discussed in Note 2c, the Company didnot consider these investments to be other-than-temporarily impaired as of December 31, 2007 and 2006.
The Company did not sell any securities with the NAIC’s designation 3 or below during the year ended December 31, 2007 that were reacquired within 30 days of the sale date. For the year ended December 31, 2006, the Company had one wash sale transaction of an NAIC 3 rated bond with a book value of $1million. The cost of the repurchased security and the gain on the transaction were less than $1 million.
The Company had assets in the amount of $50 million and $34 million as of December 31, 2007 and 2006, respectively, which were on deposit with government authorities or trustees as required by law.
Residential mortgage-backed securities
The Company holds certain investments backed by pools of residential mortgages. The majority of these investments are included in bonds. The mortgages in these pools have varying risk characteristics and arecommonly categorized as being of U.S. Government agency and non-agency prime, Alt-A and subprimeborrower quality. The mortgage collateral classified as U.S. Government agency is considered of lowest relative risk while those classified as subprime are of the highest relative risk. Of the $29,639 million ofindustrial and miscellaneous bonds, the Company had $13,191 million of residential mortgage-backedsecurities (“RMBS”) of which $8,145 million was prime, $3,731 million was Alt-A and $1,315 million was subprime. The Alt-A category includes option adjustable rate mortgages and subprime investments include"scratch and dent" pools, high loan to value pools, and pools where the borrowers have very impaired creditbut the average loan to value is low, typically 70% or below. In identifying Alt-A and subprime exposure,management utilized a combination of qualitative and quantitative factors, including FICO scores and loan to value ratios.
In 2007, market conditions for subprime and Alt-A investments deteriorated due to higher delinquencies, reduced home prices, and reduced refinancing opportunities. This market turbulence has spread to othercredit markets. It is unclear how long it will take for a return to more normal market conditions. Over thesecond half of 2007 there were a large number of credit downgrades by rating agencies for residential mortgage-backed investments. Subsequent to year end there were additional credit downgrades forsecurities backed by residential mortgage pools which were held by the Company, however suchdowngrades did not significantly change the overall credit quality mix of the RMBS portfolio.
46

Notes to Consolidated Statutory Financial Statements (continued)
The actual cost, carrying value, fair value, and related gross realized losses from other-than-temporaryimpairments of the Company’s investments with significant subprime and Alt-A exposure were as follows:
December 31, 2007 Other-Than-
Actual Carrying TemporarySubprime Cost Value Fair Value Impairments
(In Millions) Bonds:Residential mortgage-backed securities $ 1,438 $ 1,314 $ 1,257 $ 128Collateralized debt obligations 26 1 3 25
Total $ 1,464 $ 1,315 $ 1,260 $ 153
December 31, 2007 Other-Than-
Actual Carrying TemporaryAlt-A Cost Value Fair Value Impairments
(In Millions) Bonds:Residential mortgage-backed securities $ 3,856 $ 3,656 $ 3,482 $ 213Collateralized debt obligations 124 22 18 110 Other bonds 53 53 53 -
Total $ 4,033 $ 3,731 $ 3,553 $ 323
The following table shows the percentage by statement value of subprime and Alt-A bonds by vintage (representing the year the pool of loans was originated) and credit quality as of December 31, 2007.
Year AAA AA A BBB BB andBelow Total
2007 9.4% 1.1% 0.1% 0.1% -% 10.7% 2006 36.6 1.2 0.2 0.8 0.4 39.2 2005 and prior 42.0 6.9 0.7 0.4 0.1 50.1
Total 88.0% 9.2% 1.0 % 1.3% 0.5% 100.0%
Management’s judgment regarding fair value, including the difficulty of obtaining readily determinableprices for residential mortgage-backed investments and other investments impacted by the current illiquidcredit market environment, depends upon evolving conditions that can alter the anticipated cash flows realized by investors. Further deterioration of market conditions and related management judgments of fairvalue could negatively impact the Company’s statement of operations and fair value disclosures in future periods.
b. Preferred stocks
The carrying value of preferred stocks was $167 million and $270 million as of December 31, 2007 and 2006, respectively. The fair value of preferred stocks was $165 million and $288 million as of December31, 2007 and 2006, respectively.
Through December 31, 2007, the Company had realized gains of $5 million, no realized losses, and $24million in other-than-temporary impairments. Through December 31, 2006, the Company had realizedgains of $19 million, no realized losses, and $1 million in other-than-temporary impairments.
As of December 31, 2007, the Company had preferred stock with Alt-A exposure to residential mortgage-backed securities with cost, carrying value, and fair value of $3 million.
47

Notes to Consolidated Statutory Financial Statements (continued)
As of December 31, 2007 and 2006, the Company had carrying values of $144 million and $152 million, respectively, in preferred stocks for which the transfer of ownership was restricted by contractual requirements.
c. Common stocks - unaffiliated
The adjusted cost basis and carrying value of common stocks were as follows:
December 31, 2007 2006
(In Millions)
Adjusted cost basis $ 616 $ 895 Gross unrealized gains 221 335 Gross unrealized losses (33) (26) Carrying value $ 804 $ 1,204
The realized gain and loss activity of common stocks, were as follows:
Years Ended December 31, 2007 200 6
(In Millions)
Gross realized capital gains on sales $ 202 $ 232Gross realized capital losses on sales (41) (33) Other-than-temporary impairments (39) (8)
As of December 31, 2007, investments in common stock in an unrealized loss position included holdingswith a fair value of $214 million in 451 issuers. These holdings were in an unrealized loss position of $33 million, $5 million of which were in an unrealized loss position more than 12 months. As of December 31, 2006, investments in common stock with an unrealized loss position included holdings with a fair value of$76 million in 202 issuers. These holdings were in an unrealized loss position of $26 million, $10 millionof which were in an unrealized loss position more than 12 months. Based upon the Company’s impairmentreview process, the decline in value of these securities was not considered to be other-than-temporary as ofDecember 31, 2007 and 2006.
As of December 31, 2007, the Company had common stock with exposure to residential mortgage-backedsecurities of $15 million.
As of December 31, 2007 and 2006, the Company had a carrying value of $154 million and $336 million,respectively, in common stocks for which the transfer of ownership was restricted by contractual requirements.
48

Notes to Consolidated Statutory Financial Statements (continued)
d. Mortgage loans
Mortgage loans, comprised of commercial mortgage loans and residential mortgage loan pools, were$12,633 million and $11,077 million as of December 31, 2007 and 2006, respectively. There was no valuation allowance recorded as of December 31, 2007, and a valuation allowance of $24 million wasrecorded as of December 31, 2006. The Company’s commercial mortgage loans primarily finance varioustypes of commercial real estate properties throughout the United States. Residential mortgage loan poolsare pools of homogeneous residential mortgage loans substantially backed by Federal HousingAdministration and Veterans Administration guarantees. On occasion, the Company advances funds for thepayment of items such as real estate taxes, legal bills, and appraisals prepared by a Member AppraisalInstitute designated appraiser to protect collateral. Typically, advances are made on problem loans forwhich the Company is in negotiations with the borrower. To the extent that advances are not recoverable, they are written off as a realized loss upon the disposition of the mortgage loan. Taxes, assessments andother amounts advanced on behalf of a third party that were not included in the mortgage loan carryingvalue total were less than $1 million as of December 31, 2007 and 2006.
As of December 31, 2007, scheduled mortgage loan maturities, net of valuation allowances, were as follows:
(In Millions)
2008 $ 4242009 585 2010 1,077 2011 1,098 2012 1,659 Thereafter 4,790Commercial mortgage loans 9,633 Residential mortgage loan pools 3,000
Total mortgage loans $ 12,633
Included in commercial mortgage loans in the above table were $177 million of mezzanine loans.
As of December 31, 2007 and 2006, the lending rates, including fixed and variable, on the portfolio of mortgage loans were:
December 31, 2007 December 31, 2006 Weighted Weighted
Low High Average Low High AverageCommercial mortgage loans 3.9% 10.4% 6.1% 3.9% 10.4% 6.3% Residential mortgage loan pools 4.2% 13.7% 6.7% 4.1% 13.1% 6.9% Mezzanine mortgage loans 8.0% 18.0% 11.3% 8.0% 20.0% 12.9%
During the years ended December 31, 2007 and 2006, mortgage loan lending rates, including fixed and variable, on new issues were:
2007 2006 Low High Low High
Commercial mortgage loans 4.8% 8.9% 5.3% 9.9% Residential mortgage loan pools 5.6% 7.2% 5.9% 7.5% Mezzanine mortgage loans 8.0% 14.0% 9.0% 18.0%
The maximum percentage of any one commercial mortgage loan to the estimated value of securedcollateral at the time the loan was originated, exclusive of mezzanine, insured, guaranteed or purchasemoney mortgages, was 89.5% and 86.3% as of December 31, 2007 and 2006, respectively. The maximum percentage of any one mezzanine loan to the estimated value of secured collateral at the time the loan was originated was 97.5% and 98.6% as of December 31, 2007 and 2006, respectively.
49

Notes to Consolidated Statutory Financial Statements (continued)
The gain and loss activity of mortgage loans was as follows:
Years Ended December 31, 2007 2006
(In Millions)
Gross realized investment gains $ 18 $ 26 Gross realized investment losses (3) (5) Other-than-temporary impairments and write-offs (23) -
As of December 31, 2007 and 2006, the Company had no restructured loans. Restructured loans typically have been modified to defer a portion of the contracted interest payments to future periods. No interest was deferred to future periods for the years ended December 31, 2007 and 2006.
Interest deferred to future periods from mortgage loans on properties under development was $9 million and $1 million, respectively, for the years ended December 31, 2007 and 2006.
During 2007, the Company wrote-off one mortgage loan that was foreclosed. The $24 million loss related to this loan was recorded as a realized capital loss. As of December 31, 2006, the $24 million was recordedin a valuation allowance and the change in valuation allowance was recorded through surplus.
The Company does not originate any residential mortgages but invests in residential mortgage loan poolswhich may contain mortgages of subprime credit quality. As of December 31, 2007, the Company had no direct subprime exposure through the origination of residential mortgage loans or purchases ofunsecuritized whole-loan pools. The Company purchases seasoned loan pools, most of which are FHAinsured or VA guaranteed. As of December 31, 2007, the Company had mortgages with residential mortgage-backed exposure with a carrying value of $3,000 million which were FHA insured or VA guaranteed.
Impaired mortgage loans consisted of the following:
December 31, 2007 2006
(In Millions)
Impaired mortgage loans with valuation allowance $ - $ 24 Less valuation allowance on impaired loans - (24)
Net carrying value of impaired mortgage loans $ - $ -
Average recorded investment in impaired loans $ - $ 23
There was no interest income on impaired loans for the year ended December 31, 2007 and $2 million forthe year ended December 31, 2006.
There were no mortgage loans with interest more than 180 days past due as of December 31, 2007 or 2006.
50

Notes to Consolidated Statutory Financial Statements (continued)
The geographic distribution of mortgage loans was as follows:
December 31, 2007 2006
(In Millions)
California $ 2,539 $ 1,977 Massachusetts 708 702 Texas 665 665 Illinois 555 393 Washington 431 361 New York 358 403 All other states 3,661 3,586 Canada 716 335
Total commercial mortgage loans 9,633 8,422 Residential mortgage loan pools 3,000 2,655
Total mortgage loans $ 12,633 $ 11,077
Included in commercial mortgage loans in the above table were $177 million of mezzanine loans.
All other states includes mortgage loans that are spread widely across various states.
Geographical concentration is considered prior to the purchase of mortgage loans and residential mortgageloan pools. There was no material negative impact to surplus based on the geographical concentrations forthe years ended December 31, 2007 and 2006.
e. Real estate
The carrying value of real estate was as follows:
December 31, 2007 2006
(In Millions)
Held for the production of income $ 1,765 $ 1,918 Accumulated depreciation (615) (600)Encumbrances (259) (291) Held for the production of income, net 891 1,027
Held for sale 202 169 Accumulated depreciation (41) (62) Held for sale, net 161 107
Occupied by the Company 212 210 Accumulated depreciation (80) (69) Occupied by the Company, net 132 141
Total real estate $ 1,184 $ 1,275
The carrying value of non-income producing real estate was $57 million as of December 31, 2007including one residential complex for $32 million, and three land parcels for $25 million, all of which were under development except one land parcel. The carrying value of non-income producing real estate was $17 million as of December 31, 2006 consisting primarily of land. As of December 31, 2006, one non-income producing real estate property with a carrying value of less than $1 million was under development.
Depreciation expense on real estate was $88 million and $85 million for the years ended December 31, 2007 and 2006, respectively.
51

Notes to Consolidated Statutory Financial Statements (continued)
The gain and loss activity of real estate investments was as follows:
Years Ended December 31, 2007 2006
(In Millions)
Gross realized capital gains on sales $ 207 $ 92Gross realized capital losses on sales (17) (36) Impairment losses - -
The Company invests in real estate as part of its diversified investment strategy. Properties are acquired and managed for net income growth and increasing value. Properties acquired through foreclosure aremanaged similarly. If a property in the portfolio is underperforming or is not expected to outperform themarket in the future it is recommended for sale. Upon management’s approval for the sale of a property itis classified as held for sale. Properties acquired through foreclosure are classified as held for sale.
During 2007, three hotels, two residential complexes, and three office complexes acquired in previous years were classified as held for sale. Of these eight properties, one hotel and one office complex were sold in 2007 for a net gain of $106 million. During 2007, ten single family residences were acquired as part ofan employee relocation program and classified as held for sale. Four of these properties were sold for a net loss of less than $1 million. As of December 31, 2007, the Company held fourteen properties classified asheld for sale.
Of the ten properties classified as held for sale as of December 31, 2006, two single family residences, a retail center, an industrial complex, and three office complexes were sold for a net gain of $101 million. A condominium complex was reclassified from held for sale to held for the production of income after all available condominiums were sold. Another, all land, was split into two properties, a portion of this beingkept in held for sale and the rest of the land reclassified to held for the production of income. Two of theproperties, a single family residence and land, remained classified as held for sale as of December 31, 2007.
During 2006, the Company completed a transition of certain insurance operations to a new office and realized a loss of $1 million on disposition of the old office. Also during 2006, three offices, a hotel, anapartment complex, a condominium complex and an industrial building acquired in previous years wereclassified as held for sale. Of these seven properties, the hotel and apartment complex were sold in 2006 for a net gain of $43 million. As of December 31, 2006, the Company held ten properties classified as held for sale.
During 2006, eleven single family residences were acquired as part of an employee relocation program and subsequently classified as held for sale. Of these properties, eight were sold during 2006 for a net loss of less than $1 million.
Cornerstone Property Fund
In 2004 the Company transferred real estate with a fair value of $533 million into a real estate separate account, Cornerstone Property Fund, offered to contract holders.
In 2006, the assets and liabilities of the real estate separate account were transferred to two newpartnerships, Cornerstone Holding LP and Cornerstone Patriot Non-REIT Holding LP (the “newpartnerships”), which are included in partnerships and LLCs in the Consolidated Statements of FinancialPosition. At the time of the transfer, all risks and rewards of the real estate separate account wereeffectively transferred to the new partnerships. This non-cash transfer effectively transferred theCompany’s investment in the real estate separate account into these partnership interests. At the time of the 2006 transfer, all of the previously recorded deferred gains of $142 million were offset against the marketvalue of the properties thereby bringing the Company’s investment in the new partnerships back to the Company’s historical cost of $398 million. The Company did not record a gain or loss associated with this transfer. For the portion of the new partnerships owned by outside investors, the Company recorded a surrender of their group annuity contracts and an offsetting change in reserves to effect the movement ofthe outside investors’ interest from the separate account to the new partnerships.
52

Notes to Consolidated Statutory Financial Statements (continued)
Of the real estate investments transferred into the new partnerships, the Company retained legal title to fiveof the properties (the “specified properties”) with an approximate market value of $315 million. Withregard to these specified properties, the Company and the new partnerships also entered into a Total Return and Property Use Contribution Agreement (“TRAPUA”). The TRAPUA conveyed full economicownership of these properties to the new partnerships. The new partnerships are entitled to, and receivedirectly, all money and items flowing from the specified properties including the proceeds from sale of saidproperties. The new partnerships also pay all operating expenses, debt service and capital expenditures forthe specified properties. The new partnerships indemnify the Company and any of its affiliates against, and agree to hold the Company harmless from, any and all losses in connection with the specified properties. As the Company retained legal title to the specified properties, the Company remains primarily liable for obligations that may arise related to these specified properties in the event the new partnerships cannotmeet their obligations under the TRAPUA. The Company records these specified properties at a nominalvalue as real estate. In substance, the book value of the specified properties has been moved from real estate to a partnership interest.
f. Partnerships and limited liability companies
Partnership and LLC holdings, at carrying value, had characteristics of:
Years Ended December 31, 2007 2006
(In Millions)
Common stocks $ 3,130 $ 2,433 Real estate 1,090 889 Low income housing tax credits (“LIHTCs”) 249 242 Bonds 162 76 Mortgage loans 102 68 Other 401 248
Total $ 5,134 $ 3,956
The gain and loss activity of partnerships and LLCs was as follows:
Years Ended December 31, 2007 2006
(In Millions)
Gross realized capital gains on sales $ 9 $ 68Gross realized capital losses on sales - (2) Other-than-temporary impairments (100) (10)
Included in other-than-temporary impairments is $63 million attributable to the continuing decline in credit markets. As of December 31, 2007, one partnership with significant subprime exposure held by theCompany, Merryall Fund, had an actual cost of $55 million, fair value and carrying value of $13 million,and related gross realized losses from other-than-temporary impairments of $28 million. One partnership with significant Alt-A exposure held by the Company, Quantitative Enhanced Decisions Fund, had anactual cost of $96 million, carrying value and fair value of $45 million, and related gross realized lossesfrom other-than-temporary impairments of $35 million. Of the $100 million of other-than-temporaryimpairments, all were determined based on internally developed models.
The Company invests in partnerships which generate low income housing tax credits. These investments currently have unexpired tax credits which range from 1 to 11 years and have an initial 15 year holding period requirement. For determining other-than-temporary impairments on LIHTC investments, the Company uses the present value of all future benefits, the majority of which are tax credits, discounted at a risk free rate of 4.25% and compares the result to its current book value. Other-than-temporaryimpairments for the year ended December 31, 2007, were $4 million on Affordable Housing Tax CreditFunds which consisted of Boston Financial Equity Tax Credit-III for $2 million, MM Guilford Fund for $1
53

Notes to Consolidated Statutory Financial Statements (continued)
million, and Boston Financial Equity Tax Credit I for $1 million. Other-than-temporary impairments for the year ended December 31, 2006 were $5 million, which consisted of MMA Financial LLC for $2 million and WFC Apartments LP, Countryside Corp Tax III and Alliant Tax Credit Fund for approximately $1million each.
There were no write-downs or reclassifications made during the years ended December 31, 2007 or 2006 due to forfeiture or ineligibility of tax credits or similar issues. In addition, there are no LIHTCinvestments currently subject to regulatory review.
g. Net investment income
Net investment income was derived from the following sources:
Years Ended December 31, 2007 2006
(In Millions)
Bonds $ 2,656 $ 2,636 Preferred stocks 19 5 Common stocks - subsidiaries and affiliates 391 202Common stocks - unaffiliated 56 69Mortgage loans 776 691 Policy loans 620 569 Real estate 222 222 Partnerships and LLCs 468 307 Derivatives and other invested assets 154 185 Cash, cash equivalents and short-term investments 102 119
Subtotal investment income 5,464 5,005 Amortization of the IMR (34) (66) Net gain from separate accounts 7 18 Less investment expenses (503) (484)
Net investment income $ 4,934 $ 4,473
h. Net realized capital gains and losses
Net realized capital (losses) gains were comprised of the following:
Years Ended December 31, 2007 2006
(In Millions)
Bonds $ (484) $ (35)Preferred stocks (19) 18 Common stocks - subsidiaries and affiliates 5 12Common stocks - unaffiliated 122 191Mortgage loans (8) 21 Real estate 190 56 Partnerships and LLC’s (91) 56 Derivatives and other (182) (106) Federal and state taxes (44) (39)
Net realized capital (losses) gains before deferral to the IMR (511) 174
Net losses deferred to the IMR 49 115 Less taxes 7 (40) Net after tax losses deferred to the IMR 56 75
Net realized capital (losses) gains $ (455) $ 249
54

Notes to Consolidated Statutory Financial Statements (continued)
Net realized (losses) gains on derivative financial instruments by type were as follows:
Years Ended December 31, 2007 2006
(In Millions)
Interest rate swaps $ (42) $ (109) Currency swaps (19) 94 Options (47) (2) Forward contracts (9) (5) Financial futures (45) 7
Net derivative realized capital losses (162) (15) Other (20) (91)
Total derivatives and other losses $ (182) $ (106)
The $91 million of other losses in 2006 were primarily due to the maturity of a medium-term note in the second quarter which resulted in foreign currency exchange losses of $102 million.
i. Securities lending
As of December 31, 2007 and 2006, securities with a fair value of $92 million and $271 million, respectively, were on loan. Collateral in the form of securities of $95 million and $280 million was held onthe Company’s behalf, by a trustee, as of December 31 2007 and 2006, respectively. The Company retains control over the loaned securities, which remain assets of the Company, and are not removed from theaccounting records.
j. Securities purchased under agreements to resell and sold under agreements to repurchase
As of December 31, 2007, the Company had securities purchased under agreements to resell of $1,151 million with maturities ranging from January 2 through January 18, 2008 and interest rates ranging from5.0% to 6.0%. The outstanding amount as of December 31, 2007 was collateralized by bonds with a fair value of $1,213 million and cash of $19 million. As of December 31, 2006, the Company did not have any securities purchased under agreements to resell. Securities purchased under agreements to resell areincluded in cash, cash equivalents and short-term investments on the Consolidated Statutory Statements ofFinancial Position.
As of December 31, 2007 and 2006, the Company had securities sold under agreements to repurchase withtotal carrying values of $2,102 million and $1,183 million, respectively. As of December 31, 2007, the maturities of these agreements ranged from January 3, 2008 through March 6, 2008 and the interest rates ranged from 3.1% to 5.5%. The outstanding amounts as of December 31, 2007 and 2006 werecollateralized by bonds with a fair value of $2,137 million and $1,182 million, respectively and cash of $46million as of December 31, 2007.
5. Common stocks – subsidiaries and affiliates
One of the Company’s wholly owned subsidiaries, MassMutual Holding LLC (“MMHLLC”), is the parent ofsubsidiaries which include retail and institutional asset management, registered broker dealers, and international life and annuity operations.
The Company recognized $15 million of other-than-temporary impairments on an affiliated company all of which was based on internal models.
As of December 31, 2007 the Company had a carrying value of $43 million in common stocks for which thetransfer of ownership was restricted by contractual requirements. As of December 31, 2006, the Company had no common stocks for which the transfer of ownership was restricted by contractual requirements.
The Company does not rely on dividends from its subsidiaries to meet its operating cash flow requirements. Forthe domestic life insurance subsidiaries, substantially all of their statutory shareholder’s equity of approximately
55

Notes to Consolidated Statutory Financial Statements (continued)
$608 million as of December 31, 2007 was subject to dividend restrictions imposed by various state regulations.MassMutual’s domestic insurance subsidiary, C.M. Life, is required to obtain prior approval for dividendpayments in 2008.
International insurance subsidiaries primarily include operations in Japan, Taiwan, and Hong Kong. Historically, the Company has reinvested a substantial portion of its unrestricted earnings in these operations.
In 2006, the ownership of Golden Retirement Resources Inc. was transferred from MMHLLC to MassMutual.On September 15, 2006, Golden Retirement Resources Inc. was liquidated into MassMutual resulting in no gain or loss.
In 2007 and 2006, MassMutual contributed capital of $194 million and $86 million, respectively, to its subsidiaries including MMHLLC. Additionally, in 2007, MassMutual received return of capital of $87 millionfrom its subsidiaries including MMHLLC.
MassMutual received cash dividends from MMHLLC of $350 million and $175 million in 2007 and 2006, respectively. The carrying value of MMHLLC was $2,001 million and $1,955 million as of December 31, 2007 and 2006, respectively. The Company held debt issued by MMHLLC and its subsidiaries that amounted to$1,023 million as of December 31, 2007 and 2006. The Company recorded interest income on MMHLLC debtof $75 million and $66 million in 2007 and 2006, respectively.
Summarized below is GAAP financial information for the unconsolidated subsidiaries:
As of and for the Years Ended December 31,
2007 2006 (In Millions)
Total revenue $ 6,799 $ 6,364 Net income 521 456 Assets 44,457 34,907Liabilities 41,117 31,857Equity 3,340 3,050
The GAAP equity value for the unconsolidated subsidiaries includes the statutory carrying value of MMHLLC,the carrying value of MMHLLC that is nonadmitted under statutory accounting principles, and the GAAPequity value of other unconsolidated subsidiaries that are not consolidated under MMHLLC.
6. Derivative financial instruments
The Company uses derivative financial instruments in the normal course of business to manage risks, primarilyto reduce interest rate and duration imbalances determined in asset/liability analyses. The Company also uses a combination of derivatives and fixed income investments to create synthetic investment positions. These combined investments are created opportunistically when they are economically more attractive than the replicated instrument or when the replicated instruments are unavailable. Approximately $145 million, in synthetic assets are considered replicated asset transactions as defined under statutory accounting principles. The Company’s derivative strategy employs a variety of derivative financial instruments, including interest rateswaps, currency swaps, equity and credit default swaps, options, interest rate caps and floors, forward contracts,and financial futures. Investment risk is assessed on a portfolio basis and individual derivative financialinstruments are not designated in hedging relationships; therefore, as allowed by accounting rules, the Company specifically and intentionally made the decision not to apply hedge accounting.
Under interest rate swaps, the Company agrees, at specified intervals, to an exchange of variable rate and fixed rate interest payments calculated by reference to an agreed upon notional principal amount. Typically, no cash is exchanged at the outset of the contract and no principal payments are made by either party. Cash is paid or received based on the terms of the swap. These transactions are entered into pursuant to master agreements that provide for a single net payment to be made by one counterparty at each due date. Interest rate swaps areprimarily utilized to more closely match the interest rate cash flows of assets and liabilities. Interest rate swaps
56

Notes to Consolidated Statutory Financial Statements (continued)
are also used to mitigate changes in the value of assets anticipated to be purchased and other anticipated transactions and commitments.
Under currency swaps, the Company agrees to an exchange of principal denominated in two different currenciesat current rates, under an agreement to repay the principal at a specified future date and rate. The Company utilizes currency swaps for the purpose of managing currency exchange risks in its assets and its liabilities.
Credit default swaps involve a transfer of credit risk of fixed income instruments from one party to another inexchange for periodic premium payments. The buyer of the credit swap receives credit protection, whereas the seller of the swap guarantees the credit worthiness of the underlying security. This transfers the risk of defaultfrom the buyer of the swap to the seller. If a specified credit event occurs, as defined by the agreement, theseller is obligated to pay the counterparty the contractually agreed upon amount and receives in return the underlying security in an amount equal to the notional value of the credit default swap. A credit event isgenerally defined as default on contractually obligated interest or principal payments or bankruptcy.
The Company uses credit default swaps to either reduce exposure to particular issuers by buying protection orincrease exposure to issuers by selling protection against specified credit events. The Company buys protection as an efficient means to reduce credit exposure to particular issuers or sectors in the Company’s investment portfolio. The Company sells protection to enhance the return on its investment portfolio by providingcomparable exposure to fixed income securities that might not be available in the primary market or to enter into synthetic transactions by buying a high quality liquid bond to match against the credit default swap.
Options grant the purchaser the right to buy or sell a security or enter into a derivative transaction at a statedprice within a stated period. The Company’s option contracts have terms of up to 15 years. A swaption is anoption to enter into an interest rate swap at a future date. The Company purchases these options in order toprotect against undesirable financial effects resulting from interest rate exposures that exist in its assets and/or liabilities.
Interest rate cap agreements are option contracts in which the seller agrees to limit the purchaser’s riskassociated with an increase in a reference rate or index in return for a premium. Interest rate floor agreements are option contracts in which the seller agrees to limit the purchaser’s risk associated with a decline in areference rate or index in return for a premium. The Company is exposed to policyholder surrenders during a rising interest rate environment. Interest rate cap and swaption contracts are used to mitigate the Company’sloss in this environment. These derivatives are also used to reduce the duration risk in certain investmentportfolios. These derivative instruments are used to reduce the duration risk of fixed maturity investments tomatch certain life insurance products in accordance with the Company’s asset and liability management policy.
The Company utilizes certain other agreements including forward contracts and financial futures to reduce exposures to various risks. Forward contracts and financial futures are used by the Company to manage market risks relating to interest rates. Currency forwards are contracts in which the Company agrees with other partiesto exchange specified amounts of identified currencies at a specified future date. Typically, the exchange isagreed upon at the time of the contract. The Company also uses "to be announced" (“TBAs”) forward contracts to participate in the investment return on mortgage-backed securities. The Company believes that TBAs can provide a more liquid and cost effective method than purchasing or selling individual mortgage-backed pools.Typically, the price is agreed upon at the time of the contract and payment is made at a specified future date. The Company usually does not purchase TBAs with settlement by the first possible delivery date and thusaccounts for these TBAs as derivatives. TBAs which settle on the first possible delivery date are accounted for as bonds. The Company’s futures contracts are exchange traded and have credit risk. Margin requirements are met with the deposit of securities. Futures contracts are generally settled with offsetting transactions.
The Company’s principal derivative market risk exposures are interest rate risk, which includes the impact ofinflation, and credit risk. Interest rate risk pertains to the change in fair value of the derivative instruments asmarket interest rates move. The Company is exposed to credit-related losses in the event of non-performance by counterparties to derivative financial instruments. In order to minimize credit risk, the Company and itsderivative counterparties require collateral to be posted in the amount owed under each transaction, subject tothreshold and minimum transfer amounts that are functions of the rating on the counterparty’s long term, unsecured, unsubordinated debt. Additionally, in many instances, the Company enters into agreements withcounterparties that allow for contracts in a positive position, where the Company is due amounts, to be offset by
57

Notes to Consolidated Statutory Financial Statements (continued)
contracts in a negative position. This right of offset, combined with collateral obtained from counterparties,reduces the Company’s exposure. As of December 31, 2007 and 2006, collateral of $996 million and $887 million, respectively, was pledged by the counterparties. Market value exposure at risk, in a net gain position,net of offsets and collateral, was $381 million and $182 million at December 31, 2007 and 2006, respectively. Negative values in the carrying value of a particular derivative category can result from a counterparty’s right to offset positions in multiple derivative financial instruments. The Company regularly monitors counterparty credit ratings and exposures, derivatives positions and valuations, and the value of collateral posted to ensure counterparties are credit-worthy and the concentration of exposure is minimized. The Company monitors this exposure as part of its management of the Company’s overall credit exposures.
The following tables summarize the carrying values and notional amounts of the Company’s derivativefinancial instruments:
December 31, 2007 Assets Liabilities
Carrying Notional Carrying Notional Value Amount Value Amount
(In Millions)
Interest rate swaps $ 936 $ 48,442 $ (18) $ 2,887 Currency swaps 168 1,227 166 720 Asset, equity and credit default swaps 34 1,336 (5) 154 Options 324 10,281 (37) 732 Interest rate caps and floors - 140 - - Forward contracts (1) 663 8 1,015 Financial futures - long positions - 381 - - Financial futures - short positions - 186 - -
Total $ 1,461 $ 62,656 $ 114 $ 5,508
December 31, 2006 Assets Liabilities
Carrying Notional Carrying Notional Value Amount Value Amount
(In Millions)
Interest rate swaps $ 606 $ 28,707 $ 10 $ 2,318 Currency swaps 177 1,392 65 297 Asset, equity and credit default swaps (5) 783 1 237 Options 251 7,857 (4) 120 Interest rate caps and floors - 10 - 30 Forward contracts (14) 1,179 (1) 264 Financial futures - long positions - 428 - -
Total $ 1,015 $ 40,356 $ 71 $ 3,266
Notional amounts do not represent amounts exchanged by the parties and thus are not a measure of the Company’s exposure. The amounts exchanged are calculated on the basis of the notional amounts and the otherterms of the instruments, which relate to interest rates, exchange rates, security prices, or financial and otherindices.
58

Notes to Consolidated Statutory Financial Statements (continued)
The following table summarizes the Company’s notional amounts by contractual maturity and type of derivative:
December 31, Two Six
Through Through After Five Ten Ten Total Total
One Year Years Years Years 2007 2006 (In Millions) Interest rate swaps $ 19,132 $ 13,957 $ 7,243 $ 10,997 $ 51,329 $ 31,025Options - - 1,403 9,610 11,013 7,977 Currency swaps 206 492 1,065 184 1,947 1,689 Other derivatives 2,303 703 669 200 3,875 2,931
Total $ 21,641 $ 15,152 $ 10,380 $ 20,991 $ 68,164 $ 43,622
The following table represents the Company’s net notional interest rate swap positions:
December 31, 2007 2006
(In Millions)
Open interest rate swaps in a fixed receive position $ 26,474 $ 14,923 Open interest rate swaps in a fixed pay position 17,176 10,880Other interest related swaps 7,679 5,222
Total interest rate swaps $ 51,329 $ 31,025
59

Notes to Consolidated Statutory Financial Statements (continued)
7. Fair value of financial instruments
The following fair value disclosures may not necessarily be indicative of amounts that could be realized inimmediate settlement of the financial instrument. The use of different assumptions or valuation methodologiesmay have a material impact on the estimated fair value amounts.
The following table summarizes the Company’s financial instruments:
December 31, 2007 2006 Carrying Fair Carrying Fair
Value Value Value Value (In Millions)
Financial assets: Bonds $ 43,636 $ 44,127 $ 43,976 $ 44,496Preferred stocks 167 165 270 288 Common stocks - unaffiliated 804 804 1,204 1,204Mortgage loans 12,633 12,774 11,077 11,114Policy loans 8,561 10,604 8,032 9,850 Derivative financial instruments 1,461 1,461 1,015 1,015 Cash, cash equivalents and
short-term investments 2,642 2,642 1,015 1,015
Financial liabilities: Derivative financial instruments $ 114 $ 114 $ 71 $ 71 Commercial paper 250 250 - - Securities sold under agreements to repurchase 2,102 2,102 1,183 1,183Funding agreements 2,999 3,022 2,280 2,279 Investment-type insurance contracts:
Group annuity investment contracts 6,925 6,913 7,237 7,225 Individual annuity investment contracts 5,769 5,879 6,087 5,997 Guaranteed investment contracts 473 473 586 578 Supplementary investment contracts 293 293 335 335
As of December 31, 2007 and 2006, 73.6% and 76.0%, respectively, of bonds were priced by external vendorsand broker quotations. Internal models were used to price 26.4% and 24.0% of bonds as of December 31, 2007 and 2006, respectively.
The average fair value of derivative financial instrument assets was $1,238 million and $1,170 million during2007 and 2006, respectively. The average fair value of derivative financial instrument liabilities was $93million and $86 million during 2007 and 2006, respectively.
8. Fixed assets
The Company’s fixed assets are comprised primarily of internally developed and purchased software, operatingsoftware, electronic data processing equipment, office equipment and furniture. Fixed assets were $196 millionand $169 million, net of accumulated depreciation of $392 million and $349 million, as of December 31, 2007 and 2006, respectively. Depreciation expense on fixed assets was $48 million and $50 million for the yearsended December 31, 2007 and 2006, respectively.
60

Notes to Consolidated Statutory Financial Statements (continued)
9. Deferred and uncollected life insurance premium
Deferred and uncollected life insurance premium are included in other than invested assets in the Company’s Consolidated Statutory Statements of Financial Position. The table below summarizes the deferred and uncollected life insurance premium, gross and net of loading.
December 31, 2007 2006
Net of Net ofGross Loading Gross Loading
(In Millions)
Ordinary new business $ 51 $ 23 $ 49 $ 21 Ordinary renewal 484 528 467 502 Group life 18 18 18 18
Total $ 553 $ 569 $ 534 $ 541
10. Surplus notes
The following table summarizes the surplus notes issued and outstanding as of December 31, 2007:
Issue Year Amount Interest Rate Maturity Date($ In Millions)
1993 $ 250 7.625% 20231994 100 7.500% 20242003 250 5.625% 2033
Total $ 600
These notes are unsecured and subordinate to all present and future indebtedness of the Company, policy claimsand prior claims against the Company as provided by the Massachusetts General Laws. The surplus notes are all held by bank custodians for unaffiliated investors. All issuances were approved by the Commonwealth of Massachusetts Division of Insurance (the “Division”). Surplus notes are included in surplus on the Consolidated Statutory Statements of Financial Position.
All payments of interest and principal are subject to the prior approval of the Division. Anticipated sinkingfund payments are due for the notes issued in 1993 and 1994 as follows: $62 million in 2021, $88 million in2022, $150 million in 2023, and $50 million in 2024. There are no sinking fund requirements for the notesissued in 2003. Scheduled interest on the notes issued in 2003 and 1993 is payable on May 15 and November15 of each year to holders of record on the preceding May 1 or November 1, respectively. Scheduled interest onthe notes issued in 1994 is payable on March 1 and September 1 of each year to holders of record on the preceding February 15 or August 15, respectively. Interest expense is not recorded until approval for paymentis received from the Division. Through December 31, 2007, the unapproved interest was $7 million. Interest of$41 million was approved and paid during the years ended December 31, 2007 and 2006, respectively.
11. Related party transactions
The Company has management and service contracts and cost-sharing arrangements with various subsidiaries and affiliates whereby the Company, for a fee, will furnish a subsidiary or affiliate, as required, operatingfacilities, human resources, computer software development and managerial services. As of December 31, 2007and 2006, the net amounts due from these subsidiaries and affiliates were $16 million and $14 million, respectively. These outstanding balances are billed quarterly and are due and payable within 30 days.
The Company has agreements with its affiliates, including OppenheimerFunds, Inc., whereby the Companyreceives revenue for certain recordkeeping and other services that the Company provides to customers who select, as investment options, mutual funds managed by these affiliates. As of December 31, 2007 and 2006, thenet amounts due from these affiliates were $17 million and $3 million, respectively. These outstanding balancesare due and payable within 90 days.
61
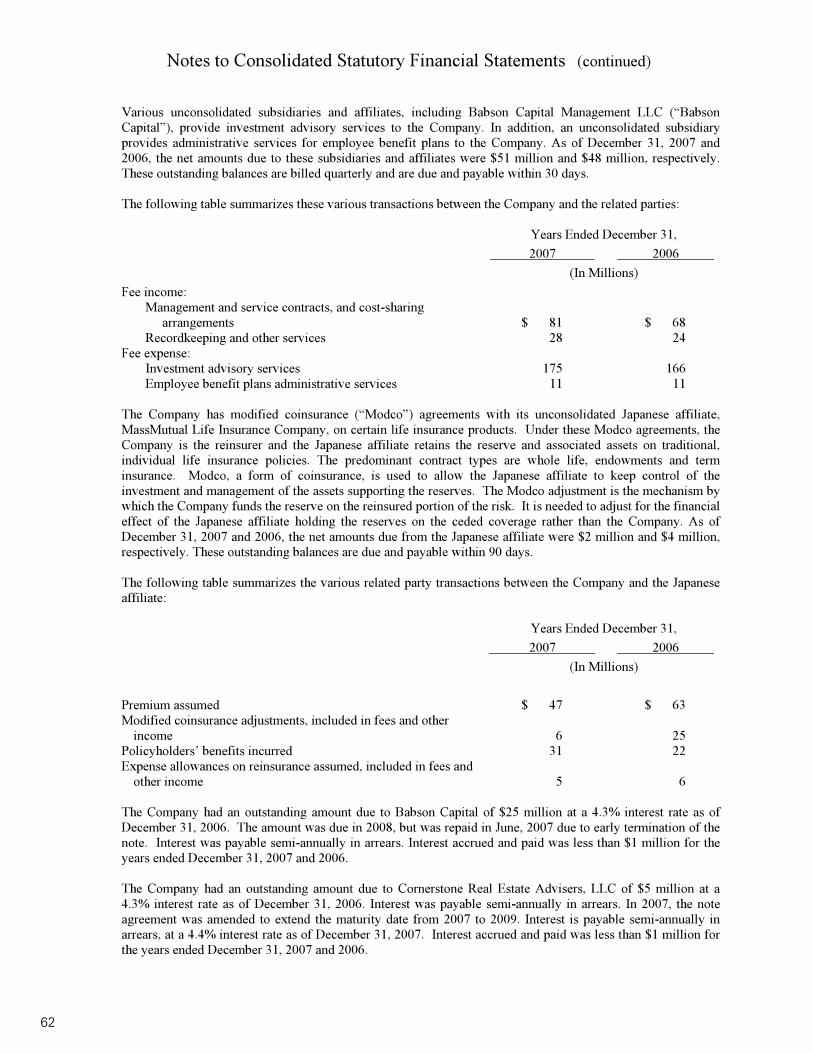
Notes to Consolidated Statutory Financial Statements (continued)
Various unconsolidated subsidiaries and affiliates, including Babson Capital Management LLC (“BabsonCapital”), provide investment advisory services to the Company. In addition, an unconsolidated subsidiaryprovides administrative services for employee benefit plans to the Company. As of December 31, 2007 and 2006, the net amounts due to these subsidiaries and affiliates were $51 million and $48 million, respectively.These outstanding balances are billed quarterly and are due and payable within 30 days.
The following table summarizes these various transactions between the Company and the related parties:
Years Ended December 31, 2007 2006
(In Millions) Fee income:
Management and service contracts, and cost- sharing arrangements $ 81 $ 68
Recordkeeping and other services 28 24 Fee expense:
Investment advisory services 175 166 Employee benefit plans administrative services 11 11
The Company has modified coinsurance (“Modco”) agreements with its unconsolidated Japanese affiliate, MassMutual Life Insurance Company, on certain life insurance products. Under these Modco agreements, theCompany is the reinsurer and the Japanese affiliate retains the reserve and associated assets on traditional, individual life insurance policies. The predominant contract types are whole life, endowments and terminsurance. Modco, a form of coinsurance, is used to allow the Japanese affiliate to keep control of the investment and management of the assets supporting the reserves. The Modco adjustment is the mechanism bywhich the Company funds the reserve on the reinsured portion of the risk. It is needed to adjust for the financialeffect of the Japanese affiliate holding the reserves on the ceded coverage rather than the Company. As of December 31, 2007 and 2006, the net amounts due from the Japanese affiliate were $2 million and $4 million, respectively. These outstanding balances are due and payable within 90 days.
The following table summarizes the various related party transactions between the Company and the Japaneseaffiliate:
Years Ended December 31, 2007 2006
(In Millions)
Premium assumed $ 47 $ 63 Modified coinsurance adjustments, included in fees and other
income 6 25 Policyholders’ benefits incurred 31 22 Expense allowances on reinsurance assumed, included in fees and
other income 5 6
The Company had an outstanding amount due to Babson Capital of $25 million at a 4.3% interest rate as ofDecember 31, 2006. The amount was due in 2008, but was repaid in June, 2007 due to early termination of thenote. Interest was payable semi-annually in arrears. Interest accrued and paid was less than $1 million for the years ended December 31, 2007 and 2006.
The Company had an outstanding amount due to Cornerstone Real Estate Advisers, LLC of $5 million at a4.3% interest rate as of December 31, 2006. Interest was payable semi-annually in arrears. In 2007, the noteagreement was amended to extend the maturity date from 2007 to 2009. Interest is payable semi-annually inarrears, at a 4.4% interest rate as of December 31, 2007. Interest accrued and paid was less than $1 million for the years ended December 31, 2007 and 2006.
62
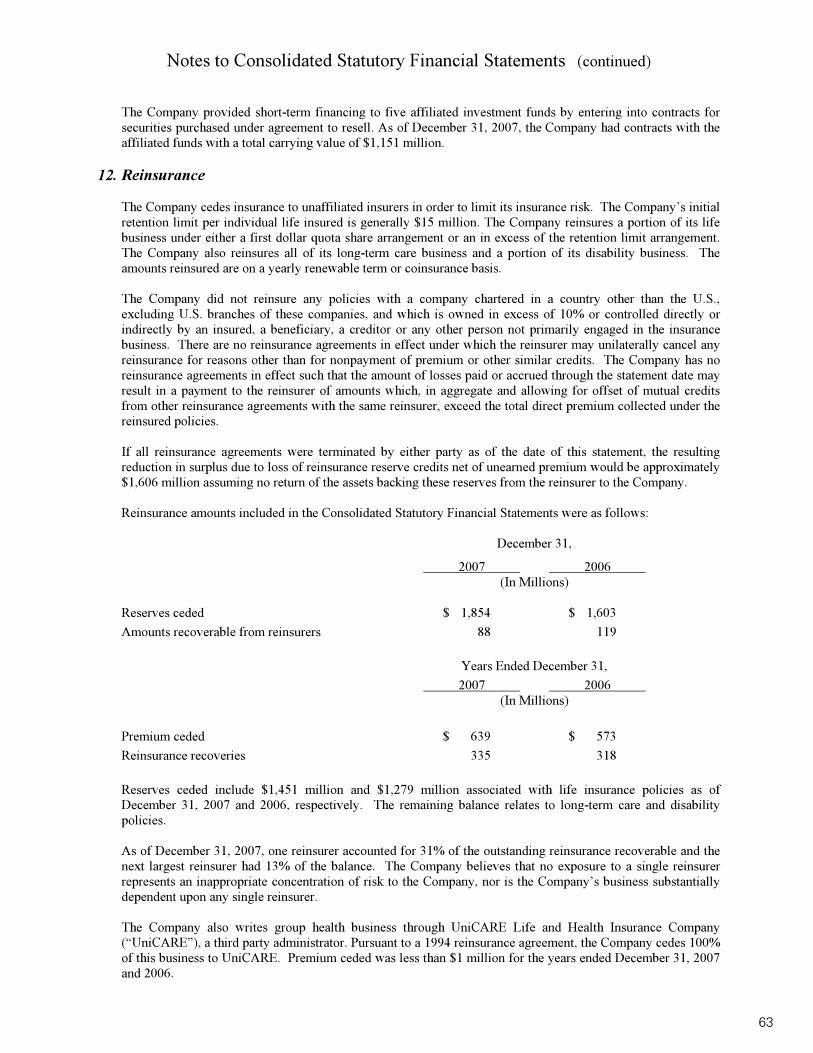
Notes to Consolidated Statutory Financial Statements (continued)
The Company provided short-term financing to five affiliated investment funds by entering into contracts for securities purchased under agreement to resell. As of December 31, 2007, the Company had contracts with the affiliated funds with a total carrying value of $1,151 million.
12. Reinsurance
The Company cedes insurance to unaffiliated insurers in order to limit its insurance risk. The Company’s initial retention limit per individual life insured is generally $15 million. The Company reinsures a portion of its lifebusiness under either a first dollar quota share arrangement or an in excess of the retention limit arrangement. The Company also reinsures all of its long-term care business and a portion of its disability business. The amounts reinsured are on a yearly renewable term or coinsurance basis.
The Company did not reinsure any policies with a company chartered in a country other than the U.S., excluding U.S. branches of these companies, and which is owned in excess of 10% or controlled directly or indirectly by an insured, a beneficiary, a creditor or any other person not primarily engaged in the insurancebusiness. There are no reinsurance agreements in effect under which the reinsurer may unilaterally cancel any reinsurance for reasons other than for nonpayment of premium or other similar credits. The Company has noreinsurance agreements in effect such that the amount of losses paid or accrued through the statement date may result in a payment to the reinsurer of amounts which, in aggregate and allowing for offset of mutual creditsfrom other reinsurance agreements with the same reinsurer, exceed the total direct premium collected under thereinsured policies.
If all reinsurance agreements were terminated by either party as of the date of this statement, the resulting reduction in surplus due to loss of reinsurance reserve credits net of unearned premium would be approximately$1,606 million assuming no return of the assets backing these reserves from the reinsurer to the Company.
Reinsurance amounts included in the Consolidated Statutory Financial Statements were as follows:
December 31,
2007 2006 (In Millions)
Reserves ceded $ 1,854 $ 1,603 Amounts recoverable from reinsurers 88 119
Years Ended December 31, 2007 2006
(In Millions)
Premium ceded $ 639 $ 573 Reinsurance recoveries 335 318
Reserves ceded include $1,451 million and $1,279 million associated with life insurance policies as ofDecember 31, 2007 and 2006, respectively. The remaining balance relates to long-term care and disability policies.
As of December 31, 2007, one reinsurer accounted for 31% of the outstanding reinsurance recoverable and thenext largest reinsurer had 13% of the balance. The Company believes that no exposure to a single reinsurer represents an inappropriate concentration of risk to the Company, nor is the Company’s business substantiallydependent upon any single reinsurer.
The Company also writes group health business through UniCARE Life and Health Insurance Company (“UniCARE”), a third party administrator. Pursuant to a 1994 reinsurance agreement, the Company cedes 100% of this business to UniCARE. Premium ceded was less than $1 million for the years ended December 31, 2007and 2006.
63

Notes to Consolidated Statutory Financial Statements (continued)
13. Policyholders’ liabilities
a. Policyholders’ reserves
The following table summarizes policyholders’ reserves, net of reinsurance, and the range of interest rates by type of product:
December 31, 2007 2006
Amount Interest Rates Amount Interest Rates($ In Millions)
Individual life $ 30,336 2.5% - 6.0% $ 29,046 2.5% - 6.0%Group life 9,470 2.5% - 4.5% 8,937 2.5% - 4.5%Group annuities 8,638 2.3% - 11.3% 8,893 2.3% - 11.3%Individual annuities 6,348 2.3% - 11.3% 6,592 2.3% - 11.3%Individual universal and variable life 3,816 2.5% - 6.0% 3,416 2.5% - 6.0%Disabled life claim reserves 1,731 3.5% - 6.0% 1,703 3.5% - 6.0%Disability active life reserves 568 3.5% - 6.0% 559 3.5% - 6.0%Guaranteed investment contracts 473 2.5% -13.0% 586 2.5% - 13.0%Other 158 2.5% - 4.5% 155 2.5% - 4.5% Total $ 61,538 $ 59,887
Guaranteed investment contracts (“GICs”) are pension plan investment contracts that pay a specified non-participating interest rate on contributions and pay book value at a specified maturity date. In 2006, the Company exited this market and ceased issuing new contracts.
As of December 31, 2007, GIC reserves totaled $473 million, which included $118 million in contracts that can be surrendered with a market-value adjustment.
As of December 31, 2007, the Company’s GIC reserves by maturity year were as follows:
(In Millions)
2008 $ 1362009 299 2010 72011 31
Total $ 473
b. Liabilities for deposit-type contracts
The following table summarizes liabilities for deposit-type contracts and the range of interest rates by typeof product:
December 31, 2007 2006
Amount Interest Rates Amount Interest Rates($ In Millions)
Funding agreements $ 2,999 2.0% - 10.2% $ 2,280 2.6% -10.2% Dividend accumulations 596 4.3% - 4.7% 607 4.3% - 4.7% Supplementary contracts 562 0.3% - 8.0% 592 0.3% - 8.0% Other 109 4.0% - 8.0% 120 4.0% - 8.0%
Total $ 4,266 $ 3,599
64

Notes to Consolidated Statutory Financial Statements (continued)
Funding agreements are investment contracts sold to domestic and international institutional investors. The terms of the funding agreements do not give the holder the right to terminate the contract prior to the contractually stated maturity date. No funding agreements in these programs have been issued with putprovisions or ratings-sensitive triggers. Currency swaps are employed to eliminate foreign exchange risk from all funding agreements issued to back non-U.S. dollar denominated notes. During 2006, a foreign-denominated medium-term note contract matured and resulted in a foreign currency loss of $102 million recorded in other realized capital losses. This loss was offset by a gain on currency swaps. Assets received for funding agreements may be invested in either the Company’s general account or in a separate account. As of December 31, 2007 and 2006, respectively, general account funding agreement balances totaled$2,999 million and $2,280 million, consisting of $2,953 million and $2,227 million in note programs and $46 million and $53 million in various other agreements.
Under most of the Company’s funding agreement programs, the Company creates an investment vehicle or trust for the purpose of issuing medium-term notes to domestic and/or international investors. Proceedsfrom the sale of the medium-term notes issued by these unconsolidated affiliates are used to purchase funding agreements from the Company. The payment terms of any particular series of notes are matchedby the payment terms of the funding agreement securing the series. Notes were initially issued from theCompany’s $2 billion European Medium-Term Note Program, now in run-off, and are now issued from its$8 billion Global Medium-Term Note Program (“GMTN”). In 2006, the Company added a new contractual separate account for the benefit of the GMTN. Separate account assets and liabilities representsegregated funds administered and invested by the Company.
As of December 31, 2007, the Company’s general account funding agreement balances by maturity year were as follows:
(In Millions)
2008 $ 6102009 780 2010 506 2011 42012 314 Thereafter 785
Total $ 2,999
c. Unpaid claims and claim expense reserves
The Company establishes unpaid claims and claim expense reserves to provide for the estimated costs ofpaying claims made under individual disability and long-term care policies written by the Company. These reserves include estimates for both claims that have been reported and those that have been incurred but not reported, and include estimates of all future expenses associated with the processing and settling of theseclaims. This estimation process is primarily based on the assumption that past experience is an appropriateindicator of future events, and involves a variety of actuarial techniques that analyze experience, trends andother relevant factors. The amounts recorded for unpaid claim and claim expense reserves represent theCompany’s best estimate based upon currently known facts and actuarial guidelines. Accordingly, actual claim payouts may vary from these estimates.
65

Notes to Consolidated Statutory Financial Statements (continued)
The following table summarizes the disabled life unpaid claims and claim expense reserves:
December 31, 2007 2006
(In Millions)
Claim reserves, beginning of year $ 1,835 $ 1,792 Less reinsurance recoverables (107) (88) Net claim reserves, beginning of year 1,728 1,704
Claims paid related to: Current year (19) (21) Prior years (266) (265)
Total claims paid (285) (286)
Incurred related to: Current year’s incurred 221 212 Current year’s interest 5 5Prior years’ incurred 7 14 Prior years’ interest 78 79
Total incurred 311 310
Net claim reserves, end of year 1,754 1,728 Plus reinsurance recoverables 99 107Claim reserves, end of year $ 1,853 $ 1,835
The changes in reserves for incurred claims related to prior years are generally the result of ongoinganalysis of recent loss development trends. In 2007, the $7 million increase in the prior years’ incurred claims was due to actual claim terminations being less than those anticipated by the morbidity table. Disability claims terminate when the recipient reaches the end of the contracted benefit period, they die, orthey return to work full-time. The prior years’ incurred claims in 2006 included a $4 million decrease related to prior year corrections. The prior year corrections were recorded as change in surplus.
The following table reconciles disabled life claim reserves to the net claim reserves at the end of the years presented in the previous table. Disabled life claim reserves are recorded in policyholders’ reserves. Accrued claim liabilities are recorded in other liabilities.
December 31, 2007 2006
(In Millions)
Disabled life claim reserves $ 1,731 $ 1,703 Accrued claim liabilities 23 25Net claim reserves, end of year $ 1,754 $ 1,728
d. Secondary guarantees
The following table shows the liabilities for guaranteed minimum death, accumulation and income benefits on annuity and variable universal life contracts:
Annuity Life GMDB GMAB GMIB GMDB Total
(In Millions)
December 31, 2007 $ 7 $ 9 $ 22 $ 116 $ 154 December 31, 2006 7 6 13 72 98
66

Notes to Consolidated Statutory Financial Statements (continued)
The following table summarizes the account values, net amount at risk and weighted average attained age for annuity contracts with guaranteed minimum death, accumulation and income benefits classified aspolicyholders’ reserves and separate account liabilities. The net amount at risk is defined as the minimumguarantee less the account value calculated on a policy-by-policy basis, but not less than zero.
December 31, 2007 December 31, 2006 Net Weighted Net Weighted
Account Amount Average Account Amount Average Value at Risk Attained Age Value at Risk Attained Age
($ In Millions)
GMDB $ 10,820 $ 119 60 $ 10,513 $ 134 60 GMAB 944 2 57 754 - 56 GMIB 2,135 31 60 1,519 1 59
Account balances of annuity contracts with GMDB guarantees invested in separate accounts were $9,740million and $9,251 million as of December 31, 2007 and 2006, respectively. In addition to the amountinvested in separate account options, $1,080 million and $1,262 million of account balances of annuity contracts with GMDB guarantees were invested in general account options as of December 31, 2007 and2006, respectively.
The Company sells universal life and variable universal life type contracts, a portion of which offer secondary guarantees, such as a guarantee that the policy will not lapse, even if the account value is reduced to zero, as long as the policyholder makes scheduled premium payments. As of December 31,2007 and 2006, the net liability for contracts with secondary guarantees on universal life and variable universal life type contracts including GMDB reserves was $1,190 million and $931 million, respectively.
The determination of GMDB, GMAB, and GMIB reserves is based on actuarial guidelines. Reserve assumptions for GMDB benefits generally anticipate payout between ages 60 and 90. GMAB benefits willbe paid either ten or 20 years from their election, depending on the terms of the benefit. GMIB benefits are generally expected to be initiated between ages 60 and 80; the Company does not expect significantelections after age 80, as the benefit accumulation ceases at that time.
14. Debt
MassMutual began issuing debt in the form of commercial paper in July 2007. Previously, the commercial paper was issued out of MassMutual Funding, LLC, an indirect subsidiary of MassMutual. Commercial paper with a carrying value and face amount of $250 million as of December 31, 2007 had interest rates ranging from4.30% to 5.55%. The commercial paper issued had maturity dates ranging from 1 day to 36 days. Interestexpense for this commercial paper for the year ended December 31, 2007 was $6 million.
The Company and MassMutual Funding, LLC had a $500 million 5-year credit facility with a syndicate of lenders that could be used for general corporate purposes and to support the commercial paper borrowings. In 2007, the credit facility agreement was amended to remove MassMutual Funding, LLC as a borrower. For the years ended December 31, 2007 and 2006, there were no draws on the credit facility.
15. Employee benefit plans
The Company provides multiple benefit plans including retirement plans and life and health benefits to employees, certain employees of unconsolidated subsidiaries, agents and retirees.
a. Pension and savings plans
The Company has funded and unfunded non-contributory defined benefit pension plans that cover substantially all employees and agents. For some participants, benefits are calculated as the greater of aformula based on either final average earnings and length of service or a cash balance formula which calculates benefits based on amounts allocated to participants that take into consideration age, service andsalary during their careers.
67
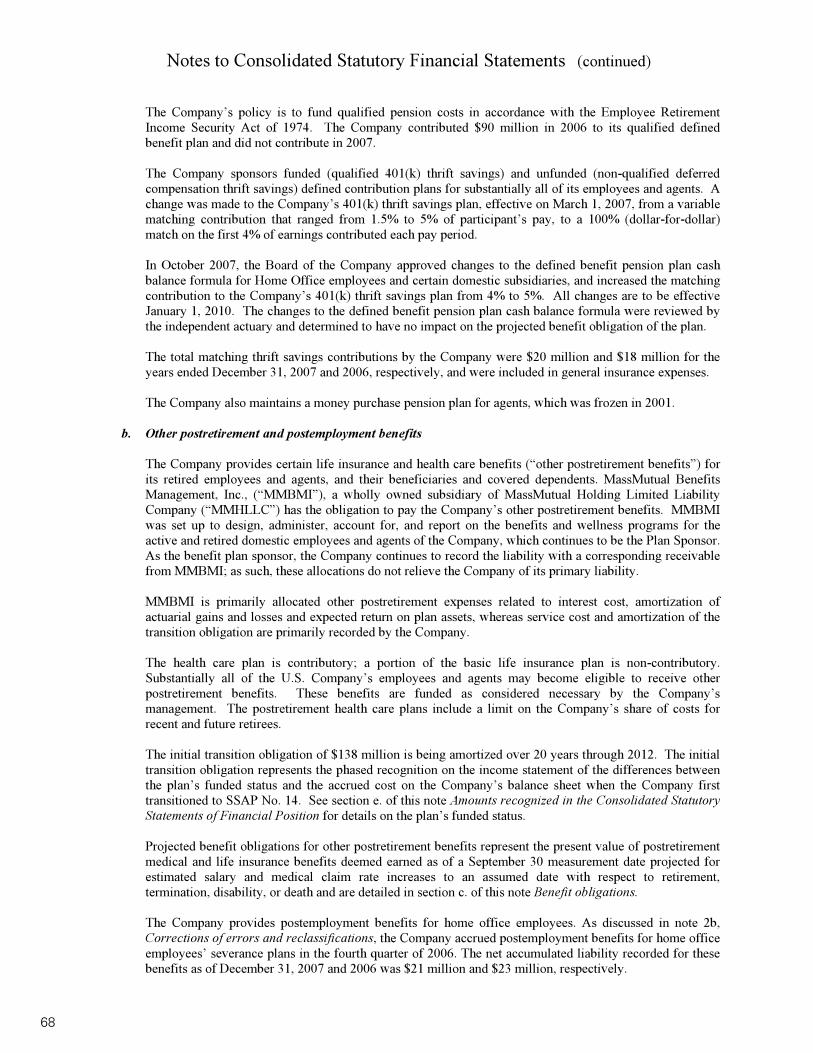
Notes to Consolidated Statutory Financial Statements (continued)
The Company’s policy is to fund qualified pension costs in accordance with the Employee Retirement Income Security Act of 1974. The Company contributed $90 million in 2006 to its qualified defined benefit plan and did not contribute in 2007.
The Company sponsors funded (qualified 401(k) thrift savings) and unfunded (non-qualified deferredcompensation thrift savings) defined contribution plans for substantially all of its employees and agents. A change was made to the Company’s 401(k) thrift savings plan, effective on March 1, 2007, from a variablematching contribution that ranged from 1.5% to 5% of participant’s pay, to a 100% (dollar-for-dollar)match on the first 4% of earnings contributed each pay period.
In October 2007, the Board of the Company approved changes to the defined benefit pension plan cash balance formula for Home Office employees and certain domestic subsidiaries, and increased the matching contribution to the Company’s 401(k) thrift savings plan from 4% to 5%. All changes are to be effective January 1, 2010. The changes to the defined benefit pension plan cash balance formula were reviewed bythe independent actuary and determined to have no impact on the projected benefit obligation of the plan.
The total matching thrift savings contributions by the Company were $20 million and $18 million for theyears ended December 31, 2007 and 2006, respectively, and were included in general insurance expenses.
The Company also maintains a money purchase pension plan for agents, which was frozen in 2001.
b. Other postretirement and postemployment benefits
The Company provides certain life insurance and health care benefits (“other postretirement benefits”) forits retired employees and agents, and their beneficiaries and covered dependents. MassMutual BenefitsManagement, Inc., (“MMBMI”), a wholly owned subsidiary of MassMutual Holding Limited LiabilityCompany (“MMHLLC”) has the obligation to pay the Company’s other postretirement benefits. MMBMIwas set up to design, administer, account for, and report on the benefits and wellness programs for theactive and retired domestic employees and agents of the Company, which continues to be the Plan Sponsor.As the benefit plan sponsor, the Company continues to record the liability with a corresponding receivablefrom MMBMI; as such, these allocations do not relieve the Company of its primary liability.
MMBMI is primarily allocated other postretirement expenses related to interest cost, amortization ofactuarial gains and losses and expected return on plan assets, whereas service cost and amortization of the transition obligation are primarily recorded by the Company.
The health care plan is contributory; a portion of the basic life insurance plan is non-contributory.Substantially all of the U.S. Company’s employees and agents may become eligible to receive other postretirement benefits. These benefits are funded as considered necessary by the Company’smanagement. The postretirement health care plans include a limit on the Company’s share of costs forrecent and future retirees.
The initial transition obligation of $138 million is being amortized over 20 years through 2012. The initialtransition obligation represents the phased recognition on the income statement of the differences between the plan’s funded status and the accrued cost on the Company’s balance sheet when the Company first transitioned to SSAP No. 14. See section e. of this note Amounts recognized in the Consolidated Statutory Statements of Financial Position for details on the plan’s funded status.
Projected benefit obligations for other postretirement benefits represent the present value of postretirementmedical and life insurance benefits deemed earned as of a September 30 measurement date projected for estimated salary and medical claim rate increases to an assumed date with respect to retirement, termination, disability, or death and are detailed in section c. of this note Benefit obligations.
The Company provides postemployment benefits for home office employees. As discussed in note 2b, Corrections of errors and reclassifications, the Company accrued postemployment benefits for home officeemployees’ severance plans in the fourth quarter of 2006. The net accumulated liability recorded for these benefits as of December 31, 2007 and 2006 was $21 million and $23 million, respectively.
68
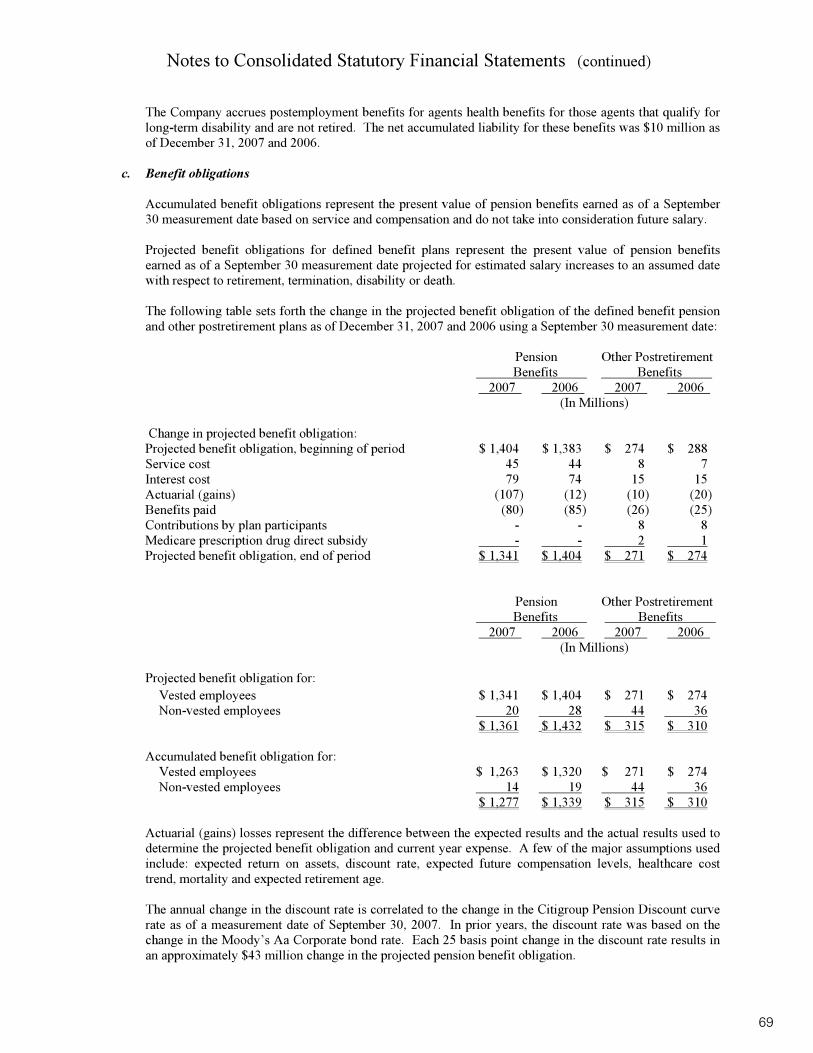
Notes to Consolidated Statutory Financial Statements (continued)
The Company accrues postemployment benefits for agents health benefits for those agents that qualify for long-term disability and are not retired. The net accumulated liability for these benefits was $10 million asof December 31, 2007 and 2006.
c. Benefit obligations
Accumulated benefit obligations represent the present value of pension benefits earned as of a September 30 measurement date based on service and compensation and do not take into consideration future salary.
Projected benefit obligations for defined benefit plans represent the present value of pension benefitsearned as of a September 30 measurement date projected for estimated salary increases to an assumed date with respect to retirement, termination, disability or death.
The following table sets forth the change in the projected benefit obligation of the defined benefit pensionand other postretirement plans as of December 31, 2007 and 2006 using a September 30 measurement date:
Pension Other Postretirement Benefits Benefits
2007 2006 2007 2006 (In Millions)
Change in projected benefit obligation:Projected benefit obligation, beginning of period $ 1,404 $ 1,383 $ 274 $ 288 Service cost 45 44 8 7 Interest cost 79 74 15 15 Actuarial (gains) (107) (12) (10) (20) Benefits paid (80) (85) (26) (25) Contributions by plan participants - - 8 8 Medicare prescription drug direct subsidy - - 2 1Projected benefit obligation, end of period $ 1,341 $ 1,404 $ 271 $ 274
Pension Other Postretirement Benefits Benefits
2007 2006 2007 2006 (In Millions)
Projected benefit obligation for: Vested employees $ 1,341 $ 1,404 $ 271 $ 274 Non-vested employees 20 28 44 36
$ 1,361 $ 1,432 $ 315 $ 310
Accumulated benefit obligation for: Vested employees $ 1,263 $ 1,320 $ 271 $ 274 Non-vested employees 14 19 44 36
$ 1,277 $ 1,339 $ 315 $ 310
Actuarial (gains) losses represent the difference between the expected results and the actual results used todetermine the projected benefit obligation and current year expense. A few of the major assumptions used include: expected return on assets, discount rate, expected future compensation levels, healthcare cost trend, mortality and expected retirement age.
The annual change in the discount rate is correlated to the change in the Citigroup Pension Discount curverate as of a measurement date of September 30, 2007. In prior years, the discount rate was based on the change in the Moody’s Aa Corporate bond rate. Each 25 basis point change in the discount rate results inan approximately $43 million change in the projected pension benefit obligation.
69
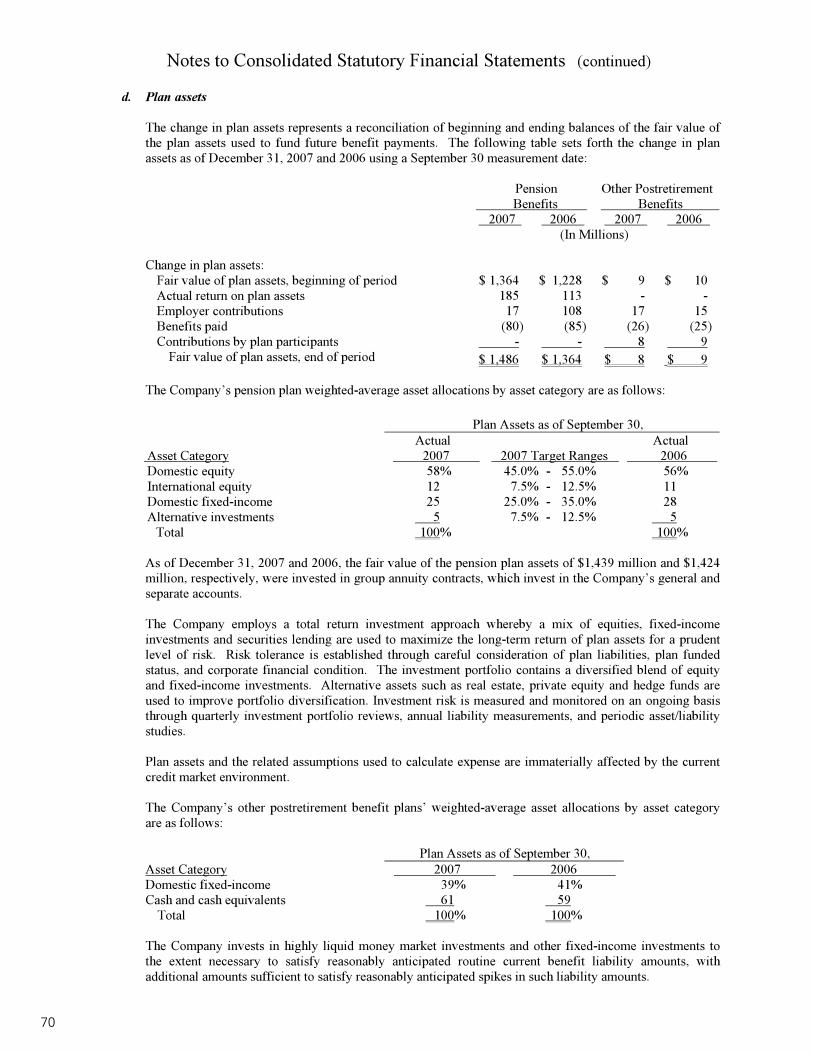
Notes to Consolidated Statutory Financial Statements (continued)
d. Plan assets
The change in plan assets represents a reconciliation of beginning and ending balances of the fair value ofthe plan assets used to fund future benefit payments. The following table sets forth the change in planassets as of December 31, 2007 and 2006 using a September 30 measurement date:
Pension Other Postretirement Benefits Benefits
2007 2006 2007 2006 (In Millions)
Change in plan assets: Fair value of plan assets, beginning of period $ 1,364 $ 1,228 $ 9 $ 10 Actual return on plan assets 185 113 - - Employer contributions 17 108 17 15 Benefits paid (80) (85) (26) (25) Contributions by plan participants - - 8 9
Fair value of plan assets, end of period $ 1,486 $ 1,364 $ 8 $ 9
The Company’s pension plan weighted-average asset allocations by asset category are as follows:
Plan Assets as of September 30,
Asset Category Actual
2007 2007 Target RangesActual 2006
Domestic equity 58% 45.0% - 55.0% 56% International equity 12 7.5% - 12.5% 11 Domestic fixed-income 25 25.0% - 35.0% 28 Alternative investments 5 7.5% - 12.5% 5
Total 100% 100%
As of December 31, 2007 and 2006, the fair value of the pension plan assets of $1,439 million and $1,424 million, respectively, were invested in group annuity contracts, which invest in the Company’s general and separate accounts.
The Company employs a total return investment approach whereby a mix of equities, fixed-incomeinvestments and securities lending are used to maximize the long-term return of plan assets for a prudentlevel of risk. Risk tolerance is established through careful consideration of plan liabilities, plan fundedstatus, and corporate financial condition. The investment portfolio contains a diversified blend of equityand fixed-income investments. Alternative assets such as real estate, private equity and hedge funds areused to improve portfolio diversification. Investment risk is measured and monitored on an ongoing basisthrough quarterly investment portfolio reviews, annual liability measurements, and periodic asset/liabilitystudies.
Plan assets and the related assumptions used to calculate expense are immaterially affected by the current credit market environment.
The Company’s other postretirement benefit plans’ weighted-average asset allocations by asset category are as follows:
Plan Assets as of September 30, Asset Category 2007 2006 Domestic fixed-income 39% 41% Cash and cash equivalents 61 59
Total 100% 100%
The Company invests in highly liquid money market investments and other fixed-income investments tothe extent necessary to satisfy reasonably anticipated routine current benefit liability amounts, with additional amounts sufficient to satisfy reasonably anticipated spikes in such liability amounts.
70

Notes to Consolidated Statutory Financial Statements (continued)
e. Amounts recognized in the Consolidated Statutory Statements of Financial Position
The funded status of the defined benefit plans is a comparison of the projected benefit obligations to the assets related to the respective plan, if any. The difference between the two represents amounts that havebeen appropriately recognized as expenses in prior periods which appear as the net amount recognized orrepresent amounts that will be recognized as expenses in the future through the amortization of the unrecognized net actuarial loss, unrecognized prior service costs, and remaining initial transition. The following table sets forth the funded status of the plans as of December 31, 2007 and 2006 using a September 30 measurement date, and then shows how the funded status is reconciled to the net asset and/orliability recognized in the Consolidated Statements of Financial Position.
Pension Benefits
Other Postretirement Benefits
2007 2006 2007 2006 (In Millions)
Fair value of plan assets, end of period $ 1,486 $ 1,364 $ 8 $ 9 Less projected benefit obligations, end of period 1,341 1,404 271 274
Funded status $ 145 $ (40) $ (263) $ (265)
Funded status $ 145 $ (40) $ (263) $ (265)Unrecognized net actuarial loss 224 436 27 38 Unrecognized prior service cost - 1 2 2 Remaining net obligation at initial date of application 5 6 26 31Effect of fourth quarter activity 4 6 5 6Subtotal net amount recognized 378 409 (203) (188) Less assets nonadmitted 529 558 - -
Net amount recognized $ (151) $ (149) $ (203) $ (188)
The qualified pension plan was over funded by $336 million and $165 million and the non-qualifiedpension plans are not funded and have total projected benefit obligations of $191 million and $205 millionfor the periods ended December 31, 2007 and 2006, respectively.
f. Prepaid and accrued benefit costs
The net pension amount recognized is broken into its respective prepaid and accrued benefit costs which areincluded in other than invested assets and other liabilities, respectively, in the Company’s Consolidated Statutory Statements of Financial Position. The Company continues to record the liability with a corresponding receivable from MMBMI.
The status of these plans as of December 31, 2007 and 2006, using a September 30 measurement date, adjusted for fourth quarter activity, is summarized below:
Pension Benefits
Other Postretirement Benefits
2007 2006 2007 2006 (In Millions) Amounts recognized in the Consolidated
Statutory Statements of Financial Position:Prepaid benefit cost $ 524 $ 552 $ - $ - Intangible assets 5 6 - - Less assets nonadmitted (529) (558) - -
Net prepaid pension plan asset - - - - Accrued benefit cost (178) (192) (203) (188)Surplus 27 43 - -
Net amount recognized $ (151) $ (149) $ (203) $ (188)
71

Notes to Consolidated Statutory Financial Statements (continued)
The change in net amount recognized for net pension benefits is as follows:
Pension Benefits 2007 2006
(In Millions) Subtotal net amount recognized, beginning of year $ 409 $ 361 Employer contributions 17 108 Periodic cost (47) (61) Other (1) 1Subtotal net amount recognized 378 409 Nonadmitted asset (529) (558)
Net amount recognized, end of year $ (151) $ (149)
g. Net periodic (benefit) cost
The net periodic (benefit) cost is the annual accounting expense or income that the Company recognized and included in general insurance expenses in the Consolidated Statutory Statements of Income for the yearsended December 31, 2007 and 2006 is as follows:
Pension Other
Postretirement Benefits Benefits
2007 2006 2007 2006 (In Millions)
Components of net periodic (benefit) cost:Service cost $ 45 $ 44 $ 8 $ 7 Interest cost 79 74 15 15 Expected return on plan assets (101) (90) - - Amortization of unrecognized transition obligation - 1 5 5Amount of recognized net actuarial and other losses 24 32 1 1
Total net periodic cost $ 47 $ 61 $ 29 $ 28
Decrease in minimum liability included in surplus $ (16) $ (4) $ - $ -
The Company expects to spend $38 million to meet its expected obligations under its nonqualified pensionplans and other postretirement benefit plans in 2008.
The expected future pension and other postretirement benefit payments and Medicare prescription drugdirect government subsidy receipts, which reflect expected future service, are as follows:
Medicare Other Prescription Postretirement Direct Government
Pension Benefits Benefits Subsidy (In Millions) 2008 $ 66 $ 23 $ 22009 69 23 2 2010 73 24 2 2011 77 25 3 2012 82 25 3 2013-2017 488 136 14
72

Notes to Consolidated Statutory Financial Statements (continued)
The net expense charged to operations for all employee and agent benefit plans, for the years endedDecember 31, 2007 and 2006 are as follows:
2007 2006 (In Millions)
Life $ 2 $ 2Health 39 43 Postretirement 29 28 Postemployment (2) 23 Disability 2 2Pension 47 61 Thrift 20 18 Other benefits 10 15Total $ 147 $ 192
h. Assumptions
The assumptions as of December 31, 2007 and 2006 using a September 30 measurement date used by theCompany to calculate the benefit obligations and to determine the benefit costs in the year are as follows:
Pension Other
Postretirement Benefits Benefits
2007 2006 2007 2006
Weighted-average assumptions used to determine:Benefit obligations:
Discount rate 6.25% 5.75% 6.25% 5.75% Rate of increase in future compensation levels 4.00% 4.00% 4.00% 4.00%
Net periodic benefit cost: Discount rate 5.75% 5.50% 5.75% 5.50% Long term expected rate of return on plan assets 7.75% 7.75% 3.00% 3.00% Rate of increase in future compensation levels 4.00% 4.00% 4.00% 4.00%
Assumed health care cost trend rates: Health care cost trend rate - - 7.00% 8.00% Ultimate health care cost trend rate after gradual
decrease until 2013 for both years 2007 and 2006, respectively - - 5.00% 5.00%
The long-term rate of return for the qualified pension plan is established using a building block approachwith proper consideration for diversification and rebalancing. Historical markets are studied and long-termhistorical relationships between equities and fixed-income are preserved consistent with the widely accepted capital market principle that assets with higher volatility generate a greater return over the long term.Current market factors such as inflation and interest rates are evaluated before long-term capital market assumptions are determined.
Assumed health care cost trend rates have an effect on the amounts reported for the health care plans. A onepercentage point change in the assumed health care cost trend rate would have had the following effects in2007:
One Percentage One Percentage Point Increase Point Decrease
(In Millions) Effect on total service and interest cost $ 2 $ (2) Effect on other postretirement benefit obligation 23 (20)
73

Notes to Consolidated Statutory Financial Statements (continued)
i. Employee compensation plans
A short-term incentive compensation plan exists that is offered to substantially all employees not covered byanother incentive plan. Employees are eligible for an annual bonus based on individual and company performance. The costs associated with the short-term incentive compensation plan were recorded by the Company.
Non-qualified deferred compensation plans are offered allowing certain employees and agents to elect to defer a portion of their compensation. Several shadow investment options are available under these plans.The costs associated with the nonqualified deferred compensation plans were recorded by the Company with less than $1 million being allocated to affiliated unconsolidated subsidiaries, including MMHLLC.
Key employees of the Company have been granted performance units in a long-term incentive compensation plan. Under this plan, performance units are granted at the start of each three year performance period. An individual employee’s participation and/or the number of units granted may vary from one cycle to the next based on performance, impact on organization and relative contribution. Each unit’s value is based on the three year consolidated results for the total enterprise on pre-established goals and measures for each year within each performance cycle. Awards are paid at the completion of each three year performance period and are subject to forfeiture if separation from service occurs for reasons other than retirement, death, disability, divestiture or position elimination. In 2007, all of the costs were recorded by the Company.
In October 2007, the Board of the Company approved a new long-term incentive compensation plan. It isintended that this new plan be utilized for all long-term awards granted beginning in 2008, and that no new awards be granted under the former long-term performance unit plan. Awards under this new plan may be granted to key employees of the Company or its subsidiaries and take the form of phantom stockappreciation rights (“PSAR”) and phantom restricted shares (“PRS”). The phantom stock utilized under the plan is intended to be a measure of earnings for the purposes of this long term incentive plan. These awards do not convey any ownership rights and will be settled in cash only. PSAR vest in full three years after the grant date, followed by a two year exercise period. PRS vest in one-third increments following 3, 4, and 5 years from the grant date. PRS awards are settled in cash following vesting. Awards are subject to forfeiture in the event of termination prior to vesting (other than retirement, death, disability or job elimination).
Several key employees of the Company and MMHLLC were granted deferred compensation agreementswhich provide fixed amounts that vest and become payable at retirement. These fixed amounts are invested in several shadow investment options specified by each agreement that allow for additional earnings to becredited based on market performance or at a stated interest rate. All employees who were granted these agreements have left the company and only two are currently receiving quarterly payments over a number of years. During 2007, less than $1 million of costs related to the deferred compensation agreements were recorded by the Company.
16. Federal income taxes
Total federal income taxes are based upon the Company’s best estimate of its current and deferred tax liabilities. Current tax expense is reported on the income statement as federal income tax expense if resulting fromoperations, and within net realized capital gains (losses) if resulting from capital transactions. Deferred incometaxes, which provide for book versus tax temporary differences, are subject to limitations and are reportedwithin surplus. Changes to deferred income taxes are reported on various lines within surplus. Limitations of deferred income taxes are recorded on the change in nonadmitted assets line, whereas, deferred taxes associatedwith net unrealized capital gains (losses) are shown within that caption on a net basis. Accordingly, the reporting of statutory to tax temporary differences, such as reserves and policy acquisition costs, and ofstatutory to tax permanent differences, such as policyholder dividends and tax credits, results in effective tax rates that differ from the federal statutory tax rate.
74

Notes to Consolidated Statutory Financial Statements (continued)
The components of the net deferred tax asset recognized in the Company’s assets, liabilities and surplus are asfollows:
December 31, 2007 2006
(In Millions)
Total deferred tax assets $ 2,742 $ 2,593 Total deferred tax liabilities (1,323) (1,214) Net deferred tax asset 1,419 1,379 Deferred tax assets nonadmitted (837) (851) Net admitted deferred tax asset $ 582 $ 528Decrease in nonadmitted asset $ 14 $ 16
The provision for current tax expense on earnings is as follows:
Years Ended December 31, 2007 2006
(In Millions)
Federal income tax expense (benefit) on operating earnings $ 133 $ (52) Foreign income tax expense on operating earnings 11 10
144 (42) Federal income tax expense on net realized capital gains 44 39Total federal and foreign income tax expense (benefit) $ 188 $ (3)
The tax effects of temporary differences that give rise to significant portions of the deferred tax assets and deferred tax liabilities are as follows:
Years Ended December 31, 2007 2006
(In Millions) Deferred tax assets:
Reserve items $ 707 $ 722 Policy acquisition costs 564 537 Investment items 349 325 Nonadmitted assets 334 307 Policyholders’ dividend related items 301 261 Pension and compensation related items 201 188 Expense items 149 135 Unrealized investment losses 119 91 Other 18 27
Total deferred tax assets 2,742 2,593 Nonadmitted deferred tax assets (837) (851)
Admitted deferred tax assets 1,905 1,742
Deferred tax liabilities: Unrealized investment gains 729 421 Deferred and uncollected premium 189 184 Pension items 184 194 Investment items 136 345 Other 85 70
Total deferred tax liabilities 1,323 1,214Net admitted deferred tax asset $ 582 $ 528
75

Notes to Consolidated Statutory Financial Statements (continued)
The change in net deferred income taxes, excluding amounts nonadmitted, is comprised of the following and ispresented as a change to net unrealized capital gains (losses) and net deferred income taxes within the StatutoryStatements of Changes in Surplus:
Years Ended December 31, 2007 2006
(In Millions)
Change in deferred tax assets $ 149 $ 60 Change in deferred tax liabilities (109) 13
Increase in deferred tax asset 40 73 Less items not recorded in the change in net deferred income taxes:
Tax effect of unrealized gains excluding cumulative effect of adoption of accounting principles in 2006 308 (128)
Cumulative effect of adoption of accounting principles - (7) Balance transferred from subsidiary - (13) Tax effect of unrealized losses (28) 59 Prior year correction (4) (41)
Increase (decrease) in net deferred income taxes $ 316 $ (57)
As of December 31, 2007, the Company had no net operating or capital loss carryforwards to include in deferred income taxes.
The components of federal and foreign income tax on operating items is recorded on the Consolidated StatutoryStatements of Income and Consolidated Statutory Statements of Changes in Surplus and is different from that which would be obtained by applying the statutory federal income tax rate to operating income before taxes.The significant items causing this difference are as follows:
Years Ended December 31, 2007 2006
($ In Millions)
AmountEffective Tax Rate Amount
Effective Tax Rate
Provision computed at statutory rate $ 116 35% $ 258 35% Change in reserve valuation basis 2 1 (7) (1) Policyholders’ dividends - - (5) (1) Investment items (166) (50) (77) (10) Tax credits (54) (16) (56) (8) Nonadmitted assets (27) (8) (49) (7) Other 1 - (10) (1)
Total statutory income tax (benefit) expense $ (128) (38)% $ 54 7%
Federal and foreign income tax expense (benefit) $ 188 $ (3) Change in net deferred income taxes (316) 57
Total statutory income tax (benefit) expense $ (128) $ 54
During the years ended December 31, 2007 and 2006, the Company paid federal income taxes in the amount of$272 million and $25 million, respectively. As of December 31, 2007, federal income taxes paid in the current and prior years that will be available for recovery in the event of future net losses are as follows: $172 million in 2007, $78 million in 2006, and $40 million in 2005.
The Company and its eligible U.S. subsidiaries are included in a consolidated U.S. federal income tax return.The Company and its subsidiaries and affiliates also file income tax returns in various states and foreignjurisdictions. The Company and its eligible subsidiaries and certain affiliates (the “Parties”) have executed andare subject to a written tax allocation agreement (the “Agreement”). The Agreement sets forth the manner in which the total combined federal income tax is allocated among the Parties. The Agreement provides theCompany with the enforceable right to recoup federal income taxes paid in prior years in the event of future net
76

Notes to Consolidated Statutory Financial Statements (continued)
losses, which it may incur. Further, the Agreement provides the Company with the enforceable right to utilizeits net losses carried forward as an offset to future net income subject to federal income taxes.
The Job Creation and Worker Assistance Act of 2002 suspended the limitation on the deductibility of the Company’s dividends paid to policyholders for 2001 through 2003. The Pension Funding Equity Act of 2004repealed that limitation for 2005 and later years. Based on data released by the United States Internal RevenueService (“IRS”) during 2006 and 2005, the Company revised its estimate used at year end 2005 and 2004, respectively, of the financial statement effect of the limitation.
In June 2006, the Financial Accounting Standards Board (“FASB”) issued FASB Interpretation No. (“FIN”) 48,“Accounting for Uncertainty in Income Taxes.” The NAIC is still evaluating the applicability of FIN 48 tostatutory financial reporting. Because statutory guidance has not been issued, the Company has not yet determined the statutory impact of adoption on its statutory financial statements. The Company continues torecognize tax benefits and related reserves in accordance with SSAP No. 5, “Liabilities, Contingencies andImpairments of Assets”.
The following is a reconciliation of the beginning and ending liability for unrecognized tax benefits:
(In Millions)
Balance, January 1, 2007 $ 216Gross increase related to positions taken in prior years 1Gross increase related to positions taken in current year 17 Gross decrease related to settlements (52)Gross increase (decrease) related to lapse of statutes of limitations -Balance, December 31, 2007 $ 182
Included in the liability for unrecognized tax benefits at December 31, 2007, are $163 million of tax positionsfor which the ultimate deductibility is highly certain but for which there is uncertainty about the timing of suchdeductibility. The liability for unrecognized tax benefit balance as of December 31, 2007 includes $19 millionof unrecognized tax benefits that, if recognized, would impact the Company’s effective tax rate. It is reasonablypossible that the total amount of unrecognized tax benefits will decrease within the next 12 months by approximately $6 million as a result of the settlement of certain tax audits.
The Company recognizes accrued interest and penalties related to the liability for unrecognized tax benefits as a component of the provision for income taxes. The amount of interest and penalties recognized in theCompany’s financial statements as of December 31, 2007 was $38 million.
The IRS recently completed its examination of the Company’s income tax returns for the tax years 2001through 2003. The IRS issued a Revenue Agent’s Report proposing to assess the Company additional incometaxes for the years 2001 through 2003. In 2007, the Company made additional payments of $81 million withrespect to tax years 2001 through 2003. In 2007, the Company filed a Letter of Protest with IRS Appeals contesting some of the proposed adjustments. Even if the Company were not to prevail on these contestedproposed adjustments, the Company would not suffer a material change to its financial position or liquidity. Settlement has been reached with the IRS for tax years prior to 2001, although the Company has reserved the right to pursue refunds for certain pre-2001 contested issues. In 2006, the Company settled with the federal government tax refund disputes on issues for the years 1984 through 1987, and 1998 through 2000. As a result of these settlements, the Company’s tax liability was reduced by $77 million in 2006. As of December 31, 2007 and 2006, the Company has no protective deposits recognized as admitted assets.
77

Notes to Consolidated Statutory Financial Statements (continued)
17. Business risks, commitments and contingencies
a. Risks and uncertainties
The Company operates in a business environment subject to various risks and uncertainties. Such risks anduncertainties include, but are not limited to, interest rate risk and credit risk. Interest rate risk is thepotential for interest rates to change, which can cause fluctuations in the value of investments and amounts due to policyholders. To the extent that fluctuations in interest rates cause the duration of assets andliabilities to differ, the Company controls its exposure to this risk by, among other things, asset/liability management techniques that account for the cash flow characteristics of the assets and liabilities.
The Company’s currency exchange risk is related to non-U.S. dollar denominated investments, its medium-term note programs and international operations. The Company mitigates its currency exposures related toits investments and medium-term note programs through the use of derivatives.
Asset based fees calculated as a percentage of the separate account assets are a source of revenue to theCompany. Gains and losses in the equity markets may result in corresponding increases and decreases in the Company’s separate account assets and related revenue.
Risks related to credit markets
Credit risk is the risk that issuers of investments owned by the Company may default or that other parties may not be able to pay amounts due to the Company. The Company attempts to manage its investments tolimit credit risk by diversifying its portfolio among various security types and industry sectors.Management did not believe that significant concentrations of credit risk existed as of and for the yearended December 31, 2006.
In 2007, the slowing of the U.S housing market, rising residential mortgage rates, and relaxed underwritingstandards by residential mortgage loan originators have led to higher delinquency and loss rates, reducedcredit availability and liquidity in the residential loan market. The Company has implemented a stringentreview process for determining the fair value of securities containing these risk characteristics. Cash flows were modeled for every bond using prepayment and default assumptions that varied according to collateralattributes. Bonds with nontrivial credit exposure were modeled across a variety of prepayment and defaultscenarios, spanning the range of possible outcomes specific to each individual security. Resulting cash flows were discounted at spreads consistent with the residential mortgage market’s weakness and theuncertainty around the magnitude and timing of cash flows. This review process provided a framework for deriving other-than-temporary impairment losses. In these analyses, data quality of loan vintage, collateraltype and investment structure are critical elements of determining fair values.
The fair value of subprime and Alt-A investments are highly sensitive to evolving conditions that can impair the cash flows realized by investors. Determining fair value is made more difficult by the lack ofobservable prices, uncertainty of credit ratings, and the current liquidity crisis which may continue into the foreseeable future. The ultimate emergence of losses is subject to uncertainty. A significant, unexpected credit event could change management’s view of these assets. If defaults were to increase significantlyabove the stresses imposed in our analysis or collateral performance was much worse than expected, management would need to reassess whether such credit events have changed the underlying dynamics ofthe market and the expected performance of these assets.
b. Leases
The Company leases office space and equipment in the normal course of business under various non-cancelable operating lease agreements. Additionally, the Company, as lessee, has entered into various sublease agreements with affiliates for office space, such as OppenheimerFunds, Inc. and Babson Capital. Total rental expense on net operating leases was $41 million and $35 million, which is net of $22 million and $19 million of sublease receipts, for the years ended December 31, 2007 and 2006, respectively.
78

Notes to Consolidated Statutory Financial Statements (continued)
Future minimum commitments for all net operating lease contractual obligations as of December 31, 2007were as follows:
Leases SubleasesNet Operating
Leases (In Millions)
2008 $ 60 $ 22 $ 38 2009 54 22 32 2010 51 24 27 2011 45 22 23 2012 34 17 17 Thereafter 101 56 45
Total $ 345 $ 163 $ 182
c. Guaranty funds
The Company is subject to insurance guaranty fund laws in the states in which it does business. These laws assess insurance companies amounts to be used to pay benefits to policyholders and policy claimants ofinsolvent insurance companies. Many states allow these assessments to be credited against future premium taxes. The Company believes such assessments in excess of amounts accrued will not materially impact its financial position, results of operations, or liquidity.
d. Litigation
The Company is involved in litigation arising in and out of the normal course of business, which seek both compensatory and punitive damages. While the Company is not aware of any actions or allegations that should reasonably give rise to a material adverse impact to the Company’s financial position or liquidity, the outcome of litigation cannot be foreseen with certainty.
The Company, together with numerous other defendants, has been named in an adversary proceeding in theEnron bankruptcy. In addition, in June 2005, the Company’s former Chief Executive Officer (“formerCEO”) filed a demand for arbitration contesting his termination “for cause” from the Company. In 2006,the arbitration panel ruled that the former CEO’s conduct did not satisfy his Employment Contract’s requirement of a “for cause” termination and awarded him a portion of the compensation and severance benefits specified in the contract. The Company has appealed this ruling to the Massachusetts state court. In 2007, the Company accrued an additional $9 million in expense, including $6 million of interest, bringing the total accrual for this matter to approximately $80 million as of December 31, 2007.
In 2005, the Company received final approval of a nationwide class action settlement involving allegedinsurance sales practices claims. In 2006, all appeals to this settlement were resolved. The settlement classincludes all policyholders, with certain limited exceptions, who have or had an ownership interest inpermanent life policies, term life policies or disability income policies issued between January 1, 1983 and December 31, 2003. Through December 31, 2007, the Company has paid $145 million of the original $320 million accrual. Additionally in 2007, the Company revised this estimate and reduced the liability by $23 million.
It is the opinion of management that the ultimate resolution of these matters will not materially impact the Company’s financial position or liquidity. However, the outcome of a particular proceeding may bematerial to the Company’s operating results for a particular period depending upon, among other factors, the size of the loss or liability and the level of the Company’s income for the period.
e. Regulatory inquiries
The Company is subject to governmental and administrative proceedings and regulatory examinations andinvestigations in the ordinary course of its business. The Company has cooperated fully with these regulatory agencies with regard to their examinations and investigations and has responded to informationrequests and comments.
79

Notes to Consolidated Statutory Financial Statements (continued)
These examinations and investigations include industry-wide investigations of issues such as (a) late trading and market timing in connection with mutual funds and variable insurance contracts, (b) revenuesharing, (c) compensation and bidding arrangements and possible anti-competitive activities between insurance producers and brokers and issuers of insurance products, and (d) marketing, pricing and sales ofretirement products. In connection with examinations and investigations, the Company has been contactedby various regulatory agencies and state attorneys general including the Securities and ExchangeCommission, U.S. Department of Labor, Financial Industry Regulatory Authority, Commonwealth of Massachusetts Division of Insurance, the State of Connecticut Insurance Department, and the AttorneysGeneral of Connecticut, Massachusetts and New York.
The Company believes that it is reasonable to expect that regulatory inquiries, examinations and investigations into the financial services industry will continue for the foreseeable future and may result in new industry-wide legislation, rules, and regulations that could significantly affect the financial services industry as a whole. It is the opinion of management that the ultimate resolution of these matters will notmaterially impact the Company’s financial position or liquidity. The outcome of a particular matter may bematerial to the Company’s operating results for a particular period depending upon, among other factors, the size of the matter and the level of the Company’s income for the period.
f. Commitments
In the normal course of business, the Company provides specified guarantees and funding to MMHLLCand certain of its subsidiaries. As of December 31, 2007 and 2006, the Company had approximately $50 million and $130 million, respectively, of outstanding unsecured funding commitments. As of December 31, 2007 and 2006, the Company had no liability attributable to the funding commitments.
In the normal course of business, the Company enters into letter of credit arrangements. As of December 31, 2007 and 2006, the Company had approximately $27 million and $87 million of outstanding letters of credit, respectively. As of December 31, 2007, the Company had a $1 million funding request attributableto these letter of credit arrangements. As of December 31, 2006, the Company had no funding requestsattributable to the letter of credit arrangements.
In the normal course of business, the Company enters into commitments to purchase certain investments. The majority of these commitments have funding periods that extend between one and eight years. The Company is not required to fund commitments once the commitment period expires. As of December 31,2007, the Company had the following commitments:
There-2008 2009 2010 2011 after Total
(In Millions)
Private placements $ 637 $ 218 $ 105 $ 39 $ 262 $ 1,261 Mortgage loans 233 320 208 37 13 811 Real estate 59 - - - - 59 Partnerships and LLC’s 403 328 168 363 1,388 2,650 LIHTC investments (including
equity contributions) 9 49 5 - 4 67Total $ 1,341 $ 915 $ 486 $ 439 $ 1,667 $ 4,848
In connection with acquisitions and dispositions, the Company had commitments related to property lease arrangements, certain indemnities, investments and other business obligations, in the normal course ofbusiness. As of December 31, 2007 and 2006, the Company had no outstanding obligations attributable to these commitments.
Certain commitments and guarantees of the Company provide for the maintenance of subsidiary regulatorycapital and surplus levels and liquidity sufficient to meet certain obligations. These commitments and guarantees are not limited. As of December 31, 2007 and 2006, the Company had no outstandingobligations attributable to these commitments and guarantees.
80

Notes to Consolidated Statutory Financial Statements (continued)
18. Withdrawal characteristics
a. Annuity actuarial reserves and liabilities for deposit-type contracts
The withdrawal characteristics of the Company’s annuity actuarial reserves and deposit- type contracts as of December 31, 2007 are illustrated below:
Amount % of Total (In Millions)
Subject to discretionary withdrawal - With fair value adjustment $ 7,507 12% At book value less current surrender charge of 5% or more 859 1 At fair value 39,429 65
Subtotal 47,795 78 Subject to discretionary withdrawal -
At book value without fair value adjustment 4,859 8 Not subject to discretionary withdrawal 8,641 14
Total $ 61,295 100%
The following is the reconciliation of total annuity actuarial reserves and liabilities for deposit-typecontracts as of December 31, 2007:
(In Millions) Statutory Statements of Financial Position:
Policyholders’ reserves – group annuities $ 8,638Policyholders’ reserves – individual annuities 6,348Policyholders’ reserves – guaranteed investment contracts 473 Liabilities for deposit type contracts 4,266
Subtotal 19,725Separate Account Annual Statement:
Annuities 39,423Other annuity contract deposit-funds and guaranteed interest contracts 2,147
Subtotal 41,570
Total $ 61,295
81

Notes to Consolidated Statutory Financial Statements (continued)
b. Separate accounts
The Company has separate accounts classified as the following: (1) indexed, which are invested to mirroran established index based on the guarantee; (2) non-indexed, which have reserve interest rates at nogreater than 4% and/or to fund a long-term interest guarantee in excess of a year that does not exceed 4%;and (3) non-guaranteed, which are variable accounts where the benefit is determined by the performance and/or market value of the investment held in the separate account with incidental risk, notional expense, and minimum death benefit guarantees.
Information regarding the separate accounts of the Company as of and for the year ended December 31,2007 is as follows:
Non- Non- Indexed Indexed Guaranteed Total
(In Millions)
Net premium, considerations or deposits $ 500 $ - $ 6,967 $ 7,467
Reserves: For accounts with assets at:
Fair value $ 2,141 $ 1,433 $ 44,779 $ 48,353Amortized cost - 858 - 858
Total reserves 2,141 2,291 44,779 49,211Other liabilities - - 836 836
Total $ 2,141 $ 2,291 $ 45,615 $ 50,047
By withdrawal characteristics: Subject to withdrawal:
With fair value adjustment $ 1,135 $ - $ - $ 1,135 At book value without fair value
adjustment and current surrender charge of 5% or more - - 1,050 1,050
At fair value, which may or may nothave a surrender charge - 2,291 42,828 45,119
At book value without fair value adjustment and with current surrender charge less than 5% - - 901 901
Subtotal 1,135 2,291 44,779 48,205Other liabilities 1,006 - 836 1,842
Total $ 2,141 $ 2,291 $ 45,615 $ 50,047
For the year ended December 31, 2007, net transfers to separate accounts of $1,059 million, included in change in policyholders’ reserves on the Consolidated Statutory Statements of Income, included transfers to separate accounts of $6,967 million and transfers from separate accounts of $5,908 million. In addition, $463 million of net deposits on deposit-type liabilities related to the Global Medium-Term Note Programwere also transferred to separate accounts; these deposits are not considered premium and, therefore, were excluded from the Consolidated Statutory Statements of Income.
82

Notes to Consolidated Statutory Financial Statements (continued)
19. Presentation of the Consolidated Statutory Statements of Cash Flows
As required by SSAP No. 69 “Statement of Cash Flows,” the Company has included in the ConsolidatedStatutory Statements of Cash Flows, non-cash transactions primarily related to the following:
Years Ended December 31, 2007 2006
(In Millions)
Exchange of bonds for bonds $ 2,964 $ 1,817 Stock conversion to other invested assets 263 71 Bond transfers to other invested assets 120 47 Stock distributions from other invested assets 41 113 Dividend reinvestment 35 19 Stock to stock conversions 30 316 Derivatives to long-term debt 26 - Stock conversion to bonds 25 32 Reclassification of short-term investments to bonds 13 906 Interest capitalization for long-term debt 13 - Net investment income payment in-kind bonds 9 13Transfer of real estate from separate accounts to partnerships
and limited liability companies - 398Bonds conversion to stocks - 1
Included in the exchange of bonds for bonds are $1,899 million and $1,366 million of purchases and sales that are the result of rate resets on existing bank loans for the years ended December 31, 2007 and 2006, respectively. The Company’s systems record these rate resets as rollover transactions.
As of December 31, 2007, the cash, cash equivalents and short-term investments of $2,642 million on the Consolidated Statutory Statements of Cash Flows excluded $8 million in nonadmitted assets related to securities purchased under agreements to resell. The uncollateralized portion of the contract was nonadmitted when thefair value of the collateral fell below the contract value.
83

84
General Agencies
AlabamaTwo North Twentieth StreetSuite 1500Birmingham, AL 35203(205) 244-1141
Albany8 Southwoods Boulevard2nd FloorAlbany, NY 12211-2554(518) 463-5533
Arizona4350 E. Camelback RoadBuilding F-150Phoenix, AZ 85018(602) 912-0123
Atlanta - Brill100 Ashford Center NorthSuite 250Atlanta, GA 30338(770) 551-3400
Atlanta - Moore3333 Peachtree RoadSuite 400Atlanta, GA 30326(404) 261-8900
Baltimore11350 McCormick RoadExecutive Plaza IV, Suite 200Hunt Valley, MD 21031(410) 785-7654
Boston125 Summer StreetSuite 510Boston, MA 02110(617) 439-4389
60 William StreetWellesley Office Park, Bldg 2Wellesley, MA 02462(781) 263-4500
Buffalo300 Corporate ParkwaySuite 216NAmherst, NY 14226(716) 852-1321
Central New Jersey1011 Route 22 WestSuite 201Bridgewater, NJ 08807(908) 704-1800
Central New York432 North Franklin StreetSyracuse, NY 13204(315) 449-3000
Central Pennsylvania100 Corporate Center DriveSuite 201Camp Hill, PA 17011(717) 763-7365
Charlotte6101 Carnegie BoulevardSuite 400Charlotte, NC 28209-4653(704) 557-9600
Chicago20 North Clark StreetSuite 1850Chicago, IL 60602-5001(312) 984-1000
Chicago - Pearre300 South WackerSuite 800Chicago, IL 60606(312) 347-1660
Dallas - Harris12750 Merit DriveSuite 900Dallas, TX 75251(972) 386-5050
Dallas - Lewis5080 Spectrum DriveSuite 902 WestDallas, TX 75001-4649(972) 458-9907
Denver - O'Keefe4100 East Mississippi AvenueSuite 900Denver, CO 80246(303) 691-0070
Denver - StillmanMetropoint I4600 South Ulster Street, Suite 1200Denver, CO 80237(303) 692-8183
Fort WorthCarter Burgess PlazaSuite 2260, 777 Main StreetFort Worth, TX 76102(817) 332-4451
Greensboro300 N. Greene StreetSuite 1650Greensboro, NC 27401(336) 275-0881
Hartford/Springfield1500 Main StreetSuite 1200Springfield, MA 01115(413) 781-6850
Professional Park314 Farmington AvenueFarmington, CT 06032-1965(860) 674-1800
One Landmark Square, Suite 110Stamford, CT 06901(203) 359-5301
Two Liberty Square, Tenth FloorBoston, MA 02109(617) 482-7444
HawaiiCity Financial Tower201 Merchant Street, Suite 2200Honolulu, HI 96813(808) 537-4591
Houston - Brock1980 Post Oak BoulevardSuite 1700Houston, TX 77056(713) 621-1660
Houston - McAndrewsThree Greenway PlazaSuite 1700Houston, TX 77046(713) 402-3800
Indianapolis - McRoberts900 E. 96th StreetSuite 300Indianapolis, IN 46240(317) 469-9999
Iowa1415 28th StreetSuite 350West Des Moines, IA 50266(515) 223-6277
JacksonThe Bluffs at Mayes Lake1635 Lelia Drive, Suite 100Jackson, MS 39216(601) 981-4545
Jacksonville/Savannah10151 Deerwood Park BoulevardBuilding 100, Suite 300Jacksonville, FL 32256(904) 998-7300
Kansas City - LavelyCorporate Woods 409401 Indian Creek ParkwaySuite 450Overland Park, KS 66210(913) 338-5000
Kansas City - Lindsay10740 Nall AvenueSuite 100Leawood, KS 66211(913) 234-0300
Kentucky/West Virginia2365 Harrodsburg RoadSuite A300Lexington, KY 40504(859) 223-4141
LeHigh ValleyStabler Corporate Center3773 Corporate Parkway, Suite 380Center Valley, PA 18034(610) 798-2500
Long Island - Ranftle6800 Jericho TurnpikeSuite 202WSyosset, NY 11791(516) 364-4203
Long Island - Sparacio1000 Woodbury RoadSuite 400Woodbury, NY 11797(516) 364-3333
Los Angeles - Fraser4601 Wilshire BoulevardThird FloorLos Angeles, CA 90010-3882(323) 965-6300
Los Angeles - Michel1875 Century Park EastSuite 1950Los Angeles, CA 90067(310) 407-2800
Los Angeles - NAMThe Warner Atrium6400 Canoga Avenue, Suite 154Woodland Hills, CA 91367(818) 449-1680
Louisiana1100 Poydras StreetSuite 1000New Orleans, LA 70163(504) 299-8971
Lubbock2333 50th StreetLubbock, TX 79412(806) 795-9393
Miami2100 Ponce De Leon BoulevardSuite 600Coral Gables, FL 33609(305) 648-2445
Michigan - Emery3152 Peregrine Drive, NESuite 110Grand Rapids, MI 49525(616) 447-7665
Michigan - Fiore33533 West 12 Mile RoadSuite 295Farmington Hills, MI 48331(248) 324-1100
Michigan - Seymour/Gill28411 Northwestern HighwaySuite 1000Southfield, MI 48034(248) 208-0660
Minneapolis901 Marquette AvenueSuite 2600Minneapolis, MN 55402-2468(612) 333-1413
NebraskaRegency Center10250 Regency Circle, Suite 250Omaha, NE 68114(402) 397-8600
Nevada10100 W. Charleston BoulevardSuite 250Las Vegas, NV 89135(702) 791-0200
New Jersey/New York - Lee/Nolan150 Clove Road, Sixth FloorLittle Falls, NJ 07424(973) 237-0100
New Jersey/New York - Lee/Nolan292 Madison Avenue 7th FloorNew York, NY 10017(212) 213-5151
New YorkOne Penn PlazaSuite 2035, 250 West 34th StreetNew York, NY 10119-0002(212) 736-2001
General Agencies and Other OfficesMassachusetts Mutual Life Insurance Company and its subsidiaries have offices around the globe. Listed here are our general agencies, health andexecutive benefit regional sales offices, retirement services offices, and international locations. For more information on a possible career withMassMutual, visit the recruiting section of our Web site: www.massmutual.com/recruitment.

85
New York - Cowan530 Fifth Avenue 14th FloorNew York, NY 10036-5101(212) 536-6000
Northern New England -McMannon436 Amherst Street2nd FloorNashua, NH 03063(603) 882-8121
Northern New England - Shaughnessy10 Charles StreetSuite 210Providence, RI 02904-2249(603) 623-7236
Ohio - Gale1660 West 2nd StreetSuite 850Cleveland, OH 44113-1454(216) 621-5680
Ohio - McKenna300 E-Business WaySuite 390Cincinnati, OH 45241(513) 579-8555
Ohio - Seymour28411 Northwestern HighwaySuite 1000Southfield, MI 48034(419) 893-9759
Oklahoma4801 Gaillardia ParkwaySuite 250Oklahoma City, OK 73142(405) 486-1400
Orange County4695 MacArthur CourtSuite 1000Newport Beach, CA 92660(949) 660-1717
Oregon222 S.W. ColumbiaSuite 825Portland, OR 97201(503) 221-1211
Peoria401 S.W. Water StreetSuite 303Peoria, IL 61602(309) 673-3839
Philadelphia - FishmanTwo Bala PlazaSuite 901Bala Cynwyd, PA 19004(610) 766-3000
Philadelphia - Whipple220 Gibraltar RoadSuite 350Horsham, PA 19044(215) 441-8200
Pittsburgh11 Stanwix StreetSuite 1200Pittsburgh, PA 15222-5401(412) 562-1600
Providence2 Hemingway DriveEast Providence, RI 02915(401) 435-3800
Puerto RicoPlaza Scotiabank Suite 1400, 273 Ponce de Leon Ave.Hato Rey, PR 00917(787) 758-2244
RichmondOverlook 14880 Sadler Road, Suite 110Glen Allen, VA 23060(804) 346-1011
Rochester600 Clinton SquareRochester, NY 14604(585) 262-5600
SacramentoNatomas Corporate Center2495 Natomas Park Drive, Suite 500Sacramento, CA 95833(916) 565-7221
St. Louis - KickhamDierbergs Corporate Plaza16690 Swingley Ridge Road Suite 240Chesterfield, MO 63017-1706(636) 728-2400
Salt Lake City6340 South 3000 East Suite 500Salt Lake City, UT 84121(801) 943-6277
Owyhee Park Plaza3501 West Elder Street, Third FloorBoise ID, 83705(208) 364-0502
San DiegoRegents Square 4275 Executive Square, Suite 400La Jolla, CA 92037(858) 558-7000
San Fernando Valley4165 E. Thousand Oaks BoulevardSuite 180Westlake Village, CA 91362(805) 777-7166
San Francisco2121 N. California BoulevardSuite 395Walnut Creek, CA 94596(925) 979-2300
San Jose101 Metro DriveSuite 550San Jose, CA 95110(408) 286-4010
SeattleBank of America Tower701 Fifth Avenue, Suite 4300Seattle, WA 98104(206) 628-8800
South Carolina741 Johnnie Dodds BoulevardMount Pleasant, SC 29464(843) 856-3411
South FloridaRadice III1000 Corporate Drive, Suite 700Ft. Lauderdale, FL 33334-3637(954) 938-8800
South TexasOne Union SquareSuite 300, 10101 Reunion PlaceSan Antonio, TX 78216-4157(210) 342-4141
Southern ConnecticutMill River 22150 Post Road, 5th FloorFairfield, CT 06824(203) 259-5575
SummitMaple Plaza I 4 Campus Drive, Second FloorParsippany, NJ 07054(973) 285-3600
Tampa4830 West Kennedy BoulevardSuite 800Tampa, FL 33609(813) 286-2280
Tennessee - Sinks8 Cadillac DriveSuite 150Brentwood, TN 37027(615) 309-6300
Tennessee - Stonebarger8245 Tournament DriveSuite 300Memphis, TN 38125(901) 748-8888
TulsaRichard Plaza Office Building4200 East Skelly Plaza, Suite 325Tulsa OK, 74135(918) 524-6345
Virginia - Burke222 Central Park AvenueSuite 1100Virginia Beach, VA 23462(757) 490-9041
Washington - Norman1593 Spring Hill RoadSuite 500 EastVienna, VA 22182-2245(703) 847-9660
Washington - Van Eperen6500 Rock Spring DriveSuite 400Bethesda, MD 20817(301) 581-7200
Washington - West4520 East West HighwaySuite 700Bethesda, MD 20814(301) 657-7770
Wisconsin525 Junction RoadSuite 8100, North TowerMadison, WI 53717(608) 829-0015
Health & Executive BenefitRegional Sales Offices
AtlantaMid-Atlantic Regional SalesOffice1040 Crown Pointe ParkwaySuite 150Atlanta, GA 30338(770) 350-0445
BostonNortheast Regional Sales Office75 Second Avenue, Suite 330Needham, MA 02494(781) 433-9888
ChicagoCentral Regional Satellite SalesOffice100 South Wacker Drive, Suite 1220Chicago, IL 60606(312) 727-0209
DallasWest Regional Sales OfficeColonnade Tower II15303 Dallas Pkwy., Suite 1060Addison, TX 75001(972) 763-0558
HartfordNortheast Regional Satellite SalesOfficeOne Financial Plaza, Suite 1085Hartford, CT 06103(800) 574-9431
Kansas CityCentral Regional Sales Office7300 College Boulevard, Suite 215Overland Park, KS 66210(913) 491-9567
Retirement Services Offices
Chicago8700 West Bryn Mawr, Suite 750SChicago, IL 60631(800) 603-1558
Los AngelesPasadena Tower 1, Suite 470800 East Colorado BoulevardPasadena, CA 91101(800) 365-2548New York24 West 40th Street7th FloorNew York, NY 10018(800) 601-9905
Palm Beach Gardens7108 Fairway DriveSuite 300Palm Beach Gardens, FL 33418(888) 425-7097
General Agencies and Other Offices (continued)

86
International Locations
AsiaBaring Asset Management (Asia)
LimitedTel: +852-2841-1411www.barings.comHong Kong
Baring Asset Management (Japan)Limited
Tel: +813-3501-6245www.barings.comTokyo, Japan
Baring SICE (Taiwan) Ltd.Tel: +886-2-2717-6866www.barings.comTaipei, Taiwan ROC
MassMutual Asia Ltd.Tel: +852-2919-9000www.massmutualasia.comHong Kong
Macau Branch OfficeMacau
Shanghai Representative OfficeShanghai, China
MassMutual Life Insurance Co.Tel: +81(0)3-5530-2290www.massmutual.co.jpTokyo, Japan
MassMutual Mercuries Life Insurance Co., Ltd.
Tel: +886(0)2-2345-5511www.mli.com.twTaipei, Taiwan
Babson Capital Japan K.K.Tel: +81(0)3-5733-4727Tokyo, Japan
EuropeBabson Capital Europe LimitedTel: +44 (0)20-3206-4500www.babsoncapitaleurope.comLondon, U.K.
Baring Asset Management (C.I.)Limited
Tel: +44 (0)1481 743330www.barings.comGuernsey, C.I.
Baring Asset Management GmbHTel: +49 (0)69-7169-1888www.barings.comFrankfurt, Germany
Baring France SASTel: +33(0)1-53-93-60-00www.barings.comParis, France
Baring Asset Management LimitedTel: +44 (0)207-628-6000www.barings.comLondon, U.K.
MassMutual Europe S.A.Tel: +352-25-19-14www.massmutualeurope.comLuxembourg
OppenheimerFunds InternationalLtd.
Tel: +353-1-637-6332www.intl.oppenheimerfunds.comDublin, Ireland
Tremont Capital Management Ltd.Tel: +44 (0)20-7491-5330www.tremont.comLondon, U.K.
Latin AmericaCompañía de Seguros Vida Corp S.A.Tel: +56 (0)2-660-3000www.vidacorp.clSantiago, Chile
North AmericaBaring Asset Management Inc.Tel: (617) 946-5200www.barings.comBoston, MA
Baring Asset Management Inc.Tel: (415) 834-1500www.barings.comSan Francisco, CA
Baring Asset Management Inc.Tel: +1-416-599-1835www.baring-asset-can.comToronto, Canada
OppenheimerFund ServicesTel: (303) 768-3200www.oppenheimerfunds.comCentennial, CO
OFI Institutional Asset Management, Inc.
Tel: (800) 422-1854www.ofiinstitutional.comBoston, MA
Tremont Group Holdings, Inc.Tel: (914) 925-1140www.tremont.comRye, NY
OppenheimerFunds, Inc.Tel: (212) 323-0200www.oppenheimerfunds.comNew York, NY
General Agencies and Other Offices (continued)
Major Subsidiaries and AffiliatesMassMutual Financial Group is a marketing name for Massachusetts Mutual Life Insurance Company (MassMutual) and its affiliate companies and salesrepresentatives which include:
MassMutual Asia Ltd.Hong KongKenneth YuManaging Director andChief Executive Officer
Macau Branch Office, MacauShanghai Representative Office,Shanghai, China
Babson Capital Management LLCSpringfield, MassachusettsRoger W. CrandallChairman, President and CEO
Baring Asset ManagementLimitedLondon, U.K.David J. BrennanChairman and CEO
C.M. Life Insurance CompanyEnfield, ConnecticutStuart H. ReeseChairman, President and CEO
Cornerstone Real EstateAdvisers LLCHartford, ConnecticutDavid J. ReillyPresident and CEO
MassMutual Europe S.A.LuxembourgOlivier MaingardChief Executive Officer
MassMutual International LLCSpringfield, MassachusettsElaine A. SarsynskiChairman, President and CEO
MassMutual Life Insurance Co.Tokyo, JapanHidezo HiranoPresident and CEO
MassMutual MercuriesLife Insurance Co., Ltd.Taipei, TaiwanDanny C.H. LiuPresident
MML Bay StateLife Insurance CompanyEnfield, ConnecticutStuart H. ReeseChairman, President and CEO
MML Investors Services, Inc.Springfield, MassachusettsMichael R. FanningPresident
OppenheimerFunds, Inc.New York, New YorkJohn V. MurphyChairman and CEO
The MassMutual TrustCompany, FSBEnfield, ConnecticutMichal L. BobrykPresident

Senior ManagementMassachusetts Mutual Life Insurance Company
87
Stuart H. ReeseChairman, President and Chief Executive Officer
Roger W. CrandallExecutive Vice PresidentCo-Chief Operating Officer andChief Investment OfficerMassMutual Retirement Servicesand MassMutual Retirement Income
Michael FoleyChief Information Officer
William F. Glavin, Jr.Executive Vice President andCo-Chief Operating OfficerU.S. Insurance Group
John V. MurphyExecutive Vice PresidentChairman and CEOOppenheimerFunds, Inc.
Mark D. RoelligExecutive Vice President andGeneral CounselLaw
Michael T. RollingsExecutive Vice President Chief Financial Officer
Elaine A. SarsynskiExecutive Vice PresidentRetirement Services andPresident and CEO MassMutual International LLC
Marie M. AugsbergerSenior Vice PresidentRetirement Services
Richard D. BourgeoisSenior Vice PresidentCorporate Financial Operations
John W. ChandlerSenior Vice PresidentU.S. Insurance Group
Kenneth S. CohenSenior Vice President and Deputy General CounselGovernment Relations
Gregory E. DeavensSenior Vice PresidentU.S. Insurance Group
Stephen Phl. DeschenesSenior Vice PresidentRetirement Income Group
Andrew C. DickeySenior Vice PresidentRetirement Income Group
Michael R. FanningSenior Vice PresidentU.S. Insurance Group
Marc A. GermainSenior Vice PresidentInformation Systems Organization
Beverly A. HolmesSenior Vice PresidentRetirement Services
Steven S. HolsteinSenior Vice PresidentU.S. Insurance Group
M. Dale JanesSenior Vice PresidentRetirement Services
Isadore JermynSenior Vice President andChief ActuaryCorporate Actuarial
E. Thomas Johnson, Jr.Senior Vice PresidentRetirement Income Group
Stephen L. KuhnSenior Vice President, Secretary andDeputy General CounselLaw
Melissa MillanSenior Vice PresidentU.S. Insurance Group
William F. O'GradySenior Vice PresidentRetirement Services
Debra A. PalerminoSenior Vice PresidentCorporate Human Resources
Burvin E. Pugh, Jr.Senior Vice PresidentU.S. Insurance Group
M. Trish RobinsonSenior Vice PresidentStrategic Communications andCommunity Responsibility
Donald B. RobitailleSenior Vice President and General AuditorGeneral Auditing
Douglas G. RussellSenior Vice PresidentRetirement Income Group
Margaret SperrySenior Vice President and Chief Compliance OfficerCorporate Compliance
Elizabeth A. WardSenior Vice President and Chief Risk OfficerCorporate Financial Operations
David S. AllenCorporate Vice President and Associate General CounselLaw
Peter J. BautzCorporate Vice PresidentCorporate Financial Operations
David W. CarlsonCorporate Vice President andActuaryCorporate Actuarial
John F. CarlsonCorporate Vice President U.S. Insurance Group
Robert J. CasaleCorporate Vice President and Deputy Chief Information OfficerInformation Systems Organization
James S. CollinsCorporate Vice President andActuaryRetirement Services
John E. DeitelbaumCorporate Vice President and Associate General CounselLaw
Pamela J. DelaneyCorporate Vice PresidentU.S. Insurance Group
Rodney J. DillmanCorporate Vice PresidentAssociate General Counsel andAssistant SecretaryLaw
William B. FisherCorporate Vice President andAssociate General CounselGovernment Relations
Jerome S. GoldenCorporate Vice PresidentRetirement Income Group
Douglas J. JangrawCorporate Vice President andActuaryCorporate Financial Operations
Michael L. KerleyCorporate Vice PresidentU.S. Insurance Group
Edward M. KlineCorporate Vice President andTreasurerCorporate Financial Operations
Richard PedersenCorporate Vice PresidentU.S. Insurance GroupSystems Applications
Todd G. PickenCorporate Vice President and Deputy TreasurerCorporate Financial Operations
Roger L. PutnamCorporate Vice PresidentU.S. Insurance Group
Scott M. ReedCorporate Vice PresidentRetirement ServicesRetirement Income Systems Applications
Ian W. SheridanCorporate Vice PresidentRetirement Services
William S. SilvanicCorporate Vice President andActuaryRetirement Services
Norman A. SmithCorporate Vice President andControllerCorporate Financial Operations
Robert V. StingleCorporate Vice President andAssociate General AuditorGeneral Auditing
Ricky A. SwayeCorporate Vice PresidentCorporate Services
John A. VaccaroCorporate Vice PresidentU.S. Insurance Group
Patricia J. WalshCorporate Vice President andAssociate General CounselLaw
Eric WietsmaCorporate Vice PresidentRetirement Services

88
Roger G. AckermanChairman andChief Executive Officer, RetiredCorning IncorporatedCorning, New YorkCommittees: Corporate Governance(Chair), Executive, Operations
James R. BirleLead DirectorMassachusetts MutualLife Insurance CompanySpringfield, MassachusettsChairmanResolute Partners LLCVillage of Golf, FloridaCommittees: Corporate Governance,Executive, Investment (Chair), Operations
Thomas C. BarryChief Executive Officer and FounderZephyr Management, L.P.New York, New YorkCommittees: Audit, Investment
James H. DeGraffenreidt, Jr.Chairman and Chief Executive OfficerWGL Holdings, Inc.Washington, D.C.Committees: Corporate Governance,Human Resources
Patricia Diaz DennisSenior Vice President andAssistant General CounselAT&TSan Antonio, TexasCommittees: Human Resources,Investment
James L. DunlapVice Chairman, RetiredOcean Energy, Inc.Houston, TexasCommittees: Audit, Human Resources
William B. EllisLecturer and Resident FellowYale University School of Forestry andEnvironmental StudiesNew Haven, ConnecticutChairman and Chief Executive Officer,Retired, Northeast UtilitiesHartford, ConnecticutCommittees: Audit (Chair), Executive,Investment
Robert A. EssnerChairmanWyethMadison, New JerseyCommittees: Executive, Human Resources (Chair), Operations
Robert M. FurekPresident andChief Executive Officer, RetiredHeublein, Inc.Hartford, ConnecticutCommittees: Corporate Governance,Operations
Carol A. LearyPresidentBay Path CollegeLongmeadow, MassachusettsCommittees: Audit, Investment
William B. Marx, Jr.Senior Executive Vice President, RetiredLucent TechnologiesMurray Hill, New JerseyCommittees: Corporate Governance,Executive, Operations (Chair)
John F. MaypoleManaging PartnerPeach State Real EstateHolding CompanyToccoa, GeorgiaCommittees: Corporate Governance,Investment
Marc F. RacicotPresidentAmerican Insurance AssociationWashington, D.C.Committees: Audit, Human Resources
Stuart H. ReeseChairman, President andChief Executive OfficerMassachusetts MutualLife Insurance CompanySpringfield, MassachusettsCommittees: Corporate Governance,Executive (Chair), Investment, Operations
Board of Directors Massachusetts Mutual Life Insurance Company
William T. SpitzVice Chancellor for Investments EmeritusVanderbilt UniversityNashville, TennesseeCommittees: Audit, Investment

Financial professionals offer products and services where they are licensed to do so.
MassMutual is committed to providing equal opportunity for employment and advancement of allemployees without regard to race, color, religious creed, age, sex, marital status, sexual orientation,national origin, citizenship status, ancestry, veteran status, past or present history of mental disorder,mental retardation, learning disability or physical disability, including but not limited to blindness.
The company’s annual meeting is held each year on the second Wednesday of April at 2 p.m., at thehome office in Springfield, Massachusetts, for the election of directors and the transaction of suchother business as may properly come before the meeting.
Desi
gned
and
pro
duce
d by
Mas
sMut
ual C
reat
ive
Serv
ices
/Stra
tegi
c Co
mm
unic
atio
ns a
nd C
omm
unity
Res
pons
ibili
ty

To learn more about MassMutual, we invite you to visit our Web site at www.massmutual.com.
Massachusetts Mutual Life Insurance Company and affiliates, Springfield, MA 01111-0001
© 2008 Massachusetts Mutual Life Insurance Company. All rights reserved. PR1000 308
CRN201003-102526