
Welcome to the Discharge to Assess Best Practice...
68
Welcome to the Discharge to Assess Best Practice Event Hosted by NHS England & South Warwickshire NHS Foundation Trust
Transcript of Welcome to the Discharge to Assess Best Practice...

Welcome to the Discharge to Assess Best Practice Event
Hosted by NHS England &
South Warwickshire NHS Foundation Trust

Welcome, Housekeeping & Plan of the Day
Jayne Rooke -
Programme Manager -
South Warwickshire NHS Foundation Trust
Overview of Homefirst
Discharging to Assess Jane Ives – Director of Operations
South Warwickshire NHS Foundation Trust
Presenter
Presentation Notes
Questions and interruptions welcomed This is our journey – yours will be different – hope its helpful

Presenter
Presentation Notes
4 year journey – sharing our experience
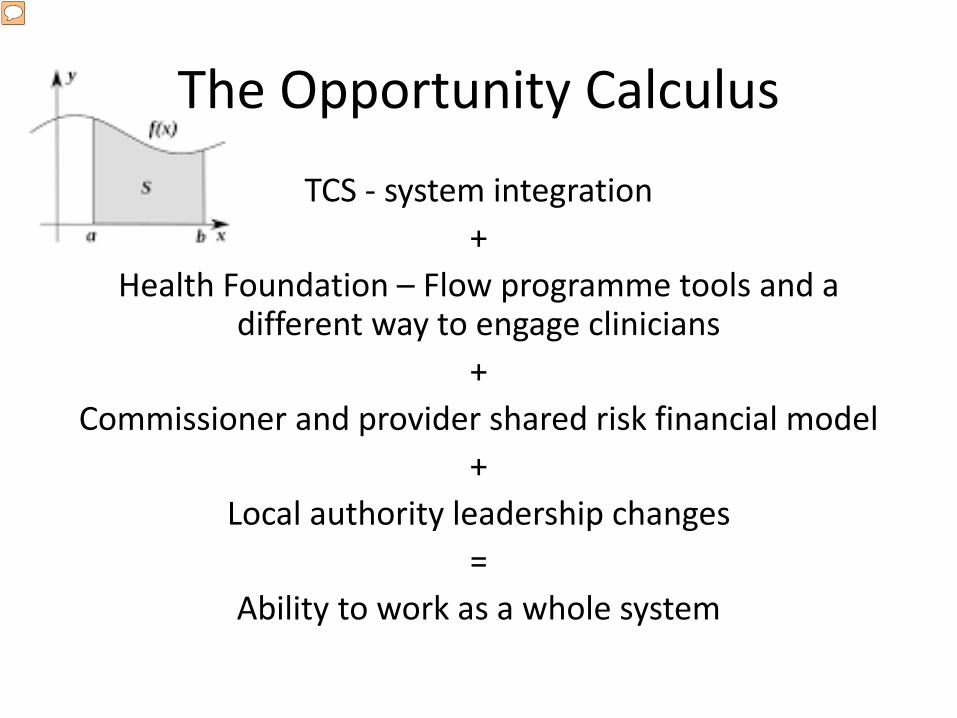
The Opportunity Calculus
TCS - system integration +
Health Foundation – Flow programme tools and a different way to engage clinicians
+ Commissioner and provider shared risk financial model
+ Local authority leadership changes
= Ability to work as a whole system
Presenter
Presentation Notes
How do you turn the case for change – into a change proposition? Why were we able to start this journey? – 2012/13 What was different in our system – a number of opportunities aligned – with the right leadership (stable trust leadership) What is the opportunity calculus in your health economy Need to be flexible and work with what you’ve got - This is the story of our journey
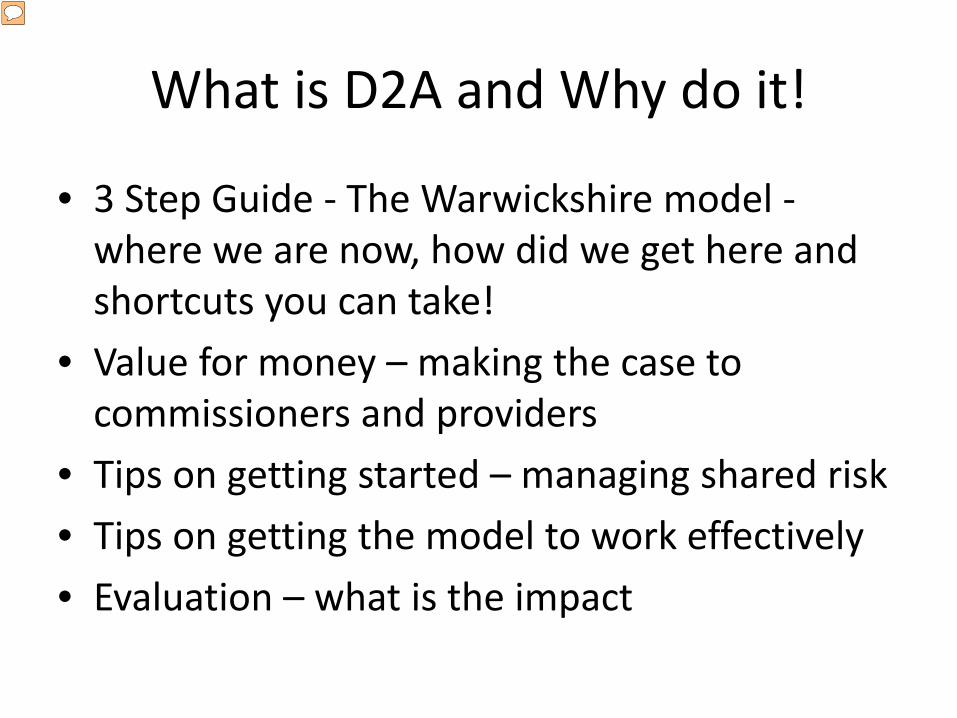
What is D2A and Why do it!
• 3 Step Guide - The Warwickshire model - where we are now, how did we get here and shortcuts you can take!
• Value for money – making the case to commissioners and providers
• Tips on getting started – managing shared risk • Tips on getting the model to work effectively • Evaluation – what is the impact
Presenter
Presentation Notes
What I am going to cover
214
63
1
3
6
41
3
5 25
17
7
24
11
12
20
9
1
9
12
4
0
14
39
4
6
Reablemement
D2A P3
D2A P2
CERT
Commmuity
Acute
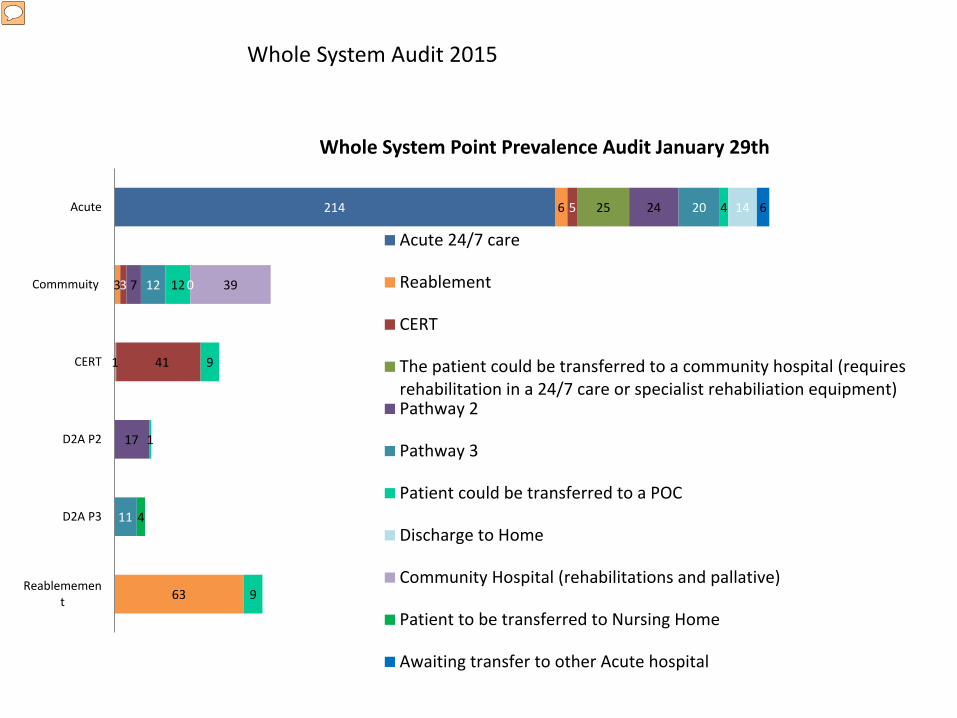
Whole System Point Prevalence Audit January 29th
Acute 24/7 care
Reablement
CERT
The patient could be transferred to a community hospital (requiresrehabilitation in a 24/7 care or specialist rehabiliation equipment)Pathway 2
Pathway 3
Patient could be transferred to a POC
Discharge to Home
Community Hospital (rehabilitations and pallative)
Patient to be transferred to Nursing Home
Awaiting transfer to other Acute hospital
Whole System Audit 2015
Presenter
Presentation Notes
Wish we had done this first!

Breakdown of patient needs 2015
26
35
73
43
48
49
69
214
Discharge to Home
Patient could betransferred to a POC
Reablemement
D2A P3
D2A P2
CERT
Commmuity
Acute
Discharge to Home
Patient could be transferred to aPOCReablemement
D2A P3
+108
+1
-28
-31
-2
+7
-26
-35
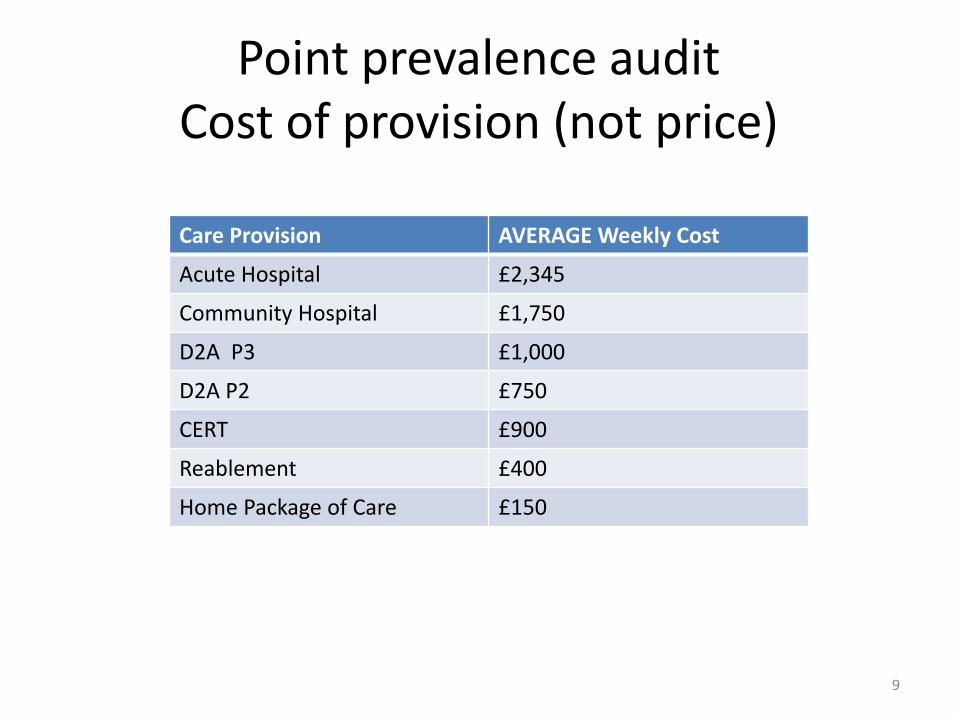
Point prevalence audit Cost of provision (not price)
9
Care Provision AVERAGE Weekly Cost
Acute Hospital £2,345
Community Hospital £1,750
D2A P3 £1,000
D2A P2 £750
CERT £900
Reablement £400
Home Package of Care £150
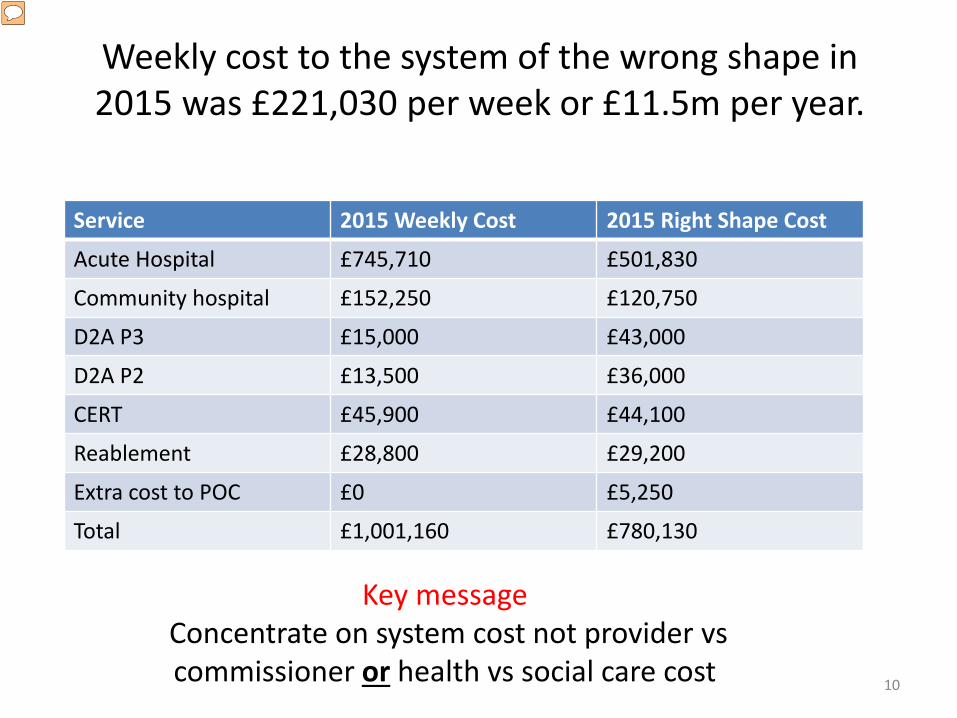
Weekly cost to the system of the wrong shape in 2015 was £221,030 per week or £11.5m per year.
10
Service 2015 Weekly Cost 2015 Right Shape Cost
Acute Hospital £745,710 £501,830
Community hospital £152,250 £120,750
D2A P3 £15,000 £43,000
D2A P2 £13,500 £36,000
CERT £45,900 £44,100
Reablement £28,800 £29,200
Extra cost to POC £0 £5,250
Total £1,001,160 £780,130
Key message Concentrate on system cost not provider vs commissioner or health vs social care cost
Presenter
Presentation Notes
Case made!

Patient no longer has care needs – that can only be met in an acute hospital
Pathway 1 Pathway 3 Pathway 2
Patients needs can be safely met at home
Unable to return home - Patient has very complex care needs and
may need continuing care
Unable to return home - Patient requires further
rehabilitation/reablement
Reablement service
Up to 6 weeks
CERT (IMC)
Up to 6 weeks
Community hospital
Up to 4 weeks
Temporary Residential
Home Up to 4 weeks
Nursing Home
Up to 6 weeks
Self Fund/ Self Care
LA funded home care Pathway 1
Self Fund Residential
care
LA funded Residential
care
Self Fund/ Self Care at
Home
CHC Funded
care Self
Funded care
LA Funded care
EXPLICIT CHANGE OF FUNDING
Presenter
Presentation Notes
The model – what is it! We didn’t start with this model (if only) but we did start with a principle - and that principle is for all patients – not just cherry picking some patients that fit and the rest – it evolved as we worked together with clinicians and social care But how much capacity do you need in each pathway?

Trusted Assessment and Pathway 1
Step 1 – Pathway 1 and Trusted Assessment – 2012/13
• Restarts of packages of care within 14 days by ward team
• Direct referral to Reablement from OT/DC without hospital social work team involvement
• eCAT – in-house technology solution for trusted assessment referrals
• Developing reablement and CERT capacity (early supported discharge and community admission avoidance service)
Presenter
Presentation Notes
We developed pathway 1 first Getting the culture right – developing trusted assessment. WCC were developing their reablement service to reduce the long terms cost of packages of care through a reablement approach, we closed community hospital capacity in North and south Warwickshire and reinvested the savings in more community services to provide capacity to meet both admission prevention and supported discharge demand

• Net neutral impact on Social Care spend
• Reduce the level of long term care packages
• Maintain independence where possible
• Support timely discharge from hospital
No decision about long term care needs in an acute setting. Minimise hospital
stay and maximise independence, with
care at home wherever possible
Step 2 - 2013-2016 An Integrated Health & Social Care Response:
Our Shared Purpose
Presenter
Presentation Notes
The strides we had made with pathways 1 were not enough and we developed a multi-agency project to deliver the rest of the pathway. It was an important step to write it down and agree across partners what we were trying to do. We had some of pathways 2 in our model already – we needed pathway 3 for those very complex patients
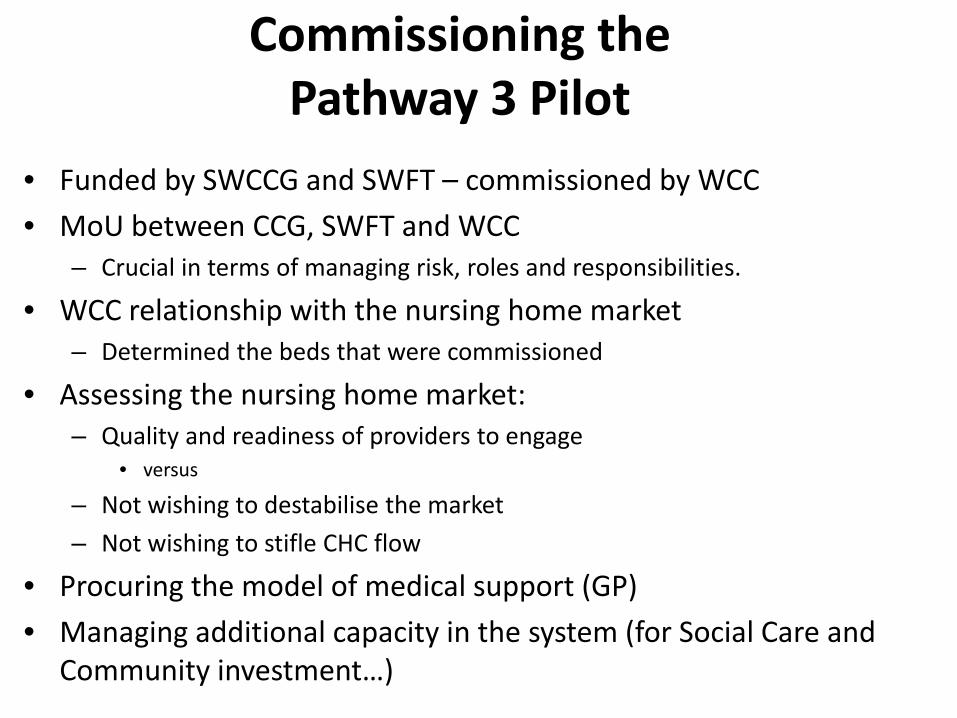
• Funded by SWCCG and SWFT – commissioned by WCC • MoU between CCG, SWFT and WCC
– Crucial in terms of managing risk, roles and responsibilities.
• WCC relationship with the nursing home market – Determined the beds that were commissioned
• Assessing the nursing home market: – Quality and readiness of providers to engage
• versus
– Not wishing to destabilise the market – Not wishing to stifle CHC flow
• Procuring the model of medical support (GP) • Managing additional capacity in the system (for Social Care and
Community investment…)
Commissioning the Pathway 3 Pilot

Key Success Factors in Maintaining D2A Flow – Top Tips
• Continuity of care co-ordination role acute – through to discharge
• Good written information for consent • Weekly MDT – continuity of staff • Quality of medical model
Presenter
Presentation Notes
Wheer are we now
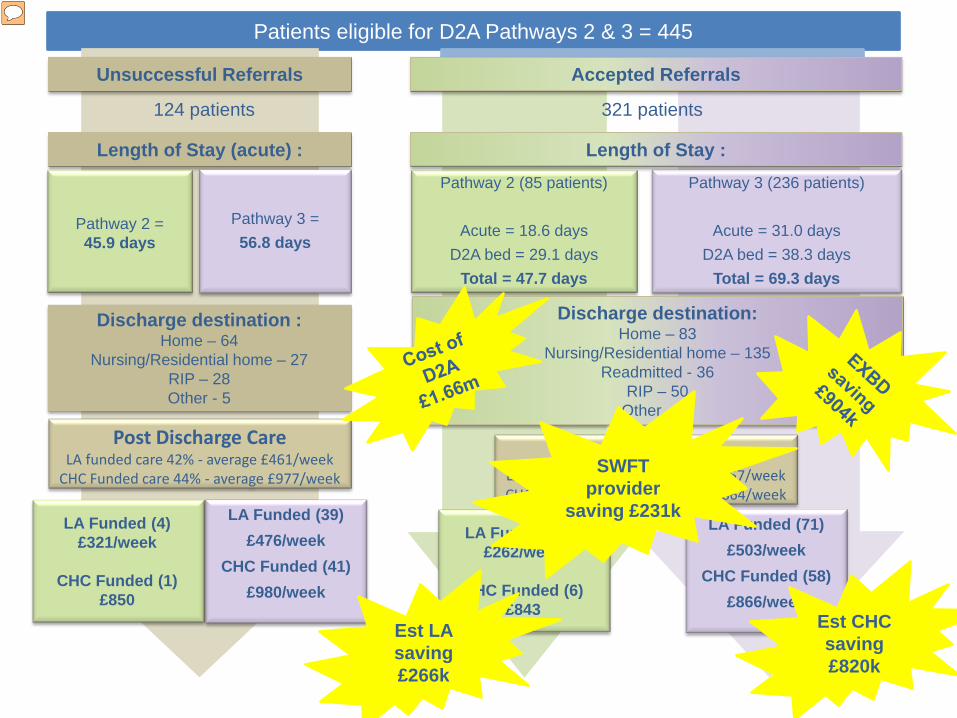
Patients eligible for D2A Pathways 2 & 3 = 445
124 patients
Unsuccessful Referrals
Length of Stay (acute) :
Pathway 2 = 45.9 days
Pathway 3 = 56.8 days
Discharge destination : Home – 64
Nursing/Residential home – 27 RIP – 28 Other - 5
Post Discharge Care LA funded care 42% - average £461/week
CHC Funded care 44% - average £977/week
LA Funded (4) £321/week
CHC Funded (1)
£850
LA Funded (39) £476/week
CHC Funded (41) £980/week
Pathway 2 (85 patients)
Acute = 18.6 days D2A bed = 29.1 days
Total = 47.7 days
Pathway 3 (236 patients)
Acute = 31.0 days D2A bed = 38.3 days
Total = 69.3 days
Accepted Referrals
Length of Stay :
321 patients
Discharge destination: Home – 83
Nursing/Residential home – 135 Readmitted - 36
RIP – 50 Other - 17
LA Funded (17) £262/week
CHC Funded (6)
£843
LA Funded (71) £503/week
CHC Funded (58) £866/week
Post Discharge Care LA funded care 32.5% - average £457/week CHC Funded care 24% - average £864/week
Est CHC saving £820k
Est LA saving £266k
SWFT provider
saving £231k
Presenter
Presentation Notes
Evaluation of the first 18 months – NOT AN RCT

Key Commissioner Messages
• Extended LoS in pathway 3 – therefore actual pathway costs higher – but
cheaper than if the extended stay was in acute hospital.
• Halving of CHC funded care – (either at home of in residential setting)
• No shift to LA funded care (small reduction!) • Assumed shift to self funding • SYSTEM SAVINGS !
Presenter
Presentation Notes
Wendy

STEP 3 – Current Work in Progress Defining Pathway 2
• Broad group of patient needs • Intent is for discharge home • Range of facilities
– Residential Homes, – Community Hospitals – Therapy Led Discharge Transition Unit – Extra Care Housing….
• Getting the capacity and flexibility right is key • Still not cracked NWB!!

Discharge Transitional Unit (DTU)
• DTU is a unique Therapy led unit – For those who need intensive therapy where this
cannot be safely carried out at home. • Therapy Ethos aiming for independent living • All activities are delivered by therapists
– Extended therapy roles • “Ten Key Roles for AHP’s. DOH”
– Existing qualified non medical prescriber within respiratory Physiotherapy.
• Aim to discharge home / usual place of residence • ‘Everyone’s business’: Shared team responsibility
Presenter
Presentation Notes
An acute hospital ward was not the ideal location for DTU as it was easy to refer inappropriate patients to the unit during periods of high activity. Planning is critical to the success of any change process before “go live” and improves overall success rate. Communication to all stakeholders is key but often forgotten or left till last

A note about CHC process
• Do you have trusted assessment so your complex discharge co-ordinators undertake DST on behalf of CHC commissioning?
• Do you have a straight to DST pathway? • Are CHC assessments undertaken in D2A
capacity or in acute beds?

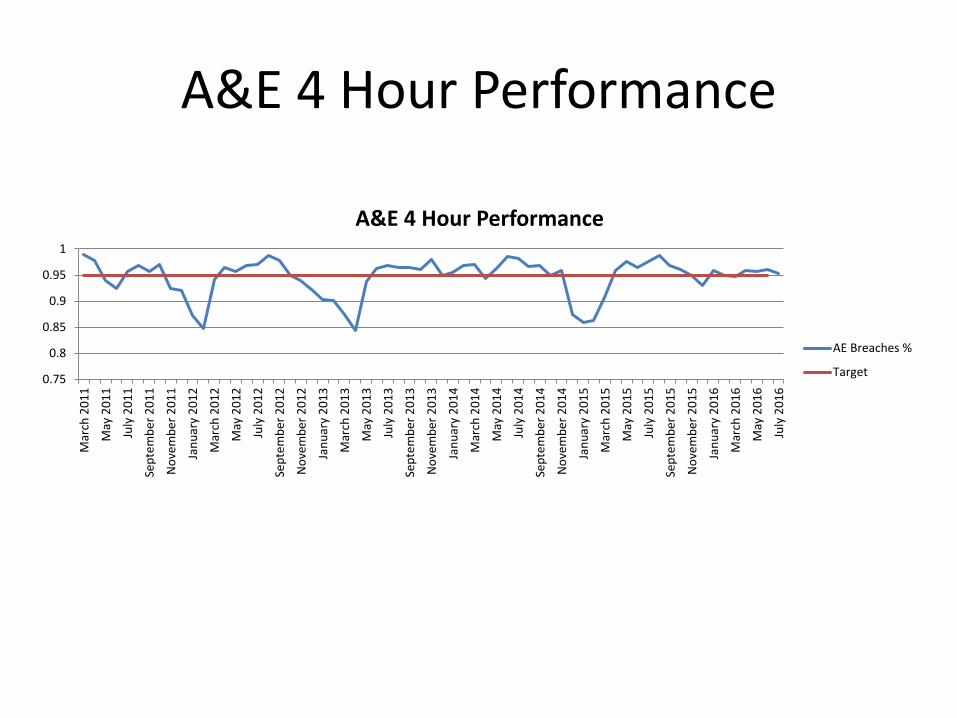
System flow and Quality Metrics 2011 – 2015/16
Indicator Baseline 2011/12 2015/16 Change
A&E 4 hour performance 93.5% 96% 2.5%
Acute Hospital length of Stay 7.7 days 5.4 2 days
Over 75 Acute length of Stay 12.6 9.1 3.5 days
Community Hospital length of stay 35 days 18 days 17 days
Emergency readmissions 12% 11% 1%
Excess bed days cost > 65 years (final column is 1 year Aug 13 – July 14)
£3.234m £2.328 £0.9m
Excess bed days % of emergency income 13% 9% 4%
Patients requiring Nursing Home care funded through CHC (baseline is control group)
44% 24% -45%
SWFT, CCG and LA – all in financial balance
Presenter
Presentation Notes
Impact

System Outcomes - Quality Indicator Baseline 2011/12 April 2015 Change
SHMI 1.11 1.02 0.9
Emergency readmissions 12% 11% 1%
Average medical outliers 12 4 -8 per day
Patient over 3 hospital ward moves 14% 2% 12%
Patient falls in hospital per 1000 bed days Acute 2 /Community 2.4
Combined 1.6 0.8
Patient in their own home 91 days after discharge from intermediate care
85% 88% +3%
Presenter
Presentation Notes
Jane
A&E 4 Hour Performance
0.75
0.8
0.85
0.9
0.95
1
Mar
ch 2
011
May
201
1
July
201
1
Sept
embe
r 201
1
Nov
embe
r 201
1
Janu
ary
2012
Mar
ch 2
012
May
201
2
July
201
2
Sept
embe
r 201
2
Nov
embe
r 201
2
Janu
ary
2013
Mar
ch 2
013
May
201
3
July
201
3
Sept
embe
r 201
3
Nov
embe
r 201
3
Janu
ary
2014
Mar
ch 2
014
May
201
4
July
201
4
Sept
embe
r 201
4
Nov
embe
r 201
4
Janu
ary
2015
Mar
ch 2
015
May
201
5
July
201
5
Sept
embe
r 201
5
Nov
embe
r 201
5
Janu
ary
2016
Mar
ch 2
016
May
201
6
July
201
6
A&E 4 Hour Performance
AE Breaches %
Target

Any Questions?

Coffee Break

Homefirst Pathways – Integration and the Future
Tracey Sheridan Denise Cross Sharon King
Dawn Johnson Amy Bastow Sallie Green Jane Mason
Michelle Greening
Setting up Pathway 3 D2A
Jane Ives Caroline Cody Cristina Ramos

Lunch Break
Capacity and Demand Model
Presented by Phil Colledge / Tracey Sheridan
Objective of the session
• Background • Challenge- Operational Capacity Plan June 16 • Six Step Process • Plans
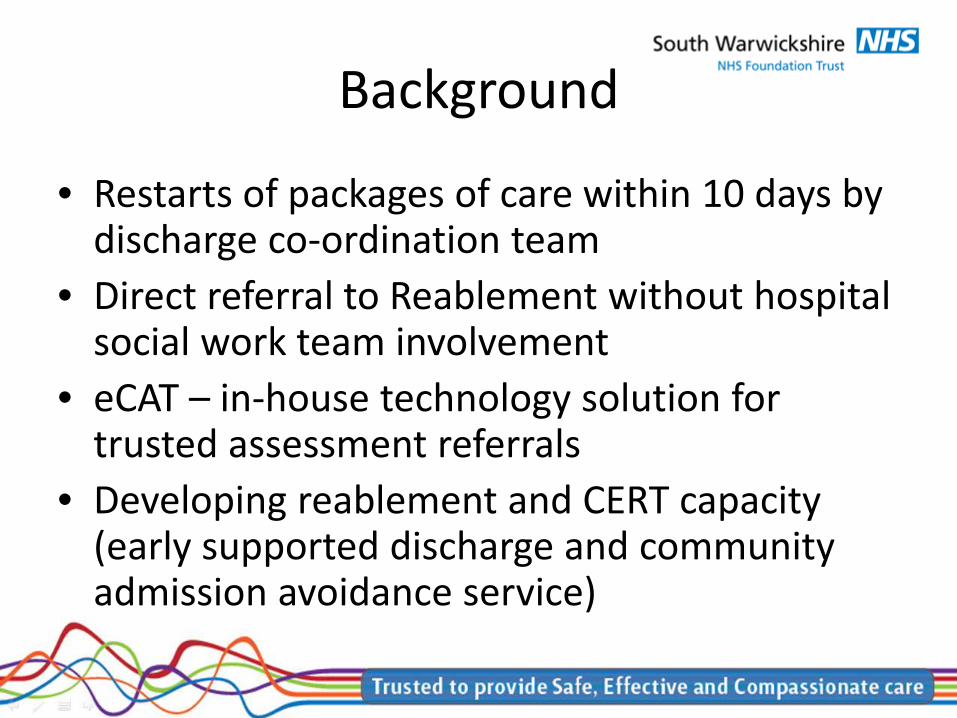
Background
• Restarts of packages of care within 10 days by discharge co-ordination team
• Direct referral to Reablement without hospital social work team involvement
• eCAT – in-house technology solution for trusted assessment referrals
• Developing reablement and CERT capacity (early supported discharge and community admission avoidance service)

Challenge- Operational Capacity Plan June 2016
Increased capacity in community to • Ensure all supported discharges are taken on the day • Increase the level of admission prevention by having
a genuine 2 hour response to primary care referral • Hold more patients awaiting car package to reduce
the number in Acute and community beds to zero
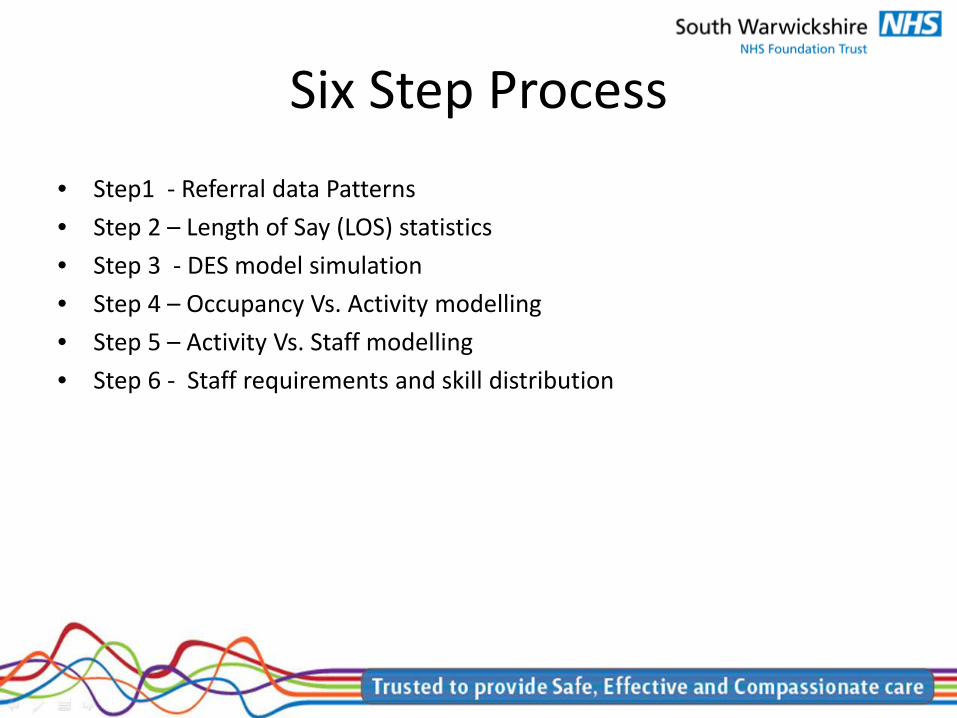
Six Step Process • Step1 - Referral data Patterns • Step 2 – Length of Say (LOS) statistics • Step 3 - DES model simulation • Step 4 – Occupancy Vs. Activity modelling • Step 5 – Activity Vs. Staff modelling • Step 6 - Staff requirements and skill distribution
Referral Pattern and Demand (Step 1)
0
5
10
15
20
25
1 3 5 7 9 11 13 15 17 19 21 23 25 27 29 31 33 35 37 39 41 43 45 47 49 51 53 55 57 59 61 63
Weekly referals
Max 95%
Min 95%

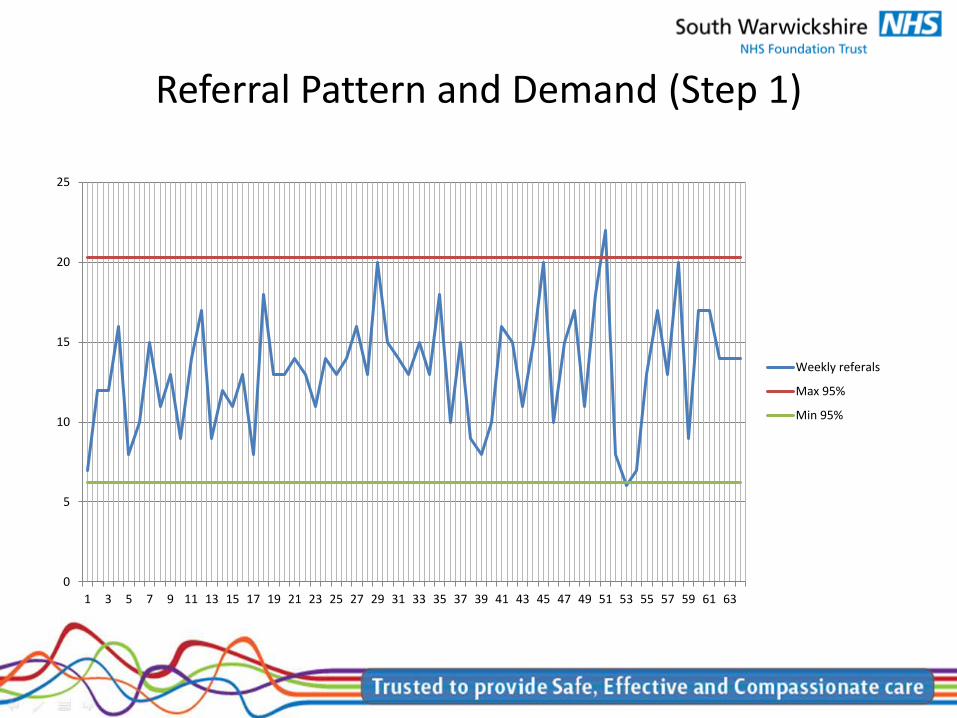
Referral Pattern and Demand (Step 1)
• Referral data has repeating patterns • People see patterns every where (Apophenia) • We can use statistics and mathematics to find historical patterns that
match (really exist) • We can use historical referral data to find potential matches with current
patterns (Auto-correlation) • Given we find matches , we can use what happened historically to predict
what may happen now ( Regression ) • We can determine a number of statistical properties from referral patterns
that are useful for modelling (Used in Step 3) • Given we have a “predicted referral pattern” we can use this in modelling
(Used in Step 3)
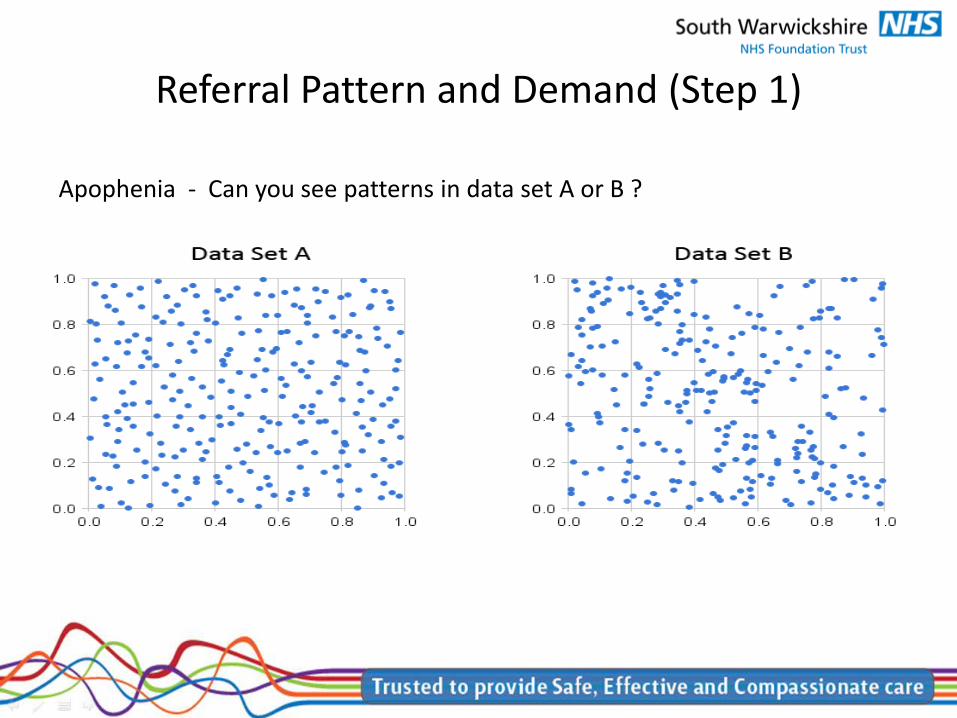
Referral Pattern and Demand (Step 1)
Apophenia - Can you see patterns in data set A or B ?

Length of Stay (LOS) (Step 2)
• Capacity has a significant dependency on Length of Stay (LOS) • Determine LOS characteristics from historical data • Using regression and stat-fit to determine LOS best fit equation (Normally
Exponential decay ) • Use LOS statistical distribution to inform (Step 3 DES)

Length of Stay (LOS) (Step 2)
0
10
20
30
40
50
60
70
80
90
100
1 3 5 7 9 11 13 15 17 19 21 23 25 27 29 31 33 35 37 39 41 43 45 47 49 51 53 55 57 59 61 63 65 67 69 71 73 75 77 79 81
NO
LOS in days
Real data
Predicted

DES Model (Step 3)
• Use Referral pattern from (Step 1) and LOS from (Step 2) • Produce simple Discrete Event simulation (DES ) model to predict (Patient
Occupancy inside the service ) • Simulate DES model for 52 weeks , and 52 replications to determine , the
average occupancy , min occupancy and the max occupancy for the service
• Output of the model are estimates of occupancy of the service that will inform (Step 4)

DES Model (Step 3)
Occupancy Vs. Activity (Step 4)
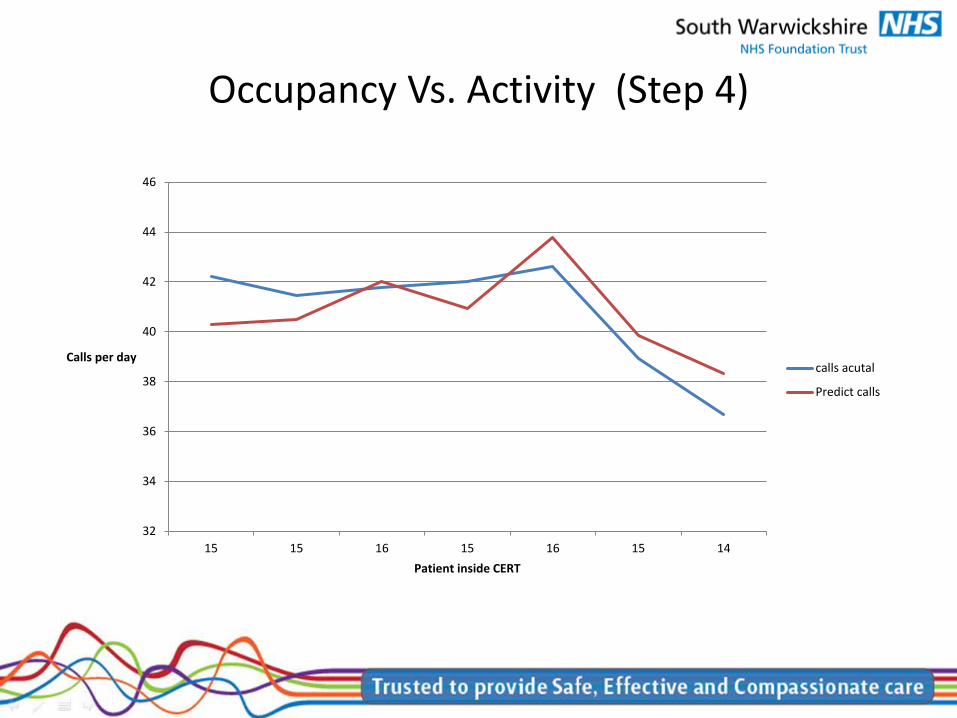
• Using historical data of occupancy and activity levels , using regression to determine the mathematical relationship between them with a high correlation
• Use the output from (Step 3) and its predicted occupancy , to predict the activity level using the mathematical relationship (Step4) , this will inform (Step 5)
Occupancy Vs. Activity (Step 4)
32
34
36
38
40
42
44
46
15 15 16 15 16 15 14
Calls per day
Patient inside CERT
calls acutal
Predict calls

Activity Vs. Staff (Step 5)
• Using historical data of staffing and activity levels , using regression to determine the mathematical relationship between them with a high correlation
• Use the output from (Step 4) of predicted activity , to predict the staffing level using the mathematical relationship (Step5) , this will inform (Step 6)

Activity Vs. Staff (Step 5)
0
10
20
30
40
50
60
70
27283032333334343535363637373838383838393940404040414242424344444545454648484849495051525354
Staff
Calls
Real staff
Predicted Staff
min
max
Staff Distribution (Step 6)
• Using predicted staffing levels from (Step 5) • Apply staffing levels to staff grade distributions to determine estimate of
staff grade numbers by grade • Staff grade distribution is dependent on (Occupancy ) of service and case
mix of patients.

Staff Distribution (Step 6)
0
10
20
30
40
50
2 3 4 5 6 7 8
No of staff
Staff bands
Staff Band distribution
05
101520253035
2 3 4 5 6 7 8
No of staff
Staff bands
Staff Band distribution
05
101520253035
2 3 4 5 6 7 8
No of staff
Staff bands
Staff Band distribution

Any Questions?
Plans- Work in Progress
• 60% referrals to CERT in South are accepted within 2 hours
• To increase level of admission prevention work is required with referrers
• System in place to monitor impact of new investment for example Apprentices
• Regional Capacity Management team • Work underway with GEH and UHCW
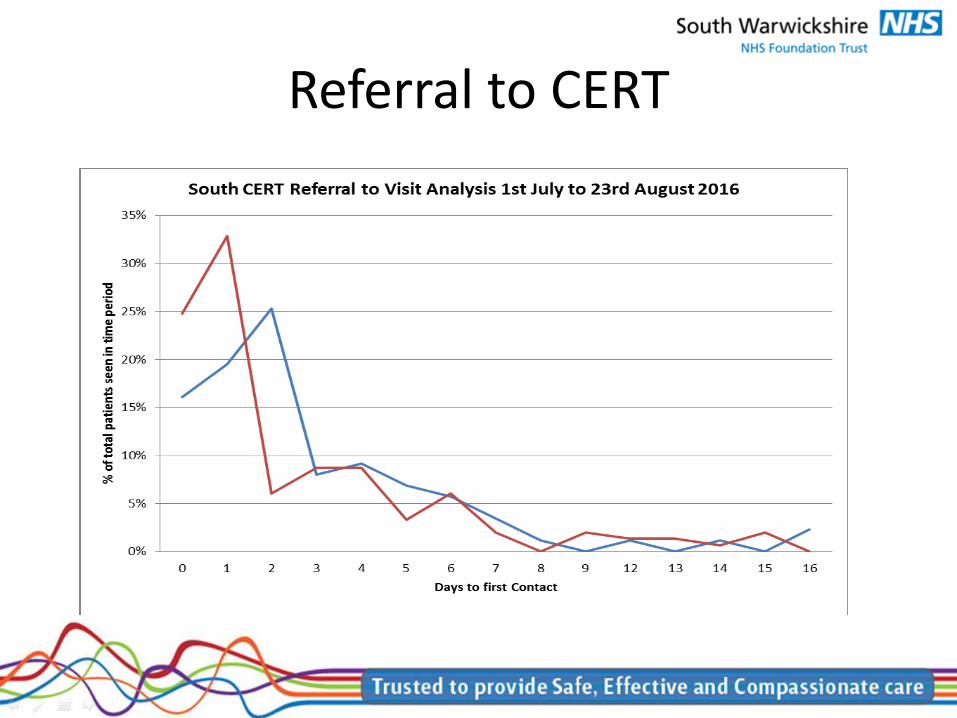
Referral to CERT


Investment- impact
0
5
10
15
20
25
30
35
40
04 A
pr 1
6
11 A
pr 1
6
18 A
pr 1
6
25 A
pr 1
6
02 M
ay 1
6
09 M
ay 1
6
16 M
ay 1
6
23 M
ay 1
6
30 M
ay 1
6
06 Ju
n 16
13 Ju
n 16
20 Ju
n 16
27 Ju
n 16
04 Ju
l 16
11 Ju
l 16
18 Ju
l 16
25 Ju
l 16
01 A
ug 1
6
08 A
ug 1
6
15 A
ug 1
6
22 A
ug 1
6
29 A
ug 1
6
05 S
ep 1
6
12 S
ep 1
6
South CERT Patient Referrals Waiting & PoC Waiting Apr-Aug 2016/17
Total Patient Referrals Waiting Patient's Waiting for PoC
Linear (Total Patient Referrals Waiting) Linear (Patient's Waiting for PoC)
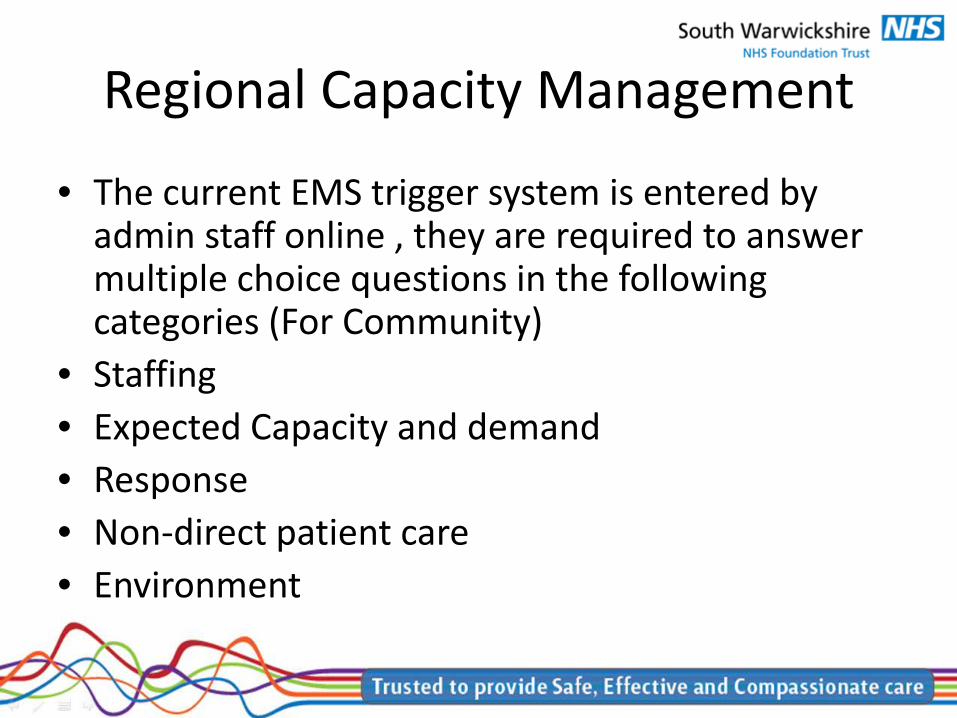
Regional Capacity Management
• The current EMS trigger system is entered by admin staff online , they are required to answer multiple choice questions in the following categories (For Community)
• Staffing • Expected Capacity and demand • Response • Non-direct patient care • Environment
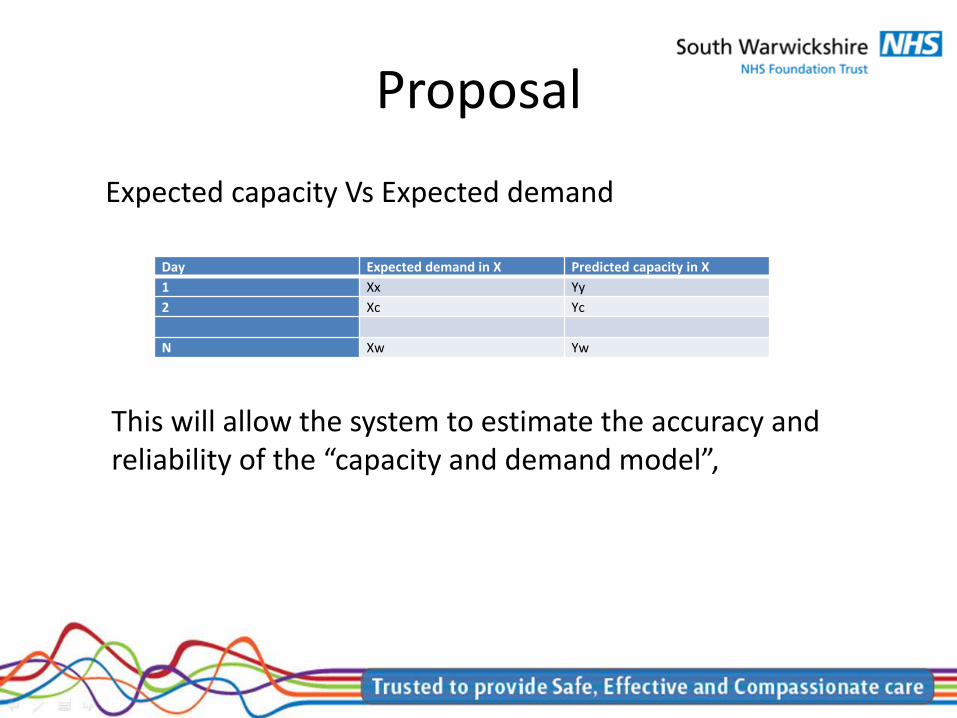
Proposal
Expected capacity Vs Expected demand
Day Expected demand in X Predicted capacity in X 1 Xx Yy 2 Xc Yc N Xw Yw
This will allow the system to estimate the accuracy and reliability of the “capacity and demand model”,

D2A Evaluation Workshop Sue Phillips Head of Transformation NHS South Warwickshire CCG Mike Donnison Information Lead NHS Arden and Greater East Midlands Commissioning Support Unit
Agenda • A short history
• The evaluation itself ▫ Purpose ▫ Approach ▫ Analysis ▫ Cost/Benefit Impact ▫ Information Governance
• Learnings
• Next Steps
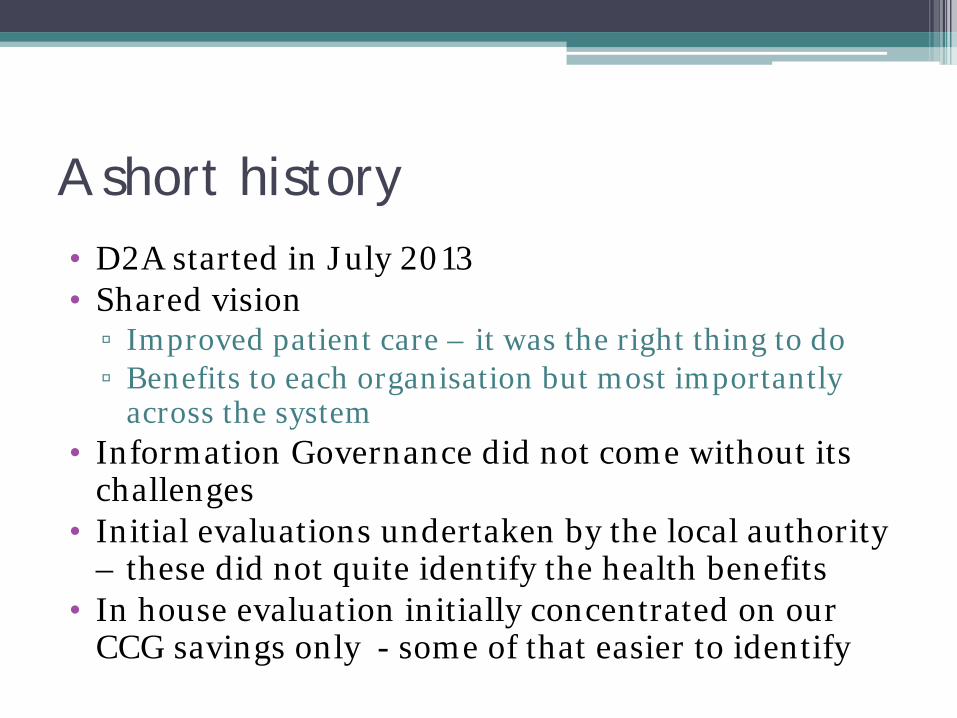
A short history • D2A started in July 2013 • Shared vision ▫ Improved patient care – it was the right thing to do ▫ Benefits to each organisation but most importantly
across the system • Information Governance did not come without its
challenges • Initial evaluations undertaken by the local authority
– these did not quite identify the health benefits • In house evaluation initially concentrated on our
CCG savings only - some of that easier to identify
Purpose of the Evaluation
To quantify the cost/ benefit impact of a cohort of patients admitted to acute care by comparing those accepting the D2A pathway to those not accepting the D2A pathway prior to their acute discharge

Approach – Metrics and Data • Metric Development
▫ Measures the pathways followed by patients accepting/ not accepting D2A ▫ Measures of Acute Stay, D2A Stay, Health and Social Care Packages Received ▫ Measures include Length/ Costs of Stay, Packages allocated and weekly costs ▫ Approximately 60 Metric identified
• D2A Dataset Development
▫ Underpinned the quantification of the metrics ▫ Data items held across Health and Social Care – Not accessible by one single
party ▫ Data linkage key to pulling elements together (NHS Number) ▫ Subject to data sharing agreements ▫ Subject to data sharing agreements ▫ Communication, Data Quality, Version Control issues and time related
dependencies ▫ Good data quality is key

Analysis • Analytical Model compared Accepting Group Vs Non Accepting Group for each of P2
and P3
• Model Estimation was 'The costs relating to the Non-Accepting Group if the patients in the Accepting Group had not accepted D2A' (i.e. Patients in Non Accepting group were volume adjusted equating to patient numbers in accepting group)
• Estimated costs then compared to actual costs identified in the Accepting Group
• Scope of Comparison – Acute Stays, D2A Stays, Patient Transport, Social Care, Continuing Healthcare and Funded Nursing Care packages
• Comparisons does not account for differences in the make up of the two groups

Acute/ D2A Stay Analysis • Total cost of acute spells compared directly between accepting and non-
accepting group (volume adjusted) • Not Casemix adjusted • Reduced Acute Care Costs in Acceptor Group
− - Shorter lengths of stay − - Referral onto D2A Beds − - Cost Aversion identified as benefit to Commissioners
• Acute + D2A Stay lengths in Acceptor > Acute Stay Length in Non-Acceptor
• Trim Point Adjustment − Greater numbers of acceptors (than non-acceptors) discharged below
trim point − Bed days below trim point quantified, Average cost per bed day applied
(£94) − Cost aversion identified as benefit to the provider

Post Discharge Analysis • Scope – Continuing Healthcare, Social Care, Funded Nursing
Care • 12 Month Time Horizon • Cost Impact estimates initially based on 6 months
− Assumed no changes to the initial number of packages received
• Refined Model − Developed for Continuing Healthcare and Social Care − Takes into account changing (reducing) numbers of service user over
time − Quantifies patients receiving packages at each month post discharge and
related average weekly costs − Not applied to Funded Nursing Care (Lower Cost Impact)

Sensitivity Analysis • Aim : To quantify the effect of uncertainty in the
model • Examined the cost impact of varying the probabilities
of individuals receiving packages of care • ‘Plausible Ranges’ applied, 5 to 25%, depending on
volume of patients • One way and two way sensitivity analysis applied
• Found that small variations in probabilities could potentially
have large effects on cost impact • Variations in probabilities susceptible to
- Small numbers - Poor Data Quality

Key Drivers of Cost/Benefit Impact
In the accepting group • D2A Provision • Shorter Acute Lengths of Stay, fewer excess bed days • Decreased probability of Social Care Packages • Decreased probability of CHC packages (and lower
cost per package of those receiving) • Increased probability of Funded Nursing Care packages

Information Governance
• The process ▫ Data set produced by South Warwickshire Foundation
Trust (SWFT) Discharge Team ▫ Sent to CSU ▫ Dataset generated ▫ Activity data reported ▫ Dataset shared with Warwickshire County Council to
add social care information ▫ Report produced ▫ All covered by an Appendix E
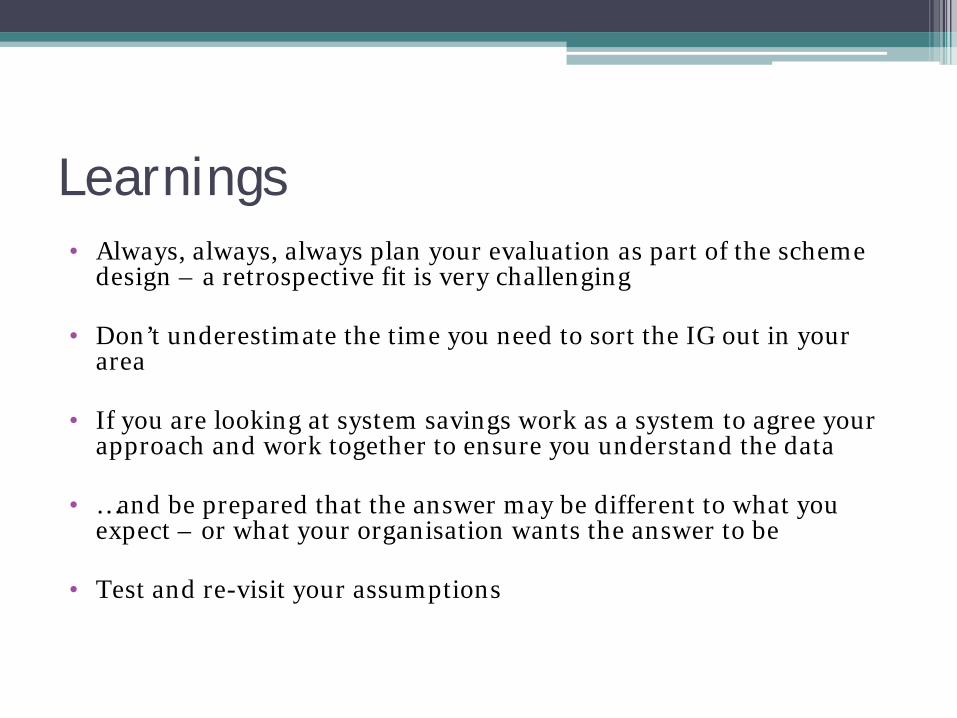
Learnings • Always, always, always plan your evaluation as part of the scheme
design – a retrospective fit is very challenging
• Don’t underestimate the time you need to sort the IG out in your area
• If you are looking at system savings work as a system to agree your approach and work together to ensure you understand the data
• …and be prepared that the answer may be different to what you expect – or what your organisation wants the answer to be
• Test and re-visit your assumptions

Learnings cont… • Clear set of metrics to inform evaluation
• Underpinned by dataset to quantify metrics
• Requires good cross organisational data collection and co-ordination
arrangements
• Importance of good data quality
• Analytical Model constructed to quantify cost impact of patients accepting D2A
• Refined model to track and quantify post discharge packages over time • Sensitivity Analysis tested uncertainty in the model

Next Steps
• D2A to move to business as usual
• Thank you and any questions

Thank you for attending this year’s Discharge to Assess
Best Practice Event!


