Welcome to the City of Gainesville
218
Transcript of Welcome to the City of Gainesville


MDA - 1
MANAGEMENT’S DISCUSSION AND ANALYSIS As management of the City of Gainesville (the “City”), we offer readers of the City’s financial statements this narrative overview and analysis of the financial activities of the City for the fiscal year ended September 30, 2004. Management’s Discussion and Analysis is designed to (a) assist the reader in focusing on significant financial issues, (b) provide an overview of the City’s financial activity, (c) identify changes in the City’s financial position, (d) identify any material deviations from the financial plan, and (e) identify individual fund issues or concerns. We encourage readers to consider the information presented here in conjunction with additional information that we have furnished in our letter of transmittal, which can be found on pages vi - xii of this report, and the City’s financial statements which begin on page 1. Financial Highlights
• The assets of the City exceeded its liabilities at the close of the most recent fiscal year by $498,499,062 (net assets). Of this amount, $36,794,999 (unrestricted net assets) may be used to meet the City’s ongoing obligations to citizens and creditors.
• The City’s total net assets increased by $15,677,122. • As of the close of the fiscal year, the City’s governmental funds reported combined ending fund
balances of $31,510,952, a decrease of $11,348,417 in comparison with the prior year. Of this total amount, $18,225,332 is available for spending at the City’s discretion (unreserved fund balance).
• At the end of the current fiscal year, the undesignated fund balance in the General Fund was $6,744,693.
• The City’s total bonded debt decreased by $18,820,250, or 3.18% during the current fiscal year. In addition to the scheduled pay down of existing debt, the prominent components of this change were the issuance of $9,805,000 in Guaranteed Entitlement Refunding Bonds Series 2004. These bonds refunded $10,010,000 in Series 1994 Guaranteed Entitlement Revenue and Refunding Bonds.
Overview of the Financial Statements This discussion and analysis are intended to serve as an introduction to the City’s basic financial statements. The City’s basic financial statements comprise three components: 1) government-wide financial statements, 2) fund financial statements, and 3) notes to the financial statements. This report also contains other supplementary information in addition to the basic financial statements themselves. Government-wide financial statements. The government-wide financial statements are designed to provide readers with a broad overview of the City’s finances, in a manner similar to a private-sector business. The statement of net assets presents information on all of the City’s assets and liabilities, with the difference between the two reported as net assets. Over time, increases or decrease in net assets may serve as a useful indicator of whether the financial position of the City is improving or deteriorating. The statement of activities presents information showing how the city’s net assets changed during the most recent fiscal year. All changes in net assets are reported as soon as the underlying event giving rise to the change occurs, regardless of the timing of related cash flows. Thus, revenues and expenses are reported in
MDA - 2
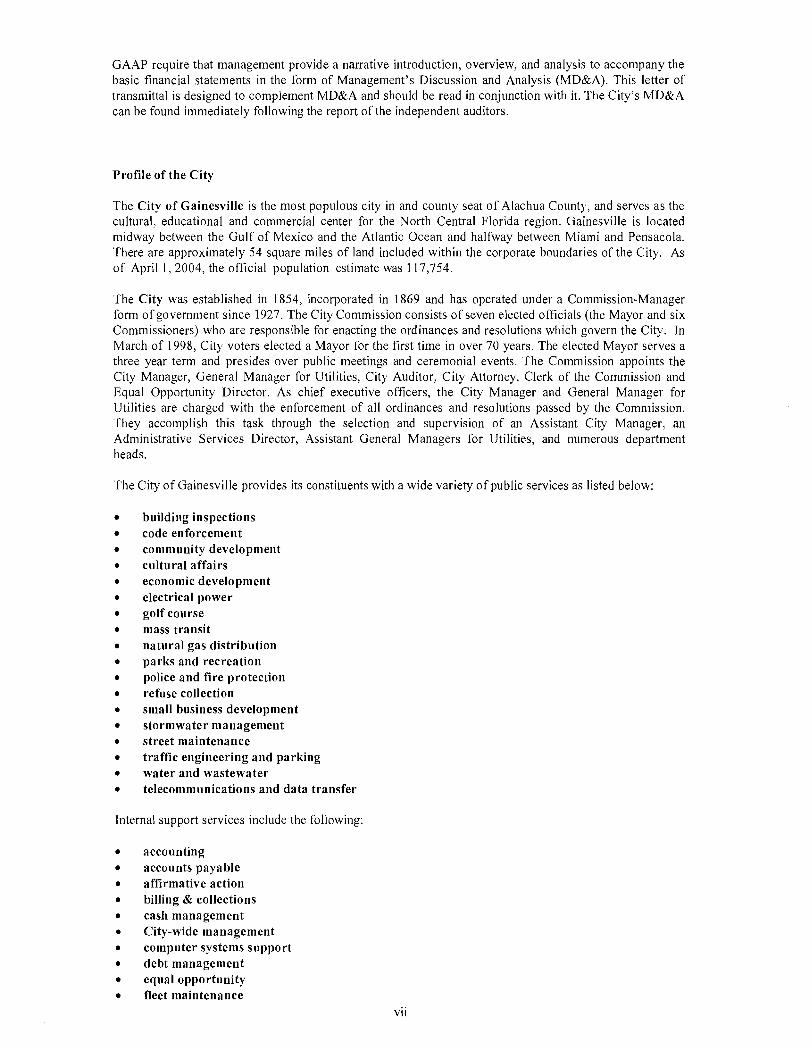
this statement for some items that will only result in cash flows in future fiscal periods (e.g., uncollected taxes and earned but unused sick leave). Both of the government-wide financial statements distinguish functions of the City that are principally supported by taxes and intergovernmental revenues (governmental activities) from other functions that are intended to recover all or a significant portion of their costs through user fees and charges (business-type activities). The governmental activities of the City include general government, public safety, physical environment, transportation, economic environment, human services and culture and recreation. The business-type activities include electric generation, transmission and distribution, natural gas, water and wastewater, telecommunications, refuse collection, stormwater management, golf course, and mass transit. The government-wide financial statements include not only the City itself, but also a legally separate enterprise zone development agency, and a legally separate redevelopment agency for which the City is financially accountable. Financial information for these component units is reported separately from the financial information presented for the primary government itself. The government-wide financial statements can be found on pages 1-2 of this report. Fund financial statements. A fund is a grouping of related accounts that is used to maintain control over resources that have been segregated for specific activities or objectives. The City, like other state and local governments, uses fund accounting to ensure and demonstrate compliance with finance-related legal requirements. All of the funds of the City can be divided into three categories: governmental funds, proprietary funds, and fiduciary funds. Governmental funds. Governmental funds are used to account for essentially the same functions reported as governmental activities in the government-wide financial statements. However, unlike the government-wide financial statements, governmental fund financial statements focus on near-term inflows and outflows of spendable resources, as well as on balances of spendable resources available at the end of the fiscal year. Such information may be useful in evaluating a government’s near-term financing requirements. Because the focus of governmental funds is narrower than that of the government-wide financial statements, it is useful to compare the information presented for governmental funds with similar information presented for governmental activities in the government-wide financial statements. By doing so, readers may better understand the long-term impact of the government’s near-term financing decisions. Both the governmental fund balance sheet and the governmental fund statement of revenues, expenditures, and changes in fund balances provide a reconciliation to facilitate this comparison between governmental funds and governmental activities. The City maintains forty individual governmental funds. Information is presented separately in the governmental fund balance sheet and in the governmental fund statement of revenues, expenditures and changes in fund balances for the general fund, which is considered to be a major fund. Data from the other thirty-nine governmental funds are combined into a single, aggregated presentation. Individual fund data for each of these nonmajor governmental funds is provided in the form of combining statements elsewhere in this report. The basic governmental fund financial statements can be found on pages 3-6 of this report. Proprietary funds. The City maintains two different types of proprietary funds. Enterprise funds are used to report the same functions presented as business-type activities in the government-wide financial statements. The City maintains five enterprise funds to account for the following operations: electric power generation, transmission and distribution, natural gas distribution, water and wastewater treatment, telecommunications, refuse collection, golf course, stormwater management, and mass transit. Internal service funds are an accounting device used to accumulate and allocate costs internally among the City’s various functions. The City maintains four internal service funds to account for fleet management operations, general insurance, employee, and retiree health insurance programs. Because these services predominantly benefit governmental rather than business-type functions, they have been included within governmental activities in the government-wide financial statements.

MDA - 3
Proprietary funds provide the same type of information as the government-wide financial statements, only in more detail. The proprietary fund financial statements provide separate information for the utility fund, which is considered to be a major fund of the City. Data from the other four proprietary funds are combined into a single, aggregated presentation. The four internal service funds are combined into a single, aggregated presentation in the proprietary fund financial statements. Individual fund data for the nonmajor enterprise funds as well as for the internal service funds is provided in the form of combining statements elsewhere in this report. The basic proprietary fund financial statements can be found on pages 7-12 of this report. Fiduciary funds. Fiduciary funds are used to account for resources held for the benefit of parties outside the government. Fiduciary funds are not reflected in the government-wide financial statements because the resources of those funds are not available to support the City’s own programs. The accounting used for fiduciary funds is much like that used for proprietary funds. The basic fiduciary fund financial statements can be found on pages 13-14 of this report. Notes to the financial statements. The notes provide additional information that is essential to a full understanding of the data provided in the government-wide and fund financial statements. The notes to the financial statements can be found on pages 15-43 of this report. Other information. In addition to the basic financial statements and accompanying notes, this report also presents certain required supplementary information concerning the City’s compliance with its General Fund budget and the City’s progress in funding its obligation to provide pension benefits to its employees. Required supplementary information can be found on pages 44-48 of this report. The combining statements referred to earlier in connection with nonmajor governmental and proprietary funds, and internal service funds are presented immediately following the required supplementary information. Combining and individual fund statements and capital asset schedules can be found on pages 47-108 of this report. Government-wide Financial Analysis As noted earlier, net assets may serve over time as a useful indicator of a government’s financial position. In the case of the City, assets exceeded liabilities by $498,499,062 at the close of the most recent fiscal year. Approximately 75% of the City’s net assets reflect its investment in capital assets (e.g., land, utility plant and equipment, buildings, improvements, machinery and equipment, and infrastructure), less any related debt used to acquire those assets that is still outstanding. The City uses these capital assets to provide services to citizens; consequently these assets are not available for future spending. Although the City’s investment in its capital assets is reported net of related debt, it should be noted that the resources needed to repay this debt must be provided from other sources, since the capital assets themselves cannot be used to liquidate these liabilities.

MDA - 4
FY04 FY03 FY04 FY03 FY04 FY03
Current and other assets 143,708,474$ 155,096,811$ 378,095,598$ 429,050,735$ 521,804,072$ 584,147,546$
Capital assets 107,952,914 97,442,123 731,041,444 702,723,007 838,994,358 800,165,130
Total assets 251,661,388 252,538,934 1,109,137,042 1,131,773,742 1,360,798,430 1,384,312,676
Long-term liabilities
outstanding 124,893,489 129,419,632 438,617,383 452,689,486 563,510,872 582,109,118
Other liabilities 14,816,961 13,325,271 283,971,535 306,056,348 298,788,496 319,381,619
Total liabilities 139,710,450 142,744,903 722,588,918 758,745,834 862,299,368 901,490,737
Net assets:
Invested in capital assets,
net of related debt 79,593,219 47,854,313 319,702,835 281,117,024 399,296,054 328,971,337
Restricted 12,928,276 22,754,050 49,479,733 83,814,681 62,408,009 106,568,731
Unrestricted 19,429,443 39,185,669 17,365,556 8,096,203 36,794,999 47,281,872
Total net assets 111,950,938$ 109,794,032$ 386,548,124$ 373,027,908$ 498,499,062$ 482,821,940$
City of Gainesville's Net Assets
activitiesGovernmental Business-type
activities Total
An additional portion of the City’s net assets ($62,408,009 or 12.5 %) represents resources that are subject to external restrictions on how they may be used. The remaining balance of unrestricted net assets ($36,794,999) may be used to meet the government’s ongoing obligations to citizens and creditors. At the end of the current fiscal year, the City is able to report positive balances in all three categories of net assets, both for the government as a whole, as well as for its separate governmental and business-type activities. The City’s net assets increased by $15,677,122 during the current fiscal year.

MDA - 5
Governmental Business-type
activities activities Total
FY04 FY03 FY04 FY03 FY04 FY03
Revenues:
Program revenues:
Charges for services 11,802,297$ 11,863,349$ 245,134,371$ 229,449,766$ 256,936,668$ 241,313,115$
Operating grants and contributions 5,951,582 4,681,010 5,059,409 4,968,210 11,010,991 9,649,220
Capital grants and contributions 1,406,477 4,971,251 7,572,300 5,953,321 8,978,777 10,924,572
General Revenues: - -
Property taxes 17,983,617 16,341,921 - - 17,983,617 16,341,921
Other taxes 18,961,421 17,738,773 - - 18,961,421 17,738,773
State revenue sharing 3,367,156 2,825,141 - - 3,367,156 2,825,141
Interest 2,641,812 1,634,773 7,011,499 6,468,299 9,653,311 8,103,072
Other revenues 3,564,261 6,097,543 16,155,309 13,945,313 19,719,570 20,042,856
Total revenues 65,678,623 66,153,761 280,932,888 260,784,909 346,611,511 326,938,670
Expenses:
General Government 18,458,043 15,061,813 - - 18,458,043 15,061,813
Public Safety 45,714,000 42,574,106 - - 45,714,000 42,574,106
Physical environment 2,827,492 2,832,078 - - 2,827,492 2,832,078
Transportation 9,548,804 9,358,165 - - 9,548,804 9,358,165
Economic environment 3,583,832 5,135,218 - - 3,583,832 5,135,218
Human services 1,713,715 1,490,131 - - 1,713,715 1,490,131
Culture & recreation 3,669,838 5,317,908 - - 3,669,838 5,317,908
Interest on long-term debt 5,136,385 3,626,965 - - 5,136,385 3,626,965
Electric - - 152,668,644 140,555,094 152,668,644 140,555,094
Gas - - 22,402,154 20,745,014 22,402,154 20,745,014
Water - - 15,662,347 14,213,832 15,662,347 14,213,832
Wastewater - - 17,978,035 17,514,229 17,978,035 17,514,229
GRUCom - - 6,626,562 6,296,174 6,626,562 6,296,174
Regional Transit System - - 13,946,979 12,833,553 13,946,979 12,833,553
Stormwater - - 3,963,762 3,934,824 3,963,762 3,934,824
Ironwood - - 1,438,628 1,531,655 1,438,628 1,531,655 Solid waste - - 5,595,169 5,703,055 5,595,169 5,703,055
Total expenses 90,652,109 85,396,384 240,282,280 223,327,430 330,934,389 308,723,814
Increase(Decrease) in net assets
before transfers (24,973,486) (19,242,623) 40,650,608 37,457,479 15,677,122 18,214,856
Transfers 27,130,392 26,366,066 (27,130,392) (26,366,066) - -
Increase in net assets 2,156,906 7,123,443 13,520,216 11,091,413 15,677,122 18,214,856
Net assets - 10/1/03 109,794,032 102,670,589 373,027,908 437,371,315 482,821,940$ 540,041,904$ Prior Period Adjustment - - - (75,434,820) -$ (75,434,820)$
Net assets - 10/1/03, as restated 109,794,032 102,670,589 373,027,908 361,936,495 482,821,940 464,607,084
Net assets - 9/30/04 111,950,938$ 109,794,032$ 386,548,124$ 373,027,908$ 498,499,062$ 482,821,940$
City of Gainesville Changes in Net Assets
MDA - 6
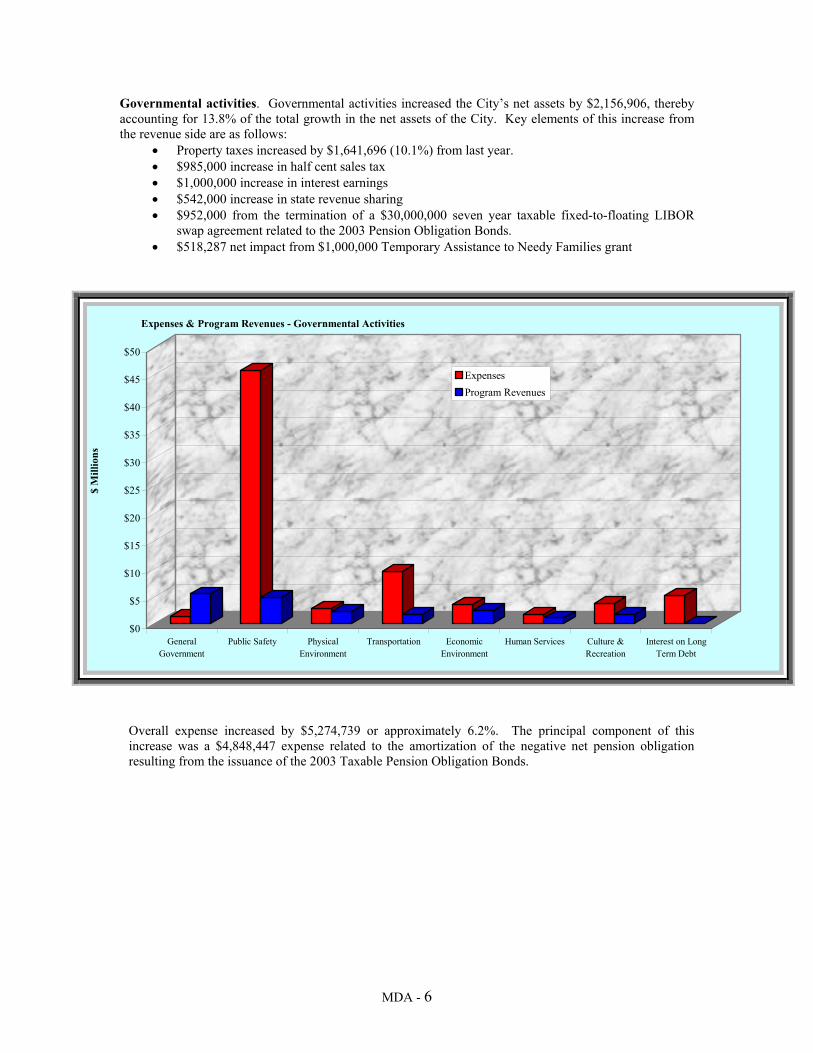
Governmental activities. Governmental activities increased the City’s net assets by $2,156,906, thereby accounting for 13.8% of the total growth in the net assets of the City. Key elements of this increase from the revenue side are as follows:
• Property taxes increased by $1,641,696 (10.1%) from last year. • $985,000 increase in half cent sales tax • $1,000,000 increase in interest earnings • $542,000 increase in state revenue sharing • $952,000 from the termination of a $30,000,000 seven year taxable fixed-to-floating LIBOR
swap agreement related to the 2003 Pension Obligation Bonds. • $518,287 net impact from $1,000,000 Temporary Assistance to Needy Families grant
$0
$5
$10
$15
$20
$25
$30
$35
$40
$45
$50
GeneralGovernment
Public Safety PhysicalEnvironment
Transportation EconomicEnvironment
Human Services Culture &Recreation
Interest on LongTerm Debt
Expenses & Program Revenues - Governmental Activities
ExpensesProgram Revenues
$ M
illio
ns
Overall expense increased by $5,274,739 or approximately 6.2%. The principal component of this increase was a $4,848,447 expense related to the amortization of the negative net pension obligation resulting from the issuance of the 2003 Taxable Pension Obligation Bonds.

MDA - 7
Revenues by Source - Governmental Activities
Charges For Services18%
Operating Grants & Contributions
9%Property Taxes
27%
Other Taxes29%
Other 15%
Capital Grants & Contributions
2%
Business-type activities. Business-type activities increased the City’s net assets by $13,520,216 accounting for 86.2% of the total growth of the City’s net assets. Key elements of this increase are as follows:
• Utility operating revenue increased $15.1 million, or approximately 6.7%. The increase was offset in part by higher fuel costs in fiscal 2004 at approximately $8.2 million, or about 10%, which are passed directly through to our customers.
• The number of customers for electric, water, wastewater and gas services increased 3.3%, 3.1%, 2.9% and 1.8% respectively in fiscal 2004.
• Gainesville Regional Utility‘s service area incurred approximately $5.5 million of damage to its facilities as a result of two hurricanes in September 2004. It is anticipated that a significant portion of the costs will be reimbursed through Federal Emergency Management Agency (FEMA) funding. The estimated $5.5 million cost has been accrued as part of fiscal 2004 activity.

MDA - 8
$0
$20
$40
$60
$80
$100
$120
$140
$160
Electric Gas Water Wastewater Grucom RegionalTransit
Stormwater Ironwood Solid Waste
Expenses & Program Revenues - Business-Type Activities
Expenses
Program Revenues
$ M
illio
ns
Financial Analysis of the Government’s Funds As noted earlier, the City uses fund accounting to ensure and demonstrate compliance with finance-related legal requirements. Governmental funds. The focus of the City’s governmental funds is to provide information on near-term inflows, outflows, and balances of spendable resources. Such information is useful in assessing the City’s financing requirements. In particular, unreserved fund balance may serve as a useful measure of the City’s net resources available for spending at the end of a fiscal year. As of the end of the current fiscal year, the City’s governmental funds reported combined ending fund balances of $31,510,952, a decrease of $11,348,417 in comparison with the prior year. Approximately 58% ($18,225,332) of this total amount constitutes unreserved fund balance, which is available for spending at the government’s discretion. The remainder of fund balance is reserved to indicate that it is not available for new spending because it has already been committed 1) to liquidate contracts and purchase orders of the prior period ($6,170,526), 2) to pay debt service ($499,000), 3) noncurrent receivables ($2,189,096), and 4) for a variety of other restricted purposes ($4,426,948). The general fund is the chief operating fund of the City. At the end of the current fiscal year there was $6,744,693 undesignated fund balance of the general fund, while total fund balance was $13,264,280. As a measure of the general fund’s liquidity, it may be useful to compare both undesignated fund balance and total fund balance to total fund expenditures. Undesignated fund balance is 9.4% of total expenditures, while total fund balance represents 18.4% of that same amount. The fund balance of the City’s general fund decreased by $1,314,532 during the current fiscal year. This was an improvement from the prior year decline of $3,318,771. Key factors in this improvement from the prior year are as follows:
• An increase in property tax revenues of $1,404,141. The millage rate remained the same as the previous year, so this growth was generated through an increase in the property tax base.
• An increase of $985,902 in half cent sales tax revenue.

MDA - 9
• A decrease of $669,920 in fire protection revenues through the Designated Assistance Agreement with Alachua County. This decrease was the result of the southwest area annexation.
• An increase of $1,094,329 in transfers from the City-owned utility system, including water and wastewater connection surcharges.
• Revenues of $952,733 from the termination of a $30,000,000 seven year taxable fixed-to-floating LIBOR swap agreement.
The special revenue funds have a total fund balance of $8,867,187, which represents a decrease of $1,459,515 from last year’s balance of $10,326,702. The debt service funds have a total fund balance of $1,201,303, $499,000 of which is reserved for the payment of debt service. The net increase in fund balance for the current year for these funds was $83,732. Fund balance in the capital projects funds decreased by $8,658,102 from $16,836,284 to $8,178,182. This reduction is primarily the product of the expenditures of the 1¢ sales tax proceeds on construction of the Downtown Parking Garage. Proprietary funds. The City’s proprietary fund financial statements provide the same type of information found in the government-wide financial statements, but in more detail. Factors concerning the finances of these funds have been addressed in the discussion of the City’s business-type activities. General Fund Budgetary Highlights The difference between the original and final sources budget was $1,485,259 or 1.9%. The primary components of this change were:
• $953,733 related to the termination payment the City received on the $30,000,000 fixed-to-floating interest rate swap against the Series 2003A and Series 2003B Taxable Pension Obligation Bonds.
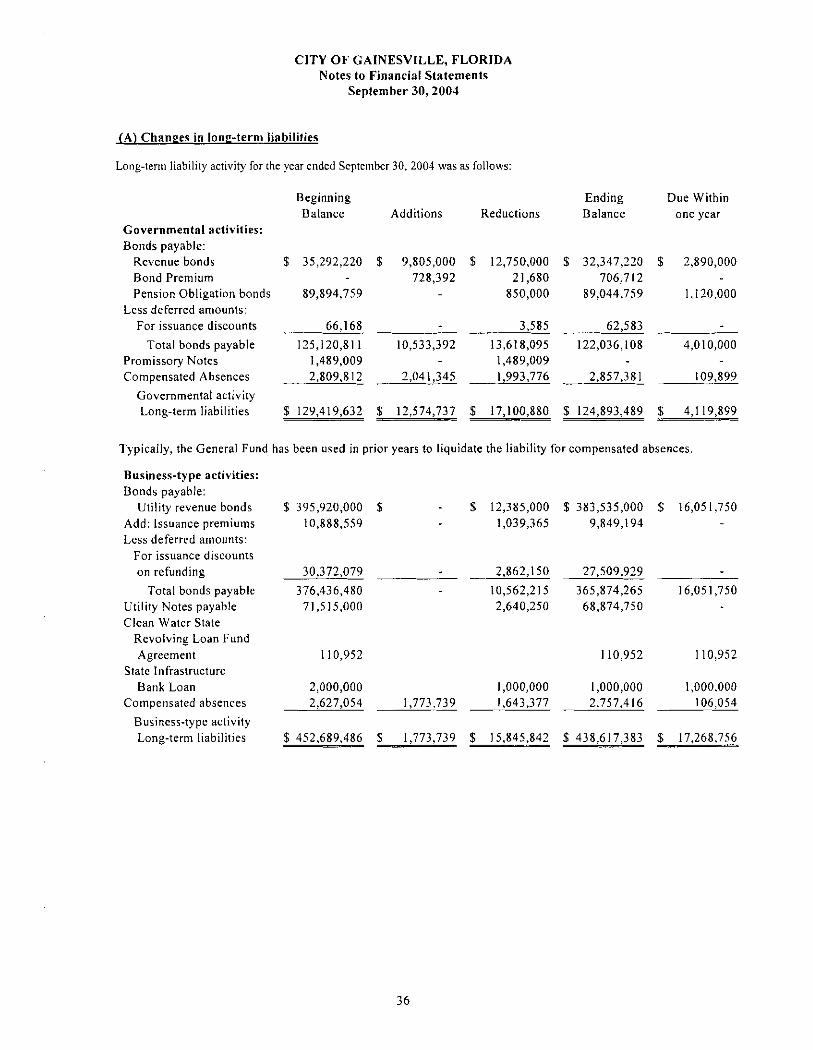
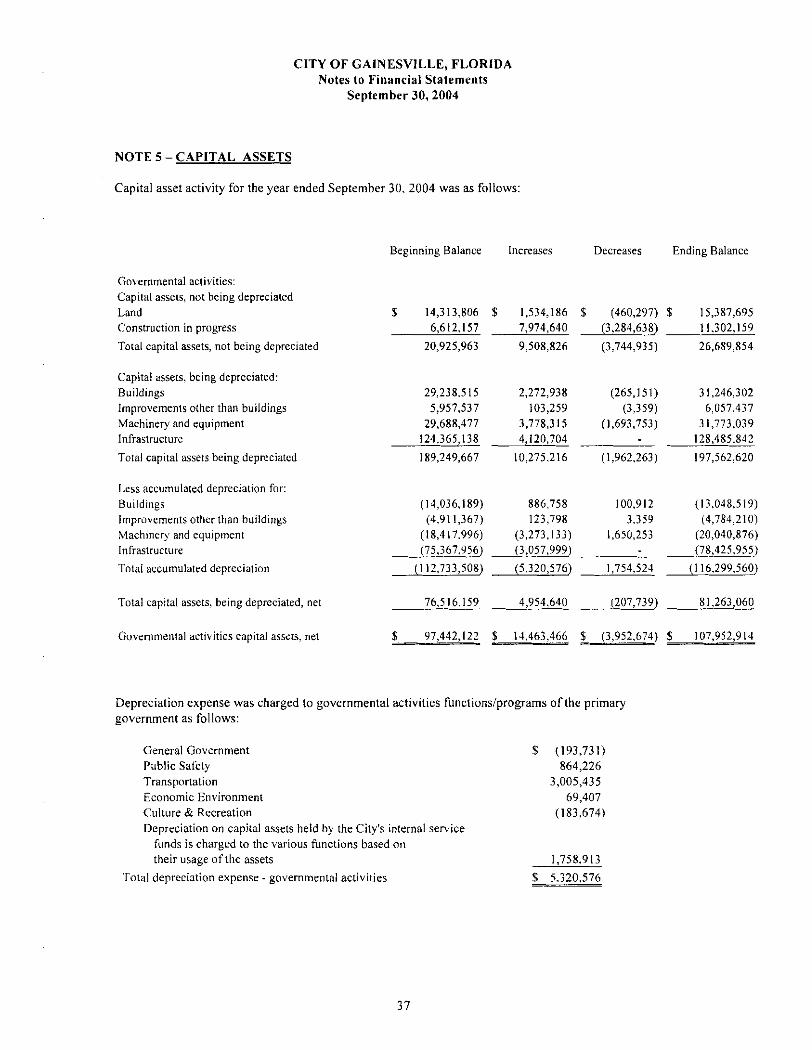
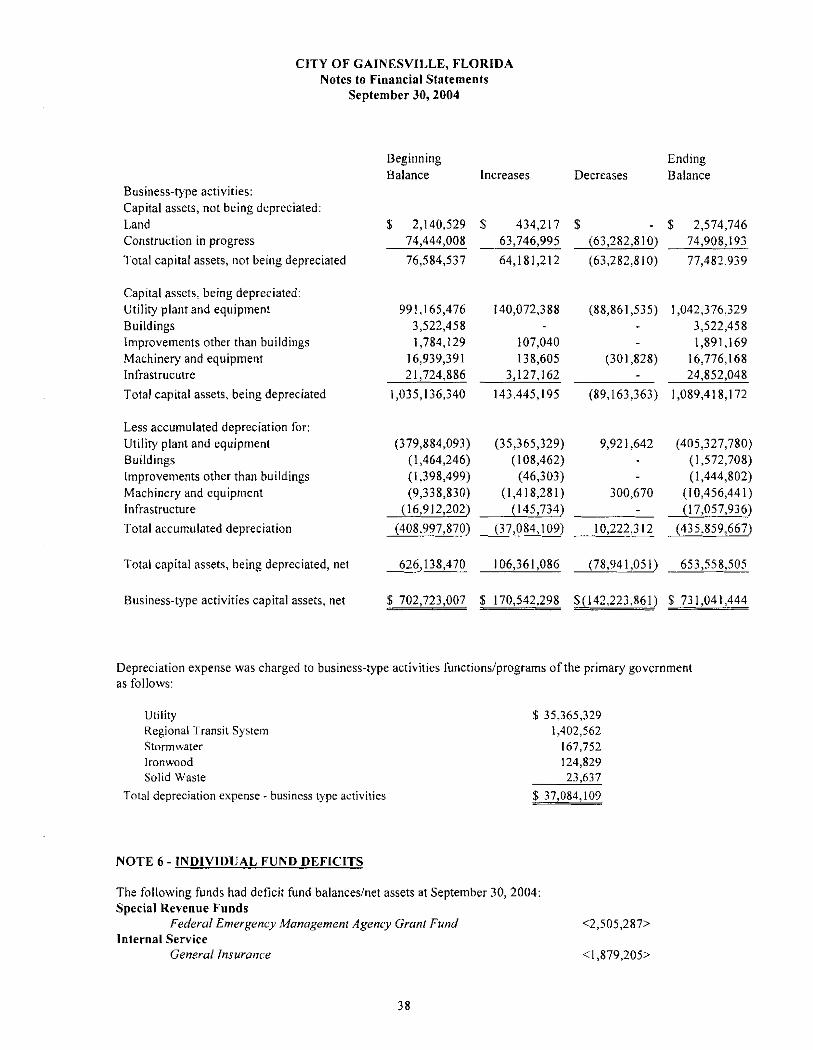
• $290,597 in Utility transfer incentive monies. The difference between the original and final general fund budget for expenditures and other uses was $3,201,664, or 4.05%. The largest part of this change was a $2,659,575 increase in transfers, most of which went to the construction and acquistion of certain capital projects in the General Capital Projects Fund. Capital Asset and Debt Administration Capital assets. The City’s investments in capital assets for its governmental and business type activities as of September 30, 2004 amounts to $838,994,358 (this is net of accumulated depreciation). The investment in capital assets includes land, buildings, improvements, machinery and equipment, utility infrastructure, roads, bikepaths and sidewalks. Major capital asset events during the fiscal year include:
• 600,000 in general roadway resurfacing. • 1.3 million North East Duck Pond restoration and stormwater improvements. • The expansion of the Kanapaha Reclamation Facility’s wastewater treatment capacity by 5
million gallons per day (MGD) was completed in FY 2004. Costs added to the project this year were $2.4 million. Total value added to wastewater treatment assets was $15.5 million.
• Electric transmission and distribution net expansion was $9.3 million. • Fiber optic service expansion was $6.7 million and included $2.3 million for trunking radio
projects. • Electric production plant increased $16.6 million and included boiler control upgrades of $3.3
million at the Deerhaven Generation Unit. • Near completion of the $8 million 850 space City owned parking garage. • $500,000 reconstruction of SW 23rd Terrace between Williston Road and Archer Road.

MDA - 10
Governmental Business-typeactivities activities Total
FY04 FY03 FY04 FY03 FY04 FY03Land 15,387,695 14,313,806$ 2,574,746$ 2,140,529$ 17,962,441$ 16,454,335$
Utility p & e - - 637,048,549 611,281,383 637,048,549 611,281,383 Buildings 18,197,783 15,202,326 1,949,750 2,058,212 20,147,533 17,260,538 Improvements 1,273,227 1,046,170 446,367 385,630 1,719,594 1,431,800
Mach & equip 11,732,163 11,270,481 6,319,727 7,600,561 18,051,890 18,871,042 Infrastructure 50,059,887 48,997,182 7,794,112 4,812,684 57,853,999 53,809,866
Const in prog 11,302,159 6,612,157 74,908,193 74,444,008 86,210,352 81,056,165 Total 107,952,914$ 97,442,122$ 731,041,444$ 702,723,007$ 838,994,358$ 800,165,129$
City of Gainesville's Capital Assets(net of depreciation)
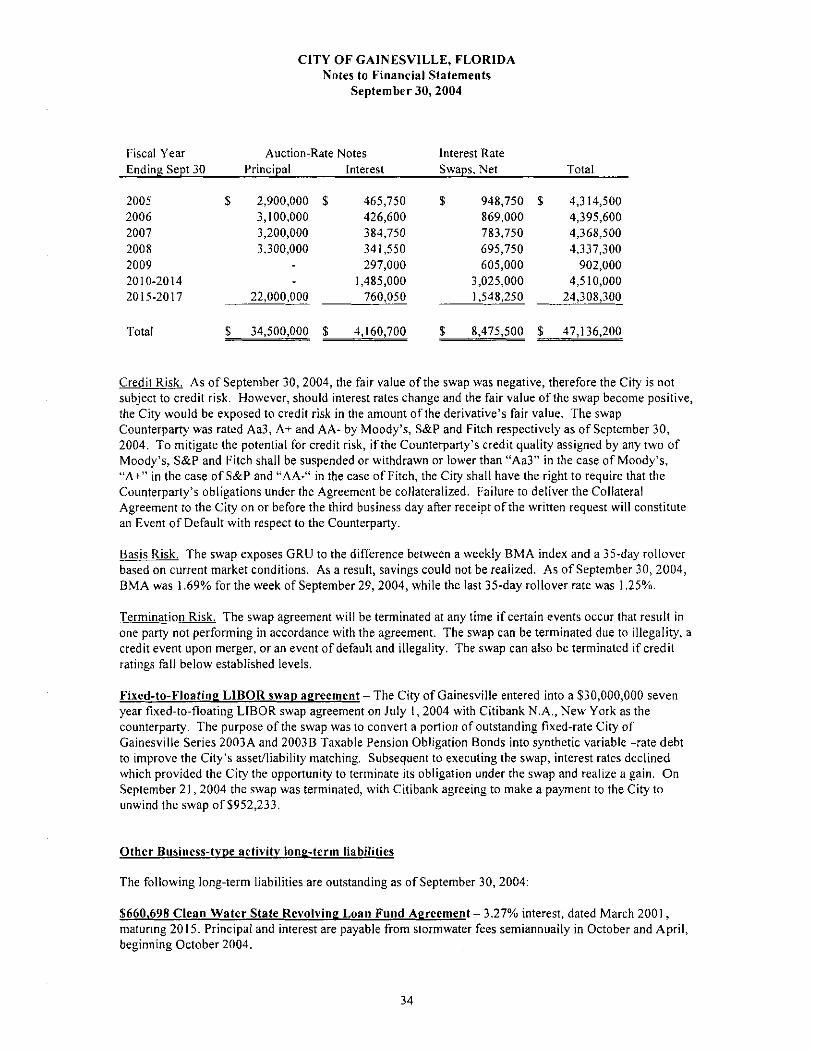
Additional information on the City’s capital assets can be found in note 5 on pages 37-38 of this report. Bonded debt. At the end of the current fiscal year, the City had total bonded debt outstanding of $573,801,729. All of this amount represents bonds secured solely by specified revenue sources (i.e., revenue bonds and notes).
Governmental Business-typeactivities activities Total
Pension obligation bonds 89,044,759$ -$ 89,044,759$ Revenue bonds & Utility notes 32,347,220 452,409,750 484,756,970 Total 121,391,979$ 452,409,750$ 573,801,729$
City of Gainesville's Outstanding DebtGeneral Obligation, Revenue Bonds & Utility Notes
The City’s total debt decreased by $18,820,250, or 3.18% during the current fiscal year. In addition to the scheduled pay down of existing debt, the prominent components of this change were the issuance of the $9,805,000 Series 2004 Guaranteed Entitlement Refunding Bonds. This issue refunded $10,010,000 of Series 1994 Guaranteed Entitlement Revenue and Refunding Bonds. The City’s utility system debt is rated AA by both Standard & Poor’s and Moody’s, and the Moody’s underlying rating on the General Government First Florida Governmental Financing Commission Loans are A2. Additional information on the City’s long-term debt can be found in Note 4 on pages 30-36 of this report.
MDA - 11
Economic Factors and Next Year’s Budgets and Rates Some of the significant factors considered in preparing the City’s FY2004 budgets were: • Gainesville’s unemployment rate is currently 2.62%. This is less than half of the state and
national averages. • Per capita income in Gainesville is $25,572. This equates to 88% of state and 84% of national
levels. • Over half of Gainesville’s jobs are supplied by the government, education and health services
sectors. Such an economic structure tends to mitigate the impact of external economic stimuli. Gainesville’s economy does not rise as much as the national average during economic expansions, nor fall as much during economic declines.
Utility rate highlights for the 2004 fiscal year are as follows: • Water and wastewater connection fee charges increased 3.3% and 9.3% respectively. • No change in electric or gas rates. • Water system customer charges increased from $0.15 to $3.15. • Commercial customer water rates increased $0.21 per 1,000 gallons, or 20.6%. • Wastewater customer charges increased $0.12 to $2.39 and base rates were increased $0.14, or
5.4%. Requests for Information This financial report is designed to provide a general overview of the City’s finances. Questions concerning any of the information provided in this report or requests for additional financial information should be addressed to the Finance Director, 200 East University Avenue, Gainesville, Florida, 32601.


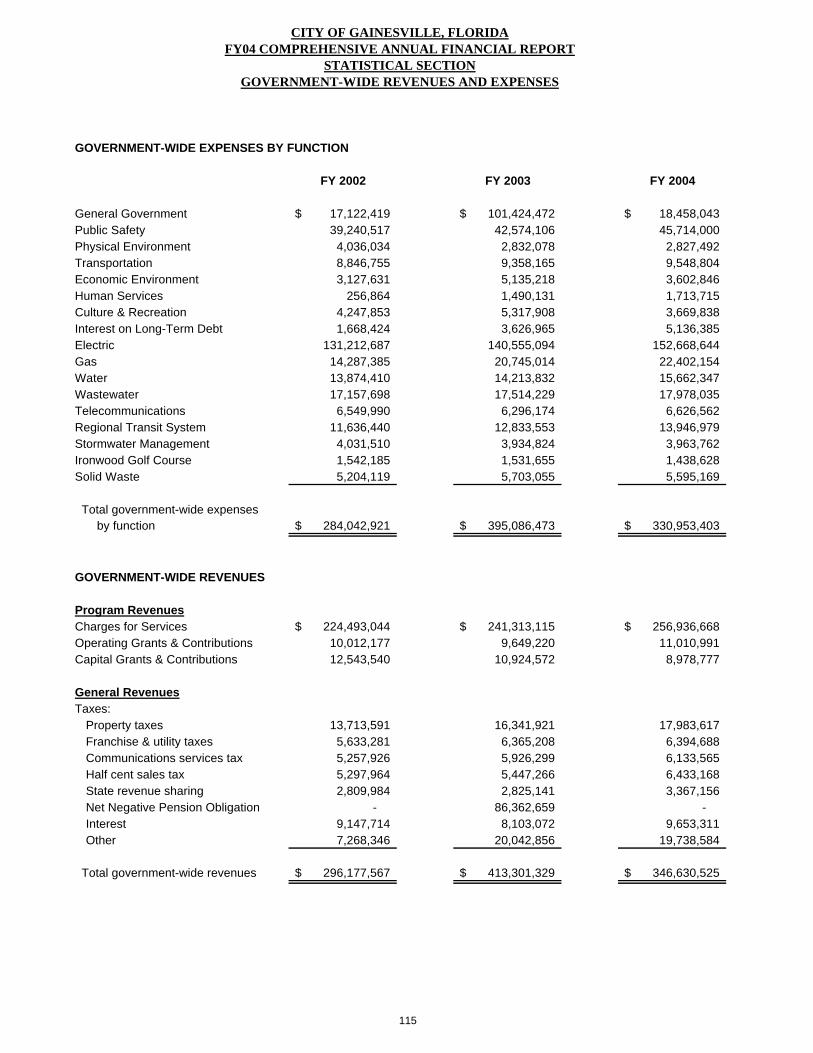
GOVERNMENT-WIDE EXPENSES BY FUNCTION
FY 2002 FY 2003 FY 2004
General Government 17,122,419$ 101,424,472$ 18,458,043$ Public Safety 39,240,517 42,574,106 45,714,000 Physical Environment 4,036,034 2,832,078 2,827,492 Transportation 8,846,755 9,358,165 9,548,804 Economic Environment 3,127,631 5,135,218 3,602,846 Human Services 256,864 1,490,131 1,713,715 Culture & Recreation 4,247,853 5,317,908 3,669,838 Interest on Long-Term Debt 1,668,424 3,626,965 5,136,385 Electric 131,212,687 140,555,094 152,668,644 Gas 14,287,385 20,745,014 22,402,154 Water 13,874,410 14,213,832 15,662,347 Wastewater 17,157,698 17,514,229 17,978,035 Telecommunications 6,549,990 6,296,174 6,626,562 Regional Transit System 11,636,440 12,833,553 13,946,979 Stormwater Management 4,031,510 3,934,824 3,963,762 Ironwood Golf Course 1,542,185 1,531,655 1,438,628 Solid Waste 5,204,119 5,703,055 5,595,169
Total government-wide expensesby function 284,042,921$ 395,086,473$ 330,953,403$
GOVERNMENT-WIDE REVENUES
Program RevenuesCharges for Services 224,493,044$ 241,313,115$ 256,936,668$ Operating Grants & Contributions 10,012,177 9,649,220 11,010,991 Capital Grants & Contributions 12,543,540 10,924,572 8,978,777
General RevenuesTaxes:
Property taxes 13,713,591 16,341,921 17,983,617 Franchise & utility taxes 5,633,281 6,365,208 6,394,688 Communications services tax 5,257,926 5,926,299 6,133,565 Half cent sales tax 5,297,964 5,447,266 6,433,168 State revenue sharing 2,809,984 2,825,141 3,367,156 Net Negative Pension Obligation - 86,362,659 - Interest 9,147,714 8,103,072 9,653,311 Other 7,268,346 20,042,856 19,738,584
Total government-wide revenues 296,177,567$ 413,301,329$ 346,630,525$
CITY OF GAINESVILLE, FLORIDAFY04 COMPREHENSIVE ANNUAL FINANCIAL REPORT
STATISTICAL SECTIONGOVERNMENT-WIDE REVENUES AND EXPENSES
115

Sources (Revenues & Transfers)
REAL OTHERPROPERTY OTHER LICENSES UTILITY CHARGES REVENUES &
FY TAX TAXES & PERMITS FEDERAL STATE COUNTY CONTRIBUTIONS FINES FOR SVCS TRANSFERS(1) (2) (3) (4)
95 8,482,949$ 9,305,593$ 1,409,738$ 31,272$ 5,879,041$ 35,106$ 19,248,327$ 1,171,824$ 4,725,347$ 1,912,974$ 96 9,335,018 10,038,049 880,755 - 6,381,350 97,000 19,243,942 1,296,521 4,231,738 1,280,889 97 9,758,851 9,944,548 665,974 1,047,167 6,482,615 - 20,158,023 1,163,218 4,660,394 1,775,875 98 10,262,973 10,526,737 1,516,597 45,666 6,448,122 - 21,406,886 1,454,335 5,086,950 1,251,998 99 10,674,658 10,293,832 1,470,963 12,567 12,506,491 165,000 27,495,624 1,170,052 5,540,870 1,259,729 00 11,400,748 10,944,137 1,545,920 12,099 7,012,365 165,000 23,351,288 1,281,314 5,580,040 1,584,473 01 12,016,711 11,430,383 1,859,727 - 6,989,825 1,415,000 24,330,224 1,208,980 5,627,373 2,354,948 02 13,042,431 11,601,025 1,787,686 - 7,134,494 - 25,694,788 1,148,623 6,202,562 2,523,468 03 15,532,877 13,103,466 2,018,662 160,638 7,314,150 18,316 25,916,113 1,329,518 6,387,470 1,404,483 04 16,934,019 13,319,945 2,426,963 397,945 8,856,790 10,391 27,950,175 1,251,951 6,205,558 1,501,381
Note: (1) Occupational Licenses were recorded in the Economic Development Fund in 96 and 97. (2) Federal Aviation Grant received in 97 for Gainesville Airport. (3) Contribution from State for Campus Development,University of Florida-$5,750,000 in 99. (4) Transfer from Utility for Leaseback - $5,138,813 in 99.
Uses (Expenditures & Transfers)
GENERAL PUBLIC PHYSICAL TRANSPOR- ECONOMIC HUMAN CULTURE & MISC. &FY GOVERNMENT SAFETY ENVIRONMENT TATION ENVIRONMENT SERVICES RECREATION TRANSFERS TOTAL
95 12,446,076$ 25,916,996$ 1,348,855$ 5,517,433$ 143,328$ -$ 2,112,094$ 4,293,999$ 51,778,781$ 96 11,853,453 27,232,997 1,867,361 2,841,481 45,606 - 3,485,909 4,715,346 52,042,153 97 12,893,927 27,946,409 1,526,149 5,393,646 16,030 2,638 2,487,619 4,465,868 54,732,286 98 13,551,817 28,690,343 1,680,616 5,632,289 163,483 - 2,651,807 4,293,153 56,663,508 99 13,958,661 29,550,295 1,728,876 5,704,676 199,893 - 3,160,576 9,968,639 64,271,616 00 14,877,772 31,747,993 1,804,708 6,114,608 235,498 - 3,262,815 4,634,621 62,678,015 01 15,641,299 31,829,470 1,902,396 6,156,720 201,106 - 3,464,763 5,771,487 64,967,241 02 17,014,680 35,079,142 1,922,139 6,460,423 66,928 - 3,654,723 4,624,353 68,822,388 03 15,231,408 41,144,614 2,224,299 7,543,340 180,738 - 4,017,568 6,162,498 76,504,465 04 15,999,322 41,402,195 2,125,688 8,057,872 205,044 - 4,291,022 8,088,508 80,169,651
(in dollars)
CITY OF GAINESVILLE, FLORIDAFY04 COMPREHENSIVE ANNUAL FINANCIAL REPORT
STATISTICAL SECTIONHISTORY OF GENERAL FUND SOURCES AND USES OF FUNDS
116

PER CAPITA REVENUES
2000 2001 2002 2003 2004
Historical Dollars 615.40$ 697.11$ 621.58$ 624.55$ 669.66$
% Change Over Previous Year -13.12% 11.72% -12.15% 0.48% 6.74%
Constant Dollars* 118.03$ 131.20$ 116.98$ 113.36$ 118.33$
% Change Over Previous Year -17.01% 10.04% -12.16% -3.19% 4.20%
PER CAPITA EXPENDITURES
613.44$ 673.61$ 618.77$ 652.87$ 680.82$
% Change Over Previous Year -3.32% 8.93% -8.86% 5.22% 4.11%
117.66$ 126.77$ 116.45$ 118.50$ 120.30$
% Change Over Previous Year -6.88% 7.19% -8.86% 1.73% 1.50%
* Constant Dollars were derived by using the Consumer Price Index base year 1967 = 100.
CITY OF GAINESVILLE, FLORIDAFY04 COMPREHENSIVE ANNUAL FINANCIAL REPORT
STATISTICAL SECTIONPER CAPITA GENERAL FUND REVENUES AND EXPENDITURES
HISTORICAL AND CONSTANT DOLLAR AMOUNTS
100
105
110
115
120
125
130
135
FY00 FY01 FY02 FY03 FY04
FISCAL YEAR
CONSTANT REVENUES VS EXPENDITURES
REV EXP
$ P
ER
CA
PIT
AL
117

Ratio of Revenues Less Expenditures to Total Revenues
2000 2001 2002 2003 2004
0.003 0.033 0.004 -0.045 -0.016
A positive ratio indicates a surplus for the year while a negative ratio indicates a deficit for the year. Thisratio is one of the primary indicators of the underlying causes of the City's financial position as it directlyaffects the expendable fund balances.
CITY OF GAINESVILLE, FLORIDAFY04 COMPREHENSIVE ANNUAL FINANCIAL REPORT
STATISTICAL SECTIONRATIO OF GENERAL FUND SURPLUS (DEFICIT) TO TOTAL REVENUES
-
10.0
20.0
30.0
40.0
50.0
60.0
70.0
80.0
90.0
MIL
LIO
NS
FY00 FY01 FY02 FY03 FY04FISCAL YEAR
GENERAL FUND OPERATIONS
SOURCES USES
118


TAX CITY TAX RATES (MILLS) LOCAL PROPERTY TAX LEVIESROLL FISCAL NET TAXABLE VALUE BONDS AND GENERAL BONDS AND GENERAL TOTAL TAXESYEAR YEAR FOR LOCAL LEVIES INTEREST GOVERNMENT INTEREST GOVERNMENT LEVIED
(1) (2) (3) (4 & 6) (4) (5)
1995 1995-96 1,947,684,276$ - 4.9659 - 9,672,006$ 9,672,006$ 1996 1996-97 2,031,119,313 - 4.9416 - 10,036,976 10,036,976 1997 1997-98 2,150,234,789 - 4.9416 - 10,625,320 10,625,320 1998 1998-99 2,235,759,820 - 4.9416 - 11,047,935 11,047,935 1999 1999-00 2,390,448,252 - 4.9416 - 11,821,291 11,821,291 2000 2000-01 2,521,712,589 - 4.9416 - 12,460,972 12,460,972 2001 2001-02 2,735,232,295 - 4.9416 - 13,516,120 13,516,120 2002 2002-03 3,252,819,147 - 4.9416 - 16,073,799 16,073,799 2003 2003-04 3,561,664,336 - 4.9416 - 17,599,965 17,599,965 2004 2004-05 3,805,211,168 - 4.9416 - 18,803,470 18,803,470
Notes:
(1) Tax roll year as of January 1st.(2) Fiscal year October 1st through September 30th.(3) Sum of real and personal property value.(4) (a) Tax rates are set by the City Commission effective October 1st. (b) Chapter 200.181, Florida Statutes, allows unrestricted ad valorem tax rate levies for debt service for general obligation bonds approved by citizen referendum and imposes a 10 mill limitation on ad valorem tax rates levied for general government operations.(5) See page 121 for history of collections.(6) The City's General Obligation Bonds Series 1974 were paid in full in Fiscal Year 1995.
CITY OF GAINESVILLE, FLORIDAFY04 COMPREHENSIVE ANNUAL FINANCIAL REPORT
STATISTICAL SECTIONHISTORY OF LOCAL AD VALOREM TAX RATES AND TAX LEVIES
119

TAX ROLL JUST VALUE OF TOTAL EXEMPT NET TAXABLEYEAR ALL PROPERTY PROPERTY VALUE
1995 4,987,069,832$ 3,039,385,556$ 1,947,684,276$ 1996 5,407,243,370 3,376,124,057 2,031,119,313 1997 5,813,160,554 3,662,925,765 2,150,234,789 1998 5,906,564,485 3,670,804,665 2,235,759,820 1999 6,117,881,236 3,727,432,984 2,390,448,252 2000 6,221,260,827 3,699,548,238 2,521,712,589 2001 6,633,284,013 3,898,051,718 2,735,232,295 2002 7,047,490,127 3,794,670,980 3,252,819,147 2003 7,469,339,911 3,907,675,575 3,561,664,336 2004 8,739,206,865 4,933,995,697 3,805,211,168
CITY OF GAINESVILLE, FLORIDAFY04 COMPREHENSIVE ANNUAL FINANCIAL REPORT
STATISTICAL SECTIONHISTORY OF PROPERTY VALUES AND PROPERTY ASSESSMENTS
$-
$500
$1,000
$1,500
$2,000
$2,500
$3,000
$3,500
$4,000
VA
LU
E (I
N M
ILL
ION
S)
1995 1996 1997 1998 1999 2000 2001 2002 2003 2004TAX ROLL YEAR
NET TAXABLE VALUE
120
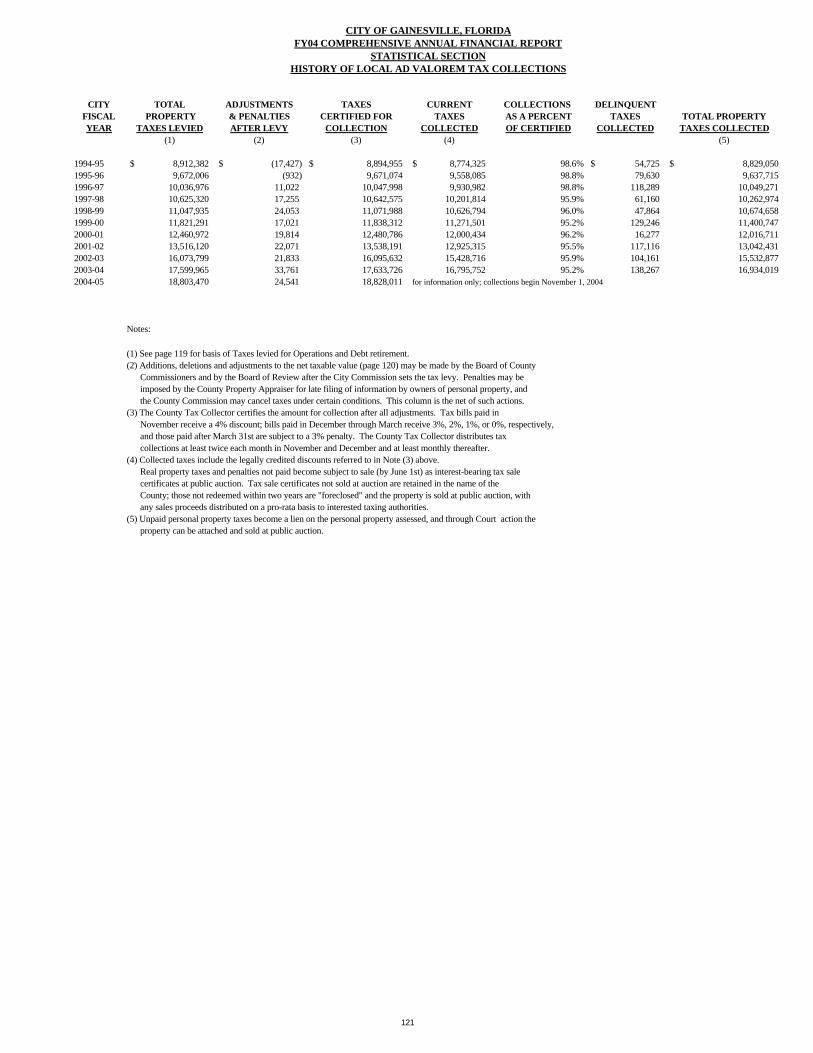
CITY TOTAL ADJUSTMENTS TAXES CURRENT COLLECTIONS DELINQUENTFISCAL PROPERTY & PENALTIES CERTIFIED FOR TAXES AS A PERCENT TAXES TOTAL PROPERTYYEAR TAXES LEVIED AFTER LEVY COLLECTION COLLECTED OF CERTIFIED COLLECTED TAXES COLLECTED
(1) (2) (3) (4) (5)
1994-95 8,912,382$ (17,427)$ 8,894,955$ 8,774,325$ 98.6% 54,725$ 8,829,050$ 1995-96 9,672,006 (932) 9,671,074 9,558,085 98.8% 79,630 9,637,715 1996-97 10,036,976 11,022 10,047,998 9,930,982 98.8% 118,289 10,049,271 1997-98 10,625,320 17,255 10,642,575 10,201,814 95.9% 61,160 10,262,974 1998-99 11,047,935 24,053 11,071,988 10,626,794 96.0% 47,864 10,674,658 1999-00 11,821,291 17,021 11,838,312 11,271,501 95.2% 129,246 11,400,747 2000-01 12,460,972 19,814 12,480,786 12,000,434 96.2% 16,277 12,016,711 2001-02 13,516,120 22,071 13,538,191 12,925,315 95.5% 117,116 13,042,431 2002-03 16,073,799 21,833 16,095,632 15,428,716 95.9% 104,161 15,532,877 2003-04 17,599,965 33,761 17,633,726 16,795,752 95.2% 138,267 16,934,019 2004-05 18,803,470 24,541 18,828,011 for information only; collections begin November 1, 2004
Notes:
(1) See page 119 for basis of Taxes levied for Operations and Debt retirement. (2) Additions, deletions and adjustments to the net taxable value (page 120) may be made by the Board of County
Commissioners and by the Board of Review after the City Commission sets the tax levy. Penalties may be imposed by the County Property Appraiser for late filing of information by owners of personal property, and the County Commission may cancel taxes under certain conditions. This column is the net of such actions.(3) The County Tax Collector certifies the amount for collection after all adjustments. Tax bills paid in November receive a 4% discount; bills paid in December through March receive 3%, 2%, 1%, or 0%, respectively, and those paid after March 31st are subject to a 3% penalty. The County Tax Collector distributes tax collections at least twice each month in November and December and at least monthly thereafter.(4) Collected taxes include the legally credited discounts referred to in Note (3) above. Real property taxes and penalties not paid become subject to sale (by June 1st) as interest-bearing tax sale certificates at public auction. Tax sale certificates not sold at auction are retained in the name of the County; those not redeemed within two years are "foreclosed" and the property is sold at public auction, with any sales proceeds distributed on a pro-rata basis to interested taxing authorities.(5) Unpaid personal property taxes become a lien on the personal property assessed, and through Court action the property can be attached and sold at public auction.
CITY OF GAINESVILLE, FLORIDAFY04 COMPREHENSIVE ANNUAL FINANCIAL REPORT
STATISTICAL SECTIONHISTORY OF LOCAL AD VALOREM TAX COLLECTIONS
121

OUTSTANDING TOTAL DELINQUENTTAX CURRENT PERCENT DELINQUENT COLLECTED OUTSTANDING TAXES
ROLL TOTAL TAX OF LEVY TAX TOTAL TAX AS A % OF DELINQUENT AS A % OFYEAR TAX LEVIED COLLECTION COLLECTED COLLECTIONS COLLECTIONS CURRENT LEVY TAXES CURRENT LEVY
1995 9,672,006$ 9,558,085$ 98.8% 79,630$ 9,012,889$ 93.2% 83,776$ 0.87%1996 10,036,976 9,930,982 98.9% 118,289 10,049,271 100.1% 96,391 0.96%1997 10,625,320 10,201,814 96.0% 61,160 10,262,974 96.6% 66,726 0.63%1998 11,047,935 10,626,794 96.2% 47,864 10,674,658 96.6% 71,624 0.65%1999 11,821,291 11,271,501 95.3% 129,246 11,400,747 96.4% 77,502 0.66%2000 12,460,972 12,000,434 96.3% 16,277 12,016,711 96.4% 106,067 0.85%2001 13,516,120 12,925,315 95.6% 117,116 13,042,431 96.5% 118,120 0.87%2002 16,073,799 15,428,716 96.0% 104,161 15,532,877 96.6% 90,291 0.56%2003 17,599,965 16,795,752 95.4% 138,267 16,934,019 96.2% 77,612 0.44%2004 18,803,470 for information only; collections begin November 1, 2004
CITY OF GAINESVILLE, FLORIDAFY04 COMPREHENSIVE ANNUAL FINANCIAL REPORT
STATISTICAL SECTIONHISTORY OF PROPERTY TAX LEVIES COMPARED WITH COLLECTIONS
122

ALACHUA ST. JOHNS ALACHUA TOTALTAX COUNTY WATER COUNTY ALL DIRECT &
ROLL CITY OF COUNTY OF SCHOOL MGMT LIBRARY OVERLAPPINGYEAR GAINESVILLE ALACHUA DISTRICT DISTRICT DISTRICT GOVERNMENTS
(1)
Tax Rate (mills) (Including Debt Service)
1995 4.9659 9.2810 12.1770 0.4820 1.8408 28.74671996 4.9416 9.2810 12.1770 0.4820 1.8408 28.72241997 4.9416 9.0290 12.1770 0.4820 1.8107 28.74671998 4.9416 8.7700 11.8240 0.4820 1.8107 28.72241999 4.9416 8.7700 10.9560 0.4820 1.9000 27.04962000 4.9416 8.7650 10.8030 0.4720 1.9000 26.88162001 4.9416 9.0009 10.4360 0.4620 1.6789 26.51942002 4.9416 8.9887 10.4660 0.4620 1.6632 26.88162003 4.9416 9.2387 9.8390 0.4620 1.6566 26.13792004 4.9416 9.2387 9.2240 0.4620 1.6566 25.5229
Tax Levies (Including Debt Service)
1995 9,672,006$ 18,076,558$ 23,717,037$ 733,166$ 3,585,304$ 55,784,071$ 1996 10,036,976 18,853,632 24,736,549 759,916 3,739,260 58,126,333 1997 10,625,320 19,351,516 26,182,628 794,857 3,893,321 55,784,071 1998 11,047,935 20,186,675 27,224,847 1,077,636 4,048,290 58,126,333 1999 11,821,291 20,964,231 28,264,660 1,152,196 4,328,385 66,530,763 2000 12,460,972 22,102,810 27,242,061 1,190,248 4,791,253 67,787,344 2001 13,516,120 24,619,002 28,544,246 1,263,649 4,592,079 72,535,096 2002 16,073,799 29,238,019 34,043,311 1,502,772 5,409,978 86,267,879 2003 17,647,319 72,823,648 77,706,173 2,719,253 13,083,558 183,979,951 2004 18,838,752 78,937,706 79,077,885 2,932,044 14,202,255 193,988,642
Note:
(1) Alachua County millage rate includes only operating and debt service; MSTU is not included in these rates.
ALL DIRECT OVERLAPPING GOVERNMENTS APPLICABLE TO THE CITY OF GAINESVILLE
CITY OF GAINESVILLE, FLORIDAFY04 COMPREHENSIVE ANNUAL FINANCIAL REPORT
STATISTICAL SECTIONHISTORY OF PROPERTY TAX RATES AND TAX LEVIES
123

OUTSTANDINGASSESSMENTS CURRENT PERCENTAGE OF
FISCAL AT BEGINNING ASSESSMENTS TOTAL ASSESSMENTS COLLECTIONSYEAR OF YEAR LEVIED ASSESSMENTS COLLECTED (1) TO TOTAL DUE
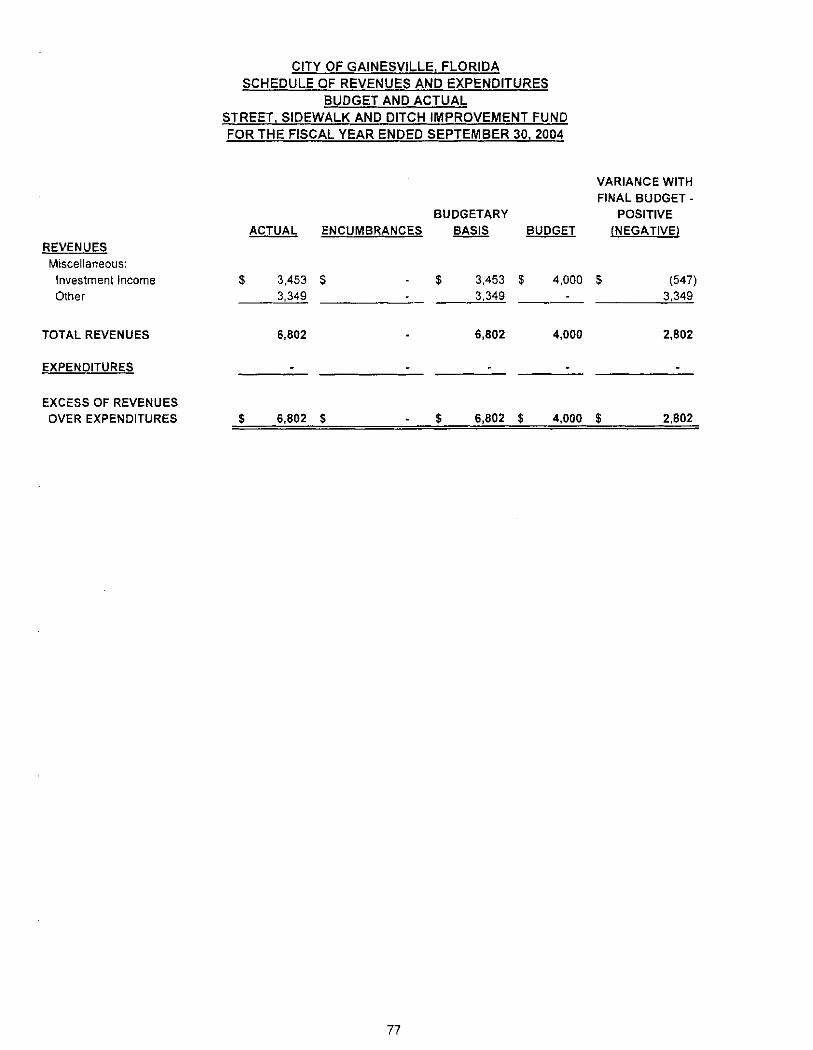
1994-95 36,460$ -$ 36,460$ 3,135$ 8.6%1995-96 33,325 - 33,325 7,249 21.8%1996-97 26,076 - 26,076 2,692 10.3%1997-98 23,384 - 23,384 2,500 10.7%1998-99 20,884 - 20,884 1,159 5.5%1999-00 19,725 - 19,725 3,919 19.9%2000-01 15,806 27,286 43,092 29,915 69.4%2001-02 13,177 25,943 39,120 7,466 19.1%2002-03 31,654 - 31,654 8,741 27.6%2003-04 22,913 - 22,913 3,453 15.1%
Notes:
(1) Assessments collected include $2,329 which was remitted to the Utilities Funds in FY1994-95; Assessments collected include $7,184 which was remitted to the Utilities Funds in FY1995-96; Assessments collected include $2,628 which was remitted to the Utilities Funds in FY1996-97; Assessments collected include $860 which was remitted to the Utilities Funds in FY1997-98; Assessments collected include $0 which was remitted to the Utilities Funds in FY1998-99; Assessments collected include $0 which was remitted to the Utilities Funds in FY1999-00; Assessments collected include $6,440 which was remitted to the Utilities Funds in FY2000-01; Assessments collected include $2,744 which was remitted to the Utilities Funds in FY2001-02; Assessments collected include $4,002 which was remitted to the Utilities Funds in FY2002-03. Assessments collected include $906 which was remitted to the Utilities Funds in FY2003-04.
(Street, Sidewalk, and Ditch Improvement Fund)
CITY OF GAINESVILLE, FLORIDAFY04 COMPREHENSIVE ANNUAL FINANCIAL REPORT
STATISTICAL SECTIONSPECIAL ASSESSMENTS FUND
124


Legal Debt Margin
Taxable Value = $3,805,211,168 Legal Debt Limit = None (1)
TAX TAXABLE BONDED BONDED CITY BONDEDROLL VALUE DEBT DEBT POPULATION DEBT PERYEAR (JANUARY 1) (SEPTEMBER 30) RATIO (APRIL 1) CAPITA
1995 1,947,684,276$ -$ (2) 0.000% 96,051 - 1996 2,031,119,313 - 0.000% 97,693 - 1997 2,150,234,789 - - 99,870 - 1998 2,235,759,820 - - 100,315 - 1999 2,390,448,252 - - 101,405 - 2000 2,521,712,589 - - 95,447 - 2001 2,735,232,295 - - 96,446 - 2002 3,252,819,147 - - 111,224 - 2003 3,561,664,336 - - 117,182 - 2004 3,805,211,168 - - 117,754 -
Notes:
(1) Chapter 200.181, Florida Statutes, allows unrestricted ad valorem tax rate levies for debt service requirements for general obligation approved by voter referendum.(2) The City's General Obligation Bonds Series 1974 were paid in full in fiscal year 1995.
RATIO OF CITY'S GROSS BONDED DEBT TO TAXABLE VALUEAND BONDED DEBT PER CAPITA
CITY OF GAINESVILLE, FLORIDAFY04 COMPREHENSIVE ANNUAL FINANCIAL REPORT
STATISTICAL SECTIONLEGAL DEBT MARGIN AND
BONDED DEBT PER CAPITA
-0.100.200.300.400.500.600.700.800.901.00
1995 1996 1997 1998 1999 2000 2001 2002 2003 2004
TAX ROLL YEAR
$ P
ER
CA
PIT
A
125

GENERAL PERCENTTAXABLE OBLIGATION OF DEBT CITY'S
TAXING PROPERTY BONDED APPLICABLE SHARE OFAUTHORITY VALUE (2) DEBT (3) TO CITY DEBT (4)
City of Gainesville 3,805,211,168$ -$ 100.00% -$ Alachua County 8,530,910,912 12,785,000 44.60% 5,702,110 Alachua County Schools 8,559,759,742 53,890,000 44.45% 23,954,105
66,675,000$ 44.53% 29,656,215$
Notes:
(1) The above information on bonded debt does not include self supporting and non-self supporting revenue bonds, certificates, and notes as follows (reserves and/or sinking fund balances have not been deducted).(2) As of January 1, 1983 homestead property of certain qualified residents is eligible for up to $25,000 value exemption.(3) Reserves and sinking fund balances have not been deducted.(4) Chapter 200.181, Florida Statutes, allows unrestricted ad valorem tax rate levies for debt service for general obligation bonds approved by voter referendum.
TAXING SELF NON-SELFAUTHORITY SUPPORTING SUPPORTING TOTALS
Alachua County -$ 46,405,000$ 46,405,000$ Alachua County Schools - - - City of Gainesville: Utilities 438,617,383 - 438,617,383 Other than Utilities - 35,138,433 35,138,433
438,617,383$ 81,543,433$ 520,160,816$
CITY OF GAINESVILLE, FLORIDAFY04 COMPREHENSIVE ANNUAL FINANCIAL REPORT
STATISTICAL SECTIONSTATEMENT OF DIRECT AND OVERLAPPING BONDED DEBT
126

GENERAL OBLIGATIONFISCAL DEBT SERVICE EXPENDITURESYEAR PRINCIPAL INTEREST TOTAL SOURCES USES
1994-95 60,000$ 3,900$ 63,900$ 0.12 0.121995-96 - - - - -1996-97 - - - - -1997-98 - - - - -1998-99 - - - - -1999-00 - - - - -2000-01 - - - - -2001-02 - - - - -2002-03 - - - - -2003-04 - - - - -
These ratios measure the amount of principal and interest the City pays each yearcompared to its total sources and uses of funds. These debt service payments areusually fixed and actually represent a legal claim on the City's resources. As debtservice increases, the City's expenditure flexibility is reduced; thus resulting in increased fiscal strain. A ratio below 10% for total debt service is considered good.
Note:
(1) The historical total sources and uses of General Funds are summarized on page 116. Debt service expenditures are included within those total uses under "General Government".
CITY OF GAINESVILLE, FLORIDAFY04 COMPREHENSIVE ANNUAL FINANCIAL REPORT
STATISTICAL SECTIONRATIO OF ANNUAL GENERAL OBLIGATION BONDS DEBT SERVICE EXPENDITURES
EXPENDITURES TO TOTALRATIO OF DEBT SERVICE
GENERAL FUND
TO TOTAL GENERAL FUND SOURCES AND USES (1)
127

STATE DEBT"GUARANTEED SERVICE
FISCAL ENTITLEMENT" COVERAGEYEAR PRINCIPAL INTEREST TOTAL REVENUE RATIO
1994-95 350,000$ 745,973$ 1,095,973$ 1,100,340$ 1.001995-96 365,000 733,721 1,098,721 1,100,340 1.001996-97 380,000 719,121 1,099,121 1,100,340 1.001997-98 395,000 702,973 1,097,973 1,100,340 1.001998-99 415,000 685,198 1,100,198 1,100,340 1.001999-00 430,000 666,004 1,096,004 1,100,340 1.002000-01 450,000 645,579 1,095,579 1,100,340 1.002001-02 475,000 623,641 1,098,641 1,100,340 1.002002-03 495,000 599,891 1,094,891 1,100,340 1.002003-04 525,000 412,574 937,574 1,100,340 1.17
(Excluding Reserve Requirements)DEBT SERVICE EXPENDITURES
DEBT SERVICE BOND COVERAGE RATIO
CITY OF GAINESVILLE, FLORIDAFY04 COMPREHENSIVE ANNUAL FINANCIAL REPORT
STATISTICAL SECTIONSCHEDULE OF STATE GUARANTEED ENTITLEMENT REVENUE
128

RATIO OF DEBT SERVICETOTAL DEBT SERVICE EXPENDITURES TO TOTAL
FISCAL EXPENDITURES (Excluding Utilities) GENERAL FUND YEAR PRINCIPAL INTEREST TOTAL SOURCES USES
1994-95 1,827,968$ 1,790,801$ 3,618,769$ 6.93 6.991995-96 1,799,792 1,730,744 3,530,536 6.69 6.781996-97 2,122,484 1,933,682 4,056,166 7.25 7.411997-98 (2) 2,042,770 1,789,423 3,832,193 6.61 6.761998-99 2,601,200 1,742,472 4,343,672 6.15 6.761999-00 1,833,297 1,501,676 3,334,973 5.30 5.322000-01 1,663,689 1,477,860 3,141,549 4.67 4.842001-02 2,190,000 1,575,315 3,765,315 5.45 5.472002-03 2,625,000 3,609,336 6,234,336 8.52 8.152003-04 3,590,000 4,951,200 8,541,200 10.83 10.65
Notes:
(1) The historical total sources and uses of General Funds used in the computation of these ratios are summarized on page 116. Debt service expenditures are included within those total uses under "General Government".(2) Figures for FY97-98 exclude $8,910,000 paid to decease the FFGFC Series 1992 Bonds.
The increase in Gainesville's ratios over the past two fiscal years is attributable to the issuance of the 2003 Series A & B Taxable Pension Obligation Bonds. These bonds were issued to take advantage of the opportunity to issue taxable debt at rates well below the interest charges on the unfunded accrued actuarial liability on the City's defined benefit pension plans. The projected savings in reduced amortization payments on this unfunded liability over the debt service on the bonds over the life of the issue is approximately $78million on a gross basis and $34million on a present value basis. Net of the Pension Obligation Bonds, the ratio of debt service expenditures to General Fund sources and uses is 5.36 and 5.27, respectively.
These ratios measure the amount of principal and interest the City pays each year compared to its total sources and uses of funds. These debt service payments are usually fixed and actually represent a legal claim on the City's resources. As debt service increases, the City's expenditure flexibility is reduced; thus resulting in increased fiscal strain.
TO TOTAL GENERAL FUND SOURCES AND USES (1)
CITY OF GAINESVILLE, FLORIDAFY04 COMPREHENSIVE ANNUAL FINANCIAL REPORT
STATISTICAL SECTIONRATIO OF ANNUAL TOTAL DEBT SERVICE EXPENDITURES
129

DEBT SERVICEFISCAL DEBT NET UTILITY COVERAGEYEAR REQUIREMENTS (1) REVENUES (2) RATIO
1994-95 47,234,795$ 67,188,372$ 1.421995-96 51,396,381 72,107,935 1.401996-97 44,196,126 77,547,009 1.751997-98 39,470,246 80,273,040 2.031998-99 33,891,908 331,155,218 (3) 9.771999-00 34,904,989 84,465,494 2.422000-01 37,677,047 90,284,791 2.402001-02 34,097,931 90,462,263 2.652002-03 33,704,853 85,190,476 2.532003-04 33,554,604 82,998,679 2.47
Notes:
(1) Excludes capitalized interest.(2) Utility net revenues include electric, gas, water and sewer charges to customers. According to Bond Ordinances; i.e. before depreciation and debt service charges, but including certain connection charges and excluding interest earnings on investments from the construction trust fund.(3) Revenues include revenue of $249,220,553 from leaseback. The coverage ratio excluding the revenue from the leaseback would be 2.42.
CITY OF GAINESVILLE, FLORIDAFY04 COMPREHENSIVE ANNUAL FINANCIAL REPORT
STATISTICAL SECTIONSCHEDULE OF UTILITY REVENUE DEBT SERVICE COVERAGE RATIO
130


CITY GOVERNMENTEstablishment of Town 1854Date of Incorporation 1869Adoption of Present Charter 1927Form of Government Commission-ManagerFiscal Year Begins October 1stTerms of Office Mayor: Three Years (two term limit)
Commissioners: Three Years (two term limit)Number of Registered Voters 68,777Number of Voter Turnout in Last City General Election 52,100 76% (Includes split City/County Precincts)
LOCATION (1)Area 54.05 square milesLatitude 82.16' WestLongitude 29.41' NorthElevation 175 feet
Highway Average AirDistance & Direction to Major Cities: Miles MinutesJacksonville 75 NE 20Orlando 100 SE 30Tampa 120 South 30
CLIMATE (1)Average Annual Temperature Range Summer 71 to 90
Winter 43 to 66Average Annual Precipitation 35.25"
COST OF LIVING INDEX (1)Composite 99.4Grocery 99.8Health Care 103.5Housing 105.7
PUBLIC SAFETYGainesville Police Department 278 Sworn Personnel
80 Civilian Personnel
Gainesville Fire-Rescue 141 Sworn Personnel10 Civilian Personnel
Source: (1) Gainesville Area Chamber of Commerce and Gainesville Council for Economic Outreach.
CITY OF GAINESVILLE, FLORIDAFY04 COMPREHENSIVE ANNUAL FINANCIAL REPORT
STATISTICAL SECTIONECONOMIC DEMOGRAPHIC CHARACTERISTICS
131

EDUCATIONPublic Schools: (1)Elementary Schools 24 schools, enrollment 12,224Middle Schools 8 schools, enrollment 6,873High Schools 7 schools, enrollment 9,009Special Schools 8 schools, enrollment 1,028Charter Schools 14 schools, enrollment 1,306Teacher Certification Required by Department of EducationPublic School Teachers 2,096Student Membership 30,440
University of Florida:Enrollment 1995 38,730
1996 39,137 1997 41,040 1998 42,336 1999 43,943 2000 45,573 2001 46,798 2002 47,373 2003 47,858 2004 47,993
Instructional Faculty 2,865 full-time, 96 part-timeDegrees Offered 106 Undergraduate
257 Graduate5 Professional (Law, Veterinary Medicine, Medicine, Pharmacy, Dentistry)12 Specialist15 Engineer
Santa Fe Community College:Enrollment 1995 12,525
1996 12,6001997 12,0861998 12,5191999 12,7952000 12,7262001 13,5162002 14,0472003 16,1082004 15,741
Faculty 293 full-time, 425 part-timeDegrees Offered 47 Associate of Arts
36 Associate of Science and Applied Science24 Certificate of Training14 Technical Certificate
(1) Source: School Board of Alachua County
CITY OF GAINESVILLE, FLORIDAFY04 COMPREHENSIVE ANNUAL FINANCIAL REPORT
STATISTICAL SECTIONECONOMIC DEMOGRAPHIC CHARACTERISTICS
132

TRANSPORTATIONFY 2003-04 AIR TRAFFIC VOLUME
GAINESVILLE-ALACHUA COUNTY REGIONAL AIRPORT (1)
Enplanements DeplanementsOctober 11,360 11,485November 10,951 11,342December 10,992 11,249January 8,293 8,750February 10,161 10,119March 12,803 13,108April 11,805 12,026May 11,261 11,524June 12,056 11,081July 10,837 11,089August 9,421 10,135September 9,134 8,282
TOTAL 129,074 130,190
MAIN BUS RIDERSHIP (2)REGIONAL TRANSIT SYSTEM
FY2002 - FY2004
FY02 FY03 FY04October 893,404 1,016,000 1,043,048November 708,084 704,814 721,829December 338,750 494,763 535,633January 722,371 847,290 854,442February 741,828 814,778 850,284March 585,063 667,153 754,277April 697,940 748,232 706,566May 350,068 381,070 371,087June 290,095 370,806 390,553July 401,104 480,890 455,201August 510,628 520,762 567,779September 954,657 1,058,197 895,797TOTAL 7,193,992 8,104,755 8,146,496
MOTOR FREIGHT SERVICE (3/4) 31 common carriers, 5 with Local TerminalsHIGHWAY ROUTES (4) Interstate 75 and 10. U.S. Highways 441, 301, 41, and 27.RAIL SERVICE (4) Freight Service by CSX TransportationBUS SERVICE (4) Intercity by Greyhound. Intracity by Regional Transit System,
including minibus service for the handicapped.
Sources: (1) Gainesville-Alachua County Regional Airport(2) Regional Transit System(3) UF Bureau of Economic and Business Research(4) Gainesville Council for Economic Outreach
CITY OF GAINESVILLE, FLORIDAFY04 COMPREHENSIVE ANNUAL FINANCIAL REPORT
ECONOMIC DEMOGRAPHIC CHARACTERISTICSSTATISTICAL SECTION
133

GENERAL DEMOGRAPHICS
BUILDING VALUE OF BANK TELEPHONEYEAR POPULATION PERMITS CONSTRUCTION DEPOSITS SERVICES
(1) (2) (2) (3) (4)1995 96,051 1,296 44,415,674$ 1,380,800,000$ 123,3361996 97,693 2,352 61,360,847 1,457,800,000 -1997 99,870 2,141 73,271,432 1,480,144,000 -1998 100,315 6,732 71,237,896 1,523,035,000 -1999 101,405 5,928 80,419,905 1,536,350,000 -2000 95,447 2,557 80,405,644 1,689,808,000 -2001 96,446 2,346 88,964,534 1,792,141,000 -2002 111,224 2,809 141,585,566 1,969,000,000 -2003 117,182 2,925 129,966,415 2,121,000,000 -2004 117,754 1,384 88,960,331 2,326,000,000 -
MEDICAL FACILITIES (5)Hospitals - Acute Care 7: Total Beds 1,239Doctors 2,211 Physicians & SurgeonsDentists 241
COMMUNICATIONS (1 and 6)Broadcasting and Telecommunications 41Major Television Stations WUFT-TV 5 (PBS)
WCJB-TV 20 (ABC)WOGX-TV 51 (FOX)WGFL-TV 53 (CBS)
Newspaper, Book, and Directory Publishing 31Major Newspaper The Gainesville Sun
CITY OWNED PARKING FACILITIES (7)Parking Garage 850On street metered spaces 281Off street metered spaces 71Permit parking spaces 28Non-metered spaces, central City district 341Handicapped, off street not metered 16Handicapped, central City district 16Reserved, central City district 349Loading, central City district 12
Sources: (1) University of Florida Bureau of Economic and Business Research.(2) City of Gainesville Building Inspection Department.(3) 1994-96 Florida Bankers Association, Branch Deposit Report;
1997-02 Sun Trust Banks of Florida Marketing Department;2003-Present Federal Deposit Insurance Corporation.
(4) Southern Bell. Information is no longer available from local exchange.(5) Gainesville Council for Economic Outreach.(6) Gainesville Area Chamber of Commerce(7) City of Gainesville Traffic Engineering Division.
CITY OF GAINESVILLE, FLORIDA
STATISTICAL SECTIONECONOMIC DEMOGRAPHIC CHARACTERISTICS
FY04 COMPREHENSIVE ANNUAL FINANCIAL REPORT
134

EMPLOYMENT (2)Unemployment
Year Rate1995 3.60%1996 2.90%1997 2.80%1998 2.40%1999 2.70%2000 1.90%2001 2.40%2002 2.62%2003 2.48%2004 2.40%
Labor Force (1 and 3)Median Age of the Population 29 Labor Force 108,766 Education Level Attained:
High School Degree 88.10%Associate's Degree 48.32%Bachelor's Degree 38.70%Graduate's Degree 18.98%
Gainesville MSA Total Non-agricultural Employment (2)Construction & Mining 4.32%Manufacturing 3.37%Trade, Transportation, and Services 14.01%Information 1.50%Financial Activities 5.05%Professional & Business Services 8.62%Educational & Health Services 16.77%Leisure & Hospitality 9.24%Other Services 3.69%Government 33.43%
Ten Largest Employers (1)Firm Product/Business Employees
University of Florida Education 12,212 Shands Hospital Health Care 7,508 School Board of Alachua County Education 4,195 Veterans Affairs Medical Center Health Care 2,700 City of Gainesville Municipal Government 2,357 Florida Department of Children and Families State Family Services 2,119 Publix Supermarkets Grocer 1,865 North Florida Regional Medical Center Health Care 1,646 Nationwide Insurance Company Insurance 1,099 Santa Fe Community College Education 831
Sources: (1) Gainesville Council for Economic Outreach (2) United States Department of Labor(3) UF Bureau of Economic and Business Research
CITY OF GAINESVILLE, FLORIDAFY04 COMPREHENSIVE ANNUAL FINANCIAL REPORT
STATISTICAL SECTIONECONOMIC DEMOGRAPHIC CHARACTERISTICS
135

EMPLOYMENT(continued)
Other Significant Area Employers:
Firm Product/Business EmployeesAlachua County Government 757The Crom Corporation Manufacturer 588Dollar General Distribution Center Retail Sales 588U.S. Postal Service Government 583Gator Dining Services Food Service 500Winn Dixie Supermarkets Grocer 470Meridian Health Care Health Care 400Hunter Marine Corporation Manufacturer 375Tower Hill Insurance Group Insurance 330Medical Manager Computer Software 310Regeneration Technologies, Inc. Biotechnical R&D & Manufacturing 285UF Athletic Association Inter-Collegiate Athletics 270CH2M Hill Southeast, Inc Engineering Consultants 261The Gainesville Sun Newspaper 247AvMed Health Plan Health Care 240Driltech Mission Manufacturer 240Cox Communications Communication 230Clariant LMS Manufacturer 216Florida Farm Bureau Insurance 200J.C. Penney Company Retail Sales 200
Source: Gainesville Council for Economic Outreach
PRINCIPAL TAXPAYERS(Real Estate & Tangible Taxpayers)
Owner/Taxpayer Business Category Taxable Value % of TotalOaks Mall Gainesville Ltd Partnership Retail Sales 83,309,000$ 2.34%Bellsouth Telecommunications, Inc. Communications 67,597,590 1.90%Florida Power Corporation Utility 39,534,720 1.11%HCA Health Services of Florida Health Care 30,350,900 0.85%Metal Container Corporation Manufacturing 23,161,860 0.65%Colonial Realty Ltd Partnership Real Estate 22,826,800 0.64%Gainesville Place LLC Property Management 22,365,700 0.63%Campus Lodge of Gainesville, LTD Property Management 18,819,200 0.53%Clariant Life Science, Molecules Manufacturing 17,881,420 0.50%Cox Cable University City, Inc. Telecommunications 17,455,030 0.49%All Others - 3,217,924,129 90.36%
TOTAL ALL TAXPAYERS 3,561,226,349$ 100.00%
Source: Alachua County Property Appraiser
CITY OF GAINESVILLE, FLORIDAFY04 COMPREHENSIVE ANNUAL FINANCIAL REPORT
STATISTICAL SECTIONECONOMIC DEMOGRAPHIC CHARACTERISTICS
136

TREND IN SALES OF UTILITY SERVICES (1)
Sales by NUMBER OF TOTAL NUMBER OF TOTAL NUMBER OF TOTALType of Service SERVICES REVENUE SERVICES REVENUE SERVICES REVENUE
Electricity:
Residential 76,262 47,256,059$ 73,739 47,080,019$ 73,522 45,762,959$ General Service 9,239 31,303,170 9,049 30,827,766 8,736 32,864,868 Large Power 18 5,350,314 20 5,294,427 18 5,201,815 Traffic & Street Lights 8 1,778,909 9 1,762,569 9 1,777,099 Rental Lights 3,056 1,593,530 2,970 1,524,005 2,854 1,448,262 Bulk & Economy Sales 3 2,959,480 3 6,229,173 3 12,135,854 Fuel Adjustment (Revenue) - 60,251,088 - 52,577,362 - 38,816,221
88,586 150,492,550$ 85,790 145,295,321$ 85,142 138,007,078$
Gas:
Residential 29,258 12,879,972$ 28,701 12,118,337$ 27,880 8,429,717$ Interruptible/Commercial 1,591 11,399,803 1,593 10,594,100 1,596 6,818,280 Liquid Propane 119 38,854 107 59,838 118 48,560
30,968 24,318,629$ 30,401 22,772,275$ 29,594 15,296,557$
Water:
General Customers 63,016 11,079,601$ 61,141 9,722,777$ 60,345 10,408,448$ University of Florida 68 617,004 71 652,307 52 616,061 Fire Hydrants (2) 7 1,077,233 7 1,039,769 7 1,060,038 Electric Plants 6 42,422 4 39,940 4 34,669
63,097 12,816,260$ 61,223 11,454,793$ 60,408 12,119,216$
Wastewater Service Fees:
Customer Billings 56,097 15,567,106$ 54,495 14,622,531$ 53,419 14,576,585$
GRUCom:
Internet Sales (GRUnet) 5,810 2,128,998$ 5,692 1,519,255$ 5,921 1,032,806$ Tower Leasing 36 1,138,366 34 941,350 37 1,033,609
5,846 3,267,364$ 5,726 2,460,605$ 5,958 2,066,415$
Notes:(1) Sales figures do not include year end adjustments for unbilled receivables.(2) There are 5,268 hydrants in the system as of September 30, 2004.
2004 2003 2002
CITY OF GAINESVILLE, FLORIDAFY04 COMPREHENSIVE ANNUAL FINANCIAL REPORT
STATISTICAL SECTIONECONOMIC DEMOGRAPHIC CHARACTERISTICS
137

CULTURAL AND RECREATION
Art Galleries:
Dance:
Music:
Museums:
Theatre:
Libraries:
Art Shows/Festivals: Art in Thornebrook Village, Downtown Festival & Art Show, Downtown Jazz & Blues Festival, Blizzard Bash, UF Fanfare & Fireworks, Hoggetowne Medieval Festival, Kanapaha Spring Garden Festival, SFCC Spring Arts Festival, Fifth Avenue Arts Festival
Parks:
Other Area Attractions:
Sources: Gainesville Council for Economic Outreach, City of Gainesville Department of Cultural Affairs,City of Gainesville Recreation and Parks Department
Academy of Music & Art, Alachua County Youth Orchestra, BarberGators, Gainesville Chamber Orchestra, Gainesville Civic Chorus, Gainesville Community Band, Gainesville Friends of Jazz & Blues, Gainesville Harmony Show chorus, Gainesville Youth Chorus, North Central Florida Blues Society, Santa Fe Brass Ensemble, Thirsty Ear Concerts, UF University Choir, UF Chamber Singers, UF Men's Glee Club, UF Women's Chorale, UF Gospel Choir, University Symphonic Band & Wind Ensemble, Willis Bodine Chorale, World Harmony Project
Dance Alive!, Dance Gainesville, Dance Theatre of Santa Fe, Danscompany of Gainesville, DuncanWorks Children's Dance Theatre, Floridance, Gainesville Ballet Theatre, Grand Squares Square Dance Club, Greenwood Morris Dancers and the Maypole, Lavern Porter Dance Company, Society for the Preservation of Oriental Folkloric Dance & Culture, Sahnobar Dance Ensemble, SoundStage American Dance Company
Focus Gallery, Gainesville Artisans' Guild Gallery, Grinter Gallery, Reitz Union Gallery, Samuel P. Harn Museum of Art, Santa Fe Gallery, The Thomas Center Galleries, University Gallery
CITY OF GAINESVILLE, FLORIDAFY04 COMPREHENSIVE ANNUAL FINANCIAL REPORT
STATISTICAL SECTIONECONOMIC DEMOGRAPHIC CHARACTERISTICS
Alachua County Library District Public Library, University of Florida Library, Santa Fe Community College Library
25 Parks and playgrounds
Bivens Arm Nature Park, Morningside Nature Center, Devil's Millhopper State Geological Site, Kanapaha Botanical Gardens, Paynes Prairie State Preserve, Santa Fe Community College Teaching Zoo, The Hawthorne Trail
The Children's Museum of the South, Florida Museum of Natural History, Matheson Historical Center, Micanopy Historical Society Museum, Theatre of Memory
Acrosstown Repertory Theatre, All Children's Theatre, Center for the Performing Arts, Constans Theatre, The Fable Factory, Gainesville Community Playhouse, High Springs Community Theatre, Hippodrome State Theatre, Performing Arts Center at P.K. Yonge, Theatre Santa Fe
138


![Gainesville Daily Sun. (Gainesville, Florida) 1908-03-26 [p 8].ufdcimages.uflib.ufl.edu/UF/00/02/82/98/01246/00858.pdfsilo 0G Cow city city city tied hat of bf OC city city Ibe city](https://static.fdocuments.in/doc/165x107/60a24d812fd6db557e56a0f7/gainesville-daily-sun-gainesville-florida-1908-03-26-p-8-silo-0g-cow-city.jpg)