City of Gainesville Urban Forest Ecological...
54
City of Gainesville Urban Forest Ecological Analysis 2016
Transcript of City of Gainesville Urban Forest Ecological...
City of Gainesville
Urban Forest Ecological
Analysis2016


Citation for this report:Andreu, M. G., Fox, D., Landry S., Northrop, R., and Hament, C. (2017). Urban Forest Ecological Analysis. Report to the
City of Gainesville, March 2017. City of Gainesville, Florida.
Photos by Caroline Hament and David Fox
Funding for this publication is provided in part by the USDA Forest Service. In accordance with federal law and USDA policy, this institu-tion is prohibited from discriminating on the basis of race, color, national origin, sex, age or disability. (Not all prohibited bases apply to all pro-grams). To file a complaint of discrimination, write: USDA, Director, Office of Civil Rights, Room 326-W, Whitten building, 1400 Indepen-dence Avenue SW, Washington, DC 20250-9410, or call 202/720-5964 (Voice and TDD). USDA is an equal opportunity provider and employer.
City of Gainesville Urban Forest Ecological Analysis 2016
Final Report to the City of GainesvilleMarch 2017
AuthorsDr. Michael G. Andreu, University of FloridaDr. David A. Fox, University of FloridaDr. Shawn M. Landry, University of South FloridaRobert J. Northrop, UF/IFAS Extension, Hillsborough CountyCaroline A. Hament, University of Florida
Project ContributorsLinda Demetropoulos, City of Gainesville PRCAMark Siburt, City of Gainesville PRCADr. Wayne C. Zipperer, U.S. Forest ServiceQuiyan Yu, University of South FloridaData collection crew: Caroline Hament, Carson Cooper, and Senol Oktay Keten
Special ThanksJoe Wolf, Gainesville Regional UtilitiesGeoff Parks, City of Gainesville PRCALandowners and residents of Gainesville

Table of ContentsExecutive Summary ................................................................................................................................6
Ecological Assessment ..........................................................................................................................7
Methods ......................................................................................................................................................8
Results ...................................................................................................................................................... 10
Diversity ............................................................................................................................................. 11
Abundance ....................................................................................................................................... 12
Native and Non-Native Tree Species ........................................................................................ 13
Forest Structure .............................................................................................................................. 14
Tree Density ................................................................................................................................ 14
Diameter Distribution of Trees.............................................................................................. 15
Forest Health ............................................................................................................................... 15
Cover of Urban Forest Strata ...................................................................................................... 16
Tree Canopy Cover .................................................................................................................... 16
Shrub Cover ................................................................................................................................. 17
Leaf Area ....................................................................................................................................... 18
Ground Cover ............................................................................................................................. 19
Tree Cover Change ......................................................................................................................... 19
The Value of Gainesville’s Urban Forest ........................................................................................ 22
Compensatory Value .................................................................................................................... 22
Energy Conservation .................................................................................................................... 23
Public Health: Air Pollution Removal ...................................................................................... 24
Avoided Runoff ............................................................................................................................... 25
Carbon Sequestration .................................................................................................................. 26
Carbon Storage .............................................................................................................................. 27
Appendices ............................................................................................................................................. 29
Appendix A: Land Use ..........................................................................................................................29
Appendix B: Ecological Assessment Species Level Results ............................................. 32
Appendix C: Gainesville Tree Canopy Assessment Using Remote Sensing .............. 37
References ........................................................................................................................................ 52
TablesTable 1. Generalized land uses in the City of Gainesville, FL with number of sample
plots per strata. ......................................................................................................................................8
Table 2. Description of each vertical strata of the urban forest included in i-Tree Eco sampling methodology. ......................................................................................................................9
Table 3. Invasive tree species found in the City of Gainesville as defined by FLEPPC. .. 13
Table 4. Ten species make up 68% of the 1-3” diameter class in Gainesville’s urban forest. Four species make up the largest diameter class (>30”). ........................................ 15
Table 5. Species with the most leaf area (LA) in Gainesville. .................................................. 18
Table 6. Tree Canopy Cover by year for Gainesville measured using remote sensing. . 19
4 • City of Gainesville Urban Forest Ecological Assessment 2016

Table 7. Summary of ecosystem services and annual values of Gainesville’s urban forest. ................................................................................................................................................... 22
Table 8. Annual energy savings from residential trees. ........................................................ 23
Table 9. Annual pollution removal by the trees and shrubs in Gainesville .................... 24
Table 10. Estimated annual economic benefits of reduced health impacts from air-borne pollutant reduction by trees and shrubs in the city of Gainesville (BenMAP) ............................................................................................................................................................... 24
Table 11. Avoided runoff and associated savings in each land use designation in the City and percent acreage of each land use ............................................................................ 25
Table 12. Carbon storage by land use designation and percent acreage ...................... 24
FiguresFigure 1. Study area map with sample grid overlay. .................................................................8
Figure 2. Generalized land use map of Gainesville, FL including sample plot loca-tions. .......................................................................................................................................................9
Figure 3. Comparison of the number of tree species by land use designation. ........... 11
Figure 4. Top ten tree species as a percentage of the total tree population in Gaines-ville, FL. ............................................................................................................................................... 12
Figure 5. Top ten tree species in the City of Gainesville. ...................................................... 12
Figure 6. Comparison of average trees per acre (TPA) for each land use designation in Gainesville, Fl. .............................................................................................................................. 14
Figure 7. Comparison of diameter (DBH) distribution by diameter class (columns) with the number of species present in each diameter class (line) ................................. 15
Figure 8. Condition of trees in Gainesville by land use designation. ............................... 15
Figure 9. The City of Gainesville has 47% canopy cover, which is higher than other major cities in Florida, such as Orlando, Tampa, and Miami. ............................................ 16
Figure 10. Percent tree cover by land use in the City of Gainesville................................. 16
Figure 11. Percent shrub cover by land use designation in the City of Gainesville. ... 17
Figure 12. Number of shrub species present in each land use designation. ................. 17
Figure 13. Distribution of leaf area by land use and the percentage of the City repre-sented by each land use.. ............................................................................................................. 18
Figure 14. Proportional distribution of ground covers by land use in Gainesville.. .... 19
Figure 15. Distribution of ground cover types by percent in Gainesville.. ..................... 19
Figure 16. Canopy and non-canopy distribution of 1996 in the City of Gainesville.. . 20
Figure 17.Canopy and non-canopy distribution of 2006 in the City of Gainesville.. .. 20
Figure 18. Canopy and non-canopy distribution of 2015 in the City of Gainesville.. . 21
Figure 19. Savings in avoided runoff costs by species.. ........................................................ 25
Figure 20. Carbon sequestration rates in Gainesville by species. ..................................... 26
Figure 21. Carbon stored in Gainesville by species.. .............................................................. 27
City of Gainesville Urban Forest Ecological Assessment 2016 • 5
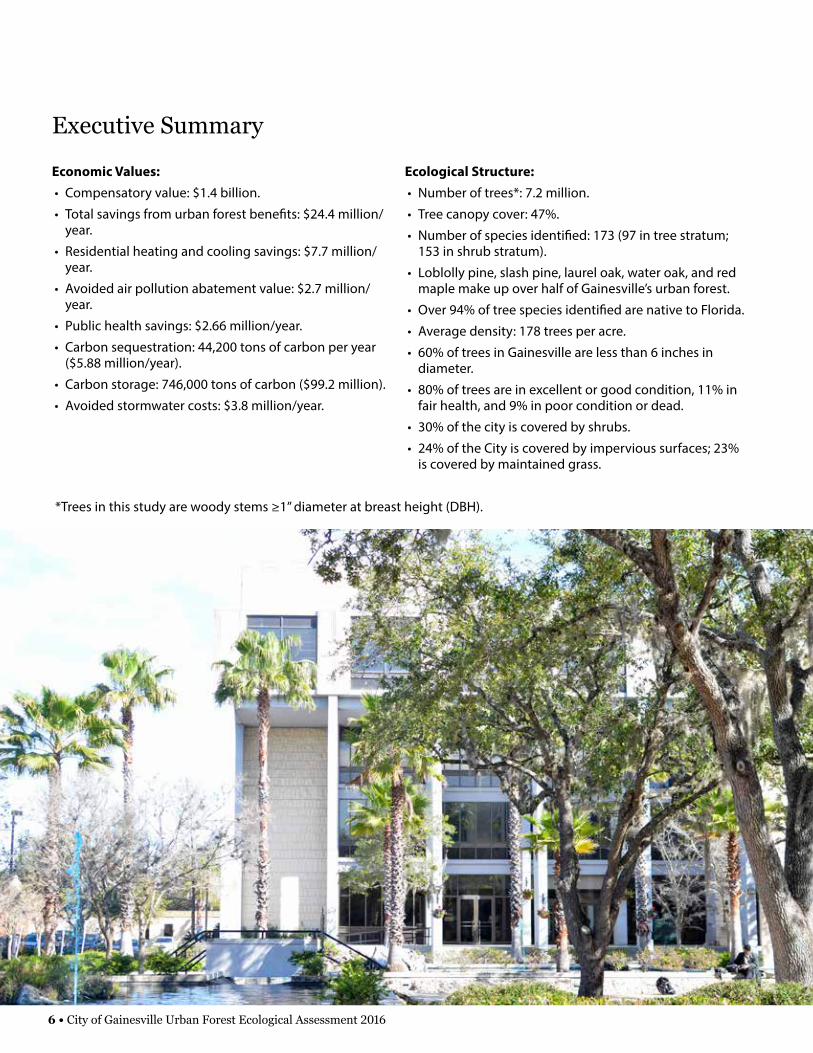
Economic Values:• Compensatory value: $1.4 billion.
• Total savings from urban forest benefits: $24.4 million/year.
• Residential heating and cooling savings: $7.7 million/year.
• Avoided air pollution abatement value: $2.7 million/year.
• Public health savings: $2.66 million/year.
• Carbon sequestration: 44,200 tons of carbon per year ($5.88 million/year).
• Carbon storage: 746,000 tons of carbon ($99.2 million).
• Avoided stormwater costs: $3.8 million/year.
Ecological Structure:• Number of trees*: 7.2 million.
• Tree canopy cover: 47%.
• Number of species identified: 173 (97 in tree stratum; 153 in shrub stratum).
• Loblolly pine, slash pine, laurel oak, water oak, and red maple make up over half of Gainesville’s urban forest.
• Over 94% of tree species identified are native to Florida.
• Average density: 178 trees per acre.
• 60% of trees in Gainesville are less than 6 inches in diameter.
• 80% of trees are in excellent or good condition, 11% in fair health, and 9% in poor condition or dead.
• 30% of the city is covered by shrubs.
• 24% of the City is covered by impervious surfaces; 23% is covered by maintained grass.
Executive Summary
*Trees in this study are woody stems ≥1” diameter at breast height (DBH).
6 • City of Gainesville Urban Forest Ecological Assessment 2016
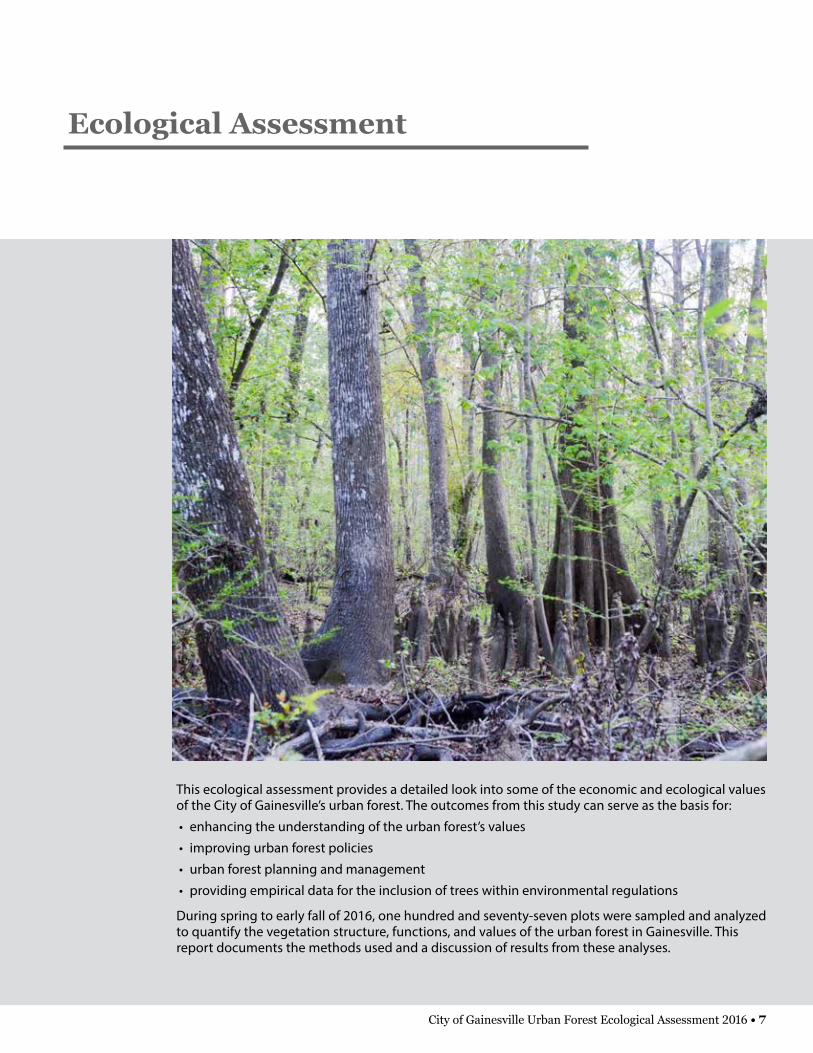
Ecological Assessment
This ecological assessment provides a detailed look into some of the economic and ecological values of the City of Gainesville’s urban forest. The outcomes from this study can serve as the basis for:
• enhancing the understanding of the urban forest’s values
• improving urban forest policies
• urban forest planning and management
• providing empirical data for the inclusion of trees within environmental regulations
During spring to early fall of 2016, one hundred and seventy-seven plots were sampled and analyzed to quantify the vegetation structure, functions, and values of the urban forest in Gainesville. This report documents the methods used and a discussion of results from these analyses.
City of Gainesville Urban Forest Ecological Assessment 2016 • 7

In order to capture a representative sample of the urban forest across broad land use categories, a systematic random sampling design was used to achieve a geographic distribution of inventory plots throughout the city. Using geographic infor-mation system (GIS) tools, a hexagonal grid was projected onto a map of the city; each full hexa-gon represented approximately 200 acres (Figure 1). One sample point was randomly located within each hexagon. The latitude and longitude was acquired from the GIS for each point to aid in plot establishment and data collection. 177 plots were randomly sampled (Table 1). GIS land use and tax parcel data were acquired from the City (Appendix A). Broad land use categories were generalized from these spatial data sets (Table 1 and Figure 2).
With this systematic sampling, the percentage of plots that fall into each land use was similar to the percent of Gainesville in each land use (Table 1). A comparatively small area of the City has an agri-cultural land use (pasture and wholesale nursery), and no sample plots fell in these areas (Figure 2). Over one-quarter of Gainesville is covered by for-estland, about half of which is composed of pine plantations along the northern City boundary. The large Industrial area in the NW corner of the City includes lands surrounding the Deerhaven power plant while the large Transportation area in the eastern part of the City is the Gainesville Regional Airport (Figure 2). The land use that occupies the most acreage in the city is Residential (29%) (Table 1).
Data collection in the 177 plots began May 9 and ended October 21, 2016. Using the latitude and longitude values from the GIS, a fixed radius 1/10th acre (r = 37.2 ft) sample area was established at each plot center location. Plot center was docu-mented with distances and directions to reference objects, which can be used to facilitate future plot reestablishment.
Three vertical strata of the urban forest were quan-tified at every sample plot: tree, shrub, and ground cover (Table 2). The tree stratum includes woody stems greater than or equal to 1 inch in diameter at breast height (DBH), measured 4.5 feet from the
Figure 1. Study area map with sample grid overlay.
Land Use Area (acres)
Percent of City
Number of Plots
Residential 11,792 28.9 48
Forested 11,098 27.2 35
Transportation 6,218 15.3 29
Public/Institutional 3,972 9.7 24
Industrial 2,973 7.3 13
Commercial 2,828 6.9 19
Open Space/Park 1,719 4.2 9
Agriculture 141 0.3 0
Gainesville 40,740 100 177Table 1. Generalized land uses in the City of Gaines-ville, FL with number of sample plots per strata.
Methods
8 • City of Gainesville Urban Forest Ecological Assessment 2016

ground. The shrub stratum is made up of woody plants at least 1 foot tall but with stems less than 1 inch DBH. The ground cover stratum consists of woody or herbaceous vegetation less than 1 foot tall. Data was collected following the plot sam-pling protocol referenced in the 2017 i-Tree User’s Manual (v6), Phase III found at www.itreetools.org.
Data collected also included the following:
• Percent cover of each stratum
• Identification of tree and shrub plant species
• Tree DBH
• Tree height
• Tree crown measurements
• Crown condition assessments
• Proximity of trees to buildings
• Tree crown light exposure index
Data was analyzed by the i-Tree Eco software tool (v6), formerly known as UFORE (Urban Forest Effects Model) (Nowak, Stevens, Sisinni, & Lu-ley, 2002), which was created by the U.S. Forest Service. This tool is widely used throughout the U.S., Canada, Australia, and the U.K. Models within i-Tree Eco quantify the structure and following values of the urban forest:
• Compensatory value
• Residential heating and cooling savings
• Avoided air pollution abatement value
• Public health savings
• Carbon sequestration value
• Carbon storage value
• Avoided stormwater costs
Strata Description
Tree Woody stems ≥1” DBH
Shrub Woody plants ≥1ft height; <1” DBH
Ground Cover Woody or herbaceous vegetation <1ft height
Table 2. Description of each vertical stratum of the urban for-est included in the i-Tree Eco sampling methodology.
Figure 2. Generalized land use map of Gainesville, FL including sample plot locations.
City of Gainesville Urban Forest Ecological Assessment 2016 • 9
Gainesville is located in temperate north Florida. Many of the plant species found in Gainesville are specific to this climate zone (Plant Hardiness Zone 9a: average annual extreme minimum tempera-tures between 20-25° F) and are not found further south in the sub-tropical regions of the state. Typical forest types in this region include mixed pine and mixed hardwood uplands and cypress/gum wetlands. Remnants of these forest types were found within the city limits. Southern pine tim-ber production is also common in northern Florida, and the City of Gainesville contains some active production forests.
Results
10 • City of Gainesville Urban Forest Ecological Assessment 2016
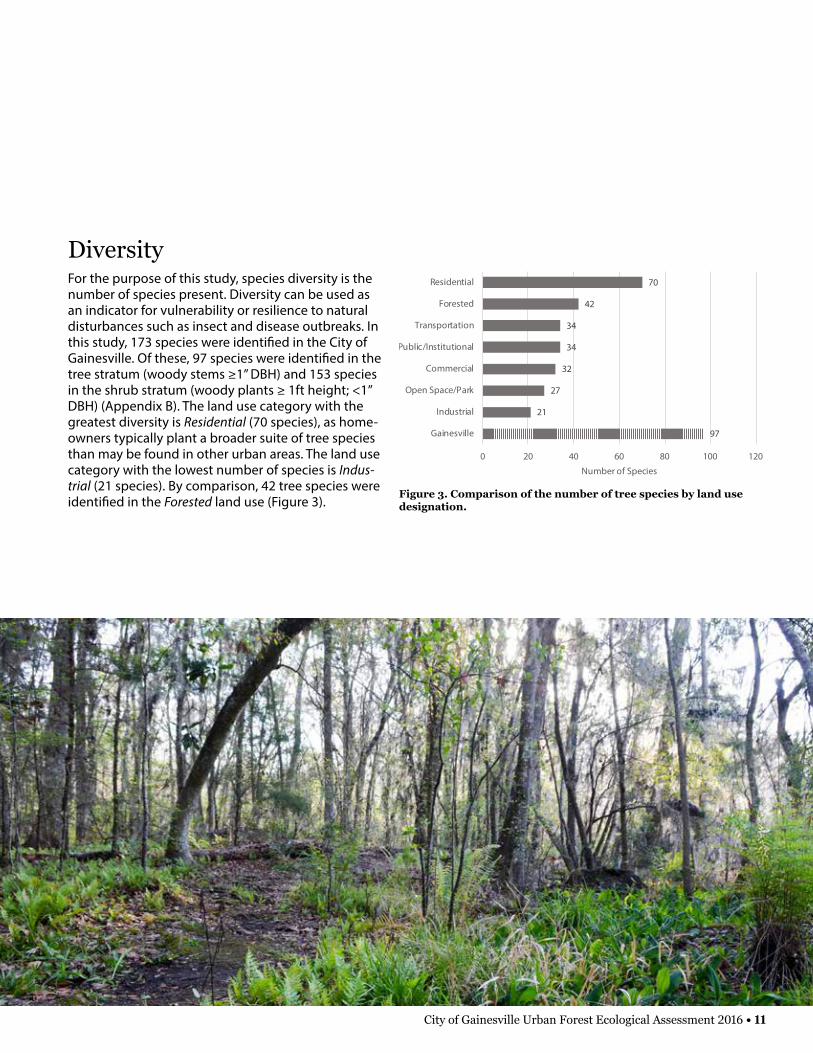
DiversityFor the purpose of this study, species diversity is the number of species present. Diversity can be used as an indicator for vulnerability or resilience to natural disturbances such as insect and disease outbreaks. In this study, 173 species were identified in the City of Gainesville. Of these, 97 species were identified in the tree stratum (woody stems ≥1” DBH) and 153 species in the shrub stratum (woody plants ≥ 1ft height; <1” DBH) (Appendix B). The land use category with the greatest diversity is Residential (70 species), as home-owners typically plant a broader suite of tree species than may be found in other urban areas. The land use category with the lowest number of species is Indus-trial (21 species). By comparison, 42 tree species were identified in the Forested land use (Figure 3).
97
21
27
32
34
34
42
70
0 20 40 60 80 100 120
Gainesville
Industrial
Open Space/Park
Commercial
Public/Institutional
Transportation
Forested
Residential
Number of Species
Figure 3. Comparison of the number of tree species by land use designation.
City of Gainesville Urban Forest Ecological Assessment 2016 • 11
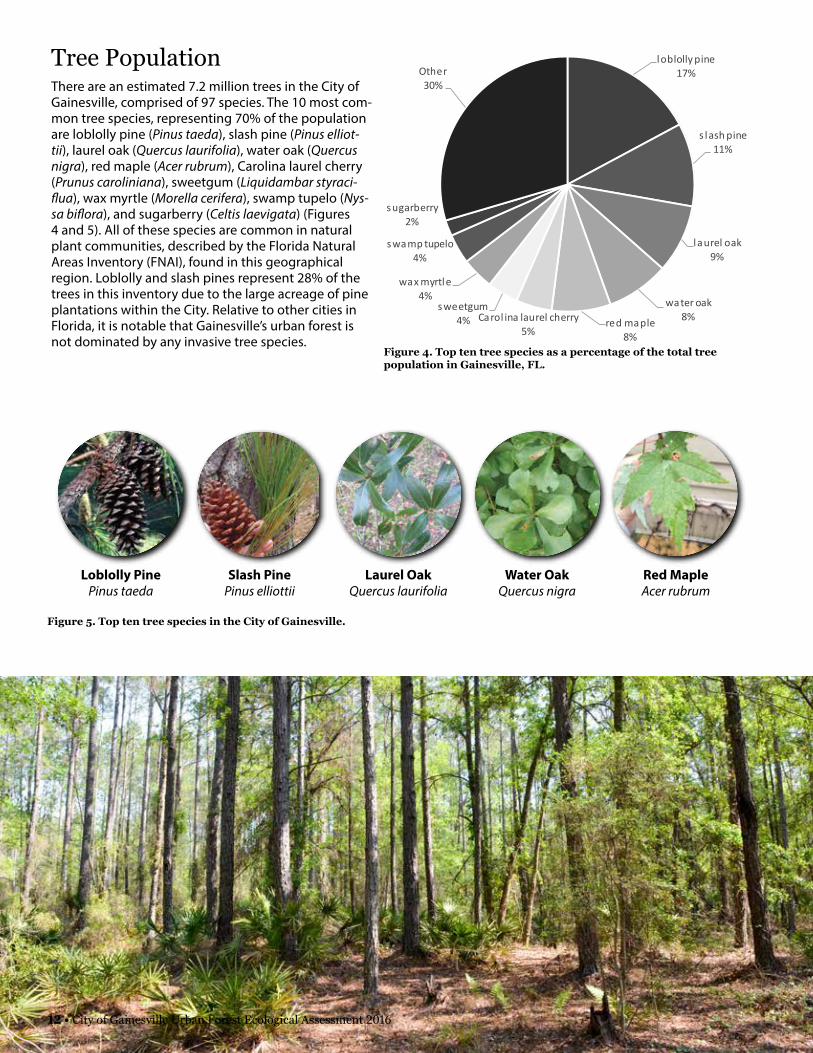
loblolly pine17%
slash pine11%
laurel oak9%
water oak8%red maple
8%
Carol ina laurel cherry5%
sweetgum4%
wax myrtle4%
swamp tupelo4%
sugarberry2%
Other30%
Figure 4. Top ten tree species as a percentage of the total tree population in Gainesville, FL.
Tree Population There are an estimated 7.2 million trees in the City of Gainesville, comprised of 97 species. The 10 most com-mon tree species, representing 70% of the population are loblolly pine (Pinus taeda), slash pine (Pinus elliot-tii), laurel oak (Quercus laurifolia), water oak (Quercus nigra), red maple (Acer rubrum), Carolina laurel cherry (Prunus caroliniana), sweetgum (Liquidambar styraci-flua), wax myrtle (Morella cerifera), swamp tupelo (Nys-sa biflora), and sugarberry (Celtis laevigata) (Figures 4 and 5). All of these species are common in natural plant communities, described by the Florida Natural Areas Inventory (FNAI), found in this geographical region. Loblolly and slash pines represent 28% of the trees in this inventory due to the large acreage of pine plantations within the City. Relative to other cities in Florida, it is notable that Gainesville’s urban forest is not dominated by any invasive tree species.
Red MapleAcer rubrum
Water OakQuercus nigra
Laurel OakQuercus laurifolia
Slash PinePinus elliottii
Loblolly PinePinus taeda
Figure 5. Top ten tree species in the City of Gainesville.
12 • City of Gainesville Urban Forest Ecological Assessment 2016

Native and Non-Native Tree Species Of the 97 tree species identified in the City, 65 are native to Florida, meaning they were found in Florida prior to Euro-pean colonization in the 16th century. The remaining 32 species are non-native, meaning they were introduced outside of their native range. Of these non-native species, six were listed by the Florida Exotic Pest Plant Council (FLEPPC, 2016) as invasive (Table 3). Invasive species are those that spread into and dominate an area, and they negatively affect eco-logical functions of the forest. Five of these are considered Category I (CAT I) invasive species, which is a subset of the FLEPPC list indicating those species which have caused severe documented ecological damage.
Although other invasive species were found in the shrub and ground cover strata, the i-Tree sam-pling scheme does not capture the cover of these species.
Species Common Name Percent of Tree Population
Percent Leaf Area
Number of Plots Present
Albizia julibrissin* Mimosa 0.14 0.16 3
Broussonetia papyrifera Paper mulberry 0.24 0.06 1
Cinnamomum camphora* Camphor tree 0.91 1.05 9
Ligustrum lucidum* Glossy privet 0.19 0.14 4
Syzygium cumini* Jambolan plum 0.02 <0.01 1
Triadica sebifera* Chinese tallow 0.16 0.06 5
Table 3. Invasive tree species found in the City of Gainesville as defined by FLEPPC. *CAT I Invasive Species
SugarberryCeltis laevigata
Wax MyrtleMorella cerifera
Carolina Laurel CherryPrunus caroliniana
Swamp TupeloNyssa bi�ora
SweetgumLiquidambar styraci�ua
City of Gainesville Urban Forest Ecological Assessment 2016 • 13

Forest StructureForest structure is the distribution of vegetation both horizontally and vertically. The following sections review phys-ical attributes of the forest that were measured and calculated to determine forest structure: tree density, diameter distribution, forest health, urban forest cover, and leaf area. These metrics were ultimately used to quantify the eco-logical functions of Gainesville’s urban forest.
Tree DensityTree density is the number of trees per acre (TPA). The higest TPA is found in the Forested land use, where loblolly and slash pine are often planted at densities between 500 and 700 TPA. The Residential land use, which represents the most acreage in the city (Table 1) and has the highest number of species (Figure 3), has far fewer TPA. The lowest TPA is found on Commercial and Transportation lands (Figure 6), which make up 22% of the City.
178
82
89
95
114
149
207
356
0 50 100 150 200 250 300 350 400
Gainesville
Transportation
Commercial
Public/Institutional
Residential
Industrial
Open Space/Park
Forested
Average Trees Per Acre
Figure 6. Comparison of average trees per acre (TPA) for each land use designation in Gainesville, Fl.
14 • City of Gainesville Urban Forest Ecological Assessment 2016

Diameter Distribution of Trees The diameter distribution of live trees in Gainesville is skewed toward smaller diameter classes (Figure 7). However, species within each class grow at differ-ent rates and have different maximum size potentials. For example, wax myrtle (Morella cerifera), which makes up 10% of the 1-3” diameter class (Table 4), grows quickly, but has a small maximum diameter and is short-lived. Loblolly pine (Pinus taeda), however, grows quickly, but has a large maximum diameter and is longer-lived. By comparison, live oak (Quercus virginiana), which makes up 25% of the largest diameter class (Table 4), grows relatively slowly, has the poten-tial to get large, and is very long-lived. Only four of the 97 species identified in the City make up the largest diame-ter class (>30”), and 3 of the 4 are not present in the species that make up the majority of the smallest diameter class (Table 4).
Species Percent of 1-3” DBH class Species Percent of
>30” DBH class
Laurel oak 12% Bald cypress 41%
Red maple 11% Live oak 25%
Water oak 10% Swamp tupelo 23%
Wax myrtle 10% Sugarberry 11%
Carolina laurel cherry 9% — —
Loblolly pine 5% — —
Sweetgum 3% — —
Sugarberry 3% — —
Elderberry 2% — —
Dahoon 2% — —
Table 4. Ten species make up 68% of the 1-3" diameter class in Gainesville's ur-ban forest. Four species make up the largest diameter class (>30”).
Forest HealthThe 2016 analysis indicates that approximately 80% of the trees are considered to be in excellent or good health, 11% are in fair health, and the remaining 9% are in poor condition or lower. Tree health was evaluated by land use. The i-Tree methodology to determine estimates of tree health is based on canopy condition assessments. These estimates of health do not reflect structural integrity. The highest percentage of healthy trees (defined as excellent and good catego-ries) in Gainesville are those in Public/Institutional (85%), Industrial (81%), and Forested (81%) land uses (Figure 8). Approximately 71-81% of trees in Com-mercial, Transportation, and Residential land uses were in excellent or good health. A greater percentage of trees in Commercial areas were in fair condition (15%) than those in Transportation and Residential areas (8% and 11%). The low-est percentage of healthy trees occurs on Open Space/Park lands and the highest percentage of unhealthy or recorded dead trees fell on Transportation.
0
10
20
30
40
50
60
70
80
0
5
10
15
20
25
30
35
40
1-3 3-6 6-9 9-12 12-15 15-18 18-21 21-24 24-27 27-30 >30
Num
ber o
f Spe
cies
Perc
ent o
f Tre
es (%
)
DBH (inches)
Figure 7. Comparison of diameter (DBH) distribution by diameter class (columns) with the number of species present in each diameter class (line).
Figure 8. Condition of trees in Gainesville by land use designation.
0% 10% 20% 30% 40% 50% 60% 70% 80% 90% 100%
Gainesville
Open Space/Park
Commercial
Transportation
Residential
Forested
Industrial
Public/Institutional
Excellent & Good Fair Poor & Dead
City of Gainesville Urban Forest Ecological Assessment 2016 • 15

7 million trees7 million treesThere are over
in Gainesville covering
= 15,000 people
32%in Tampa
22%in Orlando
21%in Miami
47% of the total area
Tree Canopy CoverTree canopy cover is used to quantify the amount of land area under and around trees. Sometimes thought of as the “footprint” of the urban forest, ecologically, canopy cover influences microclimate (e.g. shade in parking lots and homes) as well as the interception of rainfall (stormwater flow) and air pollution abatement (Leff, 2016).
Based on Eco sample plot data collected, the estimated average tree canopy cover of Gainesville is 47% (Figure 9), but it is spatially variable across land uses (Figure 10). Tree cover is greatest in Forested areas (71%) and lowest in Industrial areas (25%). The Residential (44%) and Open Space/Park (44%) land uses were nearly at the Gaines-ville average (Figure 10) and together represent 33% of the City (Table 1).
Cover of Urban Forest Strata
47
25
33
33
34
44
44
71
0 10 20 30 40 50 60 70 80
Gainesville
Industrial
Public/Institutional
Transportation
Commercial
Open Space/Park
Residential
Forested
Percent Tree Cover (%)
Figure 10. Percent tree cover by land use in the City of Gainesville.
Figure 9. The City of Gainesville has 47%
canopy cover, which is higher than other major
cities in Florida, such as Orlando, Tampa, and
Miami (Ekpe et al., 2012, Landry et al., 2011, and
U.S. Conference of May-ors, 2008).
16 • City of Gainesville Urban Forest Ecological Assessment 2016
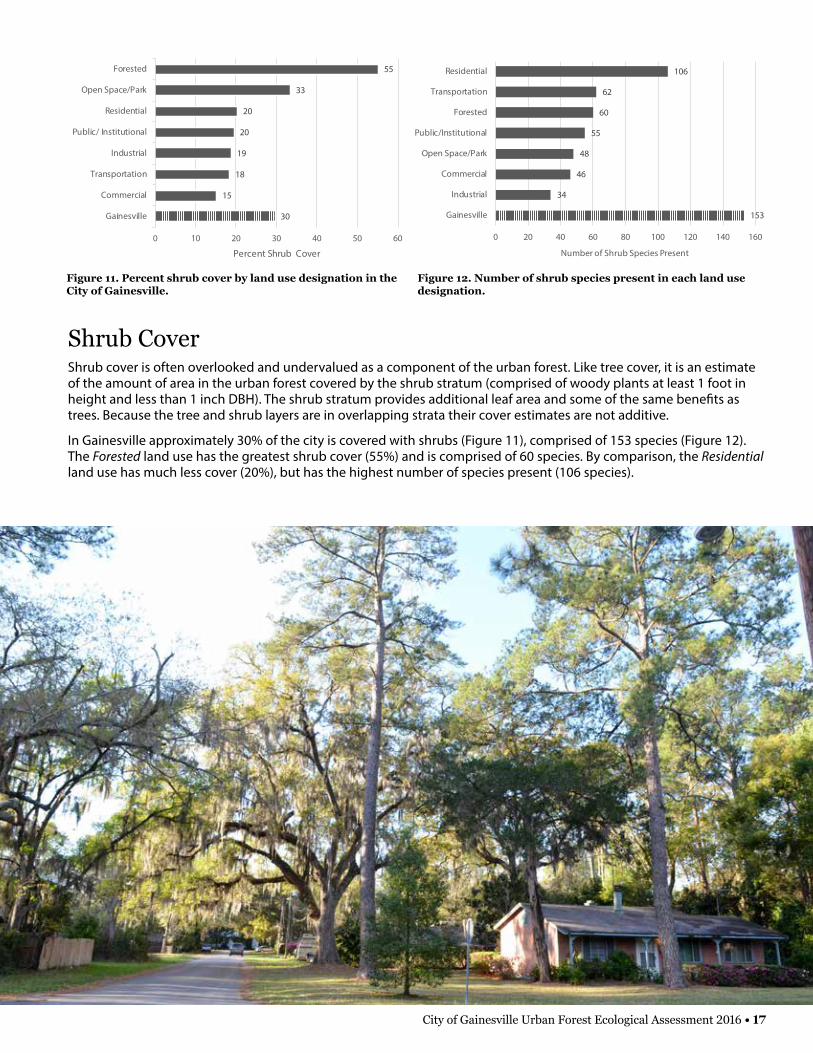
Shrub CoverShrub cover is often overlooked and undervalued as a component of the urban forest. Like tree cover, it is an estimate of the amount of area in the urban forest covered by the shrub stratum (comprised of woody plants at least 1 foot in height and less than 1 inch DBH). The shrub stratum provides additional leaf area and some of the same benefits as trees. Because the tree and shrub layers are in overlapping strata their cover estimates are not additive.
In Gainesville approximately 30% of the city is covered with shrubs (Figure 11), comprised of 153 species (Figure 12). The Forested land use has the greatest shrub cover (55%) and is comprised of 60 species. By comparison, the Residential land use has much less cover (20%), but has the highest number of species present (106 species).
30
15
18
19
20
20
33
55
Gainesville
Commercial
Transportation
Industrial
Public/ Institutional
Residential
Open Space/Park
Forested
0 10 20 30 40 50 60
Percent Shrub Cover
Figure 11. Percent shrub cover by land use designation in the City of Gainesville.
153
34
46
48
55
60
62
106
0 20 40 60 80 100 120 140 160
Gainesville
Industrial
Commercial
Open Space/Park
Public/Institutional
Forested
Transportation
Residential
Number of Shrub Species Present
Figure 12. Number of shrub species present in each land use designation.
City of Gainesville Urban Forest Ecological Assessment 2016 • 17

Leaf Area Leaf area (LA) is a three-dimensional measure of the total green leaf surface area on a tree or shrub. This differs from canopy cover, a two-dimensional mea-sure, because it is calculated for each tree and shrub regardless of canopy position or overlap.
Leaf area is used in quantifying pollution removal and avoided runoff, as leaves are responsible for wind, solar, and water interception. The i-Tree Eco model calculates leaf area of individual species using regression equations and takes into consideration tree condition.
The tree species with the greatest LA in Gainesville were loblolly pine (20%) and slash pine (15%), which were also the most dominant tree species in the urban forest based on the number of trees (Table 5). However, not all species followed this pattern. Live oak represented only 1% of the total tree population, yet 4% of the LA. Many of the species that make up majority of the City’s LA are common in forested wet-land plant communities described by FNAI.
Since leaf area is a crucial factor in quantifying the benefits of the urban forest, leaf area by land use was also considered. The land use with the highest percentage of the City’s LA was Forested (44%) (Figure 13). The Residential land use, which takes up the greatest percentage of the City, had 26% of the City’s LA. Industrial, Open Space/Park, and Commercial areas had the smallest proportion of the City’s LA (3%, 4%, and 5%), but also account for the smallest portion of Gainesville’s total acreage (Figure 13).
Species Leaf Area (%)
Loblolly pine 20%
Slash pine 15%
Water oak 8%
Laurel oak 7%
Red maple 6%
Sweetgum 5%
Live oak 4%
Bald cypress 4%
Swamp tupelo 3%
Sugarberry 3%
Table 5. Species with the most leaf area (LA) in Gainesville.
7
4
7
10
15
29
27
3
4
5
7
11
26
44
0 10 20 30 40 50
Industrial
Open Space/Park
Commercial
Public/Institutional
Transportation
Residential
Forested
Percent Leaf Area (%) Percent of City (%)
Figure 13. Distribution of leaf area by land use and the percentage of the City represented by each land use.
18 • City of Gainesville Urban Forest Ecological Assessment 2016
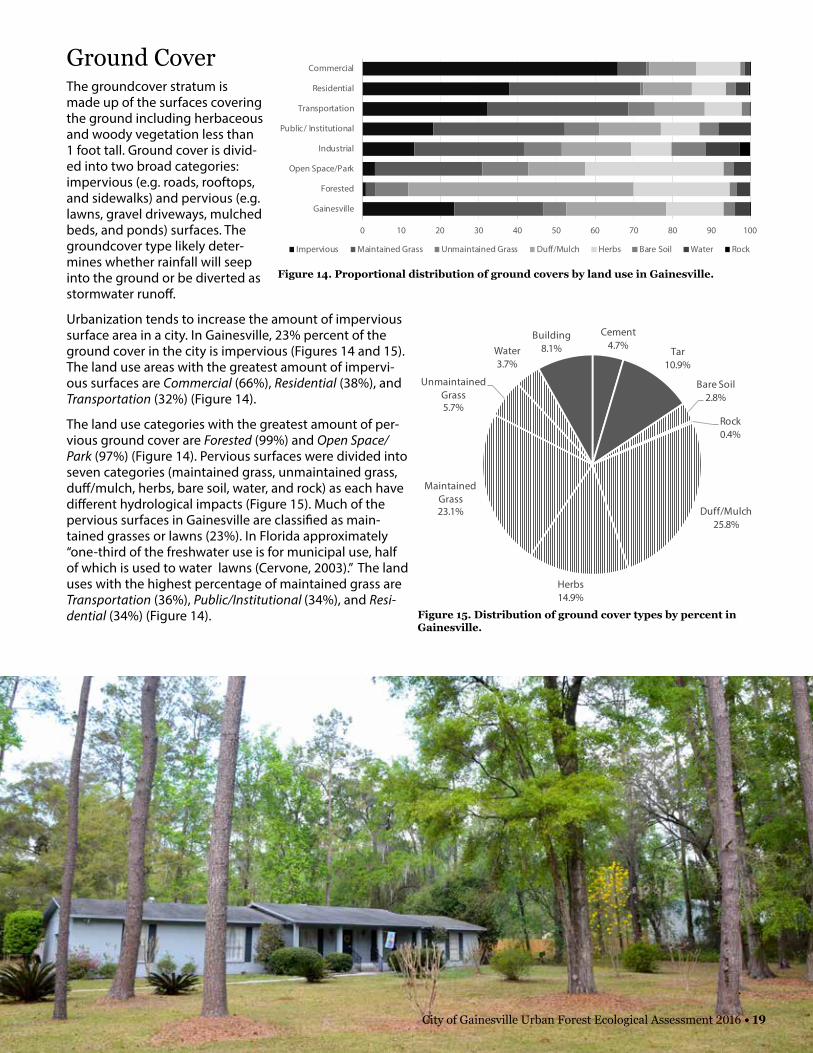
Ground CoverThe groundcover stratum is made up of the surfaces covering the ground including herbaceous and woody vegetation less than 1 foot tall. Ground cover is divid-ed into two broad categories: impervious (e.g. roads, rooftops, and sidewalks) and pervious (e.g. lawns, gravel driveways, mulched beds, and ponds) surfaces. The groundcover type likely deter-mines whether rainfall will seep into the ground or be diverted as stormwater runoff.
Urbanization tends to increase the amount of impervious surface area in a city. In Gainesville, 23% percent of the ground cover in the city is impervious (Figures 14 and 15). The land use areas with the greatest amount of impervi-ous surfaces are Commercial (66%), Residential (38%), and Transportation (32%) (Figure 14).
The land use categories with the greatest amount of per-vious ground cover are Forested (99%) and Open Space/Park (97%) (Figure 14). Pervious surfaces were divided into seven categories (maintained grass, unmaintained grass, duff/mulch, herbs, bare soil, water, and rock) as each have different hydrological impacts (Figure 15). Much of the pervious surfaces in Gainesville are classified as main-tained grasses or lawns (23%). In Florida approximately “one-third of the freshwater use is for municipal use, half of which is used to water lawns (Cervone, 2003).” The land uses with the highest percentage of maintained grass are Transportation (36%), Public/Institutional (34%), and Resi-dential (34%) (Figure 14).
0 10 20 30 40 50 60 70 80 90 100
Gainesville
Forested
Open Space/Park
Industrial
Public/ Institutional
Transportation
Residential
Commercial
Impervious Maintained Grass Unmaintained Grass Duff/Mulch Herbs Bare Soil Water Rock
Figure 14. Proportional distribution of ground covers by land use in Gainesville.
Figure 15. Distribution of ground cover types by percent in Gainesville.
Cement4.7% Tar
10.9%
Bare Soil2.8%
Rock0.4%
Duff/Mulch25.8%
Herbs14.9%
Maintained Grass23.1%
Unmaintained Grass5.7%
Water3.7%
Building8.1%
City of Gainesville Urban Forest Ecological Assessment 2016 • 19
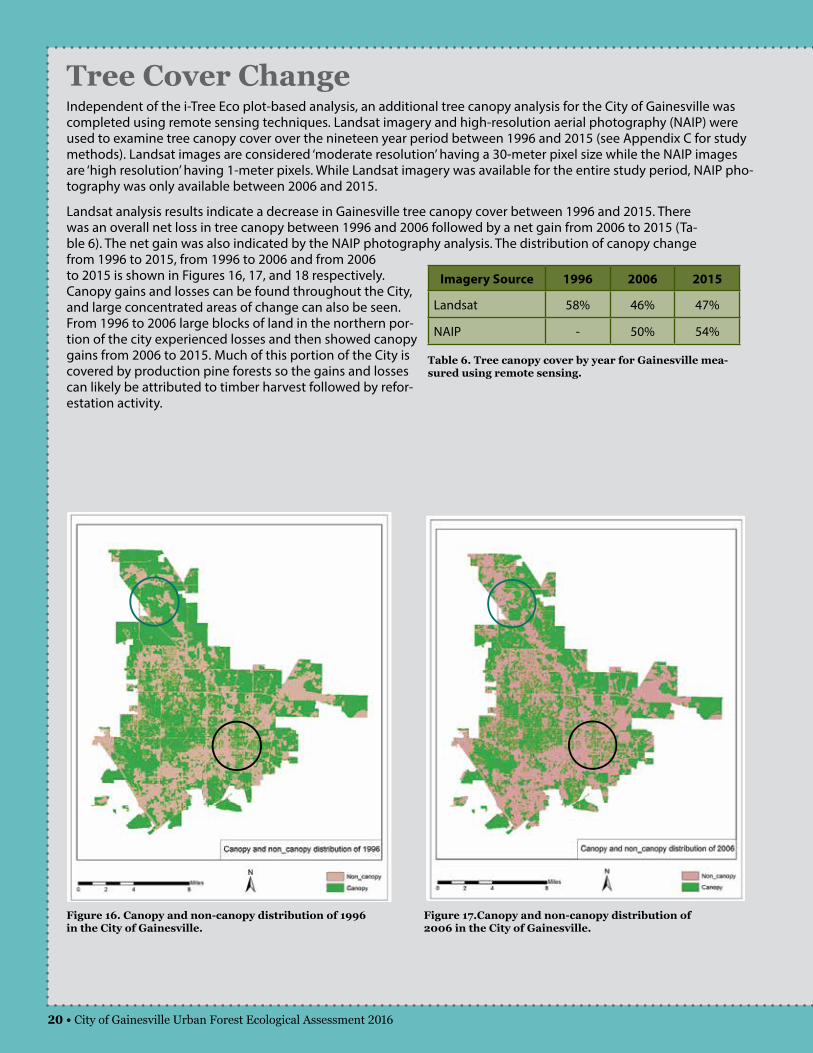
Figure 16. Canopy and non-canopy distribution of 1996 in the City of Gainesville.
Figure 17.Canopy and non-canopy distribution of 2006 in the City of Gainesville.
Tree Cover ChangeIndependent of the i-Tree Eco plot-based analysis, an additional tree canopy analysis for the City of Gainesville was completed using remote sensing techniques. Landsat imagery and high-resolution aerial photography (NAIP) were used to examine tree canopy cover over the nineteen year period between 1996 and 2015 (see Appendix C for study methods). Landsat images are considered ‘moderate resolution’ having a 30-meter pixel size while the NAIP images are ‘high resolution’ having 1-meter pixels. While Landsat imagery was available for the entire study period, NAIP pho-tography was only available between 2006 and 2015.
Landsat analysis results indicate a decrease in Gainesville tree canopy cover between 1996 and 2015. There was an overall net loss in tree canopy between 1996 and 2006 followed by a net gain from 2006 to 2015 (Ta-ble 6). The net gain was also indicated by the NAIP photography analysis. The distribution of canopy change from 1996 to 2015, from 1996 to 2006 and from 2006 to 2015 is shown in Figures 16, 17, and 18 respectively. Canopy gains and losses can be found throughout the City, and large concentrated areas of change can also be seen. From 1996 to 2006 large blocks of land in the northern por-tion of the city experienced losses and then showed canopy gains from 2006 to 2015. Much of this portion of the City is covered by production pine forests so the gains and losses can likely be attributed to timber harvest followed by refor-estation activity.
Imagery Source 1996 2006 2015
Landsat 58% 46% 47%
NAIP - 50% 54%
Table 6. Tree canopy cover by year for Gainesville mea-sured using remote sensing.
20 • City of Gainesville Urban Forest Ecological Assessment 2016

Figure 18. Canopy and non-canopy distribution of 2015 in the City of Gainesville.
1996
1996
2006
2006
2015
2015
Changes to Gaines-ville’s canopy oc-curred between 1996 and 2015 (Figures 16, 17, 18). In some areas (top), canopy was lost then gained, likey due to timber harvest followed by reforesta-tion. In other areas of the city (bottom), canopy has been lost over time without gains.
City of Gainesville Urban Forest Ecological Assessment 2016 • 21

The i-Tree Eco model uses the urban forest structure metrics discussed in the previous section to quantify and value the benefits of the urban forest. These benefits are considered ecosystem services because of their beneficial effects on the health and well-being of humans (Escobedo, Kroeger, and Wagner, 2011). These ecosystem services and their values (summarized in Table 7) are discussed in the following sections.
The Value of Gainesville’s Urban Forest
In addition to its annual values, the urban forest has an overall estimated value referred to as its compensatory value. This value considers tree size, species, con-dition, and location. The compensatory value is an estimate of the cost to replace all trees in the city if they were removed (e.g. deliberately or due to a storm).
The compensatory value of trees in Gainesville’s urban forest is over $1.4 billion dollars. This value was calculated by the ECO model using the industry standard methodology developed by the Council of Tree and Landscape Appraisers.
Ecosystem Service Annual Value (million $)
Tree shading energy savings 7.7
Avoided carbon emissions 1.7
Air pollution capture 2.7
Avoided health care costs 2.7
Avoided stormwater runoff costs 3.8
Carbon sequestration 5.9
Total Annual Urban Forest Benefits 24.4
Table 7. Summary of ecosystem services and annual values of Gainesville’s urban forest.
Ecosystem Services$24.4 million/year + $1.4 billion
Compensatory Value
22 • City of Gainesville Urban Forest Ecological Assessment 2016
Type Heating Cooling Total Price ($) Value ($)
Natural Gas (MBTU) 38,130 0 38,130 $17.30 $659,600
Electricity (MWH) 1,570 58,770 60,340 $116.15 $7,008,400
Carbon Avoided (ton) 910 11,980 12,890 $133.05 $1,715,000
Table 8. Annual energy savings from residential trees.
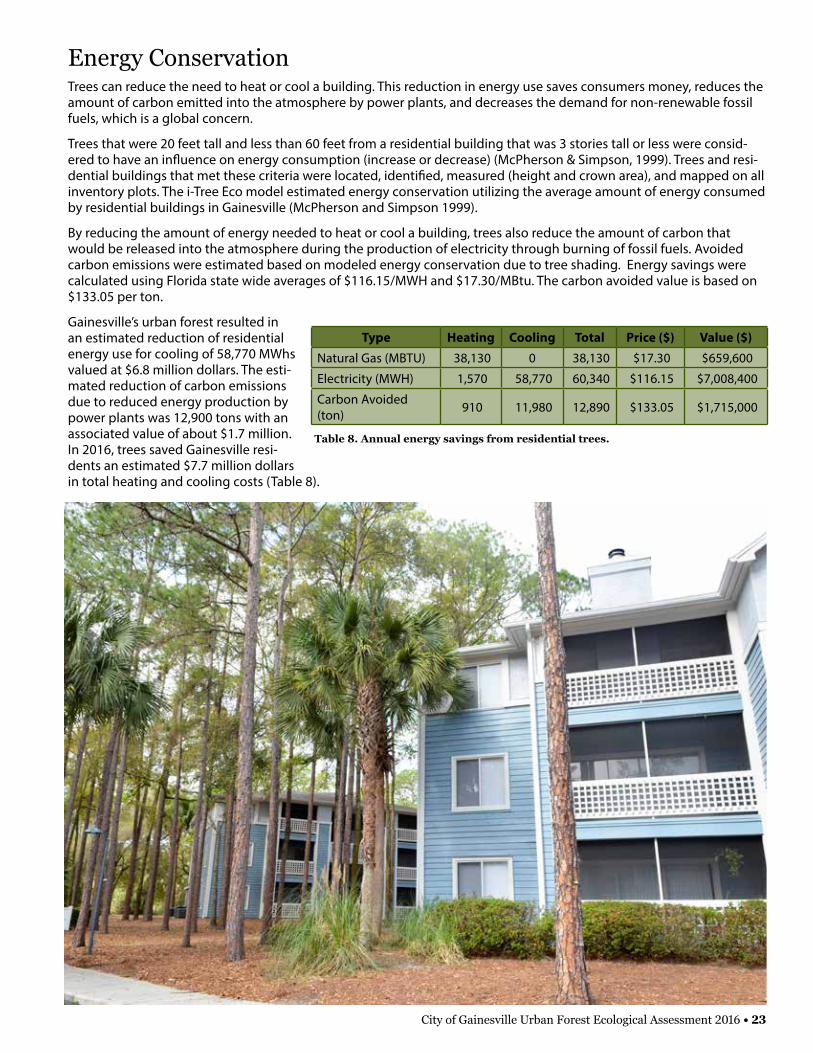
Energy ConservationTrees can reduce the need to heat or cool a building. This reduction in energy use saves consumers money, reduces the amount of carbon emitted into the atmosphere by power plants, and decreases the demand for non-renewable fossil fuels, which is a global concern.
Trees that were 20 feet tall and less than 60 feet from a residential building that was 3 stories tall or less were consid-ered to have an influence on energy consumption (increase or decrease) (McPherson & Simpson, 1999). Trees and resi-dential buildings that met these criteria were located, identified, measured (height and crown area), and mapped on all inventory plots. The i-Tree Eco model estimated energy conservation utilizing the average amount of energy consumed by residential buildings in Gainesville (McPherson and Simpson 1999).
By reducing the amount of energy needed to heat or cool a building, trees also reduce the amount of carbon that would be released into the atmosphere during the production of electricity through burning of fossil fuels. Avoided carbon emissions were estimated based on modeled energy conservation due to tree shading. Energy savings were calculated using Florida state wide averages of $116.15/MWH and $17.30/MBtu. The carbon avoided value is based on $133.05 per ton.
Gainesville’s urban forest resulted in an estimated reduction of residential energy use for cooling of 58,770 MWhs valued at $6.8 million dollars. The esti-mated reduction of carbon emissions due to reduced energy production by power plants was 12,900 tons with an associated value of about $1.7 million. In 2016, trees saved Gainesville resi-dents an estimated $7.7 million dollars in total heating and cooling costs (Table 8).
City of Gainesville Urban Forest Ecological Assessment 2016 • 23

Public Health: Air Pollution RemovalAir pollution in cities causes deleterious health impacts for residents. Some of the most serious air pollutants in urban environments are carbon monoxide (CO), nitrogen dioxide (NO2), ground-level ozone (O3), fine particulate matter (PM2.5), and sulfur dioxide (SO2). Carbon monoxide is a toxic gas that enters the atmosphere through the combustion of fossil fuels (e.g. vehicles and power plants). Nitrogen dioxide is a respiratory irritant, and it is an ingredient in the formation of ground-level ozone (O3; smog). Smog is created in the presence of sunlight, when NO2 and other volatile organic compounds react with one another. This reaction rate increases as temperatures increase. Trees can play a vital role in lowering temperatures in urban areas, reducing the rate of ground-level ozone formation (Nowak & Dwyer, 2007).
Particulate matter less than 2.5 micrometers (PM2.5) consists of suspended microscopic droplets (liquid or solid) that are small enough to be inhaled. PM2.5 is associated with serious respiratory issues when it penetrates into the lungs. Trees improve air quality by intercepting PM2.5 on their leaves. They remove carbon monoxide (CO), nitrogen dioxide (NO2), ozone (O3), and sulfur dioxide (SO2) from the atmosphere through uptake via their leaf stomata.
The i-Tree Eco model estimated that Gainesville’s trees and shrubs remove 846 tons of pollution per year with a value of $2.67 million dollars (Table 9). The model calculates the amount of pollution eliminated from the atmosphere based on 2016 Environmental Protection Agency (EPA) air pollution and weather monitors in Gainesville and assumes pollu-tion reduction does not happen during rain events. Value estimates for CO and PM2.5 were calculated with guidelines suggested by Murray, Marsh, & Bradford (1994) and Ottinger, Wooley, Robinson, Hodas, & Babb (1990). Value estimates for O3, SO2, and NO2 were calculated based on the EPA Benefits Mapping and Analysis Program (BenMAP) model (EPA, 2012).
The BenMAP model estimates the reduction in health impacts and the associated economic ben-efits derived from changes in air quality. Pollutant reduction estimates from i-Tree were used by the BenMAP model to produce estimates of potential savings in health care costs (e.g. reduced inci-dence of respiratory illness and related hospital visits or days lost from work/school). Gainesville’s urban forest reduces air pollution levels resulting in an estimated $2.66 million savings on airborne pollutant related health care costs (Table 10).
NO2 O3 PM2.5 SO2
Tree $15,310 $861,200 $979,900 $1,360
Shrub $7,620 $448,820 $344,500 $730
Subtotal $22,930 $1,310,010 $1,324,400 $2,090
Total $2,659,430
Table 10. Estimated annual economic benefits of reduced health impacts from airborne pollutant reduction by trees and shrubs in the city of Gainesville (BenMAP).
Pollutant Removal (short ton) Value ($)
O3 692 $1,310,010
NO2 102 $22,930
SO2 26 $2,090
PM2.5 22 $1,324,400
CO 4 $6,176
Total 846 $2,665,600
Table 9. Annual pollution removal by the trees and shrubs in Gainesville.
24 • City of Gainesville Urban Forest Ecological Assessment 2016
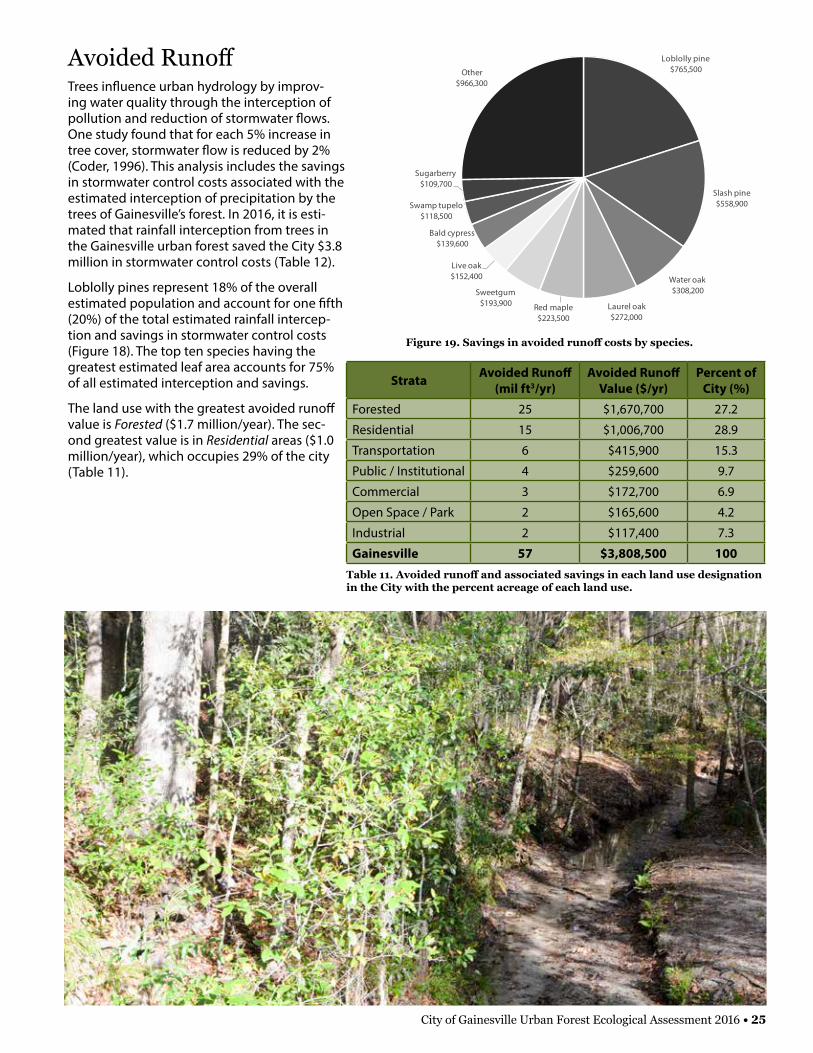
Avoided RunoffTrees influence urban hydrology by improv-ing water quality through the interception of pollution and reduction of stormwater flows. One study found that for each 5% increase in tree cover, stormwater flow is reduced by 2% (Coder, 1996). This analysis includes the savings in stormwater control costs associated with the estimated interception of precipitation by the trees of Gainesville’s forest. In 2016, it is esti-mated that rainfall interception from trees in the Gainesville urban forest saved the City $3.8 million in stormwater control costs (Table 12).
Loblolly pines represent 18% of the overall estimated population and account for one fifth (20%) of the total estimated rainfall intercep-tion and savings in stormwater control costs (Figure 18). The top ten species having the greatest estimated leaf area accounts for 75% of all estimated interception and savings.
The land use with the greatest avoided runoff value is Forested ($1.7 million/year). The sec-ond greatest value is in Residential areas ($1.0 million/year), which occupies 29% of the city (Table 11).
Strata Avoided Runoff (mil ft3/yr)
Avoided Runoff Value ($/yr)
Percent of City (%)
Forested 25 $1,670,700 27.2
Residential 15 $1,006,700 28.9
Transportation 6 $415,900 15.3
Public / Institutional 4 $259,600 9.7
Commercial 3 $172,700 6.9
Open Space / Park 2 $165,600 4.2
Industrial 2 $117,400 7.3
Gainesville 57 $3,808,500 100Table 11. Avoided runoff and associated savings in each land use designation in the City with the percent acreage of each land use.
Figure 19. Savings in avoided runoff costs by species.
Loblolly pine$765,500
Slash pine$558,900
Water oak$308,200
Laurel oak$272,000
Red maple$223,500
Sweetgum$193,900
Live oak$152,400
Bald cypress$139,600
Swamp tupelo$118,500
Sugarberry$109,700
Other$966,300
City of Gainesville Urban Forest Ecological Assessment 2016 • 25

Carbon dioxide (CO2) is a green-house gas that contributes to climate change. During the process of photosynthesis, trees incorporate atmospheric carbon into the tissue in their new growth which is then considered to be sequestered or locked up for the life of the tree or plant part (leaves, branches, trunk, or roots) (Abdollahi, Ning, & Appean-ing, 2000). Carbon sequestration rates vary by species, but healthier and more vigorous trees tend to sequester carbon at higher rates than unhealthy trees. The urban forest of Gainesville is a carbon sink, meaning it stores more carbon than it releases. Net carbon sequestration is the amount of carbon sequestered minus the estimated amount of carbon emitted as dead trees decay.The Eco model estimated that in 2016 Gainesville’s urban forest se-questered or removed 44,200 gross tons of carbon from the atmosphere, valued at $5.88 million.
The rate of carbon sequestration by an individual tree is a function of the tree size, species, and condition. The tree species with the highest rate of carbon sequestration in Gainesville is loblolly pine, which is also the spe-cies that stores the greatest amount of carbon (Figure 20).
669
1,358
2,354
2,510
2,659
3,526
3,647
4,410
6,019
7,766
- 1,000 2,000 3,000 4,000 5,000 6,000 7,000 8,000 9,000
Sugarberry
Bald cypress
Live oak
Swamp tupelo
Sweetgum
Red maple
Water oak
Laurel oak
Slash pine
Loblolly pine
Carbon Sequestration Rate (ton/yr)
Figure 20. Carbon sequestration rates in Gainesville by spe-cies.
The
carb
on emitted in Gainesville in
The
annual carbon emissions from
The
annual carbon emissions from
days
automobiles
single-family homes
25
31,300
12,800
The carbon sequestered annually by Gainesville’s urban forest is equivalent to...
Carbon Sequestration
26 • City of Gainesville Urban Forest Ecological Assessment 2016
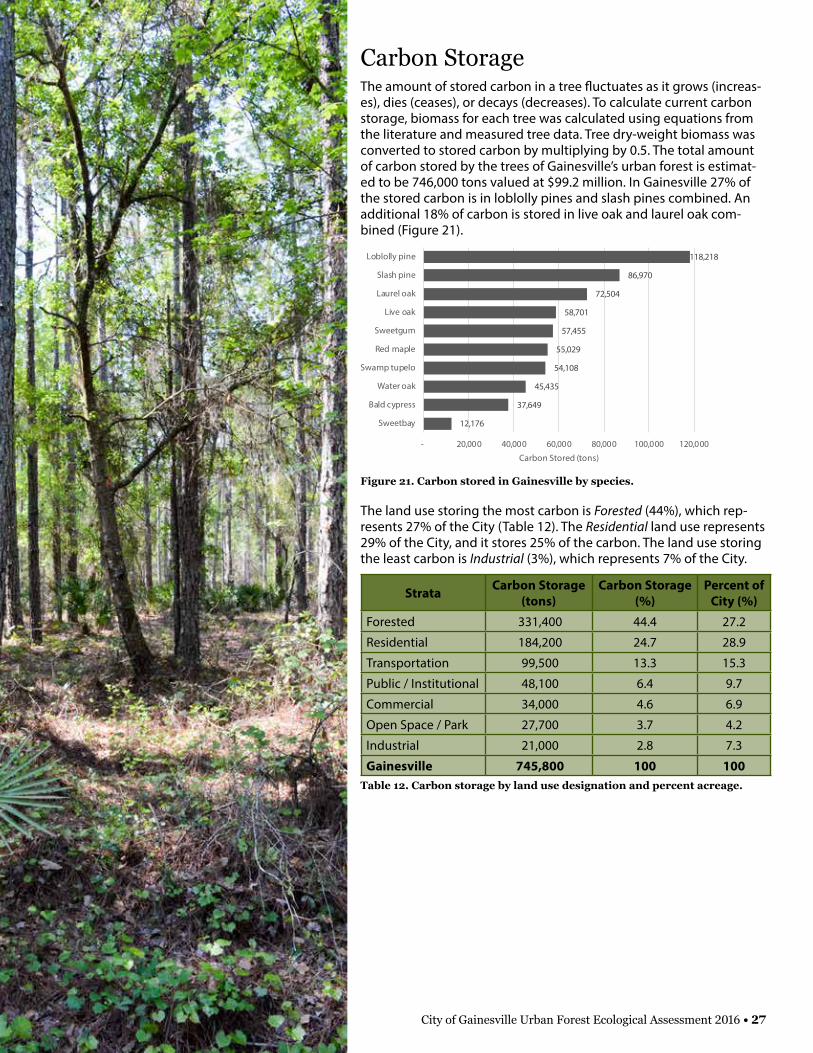
Carbon StorageThe amount of stored carbon in a tree fluctuates as it grows (increas-es), dies (ceases), or decays (decreases). To calculate current carbon storage, biomass for each tree was calculated using equations from the literature and measured tree data. Tree dry-weight biomass was converted to stored carbon by multiplying by 0.5. The total amount of carbon stored by the trees of Gainesville’s urban forest is estimat-ed to be 746,000 tons valued at $99.2 million. In Gainesville 27% of the stored carbon is in loblolly pines and slash pines combined. An additional 18% of carbon is stored in live oak and laurel oak com-bined (Figure 21).
The land use storing the most carbon is Forested (44%), which rep-resents 27% of the City (Table 12). The Residential land use represents 29% of the City, and it stores 25% of the carbon. The land use storing the least carbon is Industrial (3%), which represents 7% of the City.
12,176
37,649
45,435
54,108
55,029
57,455
58,701
72,504
86,970
118,218
- 20,000 40,000 60,000 80,000 100,000 120,000
Sweetbay
Bald cypress
Water oak
Swamp tupelo
Red maple
Sweetgum
Live oak
Laurel oak
Slash pine
Loblolly pine
Carbon Stored (tons)
Figure 21. Carbon stored in Gainesville by species.
Strata Carbon Storage (tons)
Carbon Storage (%)
Percent of City (%)
Forested 331,400 44.4 27.2
Residential 184,200 24.7 28.9
Transportation 99,500 13.3 15.3
Public / Institutional 48,100 6.4 9.7
Commercial 34,000 4.6 6.9
Open Space / Park 27,700 3.7 4.2
Industrial 21,000 2.8 7.3
Gainesville 745,800 100 100Table 12. Carbon storage by land use designation and percent acreage.
City of Gainesville Urban Forest Ecological Assessment 2016 • 27

28 • City of Gainesville Urban Forest Ecological Assessment 2016

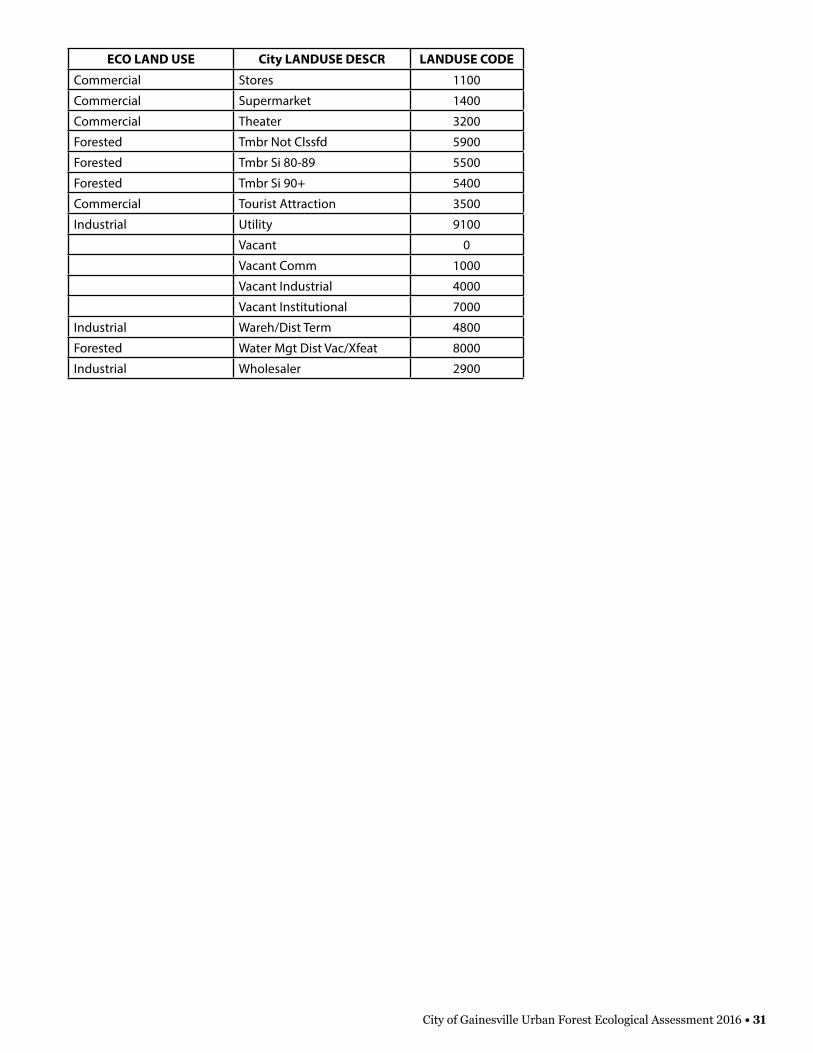
AppendicesAppendix A: Land UseLand use categories were defined for use as strata by the i-Tree Eco model based on land uses and zoning provided by the City in geographic information (GIS) files. Classification of all parcels within the City was done according to the following Eco land use definitions:
ECO Land Use Description
Agriculture Pastures, row crops, or wholesale nurseries
Commercial Retail and professional business uses
Forested Upland and wetland forests, both natural and planted
Industrial Industrial uses including municipal water, waste, and power facilities
Open Space / Park Park and recreational lands, cemeteries, golf courses
Public / Institutional Government offices, hospitals, schools, churches, & other municipal facilities
Residential All forms of housing
Transportation Roads, railroads, and airports
Certain City land use codes directly translated to Eco land uses while others did not. In the table below, blank Eco land uses indicate that more than one classification could have been applied to the City land use, depending on the specific parcel. Some individual parcels were manually classified using GIS layers and aerial photography to aid in the classifica-tion decision.
ECO LAND USE City LANDUSE DESCR LANDUSE CODE
Agriculture Acrg Not Znd Ag 9900
Transportation Airport 2000
Commercial Auto Sales 2700
Industrial Bottler 4500
Commercial Bowling Alley 3400
Public/Institutional Churches 7100
Commercial Clb/Ldg/Un Hall 7700
Public/Institutional College-Wtr Mgt Dist 8400
Residential Common Area 900
Residential Condominium 400
County Vacant/Xfeatures 8010
Public/Institutional County-Sch Brd Vacant/Xf 8011
Cty Inc Nonmuni 8600
Cultural 7900
Commercial Dept Store 1300
Federal 8800
Federal Vacant/Xfeatures 8040
Commercial Financial 2300
Commercial Florist 3000
Commercial Food Processing 4600
Open Space/Park Forest/Pk/Rec-Wtr Mgt Dst 8200
Open Space/Park Golf Course 3800
Agriculture Grzgsoil Class2 6100
Industrial Heavy Mfg 4200
Public/Institutional Hospital 8500
Commercial Insurance 2400
City of Gainesville Urban Forest Ecological Assessment 2016 • 29

ECO LAND USE City LANDUSE DESCR LANDUSE CODE
Industrial Light Mfg 4100
Industrial Lumber Yd/Mill 4300
Residential MFR <10 Units 800
Industrial Min Processing 4700
Industrial Ming/Pet/Gaslnd 9200
Residential Misc. Residence 700
Residential Mobile Home 200
Open Space/Park Mort/Cemetary 7600
Commercial Motel 3900
Residential Multifamily 300
Municipal 8900
Municipal Vacant/Xfeature 8050
Commercial Night Clubs 3300
Public/Institutional Nursing Home 7400
Commercial Off Multistory 1800
Commercial Office 1 Story 1700
Commercial Open Storage 4900
Agriculture Orn/Misc Agri 6900
Commercial Orphng/Non-Prof 7500
Other Public Vac/Xfeature 8090
Open Space/Park Outdr Rec/Pk Ld 9700
Commercial Pkg Lot (Comm) 2800
Commercial Post Office 1701
Commercial Prof Offices 1900
Public/Institutional Prv Hospital 7300
Public/Institutional Prv Schl/Coll 7200
Public/Institutional Pub Cty School 8300
Transportation Railroad Owned-Local Assd 9110
Commercial Rest, Drive-in 2200
Commercial Restaurant 2100
Residential Retirement 600
Transportation Right-Of-Way 9400
Residential Sani/ Rest Home 7800
Commercial Serv Stations 2600
Commercial Service Shops 2500
Industrial Sewg/Waste Land 9600
Commercial Sh Ctr Cmmity 1600
Commercial Sh Ctr Nbhd 1601
Commercial Sh Ctr Regional 1500
Residential Single Family 100
State Of Fla - TIITF 8701
State(Not TIITF)Vac/Xf 8020
State(TIITF) Vacant/Xf 8030
State-Not TIITF 8700
Commercial Store/Off/Res 1200
30 • City of Gainesville Urban Forest Ecological Assessment 2016
ECO LAND USE City LANDUSE DESCR LANDUSE CODE
Commercial Stores 1100
Commercial Supermarket 1400
Commercial Theater 3200
Forested Tmbr Not Clssfd 5900
Forested Tmbr Si 80-89 5500
Forested Tmbr Si 90+ 5400
Commercial Tourist Attraction 3500
Industrial Utility 9100
Vacant 0
Vacant Comm 1000
Vacant Industrial 4000
Vacant Institutional 7000
Industrial Wareh/Dist Term 4800
Forested Water Mgt Dist Vac/Xfeat 8000
Industrial Wholesaler 2900
City of Gainesville Urban Forest Ecological Assessment 2016 • 31

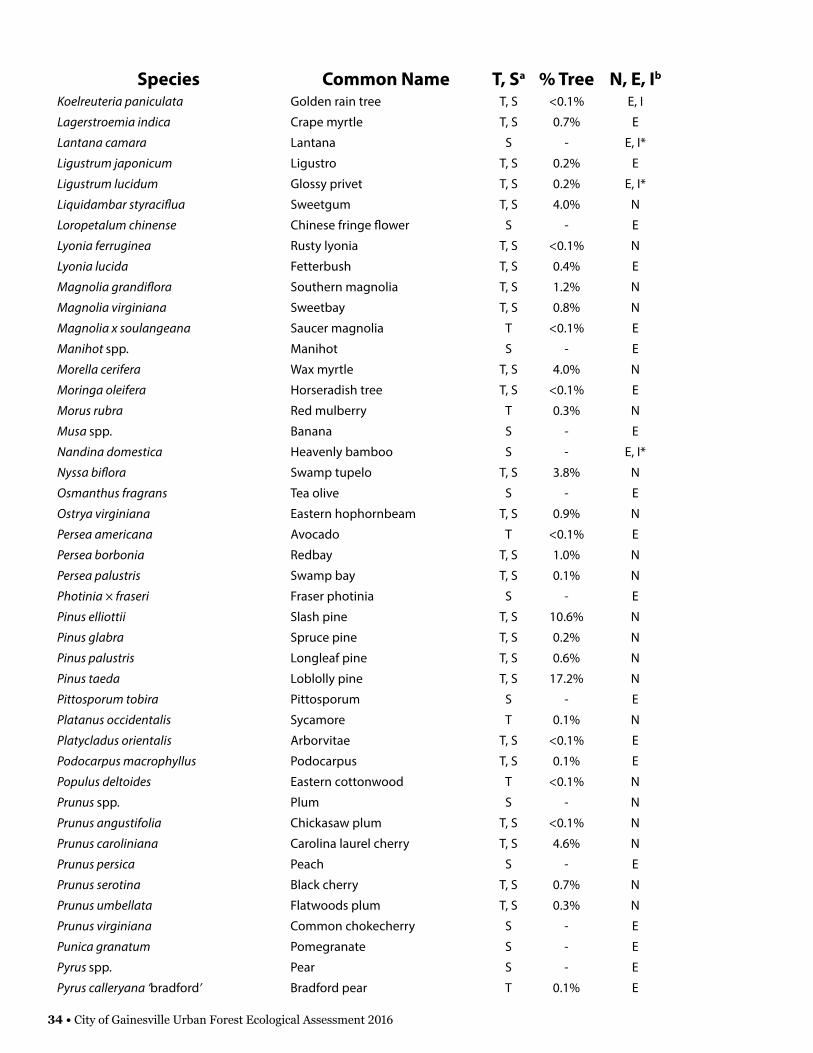
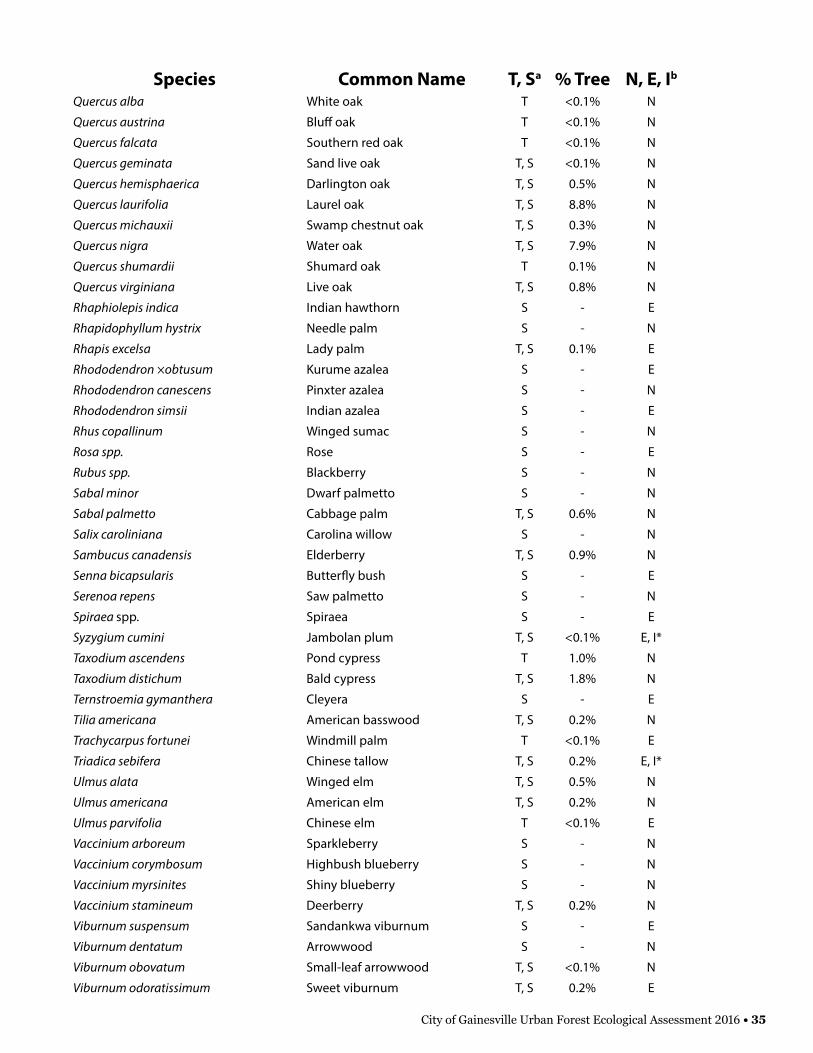
Appendix B: Ecological Assessment Species Level Results
Tree species identified in Gainesville’s urban forest:
a Tree, Shrub strata
b Native, Exotic (non-native), and Invasive status
*Category I Invasive Species
Species Common Name T, Sa % Tree N, E, Ib
Abelia chinensis Abelia S - E
Acca sellowiana Feijoa S - E
Acer floridanum Florida maple T, S 0.1% N
Acer negundo Boxelder T, S 0.7% N
Acer rubrum Red maple T, S 7.5% N
Acoelorrhaphe wrightii Paurotis palm T, S <0.1% N
Aesculus pavia Red buckeye T, S <0.1% N
Albizia julibrissin Mimosa T, S 0.1% E, I*
Aralia spinosa Devils walking stick T, S 0.1% N
Ardisia crenata Coral ardisia S - E, I*
Asimina angustifolia Slimleaf pawpaw S - N
Asimina parviflora Smallflower pawpaw S - N
Asimina reticulata Netted pawpaw S - N
Asimina triloba Common pawpaw S - N
Baccharis halimifolia Saltbush T, S <0.1% N
Bambusa spp. Bamboo S - E
Betula nigra River birch T <0.1% N
Bismarckia nobilis Bismarck palm T <0.1% E
Broussonetia papyrifera Paper mulberry T, S 0.2% E, I
Bumelia spp. Bumelia T, S <0.1% N
Bumelia lanuginosa Chittamwood S - N
Butia capitata Jelly palm T, S <0.1% E
Buxus microphyllus Boxwood S - E
Cajanus spp. Pigeon pea S - E
Callicarpa americana American beautyberry S - N
Camellia japonica Camellia T, S 0.1% E
Camellia sasanqua Sasanqua camellia S - E
Carpinus caroliniana American hornbeam T, S 0.9% N
Carya glabra Pignut hickory T, S 0.3% N
Carya illinoinensis Pecan T, S 0.9% N
Carya tomentosa Mockernut hickory T, S <0.1% N
Celtis laevigata Sugarberry T, S 2.0% N
Cephalanthus occidentalis Button bush T, S 0.3% N
Cercis canadensis Eastern redbud T, S 0.2% N
Chamaerops humilis European fan palm S - E
Chionanthus virginicus Fringe tree T, S <0.1% N
Cinnamomum camphora Camphor tree T, S 0.9% E, I*
32 • City of Gainesville Urban Forest Ecological Assessment 2016

Species Common Name T, Sa % Tree N, E, Ib
Citrus spp. Citrus T, S <0.1% E
Citrus aurantium Sour orange S - E
Citrus limon Lemon S - E
Clerodendrum spp. Glorybower S - E
Cornus florida Flowering dogwood T, S 0.1% N
Cornus foemina Swamp dogwood T, S 0.1% N
Crataegus spp. Hawthorn T, S <0.1% N
Crataegus marshallii Parsley hawthorn T, S 0.2% N
Cycas revoluta Sago palm S - E
Cyrilla racemiflora Swamp titi S - N
Diospyros spp. Persimmon S - E
Diospyros virginiana Common persimmon T, S <0.1% N
Duranta erecta Golden dewdrop S - E
Dypsis lutescens Areca palm S - E
Elaeagnus pungens Thorny elaeagnus S - E, I
Eriobotrya japonica Loquat tree T, S <0.1% E
Euonymus americanus American strawberry bush S - N
Ficus carica Common fig S - E
Ficus pumila Climbing fig S - E
Fraxinus americana White ash T 0.5% N
Fraxinus pennsylvanica Green ash T, S 0.7% N
Gardenia jasminoides Cape jasmine S - E
Gaylussacia dumosa Dwarf huckleberry S - N
Gaylussacia frondosa Blue huckleberry S - N
Gordonia lasianthus Loblolly bay T, S 0.7% N
Hamelia patens Firebush S - N
Hibiscus rosa-sinensis Chinese hibiscus S - E
Hypericum spp. St. John’s wort S - N
Ilex cassine Dahoon T, S 1.7% N
Ilex cornuta Chinese holly S - E
Ilex glabra Gallberry S - N
Ilex myrtifolia Myrtle dahoon T <0.1% N
Ilex opaca American holly T, S <0.1% N
Ilex ×attenuata ‘Savannah’ Savannah holly T <0.1% N
Ilex vomitoria Yaupon holly T, S 0.4% N
Ilex ×attenuata ‘Fosteri’ Foster’s holly S - N
Illicium parviflorum Yellow anise S - N
Itea virginica Virginia sweetspire S - N
Ixora coccinea Ixora S - E
Juniperus spp. Juniper S - E
Juniperus chinensis Chinese juniper S - E
Juniperus chinensis ‘Torulosa’ Hollywood juniper T <0.1% E
Juniperus conferta ‘Blue Pacific’ Shore juniper S - E
Juniperus virginiana Eastern red cedar T, S 0.3% N
City of Gainesville Urban Forest Ecological Assessment 2016 • 33
Species Common Name T, Sa % Tree N, E, Ib
Koelreuteria paniculata Golden rain tree T, S <0.1% E, I
Lagerstroemia indica Crape myrtle T, S 0.7% E
Lantana camara Lantana S - E, I*
Ligustrum japonicum Ligustro T, S 0.2% E
Ligustrum lucidum Glossy privet T, S 0.2% E, I*
Liquidambar styraciflua Sweetgum T, S 4.0% N
Loropetalum chinense Chinese fringe flower S - E
Lyonia ferruginea Rusty lyonia T, S <0.1% N
Lyonia lucida Fetterbush T, S 0.4% E
Magnolia grandiflora Southern magnolia T, S 1.2% N
Magnolia virginiana Sweetbay T, S 0.8% N
Magnolia x soulangeana Saucer magnolia T <0.1% E
Manihot spp. Manihot S - E
Morella cerifera Wax myrtle T, S 4.0% N
Moringa oleifera Horseradish tree T, S <0.1% E
Morus rubra Red mulberry T 0.3% N
Musa spp. Banana S - E
Nandina domestica Heavenly bamboo S - E, I*
Nyssa biflora Swamp tupelo T, S 3.8% N
Osmanthus fragrans Tea olive S - E
Ostrya virginiana Eastern hophornbeam T, S 0.9% N
Persea americana Avocado T <0.1% E
Persea borbonia Redbay T, S 1.0% N
Persea palustris Swamp bay T, S 0.1% N
Photinia × fraseri Fraser photinia S - E
Pinus elliottii Slash pine T, S 10.6% N
Pinus glabra Spruce pine T, S 0.2% N
Pinus palustris Longleaf pine T, S 0.6% N
Pinus taeda Loblolly pine T, S 17.2% N
Pittosporum tobira Pittosporum S - E
Platanus occidentalis Sycamore T 0.1% N
Platycladus orientalis Arborvitae T, S <0.1% E
Podocarpus macrophyllus Podocarpus T, S 0.1% E
Populus deltoides Eastern cottonwood T <0.1% N
Prunus spp. Plum S - N
Prunus angustifolia Chickasaw plum T, S <0.1% N
Prunus caroliniana Carolina laurel cherry T, S 4.6% N
Prunus persica Peach S - E
Prunus serotina Black cherry T, S 0.7% N
Prunus umbellata Flatwoods plum T, S 0.3% N
Prunus virginiana Common chokecherry S - E
Punica granatum Pomegranate S - E
Pyrus spp. Pear S - E
Pyrus calleryana ‘bradford’ Bradford pear T 0.1% E
34 • City of Gainesville Urban Forest Ecological Assessment 2016
Species Common Name T, Sa % Tree N, E, Ib
Quercus alba White oak T <0.1% N
Quercus austrina Bluff oak T <0.1% N
Quercus falcata Southern red oak T <0.1% N
Quercus geminata Sand live oak T, S <0.1% N
Quercus hemisphaerica Darlington oak T, S 0.5% N
Quercus laurifolia Laurel oak T, S 8.8% N
Quercus michauxii Swamp chestnut oak T, S 0.3% N
Quercus nigra Water oak T, S 7.9% N
Quercus shumardii Shumard oak T 0.1% N
Quercus virginiana Live oak T, S 0.8% N
Rhaphiolepis indica Indian hawthorn S - E
Rhapidophyllum hystrix Needle palm S - N
Rhapis excelsa Lady palm T, S 0.1% E
Rhododendron ×obtusum Kurume azalea S - E
Rhododendron canescens Pinxter azalea S - N
Rhododendron simsii Indian azalea S - E
Rhus copallinum Winged sumac S - N
Rosa spp. Rose S - E
Rubus spp. Blackberry S - N
Sabal minor Dwarf palmetto S - N
Sabal palmetto Cabbage palm T, S 0.6% N
Salix caroliniana Carolina willow S - N
Sambucus canadensis Elderberry T, S 0.9% N
Senna bicapsularis Butterfly bush S - E
Serenoa repens Saw palmetto S - N
Spiraea spp. Spiraea S - E
Syzygium cumini Jambolan plum T, S <0.1% E, I*
Taxodium ascendens Pond cypress T 1.0% N
Taxodium distichum Bald cypress T, S 1.8% N
Ternstroemia gymanthera Cleyera S - E
Tilia americana American basswood T, S 0.2% N
Trachycarpus fortunei Windmill palm T <0.1% E
Triadica sebifera Chinese tallow T, S 0.2% E, I*
Ulmus alata Winged elm T, S 0.5% N
Ulmus americana American elm T, S 0.2% N
Ulmus parvifolia Chinese elm T <0.1% E
Vaccinium arboreum Sparkleberry S - N
Vaccinium corymbosum Highbush blueberry S - N
Vaccinium myrsinites Shiny blueberry S - N
Vaccinium stamineum Deerberry T, S 0.2% N
Viburnum suspensum Sandankwa viburnum S - E
Viburnum dentatum Arrowwood S - N
Viburnum obovatum Small-leaf arrowwood T, S <0.1% N
Viburnum odoratissimum Sweet viburnum T, S 0.2% E
City of Gainesville Urban Forest Ecological Assessment 2016 • 35

Species Common Name T, Sa % Tree N, E, Ib
Viburnum rufidulum Rusty blackhaw T, S 0.1% N
Yucca aloifolia Spanish bayonet S - N
Zanthoxylum americanum Hercules’ club S - N
Ziziphus mauritiana Indian jujube S - E
36 • City of Gainesville Urban Forest Ecological Assessment 2016
Appendix C: Gainesville Tree Canopy Assessment Using Remote Sensing MethodsAuthors: Shawn Landry and Qiuyan Yu, University of South Florida
IntroductionThe purpose of this project was to utilize relatively low-cost remote sensing methods to quantify tree canopy coverage and change in Gainesville. Through the acquisition and analysis of moderate-resolution Landsat imagery, urban forest canopy coverage was mapped for 1996, 2006 and 2015 and also reported as canopy change over these time periods. The original intent was to use 1995, 2005 and 2015 time periods, but cloud-free Landsat imagery was unavailable for the 1995 and 2006 (see below). Since Landsat imagery is known to underestimate tree canopy cover, very-high reso-lution aerial imagery from the National Agriculture Imagery Program (NAIP) was utilized with a dot-based method to develop accurate estimates citywide tree canopy cover for 2016 and 2015. Future work efforts, with additional funding, could utilize the very-high resolution aerial imagery to develop detailed land cover maps for exploration of tree cover and change at the resolution of the property parcel.
Accurate Estimate of Citywide Tree Canopy CoverCitywide tree canopy in the City of Gainesville was accurately estimated using a dot-based sampling approach with NAIP aerial photographic imagery from 2006 and 2015 (Figure 1). This approach to estimate citywide tree canopy cover followed the “dot-based” estimation methods described by David Nowak and colleagues from the U.S. Forest Service (Nowak et al. 1996, Nowak and Greenfield 2012). The dot-based approach has been shown to be a very accurate and consistent method of characterizing canopy cover and change (Landry et al. 2013) A total of 1500 dots were randomly placed within the Gainesville boundary. At each location, a dot was photo-interpreted as “canopy” or “not canopy” by a trained photo-interpreter using 2006 NAIP and separately with 2015 NAIP. A subsample of 500 dots were independent-ly classified a second time as a method to test the verification error. Dots located within the tree canopy were classified as canopy, while dots located on other vegetation or other surfaces were classified as no canopy.
In 2006, 748 out of 1500 dots were classified as canopy, while 808 out of 1500 dots were canopy in 2015 (Table 1). The standard error is 1.3% for both 2006 and 2015 dot methods. Citywide tree canopy coverage was thus 49.9% +/- 1.3% (48.6 – 51.2%) in 2006 and 53.9% +/- 1.3% (52.6 – 55.2%) in 2015. These results suggest a small increase in tree canopy cover within the City of Gainesville between 2006 and 2015.
Moderate Resolution Tree Cover Mapping Measurements of tree canopy cover over time can provide an indicator of the geographic distribution of urban forest benefits within different areas of the city and how it has changed over time. The use of moderate-resolution satellite imagery such as Landsat have been shown to underestimate urban tree canopy cover (i.e., 30 meter pixels compared to 1 meter pixels for the NAIP imagery). However, the use of Landsat provides a consistent long-term measurement of change for several decades prior to the availability of high-resolution mapping techniques.
Landsat Data downloadLandsat data were acquired from United States Geological Survey (http://earthexplorer.usgs.gov/) for 5/6/1996, 5/2/2006 and 5/11/2015 as shown in Figure 2. Although the original intent was to focus on 1995 and 2005, Landsat scenes acquired in summer of 1995 and 2005 were covered by clouds over the study area as shown in the Appendix.
Table 1. Count of canopy and non-canopy of both 2006 and 2015.
2006 NAIP 2015 NAIPCanopy 748 (49.9% +/- 1.3%) 808 (53.9% +/- 1.3%))Non-Canopy 752 (50.1%) 692 (46.1%)Total 1500 1500
City of Gainesville Urban Forest Ecological Assessment 2016 • 37
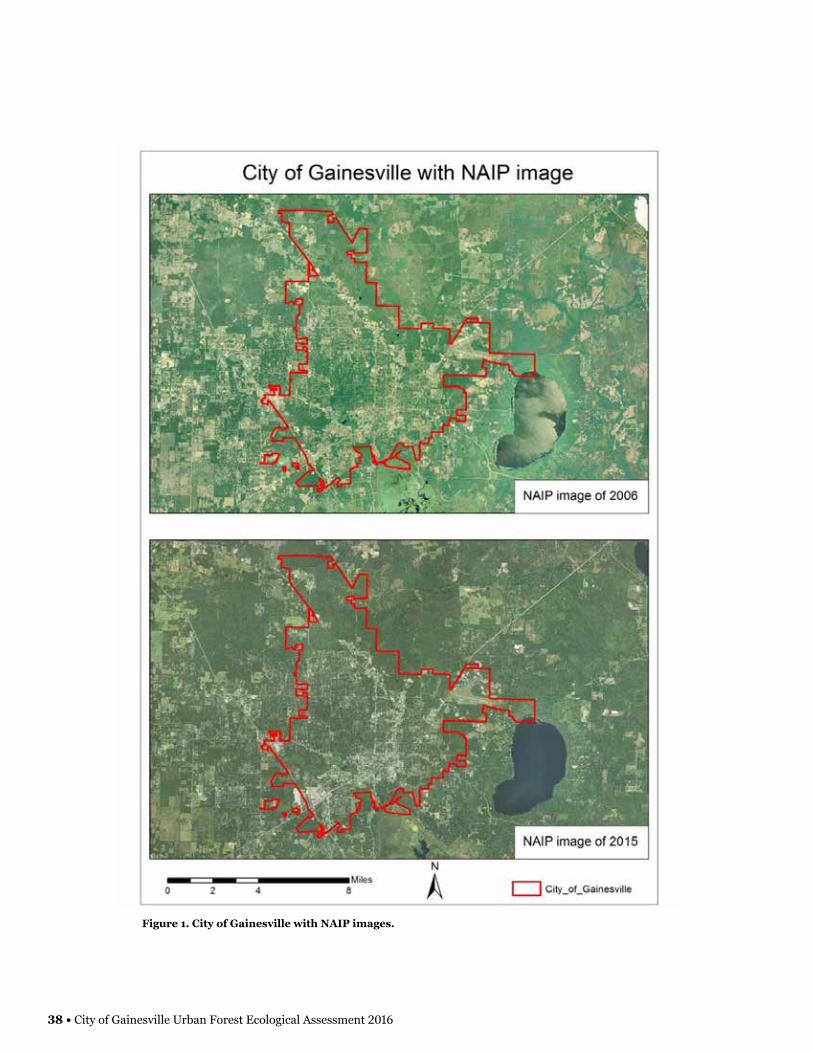
Figure 1. City of Gainesville with NAIP images.
38 • City of Gainesville Urban Forest Ecological Assessment 2016
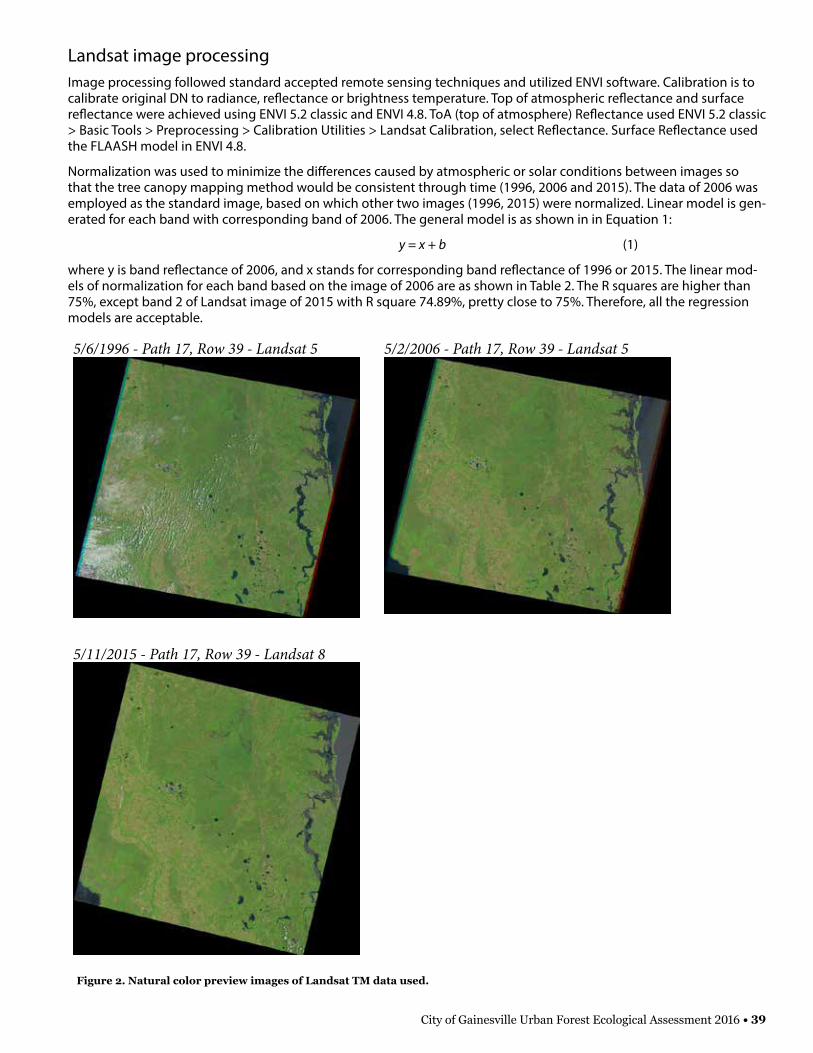
Landsat image processingImage processing followed standard accepted remote sensing techniques and utilized ENVI software. Calibration is to calibrate original DN to radiance, reflectance or brightness temperature. Top of atmospheric reflectance and surface reflectance were achieved using ENVI 5.2 classic and ENVI 4.8. ToA (top of atmosphere) Reflectance used ENVI 5.2 classic > Basic Tools > Preprocessing > Calibration Utilities > Landsat Calibration, select Reflectance. Surface Reflectance used the FLAASH model in ENVI 4.8.
Normalization was used to minimize the differences caused by atmospheric or solar conditions between images so that the tree canopy mapping method would be consistent through time (1996, 2006 and 2015). The data of 2006 was employed as the standard image, based on which other two images (1996, 2015) were normalized. Linear model is gen-erated for each band with corresponding band of 2006. The general model is as shown in in Equation 1:
y = x + b (1)
where y is band reflectance of 2006, and x stands for corresponding band reflectance of 1996 or 2015. The linear mod-els of normalization for each band based on the image of 2006 are as shown in Table 2. The R squares are higher than 75%, except band 2 of Landsat image of 2015 with R square 74.89%, pretty close to 75%. Therefore, all the regression models are acceptable.
5/6/1996 - Path 17, Row 39 - Landsat 5 5/2/2006 - Path 17, Row 39 - Landsat 5
5/11/2015 - Path 17, Row 39 - Landsat 8
Figure 2. Natural color preview images of Landsat TM data used.
City of Gainesville Urban Forest Ecological Assessment 2016 • 39
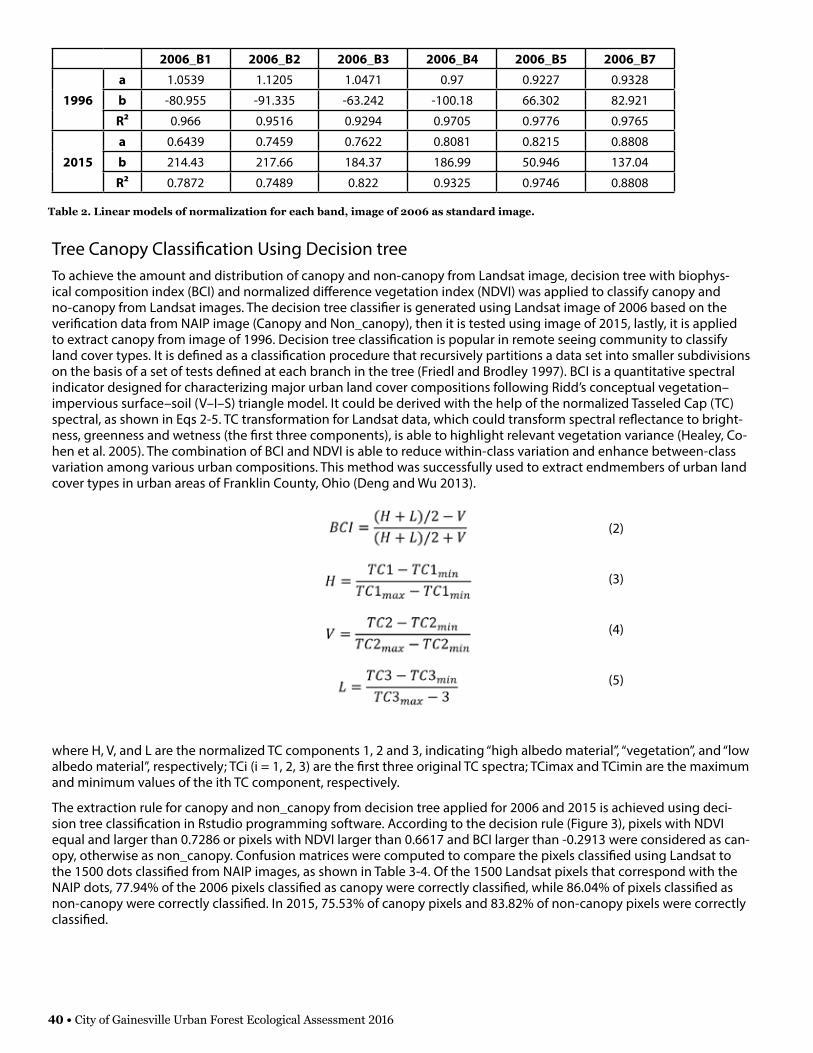
2006_B1 2006_B2 2006_B3 2006_B4 2006_B5 2006_B7
1996
a 1.0539 1.1205 1.0471 0.97 0.9227 0.9328
b -80.955 -91.335 -63.242 -100.18 66.302 82.921
R² 0.966 0.9516 0.9294 0.9705 0.9776 0.9765
2015
a 0.6439 0.7459 0.7622 0.8081 0.8215 0.8808
b 214.43 217.66 184.37 186.99 50.946 137.04
R² 0.7872 0.7489 0.822 0.9325 0.9746 0.8808
Tree Canopy Classification Using Decision treeTo achieve the amount and distribution of canopy and non-canopy from Landsat image, decision tree with biophys-ical composition index (BCI) and normalized difference vegetation index (NDVI) was applied to classify canopy and no-canopy from Landsat images. The decision tree classifier is generated using Landsat image of 2006 based on the verification data from NAIP image (Canopy and Non_canopy), then it is tested using image of 2015, lastly, it is applied to extract canopy from image of 1996. Decision tree classification is popular in remote seeing community to classify land cover types. It is defined as a classification procedure that recursively partitions a data set into smaller subdivisions on the basis of a set of tests defined at each branch in the tree (Friedl and Brodley 1997). BCI is a quantitative spectral indicator designed for characterizing major urban land cover compositions following Ridd’s conceptual vegetation–impervious surface–soil (V–I–S) triangle model. It could be derived with the help of the normalized Tasseled Cap (TC) spectral, as shown in Eqs 2-5. TC transformation for Landsat data, which could transform spectral reflectance to bright-ness, greenness and wetness (the first three components), is able to highlight relevant vegetation variance (Healey, Co-hen et al. 2005). The combination of BCI and NDVI is able to reduce within-class variation and enhance between-class variation among various urban compositions. This method was successfully used to extract endmembers of urban land cover types in urban areas of Franklin County, Ohio (Deng and Wu 2013).
(2)
(3)
(4)
(5)
where H, V, and L are the normalized TC components 1, 2 and 3, indicating “high albedo material”, “vegetation”, and “low albedo material”, respectively; TCi (i = 1, 2, 3) are the first three original TC spectra; TCimax and TCimin are the maximum and minimum values of the ith TC component, respectively.
The extraction rule for canopy and non_canopy from decision tree applied for 2006 and 2015 is achieved using deci-sion tree classification in Rstudio programming software. According to the decision rule (Figure 3), pixels with NDVI equal and larger than 0.7286 or pixels with NDVI larger than 0.6617 and BCI larger than -0.2913 were considered as can-opy, otherwise as non_canopy. Confusion matrices were computed to compare the pixels classified using Landsat to the 1500 dots classified from NAIP images, as shown in Table 3-4. Of the 1500 Landsat pixels that correspond with the NAIP dots, 77.94% of the 2006 pixels classified as canopy were correctly classified, while 86.04% of pixels classified as non-canopy were correctly classified. In 2015, 75.53% of canopy pixels and 83.82% of non-canopy pixels were correctly classified.
Table 2. Linear models of normalization for each band, image of 2006 as standard image.
40 • City of Gainesville Urban Forest Ecological Assessment 2016

Tree Cover ResultsThe decision tree classifier was applied to whole study area (City of Gainesville) for 1996, 2006 and 2015. The distribu-tion of canopy and non-canopy in 1996, 2006 and 2015 is shown in Figure 4-6. The amount of canopy from 1996 to 2006 was decreased and then increased a small portion from 2006 to 2015 (Table 5). Total area in the City of Gainesville as of 2016 is approximately 165 Km2. Because of the lower accuracy of Landsat-based results, all numbers are rounded to the nearest percent or nearest square kilometer.
Figure 3. Decision tree rule for 2006
Table 3. Classification confusion matrix on pixel.
n=1500 True 2006 True 2015Class Canopy Non_canopy Total Canopy Non_canopy TotalPredictedUsing Landsat
Canopy 583 105 688 565 112 677Non_canopy 165 647 812 243 580 823Total 748 752 1500 808 692 1500
n=1500 True 2006 (Percent) True 2015 (Percent)Class Canopy Non-Canopy Total Canopy Non_canopy TotalPredict-ed using Landsat (Percent)
Canopy 77.94 14.04 45.87 75.53 14.97 45.13Non-canopy 22.06 86.04 54.13 30.07 83.82 54.87
Total 100 100 100 100 100 100
Table 4. Classification confusion matrix on percent.
City of Gainesville Urban Forest Ecological Assessment 2016 • 41

The results of the Landsat classification results, as expected, show less canopy than the dot-based analysis that used the higher resolution NAIP imagery. Results for the 2006 NAIP showed 49.9% +/- 1.3% canopy, compared to 46% cano-py estimated from 2006 Landsat; and 53.9% +/- 1.3% canopy from the 2015 NAIP compared to 47% canopy estimated from 2015 Landsat. A comparison of the image resolution as shown in Figure 4 illustrated how Landsat results underes-timate tree canopy within highly heterogeneous areas of the City. As previously discussed, despite the underestimation of canopy from the Landsat images, the temporal trend results are valuable. A full land cover classification from the NAIP imagery would be necessary to estimate canopy with greater accuracy for individual neighborhoods in the City.
Table 5. Classification result from Landsat images for the City of Gainesville using decision tree.
Landsat 1996 Landsat 2006 Landsat 2015Canopy (%) 58 % (96 Km2) 46 % (76 Km2) 47 % (78 Km2)Non-canopy (%) 42 % (69 Km2) 54 % (89 Km2) 53 % (87 Km2)
Figure 4. 2015 NAIP imagery (left), 2015 Landsat (middle) and mapped canopy from Landsat.
42 • City of Gainesville Urban Forest Ecological Assessment 2016
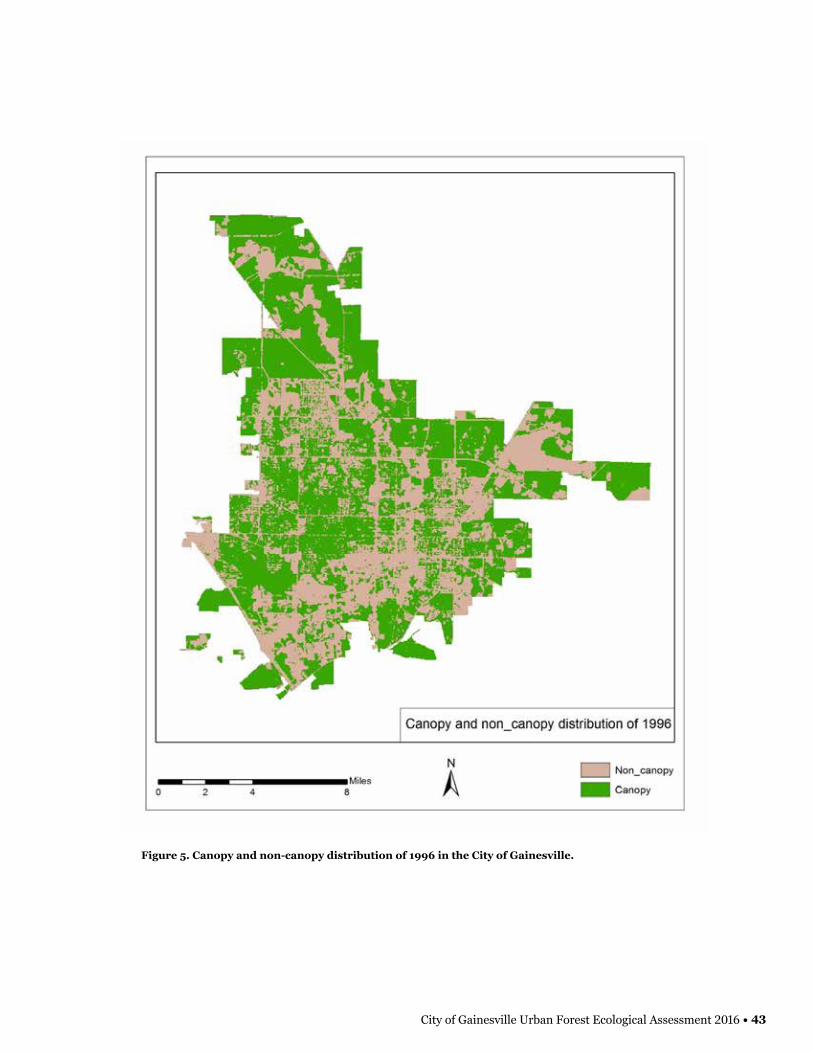
Figure 5. Canopy and non-canopy distribution of 1996 in the City of Gainesville.
City of Gainesville Urban Forest Ecological Assessment 2016 • 43

Figure 6. Canopy and non-canopy distribution of 2006 in the City of Gainesville.
44 • City of Gainesville Urban Forest Ecological Assessment 2016
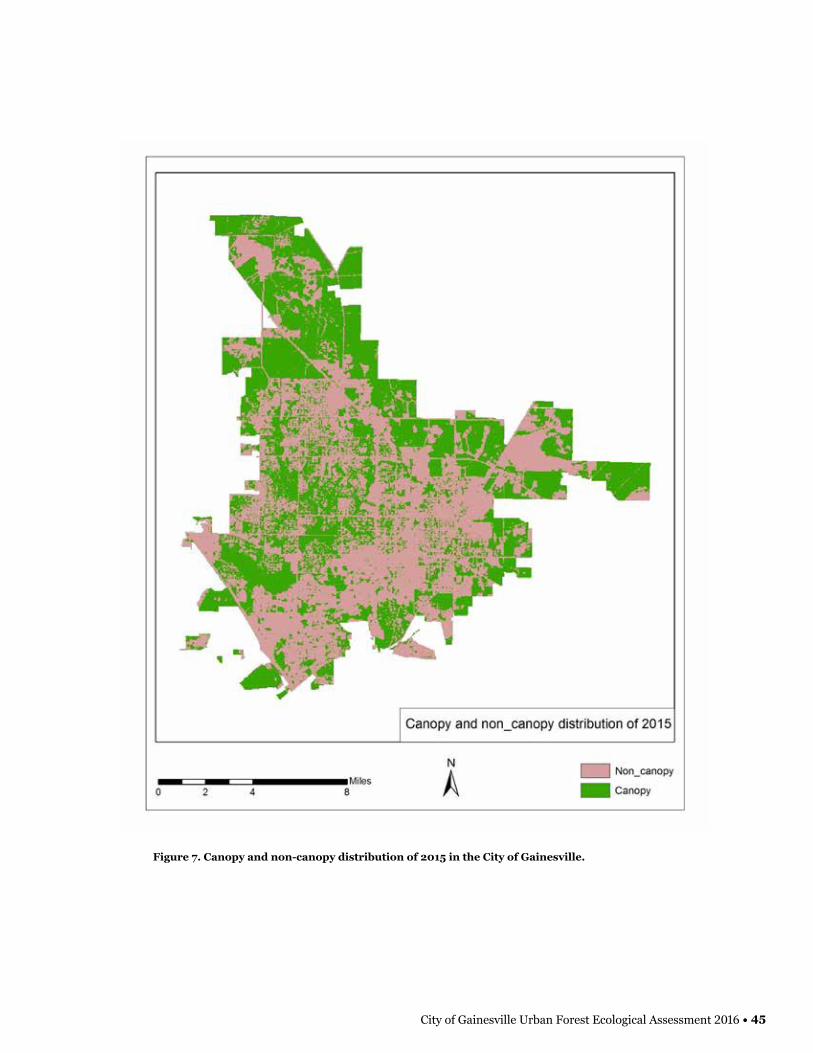
Figure 7. Canopy and non-canopy distribution of 2015 in the City of Gainesville.
City of Gainesville Urban Forest Ecological Assessment 2016 • 45

Tree Cover ChangeThe canopy in the City of Gainesville decreased from 1996 to 2015. There was an overall net loss in tree canopy from 1996 to 2006, and then a net gain in tree canopy from 2006 to 2015 (Table 6). The distribution of canopy change from 1996 to 2015, from 1996-2015 and from 2006 to 2015 is shown in Figures 7, 8 and 9, respectively.
Canopy gain km2(%) Canopy loss km2(%) No change km2(%)1996 to 2015 8 (5%) 25 (15%) 132 (80%)1996 to 2006 8 (5%) 27 (16%) 130 (79%)2006 to 2015 15 (9%) 13 (8%) 137 (83%)
Figure 8. Canopy change distribution from 1996 to 2015 in the City of Gainesville.
Table 6. Canopy change in the City of Gainesville.
46 • City of Gainesville Urban Forest Ecological Assessment 2016
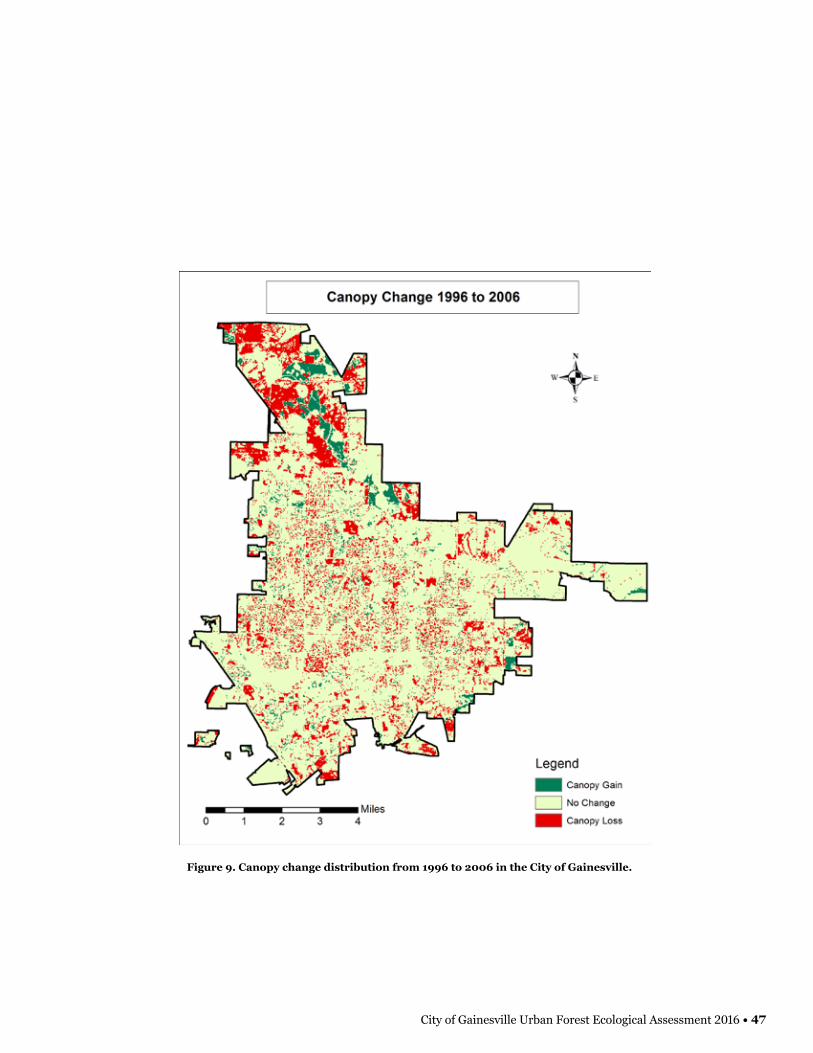
Figure 9. Canopy change distribution from 1996 to 2006 in the City of Gainesville.
City of Gainesville Urban Forest Ecological Assessment 2016 • 47

Figure 10. Canopy change distribution from 2006 to 2015 in the City of Gainesville.
48 • City of Gainesville Urban Forest Ecological Assessment 2016
Remote Sensing Analysis References
Deng, C. and C. Wu (2013). “A spatially adaptive spectral mixture analysis for mapping subpixel urban impervious sur-face distribution.” Remote Sensing of Environment 133: 62-70.
Friedl, M. A. and C. E. Brodley (1997). “Decision tree classification of land cover from remotely sensed data.” Remote Sensing of Environment 61(3): 399-409.
Healey, S. P., W. B. Cohen, Y. Zhiqiang and O. N. Krankina (2005). “Comparison of Tasseled Cap-based Landsat data struc-tures for use in forest disturbance detection.” Remote Sensing of Environment 97(3): 301-310.
Landry, S., R. J. Northrop, M. Andreu and C. C. Rhodes (2013). City of Tampa 2011 Urban Forest Analysis: The Structure, Composition, Function and Economic Benefits of Trees and the Urban Forest. Final Report to the City of Tampa, Sep-tember 2013. City of Tampa, Florida.
Nowak, D. J., R. A. Rowntree, E. G. McPherson, S. M. Sisinni, E. R. Kerkmann and J. C. Stevens (1996). “Measuring and analyzing urban tree cover.” Landscape and Urban Planning 36(1): 49-57.
Nowak, D. J. and E. J. Greenfield (2012). “Tree and impervious cover change in U.S. cities.” Urban Forestry & Urban Greening 11(1): 21-30.
City of Gainesville Urban Forest Ecological Assessment 2016 • 49

Remote Sensing Analysis Appendix: Landsat images with cloud cover in 1995 and 2005
5/4/1995 6/21/1995
7/7/1995 8/8/1995
9/9/1995 9/25/1995Figure 1. Landsat TM data acquired in summer of 1995 covered by clouds.
50 • City of Gainesville Urban Forest Ecological Assessment 2016

Figure 2. Landsat TM data acquired in summer of 2005 covered by clouds.
5/15/2005 6/16/2005
7/18/2005 8/19/2005
9/4/2005 9/20/2005
City of Gainesville Urban Forest Ecological Assessment 2016 • 51
References
Abdollahi, K., Ning, Z., & Appeaning, A. e. (2000). Global climate change and the urban forest. Baton Rouge, LA: GCRCC and Franklin Press.
Alberti, M. (2008). Advances in Urban Ecology: Integrating Humans and Ecological Processes in urban Ecosystems. Seattle: University of Washington.
Cervone, S. (2003). Aquifers. Retrieved from Center for Aquatic and Invasive Plants, University of Florida and the Bureau of Invasive Plant Managment, Florida Department of Environmental Protection: http://plants.ifas.ufl.edu/guide/aquifers.html
Coder, R. (1996). Identified Benefits of Community Trees and Forests. Athens: The University of Georgia.
Ekpe, E., E. Becker, J. Lab, R. Hinkle, and F. Escobedo. 2012. Orlando, Florida’s Urban and Community Forests and Their Ecosystem Services. University of Florida- IFAS, EDIS. FOR 290.
EPA. (2012). Environmental Benefits Mapping and Analysis Program User’s Manual. Research Triangle Park, North Caro-lina: United States Environmental Protection Agency.
Escobedo, F., Kroeger, T., & Wagner, E. (2011). Urban forests and pollution mitigation: Analyzing ecosystem services and disservices. Environmental Pollution, 159, 2078-2087.
Florida Exotic Pest Plant Council Invasive Plant Lists. (2016). Retrieved from FLEPPC.
FNAI Guide to the Natural Communities of Florida. (2010). Florida Natural Areas Inventory.
Interagency Working Group on Social Cost of Carbon, U. G. (2010). Technical Support Document: Social Cost of Carbon for Regulatory Impact Analysis Under Executive Order 12866. Retrieved from http://www.epa.gov/oms/climate/reg-ulations/scc-tsd.pdf
Landry, Shawn M., Robert J. Northrop, Michael G. Andreu, and Carolyn C. Rhodes. 2013. City of Tampa 2011 Urban Forest Analysis: The Structure, Composition, Function and Economic Benefits of Trees and the Urban Forest. Final Report to the City of Tampa, September 2013. City of Tampa, Florida.
Leff, M. (2016). The Sustainable Urban Forest--A Step by Step Approach. Philadelphia: Davey Institute/USDA Forest Service.
McPherson, E., & Simpson, J. (1999). Guidelines for Calculating Carbon Dioxide Reductions Through Urban Forestry Programs. PSW GEneral Technical Report No. 171. Albany, CA: USDA Forest Service.
Murray, F., Marsh, L., & Bradford, P. (1994). New York State Energy Plan. Albany, NY: New York State Energy Office.
Nowak, D., & Dwyer, J. (2007). Understanding the benefits and costs of forest ecosystems. In J. Kuser, Handbook of Community Forestry in the Northeast (2 ed., pp. 25-46). Syracuse, NY: USDA Forest Service.
Nowak, D., Stevens, J., Sisinni, S., & Luley, C. (2002). Effects of urban tree management and species selection on atmo-spheric carbon dioxide. Journal of Arboriculture, 28(3), 113-122.
Ottinger, R., Wooley, D., Robinson, N., Hodas, D., & Babb, S. (1990). Environmental Costs of Electricity. White Plains, NY: Pace University Center for Environmental Legal Studies, Oceana Publications, Inc.
“Protecting and Developing Urban Tree Canopy A 135-City Survey.” City Policy Associates and the United States Con-ference of Mayors. (2008). Web.
52 • City of Gainesville Urban Forest Ecological Assessment 2016


![Gainesville Daily Sun. (Gainesville, Florida) 1908-03-26 [p 8].ufdcimages.uflib.ufl.edu/UF/00/02/82/98/01246/00858.pdfsilo 0G Cow city city city tied hat of bf OC city city Ibe city](https://static.fdocuments.in/doc/165x107/60a24d812fd6db557e56a0f7/gainesville-daily-sun-gainesville-florida-1908-03-26-p-8-silo-0g-cow-city.jpg)