Weekly October 24, 2003 / Vol. 52 / No. 42 · Weekly October 24, 2003 / Vol. 52 / No. 42 department...
28
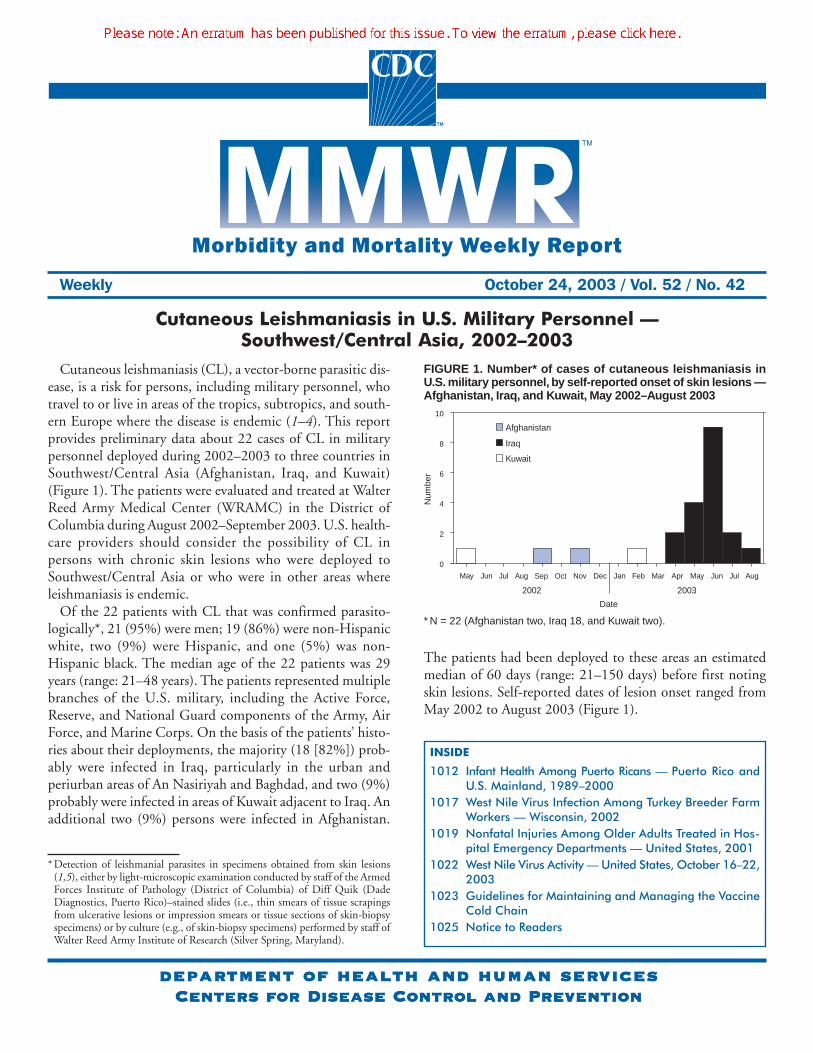
Morbidity and Mortality Weekly Report Weekly October 24, 2003 / Vol. 52 / No. 42 depar depar depar depar department of health and human ser tment of health and human ser tment of health and human ser tment of health and human ser tment of health and human services vices vices vices vices Centers for Disease Control and Prevention Centers for Disease Control and Prevention Centers for Disease Control and Prevention Centers for Disease Control and Prevention Centers for Disease Control and Prevention INSIDE 1012 Infant Health Among Puerto Ricans — Puerto Rico and U.S. Mainland, 1989–2000 1017 West Nile Virus Infection Among Turkey Breeder Farm Workers — Wisconsin, 2002 1019 Nonfatal Injuries Among Older Adults Treated in Hos- pital Emergency Departments — United States, 2001 1022 West Nile Virus Activity — United States, October 16–22, 2003 1023 Guidelines for Maintaining and Managing the Vaccine Cold Chain 1025 Notice to Readers Cutaneous Leishmaniasis in U.S. Military Personnel — Southwest/Central Asia, 2002–2003 Cutaneous leishmaniasis (CL), a vector-borne parasitic dis- ease, is a risk for persons, including military personnel, who travel to or live in areas of the tropics, subtropics, and south- ern Europe where the disease is endemic (1–4). This report provides preliminary data about 22 cases of CL in military personnel deployed during 2002–2003 to three countries in Southwest/Central Asia (Afghanistan, Iraq, and Kuwait) (Figure 1). The patients were evaluated and treated at Walter Reed Army Medical Center (WRAMC) in the District of Columbia during August 2002–September 2003. U.S. health- care providers should consider the possibility of CL in persons with chronic skin lesions who were deployed to Southwest/Central Asia or who were in other areas where leishmaniasis is endemic. Of the 22 patients with CL that was confirmed parasito- logically*, 21 (95%) were men; 19 (86%) were non-Hispanic white, two (9%) were Hispanic, and one (5%) was non- Hispanic black. The median age of the 22 patients was 29 years (range: 21–48 years). The patients represented multiple branches of the U.S. military, including the Active Force, Reserve, and National Guard components of the Army, Air Force, and Marine Corps. On the basis of the patients’ histo- ries about their deployments, the majority (18 [82%]) prob- ably were infected in Iraq, particularly in the urban and periurban areas of An Nasiriyah and Baghdad, and two (9%) probably were infected in areas of Kuwait adjacent to Iraq. An additional two (9%) persons were infected in Afghanistan. * Detection of leishmanial parasites in specimens obtained from skin lesions (1,5), either by light-microscopic examination conducted by staff of the Armed Forces Institute of Pathology (District of Columbia) of Diff Quik (Dade Diagnostics, Puerto Rico)–stained slides (i.e., thin smears of tissue scrapings from ulcerative lesions or impression smears or tissue sections of skin-biopsy specimens) or by culture (e.g., of skin-biopsy specimens) performed by staff of Walter Reed Army Institute of Research (Silver Spring, Maryland). The patients had been deployed to these areas an estimated median of 60 days (range: 21–150 days) before first noting skin lesions. Self-reported dates of lesion onset ranged from May 2002 to August 2003 (Figure 1). FIGURE 1. Number* of cases of cutaneous leishmaniasis in U.S. military personnel, by self-reported onset of skin lesions — Afghanistan, Iraq, and Kuwait, May 2002–August 2003 0 2 4 6 8 10 Number Kuwait Afghanistan Iraq Aug Jul Jun May Apr Mar Feb Jan Dec Nov Oct Sep Aug Jul Jun May 2002 2003 Date * N = 22 (Afghanistan two, Iraq 18, and Kuwait two).
Transcript of Weekly October 24, 2003 / Vol. 52 / No. 42 · Weekly October 24, 2003 / Vol. 52 / No. 42 department...
Morbidity and Mortality Weekly Report
Weekly October 24, 2003 / Vol. 52 / No. 42
depardepardepardepardepartment of health and human sertment of health and human sertment of health and human sertment of health and human sertment of health and human servicesvicesvicesvicesvicesCenters for Disease Control and PreventionCenters for Disease Control and PreventionCenters for Disease Control and PreventionCenters for Disease Control and PreventionCenters for Disease Control and Prevention
INSIDE
1012 Infant Health Among Puerto Ricans — Puerto Rico andU.S. Mainland, 1989–2000
1017 West Nile Virus Infection Among Turkey Breeder FarmWorkers — Wisconsin, 2002
1019 Nonfatal Injuries Among Older Adults Treated in Hos-pital Emergency Departments — United States, 2001
1022 West Nile Virus Activity — United States, October 16–22,2003
1023 Guidelines for Maintaining and Managing the VaccineCold Chain
1025 Notice to Readers
Cutaneous Leishmaniasis in U.S. Military Personnel —Southwest/Central Asia, 2002–2003
Cutaneous leishmaniasis (CL), a vector-borne parasitic dis-ease, is a risk for persons, including military personnel, whotravel to or live in areas of the tropics, subtropics, and south-ern Europe where the disease is endemic (1–4). This reportprovides preliminary data about 22 cases of CL in militarypersonnel deployed during 2002–2003 to three countries inSouthwest/Central Asia (Afghanistan, Iraq, and Kuwait)(Figure 1). The patients were evaluated and treated at WalterReed Army Medical Center (WRAMC) in the District ofColumbia during August 2002–September 2003. U.S. health-care providers should consider the possibility of CL inpersons with chronic skin lesions who were deployed toSouthwest/Central Asia or who were in other areas whereleishmaniasis is endemic.
Of the 22 patients with CL that was confirmed parasito-logically*, 21 (95%) were men; 19 (86%) were non-Hispanicwhite, two (9%) were Hispanic, and one (5%) was non-Hispanic black. The median age of the 22 patients was 29years (range: 21–48 years). The patients represented multiplebranches of the U.S. military, including the Active Force,Reserve, and National Guard components of the Army, AirForce, and Marine Corps. On the basis of the patients’ histo-ries about their deployments, the majority (18 [82%]) prob-ably were infected in Iraq, particularly in the urban andperiurban areas of An Nasiriyah and Baghdad, and two (9%)probably were infected in areas of Kuwait adjacent to Iraq. Anadditional two (9%) persons were infected in Afghanistan.
* Detection of leishmanial parasites in specimens obtained from skin lesions(1,5), either by light-microscopic examination conducted by staff of the ArmedForces Institute of Pathology (District of Columbia) of Diff Quik (DadeDiagnostics, Puerto Rico)–stained slides (i.e., thin smears of tissue scrapingsfrom ulcerative lesions or impression smears or tissue sections of skin-biopsyspecimens) or by culture (e.g., of skin-biopsy specimens) performed by staff ofWalter Reed Army Institute of Research (Silver Spring, Maryland).
The patients had been deployed to these areas an estimatedmedian of 60 days (range: 21–150 days) before first notingskin lesions. Self-reported dates of lesion onset ranged fromMay 2002 to August 2003 (Figure 1).
FIGURE 1. Number* of cases of cutaneous leishmaniasis inU.S. military personnel, by self-reported onset of skin lesions —Afghanistan, Iraq, and Kuwait, May 2002–August 2003
0
2
4
6
8
10
Num
ber
Kuwait
Afghanistan
Iraq
AugJulJunMayAprMarFebJanDecNovOctSepAugJulJunMay
2002 2003
Date
* N = 22 (Afghanistan two, Iraq 18, and Kuwait two).
Please note: An erratum has been published for this issue. To view the erratum, please click here.
1010 MMWR October 24, 2003
SUGGESTED CITATIONCenters for Disease Control and Prevention. [ArticleTitle]. MMWR 2003;52:[inclusive page numbers].
Centers for Disease Control and Prevention
Julie L. Gerberding, M.D., M.P.H.Director
Dixie E. Snider, M.D., M.P.H.(Acting) Deputy Director for Public Health Science
Donna F. Stroup, Ph.D., M.Sc.(Acting) Associate Director for Science
Epidemiology Program Office
Stephen B. Thacker, M.D., M.Sc.Director
Office of Scientific and Health Communications
John W. Ward, M.D.Director
Editor, MMWR Series
Suzanne M. Hewitt, M.P.A.Managing Editor, MMWR Series
Jeffrey D. Sokolow, M.A.(Acting) Lead Technical Writer/Editor
Jude C. RutledgeTeresa F. Rutledge
Douglas W. WeatherwaxWriters/Editors
Lynda G. CupellMalbea A. LaPete
Visual Information Specialists
Kim L. Bright, M.B.A.Quang M. Doan, M.B.A.
Erica R. ShaverInformation Technology Specialists
Division of Public Health Surveillanceand Informatics
Notifiable Disease Morbidity and 122 Cities Mortality DataRobert F. Fagan
Deborah A. AdamsFelicia J. ConnorLateka DammondDonna Edwards
Patsy A. HallPearl C. Sharp
The MMWR series of publications is published by theEpidemiology Program Office, Centers for Disease Controland Prevention (CDC), U.S. Department of Health andHuman Services, Atlanta, GA 30333.
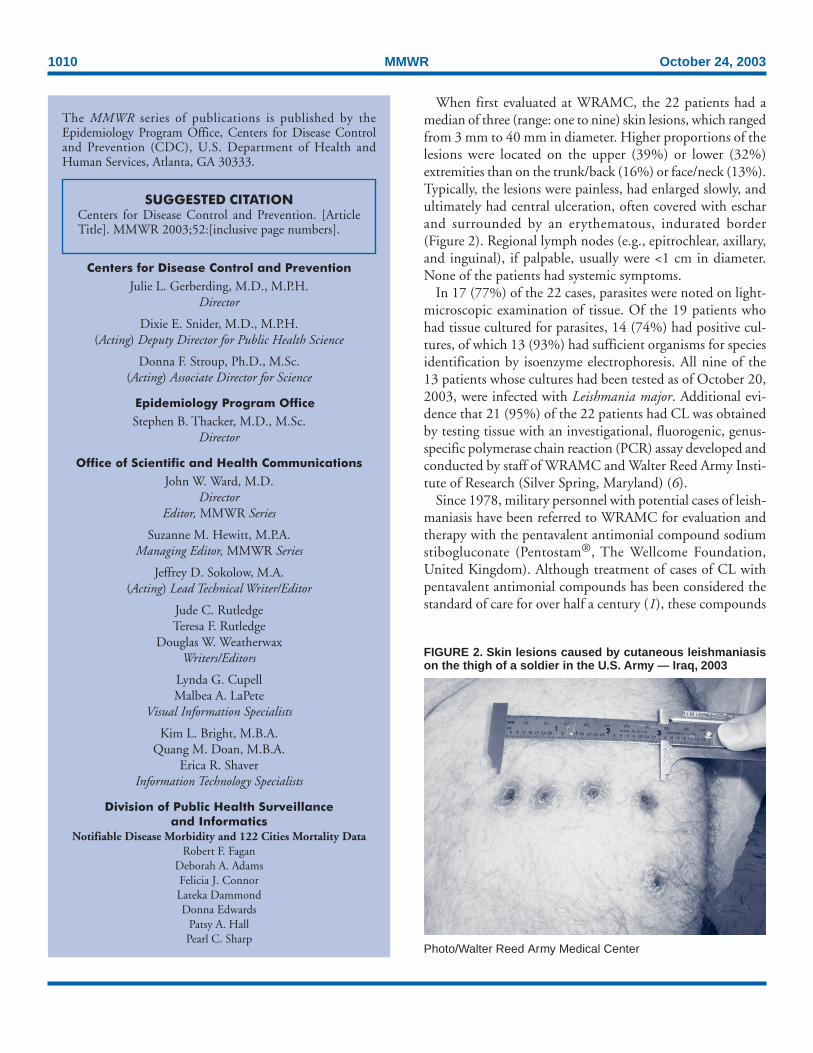
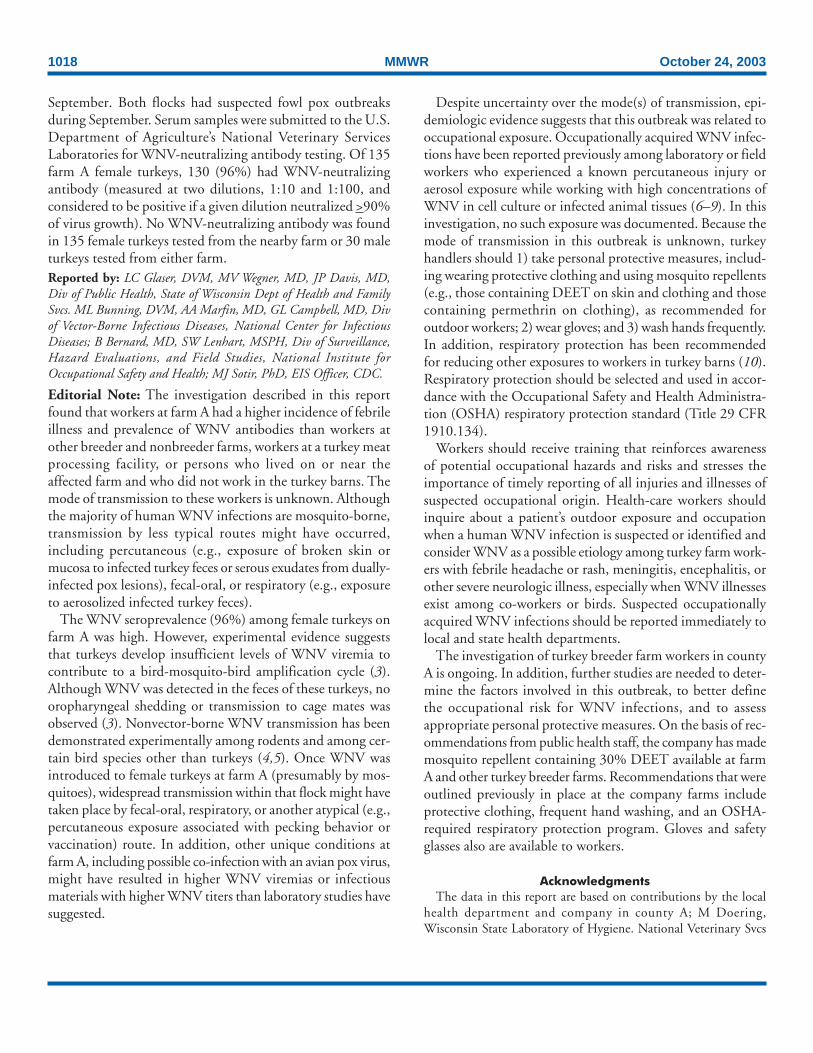
When first evaluated at WRAMC, the 22 patients had amedian of three (range: one to nine) skin lesions, which rangedfrom 3 mm to 40 mm in diameter. Higher proportions of thelesions were located on the upper (39%) or lower (32%)extremities than on the trunk/back (16%) or face/neck (13%).Typically, the lesions were painless, had enlarged slowly, andultimately had central ulceration, often covered with escharand surrounded by an erythematous, indurated border(Figure 2). Regional lymph nodes (e.g., epitrochlear, axillary,and inguinal), if palpable, usually were <1 cm in diameter.None of the patients had systemic symptoms.
In 17 (77%) of the 22 cases, parasites were noted on light-microscopic examination of tissue. Of the 19 patients whohad tissue cultured for parasites, 14 (74%) had positive cul-tures, of which 13 (93%) had sufficient organisms for speciesidentification by isoenzyme electrophoresis. All nine of the13 patients whose cultures had been tested as of October 20,2003, were infected with Leishmania major. Additional evi-dence that 21 (95%) of the 22 patients had CL was obtainedby testing tissue with an investigational, fluorogenic, genus-specific polymerase chain reaction (PCR) assay developed andconducted by staff of WRAMC and Walter Reed Army Insti-tute of Research (Silver Spring, Maryland) (6).
Since 1978, military personnel with potential cases of leish-maniasis have been referred to WRAMC for evaluation andtherapy with the pentavalent antimonial compound sodiumstibogluconate (Pentostam®, The Wellcome Foundation,United Kingdom). Although treatment of cases of CL withpentavalent antimonial compounds has been considered thestandard of care for over half a century (1), these compounds
FIGURE 2. Skin lesions caused by cutaneous leishmaniasison the thigh of a soldier in the U.S. Army — Iraq, 2003
Photo/Walter Reed Army Medical Center
Vol. 52 / No. 42 MMWR 1011
are not licensed for use in the United States. Therefore,sodium stibogluconate, the pentavalent antimonial compoundused in the United States, is provided by WRAMC underInvestigational New Drug (IND) protocols that the SurgeonGeneral of the Army holds with the U.S. Food and DrugAdministration (FDA). CDC has a separate IND protocolwith FDA for providing this drug for civilians withleishmaniasis.
All 22 patients were treated with sodium stibogluconate(20 mg/kg of body weight/day) by intravenous infusion for20 days (1). The patients’ lesions responded to therapy. Thepatients had predictable, reversible side effects from therapy(e.g., fatigue, arthralgia, myalgia, headache, and chemicalpancreatitis) (1).
Surveillance for infected female phlebotomine sand flies,the vectors of leishmanial parasites, has been conducted inand near urban and periurban areas of Iraq where U.S. mili-tary personnel have been stationed. Use of light traps facili-tated collection of many sand flies in short periods (e.g., up toapproximately 1,200 sand flies per trap in a 13-hour periodovernight, when sand flies are most active). During April–September 2003, approximately 65,000 sand flies were col-lected, about half of which were female. Taxonomic analysisindicated that the most common species in the Phlebotomusgenus were P. papatasi, P. alexandri, and P. sergenti, all of whichcan be vectors of leishmanial parasites. As of October 7, ap-proximately 24,000 female phlebotomine sand flies, in poolsof one to 15 flies, had been tested for infection by usingfluorogenic PCR (6). The overall infection rate in the sandflies was 1.4% (326 of 23,877). The infection rates for sandflies collected in and near specific areas were as follows: 2.3%(nine of 390) for Tikrit, 1.6% (315 of 19,937) for AnNasiriyah, 0.08% (one of 1,307) for Baghdad, 0.06% (one of1,795) for Balad, and 0% (none of 448) for Diwaniyah. Fivepercent (eight of 149) of PCR-positive pooled aliquots of sandflies collected from An Nasiriyah were positive by species-spe-cific PCR for L. infantum, which can cause visceral and cuta-neous leishmaniasis.Reported by: N Aronson, MD, Uniformed Svcs Univ of the HealthSciences, Bethesda; R Coleman, PhD, U.S. Army Medical ResearchInstitute of Infectious Diseases, Fort Detrick; P Coyne, MD, E Rowton,PhD, Walter Reed Army Institute of Research, Silver Spring, Maryland.D Hack, MD, M Polhemus, MD, G Wortmann, MD, Walter ReedArmy Medical Center, District of Columbia. K Cox, MD, Air ForceInstitute for Operational Health, San Antonio, Texas. P Weina, MD,520th Theatre Army Medical Laboratory (Forward), Iraq. BL Herwaldt,MD, Div of Parasitic Diseases, National Center for Infectious Diseases,CDC.
Editorial Note: Leishmaniasis is a vector-borne parasitic dis-ease endemic in parts of the tropics, subtropics, and Southern
Europe. The World Health Organization estimates that 1.5million cases of CL and 500,000 cases of visceral leishmaniasis(VL) occur each year (1).
Both cutaneous and visceral infection can remain asymp-tomatic or be associated with mild, nonspecific, andnonprogressive symptoms (1). Clinical manifestations, if theydevelop, typically are first noted weeks to months after expo-sure. The skin lesions of CL, which can be chronic and disfig-uring, typically evolve from papules to nodules to ulcerativelesions but can persist as nodules or plaques (1). Host (e.g.,immune status) and parasite (e.g., species and strain) charac-teristics affect the natural history and the ease and impor-tance of diagnosing and treating cases of CL. Although bothL. major and L. tropica are common etiologic agents of CL inAfghanistan, Iraq, and Kuwait (1,7,8), which species has causeda particular case of CL depends on such factors as the geo-graphic area and ecologic setting of exposure and the speciesof the sand-fly vector. VL is more prevalent in Iraq (8) thanin Afghanistan or Kuwait. Manifestations of cases of advancedVL include fever, cachexia, hepatosplenomegaly, pancytope-nia, and hypergammaglobulinemia; such cases can be fatal ifnot treated appropriately and quickly (1).
No FDA-approved vaccines or prophylactic medications toprevent leishmaniasis are available (1). Control measuresagainst vectors or reservoir hosts of infection might be effec-tive in particular settings (1,8,9). Personal protective measuresto decrease risk for infection include avoiding, if possible,areas where leishmaniasis is endemic, particularly from duskthrough dawn; using permethrin-treated bed nets and cloth-ing; minimizing the amount of exposed skin; and applyinginsect repellents containing 30%–35% DEET (lower percent-ages for children) to exposed skin.
Transmission of leishmanial parasites through blood trans-fusion has not been reported in the United States. However,as a precautionary measure, the Armed Services Blood Pro-gram Office of the Department of Defense (DoD) (FallsChurch, Virginia) and the American Association of BloodBanks (AABB) (Bethesda, Maryland) are implementing poli-cies to defer prospective blood donors who have been in Iraqfrom donating blood for 12 months after the last date theyleft Iraq. Additional information about these deferral policiesis available from DoD at http://www-nehc.med.navy.mil/downloads/prevmed/leishmanAug03.pdf and from AABB athttp://www.aabb.org.
In Operations Desert Storm and Shield during 1990–1991,among approximately 697,000 deployed military personnel,WRAMC identified 12 cases of so-called viscerotropic leish-maniasis caused by L. tropica (a syndrome associated with vis-ceral infection but not necessarily the classic clinicalmanifestations of VL) and 20 cases of CL (3,10; WRAMC,
1012 MMWR October 24, 2003
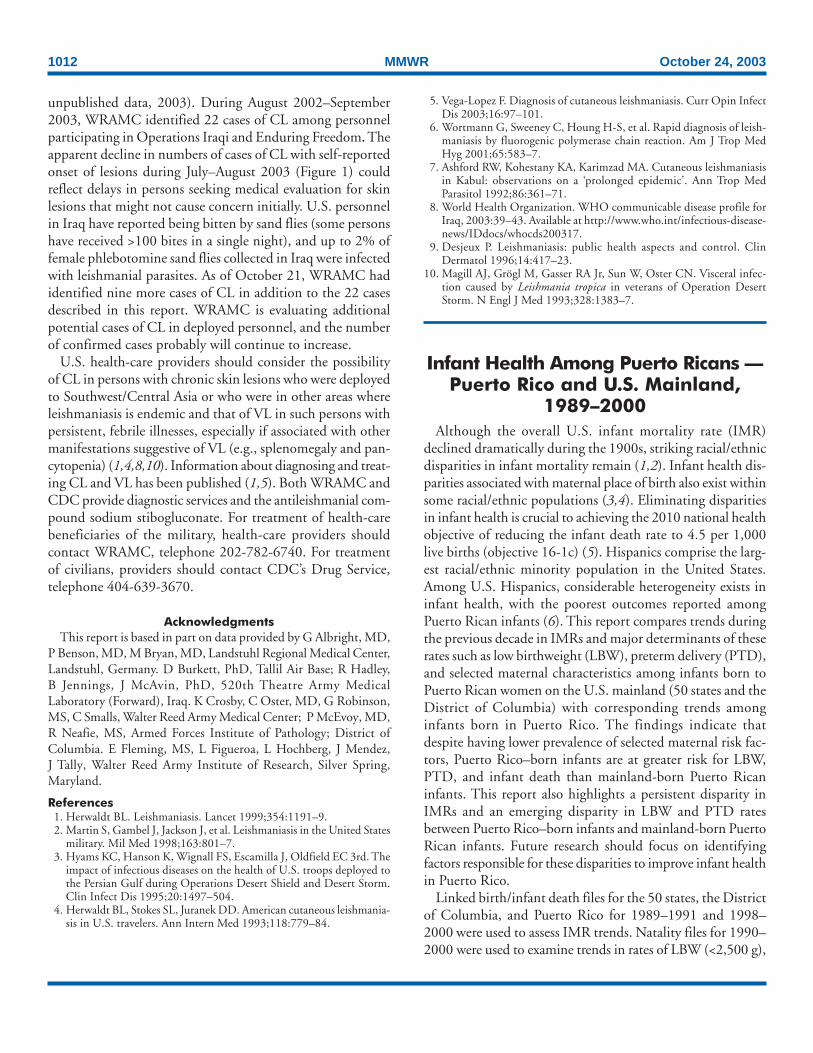
unpublished data, 2003). During August 2002–September2003, WRAMC identified 22 cases of CL among personnelparticipating in Operations Iraqi and Enduring Freedom. Theapparent decline in numbers of cases of CL with self-reportedonset of lesions during July–August 2003 (Figure 1) couldreflect delays in persons seeking medical evaluation for skinlesions that might not cause concern initially. U.S. personnelin Iraq have reported being bitten by sand flies (some personshave received >100 bites in a single night), and up to 2% offemale phlebotomine sand flies collected in Iraq were infectedwith leishmanial parasites. As of October 21, WRAMC hadidentified nine more cases of CL in addition to the 22 casesdescribed in this report. WRAMC is evaluating additionalpotential cases of CL in deployed personnel, and the numberof confirmed cases probably will continue to increase.
U.S. health-care providers should consider the possibilityof CL in persons with chronic skin lesions who were deployedto Southwest/Central Asia or who were in other areas whereleishmaniasis is endemic and that of VL in such persons withpersistent, febrile illnesses, especially if associated with othermanifestations suggestive of VL (e.g., splenomegaly and pan-cytopenia) (1,4,8,10). Information about diagnosing and treat-ing CL and VL has been published (1,5). Both WRAMC andCDC provide diagnostic services and the antileishmanial com-pound sodium stibogluconate. For treatment of health-carebeneficiaries of the military, health-care providers shouldcontact WRAMC, telephone 202-782-6740. For treatmentof civilians, providers should contact CDC’s Drug Service,telephone 404-639-3670.
AcknowledgmentsThis report is based in part on data provided by G Albright, MD,
P Benson, MD, M Bryan, MD, Landstuhl Regional Medical Center,Landstuhl, Germany. D Burkett, PhD, Tallil Air Base; R Hadley,B Jennings, J McAvin, PhD, 520th Theatre Army MedicalLaboratory (Forward), Iraq. K Crosby, C Oster, MD, G Robinson,MS, C Smalls, Walter Reed Army Medical Center; P McEvoy, MD,R Neafie, MS, Armed Forces Institute of Pathology; District ofColumbia. E Fleming, MS, L Figueroa, L Hochberg, J Mendez,J Tally, Walter Reed Army Institute of Research, Silver Spring,Maryland.
References1. Herwaldt BL. Leishmaniasis. Lancet 1999;354:1191–9.2. Martin S, Gambel J, Jackson J, et al. Leishmaniasis in the United States
military. Mil Med 1998;163:801–7.3. Hyams KC, Hanson K, Wignall FS, Escamilla J, Oldfield EC 3rd. The
impact of infectious diseases on the health of U.S. troops deployed tothe Persian Gulf during Operations Desert Shield and Desert Storm.Clin Infect Dis 1995;20:1497–504.
4. Herwaldt BL, Stokes SL, Juranek DD. American cutaneous leishmania-sis in U.S. travelers. Ann Intern Med 1993;118:779–84.
5. Vega-Lopez F. Diagnosis of cutaneous leishmaniasis. Curr Opin InfectDis 2003;16:97–101.
6. Wortmann G, Sweeney C, Houng H-S, et al. Rapid diagnosis of leish-maniasis by fluorogenic polymerase chain reaction. Am J Trop MedHyg 2001;65:583–7.
7. Ashford RW, Kohestany KA, Karimzad MA. Cutaneous leishmaniasisin Kabul: observations on a ‘prolonged epidemic’. Ann Trop MedParasitol 1992;86:361–71.
8. World Health Organization. WHO communicable disease profile forIraq, 2003:39–43. Available at http://www.who.int/infectious-disease-news/IDdocs/whocds200317.
9. Desjeux P. Leishmaniasis: public health aspects and control. ClinDermatol 1996;14:417–23.
10. Magill AJ, Grögl M, Gasser RA Jr, Sun W, Oster CN. Visceral infec-tion caused by Leishmania tropica in veterans of Operation DesertStorm. N Engl J Med 1993;328:1383–7.
Infant Health Among Puerto Ricans —Puerto Rico and U.S. Mainland,
1989–2000Although the overall U.S. infant mortality rate (IMR)
declined dramatically during the 1900s, striking racial/ethnicdisparities in infant mortality remain (1,2). Infant health dis-parities associated with maternal place of birth also exist withinsome racial/ethnic populations (3,4). Eliminating disparitiesin infant health is crucial to achieving the 2010 national healthobjective of reducing the infant death rate to 4.5 per 1,000live births (objective 16-1c) (5). Hispanics comprise the larg-est racial/ethnic minority population in the United States.Among U.S. Hispanics, considerable heterogeneity exists ininfant health, with the poorest outcomes reported amongPuerto Rican infants (6). This report compares trends duringthe previous decade in IMRs and major determinants of theserates such as low birthweight (LBW), preterm delivery (PTD),and selected maternal characteristics among infants born toPuerto Rican women on the U.S. mainland (50 states and theDistrict of Columbia) with corresponding trends amonginfants born in Puerto Rico. The findings indicate thatdespite having lower prevalence of selected maternal risk fac-tors, Puerto Rico–born infants are at greater risk for LBW,PTD, and infant death than mainland-born Puerto Ricaninfants. This report also highlights a persistent disparity inIMRs and an emerging disparity in LBW and PTD ratesbetween Puerto Rico–born infants and mainland-born PuertoRican infants. Future research should focus on identifyingfactors responsible for these disparities to improve infant healthin Puerto Rico.
Linked birth/infant death files for the 50 states, the Districtof Columbia, and Puerto Rico for 1989–1991 and 1998–2000 were used to assess IMR trends. Natality files for 1990–2000 were used to examine trends in rates of LBW (<2,500 g),

know what matters.
Dispatch
up-to-the-minute: adj1 : extending up to the immediate present,
including the very latest information;
see also MMWR.
Centers for Disease Control and Prevention
Centers for Disease Control and Prevention
Centers for Disease Control and Prevention
Centers for Disease Control and Prevention
Centers for Disease Control and Prevention
MMWR Dispatch
Vol. 52 / April 29, 2003
Morbidity and Mortality Weekly ReportCDC’s interim surveillance case definition for severe acute
respiratory syndrome (SARS) has been updated to include
laboratory criteria for evidence of infection with the SARS-
associated coronavirus (SARS-CoV) (Figure, Box). In addi-
tion, clinical criteria have been revised to reflect the possible
spectrum of respiratory illness associated with SARS-CoV. Epi-
demiologic criteria have been retained. The majority of U.S.
cases of SARS continue to be associated with travel*, with
only limited secondary spread to household members or
health-care providers (1).
SARS has been associated etiologically with a novel
coronavirus, SARS-CoV (2,3). Evidence of SARS-CoV
infection has been identified in patients with SARS in several
countries, including the United States. Several new labora-
tory tests can be used to detect SARS-CoV. Serologic testing
for coronavirus antibody can be performed by using indirect
fluorescent antibody or enzyme-linked immunosorbent
assays that are specific for antibody produced after infection.
Although some patients have detectable coronavirus antibody
during the acute phase (i.e., within 14 days of illness onset),
definitive interpretation of negative coronavirus antibody tests
is possible only for specimens obtained >21 days after onset
of symptoms. A reverse transcriptase polymerase chain reac-
tion (RT-PCR) test specific for viral RNA has been positive
within the first 10 days after onset of fever in specimens from
some SARS patients, but the duration of detectable viremia
or viral shedding is unknown. RT-PCR testing can detect
SARS-CoV in clinical specimens, including serum, stool, and
nasal secretions. Finally, viral culture and isolation have both
been used to detect SARS-CoV. Absence of SARS-CoV anti-
body in serum obtained <21 days after illness onset, a nega-
tive PCR test, or a negative viral culture does not exclude
coronavirus infection.Reported U.S. cases of SARS still will be classified as sus-
pect or probable; however, these cases can be further classi-
fied as laboratory-confirmed or -negative if laboratory data
are available and complete, or as laboratory-indeterminate if
specimens are not available or testing is incomplete. Obtain-
ing convalescent serum samples to make a final determina-
tion about infection with SARS-CoV is critical.
No instances of SARS-CoV infection have been detected
in persons who are asymptomatic. However, data are insuffi-
cient to exclude the possibility of asymptomatic infection with
SARS-CoV and the possibility that such persons can trans-
mit the virus. Investigations of close contacts and health-care
workers exposed to SARS patients might provide informa-
tion about the occurrence of asymptomatic infected persons.
Similarly, the clinical manifestations of SARS might extend
Updated Interim Surveillance Case Definition for Severe Acute Respiratory Syndrome
(SARS) — United States, April 29, 2003
* In this updated case definition, Taiwan has been added to the areas with documented
or suspected community transmission of SARS; Hanoi, Vietnam is now an area
with recently documented or suspected community transmission of SARS.
FIGURE. Clinical and laboratory criteria for probable and
suspect severe acute respiratory syndrome (SARS) cases and
SARS-associated coronavirus (SARS-CoV) infection — United
States, April 29, 2003
Laboratory-confirmed UndeterminedNegative
Moderaterespiratoryillness
Severerespiratoryillness
Mildrespiratory*illness/Asymptomatic
Clin
ical
crit
eria
Laboratory criteria for SARS-CoV
Suspect case*Probable case*
Reported to World Health Organization
* Meets epidemiologic criteria.

1014 MMWR October 24, 2003
PTD (<37 weeks’ gestation), and selected maternal character-istics among live-born infants. Analyses were limited toinfants born to Puerto Rican women (i.e., those born in PuertoRico, those born on the mainland to Puerto Rico–born moth-ers, or those born on the mainland to mothers who reportedbeing of Puerto Rican ethnicity). Infants born in Puerto Ricoto women not born either in Puerto Rico or on the mainlandwere excluded. Four subpopulations of Puerto Rican infantswere examined initially: infants born in Puerto Rico to PuertoRico–born mothers, infants born in Puerto Rico to mainland-born mothers, infants born on the mainland to Puerto Rico–born mothers, and infants born on the mainland tomainland-born mothers of Puerto Rican ethnicity. However,because maternal place of birth was not associated substan-tially with infant health outcomes, data are shown for PuertoRico–born and mainland-born infants without regard tomaternal place of birth. Chi square tests were used tocompare differences in the prevalence of infant and maternalcharacteristics and differences in IMRs among the groups.
Low Birthweight and Preterm DeliveryIn 1990, Puerto Rico–born infants were 1.03 times more
likely to be of LBW than mainland-born infants, and in 2000,this disparity increased to 1.2 (Figure). From 1990 to 2000,the LBW rate for Puerto Rico–born infants increased 18.0%,from 9.2% to 10.9%; for mainland-born infants, the LBWrate increased 3.7%, from 8.9% to 9.3%. Similar differencesin LBW rate increases were observed when analyses wererestricted to full-term and singleton births. The increase inthe LBW rate among Puerto Rico–born infants was associ-ated predominantly with an increase in the percentage ofinfants with an intermediate LBW (ILBW; 1,500–2,499 g);however, a small increase also was observed in the percentagewith a very low birthweight (VLBW; <1,500 g) (Table 1). In2000, Puerto Rico–born infants were less likely than mainland-born infants to be of VLBW (ratio = 0.7) but more likely tobe of ILBW (ratio = 1.3) (Table 1).
In 1990, Puerto Rico–born infants were less likely thanmainland-born infants to be born preterm (ratio = 0.9)(Figure). From 1990 to 2000, the PTD rate among PuertoRico–born infants increased 29.3% (from 11.6% to 15.0%),and that among mainland-born infants increased 0.9% (from13.3% to 13.4%). As a result, in 2000, Puerto Rico–borninfants were 1.1 times more likely than mainland-borninfants to be born preterm. Similar differences in PTD rateswere observed when analyses were limited to singleton births.The increase in the PTD rate among Puerto Rico–borninfants was attributable primarily to an increase in the rate ofmoderately preterm births (32–36 weeks’ gestation), although
FIGURE. Percentage of low birthweight and preterm deliveryamong infants born to Puerto Rican women, by infant place ofbirth and year — Puerto Rico and U.S. mainland*, 1990–2000
Low birthweight
0
2
4
6
8
10
12
14
16
18
20
1990 1991 1992 1993 1994 1995 1996 1997 1998 1999 2000
Puerto Rico–born infants
Mainland-born infants
Preterm delivery
0
2
4
6
8
10
12
14
16
18
20
1990 1991 1992 1993 1994 1995 1996 1997 1998 1999 2000
Year
Puerto Rico–born infants
Mainland-born infants
Per
cent
age
Per
cent
age
* 50 states and the District of Columbia.
the rate of very preterm births (<32 weeks’ gestation) alsoincreased slightly (Table 1).
In 2000, despite higher rates of LBW and PTD amongPuerto Rico–born infants, their mothers were less likely thanmothers of mainland-born infants to report selected maternalrisk factors, including receiving late/no prenatal care, having<12 years of education, not being married, having plural births,and using tobacco (Table 1). The prevalence of first trimesterprenatal care and the percentage of mothers aged <19 years attheir infant’s birth were similar for the two groups (Table 1).The prevalence of these maternal characteristics did not differby maternal place of birth.
Infant MortalityFrom 1989–1991 to 1998–2000, the combined IMR for
Puerto Rico–born and mainland-born infants declinedapproximately 24%. The 1989–1991 IMR for Puerto
Vol. 52 / No. 42 MMWR 1015
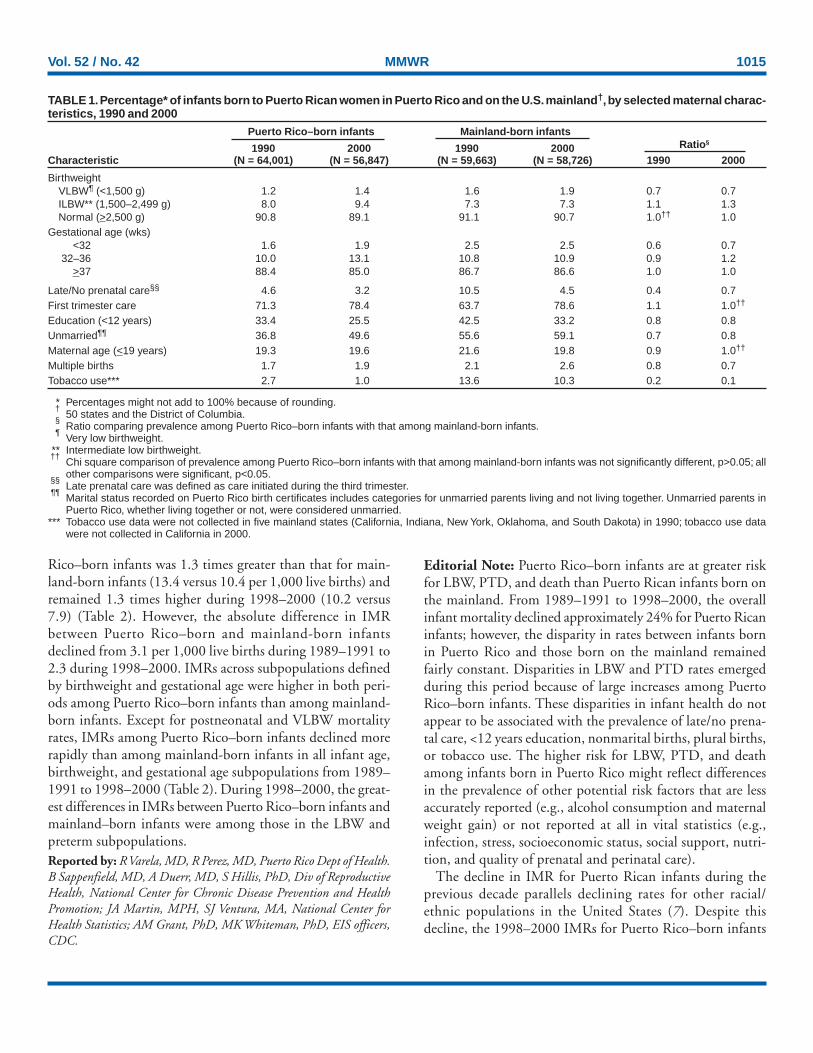
TABLE 1. Percentage* of infants born to Puerto Rican women in Puerto Rico and on the U.S. mainland†, by selected maternal charac-teristics, 1990 and 2000
Puerto Rico–born infants Mainland-born infants
1990 2000 1990 2000 Ratio§
Characteristic (N = 64,001) (N = 56,847) (N = 59,663) (N = 58,726) 1990 2000
BirthweightVLBW¶ (<1,500 g) 1.2 1.4 1.6 1.9 0.7 0.7ILBW** (1,500–2,499 g) 8.0 9.4 7.3 7.3 1.1 1.3Normal (>2,500 g) 90.8 89.1 91.1 90.7 1.0†† 1.0
Gestational age (wks)<32 1.6 1.9 2.5 2.5 0.6 0.7
32–36 10.0 13.1 10.8 10.9 0.9 1.2>37 88.4 85.0 86.7 86.6 1.0 1.0
Late/No prenatal care§§ 4.6 3.2 10.5 4.5 0.4 0.7First trimester care 71.3 78.4 63.7 78.6 1.1 1.0††
Education (<12 years) 33.4 25.5 42.5 33.2 0.8 0.8Unmarried¶¶ 36.8 49.6 55.6 59.1 0.7 0.8Maternal age (<19 years) 19.3 19.6 21.6 19.8 0.9 1.0††
Multiple births 1.7 1.9 2.1 2.6 0.8 0.7Tobacco use*** 2.7 1.0 13.6 10.3 0.2 0.1
* Percentages might not add to 100% because of rounding.†
50 states and the District of Columbia.§
Ratio comparing prevalence among Puerto Rico–born infants with that among mainland-born infants.¶
Very low birthweight.** Intermediate low birthweight.††
Chi square comparison of prevalence among Puerto Rico–born infants with that among mainland-born infants was not significantly different, p>0.05; allother comparisons were significant, p<0.05.
§§Late prenatal care was defined as care initiated during the third trimester.
¶¶Marital status recorded on Puerto Rico birth certificates includes categories for unmarried parents living and not living together. Unmarried parents inPuerto Rico, whether living together or not, were considered unmarried.
*** Tobacco use data were not collected in five mainland states (California, Indiana, New York, Oklahoma, and South Dakota) in 1990; tobacco use datawere not collected in California in 2000.
Rico–born infants was 1.3 times greater than that for main-land-born infants (13.4 versus 10.4 per 1,000 live births) andremained 1.3 times higher during 1998–2000 (10.2 versus7.9) (Table 2). However, the absolute difference in IMRbetween Puerto Rico–born and mainland-born infantsdeclined from 3.1 per 1,000 live births during 1989–1991 to2.3 during 1998–2000. IMRs across subpopulations definedby birthweight and gestational age were higher in both peri-ods among Puerto Rico–born infants than among mainland-born infants. Except for postneonatal and VLBW mortalityrates, IMRs among Puerto Rico–born infants declined morerapidly than among mainland-born infants in all infant age,birthweight, and gestational age subpopulations from 1989–1991 to 1998–2000 (Table 2). During 1998–2000, the great-est differences in IMRs between Puerto Rico–born infants andmainland–born infants were among those in the LBW andpreterm subpopulations.Reported by: R Varela, MD, R Perez, MD, Puerto Rico Dept of Health.B Sappenfield, MD, A Duerr, MD, S Hillis, PhD, Div of ReproductiveHealth, National Center for Chronic Disease Prevention and HealthPromotion; JA Martin, MPH, SJ Ventura, MA, National Center forHealth Statistics; AM Grant, PhD, MK Whiteman, PhD, EIS officers,CDC.
Editorial Note: Puerto Rico–born infants are at greater riskfor LBW, PTD, and death than Puerto Rican infants born onthe mainland. From 1989–1991 to 1998–2000, the overallinfant mortality declined approximately 24% for Puerto Ricaninfants; however, the disparity in rates between infants bornin Puerto Rico and those born on the mainland remainedfairly constant. Disparities in LBW and PTD rates emergedduring this period because of large increases among PuertoRico–born infants. These disparities in infant health do notappear to be associated with the prevalence of late/no prena-tal care, <12 years education, nonmarital births, plural births,or tobacco use. The higher risk for LBW, PTD, and deathamong infants born in Puerto Rico might reflect differencesin the prevalence of other potential risk factors that are lessaccurately reported (e.g., alcohol consumption and maternalweight gain) or not reported at all in vital statistics (e.g.,infection, stress, socioeconomic status, social support, nutri-tion, and quality of prenatal and perinatal care).
The decline in IMR for Puerto Rican infants during theprevious decade parallels declining rates for other racial/ethnic populations in the United States (7). Despite thisdecline, the 1998–2000 IMRs for Puerto Rico–born infants

1016 MMWR October 24, 2003
(10.2 per 1,000 live births) and for mainland-born infants(7.9) remain considerably higher than that for non-HispanicU.S. mainland whites (5.8) (7). In addition, in 2000, theincidence of LBW and PTD among both Puerto Rico–bornand mainland-born Puerto Rican infants was greater than thatamong infants in any other U.S. Hispanic origin group orU.S. racial/ethnic group, except non-Hispanic blacks. There-fore, a disparity in infant health exists not only between PuertoRican infants born in Puerto Rico and Puerto Rican infantsborn on the mainland, but also between all Puerto Ricaninfants and infants from other U.S. racial/ethnic populations.
The findings in this report are subject to at least two limita-tions. First, although underreporting of vital events is unlikelyin Puerto Rico (6), risk factors such as maternal tobacco usemight be reported less completely in Puerto Rico than on themainland. Second, because Hispanic origin is not recordedon birth certificates in Puerto Rico, this study was based onrecords for infants born either in Puerto Rico or on the main-land; mainland-born infants were defined as having PuertoRican ethnicity if their mothers were born in Puerto Rico orreported being Puerto Rican.
This report highlights a continuing disparity in infant mor-tality rates and an emerging disparity in LBW and PTD ratesbetween Puerto Rico–born infants and infants born on themainland to Puerto Rican mothers. These differences shouldbe considered in the planning and implementation of effortsto reduce IMRs among Puerto Ricans. The higher birthweight-and gestational age–specific IMRs in Puerto Rico contribute
more to the overall higher IMR in Puerto Rico than do thedifferences in birthweight and gestational age distributionsbetween Puerto Rico– and mainland-born infants (8). Effortsto reduce IMR in Puerto Rico should focus on reducing mor-tality rates among LBW and preterm infants, perhaps by ex-amining existing perinatal services. Additional opportunitiesmight exist for lowering the overall IMR if the underlyingcauses of the increases in the prevalence of LBW and PTDcan be identified and prevented. Improving infant health inPuerto Ricans will most likely require interventions at the in-dividual, provider, and health-care system levels.References1. Singh GK, Yu SM. Infant mortality in the United States: trends, differ-
entials, and projection, 1950 through 2010. Am J Public Health1995;85:957–64.
2. CDC. Infant mortality and low birth weight among black and whiteinfants—United States, 1980–2000. MMWR 2002;51:589–92.
3. CDC. State-specific trends in U.S. live births to women born outsidethe 50 states and the District of Columbia—United States, 1990 and2000. MMWR 2002;51:1091–5.
4. Singh GK, Yu SM. Adverse pregnancy outcomes: differences betweenU.S.- and foreign-born women in major U.S. ethnic groups. Am JPublic Health 1996;86:837–43.
5. U. S. Department of Health and Human Services. Healthy people 2010(conference ed., 2 vols). Washington, DC: U.S. Department of Healthand Human Services, 2000.
6. Becerra JE, Hogue CJR, Atrash HK, Pérez N. Infant mortality amongHispanics: a portrait in heterogeneity. JAMA 1991;265:217–21.
7. Mathews TJ, Menacker F, MacDorman MF. Infant mortality statisticsfrom the 2000 period linked data birth/infant death data set. Natl VitalStat Rep 2002;50:1–28.
8. Kitagawa EM. Components of a difference between two rates. J AmStat Assoc 1955;50:1168–94.
TABLE 2. Mortality rates* for infants born to Puerto Rican women in Puerto Rico and on the U.S. mainland†, by selected characteris-tics, 1989–1991 and 1998–2000
Puerto Rico births Mainland births Ratio§
Characteristic 1989–1991 1998–2000 1989–1991 1998–2000 1989–1991 1998–2000
Age at death¶
Neonatal 10.2 7.4 7.0 5.5 1.5 1.3Postneonatal 3.2 2.8 3.3 2.4 1.0** 1.2
BirthweightVLBW†† (<1,500 g) 498.9 397.7 319.1 251.7 1.6 1.6ILBW§§ (1,500–2,499 g) 37.9 21.0 19.8 13.3 1.9 1.6Normal (2,500 g) 4.8 3.1 3.5 2.3 1.4 1.3
Gestational age (wks)<32 361.1 292.3 208.5 188.6 1.7 1.6
32–36 23.3 14.8 11.9 8.4 2.0 1.8>37 5.6 3.4 3.9 2.5 1.4 1.4
Total 13.4 10.2 10.4 7.9 1.3 1.3
* Number of live-born infants who died within the first year of life per 1,000 live births.†
50 states and the District of Columbia.§
Ratio comparing infant mortality rate (IMR) for Puerto Rico–born infants with that for mainland-born infants.¶
Neonatal deaths comprise infants aged <28 days; postneonatal deaths comprise infants aged 28 days to age <1 year.** Chi square comparison of IMR for Puerto Rico–born infants with that for mainland-born infants was not significantly different, p>0.05; all other comparisons
were significant, p<0.05.††
Very low birthweight.§§
Intermediate low birthweight.
Vol. 52 / No. 42 MMWR 1017
West Nile Virus Infection AmongTurkey Breeder Farm Workers —
Wisconsin, 2002In 2002, Wisconsin public health officials were notified of
two cases of febrile illness in workers at a commercial turkeybreeder farm (farm A) in county A. The Wisconsin Divisionof Public Health (WDPH) initiated an investigation that founda high prevalence of West Nile virus (WNV) antibody amongfarm A workers and turkeys. An associated high incidence offebrile illness among farm A workers also was observed. Thisreport summarizes the results of this investigation, whichindicate possible nonmosquito transmission among birds andsubsequent infection of humans at farm A. Because the modeof transmission in this outbreak is unknown, turkey handlersshould take appropriate precautions, including use of DEET-containing mosquito repellents, protective clothing and gloves,respiratory protection, and proper hand hygiene. Suspectedoccupationally acquired WNV infections should be reportedimmediately to local and state health departments.
During November 2002, WDPH and the Wisconsin StateLaboratory of Hygiene (WSLH) confirmed that two ill resi-dents of county A had been infected with WNV. Before thesereports, only one human WNV infection had been reportedin this county. Both persons worked at farm A and had febrileillness with rash during late September–early October. Thesehuman illnesses occurred after a suspected fowl pox outbreakamong farm A turkeys in September. Workers were concernedthe pox outbreak might be associated with their illnesses.
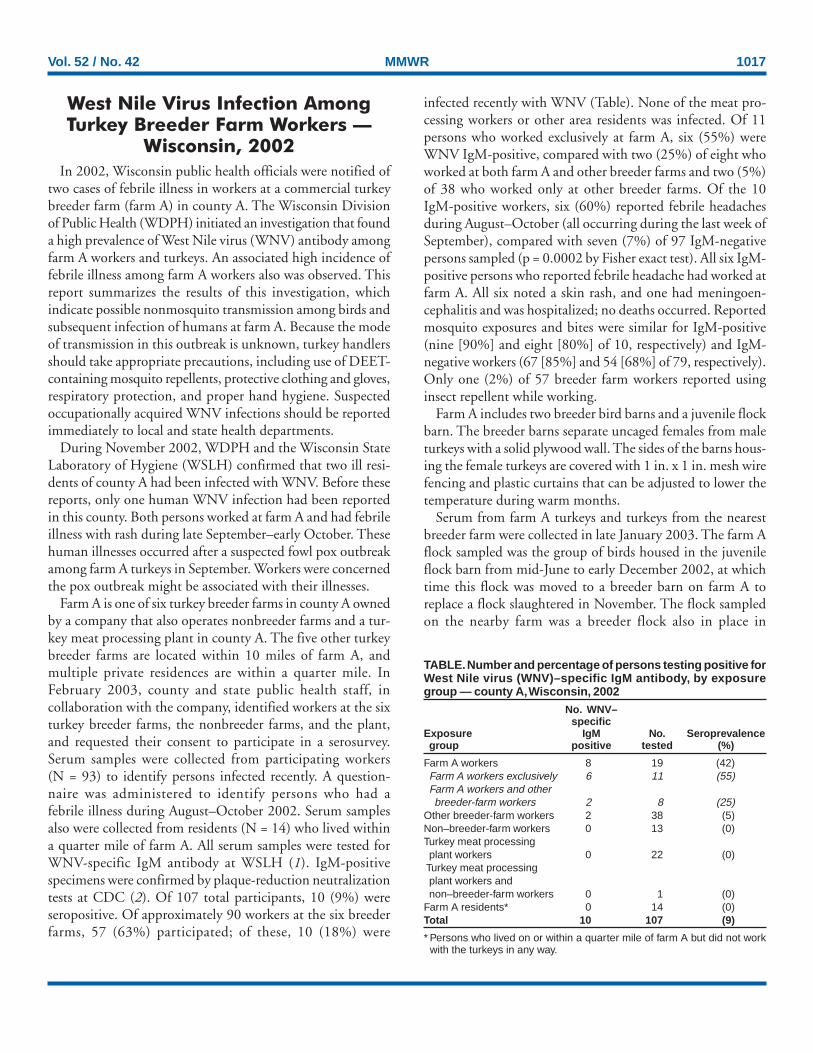
Farm A is one of six turkey breeder farms in county A ownedby a company that also operates nonbreeder farms and a tur-key meat processing plant in county A. The five other turkeybreeder farms are located within 10 miles of farm A, andmultiple private residences are within a quarter mile. InFebruary 2003, county and state public health staff, incollaboration with the company, identified workers at the sixturkey breeder farms, the nonbreeder farms, and the plant,and requested their consent to participate in a serosurvey.Serum samples were collected from participating workers(N = 93) to identify persons infected recently. A question-naire was administered to identify persons who had afebrile illness during August–October 2002. Serum samplesalso were collected from residents (N = 14) who lived withina quarter mile of farm A. All serum samples were tested forWNV-specific IgM antibody at WSLH (1). IgM-positivespecimens were confirmed by plaque-reduction neutralizationtests at CDC (2). Of 107 total participants, 10 (9%) wereseropositive. Of approximately 90 workers at the six breederfarms, 57 (63%) participated; of these, 10 (18%) were
infected recently with WNV (Table). None of the meat pro-cessing workers or other area residents was infected. Of 11persons who worked exclusively at farm A, six (55%) wereWNV IgM-positive, compared with two (25%) of eight whoworked at both farm A and other breeder farms and two (5%)of 38 who worked only at other breeder farms. Of the 10IgM-positive workers, six (60%) reported febrile headachesduring August–October (all occurring during the last week ofSeptember), compared with seven (7%) of 97 IgM-negativepersons sampled (p = 0.0002 by Fisher exact test). All six IgM-positive persons who reported febrile headache had worked atfarm A. All six noted a skin rash, and one had meningoen-cephalitis and was hospitalized; no deaths occurred. Reportedmosquito exposures and bites were similar for IgM-positive(nine [90%] and eight [80%] of 10, respectively) and IgM-negative workers (67 [85%] and 54 [68%] of 79, respectively).Only one (2%) of 57 breeder farm workers reported usinginsect repellent while working.
Farm A includes two breeder bird barns and a juvenile flockbarn. The breeder barns separate uncaged females from maleturkeys with a solid plywood wall. The sides of the barns hous-ing the female turkeys are covered with 1 in. x 1 in. mesh wirefencing and plastic curtains that can be adjusted to lower thetemperature during warm months.
Serum from farm A turkeys and turkeys from the nearestbreeder farm were collected in late January 2003. The farm Aflock sampled was the group of birds housed in the juvenileflock barn from mid-June to early December 2002, at whichtime this flock was moved to a breeder barn on farm A toreplace a flock slaughtered in November. The flock sampledon the nearby farm was a breeder flock also in place in
TABLE. Number and percentage of persons testing positive forWest Nile virus (WNV)–specific IgM antibody, by exposuregroup — county A, Wisconsin, 2002
No. WNV–specific
Exposure IgM No. Seroprevalencegroup positive tested (%)
Farm A workers 8 19 (42)Farm A workers exclusively 6 11 (55)Farm A workers and otherbreeder-farm workers 2 8 (25)
Other breeder-farm workers 2 38 (5)Non–breeder-farm workers 0 13 (0)Turkey meat processingplant workers 0 22 (0)
Turkey meat processingplant workers andnon–breeder-farm workers 0 1 (0)
Farm A residents* 0 14 (0)Total 10 107 (9)
* Persons who lived on or within a quarter mile of farm A but did not workwith the turkeys in any way.
1018 MMWR October 24, 2003
September. Both flocks had suspected fowl pox outbreaksduring September. Serum samples were submitted to the U.S.Department of Agriculture’s National Veterinary ServicesLaboratories for WNV-neutralizing antibody testing. Of 135farm A female turkeys, 130 (96%) had WNV-neutralizingantibody (measured at two dilutions, 1:10 and 1:100, andconsidered to be positive if a given dilution neutralized >90%of virus growth). No WNV-neutralizing antibody was foundin 135 female turkeys tested from the nearby farm or 30 maleturkeys tested from either farm.Reported by: LC Glaser, DVM, MV Wegner, MD, JP Davis, MD,Div of Public Health, State of Wisconsin Dept of Health and FamilySvcs. ML Bunning, DVM, AA Marfin, MD, GL Campbell, MD, Divof Vector-Borne Infectious Diseases, National Center for InfectiousDiseases; B Bernard, MD, SW Lenhart, MSPH, Div of Surveillance,Hazard Evaluations, and Field Studies, National Institute forOccupational Safety and Health; MJ Sotir, PhD, EIS Officer, CDC.
Editorial Note: The investigation described in this reportfound that workers at farm A had a higher incidence of febrileillness and prevalence of WNV antibodies than workers atother breeder and nonbreeder farms, workers at a turkey meatprocessing facility, or persons who lived on or near theaffected farm and who did not work in the turkey barns. Themode of transmission to these workers is unknown. Althoughthe majority of human WNV infections are mosquito-borne,transmission by less typical routes might have occurred,including percutaneous (e.g., exposure of broken skin ormucosa to infected turkey feces or serous exudates from dually-infected pox lesions), fecal-oral, or respiratory (e.g., exposureto aerosolized infected turkey feces).
The WNV seroprevalence (96%) among female turkeys onfarm A was high. However, experimental evidence suggeststhat turkeys develop insufficient levels of WNV viremia tocontribute to a bird-mosquito-bird amplification cycle (3).Although WNV was detected in the feces of these turkeys, nooropharyngeal shedding or transmission to cage mates wasobserved (3). Nonvector-borne WNV transmission has beendemonstrated experimentally among rodents and among cer-tain bird species other than turkeys (4,5). Once WNV wasintroduced to female turkeys at farm A (presumably by mos-quitoes), widespread transmission within that flock might havetaken place by fecal-oral, respiratory, or another atypical (e.g.,percutaneous exposure associated with pecking behavior orvaccination) route. In addition, other unique conditions atfarm A, including possible co-infection with an avian pox virus,might have resulted in higher WNV viremias or infectiousmaterials with higher WNV titers than laboratory studies havesuggested.
Despite uncertainty over the mode(s) of transmission, epi-demiologic evidence suggests that this outbreak was related tooccupational exposure. Occupationally acquired WNV infec-tions have been reported previously among laboratory or fieldworkers who experienced a known percutaneous injury oraerosol exposure while working with high concentrations ofWNV in cell culture or infected animal tissues (6–9). In thisinvestigation, no such exposure was documented. Because themode of transmission in this outbreak is unknown, turkeyhandlers should 1) take personal protective measures, includ-ing wearing protective clothing and using mosquito repellents(e.g., those containing DEET on skin and clothing and thosecontaining permethrin on clothing), as recommended foroutdoor workers; 2) wear gloves; and 3) wash hands frequently.In addition, respiratory protection has been recommendedfor reducing other exposures to workers in turkey barns (10).Respiratory protection should be selected and used in accor-dance with the Occupational Safety and Health Administra-tion (OSHA) respiratory protection standard (Title 29 CFR1910.134).
Workers should receive training that reinforces awarenessof potential occupational hazards and risks and stresses theimportance of timely reporting of all injuries and illnesses ofsuspected occupational origin. Health-care workers shouldinquire about a patient’s outdoor exposure and occupationwhen a human WNV infection is suspected or identified andconsider WNV as a possible etiology among turkey farm work-ers with febrile headache or rash, meningitis, encephalitis, orother severe neurologic illness, especially when WNV illnessesexist among co-workers or birds. Suspected occupationallyacquired WNV infections should be reported immediately tolocal and state health departments.
The investigation of turkey breeder farm workers in countyA is ongoing. In addition, further studies are needed to deter-mine the factors involved in this outbreak, to better definethe occupational risk for WNV infections, and to assessappropriate personal protective measures. On the basis of rec-ommendations from public health staff, the company has mademosquito repellent containing 30% DEET available at farmA and other turkey breeder farms. Recommendations that wereoutlined previously in place at the company farms includeprotective clothing, frequent hand washing, and an OSHA-required respiratory protection program. Gloves and safetyglasses also are available to workers.
AcknowledgmentsThe data in this report are based on contributions by the local
health department and company in county A; M Doering,Wisconsin State Laboratory of Hygiene. National Veterinary Svcs

Vol. 52 / No. 42 MMWR 1019
Laboratories, Animal and Plant Health Inspection Svc; AgricultureResearch Svc; U.S. Dept of Agriculture. S Montgomery, DVM,N Komar, PhD, D O’Leary, DVM, P Schneider; laboratory staff;Div of Vector-Borne Infectious Diseases, National Center forInfectious Diseases, CDC.
References1. Martin DA, Muth DA, Brown T, Johnson AJ, Karabatsos N, Roehrig
JT. Standardization of immunoglobulin M capture enzyme-linkedimmunosorbent assays for routine diagnosis of arboviral infections.J Clin Microbiol 2000;38:1823–36.
2. Beaty BJ, Calisher CH, Shope RE. Arboviruses. In: Lennette EH,Lennette DA, Lennette ET, eds. Diagnostic Procedures for Viral,Rickettsial, and Chlamydial Infections, 7th ed. Washington, DC:American Public Health Association, 1995.
3. Swayne DE, Beck JR, Zaki S. Pathogenicity of West Nile virus forturkeys. Avian Diseases 2000;44:932–7.
4. Odelola HA, Oduye O. West Nile virus infection of adult mice by oralroute. Archives of Virology 1977;54:251–3.
5. Komar N, Langevin S, Hinten S, et al. Experimental infection of NorthAmerican birds with the New York 1999 strain of West Nile virus.Emerg Infect Dis 2003;9:311–22.
6. Pike RM. Laboratory-associated infections: summary and analysis of3,921 cases. Health Laboratory Science 1976;13:105–14.
7. Sewell DL. Laboratory-associated infections and biosafety. ClinMicrobiol Rev 1995;8:389–405.
8. Nir YD. Airborne West Nile virus infection. Am J Trop Med Hyg1959;8:537–9.
9. CDC. Laboratory-acquired West Nile virus infection—United States,2002. MMWR 2002;51:1133–5.
10. Reynolds SJ, Parker D, Vesley D, Janni K, McJilton C. Occupationalexposure to organic dusts and gases in the turkey growing industry.Appl Occup Environ Hyg 1994;9:493–502.
Public Health and Aging
Nonfatal Injuries Among Older AdultsTreated in Hospital Emergency
Departments — United States, 2001Because injuries generally are considered a problem of the
young, injuries among older adults (i.e., persons aged >65years) have received little attention. However, injuries are theeighth leading cause of death among older adults in the UnitedStates (1). In 2001, approximately 2.7 million older adultswere treated for nonfatal injuries in hospital emergencydepartments (EDs); the majority of these injuries were theresult of falls (1). To characterize nonfatal injuries among olderadults, CDC analyzed data from the National ElectronicInjury Surveillance System-All Injury Program (NEISS-AIP).This report summarizes the results of that analysis, whichindicate differences in type and mechanism of injury by sex,suggesting that prevention programs should be designed andtailored differently for men and women.
NEISS-AIP is operated by the U.S. Consumer ProductSafety Commission and collects data about initial visits for all
(MMWR on line)
cdc.gov/mmwr
Online
1020 MMWR October 24, 2003
types and causes of injuries treated in U.S. EDs, drawing froma nationally representative sample of 66 hospitals selected as astratified probability sample of hospitals in the United States.Data from these cases are weighted by the inverse of the prob-ability of selection to produce national estimates (2). For thisreport, annualized estimates were calculated on the basis ofweighted data for 36,752 nonfatal injuries among older adultstreated in EDs during January–December 2001. U.S. CensusBureau population estimates for 2001 were used to calculateinjury rates (3). A direct variance estimation procedure wasused to calculate 95% confidence intervals and to account forthe complex sample design (2). All nonfatal injuries were clas-sified according to the mechanism of injury (e.g., fall, struckby/against, or motor vehicle crash), diagnosis, primary bodypart injured, disposition, location of injury, and intent. Thediagnosis and intent of the injury were classified according tothe most severe injury (4). Injuries of unknown intent weregrouped with those classified as unintentional.
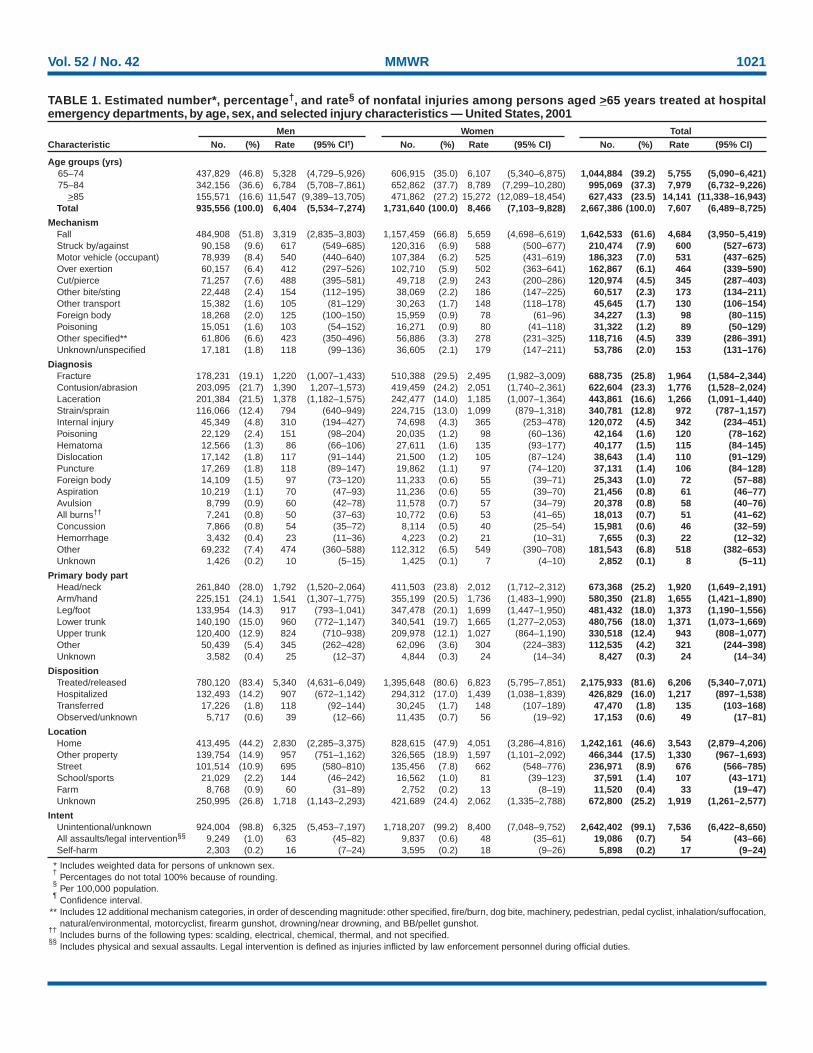
During 2001, an estimated 935,556 men and 1,731,640women aged >65 years were treated in EDs for nonfatal inju-ries. The overall injury rate per 100,000 persons was higheramong women (8,466 per 100,000 persons) than among men(6,404). Injury rates increased with age, to 15,272 for womenaged >85 years and 11,547 for men aged >85 years. Nearly allinjuries (99%) were classified as unintentional/unknownintent (Table).
Overall, falls resulted in the highest rates of injury (4,684per 100,000 persons) and were the most common mecha-nism of injury, accounting for 62% of all nonfatal injury EDvisits in this population. The injury rate from falls was higheramong women (5,659) than men (3,319). However, theinjury rates for women were lower with certain other types ofinjuries, such as being struck by/against (588 versus 617),occupying a motor vehicle (525 versus 540), and being cut orpierced (243 versus 488) (Table).
The greatest number of nonfatal injuries among older adultswere diagnosed as fractures (26%), followed by contusions/abrasions (23%), lacerations (17%), strains/sprains (13%), andinternal injuries (5%). Diagnoses varied by sex. Fractures ofall parts of the body were more common among women thanmen (30% versus 19%), and lacerations were more commonamong men than women (22% versus 14%). The parts of thebody affected most were the head/neck (25%) and arms/hands(22%). The majority (82%) of older adults were treated andreleased; 16% were hospitalized. The ratio of patients treated/released to those hospitalized was lower among women (4.7:1)than men (5.9:1), suggesting women were more often hospi-talized after a nonfatal injury. The most common (47%) loca-tion for nonfatal injuries was the home (Table).
Reported by: KE Kocher, MD, Dept of Emergency Medicine, Univ ofMichigan, Ann Arbor. AM Dellinger, PhD, Div of Unintentional InjuryPrevention, National Center for Injury Prevention and Control, CDC.
Editorial Note: Falls remain the leading cause of both nonfa-tal and fatal injury among older adults aged >65 years in theUnited States (1). The findings in this report, which indicatethat falls were the most common reason for injury-related EDvisits among persons aged >65 years, are consistent with pre-vious studies indicating that approximately 40% of older adultsliving in community settings (e.g., in private residences orminimally assisted environments) fall each year (5).
In this study, 82% of persons aged >65 years were treatedand released following injury, compared with 95% of personsaged <65 years. Older adults were more than three times morelikely (1,217 per 100,000 persons) to be hospitalized thanpersons aged <65 years (353) (1).
The findings in this report are subject to at least five limita-tions. First, NEISS-AIP provides national estimates and doesnot allow for estimates by region, state, or local jurisdiction.Second, injury outcomes are specific to ED visits and do notinclude subsequent outcomes. Third, NEISS-AIP data reflectonly those injuries that were severe enough to require treat-ment in an ED. Fourth, in cases with multiple injuries, onlydata regarding the most severe injury are recorded. Finally,data for intent are classified on the basis of information con-tained in the medical record. Injuries for which intent cannotbe determined conclusively from the ED record are groupedwith unintentional injuries.
The findings in this report can form the basis for targetingprevention efforts to different populations of older adults. Forexample, exercise can reduce the risk for fall among older adultsby 15% (6). Because women are more likely to sustain fall-related injuries, exercise can be an especially important pre-ventive measure for this population. Data from NEISS-AIPcan continue to be a source for monitoring trends, evaluat-ing interventions, and characterizing nonfatal injuriesamong persons aged >65 years.
AcknowledgmentsThis report is based on contributions by the U.S. Consumer
Product Safety Commission. K Gotsch, P Holmgreen, JL Annest,PhD, Office of Statistics and Programming, National Center forInjury Prevention and Control, CDC.
References1. CDC. Web-based injury statistics query and reporting system
(WISQARS) (2002). Available at http://www.cdc.gov/ncipc/wisqars.2. U.S. Consumer Product Safety Commission. NEISS-All Injury Program:
sample design and implementation. In: Schroeder T, Ault K, eds. Wash-ington, DC: U.S. Consumer Product Safety Commission, 2000.
Vol. 52 / No. 42 MMWR 1021
TABLE 1. Estimated number*, percentage†, and rate§ of nonfatal injuries among persons aged >65 years treated at hospitalemergency departments, by age, sex, and selected injury characteristics — United States, 2001
Men Women TotalCharacteristic No. (%) Rate (95% CI¶) No. (%) Rate (95% CI) No. (%) Rate (95% CI)
Age groups (yrs)65–74 437,829 (46.8) 5,328 (4,729–5,926) 606,915 (35.0) 6,107 (5,340–6,875) 1,044,884 (39.2) 5,755 (5,090–6,421)75–84 342,156 (36.6) 6,784 (5,708–7,861) 652,862 (37.7) 8,789 (7,299–10,280) 995,069 (37.3) 7,979 (6,732–9,226)
>85 155,571 (16.6) 11,547 (9,389–13,705) 471,862 (27.2) 15,272 (12,089–18,454) 627,433 (23.5) 14,141 (11,338–16,943)Total 935,556 (100.0) 6,404 (5,534–7,274) 1,731,640 (100.0) 8,466 (7,103–9,828) 2,667,386 (100.0) 7,607 (6,489–8,725)
MechanismFall 484,908 (51.8) 3,319 (2,835–3,803) 1,157,459 (66.8) 5,659 (4,698–6,619) 1,642,533 (61.6) 4,684 (3,950–5,419)Struck by/against 90,158 (9.6) 617 (549–685) 120,316 (6.9) 588 (500–677) 210,474 (7.9) 600 (527–673)Motor vehicle (occupant) 78,939 (8.4) 540 (440–640) 107,384 (6.2) 525 (431–619) 186,323 (7.0) 531 (437–625)Over exertion 60,157 (6.4) 412 (297–526) 102,710 (5.9) 502 (363–641) 162,867 (6.1) 464 (339–590)Cut/pierce 71,257 (7.6) 488 (395–581) 49,718 (2.9) 243 (200–286) 120,974 (4.5) 345 (287–403)Other bite/sting 22,448 (2.4) 154 (112–195) 38,069 (2.2) 186 (147–225) 60,517 (2.3) 173 (134–211)Other transport 15,382 (1.6) 105 (81–129) 30,263 (1.7) 148 (118–178) 45,645 (1.7) 130 (106–154)Foreign body 18,268 (2.0) 125 (100–150) 15,959 (0.9) 78 (61–96) 34,227 (1.3) 98 (80–115)Poisoning 15,051 (1.6) 103 (54–152) 16,271 (0.9) 80 (41–118) 31,322 (1.2) 89 (50–129)Other specified** 61,806 (6.6) 423 (350–496) 56,886 (3.3) 278 (231–325) 118,716 (4.5) 339 (286–391)Unknown/unspecified 17,181 (1.8) 118 (99–136) 36,605 (2.1) 179 (147–211) 53,786 (2.0) 153 (131–176)
DiagnosisFracture 178,231 (19.1) 1,220 (1,007–1,433) 510,388 (29.5) 2,495 (1,982–3,009) 688,735 (25.8) 1,964 (1,584–2,344)Contusion/abrasion 203,095 (21.7) 1,390 1,207–1,573) 419,459 (24.2) 2,051 (1,740–2,361) 622,604 (23.3) 1,776 (1,528–2,024)Laceration 201,384 (21.5) 1,378 (1,182–1,575) 242,477 (14.0) 1,185 (1,007–1,364) 443,861 (16.6) 1,266 (1,091–1,440)Strain/sprain 116,066 (12.4) 794 (640–949) 224,715 (13.0) 1,099 (879–1,318) 340,781 (12.8) 972 (787–1,157)Internal injury 45,349 (4.8) 310 (194–427) 74,698 (4.3) 365 (253–478) 120,072 (4.5) 342 (234–451)Poisoning 22,129 (2.4) 151 (98–204) 20,035 (1.2) 98 (60–136) 42,164 (1.6) 120 (78–162)Hematoma 12,566 (1.3) 86 (66–106) 27,611 (1.6) 135 (93–177) 40,177 (1.5) 115 (84–145)Dislocation 17,142 (1.8) 117 (91–144) 21,500 (1.2) 105 (87–124) 38,643 (1.4) 110 (91–129)Puncture 17,269 (1.8) 118 (89–147) 19,862 (1.1) 97 (74–120) 37,131 (1.4) 106 (84–128)Foreign body 14,109 (1.5) 97 (73–120) 11,233 (0.6) 55 (39–71) 25,343 (1.0) 72 (57–88)Aspiration 10,219 (1.1) 70 (47–93) 11,236 (0.6) 55 (39–70) 21,456 (0.8) 61 (46–77)Avulsion 8,799 (0.9) 60 (42–78) 11,578 (0.7) 57 (34–79) 20,378 (0.8) 58 (40–76)All burns†† 7,241 (0.8) 50 (37–63) 10,772 (0.6) 53 (41–65) 18,013 (0.7) 51 (41–62)Concussion 7,866 (0.8) 54 (35–72) 8,114 (0.5) 40 (25–54) 15,981 (0.6) 46 (32–59)Hemorrhage 3,432 (0.4) 23 (11–36) 4,223 (0.2) 21 (10–31) 7,655 (0.3) 22 (12–32)Other 69,232 (7.4) 474 (360–588) 112,312 (6.5) 549 (390–708) 181,543 (6.8) 518 (382–653)Unknown 1,426 (0.2) 10 (5–15) 1,425 (0.1) 7 (4–10) 2,852 (0.1) 8 (5–11)
Primary body partHead/neck 261,840 (28.0) 1,792 (1,520–2,064) 411,503 (23.8) 2,012 (1,712–2,312) 673,368 (25.2) 1,920 (1,649–2,191)Arm/hand 225,151 (24.1) 1,541 (1,307–1,775) 355,199 (20.5) 1,736 (1,483–1,990) 580,350 (21.8) 1,655 (1,421–1,890)Leg/foot 133,954 (14.3) 917 (793–1,041) 347,478 (20.1) 1,699 (1,447–1,950) 481,432 (18.0) 1,373 (1,190–1,556)Lower trunk 140,190 (15.0) 960 (772–1,147) 340,541 (19.7) 1,665 (1,277–2,053) 480,756 (18.0) 1,371 (1,073–1,669)Upper trunk 120,400 (12.9) 824 (710–938) 209,978 (12.1) 1,027 (864–1,190) 330,518 (12.4) 943 (808–1,077)Other 50,439 (5.4) 345 (262–428) 62,096 (3.6) 304 (224–383) 112,535 (4.2) 321 (244–398)Unknown 3,582 (0.4) 25 (12–37) 4,844 (0.3) 24 (14–34) 8,427 (0.3) 24 (14–34)
DispositionTreated/released 780,120 (83.4) 5,340 (4,631–6,049) 1,395,648 (80.6) 6,823 (5,795–7,851) 2,175,933 (81.6) 6,206 (5,340–7,071)Hospitalized 132,493 (14.2) 907 (672–1,142) 294,312 (17.0) 1,439 (1,038–1,839) 426,829 (16.0) 1,217 (897–1,538)Transferred 17,226 (1.8) 118 (92–144) 30,245 (1.7) 148 (107–189) 47,470 (1.8) 135 (103–168)Observed/unknown 5,717 (0.6) 39 (12–66) 11,435 (0.7) 56 (19–92) 17,153 (0.6) 49 (17–81)
LocationHome 413,495 (44.2) 2,830 (2,285–3,375) 828,615 (47.9) 4,051 (3,286–4,816) 1,242,161 (46.6) 3,543 (2,879–4,206)Other property 139,754 (14.9) 957 (751–1,162) 326,565 (18.9) 1,597 (1,101–2,092) 466,344 (17.5) 1,330 (967–1,693)Street 101,514 (10.9) 695 (580–810) 135,456 (7.8) 662 (548–776) 236,971 (8.9) 676 (566–785)School/sports 21,029 (2.2) 144 (46–242) 16,562 (1.0) 81 (39–123) 37,591 (1.4) 107 (43–171)Farm 8,768 (0.9) 60 (31–89) 2,752 (0.2) 13 (8–19) 11,520 (0.4) 33 (19–47)Unknown 250,995 (26.8) 1,718 (1,143–2,293) 421,689 (24.4) 2,062 (1,335–2,788) 672,800 (25.2) 1,919 (1,261–2,577)
IntentUnintentional/unknown 924,004 (98.8) 6,325 (5,453–7,197) 1,718,207 (99.2) 8,400 (7,048–9,752) 2,642,402 (99.1) 7,536 (6,422–8,650)All assaults/legal intervention§§ 9,249 (1.0) 63 (45–82) 9,837 (0.6) 48 (35–61) 19,086 (0.7) 54 (43–66)Self-harm 2,303 (0.2) 16 (7–24) 3,595 (0.2) 18 (9–26) 5,898 (0.2) 17 (9–24)
* Includes weighted data for persons of unknown sex.†
Percentages do not total 100% because of rounding.§
Per 100,000 population.¶
Confidence interval.** Includes 12 additional mechanism categories, in order of descending magnitude: other specified, fire/burn, dog bite, machinery, pedestrian, pedal cyclist, inhalation/suffocation,
natural/environmental, motorcyclist, firearm gunshot, drowning/near drowning, and BB/pellet gunshot.††
Includes burns of the following types: scalding, electrical, chemical, thermal, and not specified.§§
Includes physical and sexual assaults. Legal intervention is defined as injuries inflicted by law enforcement personnel during official duties.

1022 MMWR October 24, 2003
3. U.S. Census Bureau. Resident population projections of the United Statesby age, sex, race, and Hispanic origin: 1992 to 2050. Available athttp://www.census.gov.
4. U.S. Consumer Product Safety Commission. NEISS Coding Manual,All Injury July 2002. Washington, DC: U.S. Consumer Product SafetyCommission, 2002.
5. Hausdorff JM, Rios DA, Edelberg HK. Gait variability and fall risk incommunity-living older adults: a 1-year prospective study. Arch PhysMed Rehabil 2001;82:1050–6.
6. Shekelle P, Maglione M, Chang J, et al. Evidence report and evidence-based recommendations: falls prevention interventions in the Medicarepopulation. Baltimore, Maryland: U.S. Department of Health andHuman Services, Centers for Medicare and Medicaid Services andRAND, 2003.
West Nile Virus Activity —United States, October 16–22, 2003This report summarizes West Nile virus (WNV) surveil-
lance data reported to CDC through ArboNET as of 3 a.m.,Mountain Daylight Time, October 22, 2003.
During the reporting week of October 16–22, a total of429 human cases of WNV infection were reported from 26states (Alabama, Arizona, Arkansas, California, Georgia, Illi-nois, Kansas, Maryland, Massachusetts, Michigan, Minnesota,Montana, Nebraska, Nevada, New Jersey, New Mexico, NewYork, Ohio, Oklahoma, Pennsylvania, Rhode Island, SouthDakota, Tennessee, Texas, Vermont, and Virginia), includingseven fatal cases from four states (Maryland, Nebraska, NewYork, and Texas). During the same period, WNV infectionswere reported in 281 dead birds, 246 mosquito pools, 183horses, 2 dogs, 2 squirrels, and one unidentified animal species.
During 2003, a total of 7,386 human cases of WNV infec-tion have been reported from Colorado (n = 2,170), Nebraska(n = 1,359), South Dakota (n = 955), Texas (n = 457), NorthDakota (n = 375), Wyoming (n = 320), Montana (n = 216),Pennsylvania (n = 202), New Mexico (n = 194), Minnesota(n = 136), Iowa (n = 128), Ohio (n =86), Louisiana (n = 84),Kansas (n = 78), Oklahoma (n = 59), Mississippi (n = 56),New York (n = 56), Illinois (n = 45), Maryland (n = 45),Missouri (n = 43), Florida (n = 32), Georgia (n = 31), Ala-bama (n = 30), Indiana (n = 30), New Jersey (n = 26), Arkan-sas (n = 21), North Carolina (n = 21), Tennessee (n = 19),Virginia (n = 18), Massachusetts (n = 16), Delaware (n = 13),Kentucky (n = 13), Wisconsin (n = 13), Connecticut (n = 12),Michigan (n = six), Rhode Island (n = five), District ofColumbia (n = three), Arizona (n = two), California (n = two),Nevada (n = two), New Hampshire (n = two), Vermont(n = two), South Carolina (n = one), Utah (n = one), andWest Virginia (n = one) (Figure). Of 7,269 (98%) cases forwhich demographic data were available, 3,841 (53%) occurred
among males; the median age was 47 years (range: 1 month–99 years), and the dates of illness onset ranged from March28 to October 10. Of the 7,269 cases, 155 fatal cases werereported from Colorado (n = 44), Texas (n = 17), Nebraska(n = 16), New York (n = eight), South Dakota (n = eight),Wyoming (n = eight), Pennsylvania (n = six), Maryland(n = five), Georgia (n = four), Iowa (n = four), Minnesota(n = four), New Mexico (n = four), North Dakota (n = four),Alabama (n = three), Ohio (n = three), Indiana (n = two),Missouri (n = two), Montana (n = two), New Jersey (n = two),Delaware (n = one), Illinois (n = one), Kansas (n = one), Ken-tucky (n = one), Louisiana (n = one), Michigan (n = one),Mississippi (n = one), Tennessee (n = one), and Virginia(n = one). A total of 682 presumptive West Nile viremic blooddonors have been reported to ArboNET. Of these, 596 (87%)were reported from the following nine western and midwesternstates: Colorado, Kansas, Nebraska, New Mexico, NorthDakota, Oklahoma, South Dakota, Texas, and Wyoming. Ofthe 529 donors for whom data were reported completely, sixsubsequently had meningoencephalitis, and 76 subsequentlyhad West Nile fever.
In addition, 10,453 dead birds with WNV infection havebeen reported from 42 states, the District of Columbia, andNew York City; 3,270 WNV infections in horses, 16 WNVinfections in dogs, 14 infections in squirrels, and 24 infec-tions in unidentified animal species have been reported from39 states. During 2003, WNV seroconversions have beenreported in 1,246 sentinel chicken flocks from 15 states. Ofthe 46 seropositive sentinel horses reported, Illinois reported35; Minnesota, seven; South Dakota, three; and West Virginia,
FIGURE. Areas reporting West Nile virus (WNV) activity —United States, 2003*
* As of 3 a.m., Mountain Daylight Time, October 22, 2003.
Human WNV disease and animal WNV activity
Animal WNV activity only
Vol. 52 / No. 42 MMWR 1023
one. In addition, seropositivity was reported from one otherunidentified animal species. A total of 6,667 WNV-positivemosquito pools have been reported from 38 states, theDistrict of Columbia, and New York City.
Additional information about WNV activity is availablefrom CDC at http://www.cdc.gov/ncidod/dvbid/westnile/index.htm and http://westnilemaps.usgs.gov.
Notice to Readers
Guidelines for Maintaining and Managingthe Vaccine Cold Chain
In February 2002, the Advisory Committee on Immuniza-tion Practices (ACIP) and American Academy of Family Phy-sicians (AAFP) released their revised General Recommendationson Immunization (1), which included recommendations onthe storage and handling of immunobiologics. Because ofincreased concern over the potential for errors with the vac-cine cold chain (i.e., maintaining proper vaccine temperaturesduring storage and handling to preserve potency), this noticeadvises vaccine providers of the importance of proper coldchain management practices. This report describes proper stor-age units and storage temperatures, outlines appropriate tem-perature-monitoring practices, and recommends steps forevaluating a temperature-monitoring program. The successof efforts against vaccine-preventable diseases is attributablein part to proper storage and handling of vaccines. Exposureof vaccines to temperatures outside the recommended ranges
can affect potency adversely, thereby reducing protection fromvaccine-preventable diseases (1). Good practices to maintainproper vaccine storage and handling can ensure that the fullbenefit of immunization is realized.
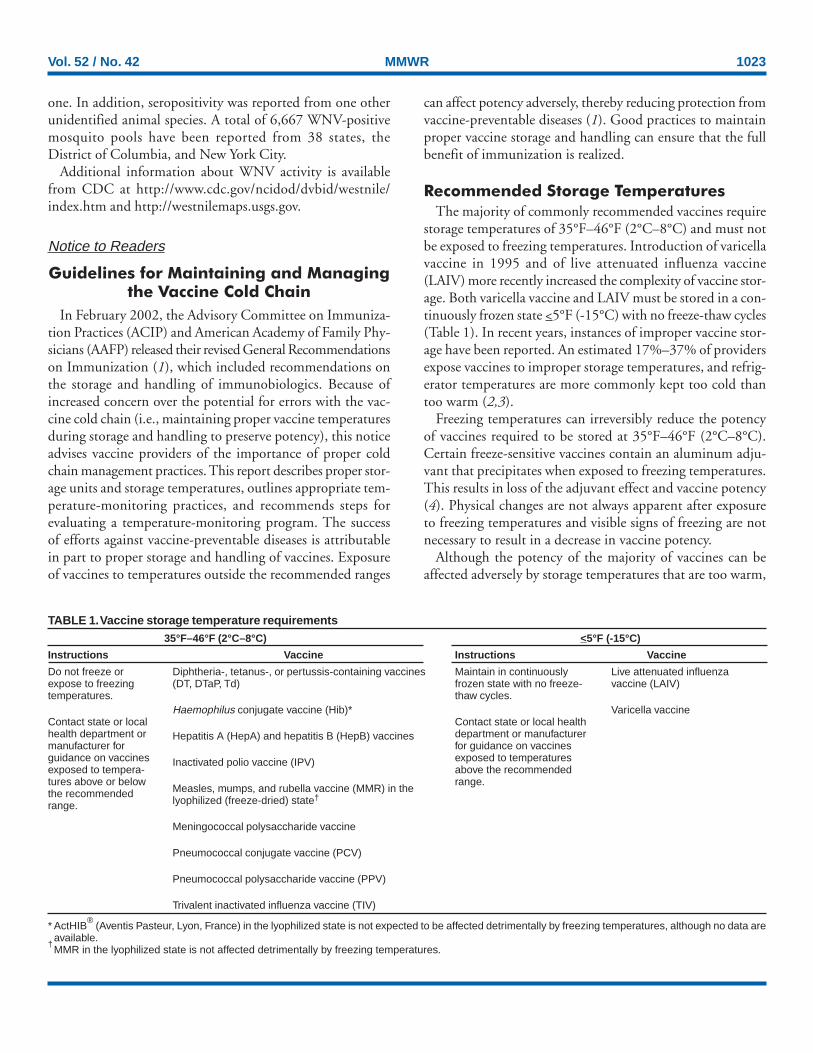
Recommended Storage TemperaturesThe majority of commonly recommended vaccines require
storage temperatures of 35°F–46°F (2°C–8°C) and must notbe exposed to freezing temperatures. Introduction of varicellavaccine in 1995 and of live attenuated influenza vaccine(LAIV) more recently increased the complexity of vaccine stor-age. Both varicella vaccine and LAIV must be stored in a con-tinuously frozen state <5°F (-15°C) with no freeze-thaw cycles(Table 1). In recent years, instances of improper vaccine stor-age have been reported. An estimated 17%–37% of providersexpose vaccines to improper storage temperatures, and refrig-erator temperatures are more commonly kept too cold thantoo warm (2,3).
Freezing temperatures can irreversibly reduce the potencyof vaccines required to be stored at 35°F–46°F (2°C–8°C).Certain freeze-sensitive vaccines contain an aluminum adju-vant that precipitates when exposed to freezing temperatures.This results in loss of the adjuvant effect and vaccine potency(4). Physical changes are not always apparent after exposureto freezing temperatures and visible signs of freezing are notnecessary to result in a decrease in vaccine potency.
Although the potency of the majority of vaccines can beaffected adversely by storage temperatures that are too warm,
TABLE 1. Vaccine storage temperature requirements35°F–46°F (2°C–8°C) <5°F (-15°C)
Instructions
Do not freeze orexpose to freezingtemperatures.
Contact state or localhealth department ormanufacturer forguidance on vaccinesexposed to tempera-tures above or belowthe recommendedrange.
Vaccine
Diphtheria-, tetanus-, or pertussis-containing vaccines(DT, DTaP, Td)
Haemophilus conjugate vaccine (Hib)*
Hepatitis A (HepA) and hepatitis B (HepB) vaccines
Inactivated polio vaccine (IPV)
Measles, mumps, and rubella vaccine (MMR) in thelyophilized (freeze-dried) state†
Meningococcal polysaccharide vaccine
Pneumococcal conjugate vaccine (PCV)
Pneumococcal polysaccharide vaccine (PPV)
Trivalent inactivated influenza vaccine (TIV)
Instructions
Maintain in continuouslyfrozen state with no freeze-thaw cycles.
Contact state or local healthdepartment or manufacturerfor guidance on vaccinesexposed to temperaturesabove the recommendedrange.
Vaccine
Live attenuated influenzavaccine (LAIV)
Varicella vaccine
* ActHIB®
(Aventis Pasteur, Lyon, France) in the lyophilized state is not expected to be affected detrimentally by freezing temperatures, although no data areavailable.
†MMR in the lyophilized state is not affected detrimentally by freezing temperatures.
1024 MMWR October 24, 2003
TABLE 2. Comparison of thermometers used to monitor vaccine temperaturesThermometer type
Standard fluid-filled
Min-max
Continuous chart recorder
Advantages
• Inexpensive and simple to use.• Thermometers encased in biosafe liquids can reflect
vaccine temperatures more accurately.
• Inexpensive.• Monitors temperature range.
• Most accurate.• Continuous 24-hour readings of temperature range and
duration.• Can be recalibrated at regular intervals.
Disadvantages
• Less accurate (+/-1°C).• No information on duration of out of specification
exposure.• No information on min/max temperatures.• Cannot be recalibrated.• Inexpensive models might perform poorly.
• Less accurate (+/-1°C).• No information on duration of out of specification
exposure.• Cannot be recalibrated.
• Most expensive.• Requires most training and maintenance.
these effects are usually more gradual, predictable, and smallerin magnitude than losses from temperatures that are too cold.In contrast, varicella vaccine and LAIV are required to be storedin continuously frozen states and lose potency when storedabove the recommended temperature range.
Vaccine Storage RequirementsVaccine storage units must be selected carefully and used
properly. A combination refrigerator/freezer unit sold for homeuse is acceptable for vaccine storage if the refrigerator andfreezer compartments each have a separate door. However,vaccines should not be stored near the cold air outlet from thefreezer to the refrigerator. Many combination units cool therefrigerator compartment by using air from the freezer com-partment. In these units, the freezer thermostat controls freezertemperature while the refrigerator thermostat controls thevolume of freezer temperature air entering the refrigerator.This can result in different temperature zones within therefrigerator.
Refrigerators without freezers and stand-alone freezers usu-ally perform better at maintaining the precise temperaturesrequired for vaccine storage, and such single-purpose unitssold for home use are less expensive alternatives to medicalspecialty equipment. Any refrigerator or freezer used for vac-cine storage must maintain the required temperature rangeyear-round, be large enough to hold the year’s largest inven-tory, and be dedicated to storage of biologics (i.e., food orbeverages should not be stored in vaccine storage units). Inaddition, vaccines should be stored centrally in the refrigera-tor or freezer, not in the door or on the bottom of the storageunit, and sufficiently away from walls to allow air to circulate.
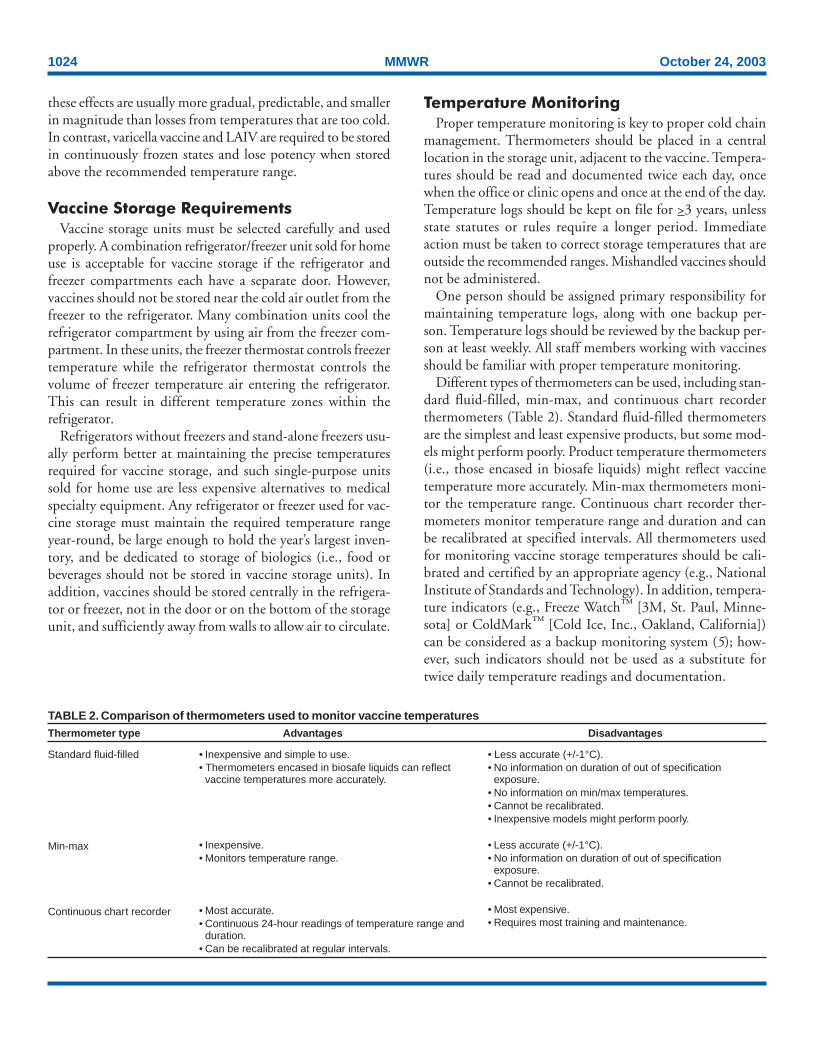
Temperature MonitoringProper temperature monitoring is key to proper cold chain
management. Thermometers should be placed in a centrallocation in the storage unit, adjacent to the vaccine. Tempera-tures should be read and documented twice each day, oncewhen the office or clinic opens and once at the end of the day.Temperature logs should be kept on file for >3 years, unlessstate statutes or rules require a longer period. Immediateaction must be taken to correct storage temperatures that areoutside the recommended ranges. Mishandled vaccines shouldnot be administered.
One person should be assigned primary responsibility formaintaining temperature logs, along with one backup per-son. Temperature logs should be reviewed by the backup per-son at least weekly. All staff members working with vaccinesshould be familiar with proper temperature monitoring.
Different types of thermometers can be used, including stan-dard fluid-filled, min-max, and continuous chart recorderthermometers (Table 2). Standard fluid-filled thermometersare the simplest and least expensive products, but some mod-els might perform poorly. Product temperature thermometers(i.e., those encased in biosafe liquids) might reflect vaccinetemperature more accurately. Min-max thermometers moni-tor the temperature range. Continuous chart recorder ther-mometers monitor temperature range and duration and canbe recalibrated at specified intervals. All thermometers usedfor monitoring vaccine storage temperatures should be cali-brated and certified by an appropriate agency (e.g., NationalInstitute of Standards and Technology). In addition, tempera-ture indicators (e.g., Freeze Watch™ [3M, St. Paul, Minne-sota] or ColdMark™ [Cold Ice, Inc., Oakland, California])can be considered as a backup monitoring system (5); how-ever, such indicators should not be used as a substitute fortwice daily temperature readings and documentation.
Vol. 52 / No. 42 MMWR 1025
All medical care providers who administer vaccines shouldevaluate their cold chain maintenance and management toensure that 1) designated personnel and backup personnel havewritten duties and are trained in vaccine storage and handling;2) accurate thermometers are placed properly in all vaccinestorage units and any limitations of the storage system arefully known; 3) vaccines are placed properly within the refrig-erator or freezer in which proper temperatures are maintained;4) temperature logs are reviewed for completeness and anydeviations from recommended temperature ranges; 5) any out-of-range temperatures prompt immediate action to fix theproblem, with results of these actions documented; 6) anyvaccines exposed to out-of-range temperatures are marked “donot use” and isolated physically; 7) when a problem is discov-ered, the exposed vaccine is maintained at proper tempera-tures while state or local health departments, or the vaccinemanufacturers, are contacted for guidance; and 8) writtenemergency retrieval and storage procedures are in place in caseof equipment failures or power outages. Around-the-clockmonitoring systems might be considered to alert staff to after-hours emergencies, particularly if large vaccine inventories aremaintained.
Additional information on vaccine storage and handling isavailable from the Immunization Action Coalition at http://www.immunize.org/izpractices/index.htm. Links to state andlocal health departments are available at http://www.cdc.gov/other.htm. Especially detailed guidelines from the Common-wealth of Australia on vaccine storage and handling, vaccinestorage units, temperature monitoring, and stability of vac-cines at different temperatures (6) are available at http://immunise.health.gov.au/cool.pdf.References1. CDC. General recommendations on immunization: recommendations
of the Advisory Committee on Immunization Practices (ACIP) and theAmerican Academy of Family Physicians (AAFP). MMWR 2002;51(No.RR-2).
2. Gazmararian JA, Oster NV, Green DC, et al. Vaccine storage practicesin primary care physician offices. Am J Prev Med 2002;23:246–53.
3. Bell KN, Hogue CJ, Manning C, Kendal AP. Risk factors for impropervaccine storage and handling in private provider offices. Pediatrics2001;107:E100.
4. World Health Organization. Thermostability of vaccines. Geneva, Swit-zerland: World Health Organization, 1998; publication no. WHO/GPV/98.07. Available at http://www.who.int/vaccines-documents/DocsPDF/www9661.pdf.
5. World Health Organization. Temperature monitors for vaccines andthe cold chain. Geneva, Switzerland: World Health Organization, 1999;publication no. WHO/V&B/99.15. Available at http://www.who.int/vaccines-documents/DocsPDF/www9804.pdf.
6. Commonwealth Department of Health and Aged Care. Keep it cool:the vaccine cold chain. Guidelines for immunisation providers on main-taining the cold chain, 2nd ed. Canberra, Australia: Commonwealth ofAustralia, 2001.
Notice to Readers
International Conference on EmergingInfectious Diseases
CDC’s National Center for Infectious Diseases, the Coun-cil of State and Territorial Epidemiologists, the AmericanSociety for Microbiology, and the World Health Organiza-tion will cosponsor the International Conference on Emerg-ing Infectious Diseases February 29–March 3, 2004, at theMarriott Marquis Hotel in Atlanta, Georgia. The conferencewill explore the most current research, surveillance, andprevention and control programs addressing all aspects ofemerging infectious diseases. Attendance is limited to 2,500participants.
The conference will include general and plenary sessions,symposia, panels of speakers, presentations on emerginginfections activities, oral and poster presentations, and exhib-its. The deadline for abstract submission for presentations isNovember 14, 2003. Information about submitting abstractsis available at http://www.iceid.org/abssub.asp. Abstractsshould address new, reemerging, or drug-resistant infectiousdiseases that affect human health. The deadline for late-breakerabstracts is January 16, 2004.
Registration information is available at http://www.iceid.organd at http://www.cdc.gov/ncidod and by e-mail [email protected] or at [email protected].
Errata: Vol. 52, No. 40 In the article, “Cigarette Smoking Among Adults — United
States, 2001,” an error occurred in the table on page 955.Total prevalence for persons with 0–12 yrs (no diploma) ofeducation was reported to be 28.4% (95% CI +1.4). The cor-rect prevalence for this population should have been 27.5%(95% CI +1.4).
In the article, “Recommended Adult Immunization Sched-ule — United States, 2003–2004,” on page 968, an incorrectvolume number was given for the fourth reference. The refer-ence should read, “4. CDC. Prevention of pneumococcal dis-ease: recommendations of the Advisory Committee onImmunization Practices (ACIP). MMWR 1997;46(No. RR-8).”
Errata: Vol. 52, No. RR-10In the MMWR Recommendations and Reports, “Guidelines
for Environmental Infection Control in Health-Care Facili-ties: Recommendations of CDC and the Healthcare Infec-tion Control Practices Advisory Committee (HICPAC),”
enr0
Cigarette Smoking Among Adults — United
enr0
States, 2001,”
enr0
Guidelines
enr0
for Environmental Infection Control in Health-Care Facilities:
enr0
Recommendations of CDC and the Healthcare Infection
enr0
Control Practices Advisory Committee (HICPAC),”
enr0
Recommended Adult Immunization Schedule
enr0
— United States, 2003–2004,”
1026 MMWR October 24, 2003
published on June 6, 2003, on page 3, an incorrect referencewas listed in the first complete paragraph of the second column.The citation should read, “Garner JS, Favero MS. CDC guide-line for handwashing and hospital environmental control.Infect Control 1986;7:231–43.”
On page 9, in the second column, paragraph J. should read,“If epidemiologic evidence exists of ongoing transmission offungal disease, conduct an environmental assessment to findand eliminate the source (11,13–16,27,44,49–51,60,81).Category IB.”
On page 10, in Figure 1, the third bullet under the footnoteshould read as follows:
“• air volume differential >125 cfm supply versus exhaust.”On page 11, in Figure 2, the label “Neutral anteroom” should
read “anteroom.” Also, the first, second, and seventh bulletsunder the footnote should read as follows:
“• pressure differential of 2.5 Pa (0.01-in. water gauge)measured at the door between patient room and anteroom;
• air volume differential >125 cfm, depending on anteroomairflow direction (i.e., pressurized versus depressurized);
• anteroom airflow patterns (i.e., anteroom is pressurized intop and middle panels, and depressurized in bottom panel).”
On page 12, in Figure 3, the third bullet under the footnoteshould read as follows:
“• air volume differential >125 cfm exhaust versus supply.”On page 25, under VI. Special Pathogens, paragraph B
should read, “Use standard cleaning and disinfection proto-cols to control environmental contamination with antibiotic-resistant, gram-positive cocci (e.g., methicillin-resistantStaphylococcus aureus, vancomycin-intermediate Staphylococ-cus aureus, or vancomycin-resistant Enterococcus [VRE])(318,320–322). Category IB.”
Online
know what matters.
e ncore.Week after week, MMWR Online plays an important role in helping
you stay informed. From the latest CDC guidance to breaking
health news, count on MMWR Online to deliver the news you
need, when you need it.
Log on to cdc.gov/mmwr and enjoy MMWR performance.
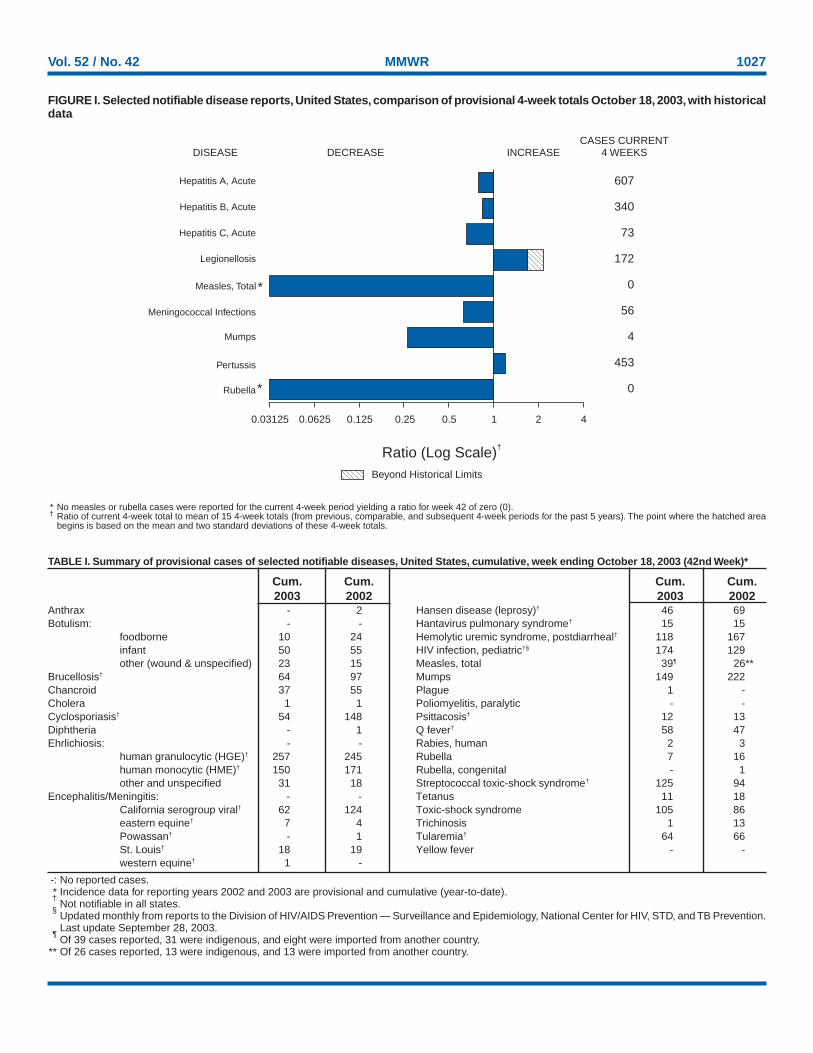
Vol. 52 / No. 42 MMWR 1027
* No measles or rubella cases were reported for the current 4-week period yielding a ratio for week 42 of zero (0).† Ratio of current 4-week total to mean of 15 4-week totals (from previous, comparable, and subsequent 4-week periods for the past 5 years). The point where the hatched area
begins is based on the mean and two standard deviations of these 4-week totals.
FIGURE I. Selected notifiable disease reports, United States, comparison of provisional 4-week totals October 18, 2003, with historicaldata
DISEASE DECREASE INCREASECASES CURRENT
4 WEEKS
Ratio (Log Scale)†
*
Beyond Historical Limits
4210.50.250.125
607
340
73
172
0
56
4
453
0
Hepatitis A, Acute
Hepatitis B, Acute
Hepatitis C, Acute
Legionellosis
Measles, Total
Mumps
Pertussis
Rubella
Meningococcal Infections
0.06250.03125
*
-: No reported cases.* Incidence data for reporting years 2002 and 2003 are provisional and cumulative (year-to-date).†
Not notifiable in all states.§
Updated monthly from reports to the Division of HIV/AIDS Prevention — Surveillance and Epidemiology, National Center for HIV, STD, and TB Prevention.Last update September 28, 2003.
¶Of 39 cases reported, 31 were indigenous, and eight were imported from another country.
** Of 26 cases reported, 13 were indigenous, and 13 were imported from another country.
TABLE I. Summary of provisional cases of selected notifiable diseases, United States, cumulative, week ending October 18, 2003 (42nd Week)*
Cum. Cum. Cum. Cum.2003 2002 2003 2002
Anthrax - 2 Hansen disease (leprosy)† 46 69Botulism: - - Hantavirus pulmonary syndrome† 15 15
foodborne 10 24 Hemolytic uremic syndrome, postdiarrheal† 118 167infant 50 55 HIV infection, pediatric†§ 174 129other (wound & unspecified) 23 15 Measles, total 39¶ 26**
Brucellosis† 64 97 Mumps 149 222Chancroid 37 55 Plague 1 -Cholera 1 1 Poliomyelitis, paralytic - -Cyclosporiasis† 54 148 Psittacosis† 12 13Diphtheria - 1 Q fever† 58 47Ehrlichiosis: - - Rabies, human 2 3
human granulocytic (HGE)† 257 245 Rubella 7 16human monocytic (HME)† 150 171 Rubella, congenital - 1other and unspecified 31 18 Streptococcal toxic-shock syndrome† 125 94
Encephalitis/Meningitis: - - Tetanus 11 18California serogroup viral† 62 124 Toxic-shock syndrome 105 86eastern equine† 7 4 Trichinosis 1 13Powassan† - 1 Tularemia† 64 66St. Louis† 18 19 Yellow fever - -western equine† 1 -
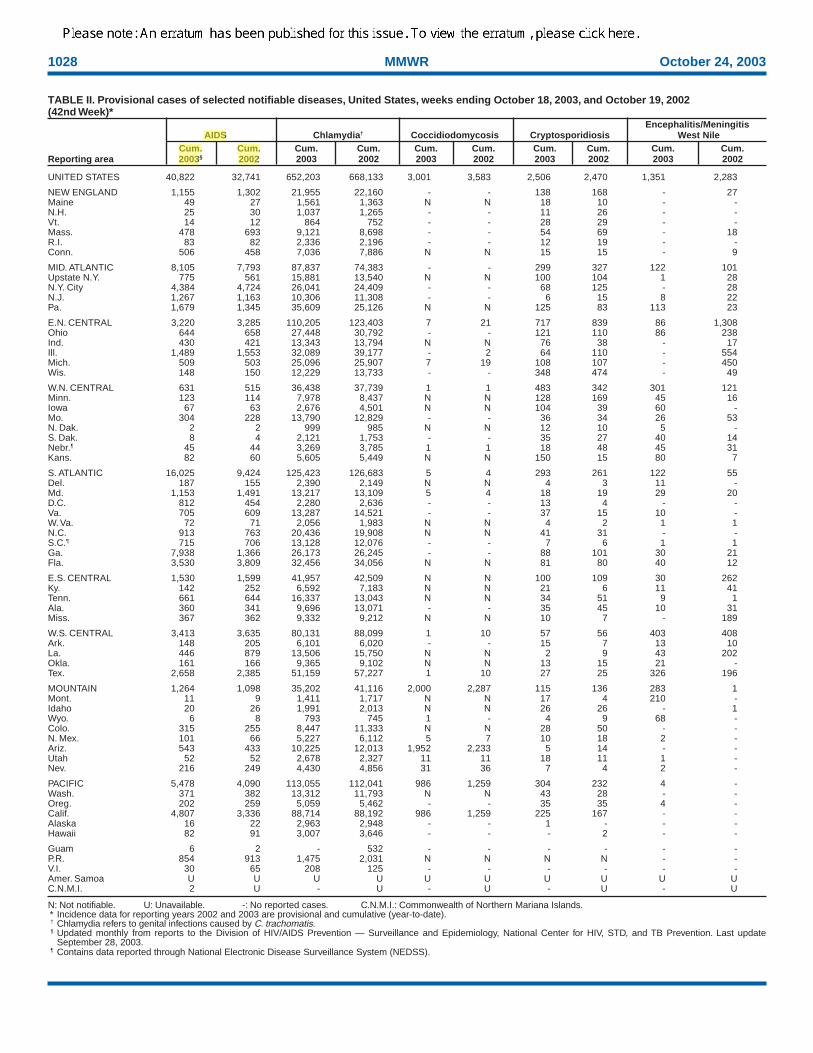
1028 MMWR October 24, 2003
N: Not notifiable. U: Unavailable. -: No reported cases. C.N.M.I.: Commonwealth of Northern Mariana Islands.* Incidence data for reporting years 2002 and 2003 are provisional and cumulative (year-to-date).† Chlamydia refers to genital infections caused by C. trachomatis.§ Updated monthly from reports to the Division of HIV/AIDS Prevention — Surveillance and Epidemiology, National Center for HIV, STD, and TB Prevention. Last update
September 28, 2003.¶ Contains data reported through National Electronic Disease Surveillance System (NEDSS).
TABLE II. Provisional cases of selected notifiable diseases, United States, weeks ending October 18, 2003, and October 19, 2002(42nd Week)*
Encephalitis/MeningitisAIDS Chlamydia† Coccidiodomycosis Cryptosporidiosis West Nile
Cum. Cum. Cum. Cum. Cum. Cum. Cum. Cum. Cum. Cum.Reporting area 2003§ 2002 2003 2002 2003 2002 2003 2002 2003 2002
UNITED STATES 40,822 32,741 652,203 668,133 3,001 3,583 2,506 2,470 1,351 2,283
NEW ENGLAND 1,155 1,302 21,955 22,160 - - 138 168 - 27Maine 49 27 1,561 1,363 N N 18 10 - -N.H. 25 30 1,037 1,265 - - 11 26 - -Vt. 14 12 864 752 - - 28 29 - -Mass. 478 693 9,121 8,698 - - 54 69 - 18R.I. 83 82 2,336 2,196 - - 12 19 - -Conn. 506 458 7,036 7,886 N N 15 15 - 9
MID. ATLANTIC 8,105 7,793 87,837 74,383 - - 299 327 122 101Upstate N.Y. 775 561 15,881 13,540 N N 100 104 1 28N.Y. City 4,384 4,724 26,041 24,409 - - 68 125 - 28N.J. 1,267 1,163 10,306 11,308 - - 6 15 8 22Pa. 1,679 1,345 35,609 25,126 N N 125 83 113 23
E.N. CENTRAL 3,220 3,285 110,205 123,403 7 21 717 839 86 1,308Ohio 644 658 27,448 30,792 - - 121 110 86 238Ind. 430 421 13,343 13,794 N N 76 38 - 17Ill. 1,489 1,553 32,089 39,177 - 2 64 110 - 554Mich. 509 503 25,096 25,907 7 19 108 107 - 450Wis. 148 150 12,229 13,733 - - 348 474 - 49
W.N. CENTRAL 631 515 36,438 37,739 1 1 483 342 301 121Minn. 123 114 7,978 8,437 N N 128 169 45 16Iowa 67 63 2,676 4,501 N N 104 39 60 -Mo. 304 228 13,790 12,829 - - 36 34 26 53N. Dak. 2 2 999 985 N N 12 10 5 -S. Dak. 8 4 2,121 1,753 - - 35 27 40 14Nebr.¶ 45 44 3,269 3,785 1 1 18 48 45 31Kans. 82 60 5,605 5,449 N N 150 15 80 7
S. ATLANTIC 16,025 9,424 125,423 126,683 5 4 293 261 122 55Del. 187 155 2,390 2,149 N N 4 3 11 -Md. 1,153 1,491 13,217 13,109 5 4 18 19 29 20D.C. 812 454 2,280 2,636 - - 13 4 - -Va. 705 609 13,287 14,521 - - 37 15 10 -W. Va. 72 71 2,056 1,983 N N 4 2 1 1N.C. 913 763 20,436 19,908 N N 41 31 - -S.C.¶ 715 706 13,128 12,076 - - 7 6 1 1Ga. 7,938 1,366 26,173 26,245 - - 88 101 30 21Fla. 3,530 3,809 32,456 34,056 N N 81 80 40 12
E.S. CENTRAL 1,530 1,599 41,957 42,509 N N 100 109 30 262Ky. 142 252 6,592 7,183 N N 21 6 11 41Tenn. 661 644 16,337 13,043 N N 34 51 9 1Ala. 360 341 9,696 13,071 - - 35 45 10 31Miss. 367 362 9,332 9,212 N N 10 7 - 189
W.S. CENTRAL 3,413 3,635 80,131 88,099 1 10 57 56 403 408Ark. 148 205 6,101 6,020 - - 15 7 13 10La. 446 879 13,506 15,750 N N 2 9 43 202Okla. 161 166 9,365 9,102 N N 13 15 21 -Tex. 2,658 2,385 51,159 57,227 1 10 27 25 326 196
MOUNTAIN 1,264 1,098 35,202 41,116 2,000 2,287 115 136 283 1Mont. 11 9 1,411 1,717 N N 17 4 210 -Idaho 20 26 1,991 2,013 N N 26 26 - 1Wyo. 6 8 793 745 1 - 4 9 68 -Colo. 315 255 8,447 11,333 N N 28 50 - -N. Mex. 101 66 5,227 6,112 5 7 10 18 2 -Ariz. 543 433 10,225 12,013 1,952 2,233 5 14 - -Utah 52 52 2,678 2,327 11 11 18 11 1 -Nev. 216 249 4,430 4,856 31 36 7 4 2 -
PACIFIC 5,478 4,090 113,055 112,041 986 1,259 304 232 4 -Wash. 371 382 13,312 11,793 N N 43 28 - -Oreg. 202 259 5,059 5,462 - - 35 35 4 -Calif. 4,807 3,336 88,714 88,192 986 1,259 225 167 - -Alaska 16 22 2,963 2,948 - - 1 - - -Hawaii 82 91 3,007 3,646 - - - 2 - -
Guam 6 2 - 532 - - - - - -P.R. 854 913 1,475 2,031 N N N N - -V.I. 30 65 208 125 - - - - - -Amer. Samoa U U U U U U U U U UC.N.M.I. 2 U - U - U - U - U
enr0
AIDS
enr0
Cum.
enr0
2003
enr0
Cum.
enr0
2002
enr0
Please note: An erratum has been published for this issue. To view the erratum, please click here.
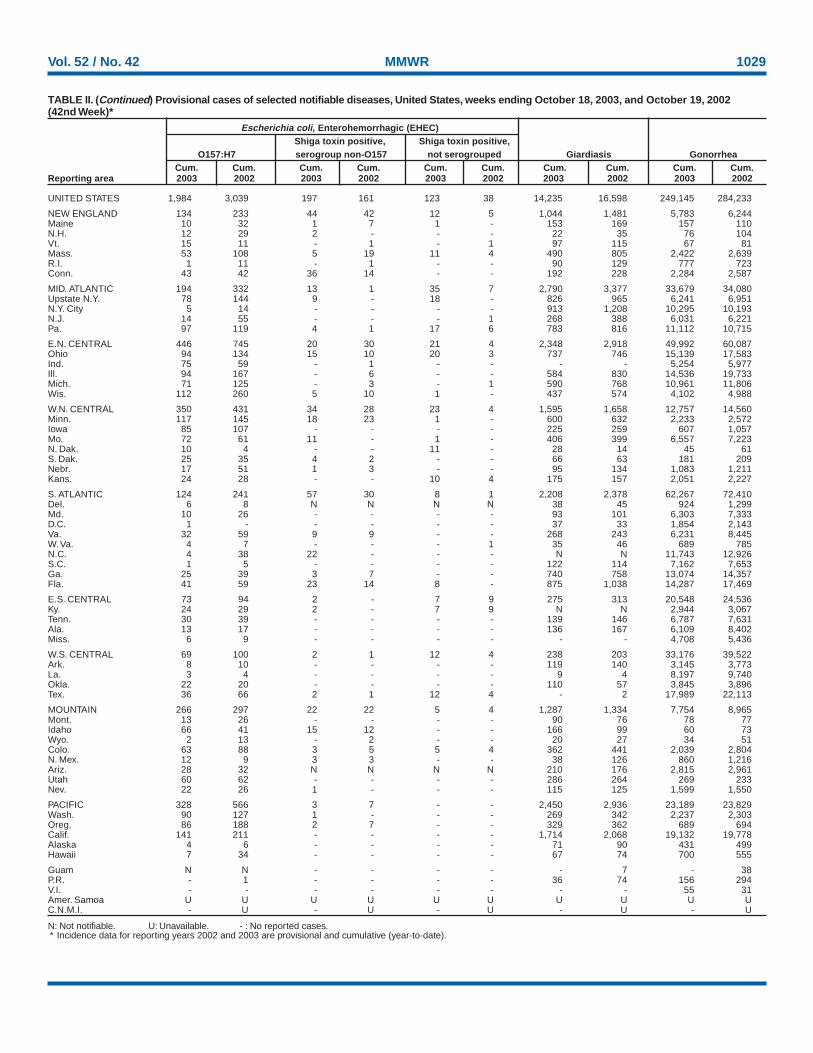
Vol. 52 / No. 42 MMWR 1029
N: Not notifiable. U: Unavailable. - : No reported cases.* Incidence data for reporting years 2002 and 2003 are provisional and cumulative (year-to-date).
TABLE II. (Continued) Provisional cases of selected notifiable diseases, United States, weeks ending October 18, 2003, and October 19, 2002(42nd Week)*
Escherichia coli, Enterohemorrhagic (EHEC)Shiga toxin positive, Shiga toxin positive,
O157:H7 serogroup non-O157 not serogrouped Giardiasis GonorrheaCum. Cum. Cum. Cum. Cum. Cum. Cum. Cum. Cum. Cum.
Reporting area 2003 2002 2003 2002 2003 2002 2003 2002 2003 2002
UNITED STATES 1,984 3,039 197 161 123 38 14,235 16,598 249,145 284,233
NEW ENGLAND 134 233 44 42 12 5 1,044 1,481 5,783 6,244Maine 10 32 1 7 1 - 153 169 157 110N.H. 12 29 2 - - - 22 35 76 104Vt. 15 11 - 1 - 1 97 115 67 81Mass. 53 108 5 19 11 4 490 805 2,422 2,639R.I. 1 11 - 1 - - 90 129 777 723Conn. 43 42 36 14 - - 192 228 2,284 2,587
MID. ATLANTIC 194 332 13 1 35 7 2,790 3,377 33,679 34,080Upstate N.Y. 78 144 9 - 18 - 826 965 6,241 6,951N.Y. City 5 14 - - - - 913 1,208 10,295 10,193N.J. 14 55 - - - 1 268 388 6,031 6,221Pa. 97 119 4 1 17 6 783 816 11,112 10,715
E.N. CENTRAL 446 745 20 30 21 4 2,348 2,918 49,992 60,087Ohio 94 134 15 10 20 3 737 746 15,139 17,583Ind. 75 59 - 1 - - - - 5,254 5,977Ill. 94 167 - 6 - - 584 830 14,536 19,733Mich. 71 125 - 3 - 1 590 768 10,961 11,806Wis. 112 260 5 10 1 - 437 574 4,102 4,988
W.N. CENTRAL 350 431 34 28 23 4 1,595 1,658 12,757 14,560Minn. 117 145 18 23 1 - 600 632 2,233 2,572Iowa 85 107 - - - - 225 259 607 1,057Mo. 72 61 11 - 1 - 406 399 6,557 7,223N. Dak. 10 4 - - 11 - 28 14 45 61S. Dak. 25 35 4 2 - - 66 63 181 209Nebr. 17 51 1 3 - - 95 134 1,083 1,211Kans. 24 28 - - 10 4 175 157 2,051 2,227
S. ATLANTIC 124 241 57 30 8 1 2,208 2,378 62,267 72,410Del. 6 8 N N N N 38 45 924 1,299Md. 10 26 - - - - 93 101 6,303 7,333D.C. 1 - - - - - 37 33 1,854 2,143Va. 32 59 9 9 - - 268 243 6,231 8,445W. Va. 4 7 - - - 1 35 46 689 785N.C. 4 38 22 - - - N N 11,743 12,926S.C. 1 5 - - - - 122 114 7,162 7,653Ga. 25 39 3 7 - - 740 758 13,074 14,357Fla. 41 59 23 14 8 - 875 1,038 14,287 17,469
E.S. CENTRAL 73 94 2 - 7 9 275 313 20,548 24,536Ky. 24 29 2 - 7 9 N N 2,944 3,067Tenn. 30 39 - - - - 139 146 6,787 7,631Ala. 13 17 - - - - 136 167 6,109 8,402Miss. 6 9 - - - - - - 4,708 5,436
W.S. CENTRAL 69 100 2 1 12 4 238 203 33,176 39,522Ark. 8 10 - - - - 119 140 3,145 3,773La. 3 4 - - - - 9 4 8,197 9,740Okla. 22 20 - - - - 110 57 3,845 3,896Tex. 36 66 2 1 12 4 - 2 17,989 22,113
MOUNTAIN 266 297 22 22 5 4 1,287 1,334 7,754 8,965Mont. 13 26 - - - - 90 76 78 77Idaho 66 41 15 12 - - 166 99 60 73Wyo. 2 13 - 2 - - 20 27 34 51Colo. 63 88 3 5 5 4 362 441 2,039 2,804N. Mex. 12 9 3 3 - - 38 126 860 1,216Ariz. 28 32 N N N N 210 176 2,815 2,961Utah 60 62 - - - - 286 264 269 233Nev. 22 26 1 - - - 115 125 1,599 1,550
PACIFIC 328 566 3 7 - - 2,450 2,936 23,189 23,829Wash. 90 127 1 - - - 269 342 2,237 2,303Oreg. 86 188 2 7 - - 329 362 689 694Calif. 141 211 - - - - 1,714 2,068 19,132 19,778Alaska 4 6 - - - - 71 90 431 499Hawaii 7 34 - - - - 67 74 700 555
Guam N N - - - - - 7 - 38P.R. - 1 - - - - 36 74 156 294V.I. - - - - - - - - 55 31Amer. Samoa U U U U U U U U U UC.N.M.I. - U - U - U - U - U
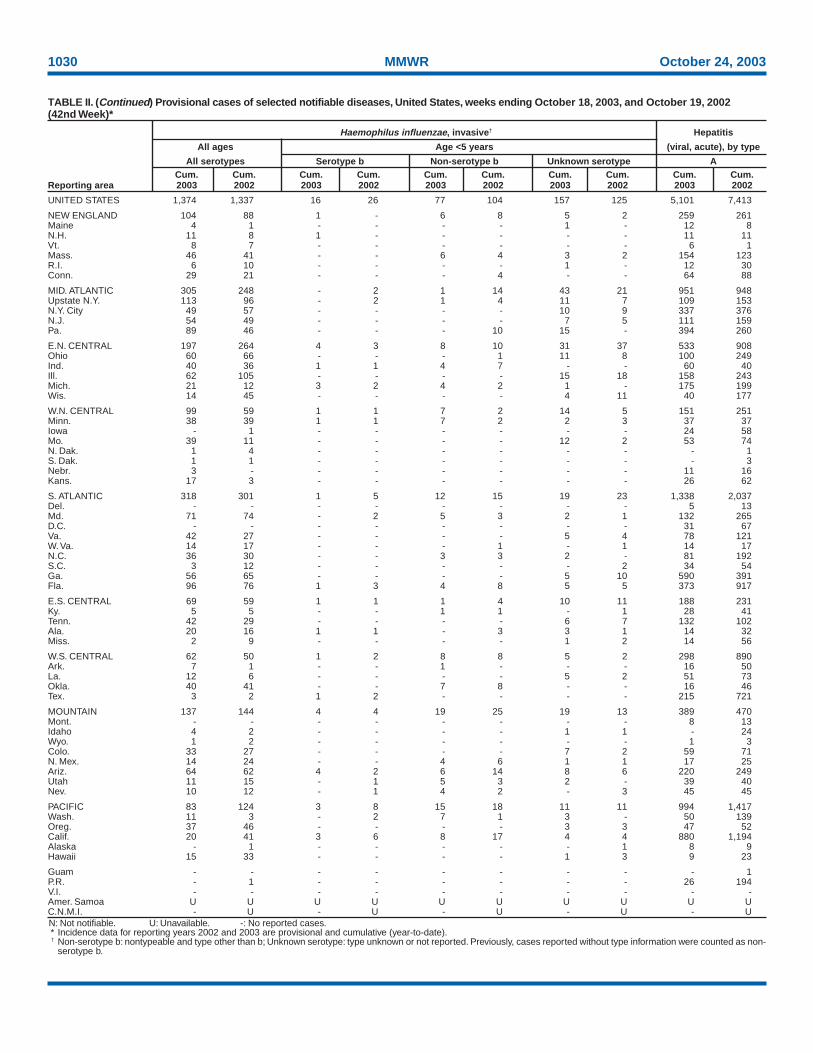
1030 MMWR October 24, 2003
N: Not notifiable. U: Unavailable. -: No reported cases.* Incidence data for reporting years 2002 and 2003 are provisional and cumulative (year-to-date).† Non-serotype b: nontypeable and type other than b; Unknown serotype: type unknown or not reported. Previously, cases reported without type information were counted as non-
serotype b.
TABLE II. (Continued) Provisional cases of selected notifiable diseases, United States, weeks ending October 18, 2003, and October 19, 2002(42nd Week)*
Haemophilus influenzae, invasive† Hepatitis
All ages Age <5 years (viral, acute), by type
All serotypes Serotype b Non-serotype b Unknown serotype ACum. Cum. Cum. Cum. Cum. Cum. Cum. Cum. Cum. Cum.
Reporting area 2003 2002 2003 2002 2003 2002 2003 2002 2003 2002
UNITED STATES 1,374 1,337 16 26 77 104 157 125 5,101 7,413
NEW ENGLAND 104 88 1 - 6 8 5 2 259 261Maine 4 1 - - - - 1 - 12 8N.H. 11 8 1 - - - - - 11 11Vt. 8 7 - - - - - - 6 1Mass. 46 41 - - 6 4 3 2 154 123R.I. 6 10 - - - - 1 - 12 30Conn. 29 21 - - - 4 - - 64 88
MID. ATLANTIC 305 248 - 2 1 14 43 21 951 948Upstate N.Y. 113 96 - 2 1 4 11 7 109 153N.Y. City 49 57 - - - - 10 9 337 376N.J. 54 49 - - - - 7 5 111 159Pa. 89 46 - - - 10 15 - 394 260
E.N. CENTRAL 197 264 4 3 8 10 31 37 533 908Ohio 60 66 - - - 1 11 8 100 249Ind. 40 36 1 1 4 7 - - 60 40Ill. 62 105 - - - - 15 18 158 243Mich. 21 12 3 2 4 2 1 - 175 199Wis. 14 45 - - - - 4 11 40 177
W.N. CENTRAL 99 59 1 1 7 2 14 5 151 251Minn. 38 39 1 1 7 2 2 3 37 37Iowa - 1 - - - - - - 24 58Mo. 39 11 - - - - 12 2 53 74N. Dak. 1 4 - - - - - - - 1S. Dak. 1 1 - - - - - - - 3Nebr. 3 - - - - - - - 11 16Kans. 17 3 - - - - - - 26 62
S. ATLANTIC 318 301 1 5 12 15 19 23 1,338 2,037Del. - - - - - - - - 5 13Md. 71 74 - 2 5 3 2 1 132 265D.C. - - - - - - - - 31 67Va. 42 27 - - - - 5 4 78 121W. Va. 14 17 - - - 1 - 1 14 17N.C. 36 30 - - 3 3 2 - 81 192S.C. 3 12 - - - - - 2 34 54Ga. 56 65 - - - - 5 10 590 391Fla. 96 76 1 3 4 8 5 5 373 917
E.S. CENTRAL 69 59 1 1 1 4 10 11 188 231Ky. 5 5 - - 1 1 - 1 28 41Tenn. 42 29 - - - - 6 7 132 102Ala. 20 16 1 1 - 3 3 1 14 32Miss. 2 9 - - - - 1 2 14 56
W.S. CENTRAL 62 50 1 2 8 8 5 2 298 890Ark. 7 1 - - 1 - - - 16 50La. 12 6 - - - - 5 2 51 73Okla. 40 41 - - 7 8 - - 16 46Tex. 3 2 1 2 - - - - 215 721
MOUNTAIN 137 144 4 4 19 25 19 13 389 470Mont. - - - - - - - - 8 13Idaho 4 2 - - - - 1 1 - 24Wyo. 1 2 - - - - - - 1 3Colo. 33 27 - - - - 7 2 59 71N. Mex. 14 24 - - 4 6 1 1 17 25Ariz. 64 62 4 2 6 14 8 6 220 249Utah 11 15 - 1 5 3 2 - 39 40Nev. 10 12 - 1 4 2 - 3 45 45
PACIFIC 83 124 3 8 15 18 11 11 994 1,417Wash. 11 3 - 2 7 1 3 - 50 139Oreg. 37 46 - - - - 3 3 47 52Calif. 20 41 3 6 8 17 4 4 880 1,194Alaska - 1 - - - - - 1 8 9Hawaii 15 33 - - - - 1 3 9 23
Guam - - - - - - - - - 1P.R. - 1 - - - - - - 26 194V.I. - - - - - - - - - -Amer. Samoa U U U U U U U U U UC.N.M.I. - U - U - U - U - U
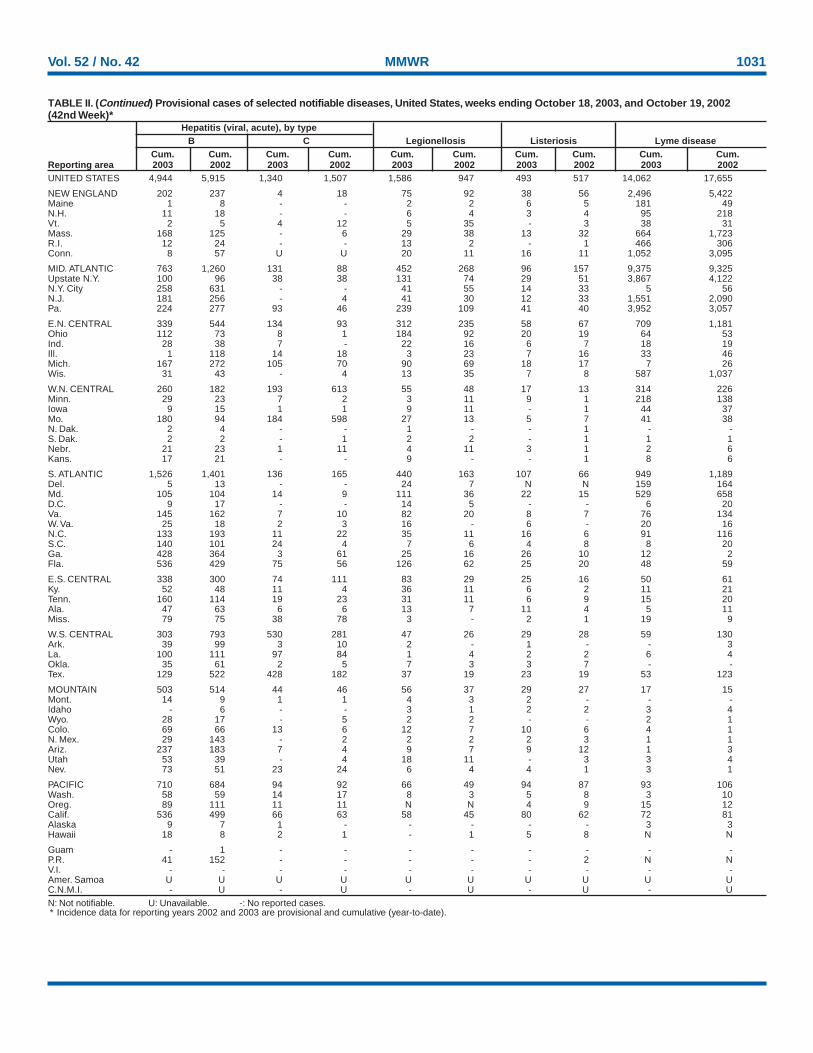
Vol. 52 / No. 42 MMWR 1031
N: Not notifiable. U: Unavailable. -: No reported cases.* Incidence data for reporting years 2002 and 2003 are provisional and cumulative (year-to-date).
TABLE II. (Continued) Provisional cases of selected notifiable diseases, United States, weeks ending October 18, 2003, and October 19, 2002(42nd Week)*
Hepatitis (viral, acute), by typeB C Legionellosis Listeriosis Lyme disease
Cum. Cum. Cum. Cum. Cum. Cum. Cum. Cum. Cum. Cum.Reporting area 2003 2002 2003 2002 2003 2002 2003 2002 2003 2002UNITED STATES 4,944 5,915 1,340 1,507 1,586 947 493 517 14,062 17,655
NEW ENGLAND 202 237 4 18 75 92 38 56 2,496 5,422Maine 1 8 - - 2 2 6 5 181 49N.H. 11 18 - - 6 4 3 4 95 218Vt. 2 5 4 12 5 35 - 3 38 31Mass. 168 125 - 6 29 38 13 32 664 1,723R.I. 12 24 - - 13 2 - 1 466 306Conn. 8 57 U U 20 11 16 11 1,052 3,095
MID. ATLANTIC 763 1,260 131 88 452 268 96 157 9,375 9,325Upstate N.Y. 100 96 38 38 131 74 29 51 3,867 4,122N.Y. City 258 631 - - 41 55 14 33 5 56N.J. 181 256 - 4 41 30 12 33 1,551 2,090Pa. 224 277 93 46 239 109 41 40 3,952 3,057
E.N. CENTRAL 339 544 134 93 312 235 58 67 709 1,181Ohio 112 73 8 1 184 92 20 19 64 53Ind. 28 38 7 - 22 16 6 7 18 19Ill. 1 118 14 18 3 23 7 16 33 46Mich. 167 272 105 70 90 69 18 17 7 26Wis. 31 43 - 4 13 35 7 8 587 1,037
W.N. CENTRAL 260 182 193 613 55 48 17 13 314 226Minn. 29 23 7 2 3 11 9 1 218 138Iowa 9 15 1 1 9 11 - 1 44 37Mo. 180 94 184 598 27 13 5 7 41 38N. Dak. 2 4 - - 1 - - 1 - -S. Dak. 2 2 - 1 2 2 - 1 1 1Nebr. 21 23 1 11 4 11 3 1 2 6Kans. 17 21 - - 9 - - 1 8 6
S. ATLANTIC 1,526 1,401 136 165 440 163 107 66 949 1,189Del. 5 13 - - 24 7 N N 159 164Md. 105 104 14 9 111 36 22 15 529 658D.C. 9 17 - - 14 5 - - 6 20Va. 145 162 7 10 82 20 8 7 76 134W. Va. 25 18 2 3 16 - 6 - 20 16N.C. 133 193 11 22 35 11 16 6 91 116S.C. 140 101 24 4 7 6 4 8 8 20Ga. 428 364 3 61 25 16 26 10 12 2Fla. 536 429 75 56 126 62 25 20 48 59
E.S. CENTRAL 338 300 74 111 83 29 25 16 50 61Ky. 52 48 11 4 36 11 6 2 11 21Tenn. 160 114 19 23 31 11 6 9 15 20Ala. 47 63 6 6 13 7 11 4 5 11Miss. 79 75 38 78 3 - 2 1 19 9
W.S. CENTRAL 303 793 530 281 47 26 29 28 59 130Ark. 39 99 3 10 2 - 1 - - 3La. 100 111 97 84 1 4 2 2 6 4Okla. 35 61 2 5 7 3 3 7 - -Tex. 129 522 428 182 37 19 23 19 53 123
MOUNTAIN 503 514 44 46 56 37 29 27 17 15Mont. 14 9 1 1 4 3 2 - - -Idaho - 6 - - 3 1 2 2 3 4Wyo. 28 17 - 5 2 2 - - 2 1Colo. 69 66 13 6 12 7 10 6 4 1N. Mex. 29 143 - 2 2 2 2 3 1 1Ariz. 237 183 7 4 9 7 9 12 1 3Utah 53 39 - 4 18 11 - 3 3 4Nev. 73 51 23 24 6 4 4 1 3 1
PACIFIC 710 684 94 92 66 49 94 87 93 106Wash. 58 59 14 17 8 3 5 8 3 10Oreg. 89 111 11 11 N N 4 9 15 12Calif. 536 499 66 63 58 45 80 62 72 81Alaska 9 7 1 - - - - - 3 3Hawaii 18 8 2 1 - 1 5 8 N N
Guam - 1 - - - - - - - -P.R. 41 152 - - - - - 2 N NV.I. - - - - - - - - - -Amer. Samoa U U U U U U U U U UC.N.M.I. - U - U - U - U - U
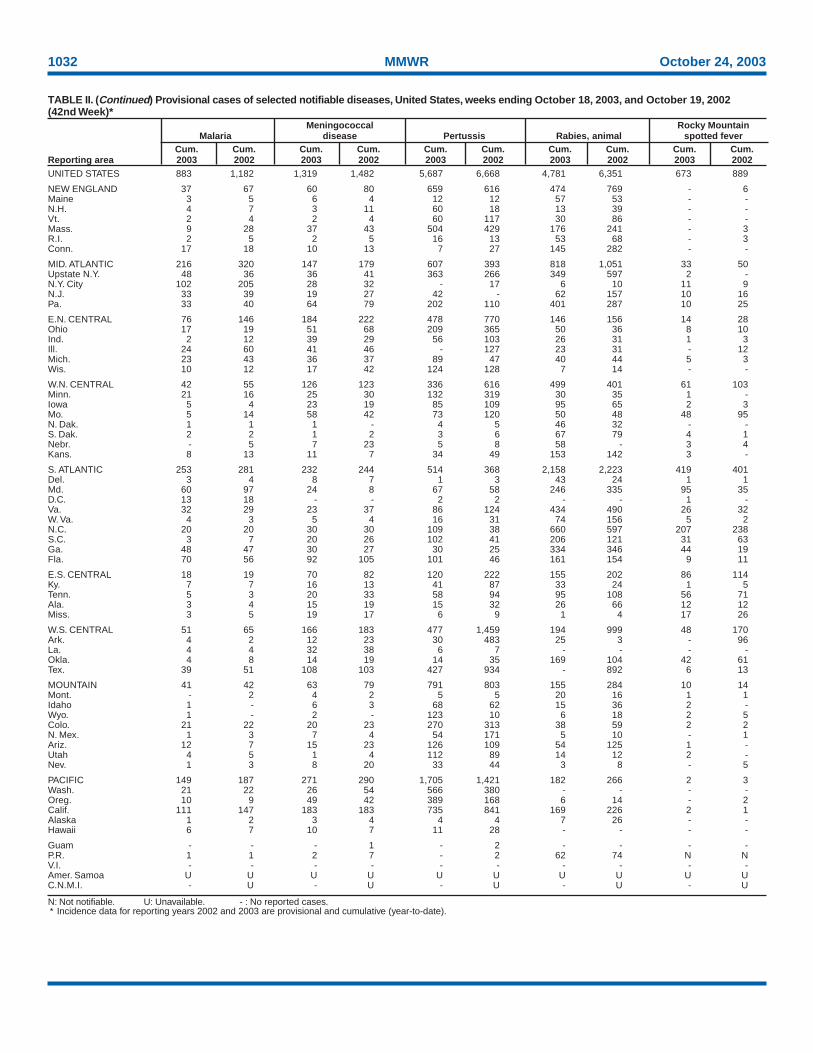
1032 MMWR October 24, 2003
N: Not notifiable. U: Unavailable. - : No reported cases.* Incidence data for reporting years 2002 and 2003 are provisional and cumulative (year-to-date).
TABLE II. (Continued) Provisional cases of selected notifiable diseases, United States, weeks ending October 18, 2003, and October 19, 2002(42nd Week)*
Meningococcal Rocky MountainMalaria disease Pertussis Rabies, animal spotted fever
Cum. Cum. Cum. Cum. Cum. Cum. Cum. Cum. Cum. Cum.Reporting area 2003 2002 2003 2002 2003 2002 2003 2002 2003 2002UNITED STATES 883 1,182 1,319 1,482 5,687 6,668 4,781 6,351 673 889
NEW ENGLAND 37 67 60 80 659 616 474 769 - 6Maine 3 5 6 4 12 12 57 53 - -N.H. 4 7 3 11 60 18 13 39 - -Vt. 2 4 2 4 60 117 30 86 - -Mass. 9 28 37 43 504 429 176 241 - 3R.I. 2 5 2 5 16 13 53 68 - 3Conn. 17 18 10 13 7 27 145 282 - -
MID. ATLANTIC 216 320 147 179 607 393 818 1,051 33 50Upstate N.Y. 48 36 36 41 363 266 349 597 2 -N.Y. City 102 205 28 32 - 17 6 10 11 9N.J. 33 39 19 27 42 - 62 157 10 16Pa. 33 40 64 79 202 110 401 287 10 25
E.N. CENTRAL 76 146 184 222 478 770 146 156 14 28Ohio 17 19 51 68 209 365 50 36 8 10Ind. 2 12 39 29 56 103 26 31 1 3Ill. 24 60 41 46 - 127 23 31 - 12Mich. 23 43 36 37 89 47 40 44 5 3Wis. 10 12 17 42 124 128 7 14 - -
W.N. CENTRAL 42 55 126 123 336 616 499 401 61 103Minn. 21 16 25 30 132 319 30 35 1 -Iowa 5 4 23 19 85 109 95 65 2 3Mo. 5 14 58 42 73 120 50 48 48 95N. Dak. 1 1 1 - 4 5 46 32 - -S. Dak. 2 2 1 2 3 6 67 79 4 1Nebr. - 5 7 23 5 8 58 - 3 4Kans. 8 13 11 7 34 49 153 142 3 -
S. ATLANTIC 253 281 232 244 514 368 2,158 2,223 419 401Del. 3 4 8 7 1 3 43 24 1 1Md. 60 97 24 8 67 58 246 335 95 35D.C. 13 18 - - 2 2 - - 1 -Va. 32 29 23 37 86 124 434 490 26 32W. Va. 4 3 5 4 16 31 74 156 5 2N.C. 20 20 30 30 109 38 660 597 207 238S.C. 3 7 20 26 102 41 206 121 31 63Ga. 48 47 30 27 30 25 334 346 44 19Fla. 70 56 92 105 101 46 161 154 9 11
E.S. CENTRAL 18 19 70 82 120 222 155 202 86 114Ky. 7 7 16 13 41 87 33 24 1 5Tenn. 5 3 20 33 58 94 95 108 56 71Ala. 3 4 15 19 15 32 26 66 12 12Miss. 3 5 19 17 6 9 1 4 17 26
W.S. CENTRAL 51 65 166 183 477 1,459 194 999 48 170Ark. 4 2 12 23 30 483 25 3 - 96La. 4 4 32 38 6 7 - - - -Okla. 4 8 14 19 14 35 169 104 42 61Tex. 39 51 108 103 427 934 - 892 6 13
MOUNTAIN 41 42 63 79 791 803 155 284 10 14Mont. - 2 4 2 5 5 20 16 1 1Idaho 1 - 6 3 68 62 15 36 2 -Wyo. 1 - 2 - 123 10 6 18 2 5Colo. 21 22 20 23 270 313 38 59 2 2N. Mex. 1 3 7 4 54 171 5 10 - 1Ariz. 12 7 15 23 126 109 54 125 1 -Utah 4 5 1 4 112 89 14 12 2 -Nev. 1 3 8 20 33 44 3 8 - 5
PACIFIC 149 187 271 290 1,705 1,421 182 266 2 3Wash. 21 22 26 54 566 380 - - - -Oreg. 10 9 49 42 389 168 6 14 - 2Calif. 111 147 183 183 735 841 169 226 2 1Alaska 1 2 3 4 4 4 7 26 - -Hawaii 6 7 10 7 11 28 - - - -
Guam - - - 1 - 2 - - - -P.R. 1 1 2 7 - 2 62 74 N NV.I. - - - - - - - - - -Amer. Samoa U U U U U U U U U UC.N.M.I. - U - U - U - U - U
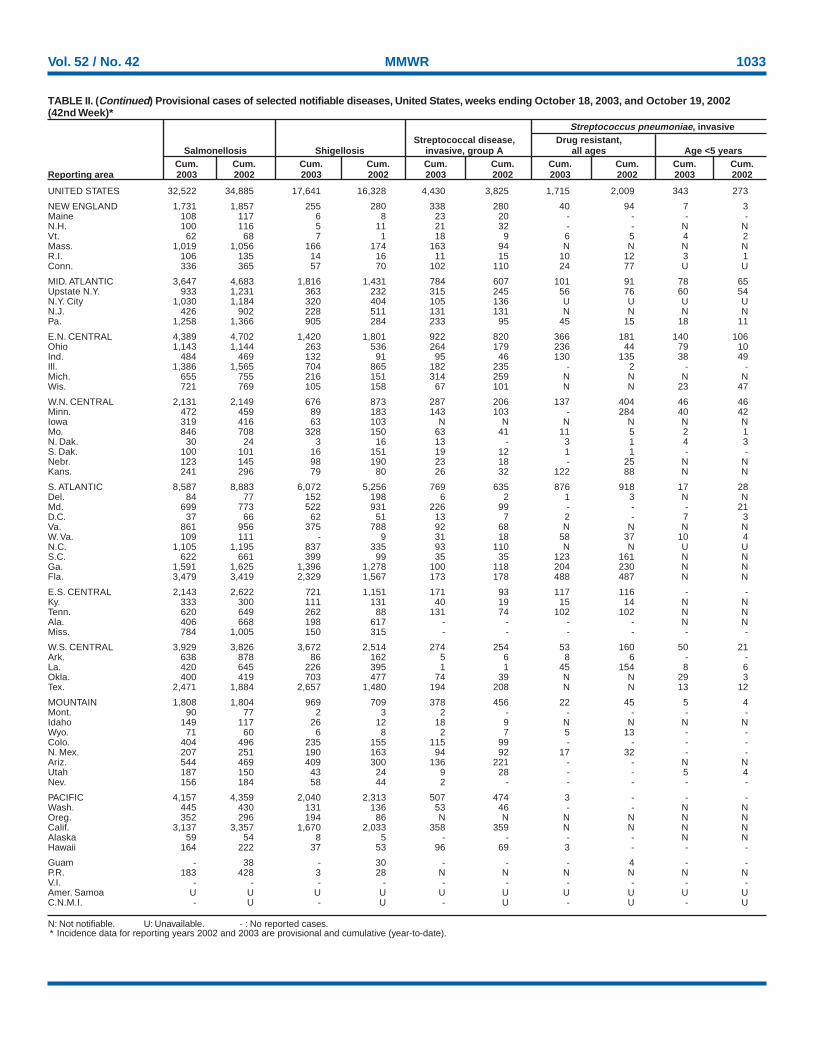
Vol. 52 / No. 42 MMWR 1033
N: Not notifiable. U: Unavailable. - : No reported cases.* Incidence data for reporting years 2002 and 2003 are provisional and cumulative (year-to-date).
TABLE II. (Continued) Provisional cases of selected notifiable diseases, United States, weeks ending October 18, 2003, and October 19, 2002(42nd Week)*
Streptococcus pneumoniae, invasiveStreptococcal disease, Drug resistant,
Salmonellosis Shigellosis invasive, group A all ages Age <5 yearsCum. Cum. Cum. Cum. Cum. Cum. Cum. Cum. Cum. Cum.
Reporting area 2003 2002 2003 2002 2003 2002 2003 2002 2003 2002
UNITED STATES 32,522 34,885 17,641 16,328 4,430 3,825 1,715 2,009 343 273
NEW ENGLAND 1,731 1,857 255 280 338 280 40 94 7 3Maine 108 117 6 8 23 20 - - - -N.H. 100 116 5 11 21 32 - - N NVt. 62 68 7 1 18 9 6 5 4 2Mass. 1,019 1,056 166 174 163 94 N N N NR.I. 106 135 14 16 11 15 10 12 3 1Conn. 336 365 57 70 102 110 24 77 U U
MID. ATLANTIC 3,647 4,683 1,816 1,431 784 607 101 91 78 65Upstate N.Y. 933 1,231 363 232 315 245 56 76 60 54N.Y. City 1,030 1,184 320 404 105 136 U U U UN.J. 426 902 228 511 131 131 N N N NPa. 1,258 1,366 905 284 233 95 45 15 18 11
E.N. CENTRAL 4,389 4,702 1,420 1,801 922 820 366 181 140 106Ohio 1,143 1,144 263 536 264 179 236 44 79 10Ind. 484 469 132 91 95 46 130 135 38 49Ill. 1,386 1,565 704 865 182 235 - 2 - -Mich. 655 755 216 151 314 259 N N N NWis. 721 769 105 158 67 101 N N 23 47
W.N. CENTRAL 2,131 2,149 676 873 287 206 137 404 46 46Minn. 472 459 89 183 143 103 - 284 40 42Iowa 319 416 63 103 N N N N N NMo. 846 708 328 150 63 41 11 5 2 1N. Dak. 30 24 3 16 13 - 3 1 4 3S. Dak. 100 101 16 151 19 12 1 1 - -Nebr. 123 145 98 190 23 18 - 25 N NKans. 241 296 79 80 26 32 122 88 N N
S. ATLANTIC 8,587 8,883 6,072 5,256 769 635 876 918 17 28Del. 84 77 152 198 6 2 1 3 N NMd. 699 773 522 931 226 99 - - - 21D.C. 37 66 62 51 13 7 2 - 7 3Va. 861 956 375 788 92 68 N N N NW. Va. 109 111 - 9 31 18 58 37 10 4N.C. 1,105 1,195 837 335 93 110 N N U US.C. 622 661 399 99 35 35 123 161 N NGa. 1,591 1,625 1,396 1,278 100 118 204 230 N NFla. 3,479 3,419 2,329 1,567 173 178 488 487 N N
E.S. CENTRAL 2,143 2,622 721 1,151 171 93 117 116 - -Ky. 333 300 111 131 40 19 15 14 N NTenn. 620 649 262 88 131 74 102 102 N NAla. 406 668 198 617 - - - - N NMiss. 784 1,005 150 315 - - - - - -
W.S. CENTRAL 3,929 3,826 3,672 2,514 274 254 53 160 50 21Ark. 638 878 86 162 5 6 8 6 - -La. 420 645 226 395 1 1 45 154 8 6Okla. 400 419 703 477 74 39 N N 29 3Tex. 2,471 1,884 2,657 1,480 194 208 N N 13 12
MOUNTAIN 1,808 1,804 969 709 378 456 22 45 5 4Mont. 90 77 2 3 2 - - - - -Idaho 149 117 26 12 18 9 N N N NWyo. 71 60 6 8 2 7 5 13 - -Colo. 404 496 235 155 115 99 - - - -N. Mex. 207 251 190 163 94 92 17 32 - -Ariz. 544 469 409 300 136 221 - - N NUtah 187 150 43 24 9 28 - - 5 4Nev. 156 184 58 44 2 - - - - -
PACIFIC 4,157 4,359 2,040 2,313 507 474 3 - - -Wash. 445 430 131 136 53 46 - - N NOreg. 352 296 194 86 N N N N N NCalif. 3,137 3,357 1,670 2,033 358 359 N N N NAlaska 59 54 8 5 - - - - N NHawaii 164 222 37 53 96 69 3 - - -
Guam - 38 - 30 - - - 4 - -P.R. 183 428 3 28 N N N N N NV.I. - - - - - - - - - -Amer. Samoa U U U U U U U U U UC.N.M.I. - U - U - U - U - U
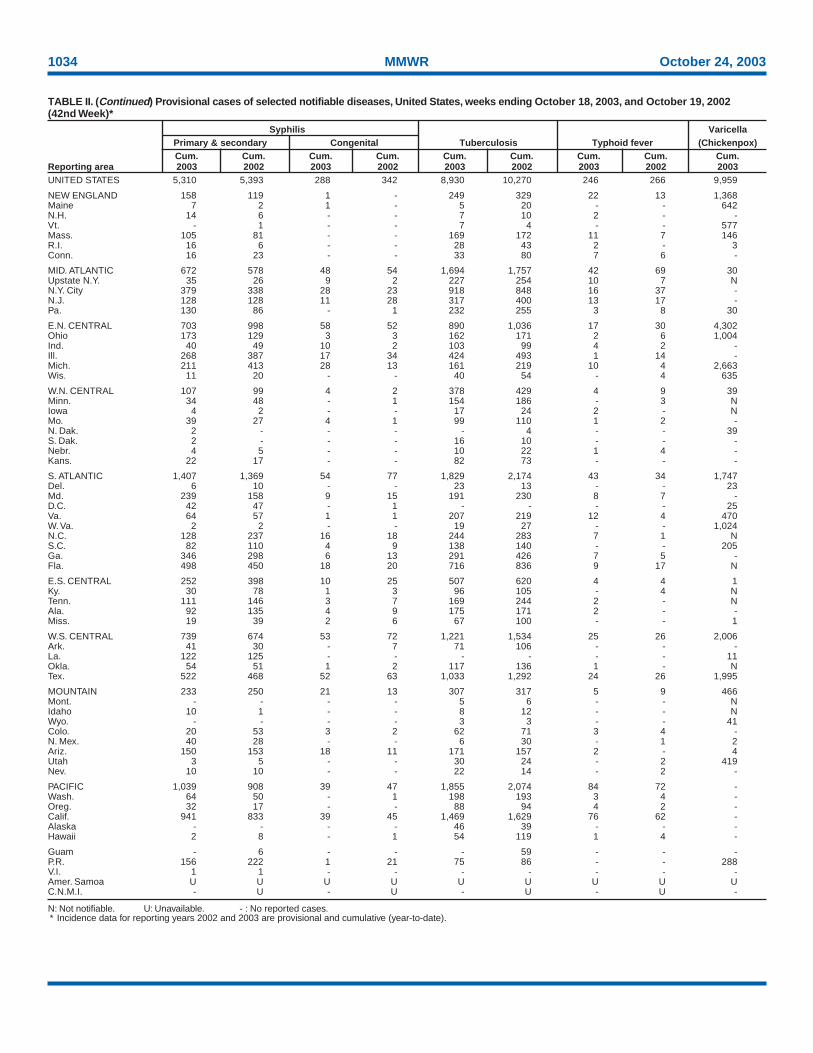
1034 MMWR October 24, 2003
N: Not notifiable. U: Unavailable. - : No reported cases.* Incidence data for reporting years 2002 and 2003 are provisional and cumulative (year-to-date).
TABLE II. (Continued) Provisional cases of selected notifiable diseases, United States, weeks ending October 18, 2003, and October 19, 2002(42nd Week)*
Syphilis VaricellaPrimary & secondary Congenital Tuberculosis Typhoid fever (Chickenpox)Cum. Cum. Cum. Cum. Cum. Cum. Cum. Cum. Cum.
Reporting area 2003 2002 2003 2002 2003 2002 2003 2002 2003UNITED STATES 5,310 5,393 288 342 8,930 10,270 246 266 9,959
NEW ENGLAND 158 119 1 - 249 329 22 13 1,368Maine 7 2 1 - 5 20 - - 642N.H. 14 6 - - 7 10 2 - -Vt. - 1 - - 7 4 - - 577Mass. 105 81 - - 169 172 11 7 146R.I. 16 6 - - 28 43 2 - 3Conn. 16 23 - - 33 80 7 6 -
MID. ATLANTIC 672 578 48 54 1,694 1,757 42 69 30Upstate N.Y. 35 26 9 2 227 254 10 7 NN.Y. City 379 338 28 23 918 848 16 37 -N.J. 128 128 11 28 317 400 13 17 -Pa. 130 86 - 1 232 255 3 8 30
E.N. CENTRAL 703 998 58 52 890 1,036 17 30 4,302Ohio 173 129 3 3 162 171 2 6 1,004Ind. 40 49 10 2 103 99 4 2 -Ill. 268 387 17 34 424 493 1 14 -Mich. 211 413 28 13 161 219 10 4 2,663Wis. 11 20 - - 40 54 - 4 635
W.N. CENTRAL 107 99 4 2 378 429 4 9 39Minn. 34 48 - 1 154 186 - 3 NIowa 4 2 - - 17 24 2 - NMo. 39 27 4 1 99 110 1 2 -N. Dak. 2 - - - - 4 - - 39S. Dak. 2 - - - 16 10 - - -Nebr. 4 5 - - 10 22 1 4 -Kans. 22 17 - - 82 73 - - -
S. ATLANTIC 1,407 1,369 54 77 1,829 2,174 43 34 1,747Del. 6 10 - - 23 13 - - 23Md. 239 158 9 15 191 230 8 7 -D.C. 42 47 - 1 - - - - 25Va. 64 57 1 1 207 219 12 4 470W. Va. 2 2 - - 19 27 - - 1,024N.C. 128 237 16 18 244 283 7 1 NS.C. 82 110 4 9 138 140 - - 205Ga. 346 298 6 13 291 426 7 5 -Fla. 498 450 18 20 716 836 9 17 N
E.S. CENTRAL 252 398 10 25 507 620 4 4 1Ky. 30 78 1 3 96 105 - 4 NTenn. 111 146 3 7 169 244 2 - NAla. 92 135 4 9 175 171 2 - -Miss. 19 39 2 6 67 100 - - 1
W.S. CENTRAL 739 674 53 72 1,221 1,534 25 26 2,006Ark. 41 30 - 7 71 106 - - -La. 122 125 - - - - - - 11Okla. 54 51 1 2 117 136 1 - NTex. 522 468 52 63 1,033 1,292 24 26 1,995
MOUNTAIN 233 250 21 13 307 317 5 9 466Mont. - - - - 5 6 - - NIdaho 10 1 - - 8 12 - - NWyo. - - - - 3 3 - - 41Colo. 20 53 3 2 62 71 3 4 -N. Mex. 40 28 - - 6 30 - 1 2Ariz. 150 153 18 11 171 157 2 - 4Utah 3 5 - - 30 24 - 2 419Nev. 10 10 - - 22 14 - 2 -
PACIFIC 1,039 908 39 47 1,855 2,074 84 72 -Wash. 64 50 - 1 198 193 3 4 -Oreg. 32 17 - - 88 94 4 2 -Calif. 941 833 39 45 1,469 1,629 76 62 -Alaska - - - - 46 39 - - -Hawaii 2 8 - 1 54 119 1 4 -
Guam - 6 - - - 59 - - -P.R. 156 222 1 21 75 86 - - 288V.I. 1 1 - - - - - - -Amer. Samoa U U U U U U U U UC.N.M.I. - U - U - U - U -

Vol. 52 / No. 42 MMWR 1035
U: Unavailable. -:No reported cases.* Mortality data in this table are voluntarily reported from 122 cities in the United States, most of which have populations of >100,000. A death is reported by the place of its
occurrence and by the week that the death certificate was filed. Fetal deaths are not included.† Pneumonia and influenza.§ Because of changes in reporting methods in this Pennsylvania city, these numbers are partial counts for the current week. Complete counts will be available in 4 to 6 weeks.¶ Total includes unknown ages.
TABLE III. Deaths in 122 U.S. cities,* week ending October 18, 2003 (42nd Week)All causes, by age (years) All causes, by age (years)
All P&I† All P&I†
Reporting Area Ages >65 45-64 25-44 1-24 <1 Total Reporting Area Ages >65 45-64 25-44 1-24 <1 Total
NEW ENGLAND 527 381 96 32 8 10 58Boston, Mass. 129 88 25 9 2 5 17Bridgeport, Conn. 45 35 7 3 - - 8Cambridge, Mass. 21 17 2 2 - - -Fall River, Mass. 23 20 1 1 - 1 -Hartford, Conn. 52 29 13 7 2 1 4Lowell, Mass. 24 13 9 1 - 1 2Lynn, Mass. 11 9 - 2 - - -New Bedford, Mass. 29 27 1 - 1 - -New Haven, Conn. U U U U U U UProvidence, R.I. 52 41 8 2 - 1 8Somerville, Mass. 4 4 - - - - -Springfield, Mass. 34 20 12 - 2 - 5Waterbury, Conn. 34 22 8 3 1 - 2Worcester, Mass. 69 56 10 2 - 1 12
MID. ATLANTIC 2,033 1,439 392 132 34 35 113Albany, N.Y. 50 41 4 4 - 1 4Allentown, Pa. 22 20 - 1 1 - 2Buffalo, N.Y. 112 91 16 3 2 - 6Camden, N.J. 40 29 4 3 - 4 4Elizabeth, N.J. 17 13 3 - - 1 2Erie, Pa. 39 31 7 1 - - -Jersey City, N.J. 48 32 10 6 - - -New York City, N.Y. 915 621 195 70 10 18 42Newark, N.J. 37 17 10 7 2 1 3Paterson, N.J. 22 13 9 - - - 1Philadelphia, Pa. 349 243 71 17 13 5 17Pittsburgh, Pa.§ 30 23 6 1 - - 4Reading, Pa. 24 19 3 - 1 1 3Rochester, N.Y. 137 99 25 10 2 1 9Schenectady, N.Y. 21 20 - - 1 - 1Scranton, Pa. 23 21 1 - 1 - 2Syracuse, N.Y. 89 67 12 7 1 2 8Trenton, N.J. 15 10 4 1 - - -Utica, N.Y. 20 14 6 - - - 2Yonkers, N.Y. 23 15 6 1 - 1 3
E.N. CENTRAL 1,816 1,205 398 136 37 40 108Akron, Ohio 58 41 9 4 2 2 3Canton, Ohio 35 22 9 4 - - 3Chicago, Ill. 335 205 73 39 8 10 24Cincinnati, Ohio 75 46 23 1 1 4 12Cleveland, Ohio 115 78 25 9 1 2 8Columbus, Ohio 171 114 37 13 4 3 7Dayton, Ohio 111 79 23 7 2 - 8Detroit, Mich. 173 94 53 17 6 3 8Evansville, Ind. 44 32 8 3 1 - 1Fort Wayne, Ind. 63 43 18 - - 2 2Gary, Ind. 14 7 2 5 - - -Grand Rapids, Mich. 47 27 13 4 1 2 2Indianapolis, Ind. 188 113 48 14 5 8 12Lansing, Mich. 39 28 8 3 - - -Milwaukee, Wis. 85 69 9 3 2 2 7Peoria, Ill. 50 37 11 2 - - 1Rockford, Ill. 43 33 9 1 - - 3South Bend, Ind. 40 34 4 2 - - 3Toledo, Ohio 84 65 9 4 4 2 3Youngstown, Ohio 46 38 7 1 - - 1
W.N. CENTRAL 542 353 132 34 10 13 41Des Moines, Iowa 55 36 14 1 1 3 5Duluth, Minn. 33 22 8 2 - 1 3Kansas City, Kans. 53 35 13 5 - - 5Kansas City, Mo. 89 52 27 5 1 4 6Lincoln, Nebr. 48 38 7 - 1 2 3Minneapolis, Minn. 53 35 9 5 3 1 4Omaha, Nebr. 68 46 18 - 3 1 9St. Louis, Mo. U U U U U U USt. Paul, Minn. 48 35 7 6 - - 4Wichita, Kans. 95 54 29 10 1 1 2
S. ATLANTIC 1,231 742 322 100 47 20 58Atlanta, Ga. 146 67 44 22 6 7 1Baltimore, Md. 193 106 51 22 11 3 16Charlotte, N.C. 115 69 33 6 6 1 9Jacksonville, Fla. 151 103 39 7 2 - 9Miami, Fla. 80 52 15 10 2 1 2Norfolk, Va. 59 39 10 3 5 2 -Richmond, Va. 62 39 14 3 3 3 5Savannah, Ga. 51 38 11 1 1 - 3St. Petersburg, Fla. 81 63 15 3 - - 3Tampa, Fla. 168 105 51 10 2 - 7Washington, D.C. 100 44 33 11 9 3 1Wilmington, Del. 25 17 6 2 - - 2
E.S. CENTRAL 681 445 151 48 19 18 32Birmingham, Ala. 9 8 1 - - - 9Chattanooga, Tenn. 77 59 14 1 2 1 2Knoxville, Tenn. 107 61 30 9 3 4 -Lexington, Ky. 47 35 8 4 - - 1Memphis, Tenn. 149 86 33 21 3 6 5Mobile, Ala. 93 65 21 3 1 3 2Montgomery, Ala. 37 26 7 1 3 - 2Nashville, Tenn. 162 105 37 9 7 4 11
W.S. CENTRAL 1,334 867 283 113 42 29 86Austin, Tex. 94 64 13 11 3 3 7Baton Rouge, La. 17 7 7 1 2 - -Corpus Christi, Tex. 54 37 13 2 2 - 2Dallas, Tex. 166 100 33 20 8 5 12El Paso, Tex. 72 48 11 7 6 - 2Ft. Worth, Tex. 112 72 19 8 3 10 7Houston, Tex. 340 197 92 34 8 9 26Little Rock, Ark. 57 41 9 5 1 1 2New Orleans, La. 31 14 10 7 - - -San Antonio, Tex. 238 174 46 12 6 - 17Shreveport, La. 39 32 2 3 1 1 3Tulsa, Okla. 114 81 28 3 2 - 8
MOUNTAIN 898 580 151 64 20 13 58Albuquerque, N.M. 110 80 12 11 4 3 10Boise, Idaho 27 23 2 1 - 1 2Colo. Springs, Colo. 60 40 12 7 1 - 6Denver, Colo. 104 67 19 10 4 4 7Las Vegas, Nev. 226 157 46 18 4 1 11Ogden, Utah 24 17 6 - - 1 3Phoenix, Ariz. 71 - - - 1 - 2Pueblo, Colo. 39 26 7 6 - - 2Salt Lake City, Utah 112 80 24 5 1 2 10Tucson, Ariz. 125 90 23 6 5 1 5
PACIFIC 1,292 879 263 92 28 30 98Berkeley, Calif. 20 11 7 1 1 - -Fresno, Calif. 48 38 6 2 1 1 7Glendale, Calif. 9 7 2 - - - 1Honolulu, Hawaii 83 64 11 3 2 3 9Long Beach, Calif. 46 21 17 8 - - 9Los Angeles, Calif. 228 150 46 22 5 5 20Pasadena, Calif. U U U U U U UPortland, Oreg. 77 51 14 8 1 3 4Sacramento, Calif. 185 128 35 11 7 4 8San Diego, Calif. 147 108 25 8 5 1 9San Francisco, Calif. U U U U U U USan Jose, Calif. 148 99 35 7 1 6 11Santa Cruz, Calif. 29 22 5 2 - - 3Seattle, Wash. 130 77 34 10 3 6 6Spokane, Wash. 44 29 11 3 - 1 5Tacoma, Wash. 98 74 15 7 2 - 6
TOTAL 10,354¶ 6,891 2,188 751 245 208 652
MMWR
The Morbidity and Mortality Weekly Report (MMWR) Series is prepared by the Centers for Disease Control and Prevention (CDC) and is available free of chargein electronic format and on a paid subscription basis for paper copy. To receive an electronic copy each week, send an e-mail message to [email protected]. Thebody content should read SUBscribe mmwr-toc. Electronic copy also is available from CDC’s World-Wide Web server at http://www.cdc.gov/mmwr or from CDC’sfile transfer protocol server at ftp://ftp.cdc.gov/pub/publications/mmwr. To subscribe for paper copy, contact Superintendent of Documents, U.S. GovernmentPrinting Office, Washington, DC 20402; telephone 202-512-1800.
Data in the weekly MMWR are provisional, based on weekly reports to CDC by state health departments. The reporting week concludes at close of business onFriday; compiled data on a national basis are officially released to the public on the following Friday. Address inquiries about the MMWR Series, including materialto be considered for publication, to Editor, MMWR Series, Mailstop C-08, CDC, 1600 Clifton Rd., N.E., Atlanta, GA 30333; telephone 888-232-3228.
All material in the MMWR Series is in the public domain and may be used and reprinted without permission; citation as to source, however, is appreciated.
All MMWR references are available on the Internet at http://www.cdc.gov/mmwr. Use the search function to find specific articles.
Use of trade names and commercial sources is for identification only and does not imply endorsement by the U.S. Department of Health and Human Services.
References to non-CDC sites on the Internet are provided as a service to MMWR readers and do not constitute or imply endorsement of these organizations ortheir programs by CDC or the U.S. Department of Health and Human Services. CDC is not responsible for the content of these sites. URL addresses listed inMMWR were current as of the date of publication.
✩ U.S. Government Printing Office: 2004-633-140/69151 Region IV ISSN: 0149-2195
1036 October 24, 2003