Weekly Market Review - Home | Envestnet€¦ · FOR ONE-ON-ONE USE WITH A CLIENT’S FINANCIAL...
16
FOR ONE-ON-ONE USE WITH A CLIENT’S FINANCIAL ADVISOR ONLY. Weekly Market Review Chart of the Week November 10, 2017 1 Talking Points • Domestic equity large cap stocks outperformed small caps, while growth-oriented stocks outperformed value. US equities outperformed international developed markets, while emerging markets was left relatively unchanged. • Treasury yields were up slightly from last week. The yield on the 10-Year Treasury Note hovers around 2.4%. • Commodities ended up from last week, with West Texas Intermediate Crude Oil prices rising approximately 3%. • The dollar index was down slightly. The dollar ended lower against a basket of major currencies. • Among other economic data, the four-week moving average for seasonally adjusted initial unemployment claims decreased to 231,250. This represents the lowest level for this average since 1973. Unemployment remains around 4.1%, considered by economists to represent full employment. Weekly Highlights • The NASDAQ Composite Index, which is heavily weighted to information technology stocks, has had an especially strong year, returning over 30% as of Thursday, November 9. The NASDAQ has experienced 64 all-time closings highs this year, more than any other year on record. • Bitcoin, a highly volatile cryptocurrency, was down more than 5% on Friday, falling over $1,000 since Wednesday’s highs. The currency now trades below $7,000. • After gold’s decline in last week’s trading, gold prices gained more than 1% on the week, its largest weekly gain in more than a month. Concerns over delays for US tax reform and the likelihood of a December Federal Reserve rate hike helped to fuel the increase. 0 50 100 150 200 250 300 Nov-16 Jan-17 Mar-17 May-17 Jul-17 Sep-17 Thousands Non-Farm Payrolls-Trailing 12 Mos. Source: Bloomberg
Transcript of Weekly Market Review - Home | Envestnet€¦ · FOR ONE-ON-ONE USE WITH A CLIENT’S FINANCIAL...

FOR ONE-ON-ONE USE WITH A CLIENT’S FINANCIAL ADVISOR ONLY.
Weekly Market Review
Chart of the Week
November 10, 2017
1
Talking Points • Domestic equity large cap
stocks outperformed small caps, while growth-oriented stocks outperformed value. US equities outperformed international developed markets, while emerging markets was left relatively unchanged.
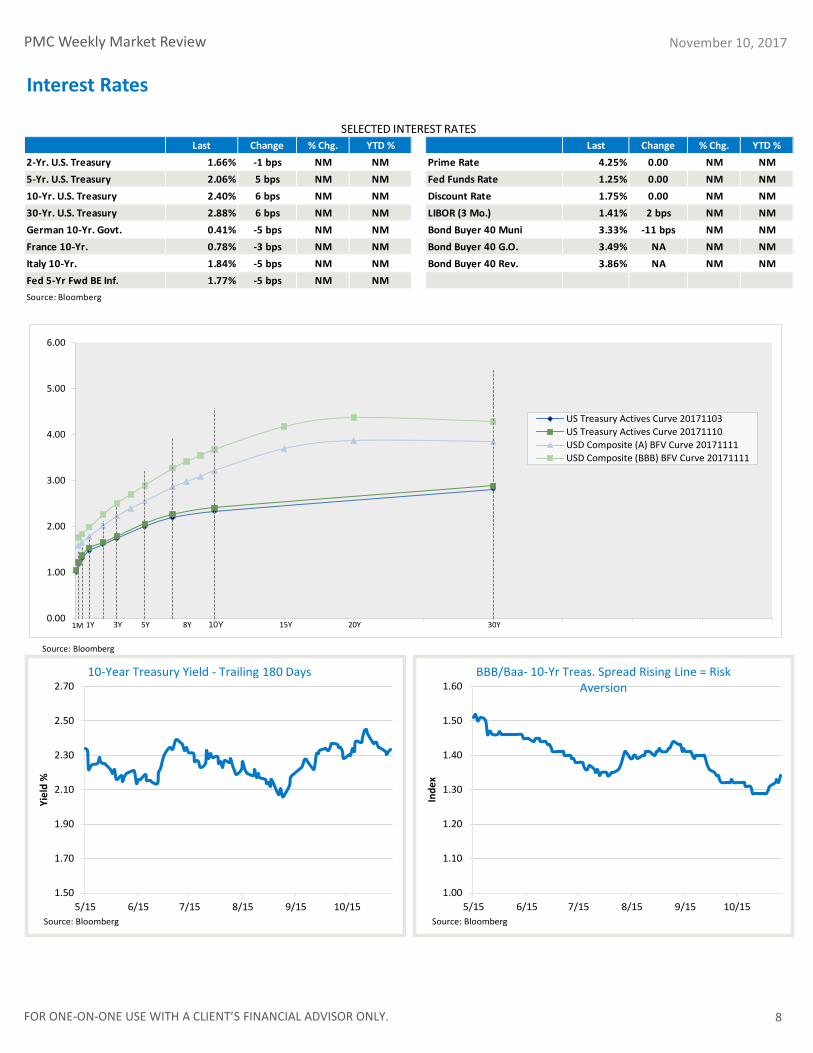
• Treasury yields were up slightly from last week. The yield on the 10-Year Treasury Note hovers around 2.4%.
• Commodities ended up from last week, with West Texas Intermediate Crude Oil prices rising approximately 3%.
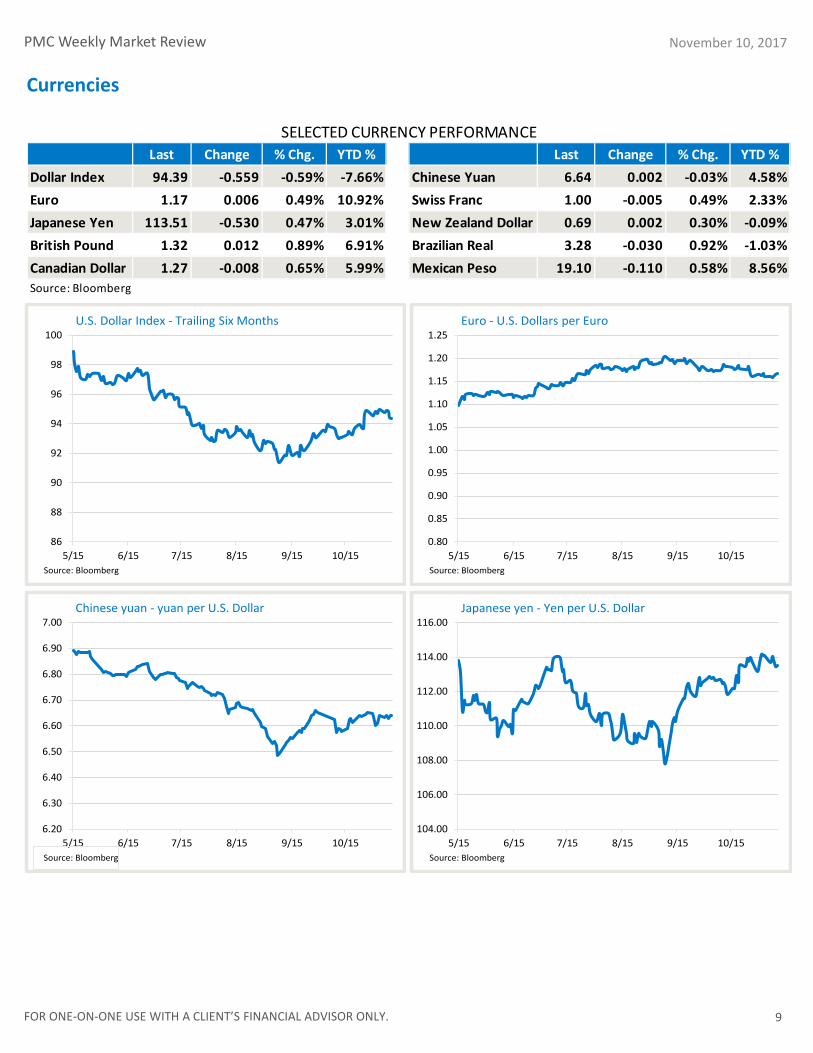
• The dollar index was down slightly. The dollar ended lower against a basket of major currencies.
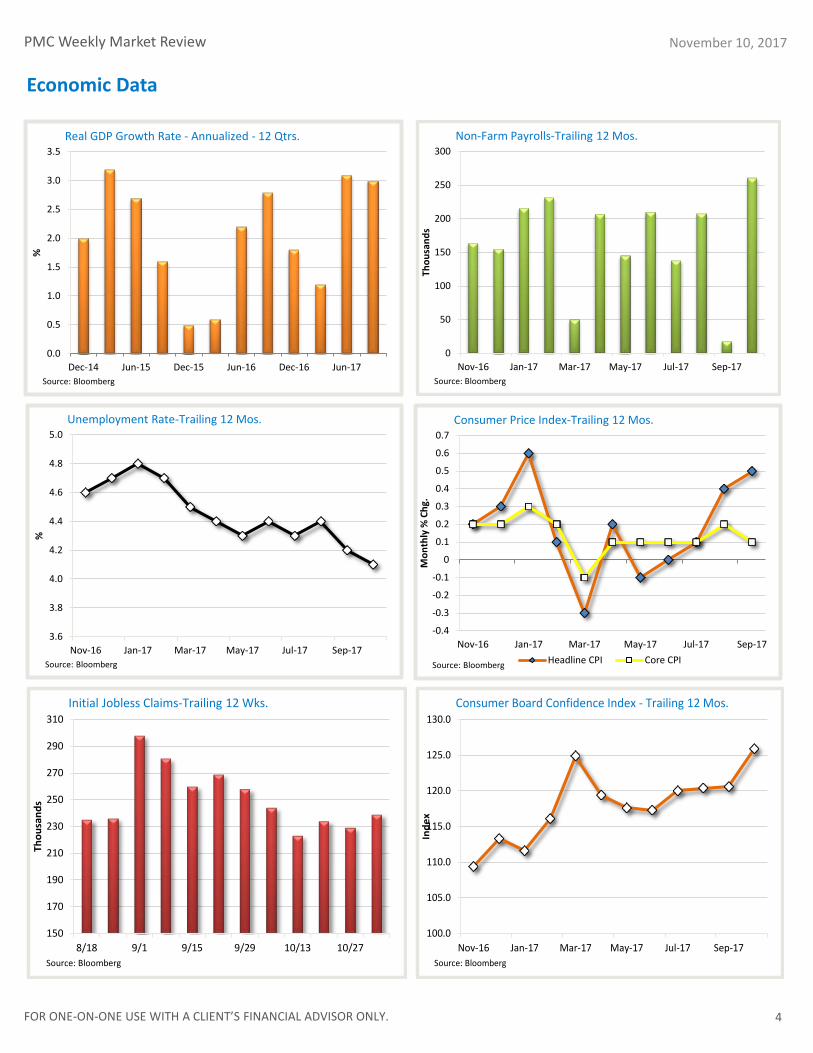
• Among other economic data, the four-week moving average for seasonally adjusted initial unemployment claims decreased to 231,250. This represents the lowest level for this average since 1973. Unemployment remains around 4.1%, considered by economists to represent full employment.
Weekly Highlights • The NASDAQ Composite Index, which is heavily weighted to
information technology stocks, has had an especially strong year, returning over 30% as of Thursday, November 9. The NASDAQ has experienced 64 all-time closings highs this year, more than any other year on record.
• Bitcoin, a highly volatile cryptocurrency, was down more than 5% on Friday, falling over $1,000 since Wednesday’s highs. The currency now trades below $7,000.
• After gold’s decline in last week’s trading, gold prices gained more than 1% on the week, its largest weekly gain in more than a month. Concerns over delays for US tax reform and the likelihood of a December Federal Reserve rate hike helped to fuel the increase.
0
50
100
150
200
250
300
Nov-16 Jan-17 Mar-17 May-17 Jul-17 Sep-17
Thou
sand
s
Non-Farm Payrolls-Trailing 12 Mos.
Source: Bloomberg
FOR ONE-ON-ONE USE WITH A CLIENT’S FINANCIAL ADVISOR ONLY.
PMC Weekly Market Review
2
November 10, 2017
L
S
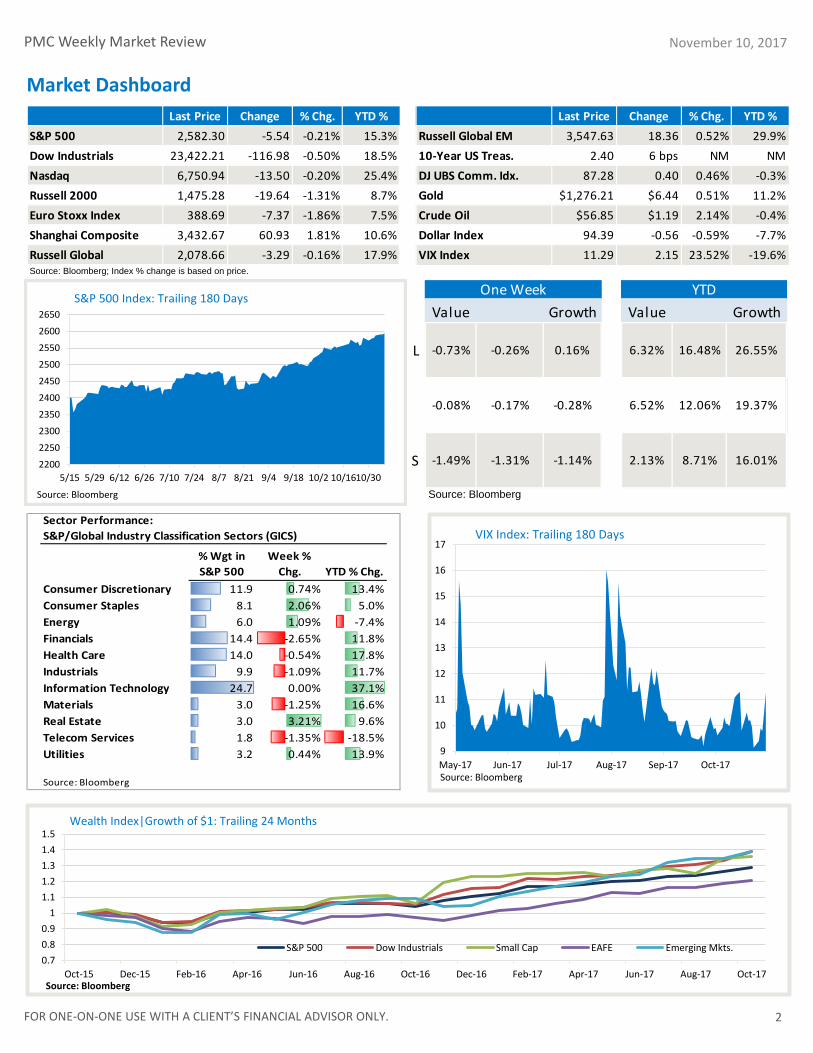
Source: Bloomberg
YTDValue Growth
6.32% 16.48% 26.55%
6.52% 12.06% 19.37%
16.01%8.71%2.13%
One WeekValue Growth
-1.49% -1.31% -1.14%
-0.73% -0.26% 0.16%
-0.08% -0.17% -0.28%
2200
2250
2300
2350
2400
2450
2500
2550
2600
2650
5/15 5/29 6/12 6/26 7/10 7/24 8/7 8/21 9/4 9/18 10/2 10/1610/30
Source: Bloomberg
S&P 500 Index: Trailing 180 Days
% Wgt in S&P 500
Week % Chg. YTD % Chg.
Consumer Discretionary 11.9 0.74% 13.4%Consumer Staples 8.1 2.06% 5.0%Energy 6.0 1.09% -7.4%Financials 14.4 -2.65% 11.8%Health Care 14.0 -0.54% 17.8%Industrials 9.9 -1.09% 11.7%Information Technology 24.7 0.00% 37.1%Materials 3.0 -1.25% 16.6%Real Estate 3.0 3.21% 9.6%Telecom Services 1.8 -1.35% -18.5%Utilities 3.2 0.44% 13.9%
Source: Bloomberg
Sector Performance: S&P/Global Industry Classification Sectors (GICS)
Last Price Change % Chg. YTD % Last Price Change % Chg. YTD %S&P 500 2,582.30 -5.54 -0.21% 15.3% Russell Global EM 3,547.63 18.36 0.52% 29.9%Dow Industrials 23,422.21 -116.98 -0.50% 18.5% 10-Year US Treas. 2.40 6 bps NM NMNasdaq 6,750.94 -13.50 -0.20% 25.4% DJ UBS Comm. Idx. 87.28 0.40 0.46% -0.3%Russell 2000 1,475.28 -19.64 -1.31% 8.7% Gold $1,276.21 $6.44 0.51% 11.2%Euro Stoxx Index 388.69 -7.37 -1.86% 7.5% Crude Oil $56.85 $1.19 2.14% -0.4%Shanghai Composite 3,432.67 60.93 1.81% 10.6% Dollar Index 94.39 -0.56 -0.59% -7.7%Russell Global 2,078.66 -3.29 -0.16% 17.9% VIX Index 11.29 2.15 23.52% -19.6%Source: Bloomberg; Index % change is based on price.
Market Dashboard
0.70.80.9
11.11.21.31.41.5
Oct-15 Dec-15 Feb-16 Apr-16 Jun-16 Aug-16 Oct-16 Dec-16 Feb-17 Apr-17 Jun-17 Aug-17 Oct-17Source: Bloomberg
Wealth Index|Growth of $1: Trailing 24 Months
S&P 500 Dow Industrials Small Cap EAFE Emerging Mkts.
9
10
11
12
13
14
15
16
17
May-17 Jun-17 Jul-17 Aug-17 Sep-17 Oct-17Source: Bloomberg
VIX Index: Trailing 180 Days
FOR ONE-ON-ONE USE WITH A CLIENT’S FINANCIAL ADVISOR ONLY.
PMC Weekly Market Review
3
November 10, 2017
The Economy and Markets
A Macro View – Rise of the machines and the opportunity they bring Facial recognition in phones, driverless cars, and drones once may have been perceived as a wave of the future, but since the 1980s, computers and digitalization have revolutionized the way we live. Our day-to-day lives and jobs depend on technology in many ways. And while it certainly has made our overall lives easier, many fear we are entering the age of the robots—that artificial intelligence (AI) will replace the need for humans in a number of professions. Automation and AI often get confused and used interchangeably, but they differ greatly. Automation is defined as a technique, method, or system of operating or controlling a process through electronic means, reducing human intervention to a minimum. AI, on the other hand, is a machine’s capability of imitating intelligent human behavior. As opposed to being programed to complete monotonous or repetitive tasks, AI imitates cognitive functions to learn and adapt after analyzing data. Both have implications for the job landscape, as technology innovators such as Elon Musk and Jack Ma have cautioned. With sweeping technological developments towards automation and AI, some jobs and industries will likely disappear, while others could morph into new opportunities. But jobs have long been under threat from automation. Employers continuously invest in new technology solutions to cut costs, and thousands of jobs have already been replaced by computers or robots. Manufacturing has been one of the hardest-hit sectors, losing approximately 5 million jobs since the year 2000, 88% of which are attributed to automation1. Additionally, the retail and restaurant industries are shifting away from cashiers to digital kiosks and mobile ordering. McDonald’s is one example: it recently announced that almost 6,000 cashiers will be replaced by 2018. These industries often represent entry level and blue-collar jobs, which require little education. However, AI has the potential to eliminate even some of the higher-paying professions that require a college degree, broadening the scope of the number of people who may be affected. One study by PwC suggests that with the rise in automation and AI, 38% of US jobs could be at risk within 15 years2. But the news is not all dim and grim. AI has the potential to create new job opportunities, boost productivity, and solve major world problems. Coding and programing have already become two of the top coveted skills sought by employers. A recent study from Burning Glass Technologies found that in 2015, 7 million job postings requested coding skills, and estimated that these types of jobs are growing 12% faster than the market average3. Additionally, some even think that AI technology could increase productivity by 40% in less than two decades, leading to a large economic boost4. It’s true—change is scary. But technology has improved how we communicate, educate, and interact with one another. And it has had a daily impact on our lives—we already are using AI without realizing it. Netflix, for example, uses proprietary technology to gage our interests and intelligently recommend new shows or movies. Its AI software has been a primary driver of its success in creating original content. Netflix collects data on the actors, directors, plots, and show concepts that the majority of consumers prefer, giving it an edge in predicting what shows or movies will be widely accepted. Although machines and robots may pose a threat to some industries and jobs, we should not fear progress. AI undoubtedly has transformative power—and creative and skilled thinkers should stand to benefit from it. Ali Caffery Portfolio Manager _________________________________________
1 http://fortune.com/2016/11/08/china-automation-jobs/ 2 https://www.pwc.co.uk/economic-services/ukeo/pwcukeo-section-4-automation-march-2017-v2.pdf 3 http://burning-glass.com/wp-content/uploads/Beyond_Point_Click_final.pdf 4 https://www.accenture.com/us-en/_acnmedia/36DC7F76EAB444CAB6A7F44017CC3997.ashx?la=en
FOR ONE-ON-ONE USE WITH A CLIENT’S FINANCIAL ADVISOR ONLY.
PMC Weekly Market Review
4
November 10, 2017
150
170
190
210
230
250
270
290
310
8/18 9/1 9/15 9/29 10/13 10/27
Thou
sand
s
Initial Jobless Claims-Trailing 12 Wks.
Source: Bloomberg
Economic Data
100.0
105.0
110.0
115.0
120.0
125.0
130.0
Nov-16 Jan-17 Mar-17 May-17 Jul-17 Sep-17
Inde
x
Consumer Board Confidence Index - Trailing 12 Mos.
Source: Bloomberg
0
50
100
150
200
250
300
Nov-16 Jan-17 Mar-17 May-17 Jul-17 Sep-17
Thou
sand
s
Non-Farm Payrolls-Trailing 12 Mos.
Source: Bloomberg
3.6
3.8
4.0
4.2
4.4
4.6
4.8
5.0
Nov-16 Jan-17 Mar-17 May-17 Jul-17 Sep-17
%
Unemployment Rate-Trailing 12 Mos.
Source: Bloomberg
0.0
0.5
1.0
1.5
2.0
2.5
3.0
3.5
Dec-14 Jun-15 Dec-15 Jun-16 Dec-16 Jun-17
%
Real GDP Growth Rate - Annualized - 12 Qtrs.
Source: Bloomberg
-0.4
-0.3
-0.2
-0.1
0
0.1
0.2
0.3
0.4
0.5
0.6
0.7
Nov-16 Jan-17 Mar-17 May-17 Jul-17 Sep-17
Mon
thly
% C
hg.
Consumer Price Index-Trailing 12 Mos.
Headline CPI Core CPISource: Bloomberg

FOR ONE-ON-ONE USE WITH A CLIENT’S FINANCIAL ADVISOR ONLY.
PMC Weekly Market Review November 10, 2017
5
Last Change % Chg. YTD % Last Change % Chg. YTD %Germany 10-Yr. Govt. 0.41 -5 bps NM NM France 10-Yr. Govt. 0.78 -3 bps NM NMGreece 10-Yr. Govt. 5.12 -2 bps NM NM Ireland 10-Yr. Govt. 0.64 -5 bps NM NMItaly 10-Yr. Govt. 1.84 -5 bps NM NM Portugal 10-Yr. Govt. 2.05 0 bps NM NMSpain 10-Yr. Govt. 1.57 -9 bps NM NM Netherlands 10-Yr. Govt. 0.51 -4 bps NM NMBelgium 10-Yr. Govt. 0.64 -3 bps NM NM U.K. 10-Yr. Govt. 1.34 -9 bps NM NM
SELECTED EUROPEAN SOVEREIGN YIELD PERFORMANCE
Source: BloombergBasis points (bps)
0.00
0.10
0.20
0.30
0.40
0.50
0.60
8/14 8/28 9/11 9/25 10/9 10/23 11/6
%
Germany 10-Year Government Bond Yield
Source: Bloomberg
1.0
1.1
1.2
1.3
1.4
1.5
1.6
1.7
1.8
1.9
8/14 8/28 9/11 9/25 10/9 10/23 11/6
%
Spain 10-Year Government Bond Yield
Source: Bloomberg
1.1
1.3
1.5
1.7
1.9
2.1
2.3
2.5
8/14 8/28 9/11 9/25 10/9 10/23 11/6
%
Italy 10-Year Government Bond Yield
Source: Bloomberg
4.0
4.2
4.4
4.6
4.8
5.0
5.2
5.4
5.6
5.8
6.0
8/14 8/28 9/11 9/25 10/9 10/23 11/6
%
Greece 10-Year Government Bond Yield
Source: Bloomberg
Eurozone

FOR ONE-ON-ONE USE WITH A CLIENT’S FINANCIAL ADVISOR ONLY.
PMC Weekly Market Review November 10, 2017
6
5,900
6,000
6,100
6,200
6,300
6,400
6,500
6,600
6,700
6,800
6,900
8/14 8/28 9/11 9/25 10/9 10/23 11/6
Inde
xNasdaq Composite-Trailing 90 Days
Source: Bloomberg
2,000
2,200
2,400
2,600
2,800
3,000
3,200
3,400
3,600
8/14 8/28 9/11 9/25 10/9 10/23 11/6
Inde
x
Shanghai Composite Index-Trailing 90 Days
Source: Bloomberg
300
320
340
360
380
400
420
8/14 8/28 9/11 9/25 10/9 10/23 11/6
Inde
x
Euro Stoxx Index-Trailing 90 Days
Source: Bloomberg
20,500
21,000
21,500
22,000
22,500
23,000
23,500
24,000
8/14 8/28 9/11 9/25 10/9 10/23 11/6
Inde
x
Dow Jones Industrial Average -Trailing 90 Days
Source: Bloomberg
Last Change % Chg. YTD % Last Change % Chg. YTD %S&P 500 2,582.30 -5.54 -0.21% 15.34% Swiss Market Index 9,134.16 -187.89 -2.02% 11.12%Dow Industrials 23,422.21 -116.98 -0.50% 18.52% CAC 40 Index (France) 5,380.72 -137.25 -2.49% 10.66%Nasdaq Composite 6,750.94 -13.50 -0.20% 25.41% DAX Index (Germany) 13,127.47 -351.39 -2.61% 14.34%Russell Global 2,078.66 -3.29 -0.16% 17.9% Irish Overall Index 6,877.14 -107.16 -1.53% 5.52%Russell Global EM 3,547.63 18.36 0.52% 29.9% Nikkei 225 22,681.42 142.30 0.63% 18.66%S&P/TSX (Canada) 16,039.26 19.10 0.12% 4.92% Hang Seng Index 29,120.92 517.31 1.81% 32.36%Mexico IPC 48,028.30 -525.12 -1.08% 5.19% Shanghai Composite 3,432.67 60.93 1.81% 10.60%Brazil Bovespa 72,165.64 -1749.78 -2.37% 19.82% Kospi Index (S. Korea) 2,542.95 -15.02 -0.59% 25.49%Euro Stoxx 600 388.69 -7.37 -1.86% 7.55% Taiwan Taiex Index 10,732.67 -68.10 -0.63% 15.98%FTSE 100 7,432.99 -127.36 -1.68% 4.06% Tel Aviv 25 Index 1,417.35 -10.27 -0.72% -3.63%
IBEX 35 (Spain) 10,092.70 -265.10 -2.56% 7.92% MICEX Index (Russia) 2,169.26 88.11 4.23% -2.84%
WORLD MARKET PERFORMANCE
Source: Bloomberg; Index % change is based on price.
Equities
FOR ONE-ON-ONE USE WITH A CLIENT’S FINANCIAL ADVISOR ONLY.
PMC Weekly Market Review November 10, 2017
7
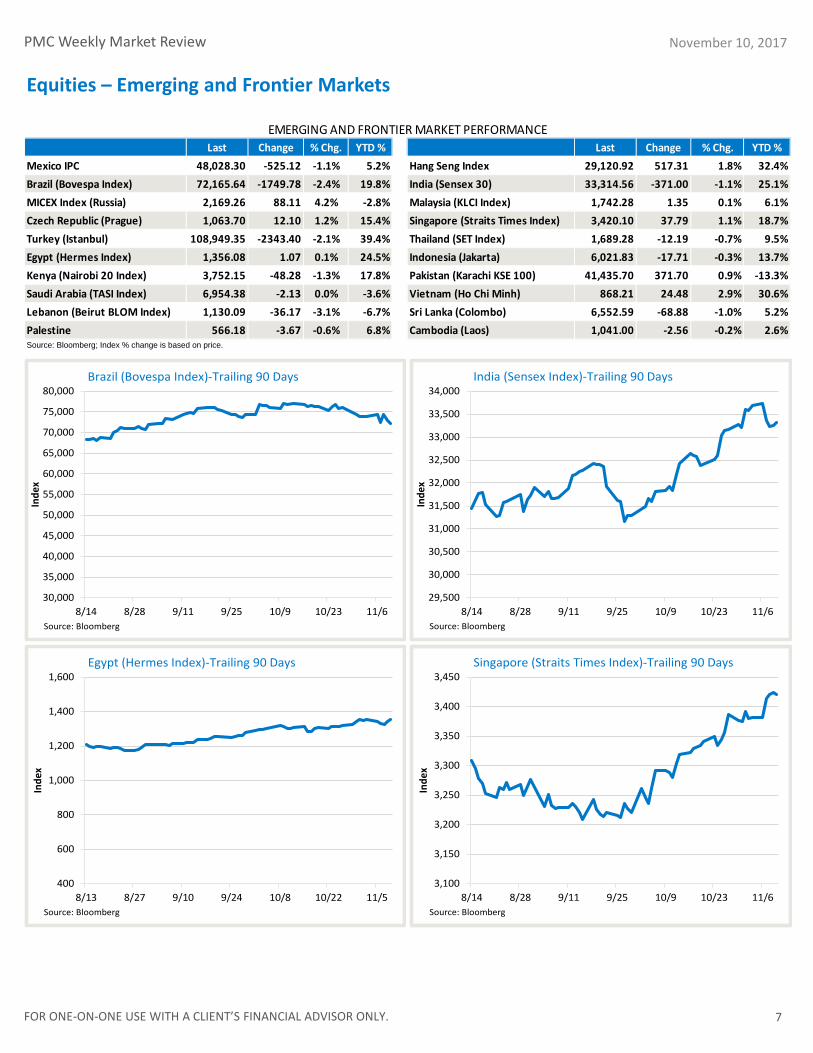
Last Change % Chg. YTD % Last Change % Chg. YTD %Mexico IPC 48,028.30 -525.12 -1.1% 5.2% Hang Seng Index 29,120.92 517.31 1.8% 32.4%Brazil (Bovespa Index) 72,165.64 -1749.78 -2.4% 19.8% India (Sensex 30) 33,314.56 -371.00 -1.1% 25.1%MICEX Index (Russia) 2,169.26 88.11 4.2% -2.8% Malaysia (KLCI Index) 1,742.28 1.35 0.1% 6.1%Czech Republic (Prague) 1,063.70 12.10 1.2% 15.4% Singapore (Straits Times Index) 3,420.10 37.79 1.1% 18.7%Turkey (Istanbul) 108,949.35 -2343.40 -2.1% 39.4% Thailand (SET Index) 1,689.28 -12.19 -0.7% 9.5%Egypt (Hermes Index) 1,356.08 1.07 0.1% 24.5% Indonesia (Jakarta) 6,021.83 -17.71 -0.3% 13.7%Kenya (Nairobi 20 Index) 3,752.15 -48.28 -1.3% 17.8% Pakistan (Karachi KSE 100) 41,435.70 371.70 0.9% -13.3%Saudi Arabia (TASI Index) 6,954.38 -2.13 0.0% -3.6% Vietnam (Ho Chi Minh) 868.21 24.48 2.9% 30.6%Lebanon (Beirut BLOM Index) 1,130.09 -36.17 -3.1% -6.7% Sri Lanka (Colombo) 6,552.59 -68.88 -1.0% 5.2%Palestine 566.18 -3.67 -0.6% 6.8% Cambodia (Laos) 1,041.00 -2.56 -0.2% 2.6%
EMERGING AND FRONTIER MARKET PERFORMANCE
Source: Bloomberg; Index % change is based on price.
30,000
35,000
40,000
45,000
50,000
55,000
60,000
65,000
70,000
75,000
80,000
8/14 8/28 9/11 9/25 10/9 10/23 11/6
Inde
x
Brazil (Bovespa Index)-Trailing 90 Days
Source: Bloomberg
29,500
30,000
30,500
31,000
31,500
32,000
32,500
33,000
33,500
34,000
8/14 8/28 9/11 9/25 10/9 10/23 11/6
Inde
x
India (Sensex Index)-Trailing 90 Days
Source: Bloomberg
400
600
800
1,000
1,200
1,400
1,600
8/13 8/27 9/10 9/24 10/8 10/22 11/5
Inde
x
Egypt (Hermes Index)-Trailing 90 Days
Source: Bloomberg
3,100
3,150
3,200
3,250
3,300
3,350
3,400
3,450
8/14 8/28 9/11 9/25 10/9 10/23 11/6
Inde
x
Singapore (Straits Times Index)-Trailing 90 Days
Source: Bloomberg
Equities – Emerging and Frontier Markets
FOR ONE-ON-ONE USE WITH A CLIENT’S FINANCIAL ADVISOR ONLY.
PMC Weekly Market Review November 10, 2017
YIELD CURVES
8
Last Change % Chg. YTD % Last Change % Chg. YTD %2-Yr. U.S. Treasury 1.66% -1 bps NM NM Prime Rate 4.25% 0.00 NM NM5-Yr. U.S. Treasury 2.06% 5 bps NM NM Fed Funds Rate 1.25% 0.00 NM NM10-Yr. U.S. Treasury 2.40% 6 bps NM NM Discount Rate 1.75% 0.00 NM NM30-Yr. U.S. Treasury 2.88% 6 bps NM NM LIBOR (3 Mo.) 1.41% 2 bps NM NMGerman 10-Yr. Govt. 0.41% -5 bps NM NM Bond Buyer 40 Muni 3.33% -11 bps NM NMFrance 10-Yr. 0.78% -3 bps NM NM Bond Buyer 40 G.O. 3.49% NA NM NMItaly 10-Yr. 1.84% -5 bps NM NM Bond Buyer 40 Rev. 3.86% NA NM NMFed 5-Yr Fwd BE Inf. 1.77% -5 bps NM NM
SELECTED INTEREST RATES
Source: Bloomberg
1M 1Y 3Y 5Y 8Y 10Y 15Y 20Y 30Y0.00
1.00
2.00
3.00
4.00
5.00
6.00
US Treasury Actives Curve 20171103US Treasury Actives Curve 20171110USD Composite (A) BFV Curve 20171111USD Composite (BBB) BFV Curve 20171111
1.50
1.70
1.90
2.10
2.30
2.50
2.70
5/15 6/15 7/15 8/15 9/15 10/15
Yiel
d %
10-Year Treasury Yield - Trailing 180 Days
Source: Bloomberg
1.00
1.10
1.20
1.30
1.40
1.50
1.60
5/15 6/15 7/15 8/15 9/15 10/15
Inde
x
BBB/Baa- 10-Yr Treas. Spread Rising Line = Risk Aversion
Source: Bloomberg
Source: Bloomberg
Interest Rates
FOR ONE-ON-ONE USE WITH A CLIENT’S FINANCIAL ADVISOR ONLY.
PMC Weekly Market Review November 10, 2017
9
86
88
90
92
94
96
98
100
5/15 6/15 7/15 8/15 9/15 10/15
U.S. Dollar Index - Trailing Six Months
Source: Bloomberg
0.80
0.85
0.90
0.95
1.00
1.05
1.10
1.15
1.20
1.25
5/15 6/15 7/15 8/15 9/15 10/15
Euro - U.S. Dollars per Euro
Source: Bloomberg
104.00
106.00
108.00
110.00
112.00
114.00
116.00
5/15 6/15 7/15 8/15 9/15 10/15
Japanese yen - Yen per U.S. Dollar
Source: Bloomberg
Last Change % Chg. YTD % Last Change % Chg. YTD %Dollar Index 94.39 -0.559 -0.59% -7.66% Chinese Yuan 6.64 0.002 -0.03% 4.58%Euro 1.17 0.006 0.49% 10.92% Swiss Franc 1.00 -0.005 0.49% 2.33%Japanese Yen 113.51 -0.530 0.47% 3.01% New Zealand Dollar 0.69 0.002 0.30% -0.09%British Pound 1.32 0.012 0.89% 6.91% Brazilian Real 3.28 -0.030 0.92% -1.03%Canadian Dollar 1.27 -0.008 0.65% 5.99% Mexican Peso 19.10 -0.110 0.58% 8.56%
SELECTED CURRENCY PERFORMANCE
Source: Bloomberg
6.20
6.30
6.40
6.50
6.60
6.70
6.80
6.90
7.00
5/15 6/15 7/15 8/15 9/15 10/15
Chinese yuan - yuan per U.S. Dollar
Source: Bloomberg
Currencies

FOR ONE-ON-ONE USE WITH A CLIENT’S FINANCIAL ADVISOR ONLY.
PMC Weekly Market Review November 10, 2017
10
0
10
20
30
40
50
60
70
5/15 6/15 7/15 8/15 9/15 10/15
$ pe
r bar
rel
Crude Oil - Light Crude ($ per barrel)
Source: Bloomberg
1,100
1,150
1,200
1,250
1,300
1,350
1,400
5/15 6/15 7/15 8/15 9/15 10/15
$ pe
r oun
ce
Gold - Spot gold price ($ per ounce)
Source: Bloomberg
320
340
360
380
400
420
440
5/15 6/15 7/15 8/15 9/15 10/15
$ pe
r bus
hel
Corn - Active Contract
Source: Bloomberg
Last Change % Chg. YTD % Last Change % Chg. YTD %Bloomberg Comm. Idx. 87.28 0.40 0.46% -0.27% Platinum Spot $929.34 $7.89 0.86% 2.88%Crude Oil $56.86 $1.19 2.14% -0.40% Corn 343.50 -4.75 -1.36% -9.61%Natural Gas $3.22 $0.23 7.71% -13.21% Wheat 431.50 5.75 1.35% -7.20%Gasoline ($/Gal.) $2.56 $0.04 1.47% 9.63% Soybeans 987.00 0.25 0.03% -0.60%Heating Oil 193.96 5.05 2.68% 7.80% Sugar 14.96 0.58 4.03% -19.48%Gold Spot $1,276.21 $6.44 0.51% 11.23% Orange Juice 162.60 6.00 3.83% -12.72%Silver Spot $16.90 $0.07 0.40% 6.17% Aluminum 2,093.00 -92.00 -4.21% 23.63%Source: Bloomberg; % change is based on price. Copper 6,808.00 -87.00 -1.26% 22.99%
SELECTED COMMODITY MARKET PERFORMANCE
Commodities
0
1,000
2,000
3,000
4,000
5,000
6,000
7,000
8,000
5/15 6/15 7/15 8/15 9/15 10/15
Inde
x
Copper
Source: Bloomberg
FOR ONE-ON-ONE USE WITH A CLIENT’S FINANCIAL ADVISOR ONLY.
PMC Weekly Market Review November 10, 2017
11
1,220
1,230
1,240
1,250
1,260
1,270
1,280
8/14 8/28 9/11 9/25 10/9 10/23 11/6
Inde
x
HFRX Global Hedge Fund Index - Trailing 90 Days
Source: Bloomberg
996
998
1,000
1,002
1,004
1,006
1,008
1,010
1,012
1,014
1,016
8/14 8/28 9/11 9/25 10/9 10/23 11/6
Inde
x
HFRX Equity Market Neutral - Trailing 90 Days
Source: Bloomberg
1,435
1,440
1,445
1,450
1,455
1,460
1,465
1,470
8/14 8/28 9/11 9/25 10/9 10/23 11/6
Inde
x
IQ Fixed Income Beta Arb Index - Trailing 90 Days
Source: Bloomberg
1,160
1,170
1,180
1,190
1,200
1,210
1,220
1,230
1,240
1,250
1,260
8/14 8/28 9/11 9/25 10/9 10/23 11/6
Inde
x
HFRX Equity Hedge Index - Trailing 90 Days
Source: Bloomberg
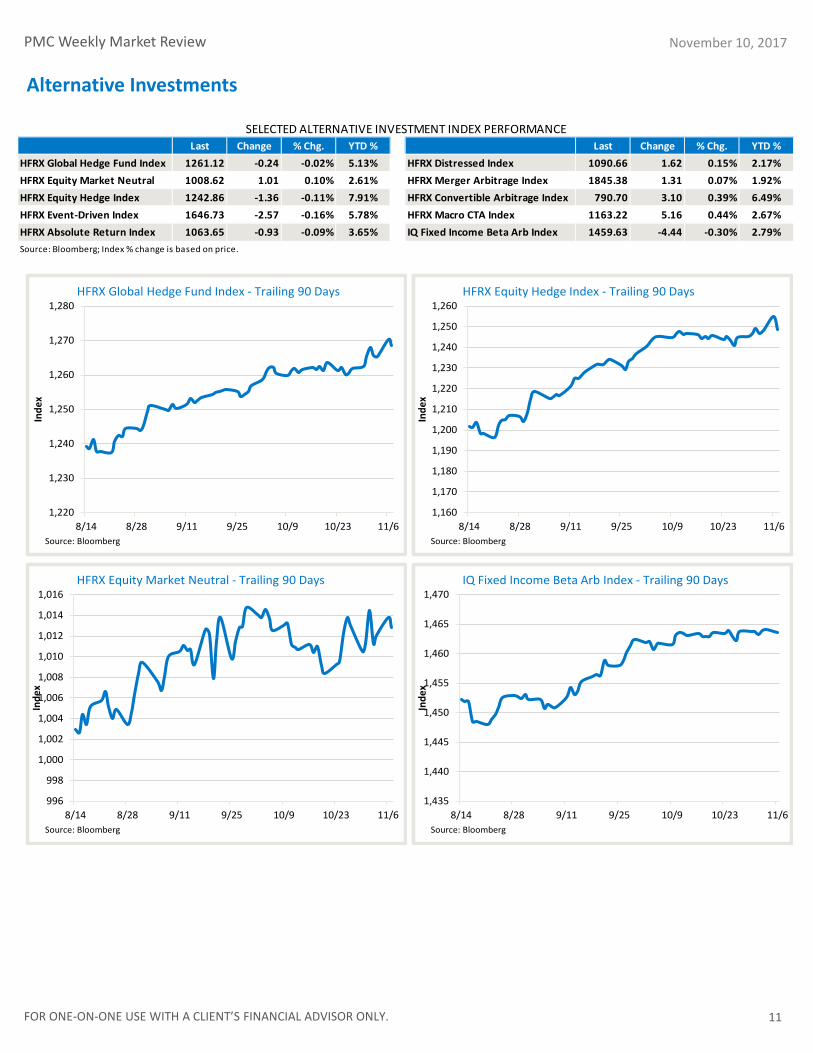
Last Change % Chg. YTD % Last Change % Chg. YTD %HFRX Global Hedge Fund Index 1261.12 -0.24 -0.02% 5.13% HFRX Distressed Index 1090.66 1.62 0.15% 2.17%HFRX Equity Market Neutral 1008.62 1.01 0.10% 2.61% HFRX Merger Arbitrage Index 1845.38 1.31 0.07% 1.92%HFRX Equity Hedge Index 1242.86 -1.36 -0.11% 7.91% HFRX Convertible Arbitrage Index 790.70 3.10 0.39% 6.49%HFRX Event-Driven Index 1646.73 -2.57 -0.16% 5.78% HFRX Macro CTA Index 1163.22 5.16 0.44% 2.67%HFRX Absolute Return Index 1063.65 -0.93 -0.09% 3.65% IQ Fixed Income Beta Arb Index 1459.63 -4.44 -0.30% 2.79%
SELECTED ALTERNATIVE INVESTMENT INDEX PERFORMANCE
Source: Bloomberg; Index % change is based on price.
Alternative Investments

FOR ONE-ON-ONE USE WITH A CLIENT’S FINANCIAL ADVISOR ONLY.
PMC Weekly Market Review
3.50
3.55
3.60
3.65
3.70
3.75
3.80
5/15 6/15 7/15 8/15 9/15 10/15
Inde
x
S&P 500/MSCI EAFE - Trailing 180 Days
Source: Bloomberg
1.40
1.45
1.50
1.55
1.60
1.65
5/15 6/15 7/15 8/15 9/15 10/15
Inde
x
MSCI EAFE/MSCI EM - Trailing 180 Days
Source: Bloomberg
0.37
0.38
0.38
0.39
0.39
0.40
0.40
0.41
0.41
0.42
0.42
5/15 6/15 7/15 8/15 9/15 10/15
Inde
xLarge Cap/Small Cap - Trailing 180 Days
Source: Bloomberg
0.78
0.79
0.80
0.81
0.82
0.83
0.84
0.85
0.86
0.87
0.88
5/15 6/15 7/15 8/15 9/15 10/15
Inde
x
Growth/Value - Trailing 180 Days
Source: Bloomberg
November 10, 2017
12
3.00
3.50
4.00
4.50
5.00
5.50
6.00
6.50
5/15 6/15 7/15 8/15 9/15 10/15
Inde
x
S&P 500/MSCI EM - Trailing 180 Days
Source: Bloomberg
Portfolio Construction
FOR ONE-ON-ONE USE WITH A CLIENT’S FINANCIAL ADVISOR ONLY.
PMC Weekly Market Review
0.300
0.302
0.304
0.306
0.308
0.310
0.312
0.314
5/15 6/15 7/15 8/15 9/15 10/15
Inde
xHigh Yield/Inv. Grade Bonds - Trailing 180 Days
Source: Bloomberg
0.210
0.215
0.220
0.225
0.230
0.235
0.240
0.245
0.250
5/15 6/15 7/15 8/15 9/15 10/15
Inde
x
Info Tech/S&P 500 - Trailing 180 Days
Source: Bloomberg
1.82
1.83
1.84
1.85
1.86
1.87
1.88
1.89
5/15 6/15 7/15 8/15 9/15 10/15
Inde
x
Inv. Grade Bonds/Int. Govt. Bonds - Trailing 180 Days
Source: Bloomberg
0.56
0.56
0.57
0.57
0.58
0.58
0.59
5/15 6/15 7/15 8/15 9/15 10/15
Inde
x
High Yield Bonds/Int. Govt. Bonds - Trailing 180 Days
Source: Bloomberg
November 10, 2017
13
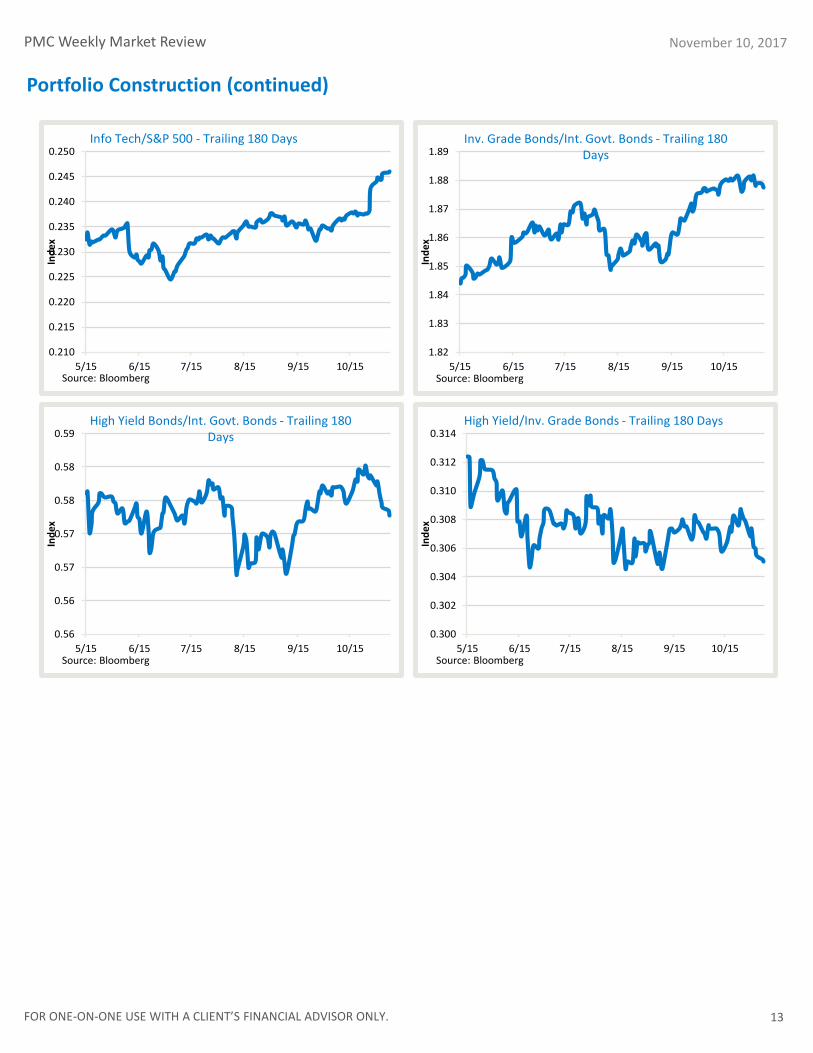
Portfolio Construction (continued)
FOR ONE-ON-ONE USE WITH A CLIENT’S FINANCIAL ADVISOR ONLY.
PMC Weekly Market Review
14
November 10, 2017
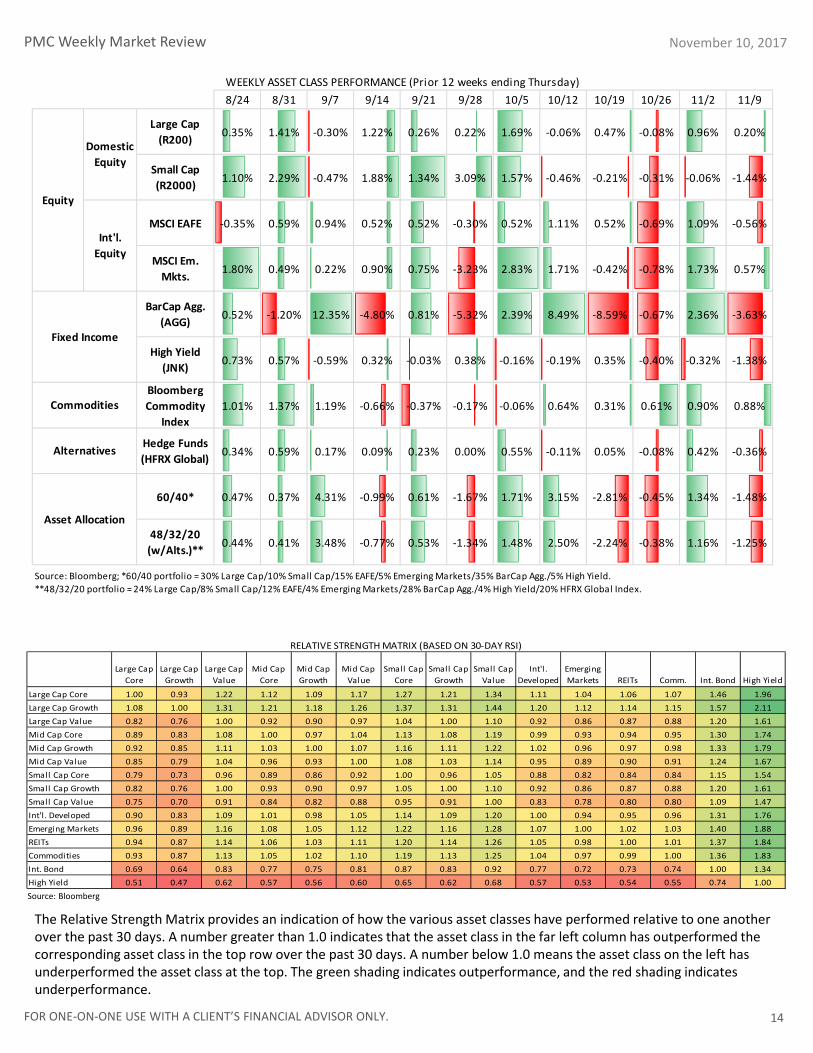
The Relative Strength Matrix provides an indication of how the various asset classes have performed relative to one another over the past 30 days. A number greater than 1.0 indicates that the asset class in the far left column has outperformed the corresponding asset class in the top row over the past 30 days. A number below 1.0 means the asset class on the left has underperformed the asset class at the top. The green shading indicates outperformance, and the red shading indicates underperformance.
Source: Bloomberg
Large Cap Core
Large Cap Growth
Large Cap Value
Mid Cap Core
Mid Cap Growth
Mid Cap Value
Small Cap Core
Small Cap Growth
Small Cap Value
Int'l . Developed
Emerging Markets REITs Comm. Int. Bond High Yield
Large Cap Core 1.00 0.93 1.22 1.12 1.09 1.17 1.27 1.21 1.34 1.11 1.04 1.06 1.07 1.46 1.96Large Cap Growth 1.08 1.00 1.31 1.21 1.18 1.26 1.37 1.31 1.44 1.20 1.12 1.14 1.15 1.57 2.11Large Cap Value 0.82 0.76 1.00 0.92 0.90 0.97 1.04 1.00 1.10 0.92 0.86 0.87 0.88 1.20 1.61Mid Cap Core 0.89 0.83 1.08 1.00 0.97 1.04 1.13 1.08 1.19 0.99 0.93 0.94 0.95 1.30 1.74Mid Cap Growth 0.92 0.85 1.11 1.03 1.00 1.07 1.16 1.11 1.22 1.02 0.96 0.97 0.98 1.33 1.79Mid Cap Value 0.85 0.79 1.04 0.96 0.93 1.00 1.08 1.03 1.14 0.95 0.89 0.90 0.91 1.24 1.67Small Cap Core 0.79 0.73 0.96 0.89 0.86 0.92 1.00 0.96 1.05 0.88 0.82 0.84 0.84 1.15 1.54Small Cap Growth 0.82 0.76 1.00 0.93 0.90 0.97 1.05 1.00 1.10 0.92 0.86 0.87 0.88 1.20 1.61Small Cap Value 0.75 0.70 0.91 0.84 0.82 0.88 0.95 0.91 1.00 0.83 0.78 0.80 0.80 1.09 1.47Int'l . Developed 0.90 0.83 1.09 1.01 0.98 1.05 1.14 1.09 1.20 1.00 0.94 0.95 0.96 1.31 1.76Emerging Markets 0.96 0.89 1.16 1.08 1.05 1.12 1.22 1.16 1.28 1.07 1.00 1.02 1.03 1.40 1.88REITs 0.94 0.87 1.14 1.06 1.03 1.11 1.20 1.14 1.26 1.05 0.98 1.00 1.01 1.37 1.84Commodities 0.93 0.87 1.13 1.05 1.02 1.10 1.19 1.13 1.25 1.04 0.97 0.99 1.00 1.36 1.83Int. Bond 0.69 0.64 0.83 0.77 0.75 0.81 0.87 0.83 0.92 0.77 0.72 0.73 0.74 1.00 1.34High Yield 0.51 0.47 0.62 0.57 0.56 0.60 0.65 0.62 0.68 0.57 0.53 0.54 0.55 0.74 1.00
RELATIVE STRENGTH MATRIX (BASED ON 30-DAY RSI)
8/24 8/31 9/7 9/14 9/21 9/28 10/5 10/12 10/19 10/26 11/2 11/9
Large Cap (R200) 0.35% 1.41% -0.30% 1.22% 0.26% 0.22% 1.69% -0.06% 0.47% -0.08% 0.96% 0.20%
Small Cap (R2000) 1.10% 2.29% -0.47% 1.88% 1.34% 3.09% 1.57% -0.46% -0.21% -0.31% -0.06% -1.44%
MSCI EAFE -0.35% 0.59% 0.94% 0.52% 0.52% -0.30% 0.52% 1.11% 0.52% -0.69% 1.09% -0.56%
MSCI Em. Mkts. 1.80% 0.49% 0.22% 0.90% 0.75% -3.23% 2.83% 1.71% -0.42% -0.78% 1.73% 0.57%
BarCap Agg. (AGG) 0.52% -1.20% 12.35% -4.80% 0.81% -5.32% 2.39% 8.49% -8.59% -0.67% 2.36% -3.63%
High Yield (JNK) 0.73% 0.57% -0.59% 0.32% -0.03% 0.38% -0.16% -0.19% 0.35% -0.40% -0.32% -1.38%
Bloomberg Commodity
Index1.01% 1.37% 1.19% -0.66% -0.37% -0.17% -0.06% 0.64% 0.31% 0.61% 0.90% 0.88%
Hedge Funds (HFRX Global) 0.34% 0.59% 0.17% 0.09% 0.23% 0.00% 0.55% -0.11% 0.05% -0.08% 0.42% -0.36%
60/40* 0.47% 0.37% 4.31% -0.99% 0.61% -1.67% 1.71% 3.15% -2.81% -0.45% 1.34% -1.48%
48/32/20 (w/Alts.)** 0.44% 0.41% 3.48% -0.77% 0.53% -1.34% 1.48% 2.50% -2.24% -0.38% 1.16% -1.25%
Source: Bloomberg; *60/40 portfolio = 30% Large Cap/10% Small Cap/15% EAFE/5% Emerging Markets/35% BarCap Agg./5% High Yield.**48/32/20 portfolio = 24% Large Cap/8% Small Cap/12% EAFE/4% Emerging Markets/28% BarCap Agg./4% High Yield/20% HFRX Global Index.
WEEKLY ASSET CLASS PERFORMANCE (Prior 12 weeks ending Thursday)
Alternatives
Asset Allocation
Domestic Equity
Int'l. Equity
Fixed Income
Commodities
Equity
FOR ONE-ON-ONE USE WITH A CLIENT’S FINANCIAL ADVISOR ONLY.
PMC Weekly Market Review November 10, 2017
15
Index Overview & Key Definitions Fed, The Fed or FED refers to the Federal Reserve System, the central bank of the United States. The Federal Open Market Committee (FOMC) is the monetary policymaking body of the Federal Reserve System. Fed Funds Rate, the interest rate at which a depository institution lends funds maintained at the Federal Reserve to another depository institution overnight. The European Central Bank (ECB) is the central bank for Europe's single currency, the euro. The ECB’s main task is to maintain the euro's purchasing power and thus price stability in the euro area. The euro area comprises the 19 European Union countries that have introduced the euro since 1999. The Gross Domestic Product (GDP) rate is a measurement of the output of goods and services produced by labor and property located in the United States. Basis Point(s) is a unit that is equal to 1/100th of 1%, and is used to denote the change in a financial instrument. The basis point is commonly used for calculating changes in interest rates, equity indexes and the yield of a fixed-income security. A separately managed account (SMA) is an individual managed investment account offered typically by a brokerage firm through one of their brokers or financial consultants and managed by independent investment management firms (often called money managers for short) and have varying fee structures. The Consumer Price Index (CPI) measures the change in the cost of a fixed basket of products and services. The Producer Price Index (PPI) program measures the average change over time in the selling prices received by domestic producers for their output. The prices included in the PPI are from the first commercial transaction for many products and some services. Core CPI is an additional CPI Index, excludes energy and food item price changes, and measures the “core” or “underlying” rate of inflation. The PCE (Personal Consumption Expenditure) Index of Prices is a US---wide indicator of the average increase in prices for all domestic personal consumption. Using a variety of data including U.S. Consumer Price Index and Producer Price Index prices, it is derived from personal consumption expenditures; essentially a measure of goods and services targeted towards individuals and consumed by individuals. The Purchasing Managers' Index (PMI) is an indicator of the economic health of the manufacturing sector. The PMI is based on five major indicators: new orders, inventory levels, production, supplier deliveries and the employment environment. Brexit is a commonly used term for the United Kingdom's withdrawal from the European Union. The Kansas City Fed Manufacturing Survey monitors manufacturing plants selected according to geographic distribution, industry mix and size in the Tenth Federal Reserve District. The Dow Jones Industrial Average (DOW or DJIA) is an unmanaged index of 30 common stocks comprised of 30 actively traded blue chip stocks, primarily industrials and assumes reinvestment of dividends. The S&P 500 Index is an unmanaged index comprised of 500 widely held securities considered to be representative of the stock market in general. The S&P/Case-Shiller Home Price Indices measure the residential housing market, tracking changes in the value of the residential real estate market in 20 metropolitan regions across the United States. The Nasdaq Composite Index is a stock market index of the common stocks and similar securities listed on the NASDAQ stock market. The US Dollar Index is a measure of the value of the United States dollar relative to a basket of foreign currencies. It is a weighted geometric mean of the dollar's value relative to other select currencies (Euro, Japanese yen, Pound sterling, Canadian dollar, Swedish krona (SEK) & Swiss franc). The FTSE 100 Index (FTSE 100) is a share index of the 100 companies listed on the London Stock Exchange (LSE) with the highest market capitalization. The Bloomberg Commodity Index (formerly the Dow Jones-UBS Commodity Index) tracks prices of futures contracts on physical commodities on the commodity markets and is designed to minimize concentration in any one commodity or sector (currently 22 commodity futures in seven sectors). The Barclays Capital US Credit Index is an unmanaged index considered representative of publicly issued, SEC-registered US corporate and specified foreign debentures and secured notes. The Barclays Capital US Aggregate Bond Index is a market capitalization-weighted index of investment-grade, fixed-rate debt issues, including government, corporate, asset-backed, and mortgage-backed securities, with maturities of at least one year. The Barclays Capital US Corporate High Yield Index covers the USD-denominated, non-investment grade, fixed-rate, taxable corporate bond market. Securities are classified as high-yield if the middle rating of Moody’s, Fitch and S&P is Ba1/BB+/BB+ or below. The index may include emerging market debt. The Barclays Capital Municipal Bond Index is an unmanaged index comprised of investment-grade, fixed-rate municipal securities representative of the tax-exempt bond market in general. The Barclays Capital US Treasury Total Return Index is an unmanaged index of public obligations of the US Treasury with a remaining maturity of one year or more. The Barclays Capital Global Aggregate ex-U.S. Index is a market capitalization-weighted index, meaning the securities in the index are weighted according to the market size of each bond type. Most U.S. traded investment grade bonds are represented. Municipal bonds, and Treasury Inflation-Protected Securities are excluded, due to tax treatment issues. The index includes Treasury securities, Government agency bonds, Mortgage-backed bonds, Corporate bonds, and a small amount of foreign bonds traded in U.S. The Barclays Capital U.S. 5-10 Year Corporate Bond Index measures the investment return of U.S. dollar denominated, investment-grade, fixed rate, taxable securities issued by industrial, utility, and financial companies with maturities between 5 and 10 years. Treasury securities, mortgage-backed securities (MBS) foreign bonds, government agency bonds and corporate bonds are some of the categories included in the index. The Barclays Capital U.S Corporate High-Yield Index is composed of fixed-rate, publicly issued, non-investment grade debt. The Barclays Capital U.S. Corporate 5-10 Year Index includes U.S. dollar-denominated, investment-grade, fixed-rate, taxable securities issued by industrial, utility, & financial companies, with maturities between 5 & 10 years. The Russell 1000 Index is a market capitalization-weighted benchmark index made up of the 1000 largest U.S. companies in the Russell 3000 Index. The Russell 1000 Growth Index is an unmanaged index considered representative of large-cap growth stocks. The Russell 1000 Value Index is an unmanaged index considered representative of large-cap value stocks. The Russell 2000 Index is an unmanaged index considered representative of small-cap stocks. The Russell 2000 Growth Index is an unmanaged index considered representative of small-cap growth stocks. The Russell 2000 Growth Index is an unmanaged index considered representative of small-cap value stocks. The Russell 3000 Index is an unmanaged index considered representative of the US stock market. The Russell Midcap Index is a subset of the Russell 1000 Index. It includes approximately 800 of the smallest securities based on a combination of their market cap and current index membership. The Russell Midcap Growth Index is an unmanaged index considered representative of mid-cap growth stocks. The Russell Midcap Value Index is an unmanaged index considered representative of mid-cap value stocks. The HFRX Indices are a series of benchmarks of hedge fund industry performance which are engineered to achieve representative performance of a larger universe of hedge fund strategies. Hedge Fund Research, Inc. employs the HFRX Methodology (UCITS compliant), a proprietary and highly quantitative process by which hedge funds are selected as constituents for the HFRX Indices. The University of Michigan Consumer Sentiment Index (MCSI) is a survey of consumer confidence conducted by the University of Michigan using telephone surveys to gather information on consumer expectations regarding the overall economy. The CBOE Volatility Index (VIX) is an up-to-the-minute market estimate of expected volatility that is calculated by using real-time S&P 500 Index option bid/ask quotes. The Index uses nearby and second nearby options with at least 8 days left to expiration and then weights them to yield a constant, 30-day measure of the expected volatility of the S&P 500 Index. The MSCI EAFE Index is designed to measure the equity market performance of developed markets outside of the U.S. & Canada. The MSCI EAFE Growth Index is an unmanaged index considered representative of growth stocks of Europe, Australasia and the Far East. The MSCI EAFE Value Index is an unmanaged index considered representative of value stocks of Europe, Australasia and the Far East. The MSCI EM (Emerging Markets) Latin America Index is a free float-adjusted market capitalization weighted index that is designed to measure the equity market performance of emerging markets in Latin America. The MSCI World ex-U.S. Index captures large and mid-cap representation across 22 of 23 Developed Markets (DM) countries - excluding the US. With 1,002 constituents, the index covers approximately 85% of the free float-adjusted market capitalization in each country. The MSCI Japan Index is designed to measure the performance of the large and mid-cap segments of the Japanese market. With 320 constituents, the index covers approximately 85% of the free float-adjusted market capitalization in Japan. The MSCI Emerging Markets Index is a free float-adjusted market capitalization index that is designed to measure equity market performance in the global emerging markets. The MSCI Europe Index is an unmanaged index considered representative of stocks of developed European countries. The MSCI Pacific Index is a free float-adjusted market capitalization weighted index that is designed to measure the equity market performance of the developed markets in the Pacific region. The Barclays Intermediate US Government/Credit Bond Index is a market capitalization-weighted index of investment-grade, fixed-rate debt issues, including Treasuries, government-related and U.S. corporate securities, with maturities of at least one year and less than 10 years. The NY Empire State Manufacturing Index is based on the monthly survey of manufacturers in New York State – known as the Empire State Manufacturing Survey – conducted by the Federal Reserve Bank of New York. The ISM Manufacturing Index is based on surveys of more than 300 manufacturing firms by the Institute of Supply Management and monitors employment, production, inventories, new orders and supplier deliveries. The ISM Non-Manufacturing Index is an index based on surveys of more than 400 non-manufacturing firms' purchasing and supply executives, within 60 sectors across the nation, by the Institute of Supply Management (ISM) and also tracks economic data, like the ISM Non-Manufacturing Business Activity Index. A composite diffusion index is created based on the data from these surveys that monitors economic conditions of the nation. The Housing Market Index (HMI) is based on a monthly survey of NAHB members designed to take the pulse of the single-family housing market. In May 2007, Markit’s U.S. PMI research was extended out to cover producers of metal goods. In October 2009, Markit’s U.S. Manufacturing PMI survey panel was extended further to cover all areas of U.S. manufacturing activity. The S&P Composite 1500 Index combines three leading indices, the S&P 500, the S&P MidCap 400, and the S&P SmallCap 600 to cover approximately 90% of the U.S. market capitalization. It is designed for investors seeking to replicate the performance of the U.S. equity market or benchmark against a representative universe of tradable stocks. The Industrial Production Index is an economic indicator that measures real output for all facilities located in the United States manufacturing, mining, and electric, and gas utilities (excluding those in U.S. territories). The Dow Jones U.S. Select REIT Index tracks the performance of publicly traded REITs and REIT-like securities and is designed to serve as a proxy for direct real estate investment, in part by excluding companies whose performance may be driven by factors other than the value of real estate.

FOR ONE-ON-ONE USE WITH A CLIENT’S FINANCIAL ADVISOR ONLY.
PMC Weekly Market Review November 10, 2017
16
The information, analysis, and opinions expressed herein are for general and educational purposes only. Nothing contained in this weekly review is intended to constitute legal, tax, accounting, securities, or investment advice, nor an opinion regarding the appropriateness of any investment, nor a solicitation of any type. All investments carry a certain risk, and there is no assurance that an investment will provide positive performance over any period of time. An investor may experience loss of principal. Investment decisions should always be made based on the investor’s specific financial needs and objectives, goals, time horizon, and risk tolerance. The asset classes and/or investment strategies described may not be suitable for all investors and investors should consult with an investment advisor to determine the appropriate investment strategy. Past performance is not indicative of future results. Information obtained from third party sources are believed to be reliable but not guaranteed. Envestnet|PMC™ makes no representation regarding the accuracy or completeness of information provided herein. All opinions and views constitute our judgments as of the date of writing and are subject to change at any time without notice. Investments in smaller companies carry greater risk than is customarily associated with larger companies for various reasons such as volatility of earnings and prospects, higher failure rates, and limited markets, product lines or financial resources. Investing overseas involves special risks, including the volatility of currency exchange rates and, in some cases, limited geographic focus, political and economic instability, and relatively illiquid markets. Income (bond) securities are subject to interest rate risk, which is the risk that debt securities in a portfolio will decline in value because of increases in market interest rates. Exchange Traded Funds (ETFs) are subject to risks similar to those of stocks, such as market risk. Investing in ETFs may bear indirect fees and expenses charged by ETFs in addition to its direct fees and expenses, as well as indirectly bearing the principal risks of those ETFs. ETFs may trade at a discount to their net asset value and are subject to the market fluctuations of their underlying investments. Investing in commodities can be volatile and can suffer from periods of prolonged decline in value and may not be suitable for all investors. Index Performance is presented for illustrative purposes only and does not represent the performance of any specific investment product or portfolio. An investment cannot be made directly into an index. Alternative Investments may have complex terms and features that are not easily understood and are not suitable for all investors. You should conduct your own due diligence to ensure you understand the features of the product before investing. Alternative investment strategies may employ a variety of hedging techniques and non-traditional instruments such as inverse and leveraged products. Certain hedging techniques include matched combinations that neutralize or offset individual risks such as merger arbitrage, long/short equity, convertible bond arbitrage and fixed-income arbitrage. Leveraged products are those that employ financial derivatives and debt to try to achieve a multiple (for example two or three times) of the return or inverse return of a stated index or benchmark over the course of a single day. Inverse products utilize short selling, derivatives trading, and other leveraged investment techniques, such as futures trading to achieve their objectives, mainly to track the inverse of their benchmarks. As with all investments, there is no assurance that any investment strategies will achieve their objectives or protect against losses. Neither Envestnet, Envestnet|PMC™ nor its representatives render tax, accounting or legal advice. Any tax statements contained herein are not intended or written to be used, and cannot be used, for the purpose of avoiding U.S. federal, state, or local tax penalties. Taxpayers should always seek advice based on their own particular circumstances from an independent tax advisor. © 2017 Envestnet Asset Management, Inc. All rights reserved. ABOUT ENVESTNET® Envestnet, Inc. (NYSE: ENV) is a leading provider of intelligent systems for wealth management and financial wellness. Envestnet’s unified technology enhances advisor productivity and strengthens the wealth management process, delivering unparalleled flexibility, accuracy, performance, and value. Envestnet enables a transparent, independent, objective, and fiduciary standard of care, and empowers enterprises and advisors to more fully understand their clients and deliver better outcomes. For more information on Envestnet, please visit www.envestnet.com.