Weekly Market Review - Envestnet · Weekly Market Review ... Year Treasury Note at almost 2.3% is...
16
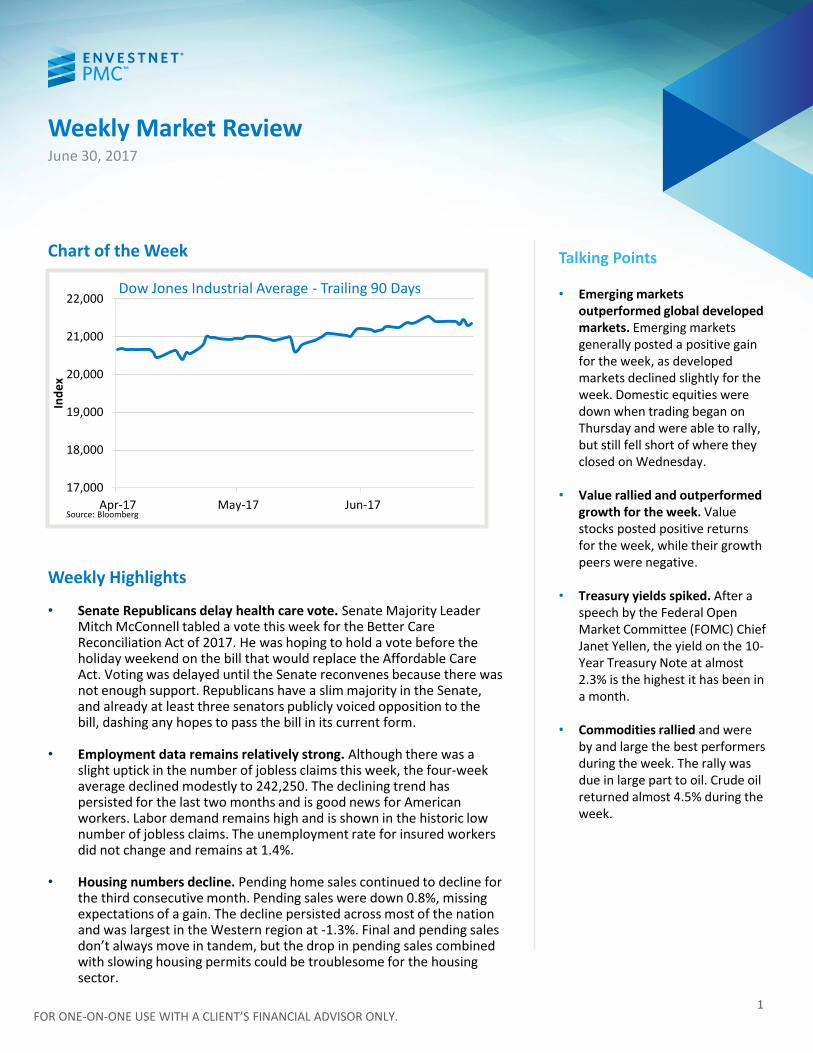
FOR ONE-ON-ONE USE WITH A CLIENT’S FINANCIAL ADVISOR ONLY. Weekly Market Review Weekly Highlights • Senate Republicans delay health care vote. Senate Majority Leader Mitch McConnell tabled a vote this week for the Better Care Reconciliation Act of 2017. He was hoping to hold a vote before the holiday weekend on the bill that would replace the Affordable Care Act. Voting was delayed until the Senate reconvenes because there was not enough support. Republicans have a slim majority in the Senate, and already at least three senators publicly voiced opposition to the bill, dashing any hopes to pass the bill in its current form. • Employment data remains relatively strong. Although there was a slight uptick in the number of jobless claims this week, the four-week average declined modestly to 242,250. The declining trend has persisted for the last two months and is good news for American workers. Labor demand remains high and is shown in the historic low number of jobless claims. The unemployment rate for insured workers did not change and remains at 1.4%. • Housing numbers decline. Pending home sales continued to decline for the third consecutive month. Pending sales were down 0.8%, missing expectations of a gain. The decline persisted across most of the nation and was largest in the Western region at -1.3%. Final and pending sales don’t always move in tandem, but the drop in pending sales combined with slowing housing permits could be troublesome for the housing sector. Chart of the Week June 30, 2017 1 Talking Points • Emerging markets outperformed global developed markets. Emerging markets generally posted a positive gain for the week, as developed markets declined slightly for the week. Domestic equities were down when trading began on Thursday and were able to rally, but still fell short of where they closed on Wednesday. • Value rallied and outperformed growth for the week. Value stocks posted positive returns for the week, while their growth peers were negative. • Treasury yields spiked. After a speech by the Federal Open Market Committee (FOMC) Chief Janet Yellen, the yield on the 10- Year Treasury Note at almost 2.3% is the highest it has been in a month. • Commodities rallied and were by and large the best performers during the week. The rally was due in large part to oil. Crude oil returned almost 4.5% during the week. 17,000 18,000 19,000 20,000 21,000 22,000 Apr-17 May-17 Jun-17 Index Dow Jones Industrial Average - Trailing 90 Days Source: Bloomberg
Transcript of Weekly Market Review - Envestnet · Weekly Market Review ... Year Treasury Note at almost 2.3% is...
FOR ONE-ON-ONE USE WITH A CLIENT’S FINANCIAL ADVISOR ONLY.
Weekly Market Review
Weekly Highlights • Senate Republicans delay health care vote. Senate Majority Leader
Mitch McConnell tabled a vote this week for the Better Care Reconciliation Act of 2017. He was hoping to hold a vote before the holiday weekend on the bill that would replace the Affordable Care Act. Voting was delayed until the Senate reconvenes because there was not enough support. Republicans have a slim majority in the Senate, and already at least three senators publicly voiced opposition to the bill, dashing any hopes to pass the bill in its current form.
• Employment data remains relatively strong. Although there was a slight uptick in the number of jobless claims this week, the four-week average declined modestly to 242,250. The declining trend has persisted for the last two months and is good news for American workers. Labor demand remains high and is shown in the historic low number of jobless claims. The unemployment rate for insured workers did not change and remains at 1.4%.
• Housing numbers decline. Pending home sales continued to decline for the third consecutive month. Pending sales were down 0.8%, missing expectations of a gain. The decline persisted across most of the nation and was largest in the Western region at -1.3%. Final and pending sales don’t always move in tandem, but the drop in pending sales combined with slowing housing permits could be troublesome for the housing sector.
Chart of the Week
June 30, 2017
1
Talking Points • Emerging markets
outperformed global developed markets. Emerging markets generally posted a positive gain for the week, as developed markets declined slightly for the week. Domestic equities were down when trading began on Thursday and were able to rally, but still fell short of where they closed on Wednesday.
• Value rallied and outperformed growth for the week. Value stocks posted positive returns for the week, while their growth peers were negative.
• Treasury yields spiked. After a speech by the Federal Open Market Committee (FOMC) Chief Janet Yellen, the yield on the 10-Year Treasury Note at almost 2.3% is the highest it has been in a month.
• Commodities rallied and were by and large the best performers during the week. The rally was due in large part to oil. Crude oil returned almost 4.5% during the week.
17,000
18,000
19,000
20,000
21,000
22,000
Apr-17 May-17 Jun-17
Ind
ex
Dow Jones Industrial Average - Trailing 90 Days
Source: Bloomberg

FOR ONE-ON-ONE USE WITH A CLIENT’S FINANCIAL ADVISOR ONLY.
PMC Weekly Market Review
2
June 30, 2017
0.7
0.8
0.9
1
1.1
1.2
1.3
1.4
Jun-15 Aug-15 Oct-15 Dec-15 Feb-16 Apr-16 Jun-16 Aug-16 Oct-16 Dec-16 Feb-17 Apr-17 Jun-17
Source: Bloomberg
Wealth Index|Growth of $1: Trailing 24 Months
S&P 500 Dow Industrials Small Cap EAFE Emerging Mkts.
L
S
Source: B loomberg
YTD
Value Growth
3.09% 8.65% 13.98%
4.04% 7.07% 10.78%
9.54%4.29%-0.40%
One Week
Value Growth
0.88% 0.04% -0.77%
0.27% -0.72% -1.63%
0.39% -0.23% -1.07%
2150
2200
2250
2300
2350
2400
2450
2500
1/3 1/17 1/31 2/14 2/28 3/14 3/28 4/11 4/25 5/9 5/23 6/6 6/20
Source: Bloomberg
S&P 500 Index: Trailing 180 Days
% Wgt in
S&P 500
Week %
Chg. YTD % Chg.
Consumer Discretionary 12.3 0.10% 10.2%
Consumer Staples 9.0 -1.07% 6.6%
Energy 6.0 0.65% -13.8%
Financials 14.5 3.25% 6.0%
Health Care 14.5 -1.55% 15.1%
Industrials 10.3 -0.02% 8.3%
Information Technology 22.3 -2.88% 16.4%
Materials 2.8 -0.21% 8.1%
Real Estate 2.9 -1.01% 4.6%
Telecom Services 2.1 -1.08% -12.8%
Utilities 3.2 -2.36% 6.9%
Source: Bloomberg
Sector Performance:
S&P/Global Industry Classification Sectors (GICS)
10
11
12
13
14
15
16
17
Jan-17 Feb-17 Mar-17 Apr-17 May-17 Jun-17Source: Bloomberg
VIX Index: Trailing 180 Days
Last Price Change % Chg. YTD % Last Price Change % Chg. YTD %
S&P 500 2,423.41 -14.89 -0.61% 8.2% Russell Global EM 3,195.64 6.27 0.20% 17.0%
Dow Industrials 21,349.63 -45.13 -0.21% 8.0% 10-Year US Treas. 2.30 16 bps NM NM
Nasdaq 6,140.42 -124.83 -1.99% 14.1% DJ UBS Comm. Idx. 82.60 2.96 3.72% -5.6%
Russell 2000 1,415.36 0.58 0.04% 4.3% Gold $1,241.51 -$15.10 -1.20% 8.2%
Euro Stoxx Index 379.37 -8.25 -2.13% 5.0% Crude Oil $46.27 $3.20 7.44% -18.8%
Shanghai Composite 3,192.43 34.55 1.09% 2.9% Dollar Index 95.65 -1.62 -1.66% -6.4%
Russell Global 1,942.40 -3.51 -0.18% 10.3% VIX Index 11.18 1.16 11.58% -20.4%Source: Bloomberg; Index % change is based on price.
Market Dashboard
FOR ONE-ON-ONE USE WITH A CLIENT’S FINANCIAL ADVISOR ONLY.
PMC Weekly Market Review
3
June 30, 2017
134135136137138139140141142143144 Dec-10 Feb-11 Apr-11 Jun-11 Aug-11 Oct-11Index S&P/Case-Shiller Home Price Index-Trailing 12 Mos.
Source: Bloomberg
The Economy and Markets
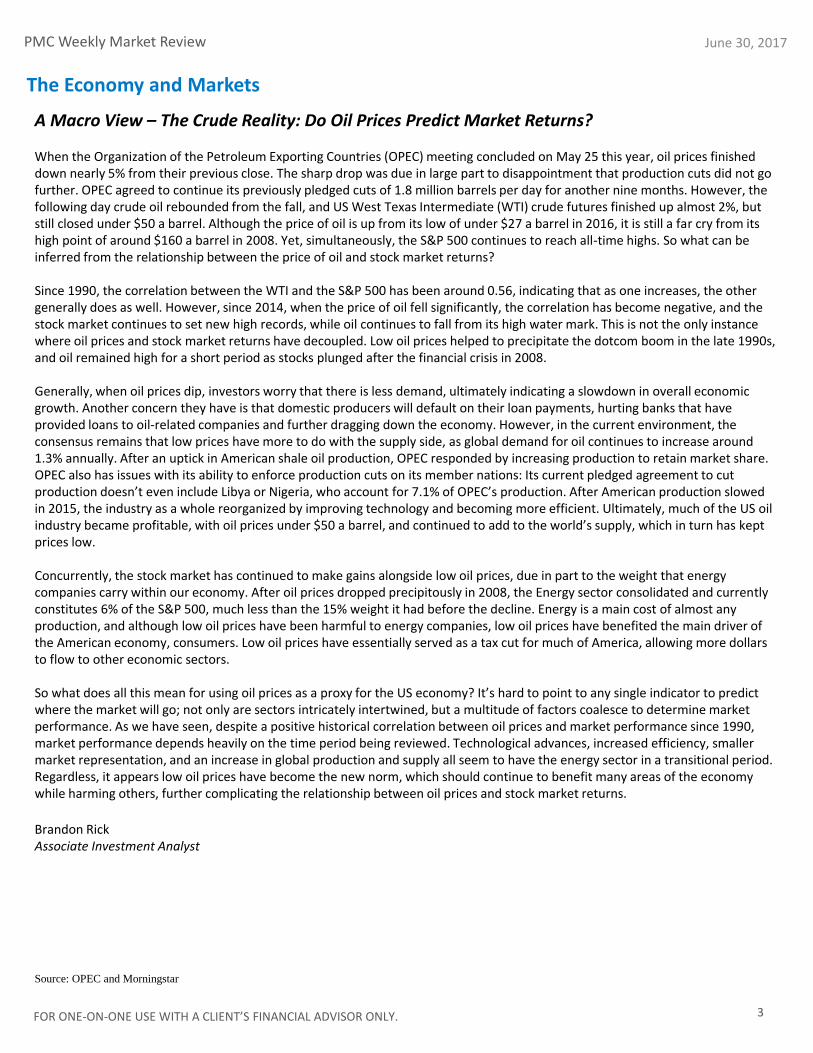
A Macro View – The Crude Reality: Do Oil Prices Predict Market Returns? When the Organization of the Petroleum Exporting Countries (OPEC) meeting concluded on May 25 this year, oil prices finished down nearly 5% from their previous close. The sharp drop was due in large part to disappointment that production cuts did not go further. OPEC agreed to continue its previously pledged cuts of 1.8 million barrels per day for another nine months. However, the following day crude oil rebounded from the fall, and US West Texas Intermediate (WTI) crude futures finished up almost 2%, but still closed under $50 a barrel. Although the price of oil is up from its low of under $27 a barrel in 2016, it is still a far cry from its high point of around $160 a barrel in 2008. Yet, simultaneously, the S&P 500 continues to reach all-time highs. So what can be inferred from the relationship between the price of oil and stock market returns? Since 1990, the correlation between the WTI and the S&P 500 has been around 0.56, indicating that as one increases, the other generally does as well. However, since 2014, when the price of oil fell significantly, the correlation has become negative, and the stock market continues to set new high records, while oil continues to fall from its high water mark. This is not the only instance where oil prices and stock market returns have decoupled. Low oil prices helped to precipitate the dotcom boom in the late 1990s, and oil remained high for a short period as stocks plunged after the financial crisis in 2008. Generally, when oil prices dip, investors worry that there is less demand, ultimately indicating a slowdown in overall economic growth. Another concern they have is that domestic producers will default on their loan payments, hurting banks that have provided loans to oil-related companies and further dragging down the economy. However, in the current environment, the consensus remains that low prices have more to do with the supply side, as global demand for oil continues to increase around 1.3% annually. After an uptick in American shale oil production, OPEC responded by increasing production to retain market share. OPEC also has issues with its ability to enforce production cuts on its member nations: Its current pledged agreement to cut production doesn’t even include Libya or Nigeria, who account for 7.1% of OPEC’s production. After American production slowed in 2015, the industry as a whole reorganized by improving technology and becoming more efficient. Ultimately, much of the US oil industry became profitable, with oil prices under $50 a barrel, and continued to add to the world’s supply, which in turn has kept prices low. Concurrently, the stock market has continued to make gains alongside low oil prices, due in part to the weight that energy companies carry within our economy. After oil prices dropped precipitously in 2008, the Energy sector consolidated and currently constitutes 6% of the S&P 500, much less than the 15% weight it had before the decline. Energy is a main cost of almost any production, and although low oil prices have been harmful to energy companies, low oil prices have benefited the main driver of the American economy, consumers. Low oil prices have essentially served as a tax cut for much of America, allowing more dollars to flow to other economic sectors. So what does all this mean for using oil prices as a proxy for the US economy? It’s hard to point to any single indicator to predict where the market will go; not only are sectors intricately intertwined, but a multitude of factors coalesce to determine market performance. As we have seen, despite a positive historical correlation between oil prices and market performance since 1990, market performance depends heavily on the time period being reviewed. Technological advances, increased efficiency, smaller market representation, and an increase in global production and supply all seem to have the energy sector in a transitional period. Regardless, it appears low oil prices have become the new norm, which should continue to benefit many areas of the economy while harming others, further complicating the relationship between oil prices and stock market returns.
Brandon Rick Associate Investment Analyst
Source: OPEC and Morningstar

FOR ONE-ON-ONE USE WITH A CLIENT’S FINANCIAL ADVISOR ONLY.
PMC Weekly Market Review
4
June 30, 2017
134135136137138139140141142143144 Dec-10 Feb-11 Apr-11 Jun-11 Aug-11 Oct-11Index S&P/Case-Shiller Home Price Index-Trailing 12 Mos.
Source: Bloomberg
220
225
230
235
240
245
250
255
260
4/7 4/21 5/5 5/19 6/2 6/16
Tho
usa
nd
s
Initial Jobless Claims-Trailing 12 Wks.
Source: Bloomberg
Economic Data
-0.4
-0.3
-0.2
-0.1
0
0.1
0.2
0.3
0.4
0.5
0.6
0.7
Jul-16 Sep-16 Nov-16 Jan-17 Mar-17 May-17
Mo
nth
ly %
Ch
g.Consumer Price Index-Trailing 12 Mos.
Headline CPI Core CPISource: Bloomberg
0.0
20.0
40.0
60.0
80.0
100.0
120.0
140.0
Jul-16 Sep-16 Nov-16 Jan-17 Mar-17 May-17
Ind
ex
Consumer Board Confidence Index - Trailing 12 Mos.
Source: Bloomberg
0
50
100
150
200
250
300
350
Jul-16 Sep-16 Nov-16 Jan-17 Mar-17 May-17
Tho
usa
nd
s
Non-Farm Payrolls-Trailing 12 Mos.
Source: Bloomberg
0.0
1.0
2.0
3.0
4.0
5.0
6.0
Sep-14 Mar-15 Sep-15 Mar-16 Sep-16 Mar-17
%
Real GDP Growth Rate - Annualized - 12 Qtrs.
Source: Bloomberg
4.0
4.1
4.2
4.3
4.4
4.5
4.6
4.7
4.8
4.9
5.0
Jul-16 Sep-16 Nov-16 Jan-17 Mar-17 May-17
%
Unemployment Rate-Trailing 12 Mos.
Source: Bloomberg
FOR ONE-ON-ONE USE WITH A CLIENT’S FINANCIAL ADVISOR ONLY.
PMC Weekly Market Review June 30, 2017
5
Last Change % Chg. YTD % Last Change % Chg. YTD %
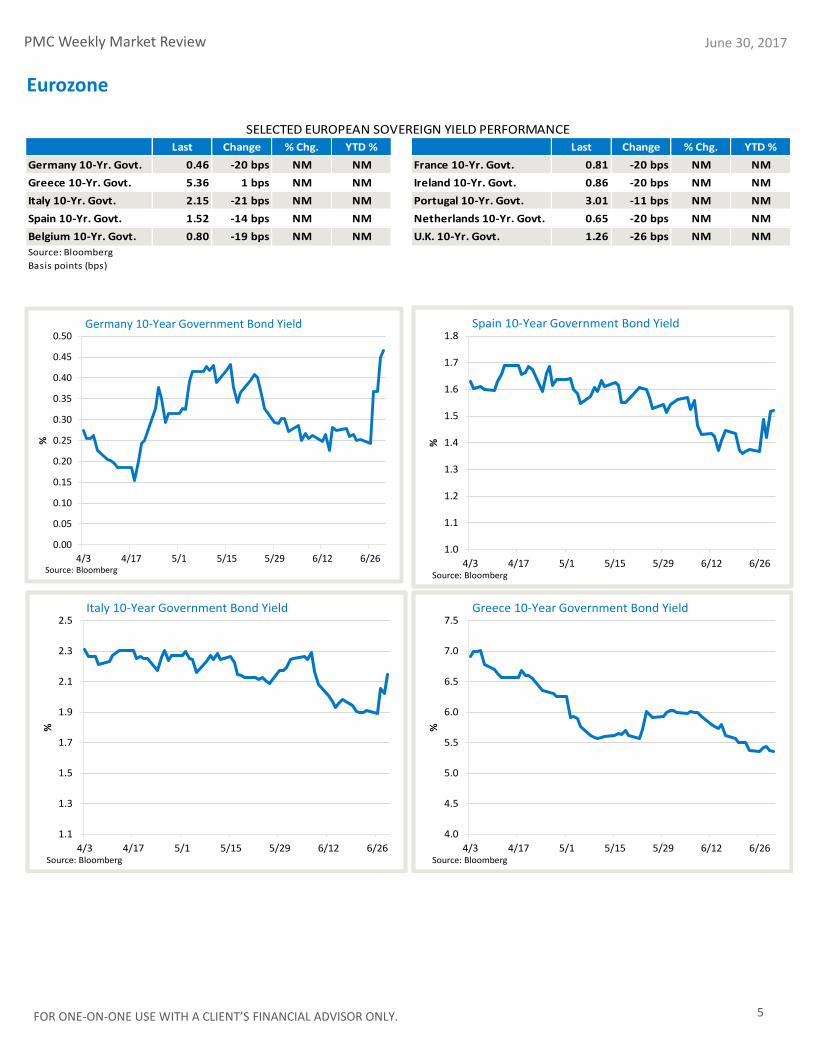
Germany 10-Yr. Govt. 0.46 -20 bps NM NM France 10-Yr. Govt. 0.81 -20 bps NM NM
Greece 10-Yr. Govt. 5.36 1 bps NM NM Ireland 10-Yr. Govt. 0.86 -20 bps NM NM
Italy 10-Yr. Govt. 2.15 -21 bps NM NM Portugal 10-Yr. Govt. 3.01 -11 bps NM NM
Spain 10-Yr. Govt. 1.52 -14 bps NM NM Netherlands 10-Yr. Govt. 0.65 -20 bps NM NM
Belgium 10-Yr. Govt. 0.80 -19 bps NM NM U.K. 10-Yr. Govt. 1.26 -26 bps NM NM
SELECTED EUROPEAN SOVEREIGN YIELD PERFORMANCE
Source: Bloomberg
Basis points (bps)
1.0
1.1
1.2
1.3
1.4
1.5
1.6
1.7
1.8
4/3 4/17 5/1 5/15 5/29 6/12 6/26
%
Spain 10-Year Government Bond Yield
Source: Bloomberg
1.1
1.3
1.5
1.7
1.9
2.1
2.3
2.5
4/3 4/17 5/1 5/15 5/29 6/12 6/26
%
Italy 10-Year Government Bond Yield
Source: Bloomberg
4.0
4.5
5.0
5.5
6.0
6.5
7.0
7.5
4/3 4/17 5/1 5/15 5/29 6/12 6/26
%
Greece 10-Year Government Bond Yield
Source: Bloomberg
Eurozone
0.00
0.05
0.10
0.15
0.20
0.25
0.30
0.35
0.40
0.45
0.50
4/3 4/17 5/1 5/15 5/29 6/12 6/26
%
Germany 10-Year Government Bond Yield
Source: Bloomberg
FOR ONE-ON-ONE USE WITH A CLIENT’S FINANCIAL ADVISOR ONLY.
PMC Weekly Market Review June 30, 2017
6
5,500
5,600
5,700
5,800
5,900
6,000
6,100
6,200
6,300
6,400
4/3 4/17 5/1 5/15 5/29 6/12 6/26
Ind
exNasdaq Composite-Trailing 90 Days
Source: Bloomberg
2,000
2,200
2,400
2,600
2,800
3,000
3,200
3,400
4/5 4/19 5/3 5/17 5/31 6/14 6/28
Ind
ex
Shanghai Composite Index-Trailing 90 Days
Source: Bloomberg
300
320
340
360
380
400
420
4/3 4/17 5/1 5/15 5/29 6/12 6/26
Ind
ex
Euro Stoxx Index-Trailing 90 Days
Source: Bloomberg
19,800
20,000
20,200
20,400
20,600
20,800
21,000
21,200
21,400
21,600
21,800
4/3 4/17 5/1 5/15 5/29 6/12 6/26
Ind
ex
Dow Jones Industrial Average -Trailing 90 Days
Source: Bloomberg
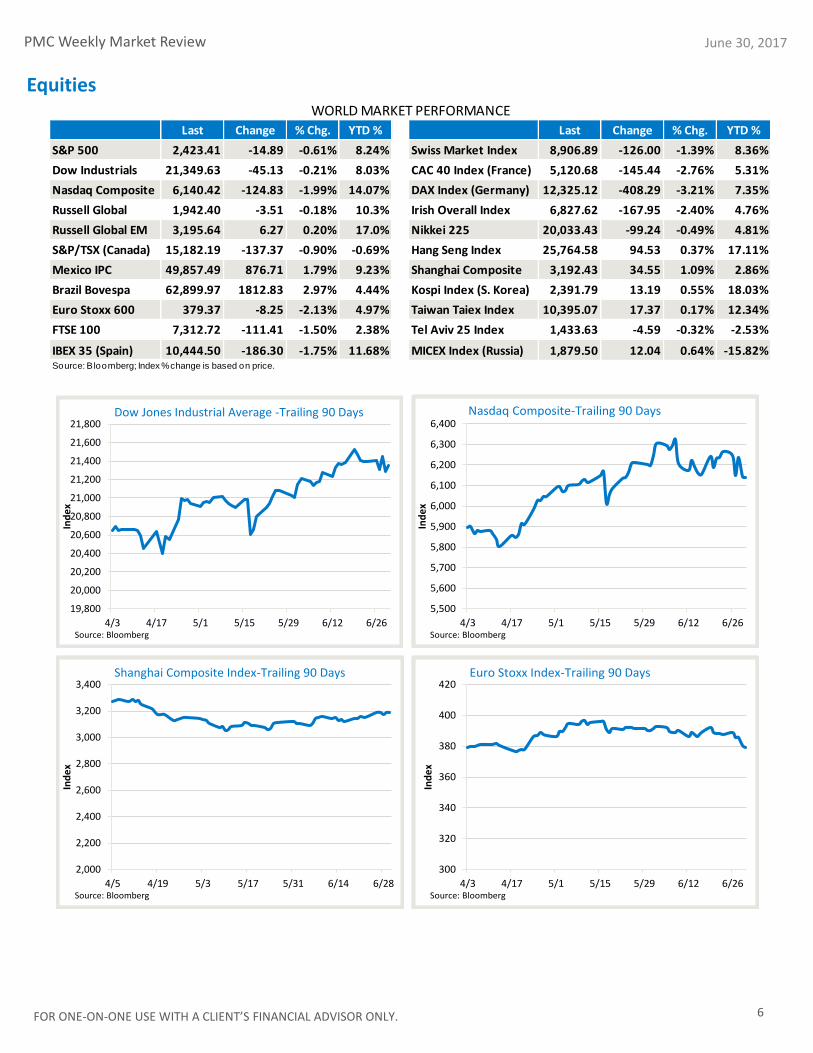
Last Change % Chg. YTD % Last Change % Chg. YTD %
S&P 500 2,423.41 -14.89 -0.61% 8.24% Swiss Market Index 8,906.89 -126.00 -1.39% 8.36%
Dow Industrials 21,349.63 -45.13 -0.21% 8.03% CAC 40 Index (France) 5,120.68 -145.44 -2.76% 5.31%
Nasdaq Composite 6,140.42 -124.83 -1.99% 14.07% DAX Index (Germany) 12,325.12 -408.29 -3.21% 7.35%
Russell Global 1,942.40 -3.51 -0.18% 10.3% Irish Overall Index 6,827.62 -167.95 -2.40% 4.76%
Russell Global EM 3,195.64 6.27 0.20% 17.0% Nikkei 225 20,033.43 -99.24 -0.49% 4.81%
S&P/TSX (Canada) 15,182.19 -137.37 -0.90% -0.69% Hang Seng Index 25,764.58 94.53 0.37% 17.11%
Mexico IPC 49,857.49 876.71 1.79% 9.23% Shanghai Composite 3,192.43 34.55 1.09% 2.86%
Brazil Bovespa 62,899.97 1812.83 2.97% 4.44% Kospi Index (S. Korea) 2,391.79 13.19 0.55% 18.03%
Euro Stoxx 600 379.37 -8.25 -2.13% 4.97% Taiwan Taiex Index 10,395.07 17.37 0.17% 12.34%
FTSE 100 7,312.72 -111.41 -1.50% 2.38% Tel Aviv 25 Index 1,433.63 -4.59 -0.32% -2.53%
IBEX 35 (Spain) 10,444.50 -186.30 -1.75% 11.68% MICEX Index (Russia) 1,879.50 12.04 0.64% -15.82%
WORLD MARKET PERFORMANCE
Source: Bloomberg; Index % change is based on price.
Equities

FOR ONE-ON-ONE USE WITH A CLIENT’S FINANCIAL ADVISOR ONLY.
PMC Weekly Market Review June 30, 2017
7
Last Change % Chg. YTD % Last Change % Chg. YTD %
Mexico IPC 49,857.49 876.71 1.8% 9.2% Hang Seng Index 25,764.58 94.53 0.4% 17.1%
Brazil (Bovespa Index) 62,899.97 1812.83 3.0% 4.4% India (Sensex 30) 30,921.61 -216.60 -0.7% 16.1%
MICEX Index (Russia) 1,879.50 12.04 0.6% -15.8% Malaysia (KLCI Index) 1,763.67 -11.90 -0.7% 7.4%
Czech Republic (Prague) 980.41 -0.27 0.0% 6.4% Singapore (Straits Times Index) 3,226.48 10.93 0.3% 12.0%
Turkey (Istanbul) 100,440.39 801.75 0.8% 28.5% Thailand (SET Index) 1,574.74 -7.62 -0.5% 2.1%
Egypt (Hermes Index) 1,216.91 1.56 0.1% 11.7% Indonesia (Jakarta) 5,829.71 53.42 0.9% 10.1%
Kenya (Nairobi 20 Index) 3,607.18 -16.65 -0.5% 13.2% Pakistan (Karachi KSE 100) 46,565.29 232.98 0.5% -2.6%
Saudi Arabia (TASI Index) 7,425.72 544.33 7.9% 3.0% Vietnam (Ho Chi Minh) 776.47 7.46 1.0% 16.8%
Lebanon (Beirut BLOM Index) 1,150.35 -5.57 -0.5% -5.1% Sri Lanka (Colombo) 6,747.07 32.34 0.5% 8.3%
Palestine 544.36 0.81 0.1% 2.7% Cambodia (Laos) 1,012.67 -8.18 -0.8% -0.2%
EMERGING AND FRONTIER MARKET PERFORMANCE
Source: Bloomberg; Index % change is based on price.
30,000
35,000
40,000
45,000
50,000
55,000
60,000
65,000
70,000
75,000
4/3 4/17 5/1 5/15 5/29 6/12 6/26
Ind
ex
Brazil (Bovespa Index)-Trailing 90 Days
Source: Bloomberg
28,000
28,500
29,000
29,500
30,000
30,500
31,000
31,500
4/3 4/17 5/1 5/15 5/29 6/12 6/26
Ind
ex
India (Sensex Index)-Trailing 90 Days
Source: Bloomberg
400
500
600
700
800
900
1,000
1,100
1,200
1,300
4/2 4/16 4/30 5/14 5/28 6/11 6/25
Ind
ex
Egypt (Hermes Index)-Trailing 90 Days
Source: Bloomberg
3,050
3,100
3,150
3,200
3,250
3,300
4/3 4/17 5/1 5/15 5/29 6/12 6/26
Ind
ex
Singapore (Straits Times Index)-Trailing 90 Days
Source: Bloomberg
Equities – Emerging and Frontier Markets

FOR ONE-ON-ONE USE WITH A CLIENT’S FINANCIAL ADVISOR ONLY.
PMC Weekly Market Review June 30, 2017
YIELD CURVES
8
Last Change % Chg. YTD % Last Change % Chg. YTD %
2-Yr. U.S. Treasury 1.38% 0 bps NM NM Prime Rate 4.25% 0.00 NM NM
5-Yr. U.S. Treasury 1.89% 13 bps NM NM Fed Funds Rate 1.25% 0.00 NM NM
10-Yr. U.S. Treasury 2.30% 16 bps NM NM Discount Rate 1.75% 0.00 NM NM
30-Yr. U.S. Treasury 2.84% 13 bps NM NM LIBOR (3 Mo.) 1.30% 1 bps NM NM
German 10-Yr. Govt. 0.46% -20 bps NM NM Bond Buyer 40 Muni 3.67% 12 bps NM NM
France 10-Yr. 0.81% -20 bps NM NM Bond Buyer 40 G.O. 3.58% NA NM NM
Italy 10-Yr. 2.15% -21 bps NM NM Bond Buyer 40 Rev. 3.75% NA NM NM
Fed 5-Yr Fwd BE Inf. 1.73% 2 bps NM NM
SELECTED INTEREST RATES
Source: Bloomberg
1M 1Y 3Y 5Y 8Y 10Y 15Y 20Y 30Y0.00
1.00
2.00
3.00
4.00
5.00
6.00
US Treasury Actives Curve 20170623
US Treasury Actives Curve 20170630
USD Composite (A) BFV Curve 20170701
USD Composite (BBB) BFV Curve 20170701
1.00
1.10
1.20
1.30
1.40
1.50
1.60
1.70
1/2 2/2 3/2 4/2 5/2 6/2
Ind
ex
BBB/Baa- 10-Yr Treas. Spread Rising Line = Risk Aversion
Source: Bloomberg
Source: Bloomberg
Interest Rates
1.50
1.70
1.90
2.10
2.30
2.50
2.70
1/3 2/3 3/3 4/3 5/3 6/3
Yie
ld %
10-Year Treasury Yield - Trailing 180 Days
Source: Bloomberg

FOR ONE-ON-ONE USE WITH A CLIENT’S FINANCIAL ADVISOR ONLY.
PMC Weekly Market Review June 30, 2017
9
90
92
94
96
98
100
102
104
1/2 2/2 3/2 4/2 5/2 6/2
U.S. Dollar Index - Trailing Six Months
Source: Bloomberg
0.80
0.85
0.90
0.95
1.00
1.05
1.10
1.15
1.20
1/2 2/2 3/2 4/2 5/2 6/2
Euro - U.S. Dollars per Euro
Source: Bloomberg
102.00
104.00
106.00
108.00
110.00
112.00
114.00
116.00
118.00
120.00
1/2 2/2 3/2 4/2 5/2 6/2
Japanese yen - Yen per U.S. Dollar
Source: Bloomberg
Last Change % Chg. YTD % Last Change % Chg. YTD %
Dollar Index 95.65 -1.618 -1.66% -6.42% Chinese Yuan 6.78 -0.056 0.82% 2.42%
Euro 1.14 0.023 2.04% 8.61% Swiss Franc 0.96 -0.011 1.11% 6.29%
Japanese Yen 112.48 1.180 -1.05% 4.00% New Zealand Dollar 0.73 0.004 0.56% 5.65%
British Pound 1.30 0.031 2.44% 5.58% Brazilian Real 3.31 -0.034 1.03% -1.78%
Canadian Dollar 1.30 -0.030 2.31% 3.66% Mexican Peso 18.14 0.134 -0.74% 14.25%
SELECTED CURRENCY PERFORMANCE
Source: Bloomberg
6.65
6.70
6.75
6.80
6.85
6.90
6.95
7.00
1/3 2/3 3/3 4/3 5/3 6/3
Chinese yuan - yuan per U.S. Dollar
Source: Bloomberg
Currencies

FOR ONE-ON-ONE USE WITH A CLIENT’S FINANCIAL ADVISOR ONLY.
PMC Weekly Market Review June 30, 2017
10
0
10
20
30
40
50
60
70
1/3 2/3 3/3 4/3 5/3 6/3
$ p
er b
arre
l
Crude Oil - Light Crude ($ per barrel)
Source: Bloomberg
1,050
1,100
1,150
1,200
1,250
1,300
1,350
1/3 2/3 3/3 4/3 5/3 6/3
$ p
er o
un
ce
Gold - Spot gold price ($ per ounce)
Source: Bloomberg
320
330
340
350
360
370
380
390
400
410
1/3 2/3 3/3 4/3 5/3 6/3
$ p
er b
ush
el
Corn - Active Contract
Source: Bloomberg
Last Change % Chg. YTD % Last Change % Chg. YTD %
Bloomberg Comm. Idx. 82.60 2.96 3.72% -5.61% Platinum Spot $924.86 -$5.19 -0.56% 2.42%
Crude Oil $46.26 $3.20 7.44% -18.79% Corn 381.00 15.50 4.24% 2.63%
Natural Gas $3.03 $0.08 2.71% -15.22% Wheat 526.00 52.50 11.09% 17.48%
Gasoline ($/Gal.) $2.24 -$0.03 -1.37% -4.15% Soybeans 954.75 43.75 4.80% -3.49%
Heating Oil 148.66 10.68 7.75% -15.91% Sugar 13.81 0.64 4.86% -25.95%
Gold Spot $1,241.60 -$15.10 -1.20% 8.20% Orange Juice 132.55 0.30 0.23% -29.61%
Silver Spot $16.63 -$0.08 -0.46% 4.45% Aluminum 1,915.00 50.00 2.68% 13.11%
Source: Bloomberg; % change is based on price. Copper 5,940.00 139.50 2.40% 7.31%
SELECTED COMMODITY MARKET PERFORMANCE
Commodities
5,100
5,200
5,300
5,400
5,500
5,600
5,700
5,800
5,900
6,000
6,100
6,200
1/3 2/3 3/3 4/3 5/3 6/3
Ind
ex
Copper
Source: Bloomberg

FOR ONE-ON-ONE USE WITH A CLIENT’S FINANCIAL ADVISOR ONLY.
PMC Weekly Market Review June 30, 2017
11
1,210
1,215
1,220
1,225
1,230
1,235
1,240
4/3 4/17 5/1 5/15 5/29 6/12 6/26
Ind
ex
HFRX Global Hedge Fund Index - Trailing 90 Days
Source: Bloomberg
975
980
985
990
995
1,000
1,005
1,010
4/3 4/17 5/1 5/15 5/29 6/12 6/26
Ind
ex
HFRX Equity Market Neutral - Trailing 90 Days
Source: Bloomberg
1,425
1,430
1,435
1,440
1,445
1,450
4/3 4/17 5/1 5/15 5/29 6/12 6/26
Ind
ex
IQ Fixed Income Beta Arb Index - Trailing 90 Days
Source: Bloomberg
1,170
1,175
1,180
1,185
1,190
1,195
1,200
1,205
4/3 4/17 5/1 5/15 5/29 6/12 6/26
Ind
ex
HFRX Equity Hedge Index - Trailing 90 Days
Source: Bloomberg
Last Change % Chg. YTD % Last Change % Chg. YTD %
HFRX Global Hedge Fund Index 1235.88 -0.71 -0.06% 2.69% HFRX Distressed Index 1100.75 7.57 0.69% 2.58%
HFRX Equity Market Neutral 994.42 3.59 0.36% 0.72% HFRX Merger Arbitrage Index 1835.68 -1.32 -0.07% 1.27%
HFRX Equity Hedge Index 1197.51 0.85 0.07% 3.64% HFRX Convertible Arbitrage Index 775.26 2.68 0.35% 4.40%
HFRX Event-Driven Index 1636.87 0.17 0.01% 4.63% HFRX Macro CTA Index 1137.31 -6.99 -0.61% 0.17%
HFRX Absolute Return Index 1043.20 1.95 0.19% 1.43% IQ Fixed Income Beta Arb Index 1447.43 4.57 0.32% 1.93%
SELECTED ALTERNATIVE INVESTMENT INDEX PERFORMANCE
Source: Bloomberg; Index % change is based on price.
Alternative Investments

FOR ONE-ON-ONE USE WITH A CLIENT’S FINANCIAL ADVISOR ONLY.
PMC Weekly Market Review
3.40
3.50
3.60
3.70
3.80
3.90
4.00
1/3 2/3 3/3 4/3 5/3 6/3
Ind
ex
S&P 500/MSCI EAFE - Trailing 180 Days
Source: Bloomberg
1.50
1.52
1.54
1.56
1.58
1.60
1.62
1.64
1.66
1/3 2/3 3/3 4/3 5/3 6/3
Ind
ex
MSCI EAFE/MSCI EM - Trailing 180 Days
Source: Bloomberg
0.36
0.36
0.37
0.37
0.38
0.38
0.39
0.39
0.40
0.40
0.41
0.41
1/3 2/3 3/3 4/3 5/3 6/3
Ind
exLarge Cap/Small Cap - Trailing 180 Days
Source: Bloomberg
0.70
0.72
0.74
0.76
0.78
0.80
0.82
0.84
0.86
1/3 2/3 3/3 4/3 5/3 6/3
Ind
ex
Growth/Value - Trailing 180 Days
Source: Bloomberg
June 30, 2017
12
3.00
3.50
4.00
4.50
5.00
5.50
6.00
6.50
7.00
1/3 2/3 3/3 4/3 5/3 6/3
Ind
ex
S&P 500/MSCI EM - Trailing 180 Days
Source: Bloomberg
Portfolio Construction

FOR ONE-ON-ONE USE WITH A CLIENT’S FINANCIAL ADVISOR ONLY.
PMC Weekly Market Review
0.298
0.300
0.302
0.304
0.306
0.308
0.310
0.312
0.314
0.316
0.318
1/3 2/3 3/3 4/3 5/3 6/3
Ind
exHigh Yield/Inv. Grade Bonds - Trailing 180 Days
Source: Bloomberg
0.205
0.210
0.215
0.220
0.225
0.230
0.235
0.240
1/3 2/3 3/3 4/3 5/3 6/3
Ind
ex
Info Tech/S&P 500 - Trailing 180 Days
Source: Bloomberg
1.79
1.80
1.81
1.82
1.83
1.84
1.85
1.86
1.87
1/3 2/3 3/3 4/3 5/3 6/3
Ind
ex
Inv. Grade Bonds/Int. Govt. Bonds - Trailing 180 Days
Source: Bloomberg
0.56
0.56
0.57
0.57
0.58
0.58
0.59
1/3 2/3 3/3 4/3 5/3 6/3
Ind
ex
High Yield Bonds/Int. Govt. Bonds - Trailing 180 Days
Source: Bloomberg
June 30, 2017
13
Portfolio Construction (continued)

FOR ONE-ON-ONE USE WITH A CLIENT’S FINANCIAL ADVISOR ONLY.
PMC Weekly Market Review
14
June 30, 2017
The Relative Strength Matrix provides an indication of how the various asset classes have performed relative to one another over the past 30 days. A number greater than 1.0 indicates that the asset class in the far left column has outperformed the corresponding asset class in the top row over the past 30 days. A number below 1.0 means the asset class on the left has underperformed the asset class at the top. The green shading indicates outperformance, and the red shading indicates underperformance.
Source: Bloomberg
Large Cap
Core
Large Cap
Growth
Large Cap
Value
Mid Cap
Core
Mid Cap
Growth
Mid Cap
Value
Small Cap
Core
Small Cap
Growth
Small Cap
Value
Int'l.
Developed
Emerging
Markets REITs Comm. Int. Bond High Yield
Large Cap Core 1.00 1.02 1.01 1.02 1.02 1.03 0.99 0.97 1.01 0.93 0.94 1.00 1.22 1.07 1.05
Large Cap Growth 0.98 1.00 0.99 1.00 1.01 1.02 0.97 0.95 1.00 0.92 0.92 0.99 1.20 1.05 1.03
Large Cap Value 0.99 1.01 1.00 1.01 1.01 1.02 0.98 0.96 1.00 0.92 0.93 0.99 1.20 1.06 1.04
Mid Cap Core 0.98 1.00 0.99 1.00 1.00 1.01 0.97 0.95 0.99 0.91 0.92 0.98 1.19 1.05 1.03
Mid Cap Growth 0.98 0.99 0.99 1.00 1.00 1.01 0.97 0.95 0.99 0.91 0.92 0.98 1.19 1.05 1.03
Mid Cap Value 0.97 0.98 0.98 0.99 0.99 1.00 0.96 0.94 0.98 0.90 0.91 0.97 1.18 1.04 1.01
Small Cap Core 1.01 1.03 1.02 1.03 1.03 1.05 1.00 0.98 1.03 0.94 0.95 1.02 1.23 1.08 1.06
Small Cap Growth 1.03 1.05 1.04 1.05 1.05 1.07 1.02 1.00 1.05 0.96 0.97 1.03 1.25 1.10 1.08
Small Cap Value 0.99 1.00 1.00 1.01 1.01 1.02 0.97 0.96 1.00 0.92 0.92 0.99 1.20 1.06 1.03
Int'l. Developed 1.07 1.09 1.08 1.09 1.10 1.11 1.06 1.04 1.09 1.00 1.01 1.08 1.31 1.15 1.13
Emerging Markets 1.07 1.08 1.08 1.09 1.09 1.10 1.05 1.04 1.08 0.99 1.00 1.07 1.30 1.14 1.12
REITs 1.00 1.01 1.01 1.02 1.02 1.03 0.98 0.97 1.01 0.93 0.93 1.00 1.21 1.07 1.05
Commodities 0.82 0.83 0.83 0.84 0.84 0.85 0.81 0.80 0.83 0.77 0.77 0.82 1.00 0.88 0.86
Int. Bond 0.93 0.95 0.94 0.95 0.95 0.97 0.92 0.91 0.95 0.87 0.88 0.94 1.14 1.00 0.98
High Yield 0.95 0.97 0.96 0.97 0.97 0.99 0.94 0.93 0.97 0.89 0.89 0.96 1.16 1.02 1.00
RELATIVE STRENGTH MATRIX (BASED ON 30-DAY RSI)
4/13 4/20 4/27 5/4 5/11 5/18 5/25 6/1 6/8 6/15 6/22 6/29
Large Cap
(R200)-1.20% 1.01% 1.47% 0.24% 0.08% -1.17% 2.09% 0.56% 0.29% -0.17% 0.23% -0.69%
Small Cap
(R2000)-1.41% 2.89% 2.38% -2.00% 0.10% -2.09% 1.64% 0.92% 1.40% -0.39% -0.39% 0.83%
MSCI EAFE -0.03% 0.21% 2.93% 0.94% 0.28% 0.55% 1.27% 0.12% -0.01% -0.92% 0.48% 0.52%
MSCI Em.
Mkts.-0.05% -0.46% 2.21% 0.04% 2.07% -1.20% 2.65% -0.60% 1.05% -1.51% 0.52% 0.52%
BarCap Agg.
(AGG)29.55% -4.73% -2.04% -3.28% -1.23% -1.56% -7.92% 2.41% -1.34% 14.14% -5.67% -3.48%
High Yield
(JNK)-0.16% 0.54% 0.62% -0.81% 0.68% 0.03% 0.59% -0.13% -0.30% 0.05% -0.56% 0.43%
Bloomberg
Commodity
Index
0.64% -2.15% -0.98% -1.68% 1.11% 0.36% 0.34% -1.48% -0.35% -1.53% -1.93% 2.49%
Hedge Funds
(HFRX Global)-0.21% 0.17% 0.46% -0.02% 0.17% -0.38% 0.56% 0.14% 0.02% -0.26% 0.32% 0.02%
60/40* 9.83% -1.03% 0.54% -1.17% -0.22% -1.08% -1.63% 1.08% -0.21% 4.65% -1.89% -1.22%
48/32/20
(w/Alts.)**7.82% -0.79% 0.53% -0.94% -0.14% -0.94% -1.19% 0.89% -0.16% 3.67% -1.45% -0.97%
Source: Bloomberg; *60/40 portfolio = 30% Large Cap/10% Small Cap/15% EAFE/5% Emerging Markets/35% BarCap Agg./5% High Yield.
**48/32/20 portfolio = 24% Large Cap/8% Small Cap/12% EAFE/4% Emerging Markets/28% BarCap Agg./4% High Yield/20% HFRX Global Index.
WEEKLY ASSET CLASS PERFORMANCE (Prior 12 weeks ending Thursday)
Alternatives
Asset Allocation
Domestic
Equity
Int'l.
Equity
Fixed Income
Commodities
Equity

FOR ONE-ON-ONE USE WITH A CLIENT’S FINANCIAL ADVISOR ONLY.
PMC Weekly Market Review June 30, 2017
15
Index Overview & Key Definitions Fed, The Fed or FED refers to the Federal Reserve System, the central bank of the United States. The Federal Open Market Committee (FOMC) is the monetary policymaking body of the Federal Reserve System. Fed Funds Rate, the interest rate at which a depository institution lends funds maintained at the Federal Reserve to another depository institution overnight. The European Central Bank (ECB) is the central bank for Europe's single currency, the euro. The ECB’s main task is to maintain the euro's purchasing power and thus price stability in the euro area. The euro area comprises the 19 European Union countries that have introduced the euro since 1999. The Gross Domestic Product (GDP) rate is a measurement of the output of goods and services produced by labor and property located in the United States. Basis Point(s) is a unit that is equal to 1/100th of 1%, and is used to denote the change in a financial instrument. The basis point is commonly used for calculating changes in interest rates, equity indexes and the yield of a fixed-income security. A separately managed account (SMA) is an individual managed investment account offered typically by a brokerage firm through one of their brokers or financial consultants and managed by independent investment management firms (often called money managers for short) and have varying fee structures. The Consumer Price Index (CPI) measures the change in the cost of a fixed basket of products and services. The Producer Price Index (PPI) program measures the average change over time in the selling prices received by domestic producers for their output. The prices included in the PPI are from the first commercial transaction for many products and some services. Core CPI is an additional CPI Index, excludes energy and food item price changes, and measures the “core” or “underlying” rate of inflation. The PCE (Personal Consumption Expenditure) Index of Prices is a US-‐wide indicator of the average increase in prices for all domestic personal consumption. Using a variety of data including U.S. Consumer Price Index and Producer Price Index prices, it is derived from personal consumption expenditures; essentially a measure of goods and services targeted towards individuals and consumed by individuals. The Dow Jones Industrial Average (DOW or DJIA) is an unmanaged index of 30 common stocks comprised of 30 actively traded blue chip stocks, primarily industrials and assumes reinvestment of dividends. The S&P 500 Index is an unmanaged index comprised of 500 widely held securities considered to be representative of the stock market in general. The S&P/Case-Shiller Home Price Indices measure the residential housing market, tracking changes in the value of the residential real estate market in 20 metropolitan regions across the United States. The Nasdaq Composite Index is a stock market index of the common stocks and similar securities listed on the NASDAQ stock market. The US Dollar Index is a measure of the value of the United States dollar relative to a basket of foreign currencies. It is a weighted geometric mean of the dollar's value relative to other select currencies (Euro, Japanese yen, Pound sterling, Canadian dollar, Swedish krona (SEK) & Swiss franc). The Nikkei Index (Nikkei 225 or Nikkei) is a stock market index for the Tokyo Stock Exchange calculated daily by the Nihon Keizai Shimbun (Nikkei) newspaper since 1950. It is a price-weighted index (the unit is yen), and the components are reviewed once a year. The FTSE 100 Index (FTSE 100) is a share index of the 100 companies listed on the London Stock Exchange (LSE) with the highest market capitalization. The Bloomberg Commodity Index (formerly the Dow Jones-UBS Commodity Index) tracks prices of futures contracts on physical commodities on the commodity markets and is designed to minimize concentration in any one commodity or sector (currently 22 commodity futures in seven sectors). The Barclays Capital US Credit Index is an unmanaged index considered representative of publicly issued, SEC-registered US corporate and specified foreign debentures and secured notes. The Barclays Capital US Aggregate Bond Index is a market capitalization-weighted index of investment-grade, fixed-rate debt issues, including government, corporate, asset-backed, and mortgage-backed securities, with maturities of at least one year. The Barclays Capital US Corporate High Yield Index covers the USD-denominated, non-investment grade, fixed-rate, taxable corporate bond market. Securities are classified as high-yield if the middle rating of Moody’s, Fitch and S&P is Ba1/BB+/BB+ or below. The index may include emerging market debt. The Barclays Capital Municipal Bond Index is an unmanaged index comprised of investment-grade, fixed-rate municipal securities representative of the tax-exempt bond market in general. The Barclays Capital US Treasury Total Return Index is an unmanaged index of public obligations of the US Treasury with a remaining maturity of one year or more. The Barclays Capital Global Aggregate ex-U.S. Index is a market capitalization-weighted index, meaning the securities in the index are weighted according to the market size of each bond type. Most U.S. traded investment grade bonds are represented. Municipal bonds, and Treasury Inflation-Protected Securities are excluded, due to tax treatment issues. The index includes Treasury securities, Government agency bonds, Mortgage-backed bonds, Corporate bonds, and a small amount of foreign bonds traded in U.S. The Barclays Capital U.S. 5-10 Year Corporate Bond Index measures the investment return of U.S. dollar denominated, investment-grade, fixed rate, taxable securities issued by industrial, utility, and financial companies with maturities between 5 and 10 years. Treasury securities, mortgage-backed securities (MBS) foreign bonds, government agency bonds and corporate bonds are some of the categories included in the index. The Barclays Capital U.S Corporate High-Yield Index is composed of fixed-rate, publicly issued, non-investment grade debt. The Barclays Capital U.S. Corporate 5-10 Year Index includes U.S. dollar-denominated, investment-grade, fixed-rate, taxable securities issued by industrial, utility, & financial companies, with maturities between 5 & 10 years. The DJ-UBS Commodity Index Total Return SM measures the collateralized returns from a basket of 19 commodity futures contracts representing the energy, precious metals, industrial metals, grains, softs and livestock sectors. The Russell 1000 Index is a market capitalization-weighted benchmark index made up of the 1000 largest U.S. companies in the Russell 3000 Index. The Russell 1000 Growth Index is an unmanaged index considered representative of large-cap growth stocks. The Russell 1000 Value Index is an unmanaged index considered representative of large-cap value stocks. The Russell 2000 Index is an unmanaged index considered representative of small-cap stocks. The Russell 2000 Growth Index is an unmanaged index considered representative of small-cap growth stocks. The Russell 2000 Growth Index is an unmanaged index considered representative of small-cap value stocks. The Russell 3000 Index is an unmanaged index considered representative of the US stock market. The Russell Midcap Index is a subset of the Russell 1000 Index. It includes approximately 800 of the smallest securities based on a combination of their market cap and current index membership. The Russell Midcap Growth Index is an unmanaged index considered representative of mid-cap growth stocks. The Russell Midcap Value Index is an unmanaged index considered representative of mid-cap value stocks. The HFRX Indices are a series of benchmarks of hedge fund industry performance which are engineered to achieve representative performance of a larger universe of hedge fund strategies. Hedge Fund Research, Inc. employs the HFRX Methodology (UCITS compliant), a proprietary and highly quantitative process by which hedge funds are selected as constituents for the HFRX Indices. The University of Michigan Consumer Sentiment Index (MCSI) is a survey of consumer confidence conducted by the University of Michigan using telephone surveys to gather information on consumer expectations regarding the overall economy. The CBOE Volatility Index (VIX) is an up-to-the-minute market estimate of expected volatility that is calculated by using real-time S&P 500 Index option bid/ask quotes. The Index uses nearby and second nearby options with at least 8 days left to expiration and then weights them to yield a constant, 30-day measure of the expected volatility of the S&P 500 Index. The MSCI EAFE Index is designed to measure the equity market performance of developed markets outside of the U.S. & Canada. The MSCI EAFE Growth Index is an unmanaged index considered representative of growth stocks of Europe, Australasia and the Far East. The MSCI EAFE Value Index is an unmanaged index considered representative of value stocks of Europe, Australasia and the Far East. The MSCI EM (Emerging Markets) Latin America Index is a free float-adjusted market capitalization weighted index that is designed to measure the equity market performance of emerging markets in Latin America. The MSCI World ex-U.S. Index captures large and mid-cap representation across 22 of 23 Developed Markets (DM) countries - excluding the US. With 1,002 constituents, the index covers approximately 85% of the free float-adjusted market capitalization in each country. The MSCI Japan Index is designed to measure the performance of the large and mid-cap segments of the Japanese market. With 320 constituents, the index covers approximately 85% of the free float-adjusted market capitalization in Japan. The MSCI Emerging Markets Index is a free float-adjusted market capitalization index that is designed to measure equity market performance in the global emerging markets. The MSCI Europe Index is an unmanaged index considered representative of stocks of developed European countries. The MSCI Pacific Index is a free float-adjusted market capitalization weighted index that is designed to measure the equity market performance of the developed markets in the Pacific region. The Barclays Intermediate US Government/Credit Bond Index is a market capitalization-weighted index of investment-grade, fixed-rate debt issues, including Treasuries, government-related and U.S. corporate securities, with maturities of at least one year and less than 10 years. The Philadelphia Fed Manufacturing Index is a regional Federal Reserve Bank index measuring changes in business growth and is constructed from a survey of participants who voluntarily answer questions regarding the direction of change in their overall business activities. The ISM Non-Manufacturing Index is an index based on surveys of more than 400 non-manufacturing firms' purchasing and supply executives, within 60 sectors across the nation, by the Institute of Supply Management (ISM) and also tracks economic data, like the ISM Non-Manufacturing Business Activity Index. A composite diffusion index is created based on the data from these surveys that monitors economic conditions of the nation. The Housing Market Index (HMI) is based on a monthly survey of NAHB members designed to take the pulse of the single-family housing market. In May 2007, Markit’s U.S. PMI research was extended out to cover producers of metal goods. In October 2009, Markit’s U.S. Manufacturing PMI survey panel was extended further to cover all areas of U.S. manufacturing activity. The NY Empire State Index is an index based on the monthly survey of manufacturers in New York State – known as the Empire State Manufacturing Survey – conducted by the Federal Reserve Bank of New York. The headline number for the NY Empire State Index refers to the survey’s main index, which summarizes general business conditions in New York State.
FOR ONE-ON-ONE USE WITH A CLIENT’S FINANCIAL ADVISOR ONLY.
PMC Weekly Market Review June 30, 2017
16
The information, analysis, and opinions expressed herein are for general and educational purposes only. Nothing contained in this weekly review is intended to constitute legal, tax, accounting, securities, or investment advice, nor an opinion regarding the appropriateness of any investment, nor a solicitation of any type. All investments carry a certain risk, and there is no assurance that an investment will provide positive performance over any period of time. An investor may experience loss of principal. Investment decisions should always be made based on the investor’s specific financial needs and objectives, goals, time horizon, and risk tolerance. The asset classes and/or investment strategies described may not be suitable for all investors and investors should consult with an investment advisor to determine the appropriate investment strategy. Past performance is not indicative of future results. Information obtained from third party sources are believed to be reliable but not guaranteed. Envestnet|PMC™ makes no representation regarding the accuracy or completeness of information provided herein. All opinions and views constitute our judgments as of the date of writing and are subject to change at any time without notice. Investments in smaller companies carry greater risk than is customarily associated with larger companies for various reasons such as volatility of earnings and prospects, higher failure rates, and limited markets, product lines or financial resources. Investing overseas involves special risks, including the volatility of currency exchange rates and, in some cases, limited geographic focus, political and economic instability, and relatively illiquid markets. Income (bond) securities are subject to interest rate risk, which is the risk that debt securities in a portfolio will decline in value because of increases in market interest rates. Exchange Traded Funds (ETFs) are subject to risks similar to those of stocks, such as market risk. Investing in ETFs may bear indirect fees and expenses charged by ETFs in addition to its direct fees and expenses, as well as indirectly bearing the principal risks of those ETFs. ETFs may trade at a discount to their net asset value and are subject to the market fluctuations of their underlying investments. Investing in commodities can be volatile and can suffer from periods of prolonged decline in value and may not be suitable for all investors. Index Performance is presented for illustrative purposes only and does not represent the performance of any specific investment product or portfolio. An investment cannot be made directly into an index. Alternative Investments may have complex terms and features that are not easily understood and are not suitable for all investors. You should conduct your own due diligence to ensure you understand the features of the product before investing. Alternative investment strategies may employ a variety of hedging techniques and non-traditional instruments such as inverse and leveraged products. Certain hedging techniques include matched combinations that neutralize or offset individual risks such as merger arbitrage, long/short equity, convertible bond arbitrage and fixed-income arbitrage. Leveraged products are those that employ financial derivatives and debt to try to achieve a multiple (for example two or three times) of the return or inverse return of a stated index or benchmark over the course of a single day. Inverse products utilize short selling, derivatives trading, and other leveraged investment techniques, such as futures trading to achieve their objectives, mainly to track the inverse of their benchmarks. As with all investments, there is no assurance that any investment strategies will achieve their objectives or protect against losses. Neither Envestnet, Envestnet|PMC™ nor its representatives render tax, accounting or legal advice. Any tax statements contained herein are not intended or written to be used, and cannot be used, for the purpose of avoiding U.S. federal, state, or local tax penalties. Taxpayers should always seek advice based on their own particular circumstances from an independent tax advisor. © 2017 Envestnet Asset Management, Inc. All rights reserved. ABOUT ENVESTNET® Envestnet, Inc. (NYSE: ENV) is the leading provider of intelligent systems for wealth management and financial wellness. Envestnet’s unified technology enhances advisor productivity and strengthens the wealth management process. Envestnet empowers enterprises and advisors to more fully understand their clients and deliver better outcomes. Envestnet's Advisor Suite® software empowers financial advisors to better manage client outcomes and strengthen their practice. Envestnet provides institutional-quality research and advanced portfolio solutions through our Portfolio Management Consultants group, Envestnet | PMC®. Envestnet | Tamarac provides leading rebalancing, reporting and practice management software. For more information on Envestnet, please visit www.envestnet.com.