Weekly Market Report -...
11
Market insight By Eva Tzima Research Analyst Right when you think that you have all your facts straight, right when things are stabilizing again for the Dry Bulk market, which was badly baered for the first couple of months of the year but didn’t collapse, a day like last Wednesday comes and makes you reconsider. For most of us who were caught up in the latest news regarding the developments in the Black Sea, the sudden drop of the BDI on Wednesday, caused exclusively by Cape rates plummeng, came as a big slap on the face. And as the market has since shown a cauous yet stable behavior, the drop of last mid-week has some- what remained away from the spotlight, with some being quick to explain it as just a glitch, which has come and gone fast, probably based on the price performance of iron ore and other commodies. But what exactly caused such a drop in rates? For the past years, China, the world’s second largest economy, has been considered the pedestal upon which global shipping growth will find a stable foong. The outlook of the dry bulk trade itself, has been inextricably linked to the future of the country’s economy, and despite voices raising concerns every now and then regarding the sustainability of projected growth, formal figures provided by the Chinese government have been reassuring that the country would opt for growth at a slower gear in the coming years, yet a growth that would be more sustainable and at the same me sufficient to drag upwards with it a number of sectors leſt ailing post 2008. On Monday last week, news released over the weekend that China’s Febru- ary exports unexpectedly dropped, sent shockwaves across the markets. This was in fact the biggest drop noted since the financial crisis and an even bigger blow on confidence regarding the country’s growth stability. The data revealed a 18.1% year-on-year decline, while an increase was originally ex- pected. As imports connued growing simultaneously, the country’s trade balance has in fact switched from a surplus in January to a deficit at the end of February, the biggest deficit recorded in the Chinese economy in two years. The immediate effect, of what was the biggest fall on Chinese exports since August 2009, was the plummeng of the iron ore price for delivery to China, which touched a 17 month low. As the country imports around 2/3 of the global seaborne iron ore, the dry bulk market was desned to feel a big chunk of the pressure mounted. Confidence has dropped quickly especially aſter the paper market for Q2 2014 took a substanal hit. Talks that due to pressure on commodity prices the Chinese were looking to cancel a number of dry bulk COAs, quickly circulated the market, with rumors menoning up to forty April onwards soybeans cargoes from ECSA. At the same me, the Capesize Tubarao/Qingdao and Western Australia/China routes noted a sharp fall almost immediately and the domino effect pushed the BDI down. Currently the market is leſt a bit numb. The days following Wednesday saw the market nong small daily upcks across the board. It is very difficult at this stage to fully appreciate what the impact regarding Chinese growth will be. Between those who believe that the sharp fall was a correcon that just didn’t materialize in a smooth manner and those who see China’s weakening growth shadowing heavily on the long awaited bright days of the dry bulk market, the truth can be most probably found somewhere in the middle. Maybe China’s economy will not grow at the esmated rate, and maybe last week’s glitch was actually a warning sign that shouldn’t be ignored, but at the same me, the fact is that rates are much healthier now than what they were a year ago, so instead of deciding whether the glass is half full or half empty, I am currently glad there is water in the glass. Chartering (Wet: Soſter- / Dry: Soſter- ) The Dry Bulk Market moved south last week, following the sudden col- lapse of the Capesize market on Wednesday, with the unexpected vola- lity taking most by surprise. The BDI closed today (18/03/2014) at 1,518 points, up by 37 points compared to yesterday’s levels (17/03/2014) and a decrease of 62 points compared to previous Tues- day’s closing (11/03/2014). March is definitely not “treang” the crude carriers nice, as acvity has moved to even lower levels this week and we don’t see any major improvements being noted unl the end of the month. The BDTI Monday (17/03/2014), was at 682 points, a decrease of 10 points and the BCTI at 622, a decrease of 7 points compared to the previous Monday (10/03/2014). Sale & Purchase (Wet: Stable+ / Dry: Stable+ ) The love for the tanker sector has re-appeared this week on the SnP front, with Genmar adding another vote of confidence for the VL seg- ment, where eight resales changed hands this week alone. On the tank- ers side, we had the sale of the “MARE ITALICUM” (110,295dwt-blt 07 Japan), which was picked by Greek buyers for a price of $ 34.0m. On the dry bulker side, we had the sale of the “CONCHES” (180,000dwt-blt 11 S. Korea), which was picked by Greek buyer Dryships for a price of $ 53.5m including a T/C. Newbuilding (Wet: Firm+ / Dry: Firm+ ) Following the prior week’s jump in reported newbuilding orders, the market has quietened down substanally in terms of acvity, with bulk- ers connuing to gather a big chunk of the ordering interest for yet an- other week. At the same me prices connue to firm for both dry bulk- ers and tankers, with those for the larger units, in both sectors, relave- ly showing more strength. We menoned last week how iron ore de- mand from China has been blessing the Capesize segment and has al- lowed for the freight market and the overall prospects of the sector to become rosier. With a lot of debate in regards to whether China can sustain its growth targets this year, following the extremely disap- poinng export figures that came out last week weighing down on sen- ment, it is very interesng to see whether this latest development will feed through to owners, who are contemplang on placing an order, and ulmately to newbuilding prices. In terms of new orders, S. Korean owner Polaris Shipping has placed an order for two VLOCs (275,000dwt) in Hyundai in S. Korea, for a reported price of $ 80.0m each. Demolion (Wet: Firm+ / Dry: Firm+ ) The same story describes the demolion market for yet another week. Numbers are going higher, acvity remains limited and the enre mar- ket is sll waing for a downward correcon to the recent rally which has yet to materialize. Prices have even surpassed 500$/ldt, which is what happened in one instance so far but sll shows the strength and the momentum of the current market. Despite the small correcon of the Rupee against the US Dollar this past week, the Indian currency is sll trading at very good levels, fact that reassures local cash buyers and allows them to increase their bids even higher. Even though the overall market acvity is sll slow, Bangladesh appears to have secured one unit and therefore a piece of the acon, while breakers in Pakistan have remained fairly quiet this week, holding their offers stable despite some good performance of the local currency. Further to the East, there was finally some acon in China, but local prices are sll stalling at the low 300 $/ldt with no big chance of offers increasing anyme soon. Average prices this week for wet tonnage were at around 330-475$/ldt and dry units received about 320-470$/ldt. Weekly Market Report Issue: Week 11| Tuesday 18 th March 2014
Transcript of Weekly Market Report -...

Market insight By Eva Tzima Research Analyst Right when you think that you have all your facts straight, right when things are stabilizing again for the Dry Bulk market, which was badly battered for the first couple of months of the year but didn’t collapse, a day like last Wednesday comes and makes you reconsider. For most of us who were caught up in the latest news regarding the developments in the Black Sea, the sudden drop of the BDI on Wednesday, caused exclusively by Cape rates plummeting, came as a big slap on the face. And as the market has since shown a cautious yet stable behavior, the drop of last mid-week has some-what remained away from the spotlight, with some being quick to explain it as just a glitch, which has come and gone fast, probably based on the price performance of iron ore and other commodities. But what exactly caused such a drop in rates?
For the past years, China, the world’s second largest economy, has been considered the pedestal upon which global shipping growth will find a stable footing. The outlook of the dry bulk trade itself, has been inextricably linked to the future of the country’s economy, and despite voices raising concerns every now and then regarding the sustainability of projected growth, formal figures provided by the Chinese government have been reassuring that the country would opt for growth at a slower gear in the coming years, yet a growth that would be more sustainable and at the same time sufficient to drag upwards with it a number of sectors left ailing post 2008.
On Monday last week, news released over the weekend that China’s Febru-ary exports unexpectedly dropped, sent shockwaves across the markets. This was in fact the biggest drop noted since the financial crisis and an even bigger blow on confidence regarding the country’s growth stability. The data revealed a 18.1% year-on-year decline, while an increase was originally ex-pected. As imports continued growing simultaneously, the country’s trade balance has in fact switched from a surplus in January to a deficit at the end of February, the biggest deficit recorded in the Chinese economy in two years.
The immediate effect, of what was the biggest fall on Chinese exports since August 2009, was the plummeting of the iron ore price for delivery to China, which touched a 17 month low. As the country imports around 2/3 of the global seaborne iron ore, the dry bulk market was destined to feel a big chunk of the pressure mounted. Confidence has dropped quickly especially after the paper market for Q2 2014 took a substantial hit. Talks that due to pressure on commodity prices the Chinese were looking to cancel a number of dry bulk COAs, quickly circulated the market, with rumors mentioning up to forty April onwards soybeans cargoes from ECSA. At the same time, the Capesize Tubarao/Qingdao and Western Australia/China routes noted a sharp fall almost immediately and the domino effect pushed the BDI down.
Currently the market is left a bit numb. The days following Wednesday saw the market noting small daily upticks across the board. It is very difficult at this stage to fully appreciate what the impact regarding Chinese growth will be. Between those who believe that the sharp fall was a correction that just didn’t materialize in a smooth manner and those who see China’s weakening growth shadowing heavily on the long awaited bright days of the dry bulk market, the truth can be most probably found somewhere in the middle. Maybe China’s economy will not grow at the estimated rate, and maybe last week’s glitch was actually a warning sign that shouldn’t be ignored, but at the same time, the fact is that rates are much healthier now than what they were a year ago, so instead of deciding whether the glass is half full or half empty, I am currently glad there is water in the glass.
Chartering (Wet: Softer- / Dry: Softer- )
The Dry Bulk Market moved south last week, following the sudden col-lapse of the Capesize market on Wednesday, with the unexpected vola-tility taking most by surprise. The BDI closed today (18/03/2014) at 1,518 points, up by 37 points compared to yesterday’s levels (17/03/2014) and a decrease of 62 points compared to previous Tues-day’s closing (11/03/2014). March is definitely not “treating” the crude carriers nice, as activity has moved to even lower levels this week and we don’t see any major improvements being noted until the end of the month. The BDTI Monday (17/03/2014), was at 682 points, a decrease of 10 points and the BCTI at 622, a decrease of 7 points compared to the previous Monday (10/03/2014).
Sale & Purchase (Wet: Stable+ / Dry: Stable+ )
The love for the tanker sector has re-appeared this week on the SnP front, with Genmar adding another vote of confidence for the VL seg-ment, where eight resales changed hands this week alone. On the tank-ers side, we had the sale of the “MARE ITALICUM” (110,295dwt-blt 07 Japan), which was picked by Greek buyers for a price of $ 34.0m. On the dry bulker side, we had the sale of the “CONCHES” (180,000dwt-blt 11 S. Korea), which was picked by Greek buyer Dryships for a price of $ 53.5m including a T/C.
Newbuilding (Wet: Firm+ / Dry: Firm+ )
Following the prior week’s jump in reported newbuilding orders, the market has quietened down substantially in terms of activity, with bulk-ers continuing to gather a big chunk of the ordering interest for yet an-other week. At the same time prices continue to firm for both dry bulk-ers and tankers, with those for the larger units, in both sectors, relative-ly showing more strength. We mentioned last week how iron ore de-mand from China has been blessing the Capesize segment and has al-lowed for the freight market and the overall prospects of the sector to become rosier. With a lot of debate in regards to whether China can sustain its growth targets this year, following the extremely disap-pointing export figures that came out last week weighing down on senti-ment, it is very interesting to see whether this latest development will feed through to owners, who are contemplating on placing an order, and ultimately to newbuilding prices. In terms of new orders, S. Korean owner Polaris Shipping has placed an order for two VLOCs (275,000dwt) in Hyundai in S. Korea, for a reported price of $ 80.0m each.
Demolition (Wet: Firm+ / Dry: Firm+ )
The same story describes the demolition market for yet another week. Numbers are going higher, activity remains limited and the entire mar-ket is still waiting for a downward correction to the recent rally which has yet to materialize. Prices have even surpassed 500$/ldt, which is what happened in one instance so far but still shows the strength and the momentum of the current market. Despite the small correction of the Rupee against the US Dollar this past week, the Indian currency is still trading at very good levels, fact that reassures local cash buyers and allows them to increase their bids even higher. Even though the overall market activity is still slow, Bangladesh appears to have secured one unit and therefore a piece of the action, while breakers in Pakistan have remained fairly quiet this week, holding their offers stable despite some good performance of the local currency. Further to the East, there was finally some action in China, but local prices are still stalling at the low 300 $/ldt with no big chance of offers increasing anytime soon. Average prices this week for wet tonnage were at around 330-475$/ldt and dry units received about 320-470$/ldt.
Weekly Market Report
Issue: Week 11| Tuesday 18th March 2014

© Intermodal Research 18/03/2014 2
Expanded and renewed with extra information for the new year, helping its readers always stay ahead of market trends
The Shipping Monthly Recap 2014
Monthly updates on the main SnP Markets
Published on the first week of every month
Everything you need to know about
the SnP market
The best way to stay well informed about the activity
that goes on every month and remain up to date with
the latest prices and freight rates for the main four
shipping sectors.
Bringing along our brokers’ information while filtering
out all the excess market noise, our research depart-
ment presents a unique monthly insight into our ex-
tensive database, with vital information that will allow
you to make better decisions in the market.
A complete fleet overview, along with detailed break-
down of changes in both the in service fleet and or-
derbook for the Dry Bulk, Tanker, Containership, and
Gas Carrier markets. Along with this we provide an in
depth look at the activity that has taken place in the
Sale and Purchase markets (Secondhand, Newbuilding
and Demolition), while giving information as to where
asset prices and freight levels currently hold as well as
an overview of their historical performance.
Actual sales compared to
index asset prices.
Main buyer and seller na-
tionalities over the past
month.
Size and price trends over
the past month for both the
Demolition and Newbuilding
markets.

© Intermodal Research 18/03/2014 3
Research & Valuations Department [email protected]
Analysts:
Mr. George Lazaridis +30 210 629 3320 [email protected]
Ms. Eva Tzima +30 210 629 3329 [email protected]
17th klm Ethniki Odos Athens-Lamia & 3 Agrambelis Str,
N.Kifissia 145 64
Athens - Greece
Website: www.intermodal.gr
Subscription form can be found on the last page
A monthly overview filled with key information
Annual subscription includes 12 monthly issues
Detailed sector updates
Straight and to the point data visualization
and analysis
As always, we focus in providing our readers with the infor-
mation they require in a condensed way that allows for easy
reading, while giving them the opportunity to get a realistic view
of where the market is and where it is likely to go next.
Our extensive tables, allow for a quick overview of the sectors as
a whole, while also offering a more detailed breakdown of the
different size segments.
With a special feature every month that provides a comprehen-
sive analysis of what’s “hot” in the market and with over 25 pag-
es of key market information and thoroughly researched materi-
al, the Intermodal monthly report is the perfect vantage point
for anyone who is involved in the shipping market and needs to
stay up to date with what is going on.
Fleet breakdown (Active &
on order).
Fleet development over the
past month.
Main shipbuilding nations
for each sector.
Current levels of asset prices
and freight rates as well as
market trends.

© Intermodal Research 18/03/2014 4
2014 2013
WS
points$/day
WS
points$/day $/day $/day
265k MEG-JAPAN 42 19,957 47.5 26,868 -25.7% 38,990 21,133
280k MEG-USG 29 14,499 30 16,225 -10.6% 25,879 7,132
260k WAF-USG 50 28,349 55 34,465 -17.7% 50,272 26,890
130k MED-MED 65 15,775 67.5 17,575 -10.2% 41,215 17,714
130k WAF-USAC 57.5 9,820 60 11,117 -11.7% 26,604 13,756
130k BSEA-MED 57.5 11,993 62.5 16,348 -26.6% 41,215 17,714
80k MEG-EAST 92.5 16,036 97.5 17,820 -10.0% 18,441 11,945
80k MED-MED 95 18,195 85 14,131 28.8% 36,011 13,622
80k UKC-UKC 87.5 3,724 85 671 454.9% 52,854 18,604
70k CARIBS-USG 97.5 11,426 102.5 13,002 -12.1% 37,754 16,381
75k MEG-JAPAN 87.5 12,028 82.5 10,469 14.9% 8,537 12,011
55k MEG-JAPAN 110 12,906 107.5 12,407 4.0% 9,833 12,117
37K UKC-USAC 142.5 13,529 135 11,815 14.5% 11,856 11,048
30K MED-MED 175 17,952 172.5 16,037 11.9% 24,479 17,645
55K UKC-USG 125 21,597 127 22,305 -3.2% 29,943 14,941
55K MED-USG 122.5 19,336 122 18,466 4.7% 29,176 12,642
50k CARIBS-USAC 112.5 13,570 135 21,845 -37.9% 40,693 15,083
Dir
tyA
fram
axC
lean
VLC
CSu
ezm
ax
Spot Rates
Vessel Routes
Week 11 Week 10$/day
±%
Mar-14 Feb-14 ±% 2014 2013 2012
300KT DH 71.5 69.1 3.4% 68.4 56.2 62.9
150KT DH 49.0 47.5 3.2% 46.7 40.1 44.9
110KT DH 37.5 35.8 4.9% 35.3 29.2 31.2
75KT DH 32.0 32.0 0.0% 32.0 28.0 26.7
52KT DH 29.0 29.6 -2.1% 29.9 24.7 24.6
VLCC
Suezmax
Indicative Market Values ($ Million) - Tankers
Vessel 5yrs old
MR
Aframax
LR1
Chartering
The anticipated market improvement has yet to materialize and as we are now well into the last decade of March it seems that the market will remain under pressure, as from the activity so far we can’t see any significant num-ber of fixtures during the final days of the month. VLs are usually the ones setting the tone in the crude carriers market and this past week was no different. Rates for both the eastbound and westbound voyage remained under pressure until the weekend, with a substantial number of offers weighing down on owners’ ideas, while fixtures ex-WAF were also tainted by the uninspiring MEG region.
Staying in the West Africa region, the Suezmax segment didn't have any better luck either. As activity fell substantially to the week before and with ballasters continuing to gather at the same time, there was only one direc-tion the market could go and down it went. With no positive spill-overs from VLs seen in the horizon, Suezmax rates in the region could soon ap-proach OPEX levels in the absence of other positive catalysts.
Rates for Aframaxes displayed a mixed picture overall this past week, alt-hough the one substantial increase noted for cross-UKC voyages could hardly be considered a success, as rates for the route have been pushed down to dismal levels. Cross-Med rates on the other hand managed to climb further up while the Caribs witnessed slight pressure.
Sale & Purchase
In the Aframax sector, we had the sale of the “MARE ITALI-CUM” (110,295dwt-blt 07 Japan), which was picked by Greek buyers for a price of $ 34.0m.
In the VLCC sector we had the sale of the “BW NYSA” (299,543dwt-blt 00, S. Korea), which was picked up for a price of $ 30.0m.
Wet Market
Indicative Period Charters
- 9 mos - 'JO PROVEL' 2013 75,013dwt
- - $ 16,000/day - Navig8
- 9 mos - 'JO ROWAN' 2013 73,811dwt
- - $ 16,000/day - Morgan Stanley
20
70
120
170
220
WS
po
ints
DIRTY - WS RATESTD3 TD5 TD8 TD4
Week 11 Week 10 ±% Diff 2014 2013
300k 1yr TC 27,250 27,250 0.0% 0 26,659 20,087
300k 3yr TC 27,750 27,750 0.0% 0 26,336 23,594
150k 1yr TC 20,250 20,250 0.0% 0 20,841 16,264
150k 3yr TC 22,250 22,250 0.0% 0 21,155 18,296
110k 1yr TC 15,750 15,750 0.0% 0 16,023 13,534
110k 3yr TC 17,250 17,250 0.0% 0 16,973 15,248
75k 1yr TC 15,500 15,500 0.0% 0 15,455 15,221
75k 3yr TC 16,250 16,250 0.0% 0 16,200 15,729
52k 1yr TC 15,250 15,250 0.0% 0 15,341 14,591
52k 3yr TC 16,250 16,250 0.0% 0 16,155 15,263
36k 1yr TC 14,750 14,750 0.0% 0 14,705 13,298
36k 3yr TC 15,500 15,500 0.0% 0 15,405 13,907
Panamax
MR
Handy
size
TC Rates
$/day
VLCC
Suezmax
Aframax
60
80
100
120
140
160
180
200
WS
po
ints
CLEAN - WS RATESTC2 TC4 TC6 TC1

© Intermodal Research 18/03/2014 5
0500
1,0001,5002,0002,5003,0003,5004,0004,500
Ind
ex
Baltic Indices
BCI BPI BSI BHSI BDI
0
5,000
10,000
15,000
20,000
25,000
30,000
35,000
40,000
45,000$
/da
y
Average T/C Rates
AVR 4TC BCI AVR 4TC BPI AVR 5TC BSI AVR 6TC BHSI
170K 6mnt TC 30,750 30,875 -0.4% -125 23,620 17,625
170K 1yr TC 31,500 31,500 0.0% 0 25,359 15,959
170K 3yr TC 24,750 24,750 0.0% 0 23,518 16,599
76K 6mnt TC 15,500 15,375 0.8% 125 16,564 12,224
76K 1yr TC 15,250 15,250 0.0% 0 14,973 10,300
76K 3yr TC 15,100 15,375 -1.8% -275 14,414 10,317
55K 6mnt TC 14,750 14,750 0.0% 0 14,155 11,565
55K 1yr TC 14,000 13,750 1.8% 250 12,973 10,234
55K 3yr TC 13,750 13,500 1.9% 250 12,700 10,482
45k 6mnt TC 12,750 12,750 0.0% 0 12,109 9,771
45k 1yr TC 11,750 11,750 0.0% 0 11,132 8,852
45k 3yr TC 11,500 11,250 2.2% 250 10,927 9,237
30K 6mnt TC 10,750 10,500 2.4% 250 10,314 8,244
30K 1yr TC 10,500 10,500 0.0% 0 10,027 8,309
30K 3yr TC 10,500 10,500 0.0% 0 10,109 8,926
Han
dym
axH
and
ysiz
e
Period
2013
Pan
amax
Sup
ram
ax
Week
11
Week
10
Cap
esi
ze
2014$/day ±% Diff
Chartering
The Dry Bulk market took a break from moving further north, halting the
latest upside trend of the past few weeks. The main reason behind the fall
of the market, which plummeted on Wednesday and tried to find its footing
through Thursday and Friday, was the massive drop noted by the Capesize
market midweek on the back of negative macro data from China and a sell
off in the paper market. Period activity was impeded by the volatility of last
mid-week, while this current week has kicked off more positively, although
the bitter taste of the correction noted is not yet fully gone.
The Capesize market, the main recipient of the bad news ex-China, has lost
its positive momentum victimized by the volatility that spread from the
paper to the physical market. Towards the end of the week charterers were
still pushing for lower numbers, but owners displayed resistance which will
lead to better numbers should infusion of new business takes place in the
following days.
Panamaxes have closed off the week noting a small increase, with the nega-
tive spill-overs from Capes weighing down on sentiment, thus preventing a
more significant upside. The Atlantic Panamax saw rates trending sideways
as the emergence of some fresh inquiry ex-ECSA has been quickly absorbed,
with the list of ballasters still growing, while the Pacific Panamax was most-
ly described as positional.
On the smaller size segments rates moved sideways overall, with Supra
gaining some ground in the ECSA region while Handies held on to their lev-
els in both basins, with the average rate approaching the $ 10,000/day.
Sale & Purchase
In the Capesize sector, we had the sale of the “CONCHES” (180,000dwt-blt
11 S. Korea), which was picked by Greek buyer Dryships for a price of $
53.5m including a T/C attached.
In the PostPanamax sector we had the sale of the “SHINCHI
MARU” (91,443dwt-blt 95, Japan), which was picked by Chinese buyers for
a price of US$ 9.5m.
Mar-14 Feb-14 ±% 2014 2013 2012
180k 48.5 46.9 3.5% 46.3 35.8 34.6
76K 27.0 27.0 0.0% 26.8 21.3 22.7
56k 27.0 27.0 0.0% 26.4 21.5 23.0
30K 21.0 21.0 0.0% 20.8 18.2 18.2
Capesize
Panamax
Supramax
Indicative Market Values ($ Million) - Bulk Carriers
Vessel 5 yrs old
Handysize
Indicative Period Charters
-11/13 mos - 'IMPERIAL' 2007 75,527dwt
- Lanshan 11/13 Mar - $ 13,500/day - Scorpio
-10/14 mos - 'LAKE DOLPHIN' 2011 179,418dwt
-Rotterdam 14/18 Mar - $ 35,000/day - Classic Maritime
Dry Market
Index $/day Index $/day Index Index
BDI 1,477 1,543 -66 1,341 1,205
BCI 2,677 $20,952 2,980 $24,243 -303 -13.6% 2,080 2,106
BPI 1,113 $8,956 1,075 $8,651 38 3.5% 1,351 1,186
BSI 1,183 $12,368 1,131 $11,831 52 4.5% 1,099 983
BHSI 671 $9,805 663 $9,654 8 1.6% 693 562
07/03/2014
Baltic IndicesWeek 11
14/03/2014Week 10
Point
Diff
2014 2013$/day
±%

© Intermodal Research 18/03/2014 6
Secondhand Sales
Size Name Dwt Built Yard M/E SS due Hull Price Buyers Comments
VLCC5 X DAEWOO
RESALES300,000
2015 -
2016
DAEWOO
SHIPBUILDING &, S.
Korea
MAN-B&W - DH
VLCC2 X HYUNDAI
SAMHO300,000 2016
HYUNDAI SAMHO
HEAVY IN, S. KoreaB&W - DH
VLCC BW NYSA 299,543 2000DAEWOO HEAVY
INDUSTRIE, S. KoreaMAN-B&W Jan-15 DH $ 30.0m undisclosed
SUEZ HUELVA SPIRIT 160,383 2001
DAEWOO
SHIPBUILDING &, S.
Korea
B&W Mar-16 DH $ 21.0m undisclosed
SUEZ ELISEWIN 149,991 2002NKK CORP - TSU,
JapanSulzer Jul -17 DH $ 23.7m US based
AFRA MARE ITALICUM 110,295 2007MITSUI CHIBA
ICHIHARA, JapanMAN-B&W Sep-17 DH $ 34.0m Greek
AFRA GUADALUPE 105,276 2012HYUNDAI HEAVY
INDS - U, S. KoreaMAN-B&W Apr-17 DH $ 47.5m
AFRA NECHES 105,276 2012HYUNDAI HEAVY
INDS - U, S. KoreaMAN-B&W Aug-17 DH $ 47.5m
PROD/
CHEMSC SHANTOU 19,508 1998
SHIN KURUSHIMA
AKITSU, JapanMitsubishi Oct-17 DH $ 16.5m StSt
PROD/
CHEMSC SHENZHEN 19,477 1999
SHIN KURUSHIMA
AKITSU, JapanMitsubishi Oct-14 DH $ 17.3m StSt
PROD/
CHEMSC ZHUHAI 19,455 1999
SHIN KURUSHIMA
AKITSU, JapanMitsubishi Oct-14 DH $ 17.3m StSt
PROD/
CHEMPARADISE BAY 10,628 1986
LINDENAU P. KIEL,
GermanyMaK Jul -16 DH $ 3.9m Russ ian epoxy
SMALL BOMAR CERES 5,517 2007CELIKTEKNE TUZLA,
TurkeyMAN-B&W Oct-17 DH $ 9.6m undisclosed -
SMALL GLOBAL TAURUS 5,130 2011YIZHENG YANGZI
SHIPBUI, ChinaMAN-B&W Dec-16 DH undisclosed Ita l ian StSt
SMALL BROVIG VIENTO 4,570 2004 GISAN, Turkey MAN-B&W Jan-15 DH $ 4.4m
Norwegian
(Seatank
Chartering)
marinel ine
SMALL BROVIG WIND 4,280 2005 SELAH, Turkey MaK Sep-15 DH undisclosedDanish
(Monjasa)epoxy
Tankers
U.S.A. based
(Genmar)
en-bloc $
735.0 m
Canadian
(Teekay)
undisclosed

© Intermodal Research 18/03/2014 7
Secondhand Sales
Name Dwt Built Yard M/E SS due Gear Price Buyers Comments
OS RIZE 9,389 1999 YARDIMCI, Turkey MAN Aug-142 X 36t
CRANES$ 2.6m undisclosed
MPP/General Cargo
Size Name Dwt Built Yard M/E SS due Gear Price Buyers Comments
CAPE CONCHES 180,000 2011
SUNGDONG
SHIPBUILDING, S.
Korea
MAN-B&W Jun-16 $ 53.5mGreek
(Dryships)T/C at $26k pd
CAPE4 X DAEHAN
RESALES180,000
2015-
2016DAEHAN, S. Korea MAN-B&W -
en-bloc EUR
242.0mItal ian (Scorpio)
CAPE SUNGDONG 1199 180,000 2015
SUNGDONG
SHIPBUILDING, S.
Korea
MAN-B&W - $ 61.0m Ital ian (Scorpio)
POST
PMAXSHINCHI MARU 91,443 1995
MITSUBISHI
NAGASAKI, JapanMitsubishi Jun-14 $ 9.5m Chinese
PMAX NEW AGILITY 76,623 2001
IMABARI
MARUGAME,
Japan
MAN-B&W Oct-16 $ 17.5m undisclosed
PMAX ASPENDOS 73,975 2003
HYUNDAI SAMHO
HEAVY IN, S.
Korea
B&W Nov-18 $ 21.7m Greek
HANDY GOLDEN HOPE 38,888 1986 IHI - AIOI, Japan Sulzer Apr-144 X 25t
CRANES$ 3.5m undisclosed
Bulk Carriers
Size Name Teu Built Yard M/E SS due Gear Price Buyers Comments
SUB
PMAXCAPE MONDEGO 2,742 2006
AKER MTW,
GermanyMAN-B&W Feb-16 undisclosed
US based
(Soundview
Maritime)
SUB
PMAXCONTI MALAGA 2,468 1997
DAEWOO HEAVY
INDUSTRIE, S.
Korea
Sulzer Dec-173 X 40t
CRANESundisclosed undisclosed
FEEDER HISPANIA 1,651 1998THYSSEN,
GermanyMitsubishi -
3 X 45t
CRANES$ 3.2m German
FEEDER IGA 1,613 1996SHIN KURUSHIMA
ONISHI, JapanMitsubishi Dec-16
3 X 40t
CRANES$ 4.0m Greek
Containers

© Intermodal Research 18/03/2014 8
Following the prior week’s jump in reported newbuilding orders, the market has quietened down substantially in terms of activity, with bulkers continu-ing to gather a big chunk of the ordering interest for yet another week. At the same time prices continue to firm for both dry bulkers and tankers, with those for the larger units, in both sectors, relatively showing more strength. We mentioned last week how iron ore demand from China has been blessing the Capesize segment and has allowed for the freight market and the overall prospects of the sector to become rosier. With a lot of debate in regards to whether China can sustain its growth targets this year, following the ex-tremely disappointing export figures that came out last week weighing down on sentiment, it is very interesting to see whether this latest development will feed through to owners, who are contemplating on placing an order, and ultimately to newbuilding prices. In terms of new orders, S. Korean owner Polaris Shipping has placed an order for two VLOCs (275,000dwt) in Hyundai in S. Korea, for a reported price of $ 80.0m each.
In terms of reported deals last week, S. Korean owner Polaris Shipping has placed an order for two VLOCs (275,000dwt) at Hyundai in S. Korea, for a reported price of $ 80.0m each.
Newbuilding Market
20
60
100
140
180
mil
lion
$
Tankers Newbuilding Prices (m$)
VLCC Suezmax Aframax LR1 MR
Week
11
Week
10±% 2014 2013 2012
Capesize 180k 56.5 56.0 0.9% 55.2 49 47
Kamsarmax 82k 30.5 30.5 0.0% 30.2 27 28
Panamax 77k 29.5 29.3 0.7% 28.8 26 27
Supramax 58k 27.5 27.5 0.0% 27 25 25
Handysize 35k 23.5 23.5 0.0% 23 21 22
VLCC 300k 99.0 98.5 0.5% 96.9 91 96
Suezmax 160k 65.0 64.5 0.8% 63 56 58
Aframax 115k 55.0 54.5 0.9% 54 48 50
LR1 75k 47.0 45.5 3.3% 44.9 41 42
MR 52k 37.3 37.3 0.0% 36.7 34 34
LNG 150K 186.0 186.0 0.0% 185.2 185 186
LGC LPG 80k 77.0 77.0 0.0% 76.0 71 71
MGC LPG 52k 66.0 66.0 0.0% 65.2 63 62
Vessel
Indicative Newbuilding Prices (million$)
Gas
Bu
lke
rsTa
nke
rs
10
30
50
70
90
110
mil
lion
$Bulk Carriers Newbuilding Prices (m$)
Capesize Panamax Supramax Handysize
Units Type Yard Delivery Buyer Price Comments
2 Bulker 275,000 dwt Hyundai, S. Korea 2017 S. Korean (Polaris Shipping) $ 80.0m
4 Bulker 208,000 dwt Jiangsu Eastern, China 2016 German (Oldendorff) $ 60.0m options
1 Bulker 95,000 dwt Jiangsu Eastern, China 09/2015 Greek (Blue Planet Shpg) undisclosed
2+2 Bulker 82,000 dwt Sinopacific, China 2016 Chinese (Shandong Bohai) undisclosed
12+8+10 Bulker 64,000 dwt China Shipping Group 2015-2017Chinese (Mingsheng
Financial Leasing)$ 28.0m
1 Container 18,000 teu Hyundai H.I., S.Korea 2015UAE based (United Arab
Shipping Co.)$ 140.0m
6 Container 2,500 teuZhoushan
Wuzhou, China2015
Chinese ( Zhonggu Xinliang
Shipping )undisclosed
2 Tanker 300,000 dwtHanjin Subic,
Philippines2016-2017
US based (Transportation
Recovery Fund)$ 95.0m
2 Tanker 40,000 dwt CSBC, Taiwan 9-12/2016Chinese Taipei (CPC Corp
Taiwan)$ 43.0m
5 Tanker 7,150 dwt Armada, Turkey 2015-2016 Turkish (Palmali Shipping) undisclosedchemical, Buyer has bought
50% stake in the yard
Newbuilding Orders Size

© Intermodal Research 18/03/2014 9
The same story describes the demolition market for yet another week. Num-bers are going higher, activity remains limited and the entire market is still waiting for a downward correction to the recent rally which has yet to mate-rialize. Prices have even surpassed 500$/ldt, which is what happened in one instance so far but still shows the strength and the momentum of the current market. Despite the small correction of the Rupee against the US Dollar this past week, the Indian currency is still trading at very good levels, fact that reassures local cash buyers and allows them to increase their bids even high-er. Even though the overall market activity is still slow, Bangladesh appears to have secured one unit and therefore a piece of the action, while breakers in Pakistan have remained fairly quiet this week, holding their offers stable despite some good performance of the local currency. Further to the East, there was finally some action in China, but local prices are still stalling at the low 300 $/ldt with no big chance of offers increasing anytime soon. Average prices this week for wet tonnage were at around 330-475$/ldt and dry units received about 320-470$/ldt.
The highest price amongst recently reported deals, was that paid by Indian breakers for the Container vessel ‘ASIA STAR’ (20,194dwt-7,076ldt-blt 94), which received a very high price of $ 504/ldt.
Demolition Market
Week
11
Week
10±% 2013 2012 2011
Bangladesh 460 450 2.2% 422 440 523
India 475 470 1.1% 426 445 511
Pakistan 455 455 0.0% 423 444 504
China 330 330 0.0% 365 384 451
Bangladesh 450 445 1.1% 402 414 498
India 470 465 1.1% 405 419 484
Pakistan 435 435 0.0% 401 416 477
China 320 320 0.0% 350 365 432
Dry
Indicative Demolition Prices ($/ldt)
Markets
We
t
250
300
350
400
450
500
550
$/l
dt
Wet Demolition Prices
Bangladesh India Pakistan China
250
300
350
400
450
500
550
$/l
dt
Dry Demolition Prices
Bangladesh India Pakistan China
Name Size Ldt Built Yard Type $/ldt Breakers Comments
OVERSEAS BERYL 94,797 17,096 1994HYUNDAI HEAVY
INDS - U, S. KoreaTANKER $ 453/Ldt undisclosed
as-is Singapore including bunkers
for final trip
FULL STRONG 70,171 9,323 1994SANOYAS HISHINO
MIZ'MA, JapanBULKER $ 302/Ldt Chinese
ACHILLEAS 35,458 8,593 1985KOREA SHBLDG &
ENG - B, S. KoreaBULKER $ 310/Ldt Turkish auction in Cyprus
ORANGE BREEZE 23,242 8,126 1984MATHIAS-THESEN,
GermanyGC $ 483/Ldt Indian
INCA MAIDEN 22,133 7,786 1986
MITSUBISHI
SHIMONOSEKI,
Japan
GC $ 472/Ldt Bangladeshi
ASIA STAR 20,194 7,076 1994 THYSSEN, Germany CONT $ 504/Ldt Indian
LAGAS RAINBOW 1,160 1,320 1980 KEGOYA, Japan BULKER $ 320/Ldt Chinese
Demolition Sales
The information contained in this report has been obtained from various sources, as reported in the market. Intermodal Shipbrokers Co. believes such information to be factual and reliable without mak-ing guarantees regarding its accuracy or completeness. Whilst every care has been taken in the production of the above review, no liability can be accepted for any loss or damage incurred in any way whatsoever by any person who may seek to rely on the information and views contained in this material. This report is being produced for the internal use of the intended recipients only and no re-producing is allowed, without the prior written authorization of Intermodal Shipbrokers Co.
Compiled by Intermodal Research & Valuations Department | [email protected]
Analysts: Mr. George Lazaridis | [email protected]
Ms. Eva Tzima | [email protected]
Finance News
“Tsakos hits the mark
Tsakos Energy Navigation has recorded a stronger fourth quarter result in line with Wall Street fore-casts. New York-listed Tsakos booked an adjusted loss of $5.3m in the three months to the close of 2013, an improvement on the $9.0m red number of a year earlier. Its loss per share of $0.09 was exactly as ana-lysts tracking the company had expected.
Nikolas P. Tsakos, chief executive of TEN, said in a statement: "TEN has once more demonstrated its ability to navigate through the rough shipping cycles and arrive at the other end stronger and bigger.
“Our successful chartering strategy together with our large operational capacity, places us on the top of companies with the ability to take advantage of mar-ket improvements.”
Tsakos says the introduction of two new suezmaxes and an LNG carrier during the year continued to boost its top line, with revenue up 4.5% to $70.6m in the final quarter.
“The crude charter market improved significantly, albeit too late to have a major impact on the fourth quarter 2013,” the owner said. “It benefitted TEN's spot and profit-share time-chartered suezmaxes, but aframaxes were not to reap the real benefits until the start of 2014.”
TEN, which today revealed it has added four addition-al aframax newbuildings at DSME against contracts with Statoil, booked an adjusted loss of $7.2m in 2013.
This marked an improvement on the $33.8m deficit seen in 2012 ”. (Trade Winds)
Commodities & Ship Finance
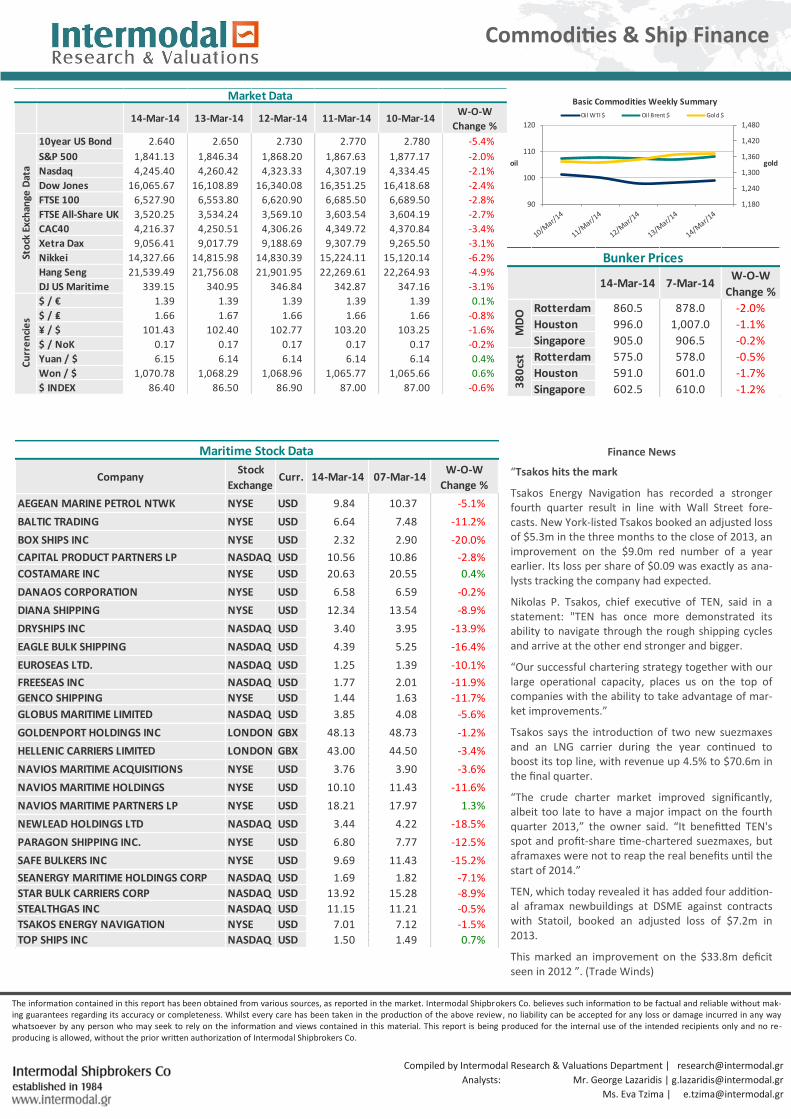
14-Mar-14 13-Mar-14 12-Mar-14 11-Mar-14 10-Mar-14W-O-W
Change %
10year US Bond 2.640 2.650 2.730 2.770 2.780 -5.4%
S&P 500 1,841.13 1,846.34 1,868.20 1,867.63 1,877.17 -2.0%
Nasdaq 4,245.40 4,260.42 4,323.33 4,307.19 4,334.45 -2.1%
Dow Jones 16,065.67 16,108.89 16,340.08 16,351.25 16,418.68 -2.4%
FTSE 100 6,527.90 6,553.80 6,620.90 6,685.50 6,689.50 -2.8%
FTSE All-Share UK 3,520.25 3,534.24 3,569.10 3,603.54 3,604.19 -2.7%
CAC40 4,216.37 4,250.51 4,306.26 4,349.72 4,370.84 -3.4%
Xetra Dax 9,056.41 9,017.79 9,188.69 9,307.79 9,265.50 -3.1%
Nikkei 14,327.66 14,815.98 14,830.39 15,224.11 15,120.14 -6.2%
Hang Seng 21,539.49 21,756.08 21,901.95 22,269.61 22,264.93 -4.9%
DJ US Maritime 339.15 340.95 346.84 342.87 347.16 -3.1%
$ / € 1.39 1.39 1.39 1.39 1.39 0.1%
$ / ₤ 1.66 1.67 1.66 1.66 1.66 -0.8%
¥ / $ 101.43 102.40 102.77 103.20 103.25 -1.6%
$ / NoK 0.17 0.17 0.17 0.17 0.17 -0.2%
Yuan / $ 6.15 6.14 6.14 6.14 6.14 0.4%
Won / $ 1,070.78 1,068.29 1,068.96 1,065.77 1,065.66 0.6%
$ INDEX 86.40 86.50 86.90 87.00 87.00 -0.6%
Market Data
Cu
rre
nci
es
Sto
ck E
xch
ange
Dat
a
1,180
1,240
1,300
1,360
1,420
1,480
90
100
110
120
goldoil
Basic Commodities Weekly Summary
Oil WTI $ Oil Brent $ Gold $
14-Mar-14 7-Mar-14W-O-W
Change %
Rotterdam 860.5 878.0 -2.0%
Houston 996.0 1,007.0 -1.1%
Singapore 905.0 906.5 -0.2%
Rotterdam 575.0 578.0 -0.5%
Houston 591.0 601.0 -1.7%
Singapore 602.5 610.0 -1.2%
Bunker Prices
MD
O3
80
cst
CompanyStock
ExchangeCurr. 14-Mar-14 07-Mar-14
W-O-W
Change %
AEGEAN MARINE PETROL NTWK NYSE USD 9.84 10.37 -5.1%
BALTIC TRADING NYSE USD 6.64 7.48 -11.2%
BOX SHIPS INC NYSE USD 2.32 2.90 -20.0%
CAPITAL PRODUCT PARTNERS LP NASDAQ USD 10.56 10.86 -2.8%
COSTAMARE INC NYSE USD 20.63 20.55 0.4%
DANAOS CORPORATION NYSE USD 6.58 6.59 -0.2%
DIANA SHIPPING NYSE USD 12.34 13.54 -8.9%
DRYSHIPS INC NASDAQ USD 3.40 3.95 -13.9%
EAGLE BULK SHIPPING NASDAQ USD 4.39 5.25 -16.4%
EUROSEAS LTD. NASDAQ USD 1.25 1.39 -10.1%
FREESEAS INC NASDAQ USD 1.77 2.01 -11.9%
GENCO SHIPPING NYSE USD 1.44 1.63 -11.7%
GLOBUS MARITIME LIMITED NASDAQ USD 3.85 4.08 -5.6%
GOLDENPORT HOLDINGS INC LONDON GBX 48.13 48.73 -1.2%
HELLENIC CARRIERS LIMITED LONDON GBX 43.00 44.50 -3.4%
NAVIOS MARITIME ACQUISITIONS NYSE USD 3.76 3.90 -3.6%
NAVIOS MARITIME HOLDINGS NYSE USD 10.10 11.43 -11.6%
NAVIOS MARITIME PARTNERS LP NYSE USD 18.21 17.97 1.3%
NEWLEAD HOLDINGS LTD NASDAQ USD 3.44 4.22 -18.5%
PARAGON SHIPPING INC. NYSE USD 6.80 7.77 -12.5%
SAFE BULKERS INC NYSE USD 9.69 11.43 -15.2%
SEANERGY MARITIME HOLDINGS CORP NASDAQ USD 1.69 1.82 -7.1%
STAR BULK CARRIERS CORP NASDAQ USD 13.92 15.28 -8.9%
STEALTHGAS INC NASDAQ USD 11.15 11.21 -0.5%
TSAKOS ENERGY NAVIGATION NYSE USD 7.01 7.12 -1.5%
TOP SHIPS INC NASDAQ USD 1.50 1.49 0.7%
Maritime Stock Data

© Intermodal Shipbrokers Co
11
18/03/2014
Subscription Form
Select Price in US$
Weekly Publications
Weekly Market Report Annual Subscription □ Free
Monthly Publications
Shipping Monthly Recap - free summary Annual Subscription - 12 issues □ Free version
Shipping Monthly Recap - full report Annual Subscription - 12 issues □ $ 1,000
Your Contact Details
Full Name: Title:
Company: Position:
Address:
Country: Post code:
E-mail: Telephone:
Company Website: Fax:
Name and address to appear on invoice (if different from above):
□ I will be paying by bank transfer (please contact us for our bank details)
You can contact us directly by phone or by e-mailing, faxing or posting the
below form completed with all your details:
Tel: +30 210 6293 300
Fax:+30 210 6293 333-4
Email: [email protected]
Intermodal Shipbrokers Co.
17th km Ethniki Odos Athens-Lamia & 3 Agrambelis street,
145 64 N.Kifisia,
Athens - Greece
Sector Reports
The LNG Market 2013 - An overview analysis on the state of
the LNG market in 2013 Annual publication - 1 issue □ $ 500
Please note that orders will only be dispatched once full receipt of payment has been confirmed.