WEEKLY SHIPPING MARKET REPORT -...
18
WEEKLY SHIPPING MARKET REPORT WEEK 37 - 10 th September – to 17 th September 2013 Legal Disclamer The information contained herein has been obtained by various sources. Although every effort has been made to ensure that this information is accurate, complete and up to date, Shiptrade Services S.A. does not accept any responsibility whatsoever for any loss or damage occasioned or claimed, upon reliance on the information, opinions and analysis contained in this report. Researched and compiled by: Shiptrade Services SA, Market Research on behalf of the Sale & Purchase, Dry Cargo Chartering and Tanker Chartering Departments. For any questions please contact: [email protected] Shiptrade Services SA Tel +30 210 4181814 [email protected] 1st Floor, 110/112 Notara Street Fax +30 210 4181142 [email protected] 185 35 Piraeus, Greece www.shiptrade.gr [email protected]
Transcript of WEEKLY SHIPPING MARKET REPORT -...
WEEKLY SHIPPING
MARKET REPORT WEEK 37
- 10th September – to 17th September 2013
Legal Disclamer
The information contained herein has been obtained by various sources. Although every effort has been made to ensure that this information is accurate, complete and up to date, Shiptrade Services S.A. does not accept any responsibility whatsoever for any loss or damage occasioned or claimed, upon reliance on the information, opinions and analysis contained in this report.
Researched and compiled by: Shiptrade Services SA, Market Research on behalf of the Sale & Purchase, Dry Cargo Chartering and Tanker Chartering Departments. For any questions please contact: [email protected]
Shiptrade Services SA Tel +30 210 4181814 [email protected] 1st Floor, 110/112 Notara Street Fax +30 210 4181142 [email protected] 185 35 Piraeus, Greece www.shiptrade.gr [email protected]
1
Weekly product tanker capacity growth rises, crude tanker falls
Capacity, in a commoditized industry like shipping, is an important metric that directly impacts companies' top line or revenue performance. When capacity grows faster than demand, competition will rise among individual shipping firms as they try to use idle ships and cover fixed costs. This will lower day rates, which will negatively affect bottom-line earnings, free cash flows, and share prices for tanker companies. Companies are scrapping crude tankers amid a depressing market Between August 23 and 30, tanker capacity measured in deadweight tonnage (the weight a ship can safely carry across the ocean), fell by another 0.04% for crude tankers. Product tankers, on the other hand, rose 0.05% % using the last eight weeks to smooth out the data. The recent decline in growth rates appears to reflect lower shipping rates. When shipping rates are at depressing levels and shipping companies can't profit by running the new or existing ships, companies will delay receiving new ships or scrap ships to reduce capacity and support rates. This could act as a short-term support for shipping rates. But this is another indicator that points to the depressed crude tanker market, given that ship orders had slumped over the same period. Annual capacity growth falling While annual capacity growth still remains above 3.5% for crude tankers and even higher for product tankers, it has come down since April, which is a positive sign. Analysts consider year-over-year growth because it adjusts for possible seasonality and short-term noise, and demand figures are often quoted on a year-over-year basis for the same reasons. So this makes comparing supply and demand balance easier Interpretation of higher growth The decline in weekly capacity is a positive sign that incumbent firms are resorting to scrapping and slippage to alleviate issues with excess capacity and support shipping rates for crude tankers. If shipping rates rise further from here, however, as they often do because of seasonal increases in demand for heating oil for the winter, capacity growth will likely rise. For product tankers, the weakness we've seen over the past few weeks appears to be due to a short-term pause in deliveries. This will likely pick up throughout the remainder of this year, as several companies such as Navios Maritime Acquisition Corp. (NNA) and Scorpio Tankers Ltd. (STNG) have been placing large number of orders since last year. Depending on whether demand is expected to meet supply, current capacity growth could be negative or positive for tanker firms such as Frontline Ltd. (FRO), Nordic American Tanker Ltd. (NAT), Navios Maritime Acquisition Corp. (NNA), and Scorpio Tankers Ltd. (STNG). (Market Realist)
The dynamics of the global oil trade and demand for crude tankers
There are two key driving forces of oil shipment demand today, which has been a trend for the past five years: a decrease in oil shipments to the United States and growth in China. In 2010, the largest importers of oil in the world were the United States, China, Japan, and India. The United States imported 9.2 million barrels a day (21% of the total), while China, the second largest importer, imported 4.7 million (11% of the total), according to data from the U.S. Energy Information Administration (EIA). The United States leaves while China picks up The United States has historically been the largest importer of oil. But since horizontal drilling and hydraulic fracturing technologies have made it possible for energy companies to extract oil from areas where oil extraction was initially considered impossible and uneconomical, domestic production started to take off after successful trials, beginning the United States' journey to becoming an energy-independent country. As OPEC (the Organization of Petroleum Exporting Countries—which are primarily situated in Africa and the Middle East) and oil shipment companies continued to lose business from the West, they found a savior in the East: China. Driven by rapid growth, spurred by government stimulus in 2009 and a population that strives to work and earn more to have higher living standards,
demand for oil has grown rapidly in double digits. Imports, as a result, grew ~10% from 2008 to 2012. China's growth isn't enough While China stepped up its oil import, it wasn't enough to fill falling U.S. imports. With the exception of 2010, when the United States imported more oil as its economy recovered, the remaining three years have consistently led to lower imports than China can soak up. The EIA estimates that the country will become the largest producer of crude oil within the next few years, knocking countries such as Russia and Saudi Arabia off the top chart. China's golden age of investment-led economic growth is now history, and as the country opens up to more consumption, how may oil consumption be affected? With tanker stocks falling more than 80% from 2008, and China now a larger player in the world's oil shipment market, will the downtrend reverse or continue? The following indicators will help us understand the demand prospects of companies such as Frontline Ltd. (FRO), Teekay Tankers Ltd. (TNK), Nordic American Tanker Ltd. (NAT), and, to an extent, Tsakos Energy Navigation Ltd. (TNP) and the Guggenheim Shipping ETF (SEA) over the next few months.( Market Realist)
Rising dollar creates fuel cost worries for shipping companies
The falling rupee may bring more export business for the shipping lines, with Indian goods getting a competitive edge in the international market. Shipping companies which are already reeling under subdued freight rates and oversupply of vessels are worried over rising fuel costs as the dollar becomes more expensive. Shipping Corporation of India, for the first time has decided in its board meeting to go for partial bunker hedging. “We will start with a small percentage and then increase the amount we will hedge gradually,” said Sunil Thapar, director- bunker and tanker division, Shipping Corporation of India. While most companies feel that they are hedged against the currency crisis since the sector deals in dollars only. However, because the outgo is also in dollars, the rupee depreciation has not meant huge benefits. The currency depreciation has created woes for coastal shipping, since most of the revenue is incurred in rupees, while the costs are in dollars. “The returns in coastal shipping are suffering. The overall coast of logistics is going up since the port charges are in dollars,” said Anil Devli, president, Indian National Shipowners Association. For coastal shipping, there is an added challenge as far as bunker goes. The increase in price of high speed diesel has made it less competitive to the road transportation which has subsidized diesel. “This has also discouraged new entrants from venturing into coastal shipping. It is not a flourishing business,” a senior port sector analyst said. Last week, rupee plunged to a low of 66 per dollar mark. The rupee has lost more than 16% against the dollar so far in 2013 - making it the worst performer by far among Asian emerging market currencies, according to Reuters.(BusinessStandard)
Suez Canal Project to Attract Foreign Investments
Chairman of the Suez Canal Authority Mohab Memish said that the project of “Suez Canal Axis” will be developed in a way that allows accelerating the growth rate in the region as well as attracting Arab and foreign investments to take part in the implementation of the project. He said that the name of Suez Canal project will be changed to the “Two Poles” referring to Ain Sokhna Port, where the first phase of the project kicks off, and Port Said harbor, where the project ends. Memish added that the next period will witness a major role for the Suez Canal Authority after drafting the required legislations on this score, noting that a legislative amendment is underway to give the Authority a full supervision over the project. (Suez Canal Authority)
Shipping , Commodities & Financial News
2
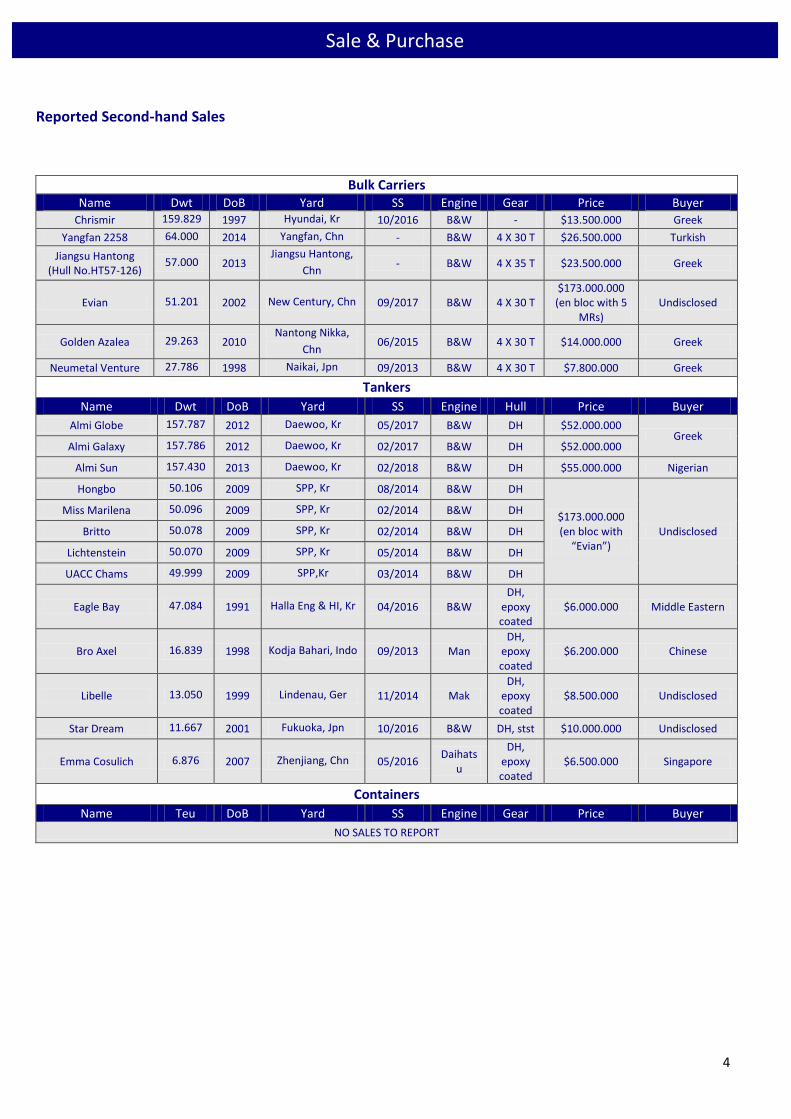
Rally in Capes creates a firmer S&P market
Greek players seem to keep scanning the market for Capesize bulkers with the most interesting reported sale to be the 1997
Hyundai built unit “Chrismir” at $13.5 mill. On the other hand, silence is noted for this week in the Panamax sector with no
reported sales and very few candidates. Furthermore, well noted are the resales of a 2013 Jiangsu Hantong built Supramax
unit to Turkish buyers at $23.5 mill and a 2014 Yangfan built Ultramax unit to Greek buyers at $26.5 mill. Meantime, activity
in the handy sector is still firm with the 2010 Nantong Nikka built “Golden Azalea” sold at $14 mill and the Japanese owned
1997 Naikai built “Neumetal Venture” committed at $7.8 mill, both to different Greek buyers.
In the wet sector, well noted are the sales of 3 x modern Daewoo built Sister Aframax tankers, 2 of which built in 2012 were
reported being sold to Greek Buyers at $52 mill each and 1 of which built in 2013 was reported being sold to Nigerian Buyers
at $55 mill. Following last week’s firm activity in the MR sector, 6 MR tankers have changed hands this week, with 5 x 2009
SPP built units been snapped up by the same buyers in a very interesting en-bloc deal of $173 mill (deal included a supramax
bc 2001 New Century built), while a vintage unit 1991 Halla Eng & HI built was committed to Middle Eastern buyers at $6.1
mill. Last but not least, the Japanese built & owned St.St. tanker “Star Dream” was reported being committed at $10 mill.,
two modern Aframaxes were sold to Greek and Singapore based buyers, with Greek interests snapping up both the 2006
built MR Tanker “Twinkle Express” for $20 mill., as well as the 1990 built MR Tanker “Champion Pioneer” for $5.4 mill.
Shiptrade’s enquiry index last week has suffered a small decline of about 11%. In the dry sector, enquiries for handysize
bulkers remained at same levels as previous week, Handymaxes and Supramaxes are always attracting serious interest.
Interest for Panamaxes showed a slight increase of about 16%. On the other hand the capsize enquiries were reduced by
more than 50%. Buying interest for tankers has stabilized after a series of increase during the last weeks. MRs have lost just a
bit of the interest about 12% less than previous week, in the Panamax sector, interest continues to be on the low side.
Enquiries for aframaxes remained stable with the interest not being very firm. After the wide decrease of about 50%
Suezmax remained at the same levels again this week. VLCCs have no change at all, with interest remaining extremely weak.
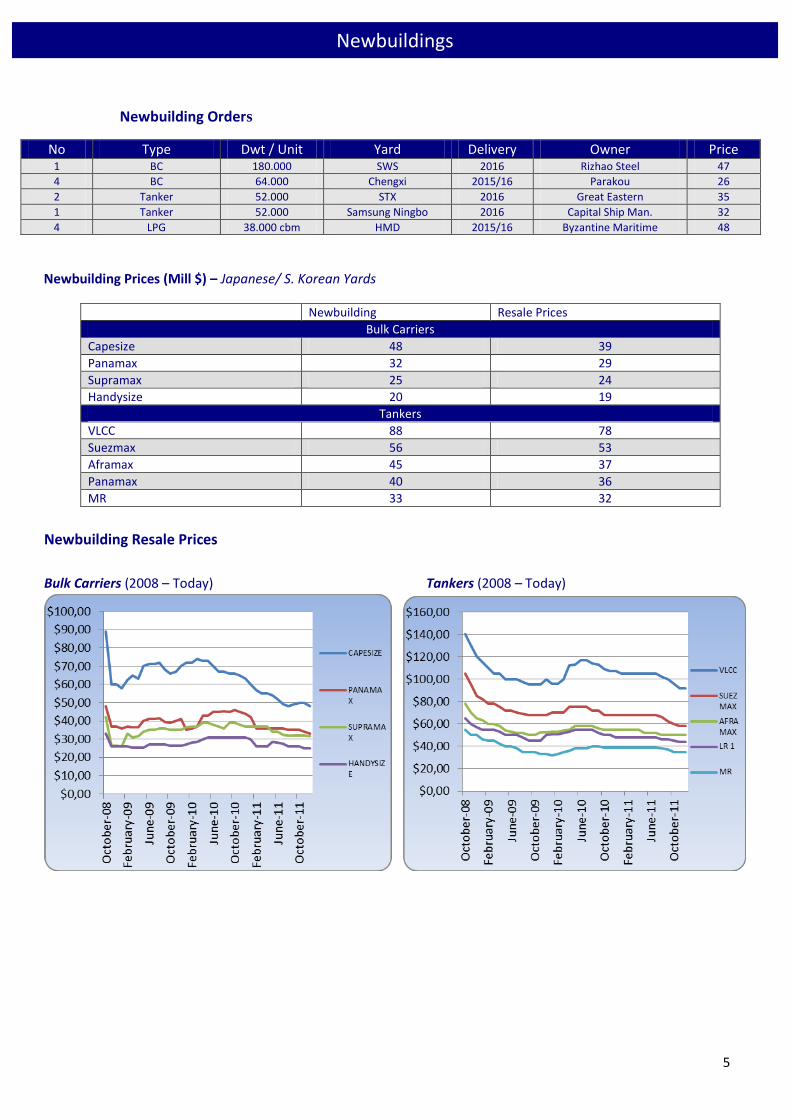
NEWBUILDINGS
In the newbuilding market we have seen 12 vessels to have been contracted.
5 Bulk Carriers (Capesize, Ultramax)
3 Tankers (MR)
4 LPG
DEMOLITION
Slight signs of relief this week in the demolition market and the sub-continent in particular, with the Indian rupee appreciated by almost 3% in the last week alone, finishing the week at the healthy 63.5 to the USD, with credit to be given to the appointment of a new RBI governor. Gains on the currency brought India back to the position of the leading market in the sub-continent, bringing again confidence amongst local buyers. Two container vessels were sold at very firm prices, however we understand that they remain unsold locally, indicating that cash buyers may be gambling on a market upturn in the coming weeks. In Bangladesh, despite the fact that local currency remained stable, the downward trend in local steel prices are a source of uncertainty and the result is the Bangladeshi market not being competitive at the moment. Demand for tonnage in Pakistan is there and in order for the local market to take its’ share of market tonnage, prices have to improve. China is the market at the moment, with impressive levels being offered and a considerable amount of tonnage ending up in local yards. With demand for tonnage there, as well as stability at competitive levels, there you have it! It seems like China is the destination for owners of vintage units trading in that area.
Sale & Purchase
3
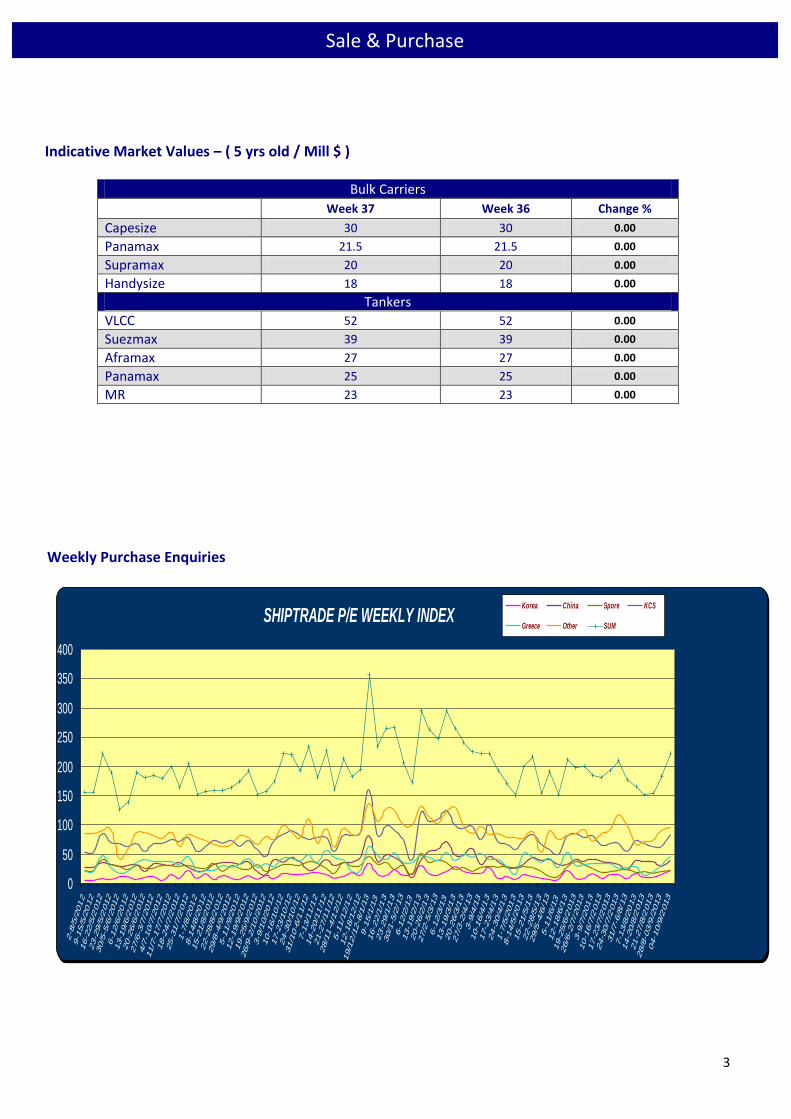
Indicative Market Values – ( 5 yrs old / Mill $ )
Bulk Carriers
Week 37 Week 36 Change %
Capesize 30 30 0.00
Panamax 21.5 21.5 0.00
Supramax 20 20 0.00
Handysize 18 18 0.00
Tankers
VLCC 52 52 0.00
Suezmax 39 39 0.00
Aframax 27 27 0.00
Panamax 25 25 0.00
MR 23 23 0.00
Weekly Purchase Enquiries
SHIPTRADE P/E WEEKLY INDEX
0
50
100
150
200
250
300
350
400
2-8
/5/2
01
29-1
5/5
/20
12
16-2
2/5
/2012
23-2
9/5
/2012
30/5
-5/6
/2012
6-1
2/6
/20
12
13-1
9/6
/2012
20-2
6/6
/2012
27/6
-3/7
/2012
4/7
-10/7
/2012
11/7
-17/7
/2012
18-2
4/7
/2012
25-3
1/7
/2012
1-7
/8/2
01
28-1
4/8
/20
12
15-2
1/8
/2012
22-2
8/8
/2012
29/8
-4/9
/2012
5-1
1/9
/20
12
12-1
9/9
/2012
19-2
5/9
/2012
26/9
-2/1
0/2
012
3-9
/10/2
012
10-1
6/1
0/1
217-2
3/1
0/1
224-3
0/1
0/1
2
31/1
0-6
/11/1
27-1
3/1
1/1
214-2
0/1
1/1
221-2
7/1
1/1
2
28/1
1-4
/12/1
25-1
1/1
2/1
212-1
8/1
2/1
2
19/1
2/1
2-8
/1/1
39-1
5/1
/13
16-2
2/1
/13
23-2
9/1
/13
30/1
-5/2
/13
6-1
2/2
/13
13-1
9/2
/13
20-2
6/2
/13
27/2
-5/3
/13
6-1
2/3
/13
13-1
9/3
/13
20-2
6/3
/13
27/3
-2/4
/13
3-9
/4/1
310-1
6/4
/13
17-2
3/4
/13
24-3
0/4
/13
1-7
/5/2
01
38-1
4/5
/20
13
15-2
1/5
/13
22-2
8/5
/13
29/5
-4/6
/13
5-1
1/6
/13
12-1
8/6
/13
19-2
5/6
/2013
26/6
-2/7
/2013
3-9
/7/2
01
310-1
6/7
/2013
17-2
3/7
/2013
24-3
0/7
/2013
31/7
-6/8
/13
7-1
3/8
/20
13
14-2
0/8
/2013
21-2
7/8
/2013
28/8
-03/9
/2013
04-1
0/9
/2013
Korea China Spore KCS
Greece Other SUM
Sale & Purchase
4
Reported Second-hand Sales
Bulk Carriers Name Dwt DoB Yard SS Engine Gear Price Buyer
Chrismir 159.829 1997 Hyundai, Kr 10/2016 B&W - $13.500.000 Greek
Yangfan 2258 64.000 2014 Yangfan, Chn - B&W 4 X 30 T $26.500.000 Turkish
Jiangsu Hantong (Hull No.HT57-126)
57.000 2013 Jiangsu Hantong,
Chn - B&W 4 X 35 T $23.500.000 Greek
Evian 51.201 2002 New Century, Chn 09/2017 B&W 4 X 30 T $173.000.000 (en bloc with 5
MRs) Undisclosed
Golden Azalea 29.263 2010 Nantong Nikka,
Chn 06/2015 B&W 4 X 30 T $14.000.000 Greek
Neumetal Venture 27.786 1998 Naikai, Jpn 09/2013 B&W 4 X 30 T $7.800.000 Greek
Tankers
Name Dwt DoB Yard SS Engine Hull Price Buyer
Almi Globe 157.787 2012 Daewoo, Kr 05/2017 B&W DH $52.000.000 Greek
Almi Galaxy 157.786 2012 Daewoo, Kr 02/2017 B&W DH $52.000.000
Almi Sun 157.430 2013 Daewoo, Kr 02/2018 B&W DH $55.000.000 Nigerian
Hongbo 50.106 2009 SPP, Kr 08/2014 B&W DH
$173.000.000 (en bloc with
“Evian”) Undisclosed
Miss Marilena 50.096 2009 SPP, Kr 02/2014 B&W DH
Britto 50.078 2009 SPP, Kr 02/2014 B&W DH
Lichtenstein 50.070 2009 SPP, Kr 05/2014 B&W DH
UACC Chams 49.999 2009 SPP,Kr 03/2014 B&W DH
Eagle Bay 47.084 1991 Halla Eng & HI, Kr 04/2016 B&W DH,
epoxy coated
$6.000.000 Middle Eastern
Bro Axel 16.839 1998 Kodja Bahari, Indo 09/2013 Man DH,
epoxy coated
$6.200.000 Chinese
Libelle 13.050 1999 Lindenau, Ger 11/2014 Mak DH,
epoxy coated
$8.500.000 Undisclosed
Star Dream 11.667 2001 Fukuoka, Jpn 10/2016 B&W DH, stst $10.000.000 Undisclosed
Emma Cosulich 6.876 2007 Zhenjiang, Chn 05/2016 Daihats
u
DH, epoxy coated
$6.500.000 Singapore
Containers
Name Teu DoB Yard SS Engine Gear Price Buyer
NO SALES TO REPORT
Sale & Purchase
5
Newbuilding Orders
No Type Dwt / Unit Yard Delivery Owner Price 1 BC 180.000 SWS 2016 Rizhao Steel 47
4 BC 64.000 Chengxi 2015/16 Parakou 26
2 Tanker 52.000 STX 2016 Great Eastern 35
1 Tanker 52.000 Samsung Ningbo 2016 Capital Ship Man. 32
4 LPG 38.000 cbm HMD 2015/16 Byzantine Maritime 48
Newbuilding Prices (Mill $) – Japanese/ S. Korean Yards
Newbuilding Resale Prices
Bulk Carriers
Capesize 48 39
Panamax 32 29
Supramax 25 24
Handysize 20 19
Tankers
VLCC 88 78
Suezmax 56 53
Aframax 45 37
Panamax 40 36
MR 33 32
Newbuilding Resale Prices
Bulk Carriers (2008 – Today) Tankers (2008 – Today)
Newbuildings
6
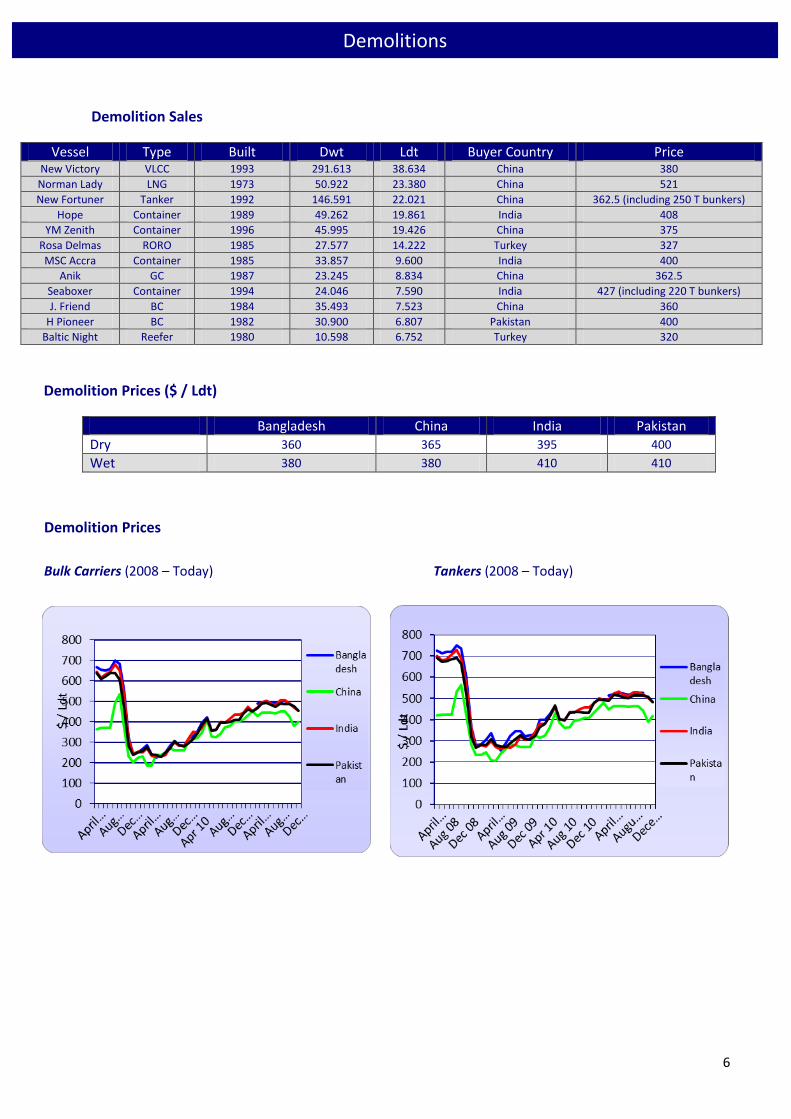
Demolition Sales
Vessel Type Built Dwt Ldt Buyer Country Price New Victory VLCC 1993 291.613 38.634 China 380
Norman Lady LNG 1973 50.922 23.380 China 521
New Fortuner Tanker 1992 146.591 22.021 China 362.5 (including 250 T bunkers)
Hope Container 1989 49.262 19.861 India 408
YM Zenith Container 1996 45.995 19.426 China 375
Rosa Delmas RORO 1985 27.577 14.222 Turkey 327
MSC Accra Container 1985 33.857 9.600 India 400
Anik GC 1987 23.245 8.834 China 362.5
Seaboxer Container 1994 24.046 7.590 India 427 (including 220 T bunkers)
J. Friend BC 1984 35.493 7.523 China 360
H Pioneer BC 1982 30.900 6.807 Pakistan 400
Baltic Night Reefer 1980 10.598 6.752 Turkey 320
Demolition Prices ($ / Ldt)
Bangladesh China India Pakistan
Dry 360 365 395 400
Wet 380 380 410 410
Demolition Prices
Bulk Carriers (2008 – Today) Tankers (2008 – Today)
Demolitions
7
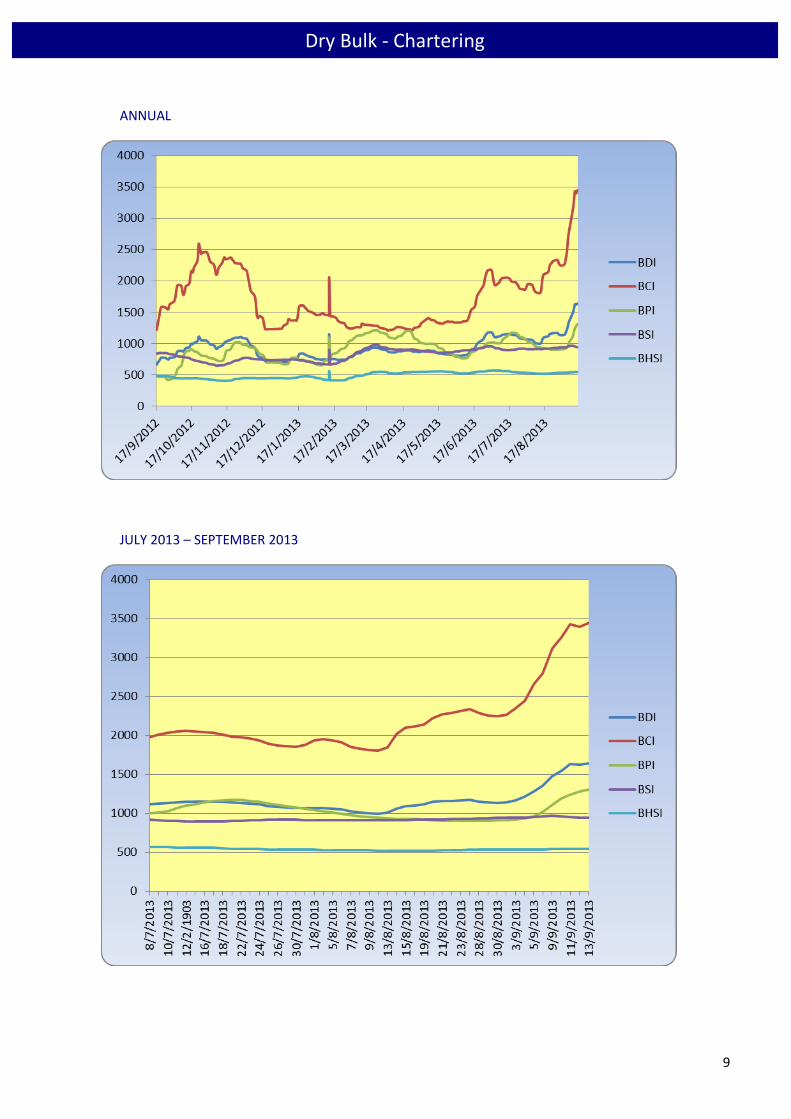
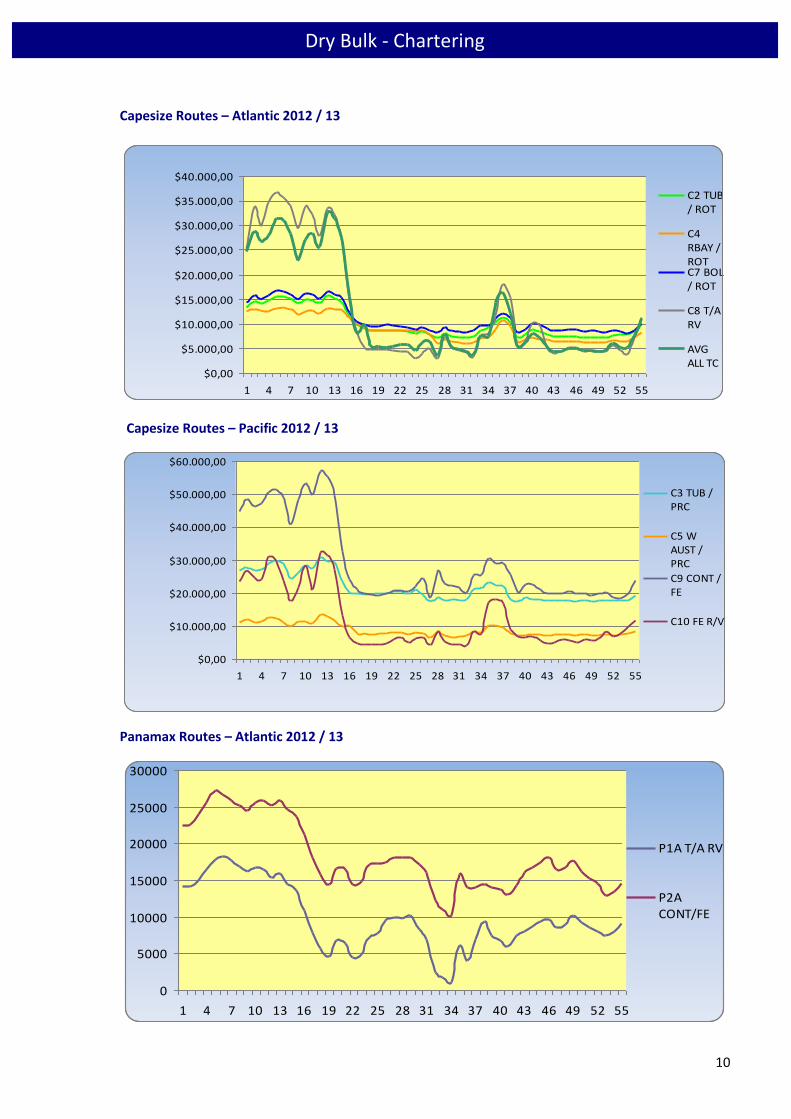
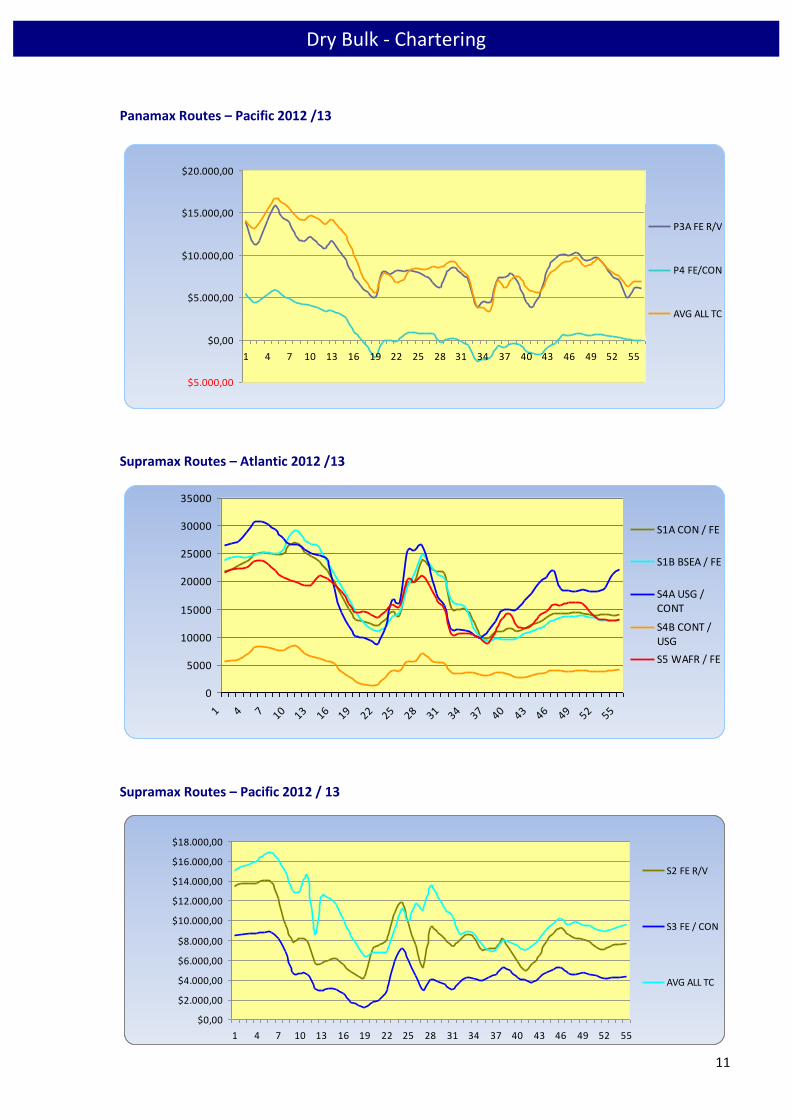
In Brief: Capesize rally continues, while pushing the rest. Capes: Cape market kept rising Market for capes kept rising for one more week, with the BCI closing at 3446 points notably increased by 647 points. Atlantic basin continued its upward trend with the transantlantic round trips fixing at around USD 28,000 surged by about USD 10,000 compared to last weeks levels. As for Tubarao / Qingdao route closing at about USD 29.50 pmt and the fronthaul ex Conti/Med fixing at around USD 48,500. Pacific market was strong as well with the Aussie round trips fixing at around USD 29,000-30,000 improved around 8,000. Port Hedland / Qingdao were fixed at around USD 11.95 pmt. Period levels at about USD 22,000 for one year. Panamax: Steady movement in the Atlantic, positive in the Pacific basin. BPI index at the beginning of the week was at 1105 points to finally close up by 201 points at 1306 on Friday. Steady sentiment was seen in the Atlantic region last week. Transantlantic round trips were reported fixing at around USD 10000 levels about whilst there were some quick Baltic rounds and 2 ll requirements reported at USD 10500-11000 about basis delivery Continent and redelivery Skaw-Passero range. Fronthauls ex US Gulf were reported fixing at USD 15500 levels aps plus about 550k ballast bonus. There were also a couple of fixtures via Black Sea to Singapore-Japan range fixing at USD 22500-23000 levels basis delivery Canakkale. In the Pacific basin market looks very active causing rates to significantly increase at almost every direction. Aussie rounds were reported fixing at USD 11500-12000 levels basis dop Mid-S. China whilst there were rumors for a nice-eco Kamsarmax fixing at USD 15000 dop Japan redelivery China. Nopac also remained fairly active with fixtures at USD 12000-14000 basis dop S. Korea-Japan range. Indonesian Coal Market remained active with a few fixtures reported at USD 12000 levels dop S.China redelivery full China-Korea range. Short period fixtures were reported at USD 10000-10500 levels for 4/6,5/7 months and around USD 11500 daily for 11/13 months for nice eco Kamsarmax. Supramax: Negative sentiment BSI index at the beginning of the week was at 965 and at the end of the week closed at 940,decreasing by 25 points. Fronthauls from USG have been fixed at USD 16.000-18.000 and trips from USG with redelivery Gibraltar at USD around 14.000. We have seen fixtures for 4/6 months at USD 14.000 - 15.000 redelivery worldwide and for redelivery Atlantic at USD 12.000-13.000.In the pacific N.Ore cargoes kept the market on a firm mood but due to luck of usual coal cargoes the trend was not significantly positive. Regarding short period, vessels fixed at USD 9.500-11.000 basis redelivery worldwide. Handysize: The feeling remains positive although the index dropped one point at the end of the week. In the Atlantic Basin the Black Sea Market keeping strong although as fm Friday softened a little bit. Nevertheless we were impressed after seeing reported 33 k dwt vsl getting 6750 bss delivery Passero for trip via Black Sea to USG .The intramed rates closed at 11000 for the index types and the rates to Continent close around 9-10,000. From the other side of the atlantic the rates to Emed/Continent were decreased as ECSA market is dead presently for this size and also booming black sea marked has reduced the rates ex USG/USEC In the Pacific Basin the market is more stable compared with the Atlantic market. The pacific rounds closed at 7s level basis delivery China – Japan rge. The backhaul trips were fixed sub 6k basis redelivery West or South Africa . Trips to Med were fixed around 5,000 usd . The period rate for the index type closed at high 8’s for 9/12 or 11/13 months.
Dry Bulk - Chartering
Dry Bulk - Chartering
Dry Bulk - Chartering
Dry Bulk - Chartering
8
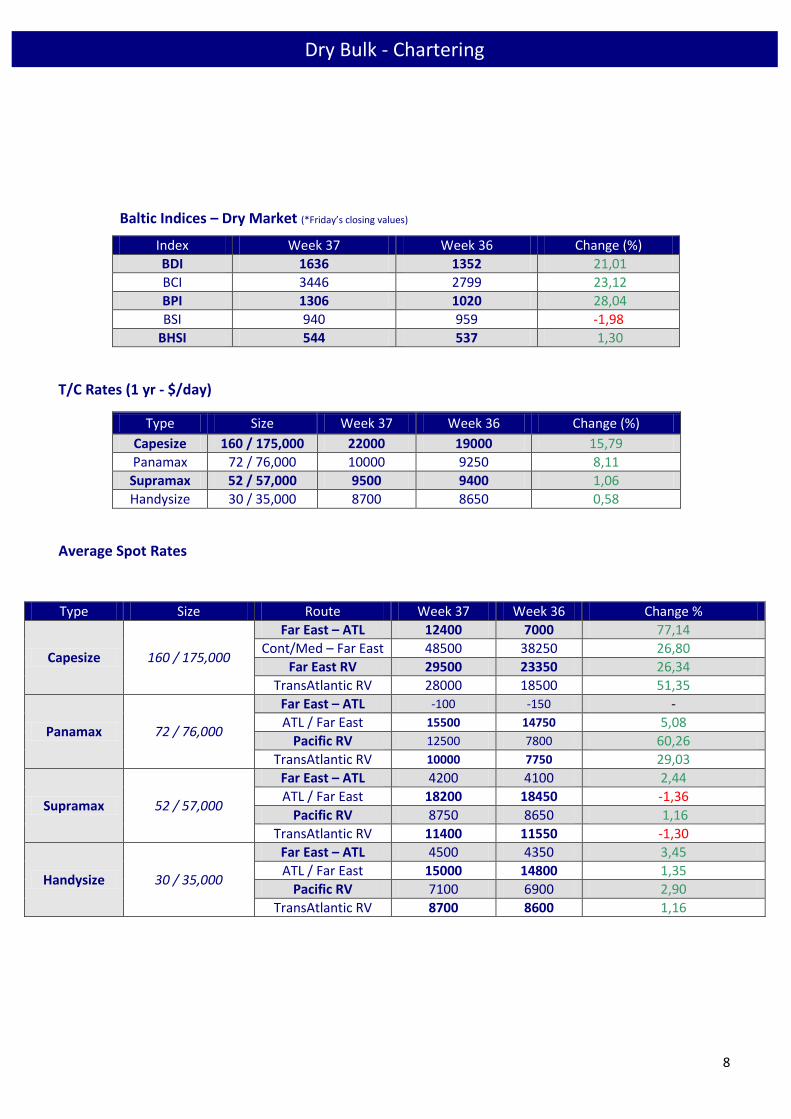
Baltic Indices – Dry Market (*Friday’s closing values)
Index Week 37 Week 36 Change (%)
BDI 1636 1352 21,01
BCI 3446 2799 23,12
BPI 1306 1020 28,04
BSI 940 959 -1,98
BHSI 544 537 1,30
T/C Rates (1 yr - $/day)
Type Size Week 37 Week 36 Change (%)
Capesize 160 / 175,000 22000 19000 15,79
Panamax 72 / 76,000 10000 9250 8,11
Supramax 52 / 57,000 9500 9400 1,06
Handysize 30 / 35,000 8700 8650 0,58
Average Spot Rates
Type Size Route Week 37 Week 36 Change %
Capesize 160 / 175,000
Far East – ATL 12400 7000 77,14
Cont/Med – Far East 48500 38250 26,80
Far East RV 29500 23350 26,34
TransAtlantic RV 28000 18500 51,35
Panamax 72 / 76,000
Far East – ATL -100 -150 -
ATL / Far East 15500 14750 5,08
Pacific RV 12500 7800 60,26
TransAtlantic RV 10000 7750 29,03
Supramax 52 / 57,000
Far East – ATL 4200 4100 2,44
ATL / Far East 18200 18450 -1,36
Pacific RV 8750 8650 1,16
TransAtlantic RV 11400 11550 -1,30
Handysize 30 / 35,000
Far East – ATL 4500 4350 3,45
ATL / Far East 15000 14800 1,35
Pacific RV 7100 6900 2,90
TransAtlantic RV 8700 8600 1,16
Dry Bulk - Chartering
9
ANNUAL
JULY 2013 – SEPTEMBER 2013
Dry Bulk - Chartering
10
Dry Bulk - Chartering
Capesize Routes – Atlantic 2012 / 13
$0,00
$5.000,00
$10.000,00
$15.000,00
$20.000,00
$25.000,00
$30.000,00
$35.000,00
$40.000,00
1 4 7 10 13 16 19 22 25 28 31 34 37 40 43 46 49 52 55
C2 TUB/ ROT
C4RBAY /ROTC7 BOL/ ROT
C8 T/ARV
AVGALL TC
Capesize Routes – Pacific 2012 / 13
$0,00
$10.000,00
$20.000,00
$30.000,00
$40.000,00
$50.000,00
$60.000,00
1 4 7 10 13 16 19 22 25 28 31 34 37 40 43 46 49 52 55
C3 TUB /PRC
C5 WAUST /PRC
C9 CONT /FE
C10 FE R/V
Panamax Routes – Atlantic 2012 / 13
0
5000
10000
15000
20000
25000
30000
1 4 7 10 13 16 19 22 25 28 31 34 37 40 43 46 49 52 55
P1A T/A RV
P2ACONT/FE
11
Dry Bulk - Chartering
Panamax Routes – Pacific 2012 /13
$5.000,00
$0,00
$5.000,00
$10.000,00
$15.000,00
$20.000,00
1 4 7 10 13 16 19 22 25 28 31 34 37 40 43 46 49 52 55
P3A FE R/V
P4 FE/CON
AVG ALL TC
Supramax Routes – Atlantic 2012 /13
0
5000
10000
15000
20000
25000
30000
35000
1 4 7 10 13 16 19 22 25 28 31 34 37 40 43 46 49 52 55
S1A CON / FE
S1B BSEA / FE
S4A USG /CONT
S4B CONT /USG
S5 WAFR / FE
Supramax Routes – Pacific 2012 / 13
$0,00
$2.000,00
$4.000,00
$6.000,00
$8.000,00
$10.000,00
$12.000,00
$14.000,00
$16.000,00
$18.000,00
1 4 7 10 13 16 19 22 25 28 31 34 37 40 43 46 49 52 55
S2 FE R/V
S3 FE / CON
AVG ALL TC
12
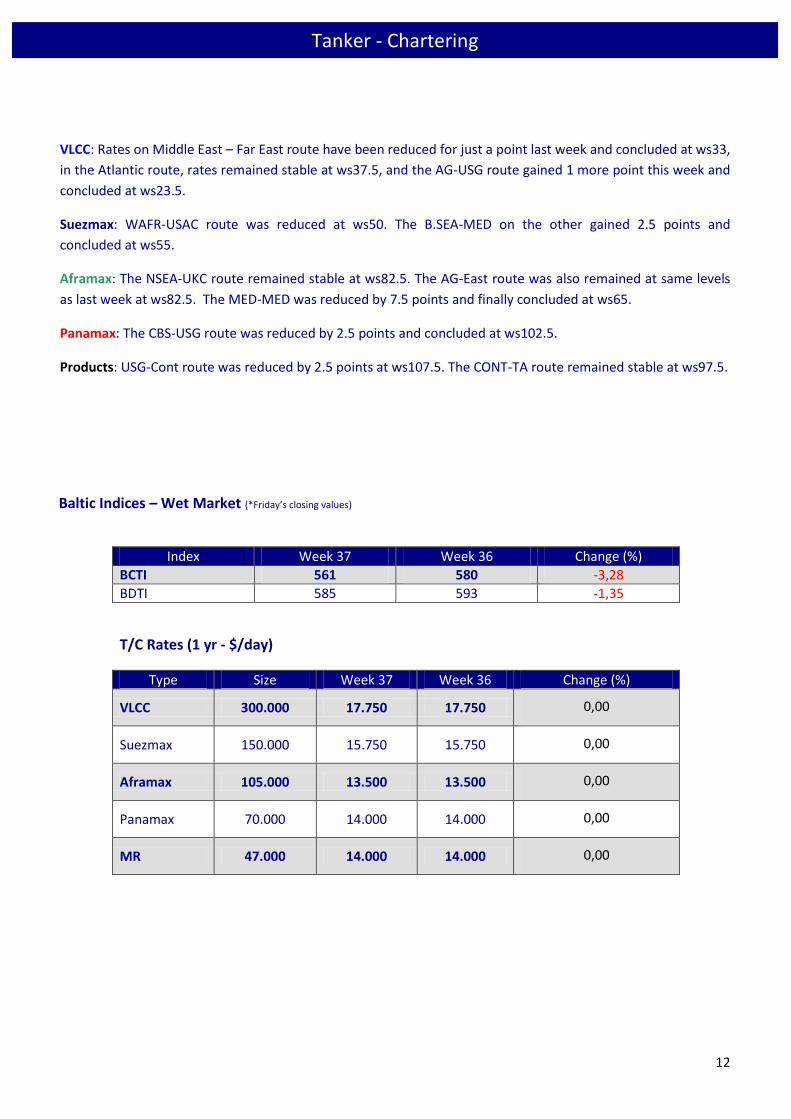
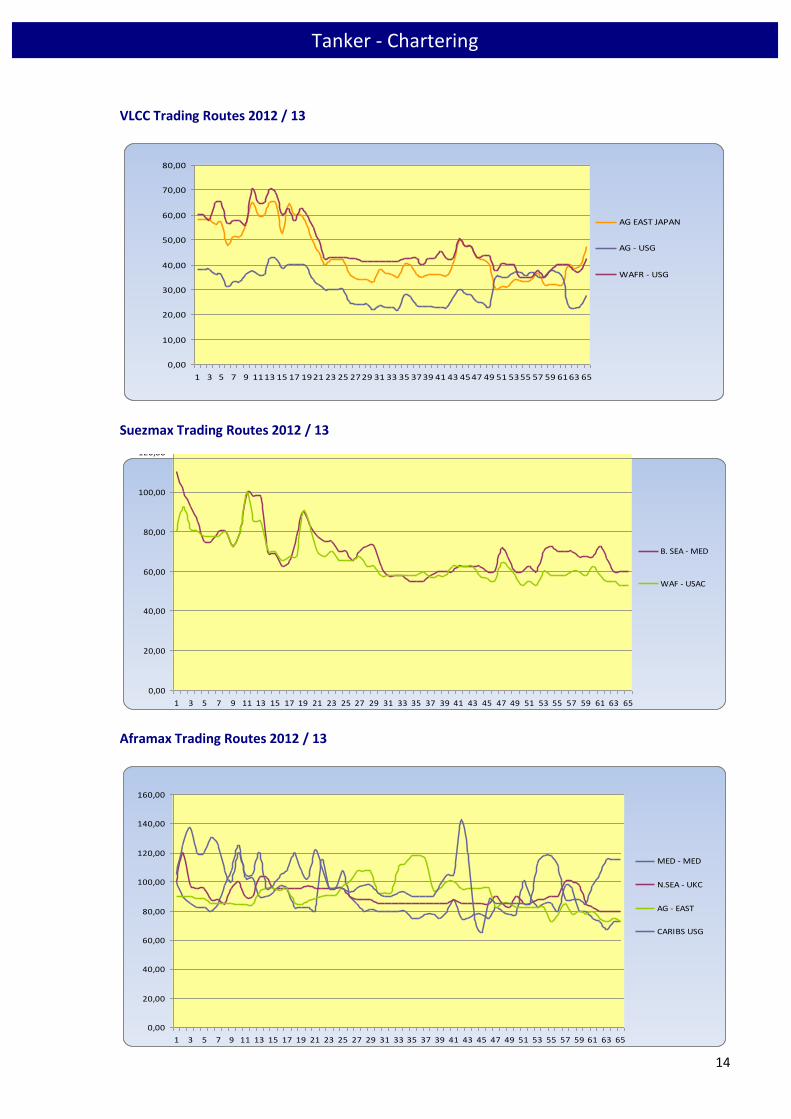
VLCC: Rates on Middle East – Far East route have been reduced for just a point last week and concluded at ws33,
in the Atlantic route, rates remained stable at ws37.5, and the AG-USG route gained 1 more point this week and
concluded at ws23.5.
Suezmax: WAFR-USAC route was reduced at ws50. The B.SEA-MED on the other gained 2.5 points and
concluded at ws55.
Aframax: The NSEA-UKC route remained stable at ws82.5. The AG-East route was also remained at same levels
as last week at ws82.5. The MED-MED was reduced by 7.5 points and finally concluded at ws65.
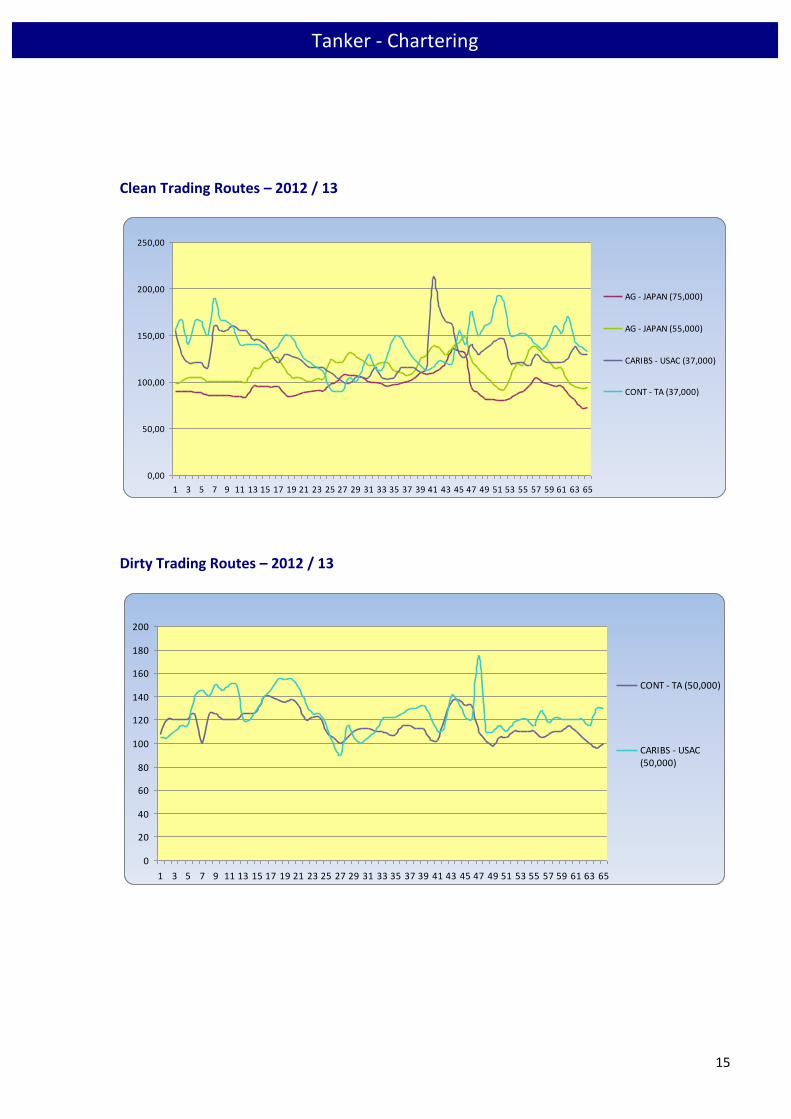
Panamax: The CBS-USG route was reduced by 2.5 points and concluded at ws102.5.
Products: USG-Cont route was reduced by 2.5 points at ws107.5. The CONT-TA route remained stable at ws97.5.
Baltic Indices – Wet Market (*Friday’s closing values)
Index Week 37 Week 36 Change (%)
BCTI 561 580 -3,28
BDTI 585 593 -1,35
T/C Rates (1 yr - $/day)
Type Size Week 37 Week 36 Change (%)
VLCC 300.000 17.750 17.750 0,00
Suezmax 150.000 15.750 15.750 0,00
Aframax 105.000 13.500 13.500 0,00
Panamax 70.000 14.000 14.000 0,00
MR 47.000 14.000 14.000 0,00
Tanker - Chartering
13
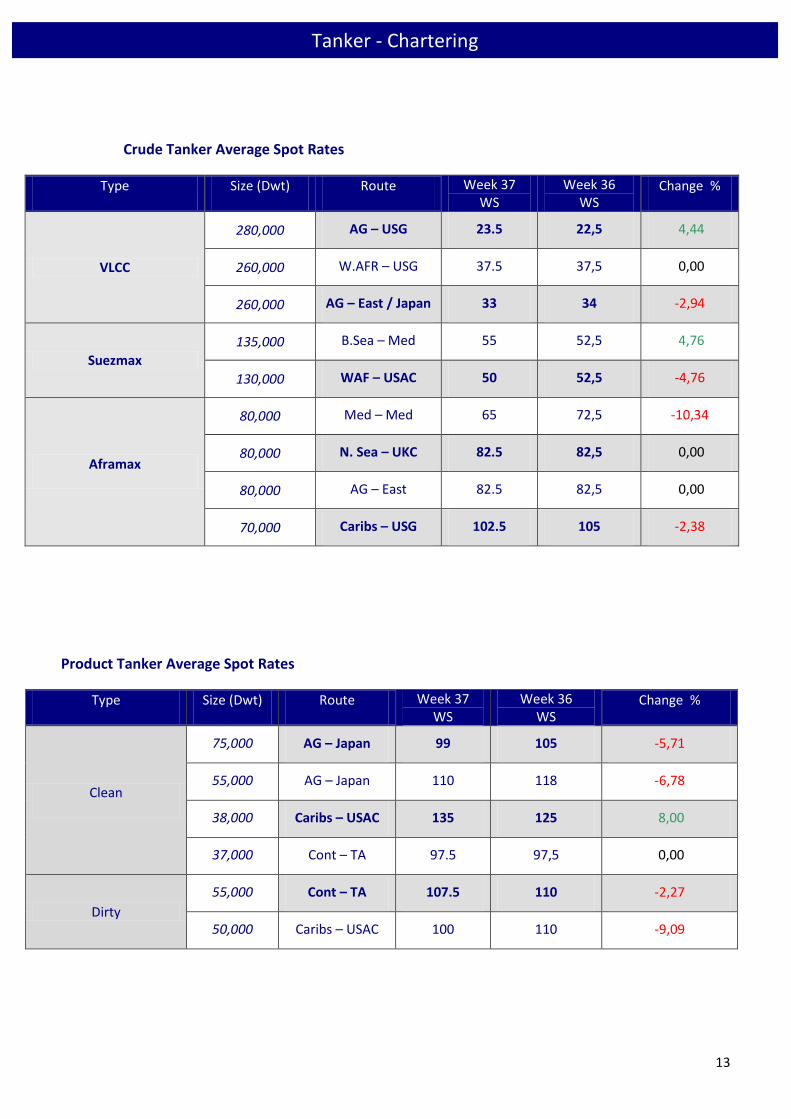
Crude Tanker Average Spot Rates
Type Size (Dwt) Route Week 37 WS
Week 36 WS
Change %
VLCC
280,000 AG – USG 23.5 22,5 4,44
260,000 W.AFR – USG 37.5 37,5 0,00
260,000 AG – East / Japan 33 34 -2,94
Suezmax
135,000 B.Sea – Med 55 52,5 4,76
130,000 WAF – USAC 50 52,5 -4,76
Aframax
80,000 Med – Med 65 72,5 -10,34
80,000 N. Sea – UKC 82.5 82,5 0,00
80,000 AG – East 82.5 82,5 0,00
70,000 Caribs – USG 102.5 105 -2,38
Product Tanker Average Spot Rates
Type Size (Dwt) Route Week 37 WS
Week 36 WS
Change %
Clean
75,000 AG – Japan 99 105 -5,71
55,000 AG – Japan 110 118 -6,78
38,000 Caribs – USAC 135 125 8,00
37,000 Cont – TA 97.5 97,5 0,00
Dirty
55,000 Cont – TA 107.5 110 -2,27
50,000 Caribs – USAC 100 110 -9,09
Tanker - Chartering
14
VLCC Trading Routes 2012 / 13
0,00
10,00
20,00
30,00
40,00
50,00
60,00
70,00
80,00
1 3 5 7 9 1113 15 17 1921 23 25 2729 31 33 35 3739 41 43 4547 49 51 5355 57 59 6163 65
AG EAST JAPAN
AG - USG
WAFR - USG
Suezmax Trading Routes 2012 / 13
0,00
20,00
40,00
60,00
80,00
100,00
120,00
1 3 5 7 9 11 13 15 17 19 21 23 25 27 29 31 33 35 37 39 41 43 45 47 49 51 53 55 57 59 61 63 65
B. SEA - MED
WAF - USAC
Aframax Trading Routes 2012 / 13
0,00
20,00
40,00
60,00
80,00
100,00
120,00
140,00
160,00
1 3 5 7 9 11 13 15 17 19 21 23 25 27 29 31 33 35 37 39 41 43 45 47 49 51 53 55 57 59 61 63 65
MED - MED
N.SEA - UKC
AG - EAST
CARIBS USG
Tanker - Chartering
15
Clean Trading Routes – 2012 / 13
0,00
50,00
100,00
150,00
200,00
250,00
1 3 5 7 9 11 13 15 17 19 21 23 25 27 29 31 33 35 37 39 41 43 45 47 49 51 53 55 57 59 61 63 65
AG - JAPAN (75,000)
AG - JAPAN (55,000)
CARIBS - USAC (37,000)
CONT - TA (37,000)
Dirty Trading Routes – 2012 / 13
0
20
40
60
80
100
120
140
160
180
200
1 3 5 7 9 11 13 15 17 19 21 23 25 27 29 31 33 35 37 39 41 43 45 47 49 51 53 55 57 59 61 63 65
CONT - TA (50,000)
CARIBS - USAC(50,000)
Tanker - Chartering
16
Shipping Stocks
Commodities
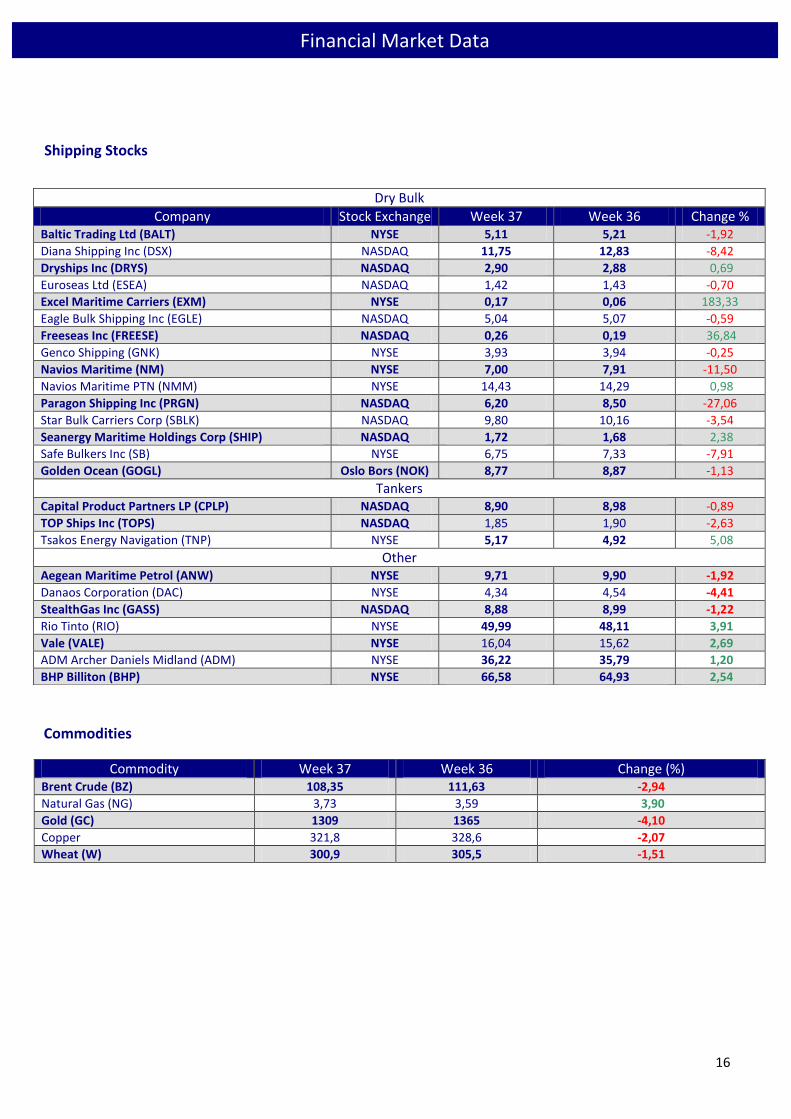
Commodity Week 37 Week 36 Change (%) Brent Crude (BZ) 108,35 111,63 -2,94
Natural Gas (NG) 3,73 3,59 3,90
Gold (GC) 1309 1365 -4,10
Copper 321,8 328,6 -2,07
Wheat (W) 300,9 305,5 -1,51
Dry Bulk
Company Stock Exchange Week 37 Week 36 Change % Baltic Trading Ltd (BALT) NYSE 5,11 5,21 -1,92
Diana Shipping Inc (DSX) NASDAQ 11,75 12,83 -8,42
Dryships Inc (DRYS) NASDAQ 2,90 2,88 0,69
Euroseas Ltd (ESEA) NASDAQ 1,42 1,43 -0,70
Excel Maritime Carriers (EXM) NYSE 0,17 0,06 183,33
Eagle Bulk Shipping Inc (EGLE) NASDAQ 5,04 5,07 -0,59
Freeseas Inc (FREESE) NASDAQ 0,26 0,19 36,84
Genco Shipping (GNK) NYSE 3,93 3,94 -0,25
Navios Maritime (NM) NYSE 7,00 7,91 -11,50
Navios Maritime PTN (NMM) NYSE 14,43 14,29 0,98
Paragon Shipping Inc (PRGN) NASDAQ 6,20 8,50 -27,06
Star Bulk Carriers Corp (SBLK) NASDAQ 9,80 10,16 -3,54
Seanergy Maritime Holdings Corp (SHIP) NASDAQ 1,72 1,68 2,38
Safe Bulkers Inc (SB) NYSE 6,75 7,33 -7,91
Golden Ocean (GOGL) Oslo Bors (NOK) 8,77 8,87 -1,13
Tankers Capital Product Partners LP (CPLP) NASDAQ 8,90 8,98 -0,89
TOP Ships Inc (TOPS) NASDAQ 1,85 1,90 -2,63
Tsakos Energy Navigation (TNP) NYSE 5,17 4,92 5,08
Other
Aegean Maritime Petrol (ANW) NYSE 9,71 9,90 -1,92
Danaos Corporation (DAC) NYSE 4,34 4,54 -4,41
StealthGas Inc (GASS) NASDAQ 8,88 8,99 -1,22
Rio Tinto (RIO) NYSE 49,99 48,11 3,91
Vale (VALE) NYSE 16,04 15,62 2,69
ADM Archer Daniels Midland (ADM) NYSE 36,22 35,79 1,20
BHP Billiton (BHP) NYSE 66,58 64,93 2,54
Financial Market Data
17
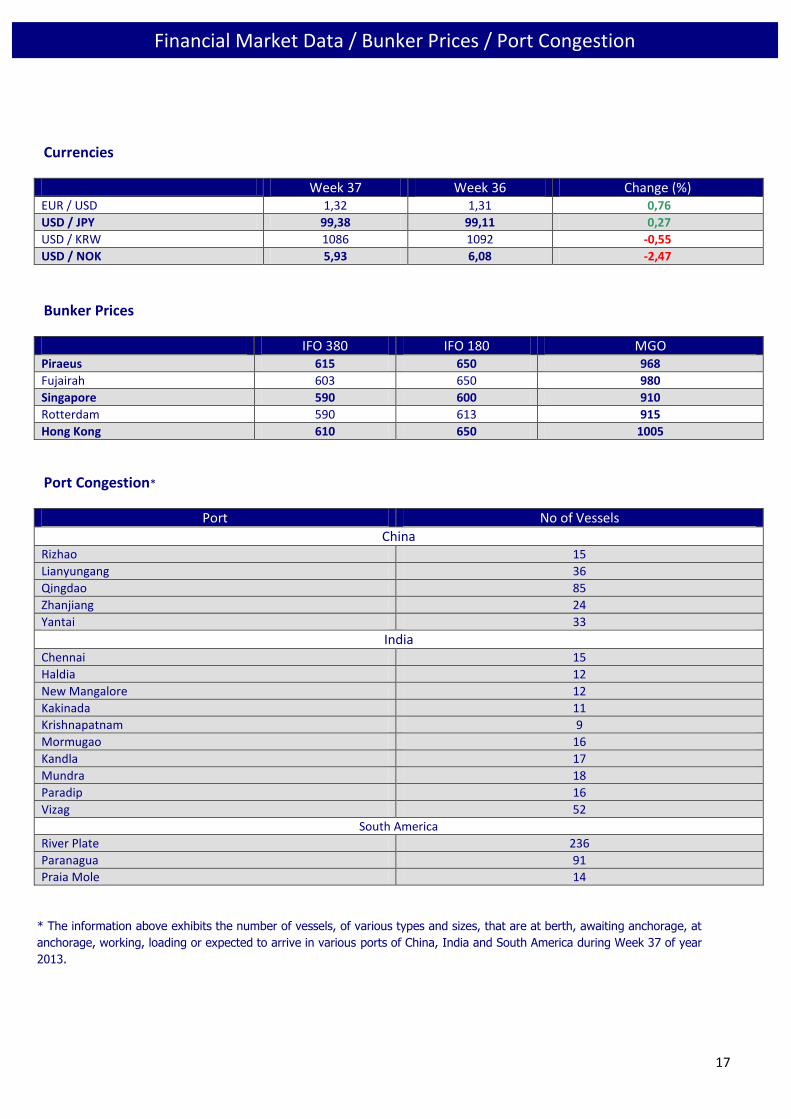
Currencies
Week 37 Week 36 Change (%) EUR / USD 1,32 1,31 0,76
USD / JPY 99,38 99,11 0,27
USD / KRW 1086 1092 -0,55
USD / NOK 5,93 6,08 -2,47
Bunker Prices
IFO 380 IFO 180 MGO Piraeus 615 650 968
Fujairah 603 650 980
Singapore 590 600 910
Rotterdam 590 613 915
Hong Kong 610 650 1005
Port Congestion*
Port No of Vessels
China Rizhao 15
Lianyungang 36
Qingdao 85
Zhanjiang 24
Yantai 33
India
Chennai 15
Haldia 12
New Mangalore 12
Kakinada 11
Krishnapatnam 9
Mormugao 16
Kandla 17
Mundra 18
Paradip 16
Vizag 52
South America
River Plate 236
Paranagua 91
Praia Mole 14
* The information above exhibits the number of vessels, of various types and sizes, that are at berth, awaiting anchorage, at
anchorage, working, loading or expected to arrive in various ports of China, India and South America during Week 37 of year
2013.
Financial Market Data / Bunker Prices / Port Congestion