Weekly Market Recap February 5, 2018 - BB&T Scott...
14
1 Weekly Market Recap April 30, 2018 Last Week: • The Dow Jones Industrial Average slid lower for the week (-0.6%) o For the week, advancers and decliners were evenly mixed o Top gainers were Verizon +7.7%, Home Depot and Nike, both +5.3% o Worst for the week was 3M (-9.9%), joined by Caterpillar (-5.6%) and Goldman Sachs (-4.8%) o Mobile-Telecom was the best performing industry group on news of Sprint and TMobile talking merger again, joined by Drug and Apparel Retailers, Medical Supplies and Retail REITs o Worst performing industry groups for the week were Materials-focused (Coal, Aluminum, mining, metals) joined by Defense • Dow Transports downshifted (-0.3%) while Dow Utilities powered higher +2.5% • The S&P 500 broke even for the week o Telecom had a big week joined by Utilities and Real Estate … Health Care +1.8% did the best of any of the major sectors o Industrials lagged noticeably (-3.2%) as did Materials (-2.1%) • The S&P Smallcap and Midcap indices experienced small declines, with the Smallcap dropping (-0.6%) while the Midcap fell (-0.4%) • NASDAQ was right in line (-0.4%) • Crude oil lost a few pennies by the end of the week to close at $67.97/barrel o Brent Crude briefly surpassed $75/barrel in Tuesday trading, the first time it has done so in three years, as oil moved higher midweek before declining late in the week • Gold pulled back another $14/ounce to $1,324 • Global stocks were more to the upside for the week o The Euro Stoxx 600 was up +0.7% while most European markets were higher London had the biggest gains of the three major markets +1.8% while Paris picked up +1.3% … Frankfurt was a drag on the index with a gain of only +0.3%
Transcript of Weekly Market Recap February 5, 2018 - BB&T Scott...

1
Weekly Market Recap April 30, 2018
Last Week:
• The Dow Jones Industrial Average slid lower for the week (-0.6%) o For the week, advancers and decliners were evenly mixed o Top gainers were Verizon +7.7%, Home Depot and Nike, both +5.3% o Worst for the week was 3M (-9.9%), joined by Caterpillar (-5.6%) and Goldman Sachs (-4.8%) o Mobile-Telecom was the best performing industry group on news of Sprint and TMobile talking
merger again, joined by Drug and Apparel Retailers, Medical Supplies and Retail REITs o Worst performing industry groups for the week were Materials-focused (Coal, Aluminum,
mining, metals) joined by Defense • Dow Transports downshifted (-0.3%) while Dow Utilities powered higher +2.5% • The S&P 500 broke even for the week
o Telecom had a big week joined by Utilities and Real Estate … Health Care +1.8% did the best of any of the major sectors
o Industrials lagged noticeably (-3.2%) as did Materials (-2.1%) • The S&P Smallcap and Midcap indices experienced small declines, with the Smallcap dropping (-0.6%)
while the Midcap fell (-0.4%) • NASDAQ was right in line (-0.4%) • Crude oil lost a few pennies by the end of the week to close at $67.97/barrel
o Brent Crude briefly surpassed $75/barrel in Tuesday trading, the first time it has done so in three years, as oil moved higher midweek before declining late in the week
• Gold pulled back another $14/ounce to $1,324 • Global stocks were more to the upside for the week
o The Euro Stoxx 600 was up +0.7% while most European markets were higher London had the biggest gains of the three major markets +1.8% while Paris picked up
+1.3% … Frankfurt was a drag on the index with a gain of only +0.3%

2
Weekly Market Recap April 30, 2018
Moscow continued its recovery from expanded sanctions +1.9% o AsiaPac stock markets also had a good week
Tokyo and Sydney both saw prices move ahead +1.4% while Bombay advanced +1.6% and Shanghai picked up +0.4%
China’s Shenzhen continued its decline (-1.0%) while Hong Kong also finished in negative numbers (-0.5%)
• The US Dollar Index broke above 91 for the first time since early January, finishing stronger at 91.53 o The Mexican Peso lost 4.5% against the U.S. dollar in the last five days (as of Monday),
reflecting growing concern that the country will elect a “populist firebrand” as its next President. Front-runner Andres Manuel Lopez Obrador has established a greater than 20 percentage point lead over Ricardo Anaya. One day later (Tuesday), the Peso jumped 5% on news that a NAFTA deal is imminent
• The VIX Volatility Index got a little excited midweek before finishing lower by nearly a point and a half at 15.41 at week’s end
• The 10-year Treasury yield spent several days above 3% before finishing the week unchanged at 2.96%
• Former PayPal and Intuit CEO Bill Harris provided some colorful opinion on Bitcoin: “I’m tired of saying, ‘Be careful, it’s speculative. Be careful, it’s gambling. Be careful, it’s a bubble.’ I’ll say it: Bitcoin is a scam. It’s a colossal pump-and-dump scheme, the likes of which the world has never seen. The losers are ill-informed buyers caught up in the spiral of greed. The result is a massive transfer of wealth from ordinary families to internet promoters”
• The European Central Bank left rates unchanged but also acknowledged that the economy in the Eurozone might be losing a little speed, a more dovish outlook than before
• The Bank of Japan also didn’t adjust interest rates and removed the timeline for hitting an inflation goal • South and North Korea held meaningful talks at their summit with plans to work on a peace agreement
between the divided countries

3
Weekly Market Recap April 30, 2018
o North Korea vowed to shut down its nuclear test site as early as May • Mike Pompeo was confirmed as Secretary of State • Ronny Jackson withdrew his name from consideration to run the Veterans Affairs department
following the release of reports summarizing a number of possible allegations • First quarter GDP checked in at 2.3% in the preliminary estimate, a shade above the 2.0% consensus
forecast but a slowdown from the past several quarters • Existing Home Sales came in at 5.6 million annualized units in March, slightly exceeding the 5.52
million consensus estimate
• New Home Sales rose to a 4-month high at 694,000 annualized units, +8.8% y/y and well above the 630,000 consensus estimate
• The Case-Shiller Home Price Index rose 6.3% y/y in February, and the 20-city index increased at a slightly faster 6.8% y/y price, its most robust growth rate since mid-2014
• The Employment Cost Index rose 2.7% year-over-year, its fastest rate of growth since 2008 • IHS Markit’s Flash Services PMI gauge clocked in at 54.4 in April, up from 54.0 in March • In a similar vein, the IHS Flash Manufacturing PMI measure printed 56.5 in April, up from 55.6 in
March • But moving in an opposite direction, the Chicago Fed’s index of economic activity dipped to 0.1 in
March from 0.98 in February • The Conference Board’s Consumer Confidence Index came in at 128.7 in April, surpassing the 126.0
consensus forecast, and near an 18-year high • The University of Michigan’s final Consumer Sentiment reading for April edged up to 98.8 from the
initial 97.8 reading, though still below March’s 101.4 • Durable Goods Orders rose 2.6% in March, more than double the 1.2% consensus guess, though ex-
Transportation orders dipped -0.3% vs. a guess of +0.5%

4
Weekly Market Recap April 30, 2018
• Weekly Jobless Claims came in at 209,000, considerably better than the 230,000 consensus, and the lowest reading since 1969
Source: Bespoke
• In corporate news: o Takeda Pharmaceuticals and Shire finally arrived at an agreement on merger terms, with the
former agreeing to acquire the latter for $64 billion in a combination of cash and stock o A judge ruled to block the Xerox deal to be acquired Fujifilm, citing the CEO for considering
personal rather than shareholder interests o Sonos, a wireless speaker company, is preparing for an IPO this summer … clearly they are
raising the volume o Comcast formalized a $31 billion bid to buy Sky, a leading European cable operator … the deal
challenges current bidder 21st Century Fox … Comcast had previously bid for Fox but was rejected in favor of Disney

5
Weekly Market Recap April 30, 2018
This Week:
• US markets look to open slightly higher o There was more M&A action over the weekend, to the tune of $100 billion total
Sainsbury is said to have acquired Walmart’s ASDA division over the weekend Boeing announced an acquisition of KLXI Marathon Petroleum finalized a deal to buy Andeavor for over $20 billion Prologis acquired DCT Industrial Trust Sprint and T-Mobile finally got a deal done to merge And Marriott Vacations announced the acquisition of ILG
• Most major European markets are slightly higher for the day • Many Asian markets are closed … those open are mostly higher with Hong Kong +1.7% leading the
way • The Federal Open Markets Committee announces its decision about US interest rates on Wednesday
with no change in rates expected • The Royal Bank of Australia’s decision comes a day earlier on Tuesday • Treasury Secretary Steve Mnuchin, Commerce Secretary Wilbur Ross, National Economics Council
Chair Larry Kudlow and Trade Representative Robert Lighthizer lead a team that will be in China on Thursday and Friday for trade talks
• Earnings season is now halfway done. JP Morgan reports that 80%ish of companies reporting have beaten earnings and 70%ish have beaten sales projections, yet the markets continue to be range-bound rather than impacted positively … earnings keep rolling this week:
o Monday: Affiliated Managers Group, Akamai, Allergan, Arconic, Bright Horizons, CNA Financial, Cognex, Enterprise Products Partners, First Data, IDEX, Loews, McDonald’s, ON Semiconductor, PerkinElmer, Public Service Enterprise, SBA Communications, Stifel and Tenet Healthcare
o Tuesday: Aetna, Allstate, American Tower, Anadarko Petroleum, Apple, Arch Capital, Archer-Daniels, Arthur Gallagher, BP, CH Robinson, Concho Resources, Cummins, Devon Energy, Eaton, Ecolab, Edison International, Emerson Electric, Encana, Fidelity National Information Services, Fiserv, Fortis, Gilead, HCA, Incyte, IPG Photonics, Johnson Controls, Juniper Networks, L3, Marathon Petroleum, Merck, Mondelez, MPLX, Newfield Exploration, Noble Energy, ONEOK, Pfizer, Ryman Hospitality Properties, Scotts Miracle-Gro, Seagate, ServiceMaster, Shopify, SS&C Technologies, Suncor Energy, Tapestry, UnderArmour, Verisk Analytics, WEC Energy, Xylem and YUM China
o Wednesday: American Financial Group, AIG, American Water Works, AmerisourceBergen, Annaly Capital, Apache, Aptiv, ADP, Bunge, CBRE Group, CDW, Cerner, CGI Group, Clorox, Continental Resources, CSG Systems, CVS, Equinix, Essex Property, Estee Lauder, Eversource Energy, Exelon, Express Scripts, Garmin, Hologic, Host Hotels, Humana, Hyatt, IQVIA, Lincoln National, Manulife, Marathon Oil, Mastercard, MetLife, Mid-America Apartment Communities,

6
Weekly Market Recap April 30, 2018
Molson Coors, Norwegian Cruise, NXP, Pioneer Natural Resources, Prudential, Republic Services, Southern Company, Square, Tesla, Kraft Heinz, Waste Connections, Williams, Wyndham Worldwide, XL Group, XPO Logistics, Zoetis and Zynga
o Thursday: ABIOMED, Activision Blizzard, Apollo Global, Arista Networks, Ball, BCE, Becton Dickinson, Cardinal Health, CBS, Church & Dwight, Cigna, Consolidated Edison, DaVita, DowDupont, EOG Resources, Ferrari, FleetCor, Fortinet, Fresenius Medical Care, GGP, Genpact, Global Payments, ICON, Ingredion, International Exchange, Kellogg, KKR, Live Nation, Magellan Midstream, Mettler-Toledo, Motorola Solutions, MSCI, NRG Energy, Pacific Gas & Electric, Pembina Pipeline, PPL, Regeneron, Sealed Air, Teleflex, Teva Pharmaceuticals, Vulcan, Westlake Chemical and Xerox
o Friday: Alibaba, Aon, CBOE Global Markets, Celgene, CenterPoint Energy, Cheniere Energy, IDEXX, Newell, VF Corp and Vistra Energy
• Economic reports: o Monday: Personal Income, PCE, Pending Home Sales and Chicago PMI o Tuesday: Markit PMI, Construction Spending, Vehicle Sales and ISM Manufacturing o Wednesday: ADP Jobs Report and several overseas PMI/GDP/unemployment reports o Thursday: Jobless Claims, Productivity, Trade Balances, Markit Services PMI, ISM Non-
Manufacturing and Factory Orders o Friday: Nonfarm Payrolls and Unemployment Rate
7
Weekly Market Recap April 30, 2018
BB&T Scott & Stringfellow Preliminary Performance for wrap accounts managed by the Sterling Equity Opportunities Group, Net of Fees. Performance reflects reinvested interest income and dividends and realized and unrealized capital gains and losses.
• Global Leaders -0.7% year to date, +124.7% cumulative, since inception (12/31/00) • MSCI World Net +0.3% year to date, +174.5% vs combined benchmark* since portfolio inception
(12/31/00)
• Special Opportunities +2.2% year to date, +412.9% cumulative, since inception (12/31/00) • Russell 3000 Total Return +0.5% year to date, +201.9% since portfolio inception (12/31/00)
• Equity Income -2.4% year to date, +280.1% cumulative, since inception (12/31/00) • Russell 1000 Value Total Return -1.6% year to date, +208.5% since portfolio inception (12/31/00)
• SMID -1.3% year to date, +80.1% cumulative, since inception (6/30/11) • Russell 2500 Total Return +0.9% year to date, +109.6% since portfolio inception (6/30/11)
• Insight +1.0% year to date, +129.9% cumulative, since inception (8/31/11) • Russell 1000 Total Return +0.4% year to date, +151.0% since portfolio inception (8/31/11)
• Enhanced Equity -0.5% year to date, +131.2% cumulative, since inception (12/31/03) • CBOE BuyWrite Total Return +0.2% year to date, +120.1% since portfolio inception (12/31/03)
• S&P 500 Total Return +0.4% year to date, +185.0% since (12/31/00)
*Combined Benchmark is the S&P 500 from inception to 12/31/2015, and the MSCI World Net index from 1/1/2016 forward.
As always, thanks very much for your interest and support.
Farley Shiner, CFA® Managing Director Adam Bergman, CFA® Executive Director

8
Weekly Market Recap April 30, 2018
Source: APL. The Sponsor Level Performance shown is net of fees and reflects the reinvestment of dividends and other earnings. The performance presented represents past performance and is no guarantee of future results. Market conditions vary from year to year and can result in a decline in market value due to material market or economic conditions. The performance is considered supplemental information to, and may only be distributed with, the Composite Disclosure presentation.
The Chartered Financial Analyst® (CFA) charter is a graduate-level investment credential awarded by the CFA Institute — the largest global association of investment professionals. To earn the CFA charter, candidates must: 1) pass three sequential, six-hour examinations; 2) have at least four years of qualified professional investment experience; 3) join CFA Institute as members; and 4) commit to abide by, and annually reaffirm, their adherence to the CFA Institute Code of Ethics and Standards of Professional Conduct.
Specific securities identified and described do not represent all of the securities purchased, sold or recommended to clients. There are no assurances that securities identified will be profitable investments. The securities described are neither a recommendation nor a solicitation. Security information is being obtained from resources the firm believes to be accurate, but no warrant is made as to the accuracy or completeness of the information.
Opinions contained in the preceding commentary reflect those of Sterling Capital Management LLC, and not those of BB&T Corporation or its executives. The stated opinions are for general information only and are not meant to be predictions or an offer of individual or personalized investment advice. They also are not intended as an offer or solicitation with respect to the purchase or sale of any security. This information and these opinions are subject to change without notice. Any type of investing involves risk and there are no guarantees. Sterling Capital Management LLC does not assume liability for any loss which may result from the reliance by any person upon any such information or opinions.
Investment advisory services are available through Sterling Capital Management LLC, a separate subsidiary of BB&T Corporation. Sterling Capital Management LLC manages customized investment portfolios, provides asset allocation analysis and offers other investment-related services to affluent individuals and businesses. Securities and other investments held in investment management or investment advisory accounts at Sterling Capital Management LLC are not deposits or other obligations of BB&T Corporation, Branch Banking and Trust Company or any affiliate, are not guaranteed by Branch Banking and Trust Company or any other bank, are not insured by the FDIC or any other government agency, and are subject to investment risk, including possible loss of principal invested.
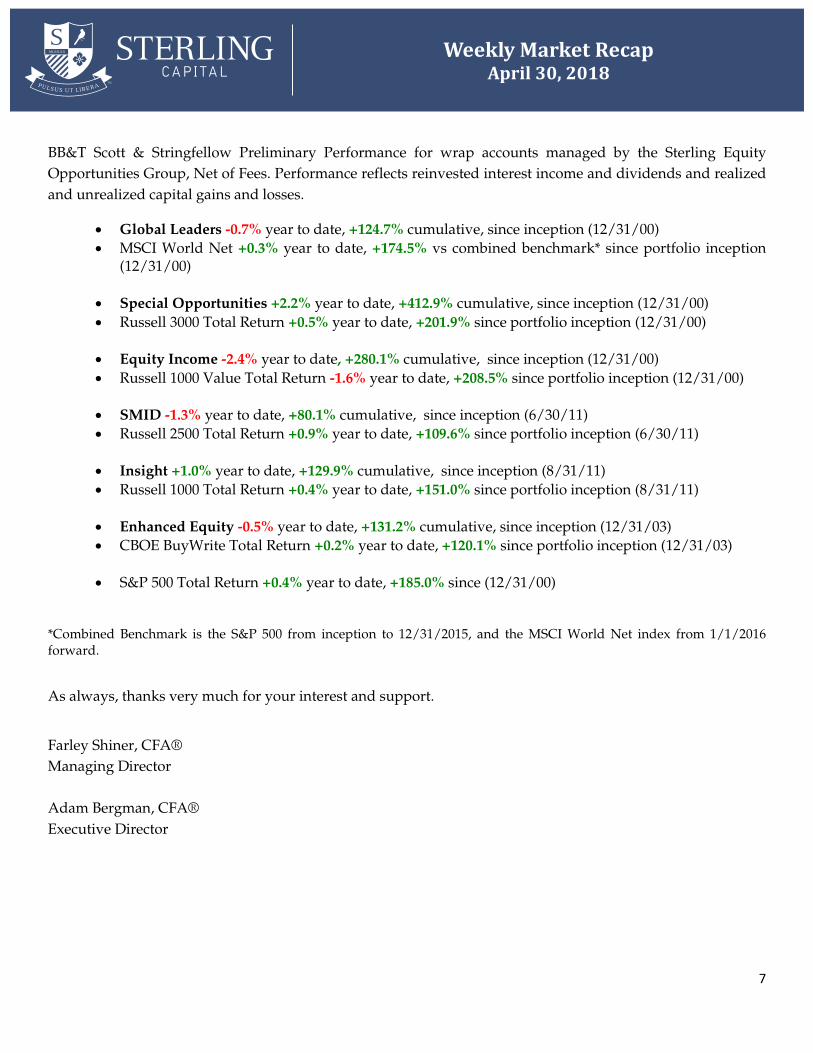
Total Return Composite Assets Total Composite Benchmark"Pure" Total Return No. of End of Period Percent of Firm Assets Composite 3-yr St Dev 3-yr St Dev
Year Gross of Fees Net of Fees Portfolios ($MM) Firm Assets ($MM) Dispersion (%) BXM (%) (%)2016 13.20 11.17 13 9 0.0 51,603 0.5% 7.07 8.79 6.592015 -1.90 -3.72 16 9 0.0 51,155 0.5% 5.24 8.21 6.432014 9.39 7.27 19 11 0.0 47,540 0.3% 5.64 8.23 5.902013 22.13 19.74 20 11 0.0 45,638 0.5% 13.26 11.35 9.442012 10.49 8.26 23 10 0.2 4,422 0.7% 5.20 13.68 11.602011 2.26 0.21 29 12 0.3 3,932 0.8% 5.72 15.62 13.692010 12.42 10.23 31 15 0.4 3,548 0.6% 5.86 20.29 17.222009 30.73 28.20 35 21 0.7 2,839 1.0% 25.91 18.99 15.882008 -32.00 -33.44 48 21 1.1 1,907 1.8% -28.65 16.45 13.422007 11.71 9.30 44 22 1.1 2,059 0.8% 6.59 6.98 4.692006 16.50 13.80 44 22 1.7 1,314 0.6% 13.33 6.20 4.112005 9.96 7.54 34 14 1.5 904 0.5% 4.252004 13.91 11.30 18 7 1.3 522 0.0% 8.30
Annualized Since Inception 8.03 5.83 5.25
Sterling Capital Management – Enhanced Equity SMA Composite December 31, 2003 – December 31, 2016
Description: Consists of all discretionary separately managed wrap Enhanced Equity portfolios. Sterling’s Enhanced Equity portfolios invest primarily in companies held in other EquityOpportunities Group portfolios where call options are written opportunistically to enhance the portfolio’s cash flow.
Notes:1. Sterling Capital Management LLC (SCM) is a registered investment advisor with the SEC. Registration does not imply a certain level of skill or training. Sterling manages a variety of equity, fixed income and balanced
assets. Prior to January 2001, Sterling was a wholly owned subsidiary of United Asset Management (UAM). In January 2001, Sterling Capital Management LLC purchased all the assets and business of Sterling CapitalManagement Company from UAM to become an employee owned firm. There were no changes in personnel. In April 2005, BB&T Corporation purchased a majority equity ownership stake in Sterling CapitalManagement LLC. There were no changes in personnel. In October 2010, the management group of Sterling Capital entered into an agreement with BB&T Corporation that reduced and restructured management'sinterest in Sterling Capital Management. Additionally, BB&T Asset Management merged into Sterling Capital Management. There were no material changes in personnel. In January 2013, CHOICE Asset Managementfirm merged into Sterling Capital Management. There were no changes in personnel. “Percent of Firm Assets” and “Total Firm Assets” prior to 2013 are for CHOICE Asset Management. In August 2015, 8 new employeesjoined Sterling Capital management via Stratton Management Company following the close of BB&T’s purchase of Susquehanna Bancshares. There were no changes to personnel.
2. George F. Shipp, CFA, has managed the portfolio since inception. No alterations of composites, as presented herein, have occurred due to changes in personnel or other reasons at any time.3. Inception date of composite: December 31, 2003. Creation date: December 31, 2003. The appropriate index is the CBOE Buy/Write Index (ticker symbol BXM) that is designed to show the performance of a basket of S&P
500 stocks with calls written monthly at the money. It represents the universe of stocks from which covered call managers typically select. Total return includes price appreciation/depreciation and income as a percentof the original investment. A complete list of all of SCM’s composites and their descriptions is available upon request. Policies for valuing portfolios, calculating performance and preparing compliant presentations areavailable upon request.
4. Performance reflects reinvested interest income and dividends and realized and unrealized capital gains and losses. All portfolios are valued monthly as of calendar month-end and utilize trade-date and accrued incomeaccounting. Valuations and performance are reported in US dollars. Portfolio returns are calculated monthly using the Modified Dietz method. Portfolios are revalued for cash flows greater than 10%. Composite returnsare calculated by weighting the individual portfolio returns using beginning of period market value plus weighted cash flows. Periodic time weighted returns are geometrically linked. Returns are not calculated net ofnon-reclaimable withholding taxes due to immaterial dollar amounts.
5. “Pure” gross of fees returns do not reflect the deduction of any fees including trading costs. The net of fee return reflects the actual SMA fee of the individual account. The SMA fee includes all charges for trading costs,portfolio management, custody and other administrative fees.
6. The annual composite dispersion presented is measured by an asset-weighted standard deviation calculation method of all portfolios in the composite for the entire year. It is not meaningful when there are less than sixportfolios in the composite for the entire year. The three year annualized standard deviation measures the variability of the composite and benchmark returns over the preceding 36 month period. It is not required to bepresented for annual periods prior to 2011 or when a full three years of composite performance is not yet available.
7. The performance presented represents past performance and is no guarantee of future results. Stock market conditions vary from year to year and can result in a decline in market value due to material market oreconomic conditions.
Sterling Capital Management LLC claims compliance with the Global Investment Performance Standards (GIPS®) and has prepared and presented this report incompliance with the GIPS standards. Sterling Capital Management LLC has been independently verified for the periods 01/01/01 to 12/31/14. The verification report(s)is/are available upon request. Verification assesses whether (1) the firm has complied with all the composite construction requirements of the GIPS standards on a firm-wide basis and (2) the firm’s policies and procedures are designed to calculate and present performance in compliance with the GIPS standards. Verification does notensure the accuracy of any specific composite presentation.

Sterling Capital Management – Equity Income SMA CompositeDecember 31, 2000 – December 31, 2016
Description: Consists of all discretionary separately managed wrap Equity Income portfolios. Sterling’s Equity Income portfolios invest primarily in companies with a dividend yield greaterthan the S&P 500 and a history of growing the dividend, either three consecutive years or six of the prior ten years.
Notes:1. Sterling Capital Management LLC (SCM) is a registered investment advisor with the SEC. Registration does not imply a certain level of skill or training. Sterling manages a variety of equity, fixed income and balanced
assets. Prior to January 2001, Sterling was a wholly owned subsidiary of United Asset Management (UAM). In January 2001, Sterling Capital Management LLC purchased all the assets and business of Sterling CapitalManagement Company from UAM to become an employee owned firm. There were no changes in personnel. In April 2005, BB&T Corporation purchased a majority equity ownership stake in Sterling CapitalManagement LLC. There were no changes in personnel. In October 2010, the management group of Sterling Capital entered into an agreement with BB&T Corporation that reduced and restructured management'sinterest in Sterling Capital Management. Additionally, BB&T Asset Management merged into Sterling Capital Management. There were no material changes in personnel. In January 2013, CHOICE Asset Managementfirm merged into Sterling Capital Management. There were no changes in personnel. “Percent of Firm Assets” and “Total Firm Assets” prior to 2013 are for CHOICE Asset Management. In August 2015, 8 new employeesjoined Sterling Capital management via Stratton Management Company following the close of BB&T’s purchase of Susquehanna Bancshares. There were no changes to personnel.
2. George F. Shipp, CFA, has managed the portfolio since inception. No alterations of composites, as presented herein, have occurred due to changes in personnel or other reasons at any time.3. Inception date of composite: December 31, 2000. Creation date: December 31, 2000. The appropriate benchmark for this composite is the Russell 1000 Value Index." The Russell 1000 Value Index measures the performance
of the large-cap value segment of the U.S equity universe. It includes those Russell 1000 companies with lower price-to-book ratios and lower expected growth values. The index is reconstituted annually. Total returnincludes price appreciation/depreciation and income as a percent of original investment. A complete list of all of SCM’s composites and their descriptions is available upon request. Policies for valuing portfolios,calculating performance and preparing compliant presentations are available upon request.
4. Performance reflects reinvested interest income and dividends and realized and unrealized capital gains and losses. All portfolios are valued monthly as of calendar month-end and utilize trade-date and accrued incomeaccounting. Valuations and performance are reported in US dollars. Portfolio returns are calculated monthly using the Modified Dietz method. Portfolios are revalued for cash flows greater than 10%. Composite returnsare calculated monthly by weighting the aggregate SMA/Wrap sponsor returns using beginning of period market values. Periodic time weighted returns are geometrically linked. Returns are not calculated net of non-reclaimable withholding taxes due to immaterial dollar amounts.
5. “Pure” gross of fees returns do not reflect the deduction of any fees including trading costs. The net of fee return reflects the actual SMA fee of the individual portfolios in each platform except for one platform where themaximum fee is deducted from the gross return. The SMA fee includes all charges for trading costs, portfolio management, custody and other administrative fees. The actual fee may vary by size and type of portfolio.
6. The annual composite dispersion presented is measured by an asset-weighted standard deviation calculation method of all portfolios in the composite for the entire year. The dispersion is not meaningful because lessthan six portfolios are in the composite. The three year annualized standard deviation measures the variability of the composite and benchmark returns over the preceding 36 month period. It is not required to bepresented for annual periods prior to 2011 or when a full three years of composite performance is not yet available.
7. The performance presented represents past performance and is no guarantee of future results. Stock market conditions vary from year to year and can result in a decline in market value due to material market oreconomic conditions.
Sterling Capital Management LLC claims compliance with the Global Investment Performance Standards (GIPS®) and has prepared and presented this report incompliance with the GIPS standards. Sterling Capital Management LLC has been independently verified for the periods 01/01/01 to 12/31/14. The verification report(s)is/are available upon request. Verification assesses whether (1) the firm has complied with all the composite construction requirements of the GIPS standards on a firm-wide basis and (2) the firm’s policies and procedures are designed to calculate and present performance in compliance with the GIPS standards. Verification does notensure the accuracy of any specific composite presentation.
Total Return Composite Assets Total Composite Benchmark"Pure" Total Return No. of End of Period Percent of Firm Assets Composite Russell 3-yr St Dev 3-yr St Dev
Year Gross of Fees Net of Fees Portfolios ($MM) Firm Assets ($MM) Dispersion (%) 1000 Value (%) (%)2016 15.43 13.84 3 989 1.9 51,603 Not Meaningful 17.34 10.40 10.772015 -2.70 -4.15 3 1,100 2.2 51,155 Not Meaningful -3.83 10.20 10.682014 4.61 2.98 3 1,501 3.2 47,540 Not Meaningful 13.45 8.33 9.202013 26.70 24.74 3 1,574 3.4 45,638 Not Meaningful 32.53 9.72 12.882012 12.39 10.63 3 1,272 28.8 4,422 Not Meaningful 17.51 11.83 15.732011 10.24 8.54 2 1,159 29.5 3,932 Not Meaningful 0.39 14.88 20.982010 15.64 13.87 2 992 28.0 3,548 Not Meaningful 15.51 17.82 23.512009 18.92 17.05 2 811 28.6 2,839 Not Meaningful 19.69 16.17 21.402008 -26.17 -27.26 2 620 32.5 1,907 Not Meaningful -36.85 13.18 15.582007 9.20 7.66 1 668 32.4 2,059 Not Meaningful -0.17 6.52 8.172006 23.09 21.35 1 442 33.6 1,314 Not Meaningful 22.25 6.00 6.782005 10.19 8.63 1 263 29.1 904 Not Meaningful 7.05 9.51 9.592004 23.23 21.39 1 128 24.5 522 Not Meaningful 16.49 12.76 14.972003 31.36 29.24 1 31 19.6 158 Not Meaningful 30.03 12.94 16.222002 -12.34 -13.78 1 15 29.4 51 Not Meaningful -15.522001 5.76 4.46 1 4 16.7 24 Not Meaningful -5.59
Annualized Since Inception 9.32 7.69 6.55
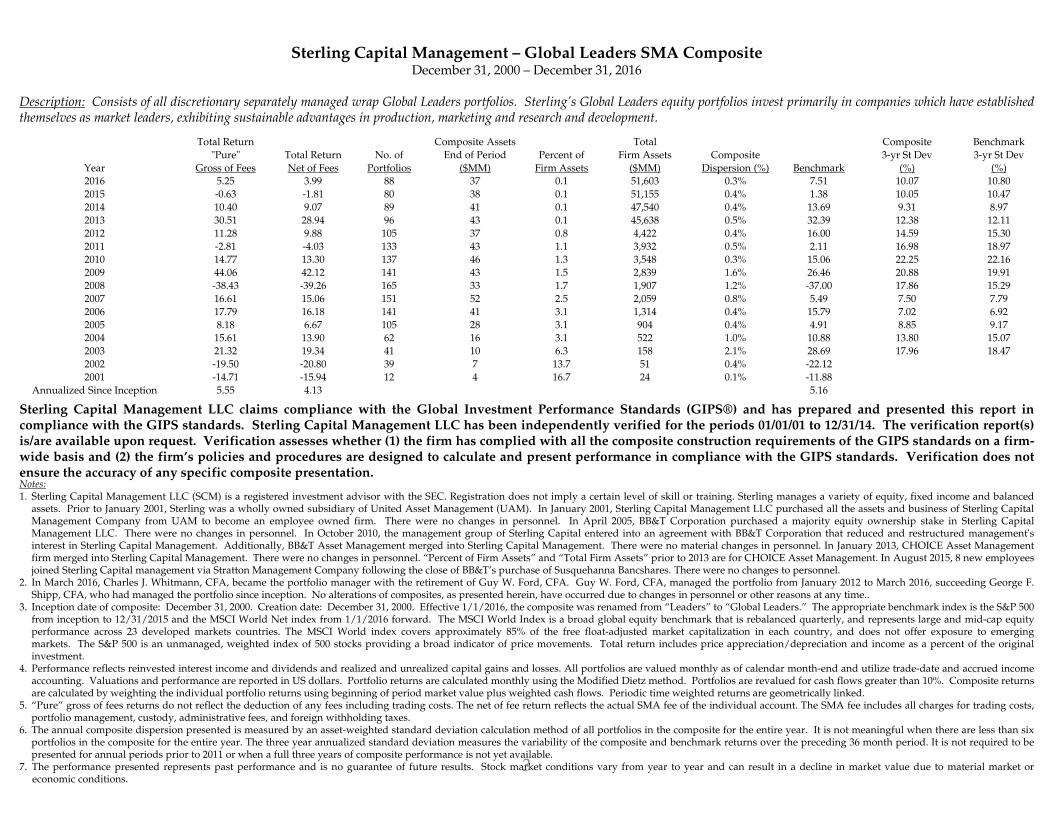
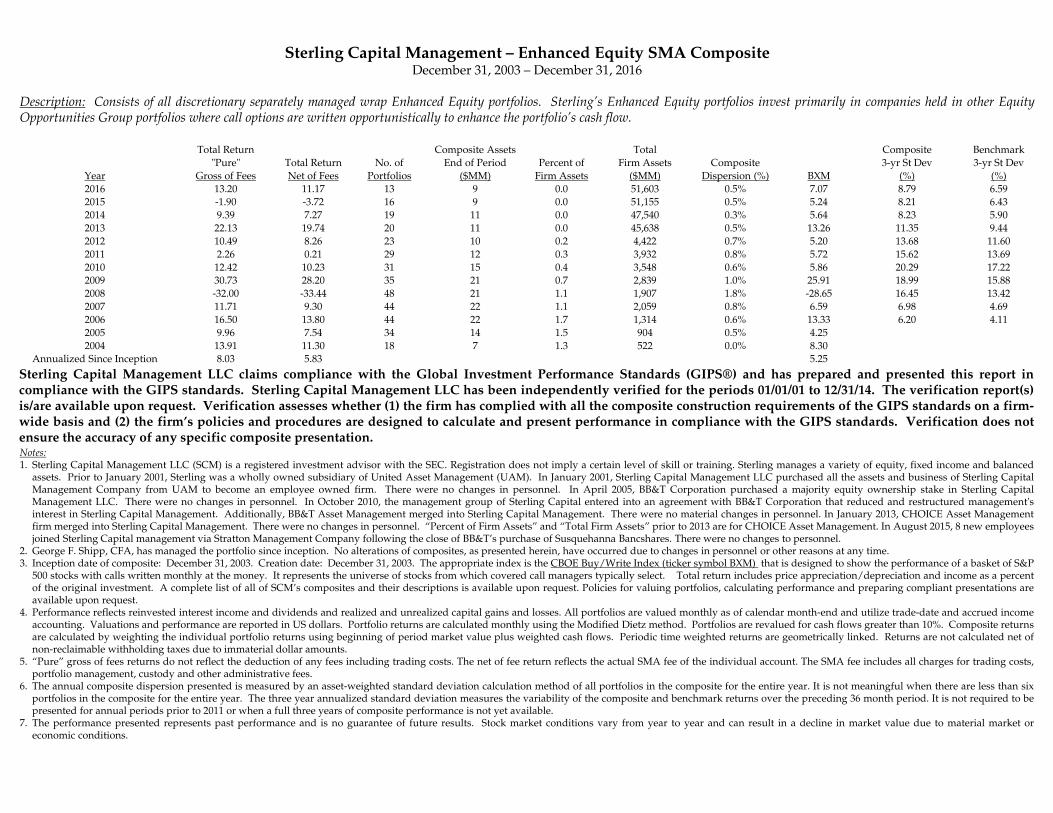
Sterling Capital Management – Global Leaders SMA CompositeDecember 31, 2000 – December 31, 2016
Description: Consists of all discretionary separately managed wrap Global Leaders portfolios. Sterling’s Global Leaders equity portfolios invest primarily in companies which have establishedthemselves as market leaders, exhibiting sustainable advantages in production, marketing and research and development.
Notes:1. Sterling Capital Management LLC (SCM) is a registered investment advisor with the SEC. Registration does not imply a certain level of skill or training. Sterling manages a variety of equity, fixed income and balanced
assets. Prior to January 2001, Sterling was a wholly owned subsidiary of United Asset Management (UAM). In January 2001, Sterling Capital Management LLC purchased all the assets and business of Sterling CapitalManagement Company from UAM to become an employee owned firm. There were no changes in personnel. In April 2005, BB&T Corporation purchased a majority equity ownership stake in Sterling CapitalManagement LLC. There were no changes in personnel. In October 2010, the management group of Sterling Capital entered into an agreement with BB&T Corporation that reduced and restructured management'sinterest in Sterling Capital Management. Additionally, BB&T Asset Management merged into Sterling Capital Management. There were no material changes in personnel. In January 2013, CHOICE Asset Managementfirm merged into Sterling Capital Management. There were no changes in personnel. “Percent of Firm Assets” and “Total Firm Assets” prior to 2013 are for CHOICE Asset Management. In August 2015, 8 new employeesjoined Sterling Capital management via Stratton Management Company following the close of BB&T’s purchase of Susquehanna Bancshares. There were no changes to personnel.
2. In March 2016, Charles J. Whitmann, CFA, became the portfolio manager with the retirement of Guy W. Ford, CFA. Guy W. Ford, CFA, managed the portfolio from January 2012 to March 2016, succeeding George F.Shipp, CFA, who had managed the portfolio since inception. No alterations of composites, as presented herein, have occurred due to changes in personnel or other reasons at any time..
3. Inception date of composite: December 31, 2000. Creation date: December 31, 2000. Effective 1/1/2016, the composite was renamed from “Leaders” to “Global Leaders.” The appropriate benchmark index is the S&P 500from inception to 12/31/2015 and the MSCI World Net index from 1/1/2016 forward. The MSCI World Index is a broad global equity benchmark that is rebalanced quarterly, and represents large and mid-cap equityperformance across 23 developed markets countries. The MSCI World index covers approximately 85% of the free float-adjusted market capitalization in each country, and does not offer exposure to emergingmarkets. The S&P 500 is an unmanaged, weighted index of 500 stocks providing a broad indicator of price movements. Total return includes price appreciation/depreciation and income as a percent of the originalinvestment.
4. Performance reflects reinvested interest income and dividends and realized and unrealized capital gains and losses. All portfolios are valued monthly as of calendar month-end and utilize trade-date and accrued incomeaccounting. Valuations and performance are reported in US dollars. Portfolio returns are calculated monthly using the Modified Dietz method. Portfolios are revalued for cash flows greater than 10%. Composite returnsare calculated by weighting the individual portfolio returns using beginning of period market value plus weighted cash flows. Periodic time weighted returns are geometrically linked.
5. “Pure” gross of fees returns do not reflect the deduction of any fees including trading costs. The net of fee return reflects the actual SMA fee of the individual account. The SMA fee includes all charges for trading costs,portfolio management, custody, administrative fees, and foreign withholding taxes.
6. The annual composite dispersion presented is measured by an asset-weighted standard deviation calculation method of all portfolios in the composite for the entire year. It is not meaningful when there are less than sixportfolios in the composite for the entire year. The three year annualized standard deviation measures the variability of the composite and benchmark returns over the preceding 36 month period. It is not required to bepresented for annual periods prior to 2011 or when a full three years of composite performance is not yet available.
7. The performance presented represents past performance and is no guarantee of future results. Stock market conditions vary from year to year and can result in a decline in market value due to material market oreconomic conditions.
Sterling Capital Management LLC claims compliance with the Global Investment Performance Standards (GIPS®) and has prepared and presented this report incompliance with the GIPS standards. Sterling Capital Management LLC has been independently verified for the periods 01/01/01 to 12/31/14. The verification report(s)is/are available upon request. Verification assesses whether (1) the firm has complied with all the composite construction requirements of the GIPS standards on a firm-wide basis and (2) the firm’s policies and procedures are designed to calculate and present performance in compliance with the GIPS standards. Verification does notensure the accuracy of any specific composite presentation.
3
Total Return Composite Assets Total Composite Benchmark"Pure" Total Return No. of End of Period Percent of Firm Assets Composite 3-yr St Dev 3-yr St Dev
Year Gross of Fees Net of Fees Portfolios ($MM) Firm Assets ($MM) Dispersion (%) Benchmark (%) (%)2016 5.25 3.99 88 37 0.1 51,603 0.3% 7.51 10.07 10.802015 -0.63 -1.81 80 38 0.1 51,155 0.4% 1.38 10.05 10.472014 10.40 9.07 89 41 0.1 47,540 0.4% 13.69 9.31 8.972013 30.51 28.94 96 43 0.1 45,638 0.5% 32.39 12.38 12.112012 11.28 9.88 105 37 0.8 4,422 0.4% 16.00 14.59 15.302011 -2.81 -4.03 133 43 1.1 3,932 0.5% 2.11 16.98 18.972010 14.77 13.30 137 46 1.3 3,548 0.3% 15.06 22.25 22.162009 44.06 42.12 141 43 1.5 2,839 1.6% 26.46 20.88 19.912008 -38.43 -39.26 165 33 1.7 1,907 1.2% -37.00 17.86 15.292007 16.61 15.06 151 52 2.5 2,059 0.8% 5.49 7.50 7.792006 17.79 16.18 141 41 3.1 1,314 0.4% 15.79 7.02 6.922005 8.18 6.67 105 28 3.1 904 0.4% 4.91 8.85 9.172004 15.61 13.90 62 16 3.1 522 1.0% 10.88 13.80 15.072003 21.32 19.34 41 10 6.3 158 2.1% 28.69 17.96 18.472002 -19.50 -20.80 39 7 13.7 51 0.4% -22.122001 -14.71 -15.94 12 4 16.7 24 0.1% -11.88
Annualized Since Inception 5.55 4.13 5.16

Sterling Capital Management – Insight SMA CompositeAugust 31, 2011 – December 31, 2016
Description: Consists of all discretionary separately managed wrap Insight portfolios. Sterling’s Insight equity portfolios invest primarily in companies where there has been recent insiderbuying activity; we also retain the flexibility to own companies in which insiders own a substantial stake.
Notes:1. Sterling Capital Management LLC (SCM) is a registered investment advisor with the SEC. Registration does not imply a certain level of skill or training. Sterling manages a variety of equity, fixed income and balanced
assets. Prior to January 2001, Sterling was a wholly owned subsidiary of United Asset Management (UAM). In January 2001, Sterling Capital Management LLC purchased all the assets and business of Sterling CapitalManagement Company from UAM to become an employee owned firm. There were no changes in personnel. In April 2005, BB&T Corporation purchased a majority equity ownership stake in Sterling CapitalManagement LLC. There were no changes in personnel. In October 2010, the management group of Sterling Capital entered into an agreement with BB&T Corporation that reduced and restructured management'sinterest in Sterling Capital Management. Additionally, BB&T Asset Management merged into Sterling Capital Management. There were no material changes in personnel. In January 2013, CHOICE Asset Managementfirm merged into Sterling Capital Management. There were no changes in personnel. “Percent of Firm Assets” and “Total Firm Assets” prior to 2013 are for CHOICE Asset Management. In August 2015, 8 new employeesjoined Sterling Capital management via Stratton Management Company following the close of BB&T’s purchase of Susquehanna Bancshares. There were no changes to personnel.
2. Adam B. Bergman, CFA, has managed the portfolio since inception. No alterations of composites, as presented herein, have occurred due to changes in personnel or other reasons at any time.3. Inception date of composite: August 31, 2011. Creation date: August 31, 2011. The appropriate index is the Russell 1000 Index which measures the performance of the largest 1,000 US companies, representing over 90%
of the investable US market. The index is reconstituted annually. Total return includes price appreciation/depreciation and income as a percent of the original investment. A complete list of all of SCM’s composites andtheir descriptions is available upon request. Policies for valuing portfolios, calculating performance and preparing compliant presentations are available upon request.
4. Performance reflects reinvested interest income and dividends and realized and unrealized capital gains and losses. All portfolios are valued monthly as of calendar month-end and utilize trade-date and accrued incomeaccounting. Valuations and performance are reported in US dollars. Portfolio returns are calculated monthly using the Modified Dietz method. Portfolios are revalued for cash flows greater than 10%. Composite returnsare calculated by weighting the individual portfolio returns using beginning of period market value plus weighted cash flows. Periodic time weighted returns are geometrically linked. Returns are not calculated net ofnon-reclaimable withholding taxes due to immaterial dollar amounts.
5. “Pure” gross of fees returns do not reflect the deduction of any fees including trading costs. The net of fee return reflects the actual SMA fee of the individual account. The SMA fee includes all charges for trading costs,portfolio management, custody and other administrative fees.
6. The annual composite dispersion presented is measured by an asset-weighted standard deviation calculation method of all portfolios in the composite for the entire year. It is not meaningful when there are less than sixportfolios in the composite for the entire year. The three year annualized standard deviation measures the variability of the composite and benchmark returns over the preceding 36 month period. It is not required to bepresented for annual periods prior to 2011 or when a full three years of composite performance is not yet available.
7. The performance presented represents past performance and is no guarantee of future results. Stock market conditions vary from year to year and can result in a decline in market value due to material market oreconomic conditions.
Sterling Capital Management LLC claims compliance with the Global Investment Performance Standards (GIPS®) and has prepared and presented this report incompliance with the GIPS standards. Sterling Capital Management LLC has been independently verified for the periods 01/01/01 to 12/31/14. The verification report(s)is/are available upon request. Verification assesses whether (1) the firm has complied with all the composite construction requirements of the GIPS standards on a firm-wide basis and (2) the firm’s policies and procedures are designed to calculate and present performance in compliance with the GIPS standards. Verification does notensure the accuracy of any specific composite presentation.
Total Return Composite Assets Total Composite Benchmark"Pure" Total Return No. of End of Period Percent of Firm Assets Composite Russell 3-yr St Dev 3-yr St Dev
Year Gross of Fees Net of Fees Portfolios ($MM) Firm Assets ($MM) Dispersion (%) 1000 (%) (%)2016 10.39 8.88 146 33 0.1 51,603 0.3% 12.05 9.92 10.692015 5.14 3.69 116 29 0.1 51,155 0.3% 0.92 9.35 10.482014 7.41 5.88 134 29 0.1 47,540 0.2% 13.24 9.42 9.122013 28.48 26.64 121 27 0.1 45,638 0.2% 33.112012 17.74 16.17 74 14 0.3 4,422 0.1% 16.42
2011 (Inception 8/31/11) 4.86 4.62 2 0 0.0 3,932 3.50Annualized Since Inception 13.64 12.11 14.45

Sterling Capital Management - SMID Opportunities SMA CompositeJune 30, 2011 – December 31, 2016
Description: Consists of all discretionary separately managed wrap SMID Opportunities portfolios. Sterling’s SMID Opportunities equity portfolios invest primarily in companies similar tothe market capitalization of the Russell 2500 index.
Notes:1. Sterling Capital Management LLC (SCM) is a registered investment advisor with the SEC. Registration does not imply a certain level of skill or training. Sterling manages a variety of equity, fixed income and balanced
assets. Prior to January 2001, Sterling was a wholly owned subsidiary of United Asset Management (UAM). In January 2001, Sterling Capital Management LLC purchased all the assets and business of Sterling CapitalManagement Company from UAM to become an employee owned firm. There were no changes in personnel. In April 2005, BB&T Corporation purchased a majority equity ownership stake in Sterling CapitalManagement LLC. There were no changes in personnel. In October 2010, the management group of Sterling Capital entered into an agreement with BB&T Corporation that reduced and restructured management'sinterest in Sterling Capital Management. Additionally, BB&T Asset Management merged into Sterling Capital Management. There were no changes in personnel. In January 2013, CHOICE Asset Management firmmerged into Sterling Capital Management. There were no changes in personnel. “Percent of Firm Assets” and “Total Firm Assets” prior to 2013 are for CHOICE Asset Management. In August 2015, 8 new employeesjoined Sterling Capital management via Stratton Management Company following the close of BB&T’s purchase of Susquehanna Bancshares. There were no changes to personnel.
2. Joshua L. Haggerty, CFA, has managed the portfolio since inception. No alterations of composites, as presented herein, have occurred due to changes in personnel or other reasons at any time.3. Inception date of composite: June 30, 2011. Creation date: June 30, 2011. The appropriate index is the Russell 2500 Index which measures the performance of the smallest 2,500 companies in the Russell 3000. It represents
the universe of stocks from which small- and mid-cap managers typically select. The index is reconstituted annually. Total return includes price appreciation/depreciation and income as a percent of the originalinvestment. A complete list of all of SCM’s composites and their descriptions is available upon request. Policies for valuing portfolios, calculating performance and preparing compliant presentations are available uponrequest.
4. Performance reflects reinvested interest income and dividends and realized and unrealized capital gains and losses. All portfolios are valued monthly as of calendar month-end and utilize trade-date and accrued incomeaccounting. Valuations and performance are reported in US dollars. Portfolio returns are calculated monthly using the Modified Dietz method. Portfolios are revalued for cash flows greater than 10%. Composite returnsare calculated by weighting the individual portfolio returns using beginning of period market value plus weighted cash flows. Periodic time weighted returns are geometrically linked. Returns are not calculated net ofnon-reclaimable withholding taxes due to immaterial dollar amounts.
5. “Pure” gross of fees returns do not reflect the deduction of any fees including trading costs. The net of fee return reflects the actual SMA fee of the individual account. The SMA fee includes all charges for trading costs,portfolio management, custody and other administrative fees.
6. The annual composite dispersion presented is measured by an asset-weighted standard deviation calculation method of all portfolios in the composite for the entire year. It is not meaningful when there are less than sixportfolios in the composite for the entire year. The three year annualized standard deviation measures the variability of the composite and benchmark returns over the preceding 36 month period. It is not required to bepresented for annual periods prior to 2011 or when a full three years of composite performance is not yet available.
7. The performance presented represents past performance and is no guarantee of future results. Stock market conditions vary from year to year and can result in a decline in market value due to material market oreconomic conditions.
Sterling Capital Management LLC claims compliance with the Global Investment Performance Standards (GIPS®) and has prepared and presented this report incompliance with the GIPS standards. Sterling Capital Management LLC has been independently verified for the periods 01/01/01 to 12/31/14. The verification report(s)is/are available upon request. Verification assesses whether (1) the firm has complied with all the composite construction requirements of the GIPS standards on a firm-wide basis and (2) the firm’s policies and procedures are designed to calculate and present performance in compliance with the GIPS standards. Verification does notensure the accuracy of any specific composite presentation.
Total Return Composite Assets Total Composite Benchmark"Pure" Total Return No. of End of Period Percent of Firm Assets Composite Russell 3-yr St Dev 3-yr St Dev
Year Gross of Fees Net of Fees Portfolios ($MM) Firm Assets ($MM) Dispersion (%) 2500 (%) (%)2016 16.08 14.64 67 14 0.0 51,603 1.2% 17.59 10.67 13.672015 -0.39 -1.64 31 8 0.0 51,155 0.7% -2.90 10.53 12.422014 13.30 11.94 32 6 0.0 47,540 0.4% 7.07 10.58 11.672013 25.34 23.89 20 4 0.0 45,638 0.3% 36.802012 17.47 16.08 13 2 0.0 4,422 0.2% 17.88
2011 (Inception 6/30/11) -10.17 -10.72 3 0 0.0 3,932 -9.78Annualized Since Inception 10.51 9.17 11.03

Sterling Capital Management – Special Opportunities SMA CompositeDecember 31, 2000 – December 31, 2016
Description: Consists of all discretionary separately managed wrap Special Opportunities portfolios. Sterling’s Special Opportunities equity portfolios invest primarily in companies with thebest perceived combination of underlying growth potential and attractive valuation in a concentrated portfolio that has the flexibility to shift among styles.
Notes:1. Sterling Capital Management LLC (SCM) is a registered investment advisor with the SEC. Registration does not imply a certain level of skill or training. Sterling manages a variety of equity, fixed income and balanced
assets. Prior to January 2001, Sterling was a wholly owned subsidiary of United Asset Management (UAM). In January 2001, Sterling Capital Management LLC purchased all the assets and business of Sterling CapitalManagement Company from UAM to become an employee owned firm. There were no changes in personnel. In April 2005, BB&T Corporation purchased a majority equity ownership stake in Sterling CapitalManagement LLC. There were no changes in personnel. In October 2010, the management group of Sterling Capital entered into an agreement with BB&T Corporation that reduced and restructured management'sinterest in Sterling Capital Management. Additionally, BB&T Asset Management merged into Sterling Capital Management. There were no material changes in personnel. In January 2013, CHOICE Asset Managementfirm merged into Sterling Capital Management. There were no changes in personnel. “Percent of Firm Assets” and “Total Firm Assets” prior to 2013 are for CHOICE Asset Management. In August 2015, 8 new employeesjoined Sterling Capital management via Stratton Management Company following the close of BB&T’s purchase of Susquehanna Bancshares. There were no changes to personnel.
2. George F. Shipp, CFA, has managed the portfolio since inception. No alterations of composites, as presented herein, have occurred due to changes in personnel or other reasons at any time.3. Inception date of composite: December 31, 2000. Creation date: December 31, 2000. The appropriate index is the Russell 3000 Index which measures the performance of the largest 3,000 US companies, representing
approximately 98% of the investable US market. It represents the universe of stocks from which all-cap managers typically select. The index is reconstituted annually. Total return includes priceappreciation/depreciation and income as a percent of the original investment. A complete list of all of SCM’s composites and their descriptions is available upon request. Policies for valuing portfolios, calculatingperformance and preparing compliant presentations are available upon request.
4. Performance reflects reinvested interest income and dividends and realized and unrealized capital gains and losses. All portfolios are valued monthly as of calendar month-end and utilize trade-date and accrued incomeaccounting. Valuations and performance are reported in US dollars. Portfolio returns are calculated monthly using the Modified Dietz method. Portfolios are revalued for cash flows greater than 10%. Composite returnsare calculated monthly by weighting the aggregate SMA/Wrap sponsor returns using beginning of period market values. Periodic time weighted returns are geometrically linked. Returns are not calculated net of non-reclaimable withholding taxes due to immaterial dollar amounts.
5. “Pure“ gross of fees returns do not reflect the deduction of any fees including trading costs. The net of fee return reflects the actual SMA fee of the individual portfolios in each platform except for one platform where themaximum fee is deducted from the gross return. The SMA fee includes all charges for trading costs, portfolio management, custody and other administrative fees. The actual fee may vary by size and type of portfolio.
6. The annual composite dispersion presented is measured by an asset-weighted standard deviation calculation method of all portfolios in the composite for the entire year. The dispersion is not meaningful because less thansix portfolios are in the composite. The three year annualized standard deviation measures the variability of the composite and benchmark returns over the preceding 36 month period. It is not required to be presented forannual periods prior to 2011 or when a full three years of composite performance is not yet available.
7. The performance presented represents past performance and is no guarantee of future results. Stock market conditions vary from year to year and can result in a decline in market value due to material market oreconomic conditions.
Sterling Capital Management LLC claims compliance with the Global Investment Performance Standards (GIPS®) and has prepared and presented this report incompliance with the GIPS standards. Sterling Capital Management LLC has been independently verified for the periods 01/01/01 to 12/31/14. The verification report(s)is/are available upon request. Verification assesses whether (1) the firm has complied with all the composite construction requirements of the GIPS standards on a firm-wide basis and (2) the firm’s policies and procedures are designed to calculate and present performance in compliance with the GIPS standards. Verification does notensure the accuracy of any specific composite presentation.
Total Return Composite Assets Total Composite Benchmark"Pure" Total Return No. of End of Period Percent of Firm Assets Composite Russell 3-yr St Dev 3-yr St Dev
Year Gross of Fees Net of Fees Portfolios ($MM) Firm Assets ($MM) Dispersion (%) 3000 (%) (%)2016 5.72 4.31 4 721 1.4 51,603 Not Meaningful 12.74 10.35 10.882015 9.59 8.00 4 901 1.8 51,155 Not Meaningful 0.48 9.67 10.582014 15.93 14.23 4 927 1.9 47,540 Not Meaningful 12.56 9.33 9.292013 26.61 24.72 4 850 1.9 45,638 Not Meaningful 33.55 13.49 12.712012 15.45 13.68 4 718 16.2 4,422 Not Meaningful 16.42 15.75 15.952011 -2.72 -4.18 3 776 19.7 3,932 Not Meaningful 1.03 17.35 19.622010 12.79 11.08 3 868 24.5 3,548 Not Meaningful 16.93 22.62 22.942009 39.65 37.53 2 752 26.5 2,839 Not Meaningful 28.34 21.26 20.612008 -32.07 -33.08 2 507 26.6 1,907 Not Meaningful -37.31 19.08 16.022007 16.24 14.60 1 552 26.8 2,059 Not Meaningful 5.14 8.80 8.252006 23.07 21.29 1 346 26.3 1,314 Not Meaningful 15.72 8.62 7.622005 4.67 3.11 1 261 28.9 904 Not Meaningful 6.12 10.45 9.632004 29.90 27.85 1 155 29.7 522 Not Meaningful 11.95 14.87 15.052003 45.35 42.97 1 55 34.8 158 Not Meaningful 31.06 17.20 18.372002 -16.17 -17.58 1 27 52.9 51 Not Meaningful -21.542001 10.65 9.18 1 15 62.5 24 Not Meaningful -11.46
Annualized Since Inception 11.06 9.40 5.84