Week 6: Numerical Methods for Solving Equations
54
MTH4114: Computing and Data Analysis with Excel Week 6: Numerical Methods for Solving Equations 1
Transcript of Week 6: Numerical Methods for Solving Equations

MTH4114: Computing and Data Analysis with Excel
Week 6:Numerical Methods for
Solving Equations
1

Solving Equations
• A basic task in mathematics is to find the roots of a function, i.e. given a function f(x), find the value(s) of x such that f(x)=0.
• Some functions have roots which can be calculated exactly (e.g. linear or quadratic polynomials), but many functions do not, e.g. even some simple functions like 𝑥5 − 𝑥 + 1 do not have "exact" roots
• The best we can do is approximate the roots using numerical methods.
• All such methods involve doing some process repeatedly: something Excel is very good at.
2

Solving Equations Numerically
We consider several methods using Excel:
• Graphing/inspection
• Iterative methods (bisection, Newton-Raphson method)
• Goal Seek (Excel built-in)
• Note: if we know how to find roots of functions then we can also solve equations by first writing them in the form f(x)=0 for some function.
• For example we can rewrite 𝑥3 = 𝑒𝑥 as𝑥3 − 𝑒𝑥 = 0
3

Graphing functions and estimating roots
• If we can't find the roots of a function by hand, it's a good idea to first graph the function and estimate the roots by inspecting the graph.
• We covered this last week but let's quickly recap.
• We demonstrate with an example: suppose we want to find the roots of 𝑓(𝑥) = 𝑥^3 + 𝑥^2 − 5𝑥 − 5 in the interval −4 ≤ 𝑥 ≤ 4
1. Create a list of equally spaced x values in the interval and calculate the corresponding values of y=f(x). Hint use AutoFill.
4

Graphing functions and estimating roots
2. Now select all the data (columns A and B) and insert scatter chart (from the Insert tab, Charts group); make sure the version where the dots are joined together to form a smooth curve.
3. You can use a line graph if you prefer. With the default settings the axes are probably easier to read with a scatter plot.
5

Scatter graph
The Scatter graph looks like:
6

Scale axis (if needed)
By clicking on the y axis we adjust the scale so it is easier to see the roots.
7

Read off the roots
• Now we can estimate the roots by inspecting the chart.
1. The first root lies somewhere in the interval − 3 ≤ 𝑥 ≤ −2
2. The second root is (exactly) 𝑥 = −1 (we know it is exact from the table)
3. The third root lies somewhere in the interval2 ≤ 𝑥 ≤ 3
• Although estimates obtained in this way usually aren’t very accurate, they are essential as a 'first guess' when applying iterative methods such as bisection or the Newton-Raphson method.
8

The bisection method
The bisection method relies on the following fact:
If
• f is a continuous function, and
• a<b and
• f(a) and f(b) have opposite signs
then f has a root between a and b.
This means it is often easy to tell that f does have a root between a and b even when we don't know what the root is.
9

The bisection method
• Suppose that we do know that f has a root between a and b. (Think between 2 in and 3 in the earlier example.)
• Find the mid-point of the interval [a,b]. Let's give it a
name "c": so 𝑐 =𝑎+𝑏
2
• What we can say about the root? We know it must lie in one of [a,c] or [c,b].
• But we can easily check which of these intervals it lies in:
• If f(a) and f(c) have opposite signs then the root is in [a,c]
• If f(b) and f(c) have opposite signs then the root is in [c,b]
10

The bisection method
• In either case, the root lies in an interval half the size of the original interval, i.e. we have a better estimate for the root.
• We can now repeat the process on the new interval, andget an interval a quarter the size.
• As we keep repeating we get smaller and smaller intervals (so better and better estimates);
• Eventually the interval becomes so small that the midpoint is a very good estimate of the root!
11

The bisection method
Example. We can see there is a root between a and b because f(a)<0 and f(b)>0.
12

The bisection method
We can see that f(c)<0 so the root must lie between c and b.
13

The bisection method
We set "new a", let's call it a2, equal to c, and "new b" (call it b2) equal to b. The graph now looks like:
14

The bisection method
Again we split into two and since f(c)>0 we see the root must lie between a2 and c.
15

The bisection method
We set "new new a" (let's call it a3) equal to a2, and "new new b" (call it b3) equal to c. The graph now looks like:
16

Bisection method in Excel
• So how do we implement this in Excel?
• Let's use the function 𝑓(𝑥) = 𝑥3 + 𝑥2 − 5𝑥 − 5 from earlier.
• We saw that it has a root between 2 and 3.Indeed f(2)=-3 and f(3)=16.
• We set up a table in Excel with columns for a, b, c, f(a), f(b) and f(c).
• In the second row we enter our starting values for a and b (2 and 3), and we will enter formulas for c, f(a), f(b) and f(c)
17

Bisection method in Excel
• The formula for c is easy: it is 𝑐 =𝑎+𝑏
2which means we
enter =(A2+B2)/2 in C2.
• We enter the formula for f(a) in D2: this is =A2^3+A2^2-5*A2-5
• We can AutoFill (or copy/paste) the formula to E2 and F2. Check: the formula in E2 refers to B2 so is f(b) and the formula in F2 refers to C2 so is f(c).
• Now we need to start the next row (row 3). We want A3 to be "new a" and B3 to be "new b". How do we do that?
18

Formulas for "new a" and "new b"
Before we write the formulas we need to work out what we actually want.
• If f(a) and f(c) have opposite signs then "new a" is just a, and "new b" is c.
• Otherwise f(c) and f(b) must have opposite signs (think about it) so then "new a" is c, and "new b" is just b.
• How can we get Excel to tell if f(a) and f(c) have opposite signs. We could use a complicated formula with OR and AND but it easier to use the following observation:
f(a) and f(c) have opposite signs if and only if 𝑓 𝑎 𝑓 𝑐 ≤ 0
19

Formulas for "new a" and "new b"
Having worked out the logic we now need to write it in Excel. We use the IF function.
• Remember the syntax of the IF function.IF (LOGICAL_TEST, VALUE_IF_TRUE, VALUE_IF_FALSE)
• Lets start with cell A3 which is "new a".
• The logical test is: D2*F2<=0 (D2 is f(a) and F2 is f(c))
• If the test is true (i.e., f(a) and f(c) have opposite signs) then "new a" is just a: i.e., VALUE_IF_TRUE is A2.
• Otherwise "new a" is c: i.e., VALUE_IF_FALSE is C2.
• So our formula is:
=IF(D2*F2<=0,A2,C2)20

Formulas for "new a" and "new b"
• Now for cell B3 which is "new b".
• The logical test is the same : D2*F2<=0
• This time, if the test is true (i.e., f(a) and f(c) have opposite signs) then "new b" is c. So VALUE_IF_TRUE is C2.
• Otherwise "new b" is just b: i.e., VALUE_IF_FALSE is B2.
• So our formula is:
=IF(D2*F2<=0,C2,B2)
21

AutoFill does the rest!
We have done a lot of work but now we can just use AutoFill to do everything.
• First AutoFill C2:F2 to C3:F3.
• Now AutoFill A3:F3 down as far as you need.
22

Read off the root
• We just look far enough down the table that our estimates (the relevant "a" and "b") are as close as we want.
• For example if we want 3 decimal places we see that in row 13:
a and b are both 2.236 to 3dp so this root (which we know must lie between them) is 2.236 to 3dp.
• If we wanted more accuracy we just look further down: in row 17 we see the root is 2.2361 to 4dp.
23

Bisection Template
• Constructing this spreadsheet took a moderate amount of work. But....
• We can reuse it for other bisection problems.
• All you need to do is:
1. Change the initial a and b values in cells A2 and B2
2. Enter the new formula for f(a) in cell D2
3. AutoFill or Copy/Paste the new formula down columns D,E and F.
24

Bisection Template
• For example suppose 𝑓 𝑥 = 𝑥3 + 𝑥 + 1.
• We observe by graphing that there is a root between -1 and 0. [f(-1)=-1 and f(0)=1]
• Enter -1 and 0 in cells A2 and B2 as the initial a and b.
• Enter the formula =A2^3+A2+1 in cell D2.
• AutoFill or Copy/Paste the formula to D2:F20 (say)
25

Bisection Template
26
In row 14 we see that a root is -0.682 to 3dp.

Bisection method: pros and cons
The bisection method has advantages and disadvantages:
• It is guaranteed to find a root, provided f(x) is continuous and the initial interval [a,b] is chosen appropriately (i.e. f(a)f(b)<0)
• It converges quite slowly, i.e. it can take a large number of bisection steps to obtain an accurate estimate of the root.
• In fact it is an easy exercise to show that it takes 3-4 steps for each extra decimal place you want.
• In Excel this isn't much of an issue: Excel can do thousands of steps easily. (Excel's accuracy is a bigger problem if you want lots of decimal places)
27

Using the gradient
Suppose we have an estimate 𝑥1 for the root, and that we know the gradient of the curve at 𝑥1.
28

Using the Gradient
As in the picture on the previous slide we draw a tangent line to the curve and see where that hits the axis. We can hope that this is a better estimate.
• It is easy to check that the formula for our new
estimate 𝑥2 is 𝑥1 −𝑓(𝑥1)
𝑓′(𝑥1).
• As always we can repeat this and hope we get closer and closer to the root. This is called the Newton-Raphson method.
29

Newton-Raphson method
• Why does the Newton-Raphson method (usually) work?
• The tangent line to 𝑓(𝑥) at the point 𝑥 = 𝑥1 is a good approximation to 𝑓(𝑥) near 𝑥 = 𝑥1, so if we find where the tangent line crosses the x-axis, we should obtain a better estimate of the root of 𝑓(𝑥).
• If our initial estimate is "bad" then this method may not work.
30

Newton-Raphson in Excel
• Although the ideas behind the Newton-Raphson method are more complicated than the bisection method, it is actually easier to implement.
• We set out columns in Excel with headings: n, x_n, f(x_n), f'(x_n), and x_n-f(x_n)/f'(x_n)
• The first column just contains the iteration number: we can autofill that with say 1 to 10.
31

Newton-Raphson in Excel
• Cell B2 contains our initial estimate 𝑥1 for the root.
• Cell C2 contains the formula for 𝑓 𝑥1 ; since 𝑥1 is the value in cell B2 this is f(B2)
• Cell D2 contains the formula for 𝑓′(𝑥1). Note we have to work out f' ourselves: Excel does not do that for us.
• Cell E2 contains the formula for 𝑥1 −𝑓(𝑥1)
𝑓′(𝑥1). Since we
already know 𝑥1 is in cell B2, 𝑓(𝑥1) is in cell C2, and 𝑓′(𝑥1) is in cell D2 this is just:
=B2-C2/D2
• Finally 𝑥2 is exactly the number we have just calculated so we put the formula =E2 in cell B3.
32

Newton-Raphson in Excel
• Let's see this with 𝑓 𝑥 = 𝑥3 + 𝑥2 − 5𝑥 − 5.
• The formula in C2 is =B2^3+B2^2-5*B2-5
• Differentiating we get 𝑓′ 𝑥 = 3𝑥2 + 2𝑥 − 5.
• The formula in D2 is =3*B2^2+2*B2-5
33

Newton-Raphson in Excel
• As with the bisection method this has taken a moderate amount of work. But getting Excel to do the next iterations is just AutoFill.
• AutoFill cells B3,C2 D2 and E2 down their columns.
• Note The numbers won't make sense until you have done all the AutoFilling.
34

Newton-Raphson in Excel
We get:
And we see even by step 6 we have the root to 6 decimal places: 2.236068.
35

Newton-Raphson template
As with the bisection method is easy to reuse this spreadsheet for other Newton-Raphson calculations.
1. Enter the initial estimate in B2.
2. Enter the new formula for f(x_n) in C2
3. Enter the new formula for f'(x_n) in D2
4. AutoFill C2 and D2 down their columns.
Let us try our other example from before: 𝑓 𝑥 = 𝑥3 + 𝑥 + 1.
• We differentiate this to get 𝑓′ 𝑥 = 3𝑥2 + 1.
• We enter our estimate (say -1) in B2, put =B2^3+B2+1 in cell C2, and =3*B2^2+1 in cell D2. Then AutoFill and….
36

Newton-Raphson template
We get
And again even by row 6 (which is 𝑥5) we see our estimate for the root =0.682328 is accurate to 6dp.
37

Newton-Raphson pros and cons
• The advantages of Newton-Raphson are that is easy to implement and converges very fast.
• The disadvantages are that the function needs to be differentiable, and you need to differentiate it.
A remark on the speed of convergence:
• It can do as well as doubling the number of correct decimal places each step.
• This doesn't matter in Excel where you may be working to 6-10 decimal places; in more advanced numerical methods you might work to 1000dp and it does matter.
38

Summary
We have seen two ways of finding roots. There are several key points:
• It is easy to get Excel to do something repeatedly: just use one row for each "go".
• Excel can find roots using bisection or Newton-Raphson (these are examinable – but as the exam is open book you would be able to refer to my templates)
• You can easily see all the steps (i.e., what the algorithm is doing) and they all update as you change any parameters (such as the start value).
39

Excel Goal Seek
• However: Excel has its own built in way of finding roots to an equation which can be very useful.
• Excel uses the name "Goal Seek" and it is in the Data Ribbon under the heading "What-If-Analysis" in the "Forecast" section of the ribbon.
40

Excel Goal Seek
• Excel Goal Seek works as follows:
• You choose two cells and think of one of them as "x" and one as "f(x)". Let's do this by entering a header "x" in A1 and "f(x)" in B1.
• Enter our start guess for the root in A2
• Enter the formula for the function in B2.
41

Excel Goal Seek• Now click on Goal Seek (Data Ribbon under What-If-
Analysis.
• This brings up the following dialogue box:
• Enter the name of the cellwith f(x) in it in the "Set cell" line. For us this is B2.
• Enter the value we want thefunction to be in "To Value".For us this is 0.
• Enter the cell which Excel needs to change to make this happen in "By changing cell". For us this is A2.
• Press OK.42
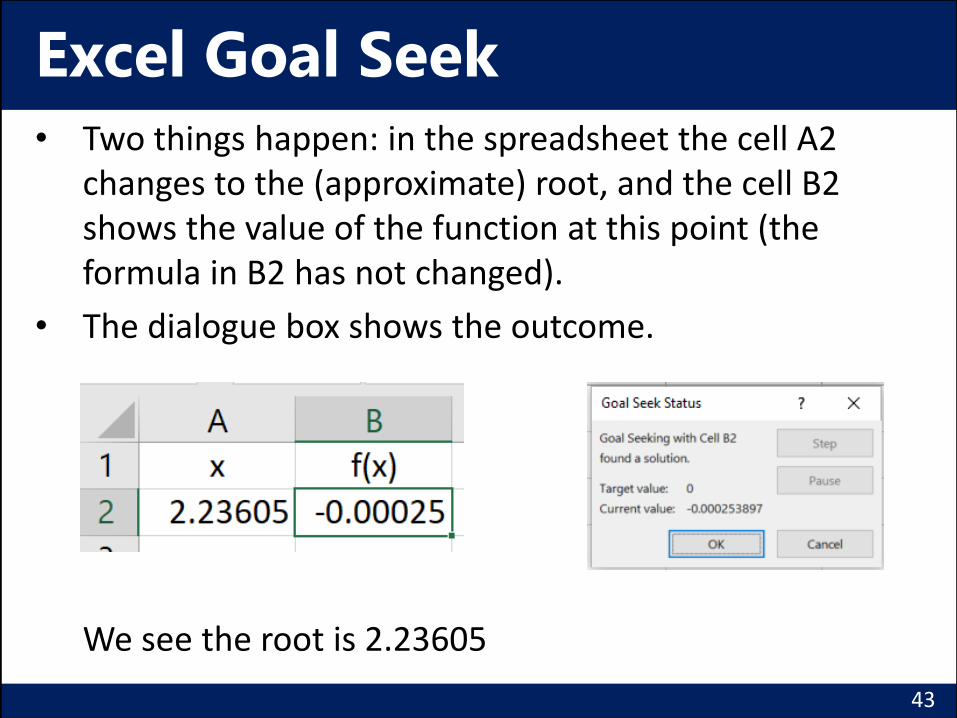
Excel Goal Seek• Two things happen: in the spreadsheet the cell A2
changes to the (approximate) root, and the cell B2 shows the value of the function at this point (the formula in B2 has not changed).
• The dialogue box shows the outcome.
We see the root is 2.23605
43

Excel Goal Seek pros and cons
• Advantage: it is very easy.
• Disadvantage: you can't tell how accurate it is. [You can tell it is not completely wrong as you can see f(x) is close to 0.]
• However, goal seek has another very big advantage. It doesn't care how the value in the "Set cell" cell is calculated: it just needs to change based on the "By changing cell" cell.
44

Excel Goal Seek (more general)
• Recall in the Week 2 Exercises we looked at mortgage repayments.
• The only change I have made is to enter the formula =B26 in cell E3 so that you can see the final balance more easily.
45

Excel Goal Seek (more general)
• The question asked you to adjust the Annual Repayment value in cell E1 to make the final balance less than £1,000.
• Goal seek can do this for us: run Goal Seek with
• Set cell: E3
• To value: 0
• By changing cell: E1
• We instantly get theanswer: £6,559.
• It didn't matter that we don't have a nice formula for the final amount – all that matters is Excel can calulate it.
46

MTH4114: Computing and Data Analysis with Excel
Review of Week 5 Exercises

Sort/Filter
• Do not select a region when sorting/filtering or if you do then select the whole table. Otherwise Excel will sort your selection without changing the other columns. This means the names and the marks might all be mixed up!
48

Formatting a cell
• Formatting a cell does not change what is in the cell!
• If you tell Excel to display the number to 2dp the full number is still stored there.
• If you tell Excel to display a date as a day of the week the full date is stored there.
• If you want the change what is stored in the cell you need a formula.
49

Date to day of week
• If the date is in cell A2 then the formula you need is =TEXT(A2,"dddd").
• I do not expect you to remember this!
• But if you type weekday intothe Excel help you get:
• The first item is not whatyou want.
• But the fourth item isexactly what you want.
50

Date to day of week
• Looking down that link:
• We have a whole sectionon what we want.
• It includes an example:
• You do need to know how to use Excel's help.
51

Chart Series labels
• In most cases when you want to change a chart in Excel you just click on the right item and make a change. This can be fiddly but mostly works.
• However to change the name of the series being plotted you need to do something different.
• For example:
52

Chart Series labels
To change the labels:
• Right click the chart and choose"Select Data"
• This bring up the dialoguebox below. Click Edit on the left.
53

Chart Series labels
• This brings up another dialogue box
• Enter the name you want as Series name.
• Select "Series 2" and do the same.
• In most cases Excel will get this right: it will use the headers as the series name.
• (In this case Excel thinks of my "pretty formulas" as pictures which is why it gets it wrong here.)
54