Webinar Leaders - Institute of Industrial and Systems ... ILSS Best in Class... · Webinar Leaders...
106
26 April 2017 Webinar Leaders D. Scott Sink, ISE @ OSU Katie Monaghan Daniel Low Pitroff Michael Beardsley Council on Industrial and Systems Engineering ISE @ OSU Integrated LeanSigma Best in Class Certification Case Studies Columbus/Eastern Ohio Mini-Region
Transcript of Webinar Leaders - Institute of Industrial and Systems ... ILSS Best in Class... · Webinar Leaders...

26 April 2017
Webinar Leaders
D. Scott Sink, ISE @ OSU
Katie Monaghan
Daniel Low Pitroff
Michael Beardsley
Council on Industrial and
Systems Engineering
ISE @ OSU Integrated LeanSigma
Best in Class Certification Case Studies
Columbus/Eastern
Ohio Mini-Region

Purpose, Objectives, Agenda
Purpose: Share best in class Integrated LeanSigma Certification Project Case
Studies
Objectives:
Overview the ILSS
Capstone Cert Prog in
ISE at OSU
Share three neat case
studies, all different
Entertain Questions
as go along if possible
Share upcoming
Webinar’s from IISE’s
Chapter #1
Key Points:
The ILSS Capstone Certification Program is
celebrating it’s 10th year!
Case Study 1--There is a science to reducing
turnover, causing improved ideal behaviors from
employees
Case Study 2– Getting the Data Model right is
required to achieve Level 5 Process Maturity
Case Study 3—Tapping in to our Suppliers full
capabilities often improves the effectiveness and
efficiency of our own organizations.
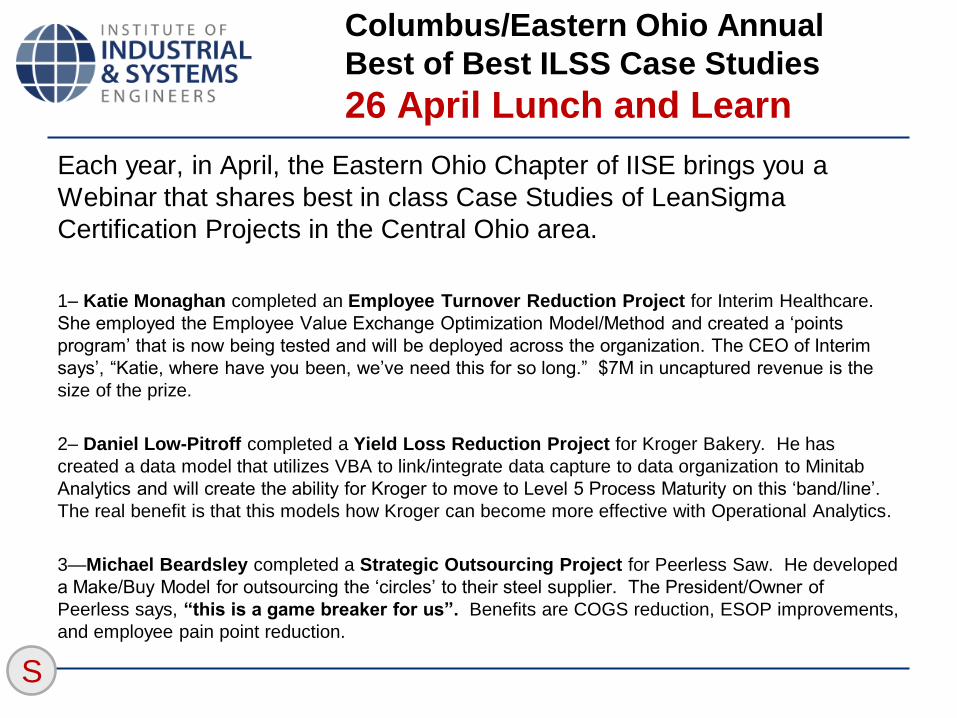
Columbus/Eastern Ohio Annual
Best of Best ILSS Case Studies
26 April Lunch and Learn
Each year, in April, the Eastern Ohio Chapter of IISE brings you a
Webinar that shares best in class Case Studies of LeanSigma
Certification Projects in the Central Ohio area.
1– Katie Monaghan completed an Employee Turnover Reduction Project for Interim Healthcare.
She employed the Employee Value Exchange Optimization Model/Method and created a ‘points
program’ that is now being tested and will be deployed across the organization. The CEO of Interim
says’, “Katie, where have you been, we’ve need this for so long.” $7M in uncaptured revenue is the
size of the prize.
2– Daniel Low-Pitroff completed a Yield Loss Reduction Project for Kroger Bakery. He has
created a data model that utilizes VBA to link/integrate data capture to data organization to Minitab
Analytics and will create the ability for Kroger to move to Level 5 Process Maturity on this ‘band/line’.
The real benefit is that this models how Kroger can become more effective with Operational Analytics.
3—Michael Beardsley completed a Strategic Outsourcing Project for Peerless Saw. He developed
a Make/Buy Model for outsourcing the ‘circles’ to their steel supplier. The President/Owner of
Peerless says, “this is a game breaker for us”. Benefits are COGS reduction, ESOP improvements,
and employee pain point reduction.
S
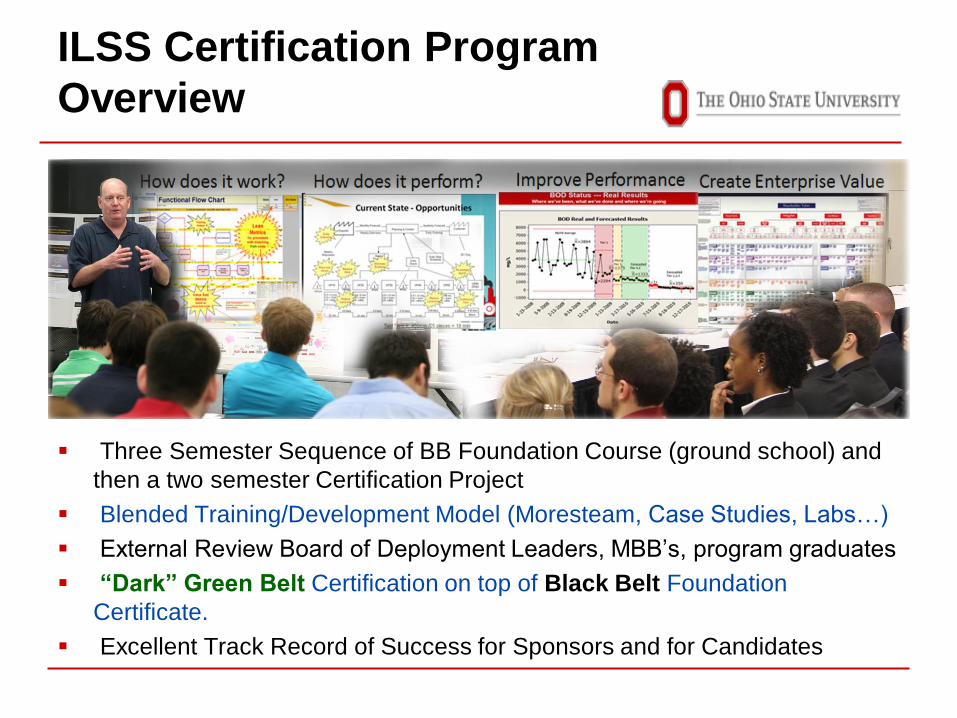
ILSS Certification Program
Overview
Three Semester Sequence of BB Foundation Course (ground school) and
then a two semester Certification Project
Blended Training/Development Model (Moresteam, Case Studies, Labs…)
External Review Board of Deployment Leaders, MBB’s, program graduates
“Dark” Green Belt Certification on top of Black Belt Foundation
Certificate.
Excellent Track Record of Success for Sponsors and for Candidates
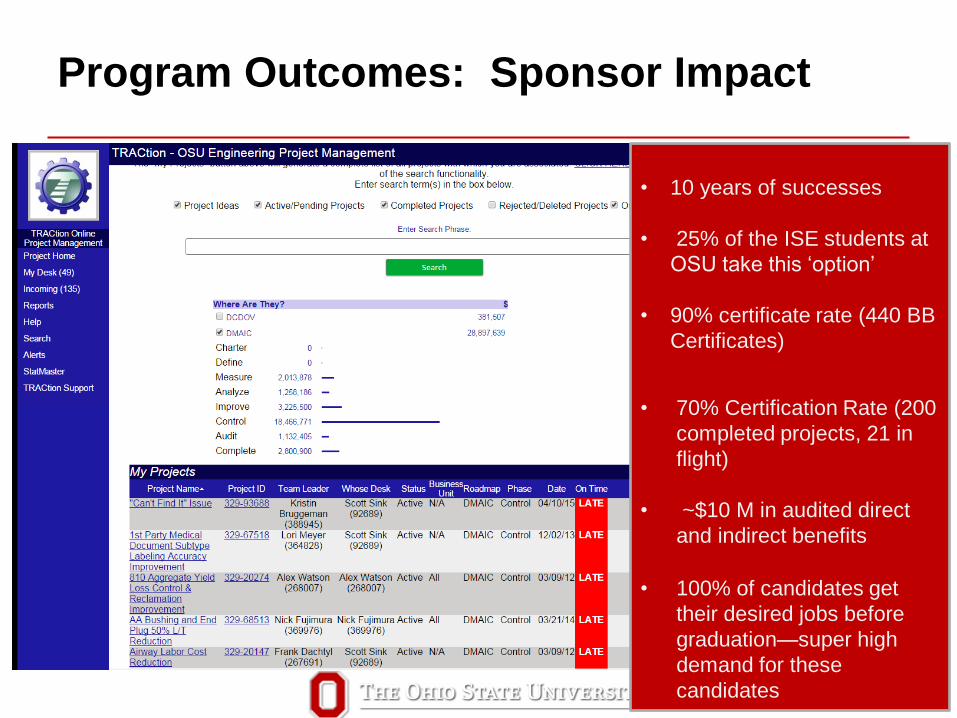
Program Outcomes: Sponsor Impact
• 10 years of successes
• 25% of the ISE students at
OSU take this ‘option’
• 90% certificate rate (440 BB
Certificates)
• 70% Certification Rate (200
completed projects, 21 in
flight)
• ~$10 M in audited direct
and indirect benefits
• 100% of candidates get
their desired jobs before
graduation—super high
demand for these
candidates

Blended Training Model in many respects
Blended and balanced hard/soft skills
Program and Project Management Focus (Bias for Results)
Personal and
Professional
Mastery:
Team work and leadership
Habits of Highly Effective
People
Learning how to learn better
Change Leadership and
Management
Full Potential Performance
Systems and
Statistical
Thinking:
Operational Excellence
End2End Value Stream
Mapping and Analysis
Improve your skills with
Statistical Process Control
Exploratory and Confirmatory
Data Analytics
How many of your core ISE
courses come together to
improve systems and
processes
Pragmatic
Modeling of
Problems and
Projects
Integrated Program
Management
Modeling and
Execution Approaches
Extensive Case
Examples from a wide
variety of
organizations
Opportunity to add an
Integrated LeanSigma
Certification and a
best in class
Internship to your
BSISE
Green Belt Certification on top
of your Black Belt Foundation
Course Certificate (5810)
At-cause
At-effect
Fix the System
Fix the Process
Fix the Problem
Do Nothing
Enroll Others
Sabbotage
Best case
Worst case Best case
Worst case
7
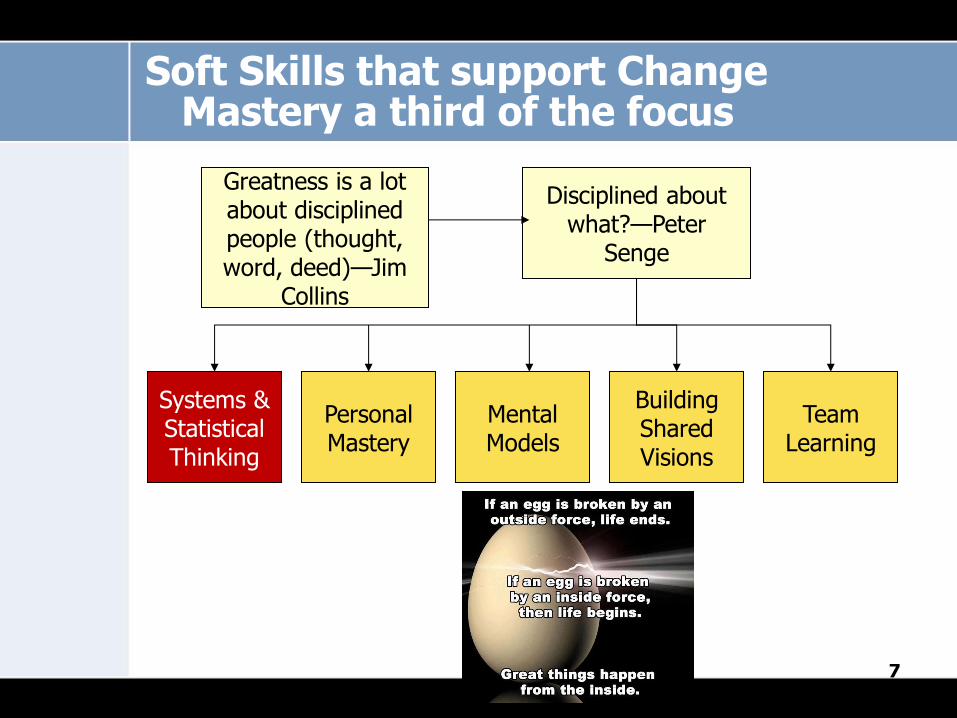
Greatness is a lot about disciplined people (thought, word, deed)—Jim
Collins
Disciplined about what?—Peter
Senge
Systems & Statistical Thinking
Personal Mastery
Mental Models
Building Shared Visions
Team Learning
Soft Skills that support Change Mastery a third of the focus
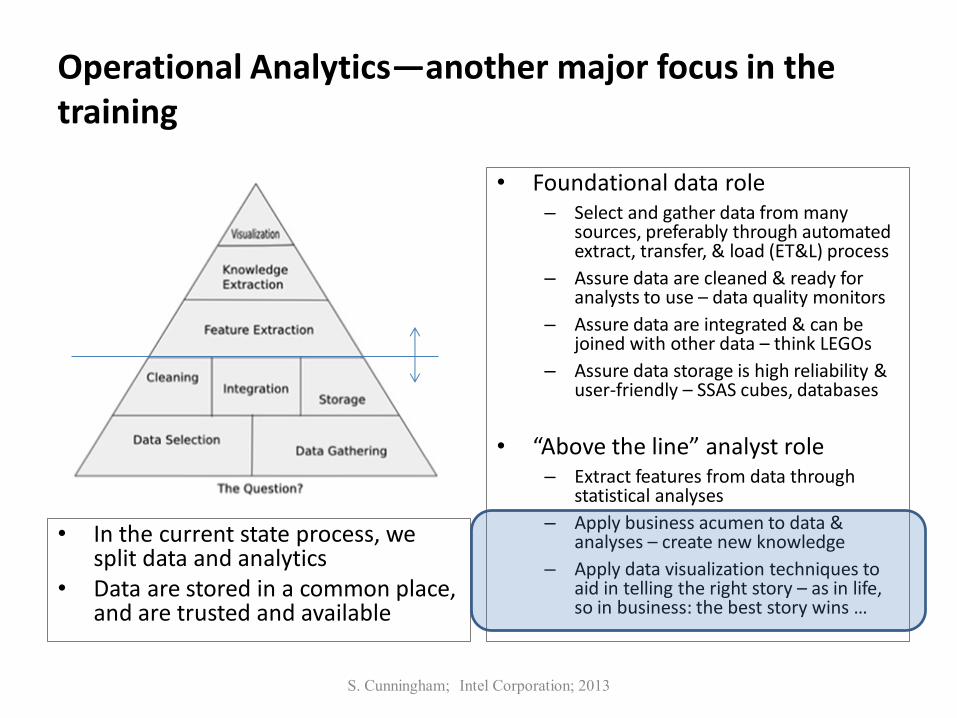
Operational Analytics—another major focus in the training
• In the current state process, we split data and analytics
• Data are stored in a common place, and are trusted and available
• Foundational data role – Select and gather data from many
sources, preferably through automated extract, transfer, & load (ET&L) process
– Assure data are cleaned & ready for analysts to use – data quality monitors
– Assure data are integrated & can be joined with other data – think LEGOs
– Assure data storage is high reliability & user-friendly – SSAS cubes, databases
• “Above the line” analyst role – Extract features from data through
statistical analyses
– Apply business acumen to data & analyses – create new knowledge
– Apply data visualization techniques to aid in telling the right story – as in life, so in business: the best story wins …
S. Cunningham; Intel Corporation; 2013

Great Sponsors in the Greater Columbus Area
Very balanced portfolio of industries, problems, solution approaches
that benefits the group of candidates
Life Sciences,
Health Care &
Social Services
Production, Manufacturing, &
Process Industries
Retail & Food
Processing
Services
Financial &
Other
Transactional
and Shared
Services
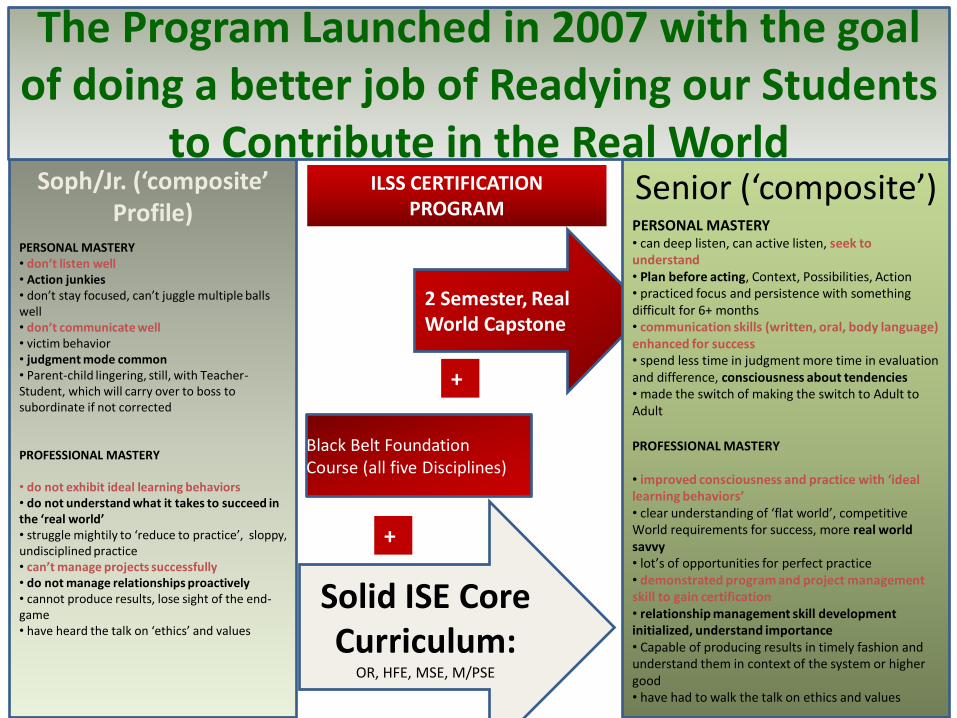
Soph/Jr. (‘composite’ Profile)
PERSONAL MASTERY • don’t listen well • Action junkies • don’t stay focused, can’t juggle multiple balls well • don’t communicate well • victim behavior • judgment mode common • Parent-child lingering, still, with Teacher-Student, which will carry over to boss to subordinate if not corrected PROFESSIONAL MASTERY • do not exhibit ideal learning behaviors • do not understand what it takes to succeed in the ‘real world’ • struggle mightily to ‘reduce to practice’, sloppy, undisciplined practice • can’t manage projects successfully • do not manage relationships proactively • cannot produce results, lose sight of the end-game • have heard the talk on ‘ethics’ and values
Solid ISE Core Curriculum:
OR, HFE, MSE, M/PSE
2 Semester, Real World Capstone
Black Belt Foundation Course (all five Disciplines)
+
ILSS CERTIFICATION PROGRAM
Senior (‘composite’)
PERSONAL MASTERY • can deep listen, can active listen, seek to understand • Plan before acting, Context, Possibilities, Action • practiced focus and persistence with something difficult for 6+ months • communication skills (written, oral, body language) enhanced for success • spend less time in judgment more time in evaluation and difference, consciousness about tendencies • made the switch of making the switch to Adult to Adult
PROFESSIONAL MASTERY • improved consciousness and practice with ‘ideal learning behaviors’ • clear understanding of ‘flat world’, competitive World requirements for success, more real world savvy • lot’s of opportunities for perfect practice • demonstrated program and project management skill to gain certification • relationship management skill development initialized, understand importance • Capable of producing results in timely fashion and understand them in context of the system or higher good • have had to walk the talk on ethics and values
The Program Launched in 2007 with the goal of doing a better job of Readying our Students
to Contribute in the Real World
+
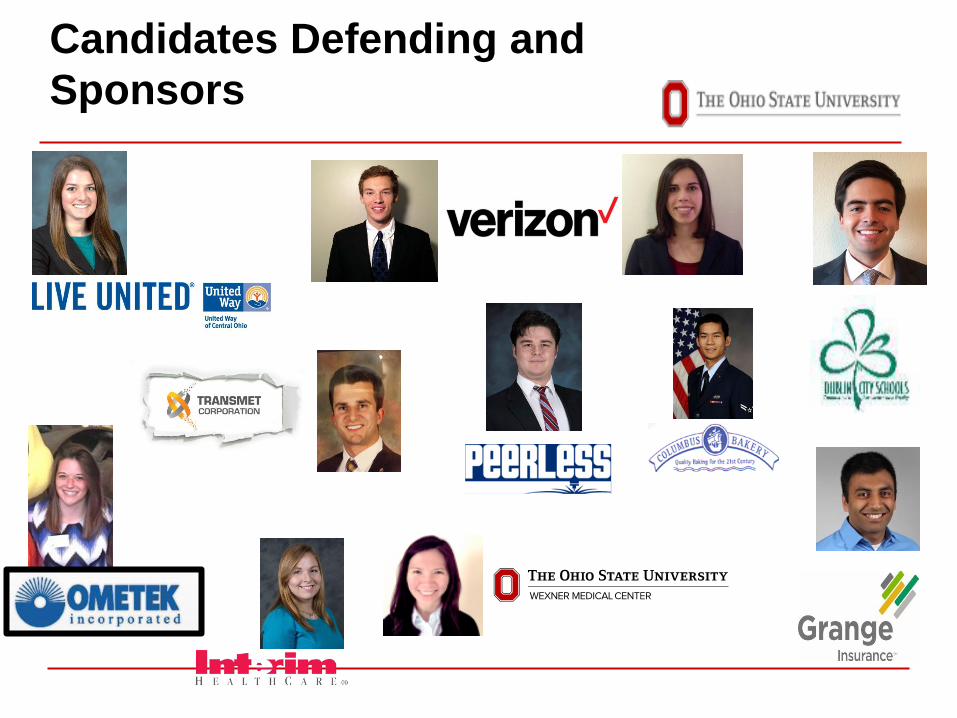
Candidates Defending and
Sponsors

Candidates and
Sponsors for 2017-18

Agenda Highlights
ILSS Certification Program Overview
Case Study Presentations
• Katie Monaghan—Designing, Developing, Testing an Employee
Value Exchange Optimization Program in order to reduce
turnover and capture in excess of $6M in lost revenue each year.
• Daniel Low Pitroff—
• Michael Beardsley

Turnover Reduction
Project
Salo Solutions
Interim Healthcare
Presented 4/26/2017
Project Leader: Katie Monaghan
Mentor: Laura Czuba
Coach: Dr. Scott Sink
IISE Chapter #1 Webinar
(1)
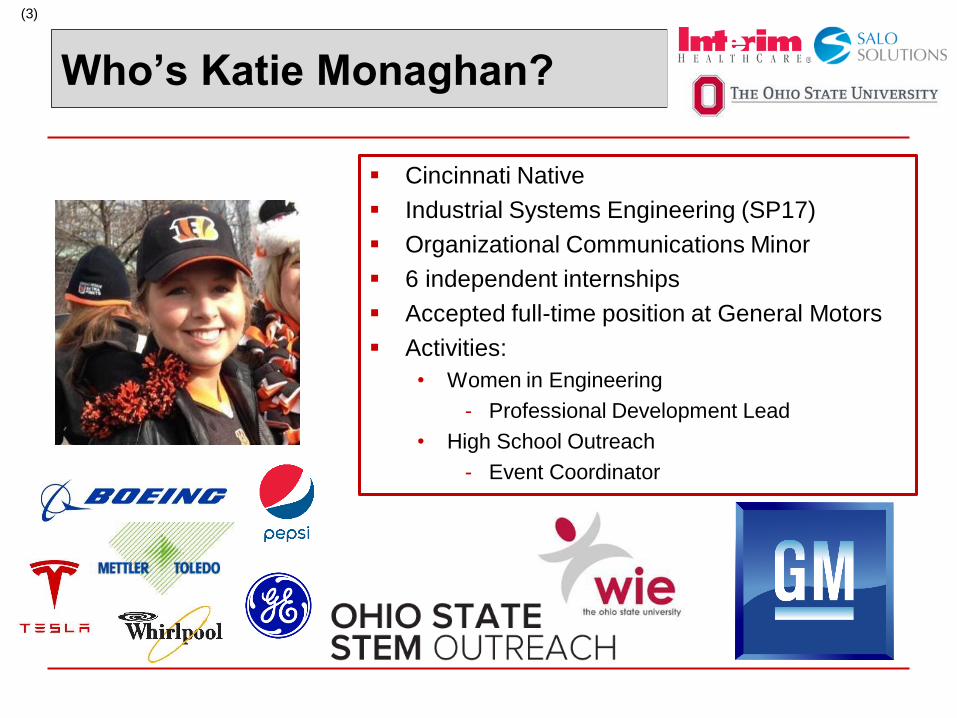
Who’s Katie Monaghan?
Cincinnati Native
Industrial Systems Engineering (SP17)
Organizational Communications Minor
6 independent internships
Accepted full-time position at General Motors
Activities:
• Women in Engineering
- Professional Development Lead
• High School Outreach
- Event Coordinator
(3)

Webinar
Summarize my design for lean sigma project
regarding turnover in the healthcare industry
Meeting Purpose
Gain an understanding of how design for lean
sigma can be applicable in human resources and
the healthcare industry
Objectives
Intro to candidate
Intro my company
What’s at stake?
Business case
Main problem
Why is it this way?
How can we fix it?
Design of Solution
Does it work?
Long Term
Operational Definitions
Immediate next steps
Wrap up
Agenda
(2)

Salo Solutions
Industry leader for at home healthcare services: Home Health
Aides (HHA), Nurses (RN) etc.
5000+ employees across Ohio, Pennsylvania, West Virginia,
Kentucky and Indiana—most in Ohio
64 Midwest Branches under Salo Solutions
Each branch is independently operated
(4)
Interim is the Midwest leader for at-home
HealthCare services
Interim Health Care
TSO Management (60% franchise)
Salo Solutions (Midwest Private Network)
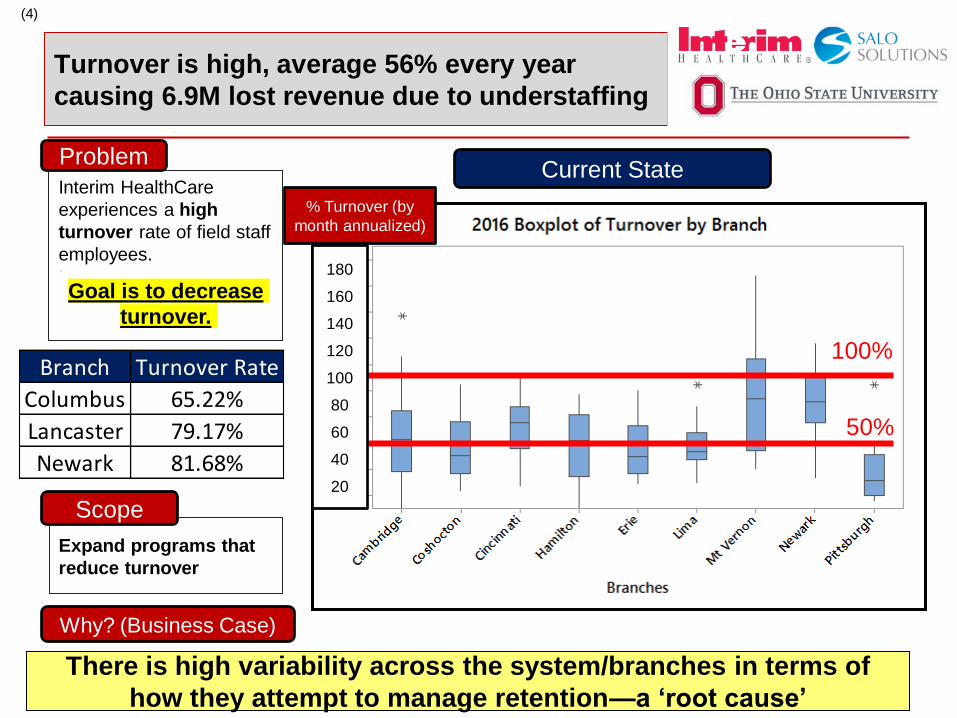
Turnover is high, average 56% every year
causing 6.9M lost revenue due to understaffing
Interim HealthCare
experiences a high
turnover rate of field staff
employees. ,
Goal is to decrease
turnover.
Problem
(4)
Expand programs that
reduce turnover
Scope
There is high variability across the system/branches in terms of
how they attempt to manage retention—a ‘root cause’
Current State
Why? (Business Case)
50%
Branch Turnover Rate
Columbus 65.22%
Lancaster 79.17%
Newark 81.68%
180
160
140
120
100
80
60
40
20
% Turnover (by
month annualized)
100%
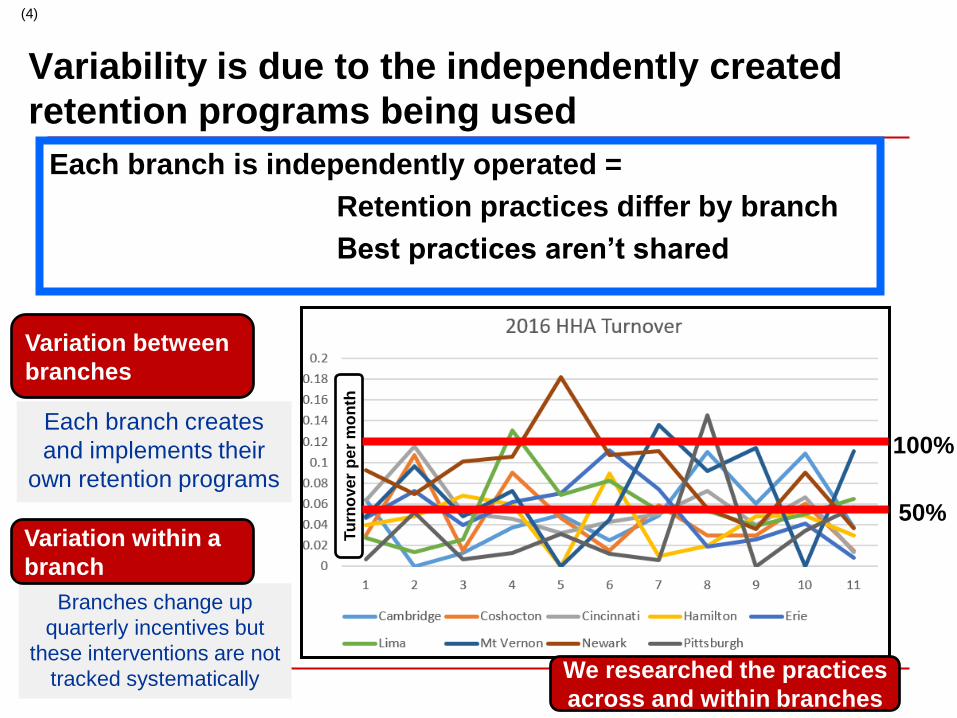
Each branch is independently operated =
Retention practices differ by branch
Best practices aren’t shared
(4)
Variability is due to the independently created
retention programs being used
Each branch creates
and implements their
own retention programs
We researched the practices
across and within branches
Tu
rno
ve
r p
er
mo
nth
100%
50%
Branches change up
quarterly incentives but
these interventions are not
tracked systematically
Variation between
branches
Variation within a
branch

Points programs are top category
in long term retention
Attracting New
Employees
The largest contributing
factors by lifecycle are:
Ease New Hires
into the Company
and the Positon
Long Term
Retention
Decide to work for
Home Health Care
Activities #1-3 Lifecycle of an
Employee
Pick Interim
Onboarding
Adjustment Period (1yr)
Decide to continue
working for Interim
Gas Reimbursement
Sign on bonus
Free CPR Training
Cell phone Peer mentor
Welcome kit for new hires
Shadow another employee
Points Programs
Anniversary Birthday
Cards/Gifts
Free CPR training
Data for Future Projects
Scope of my Project
For each activity, participants were given a set of factors that contribute to each of these
figures and asked to rank them on impact

Most impactful programs: Points
Program, No Call Off, Longevity Bonus,
Birthday & Gatherings
Find Effect
Slope
represents
decrease
in turnover
Seasonal Gatherings
Points Program
Birthday Gift
No Call Off
Longevity Bonus
These 5 Programs… 1. Have the most impact in turnover, if the program
exists, less turnover, if not, higher turnover.
2. And we have enough data to make us 80%
confident in that impact
Test Significance
How confident
we are of that
impact

ROI
Contribution
Potential Revenue
Returns
($)
Investments
($)
Investment 1
Investment 2
Investment 3
Investment 4
Etc.
VALUE
EXCHANGE
‘Smart’ Investments in the development of consistent programs in these
five areas have shown to positively impact retention.
Investment in these
programs
Returns in
value added
activities to
the company
Practical Significance to Less Turnover
How can we
extract value from
this information?
Implementation of variations
of these 5 programs are
shown to decrease turnover
ProgramsImpact on
Turnover
Points Program 15.5%
Seasonal Gatherings 15.1%
Anniversary/Birthday 10.8%
Longevity Bonus 9.5%
No Call Off 9.0%

Points program is the best
route to move forward
Why?
1. Already has a positive impact on the
branches
2. We can incorporate other programs known to
decrease turnover
3. Customizable by branch
How do we create a points program?
Points Program
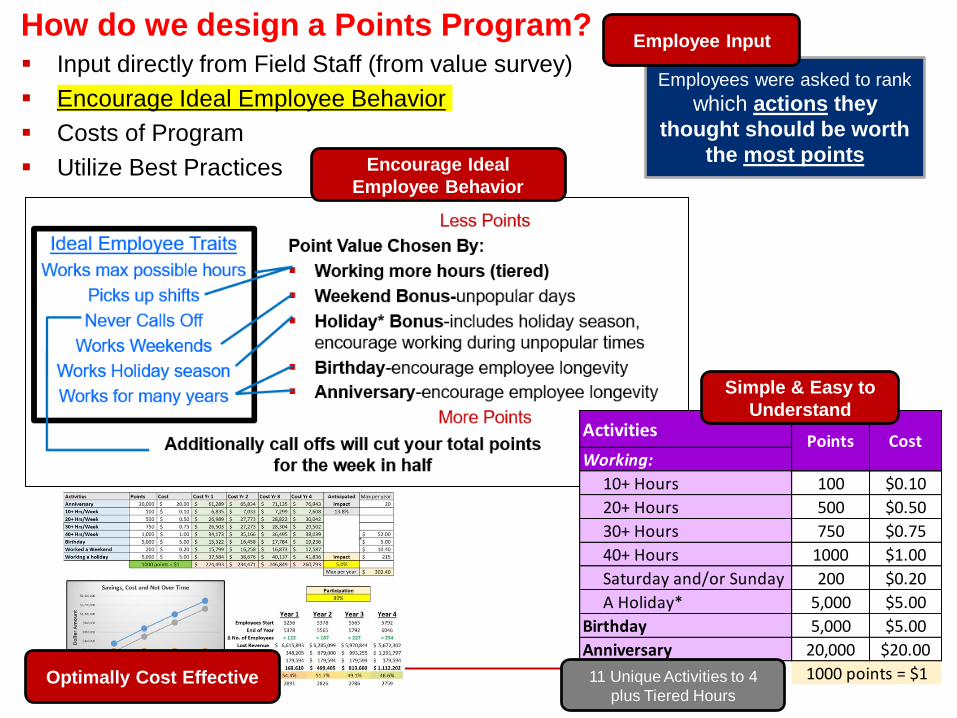
How do we design a Points Program? Input directly from Field Staff (from value survey)
Encourage Ideal Employee Behavior
Costs of Program
Utilize Best Practices
Employees were asked to rank
which actions they
thought should be worth
the most points
Activities
Working:
10+ Hours 100 $0.10
20+ Hours 500 $0.50
30+ Hours 750 $0.75
40+ Hours 1000 $1.00
Saturday and/or Sunday 200 $0.20
A Holiday* 5,000 $5.00
Birthday 5,000 $5.00
Anniversary 20,000 $20.00
Points Cost
1000 points = $1
Simple & Easy to
Understand
11 Unique Activities to 4
plus Tiered Hours
Employee Input
Encourage Ideal
Employee Behavior
Optimally Cost Effective
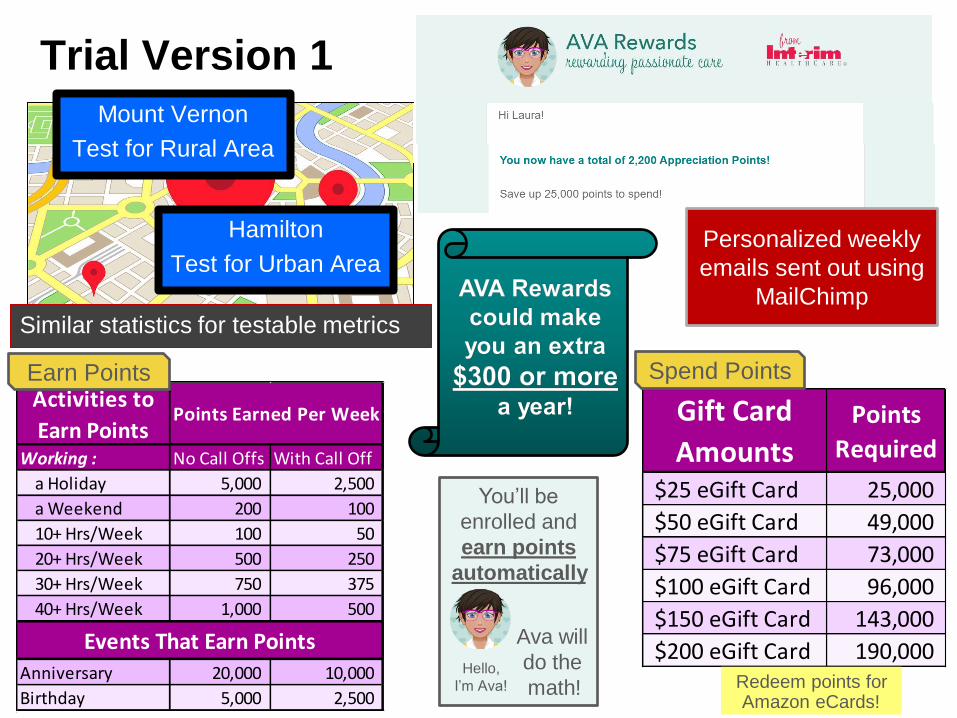
Trial Version 1
Mount Vernon
Test for Rural Area
Hamilton
Test for Urban Area
Similar statistics for testable metrics
Working : No Call Offs With Call Off
a Holiday 5,000 2,500
a Weekend 200 100
10+ Hrs/Week 100 50
20+ Hrs/Week 500 250
30+ Hrs/Week 750 375
40+ Hrs/Week 1,000 500
Anniversary 20,000 10,000
Birthday 5,000 2,500
Events That Earn Points
Activities to
Earn PointsPoints Earned Per Week Gift Card
Amounts
Points
Required
$25 eGift Card 25,000
$50 eGift Card 49,000
$75 eGift Card 73,000
$100 eGift Card 96,000
$150 eGift Card 143,000
$200 eGift Card 190,000
Earn Points Spend Points
You’ll be
enrolled and
earn points
automatically
.
Ava will
do the.
math!. Hello,
I’m Ava! Redeem points for Amazon eCards!
Personalized weekly
emails sent out using
MailChimp

Timeline: Trial implemented and
gathering data
First Hours
turned in
Onsite Feedback
Event 4/4 and 4/6
April
Communication
to Employees
AVA is
LIVE!
These events
gage interest and
gather feedback Feedback Phone
calls to interested
employees 14-18
First Weekly
Email Sent
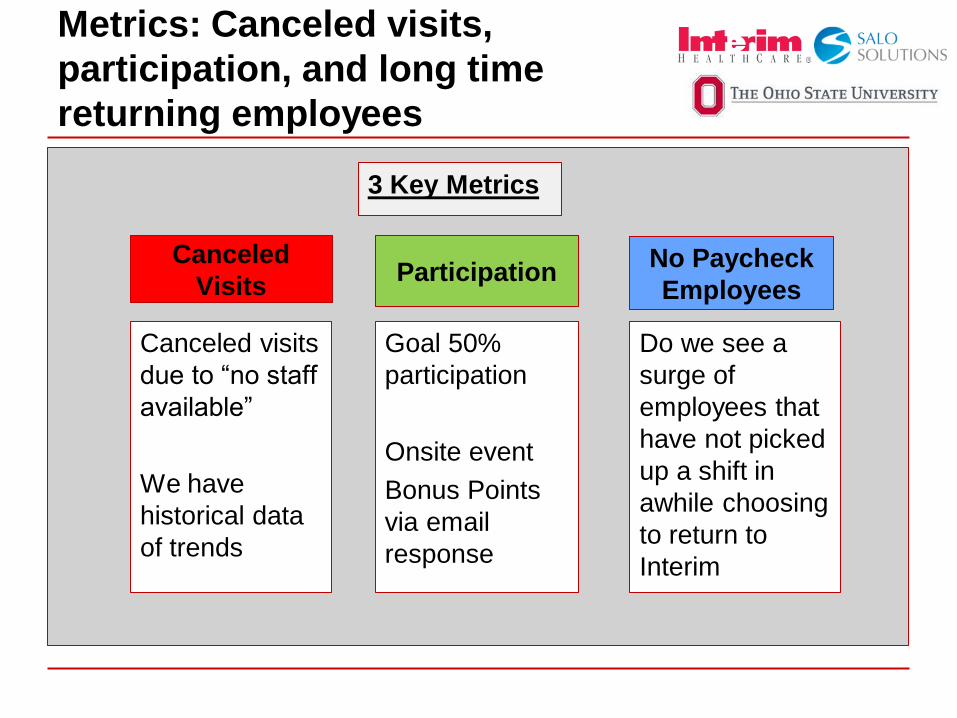
Metrics: Canceled visits,
participation, and long time
returning employees
3 Key Metrics
Canceled
Visits Participation
No Paycheck
Employees
Canceled visits
due to “no staff
available”
We have
historical data
of trends
Goal 50%
participation
Onsite event
Bonus Points
via email
response
Do we see a
surge of
employees that
have not picked
up a shift in
awhile choosing
to return to
Interim

Across all segmentations,
participation in program is
extremely higher that expected.
(7)
Participation-extremely high on all
employee segmentation calculated ~60%
Of those opening emails, 60% of
them have opened 3 or more!
65 65 79
40
0%
10%
20%
30%
40%
50%
60%
70%
80%
90%
100%
HHA Not HHA HHA Not HHA
HAM MTV
Branch and Skill
Not Open
Opening
62 67 75 62 59
0%
10%
20%
30%
40%
50%
60%
70%
80%
90%
100%
0-1 1-3 3-5 5-10 10+
Tenure with Interim
Not Open
Opening
Extremely high!!
Goal was 30-50%
Branch
Discipline
Skill
Tenure
Age
0%
10%
20%
30%
40%
50%
60%
70%
80%
90%
100%
0%
5%
10%
15%
20%
25%
30%
35%
40%
45%
50%
1 2 3 4 5 6
Number of Emails Opened
Open Exactly Cumulative
(7)
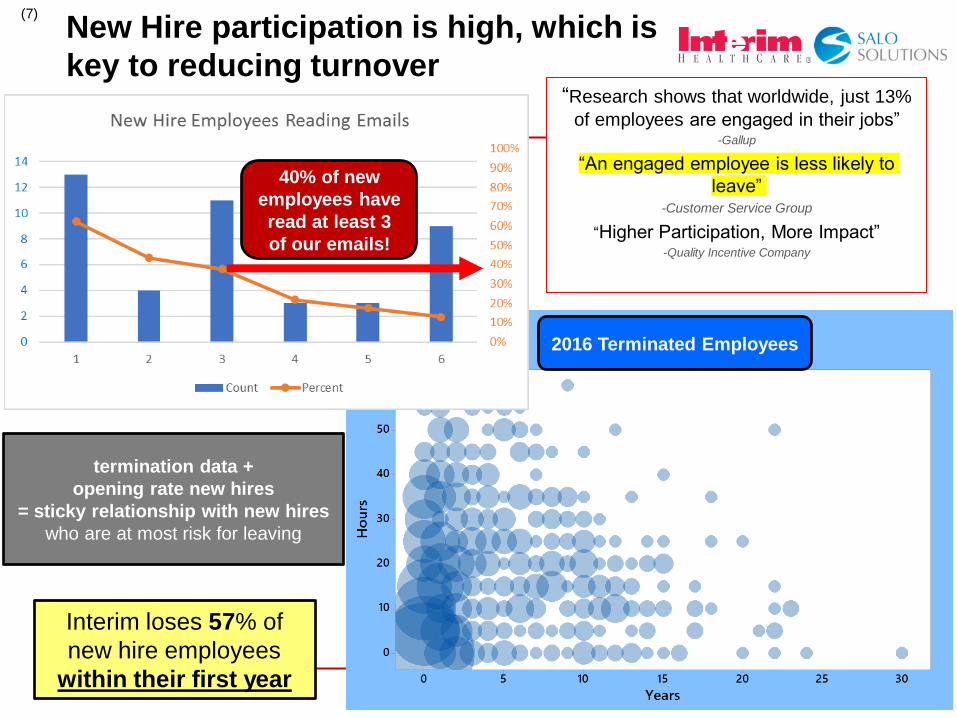
New Hire participation is high, which is
key to reducing turnover “Research shows that worldwide, just 13%
of employees are engaged in their jobs” -Gallup
“An engaged employee is less likely to
leave” -Customer Service Group
“Higher Participation, More Impact” -Quality Incentive Company
40% of new
employees have
read at least 3
of our emails!
termination data +
opening rate new hires
= sticky relationship with new hires
who are at most risk for leaving
Interim loses 57% of
new hire employees
within their first year
2016 Terminated Employees
(7)
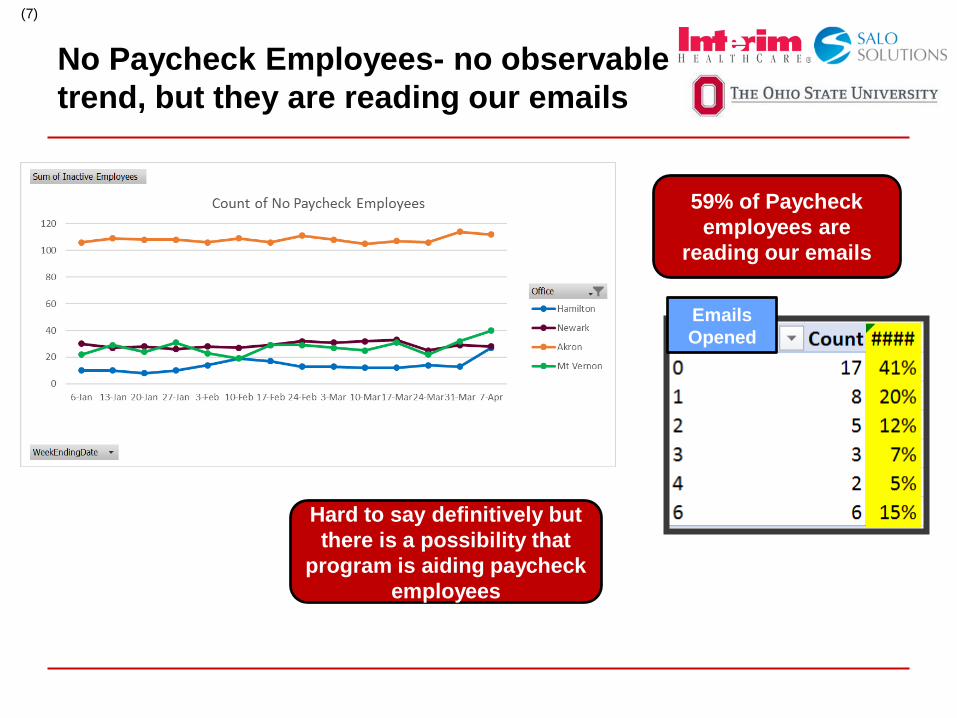
No Paycheck Employees- no observable
trend, but they are reading our emails
Hard to say definitively but
there is a possibility that
program is aiding paycheck
employees
59% of Paycheck
employees are
reading our emails
Emails
Opened
0
50
100
150
200
250
300
Jan Feb Mar Apr May Jun Jul Aug Sep Oct Nov Dec Jan Feb Mar Apr
2016 2017
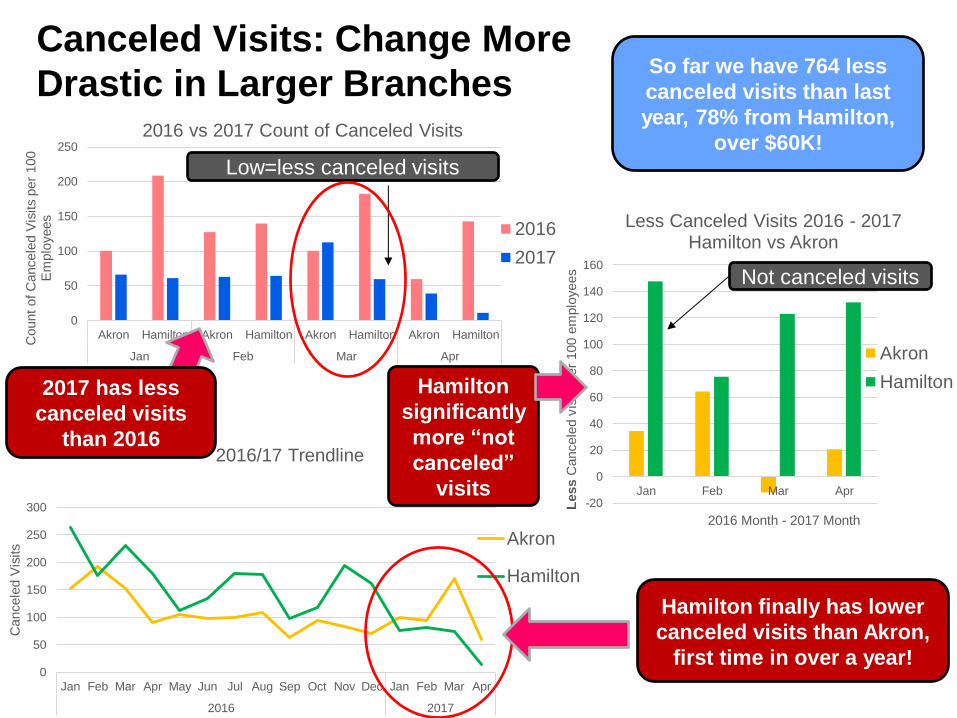
Cancele
d V
isits
2016/17 Trendline
Akron
Hamilton
Canceled Visits: Change More
Drastic in Larger Branches
0
50
100
150
200
250
Akron Hamilton Akron Hamilton Akron Hamilton Akron Hamilton
Jan Feb Mar Apr
Count
of C
ancele
d V
isits p
er
100
Em
plo
yees
2016 vs 2017 Count of Canceled Visits
2016
2017
So far we have 764 less
canceled visits than last
year, 78% from Hamilton,
over $60K!
-20
0
20
40
60
80
100
120
140
160
Jan Feb Mar Apr
Less C
ancele
d v
isits p
er
100 e
mplo
yees
2016 Month - 2017 Month
Less Canceled Visits 2016 - 2017 Hamilton vs Akron
Akron
HamiltonHamilton
significantly
more “not
canceled”
visits
Hamilton finally has lower
canceled visits than Akron,
first time in over a year!
Low=less canceled visits
Not canceled visits
2017 has less
canceled visits
than 2016

Scheduler feedback-easier to
get people to pick up shifts “Scheduling is A LOT easier, people seem eager to pick up more hours especially
since we posted up the hours on the wall. Competition increased and people are
trying to beat their friends” -Mandy HHA Scheduler Mt. Vernon
More hours trending upward
starting the 4th!

“Awesome idea because everybody wants to be appreciated and in this
industry we don’t get that much pay or benefits compared to other places”
“Excited about it! It’s a really good way incentive. Its really positive watching
my points go up!”
Motivational Incentive Appreciative
“Inspiring—excellent motivation. Any incentive makes our jobs more enjoyable.”
“It makes a person think “wow they really care about me” ”
“I was talking to another employee and telling them they have to hop on the
portal l and check it out! I love that I can get amazon gift cards”
“I love how simple it is to understand”
(7)
Employee feedback-
overwhelmingly positive!

Is it achieving our goals as an appreciation
program for our employees? Employees extremely receptive which is key for long term retention
benefits.
Short term metrics support long term
retention? Participation extremely promising across all segments-engaged
employees stick with their company
(7)
Trial achieved our two main
objectives

Logical Next Steps
Step One: Do we want to continue to expand AVA Rewards to all offices?
Step Two: What are we changing about the program?
Make changes/transition to AVA Rewards version 2
Step Three: Rewards Fulfillment options
Step Four: Implementation Planning: Who, What, When?
Implement in all offices
Step Five: Analyze Responses (Plan Do CheckAct cycle)
(7)
Next Steps include managerial decision
to roll out to other branches

Completed:
• By analyzing the data, it was determined that a points program would
yield the greatest cost/benefit
• Data collected from employee input and ideal employee behavior along
with cost was used to create program with high perceived value
• A trial is currently in progress at Mt. Vernon and Hamilton offices
• Data supports short term metrics that program will encourage long
term turnover reduction.
Do you have any questions?
Special thanks to Salo Solutions and Dr. Sink for the
opportunity to work on this project!
Questions?
(7)
Recap
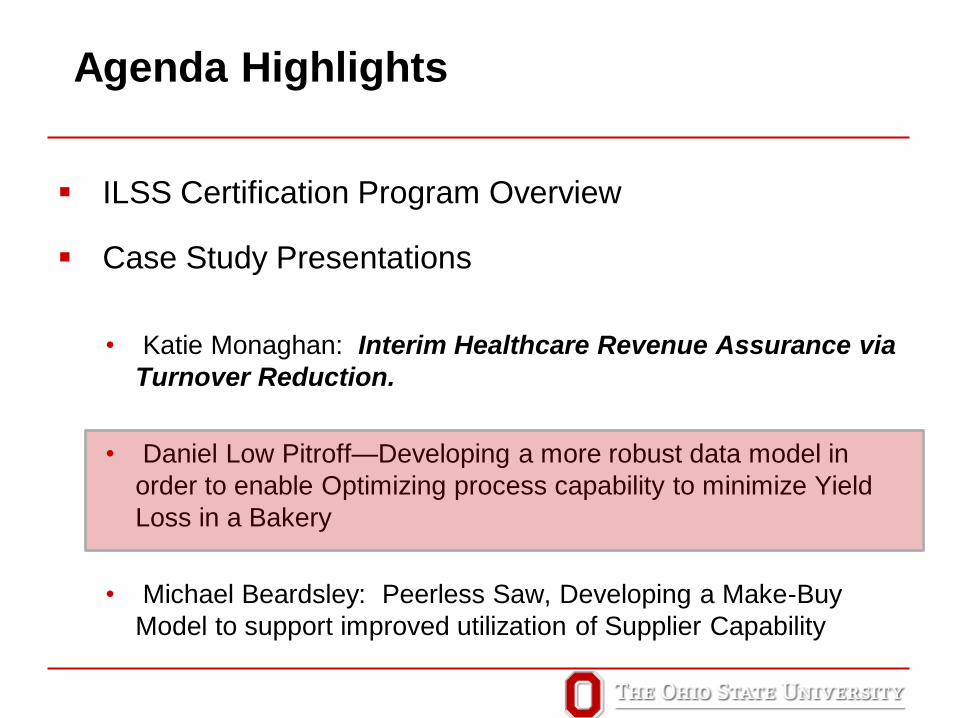
Agenda Highlights
ILSS Certification Program Overview
Case Study Presentations
• Katie Monaghan: Interim Healthcare Revenue Assurance via
Turnover Reduction.
• Daniel Low Pitroff—Developing a more robust data model in
order to enable Optimizing process capability to minimize Yield
Loss in a Bakery
• Michael Beardsley: Peerless Saw, Developing a Make-Buy
Model to support improved utilization of Supplier Capability
Engineering
Process Maturity
Level Five Using
Macros in Excel
and Minitab

Hello! I am Daniel Low-Pitroff
I am here to talk about how I
used macros in Excel and
Minitab to reduce cookie
over-pack at the Columbus
Bakery
40

▸ Executive Summary
▸ Current State Process
▸ Conducting the DoE
▸ Setbacks and the Pivot
▸ Concurrent Methodologies
▸ Process Re-Engineering
▸ Data Collection and Optimization
▸ Final Results
Appendix
Meeting Agenda
41
Objective: Review what has been accomplished throughout the course
of this project.
Executive
Summary What, Why, and How

Using both the DMAIC and DCDOV
methodologies, I was able to reduce cookie
package weights
43
• Short-term reduction of cookie package weights (mean) by 13 grams (about 2 cookies)
• Long-term plan to optimize cookie weights and reduce variation
WHAT
• Resulting in savings of $34,500 in the amount of dollars lost due to over-pack
• And, demonstrate capability to do this and then expand to other lines
WHY
• Short-term: Process re-engineering to improve detection of high cookie weights upstream
• Long-term: Data collection and analysis tool allowing for optimization of cookie weights once data has been collected
HOW
Current State
Process How the process works and performs

I was tasked to reduce variation, shift the mean left and
have no pack weights below the Lower Bound (the
government requirement)
45
Current Stats
• Overfill Rate: 95%
• Underfill Rate: 0.2%
• Mean: 390 grams
• St. Dev.: 12.5 grams
Targeted Stats
• Overfill Rate: 74.4%
• Underfill Rate: 0.2%
• Mean: Shifted over 15
grams
• St. Dev.: Approximately
5.5 gram reduction (44%)
DONE is this
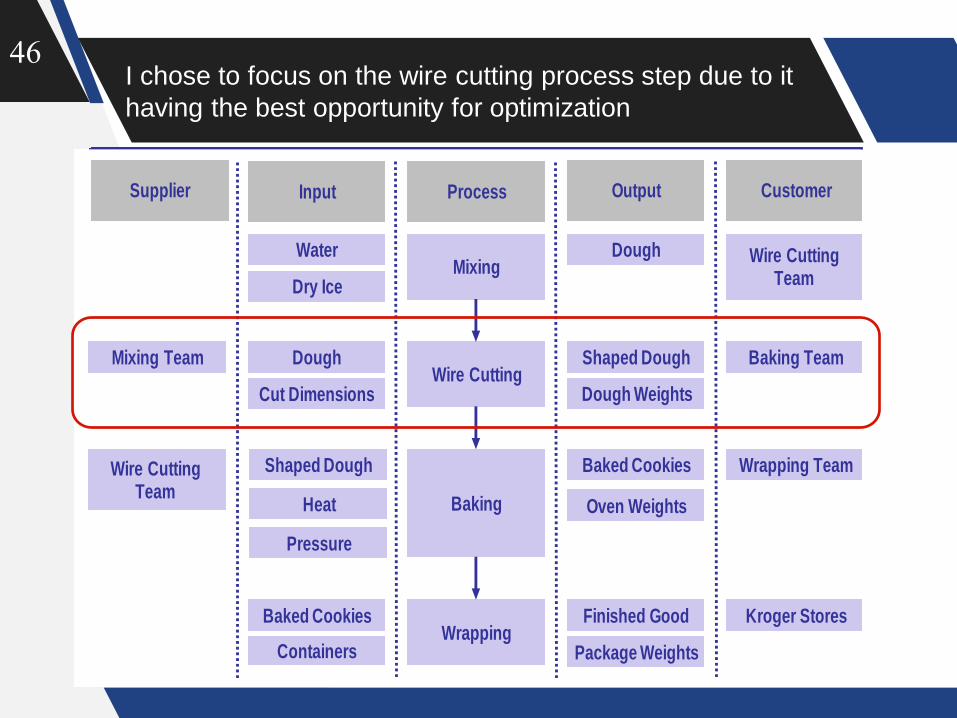
I chose to focus on the wire cutting process step due to it
having the best opportunity for optimization
46
Supplier Input Process Output Customer
Mixing
Wire Cutting
Baking
Wrapping
Dough
Shaped Dough
Wire Cutting Team
Baking Team
Wire Cutting Team
Dry Ice
Water
Dough
Pressure
Shaped Dough
Mixing Team
Cut Dimensions
Wrapping Team
Kroger StoresFinished Good
Baked Cookies
Heat
Baked Cookies
Containers Package Weights
Dough Weights
Oven Weights
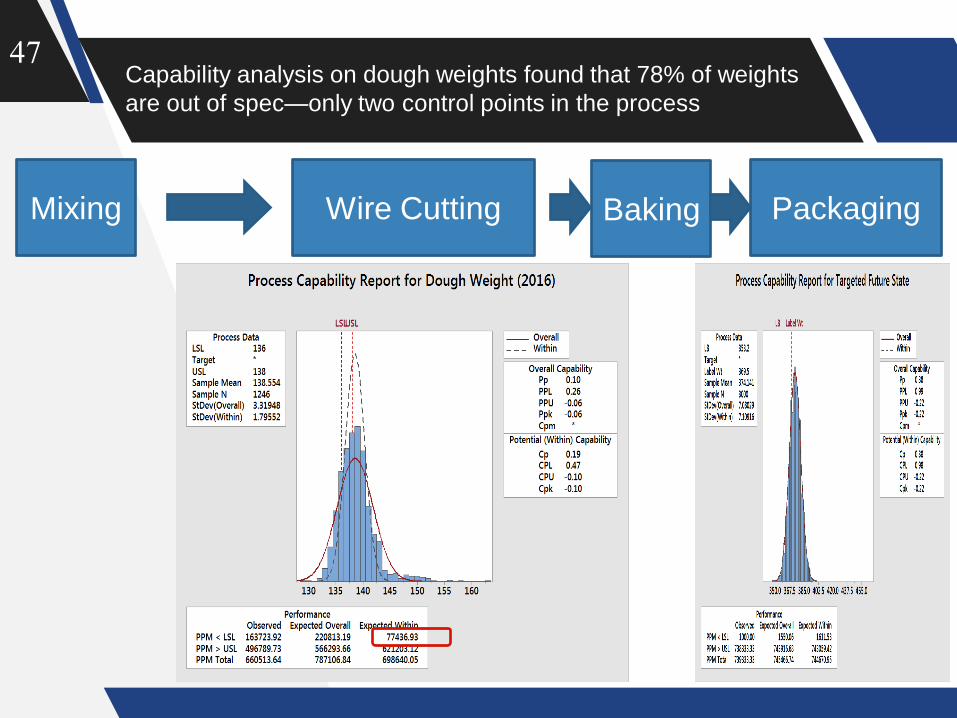
Capability analysis on dough weights found that 78% of weights
are out of spec—only two control points in the process
47
Mixing Wire Cutting Packaging Baking
Performing the
DoE Factor screening and DoE results

SMEs were leveraged to understand what factors might
be contributing the most to variability in dough weights
49
Potential Factors for Screening
DoE
Description
Dough Rest Time How long the dough has been
resting
Dough Temperature The temperature of the dough
Cylinder RPM Settings The settings of the cut machine
Wire Cut Speed The settings of the cut machine
Ambient Plant Temperature The plant environment
Plant Humidity The plant environment
We found:
• No correlation between humidity and dough weights
• Wire cut speed is not adjustable in the present system design

Three factor levels were chosen on the day of the DoE
because I did not have direct control over them
50
Metric Lower
Level
Upper
Level
Units Operational Definition
Plant
Temp
75 77 Fahrenheit Ambient temperature at
wire cut machine using
a calibrated
thermometer, +/- 0..5
degrees
Dough
Temp
72 74 Fahrenheit Using a calibrated
infrared thermometer,
+/- 0.5 degrees
Dough
Rest Time
30 70 Minutes Timed from arrival of
dough to “on deck”
station to sample time
(with 14 minutes
assumed for dough to
arrive once dumped)
Cylinder
RPM
2.95 3.10 RPM Ensure both sides of the
feed roll is set to the
proper setting

Research led me to believe that temperature was an
important factor, but that was not found in the DoE
51
This was a major
learning point for me in
terms of data modeling
and DOE Concept
Design—I made a
major logic error at this
point.

Setbacks and the
Pivot Transition into DCDOV

After receiving coaching, I realized that plant
temperature was incorrectly modeled in the DoE
53
• The levels chosen for plant temperature represented a very small segment of possible
temperatures as you can see below
• As such, it was determined that a “historical DoE” or regression would need to be used to truly
optimize dough weights
• In essence, my focus shifted from doing a snapshot DOE to creating a data model that would
support ongoing and dynamic analytics by getting more data and pairing it consistently

I wanted to verify that plant temperature was creating
variability in the process so I created the plot below
54
USL
LSL
Target
Less Variation?
Research and
experience
have shown
that
temperature
and humidity
are big
factors in the
baking
process.

A t-test was conducted to verify the hypothesis that dough
weights were less variable at lower temperatures
55
“
”
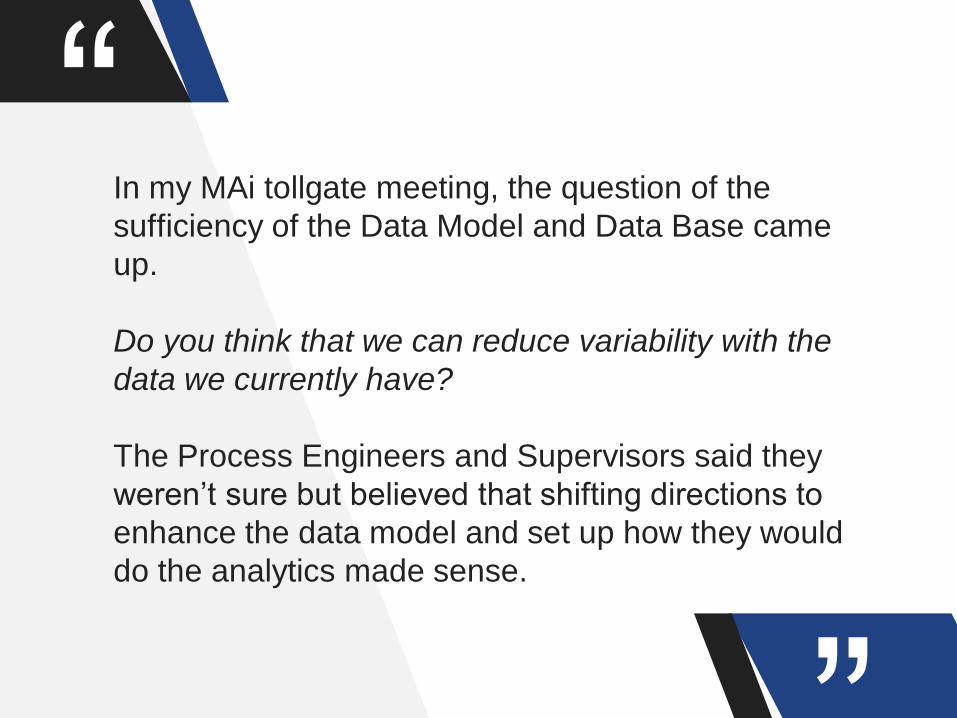
In my MAi tollgate meeting, the question of the
sufficiency of the Data Model and Data Base came
up.
Do you think that we can reduce variability with the
data we currently have?
The Process Engineers and Supervisors said they
weren’t sure but believed that shifting directions to
enhance the data model and set up how they would
do the analytics made sense.

Concurrent
Methodologies How we reduced cookie over-pack in the
short and long-term

After receiving more coaching from my coach, I decided to
split the rest of my work into two concurrent tracks
58
Process Re-
Engineering
We are here
DMAi:
Improve
performance
in the short-
term
Excel and
Minitab Macros
CDOv:
Create
sustainable
long-term
performance
1
2
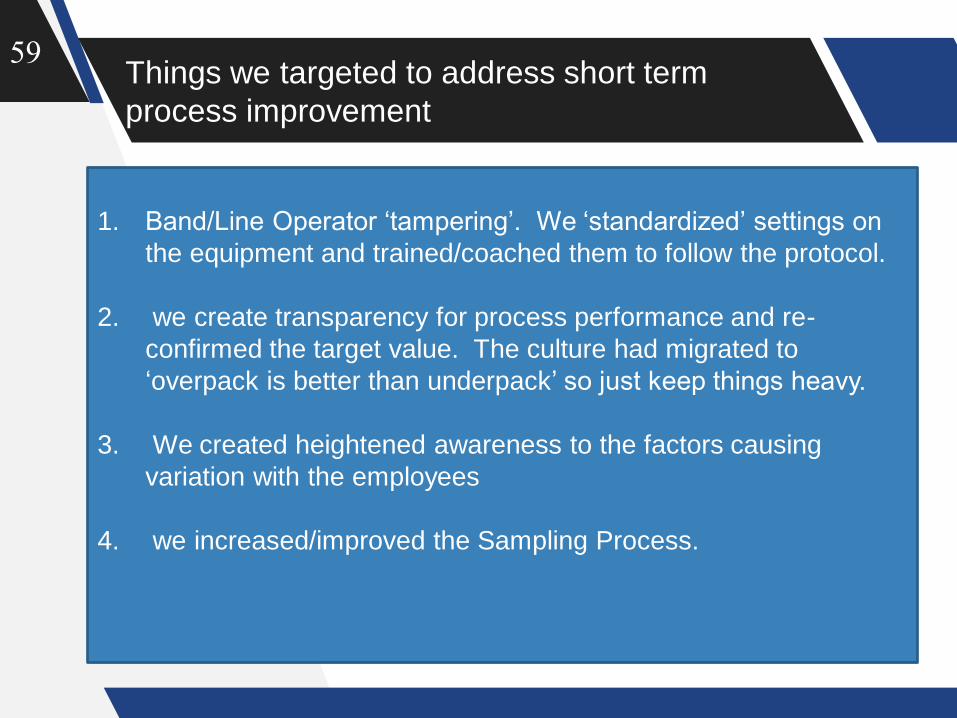
Things we targeted to address short term
process improvement
59
1. Band/Line Operator ‘tampering’. We ‘standardized’ settings on
the equipment and trained/coached them to follow the protocol.
2. we create transparency for process performance and re-
confirmed the target value. The culture had migrated to
‘overpack is better than underpack’ so just keep things heavy.
3. We created heightened awareness to the factors causing
variation with the employees
4. we increased/improved the Sampling Process.
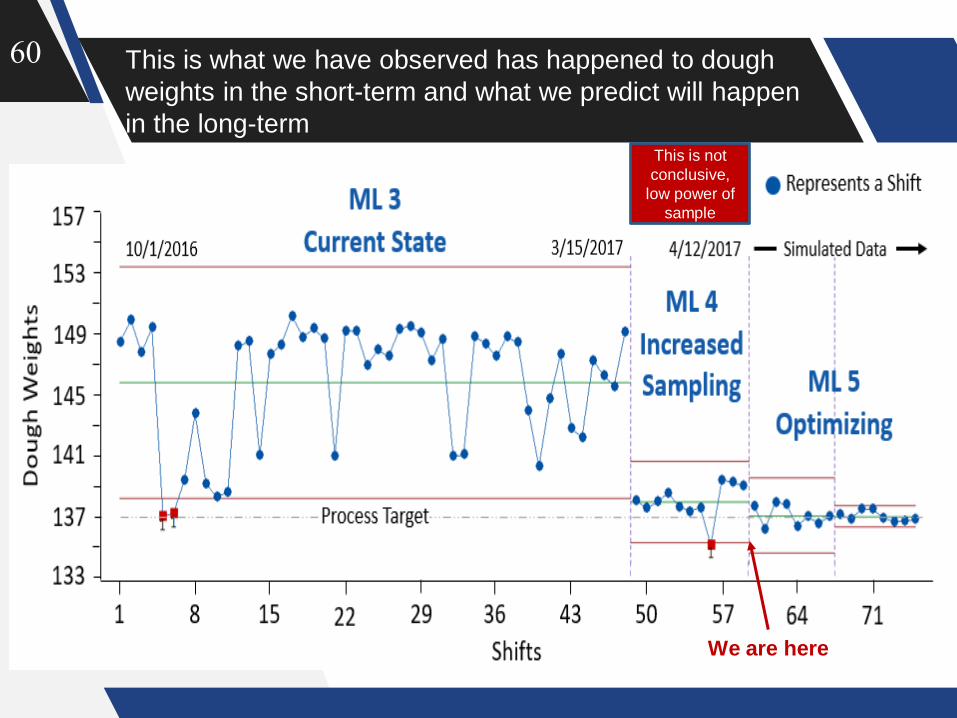
This is what we have observed has happened to dough
weights in the short-term and what we predict will happen
in the long-term
60
We are here
This is not
conclusive,
low power of
sample

Process Re-
Engineering Moving the needle in the short-term

I used FMEA and observation of each operator to
develop suggested improvements
62
High Benefit (1)
1. Create data analysis tool
(complete)
2. Train operators to try and hit
specs rather than run heavy
3. Post charts on operator/shift
performance
4. Recalculate new specs based on
bake-off
5. Test different spec limits for each
SKU
6. Purchase a freezer and freeze
dough before dumps
7. Take dough weights more
frequently (complete)
(2)
(3)
(6)
(5)
(7)
High Effort/Cost

Data Collection
and Optimization Using VBA to improve data collection and
analysis to enable future optimization
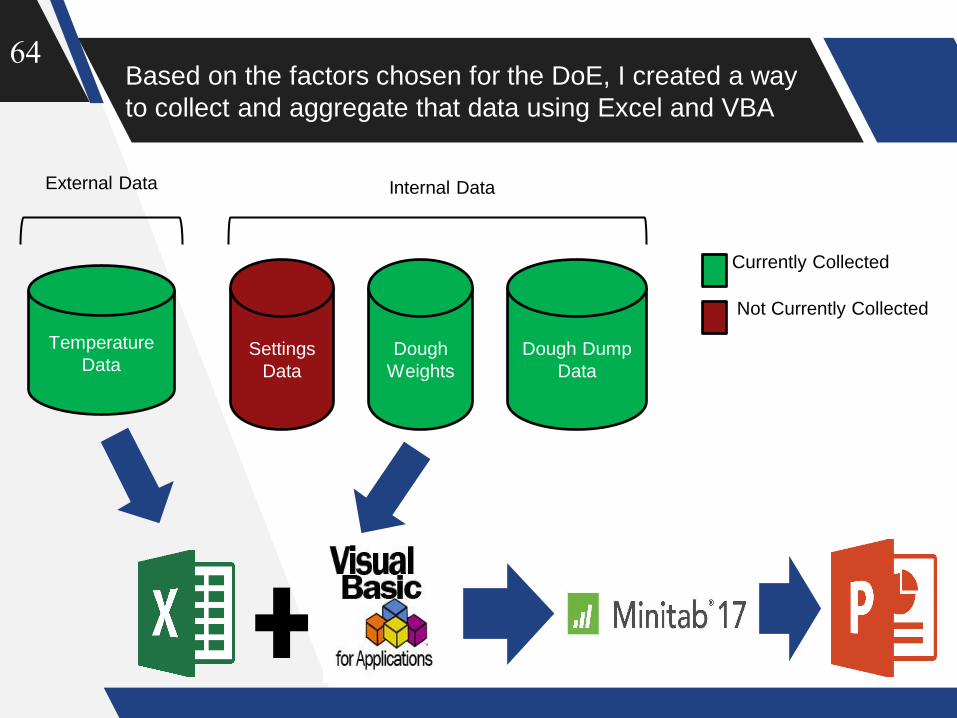
Based on the factors chosen for the DoE, I created a way
to collect and aggregate that data using Excel and VBA
64
Temperature
Data Settings
Data
Dough
Weights
Dough Dump
Data
External Data Internal Data
Currently Collected
Not Currently Collected

The tool enables users to input, aggregate, and filter collected data then
conduct automatic Minitab analysis that exports to a PowerPoint
65
Intended Benefits
• Enables scaling of
analysis across SKUs
• Collection of data into
one location for
optimization
• Save time on
conducting analysis
Final Results What are the short-term benefits
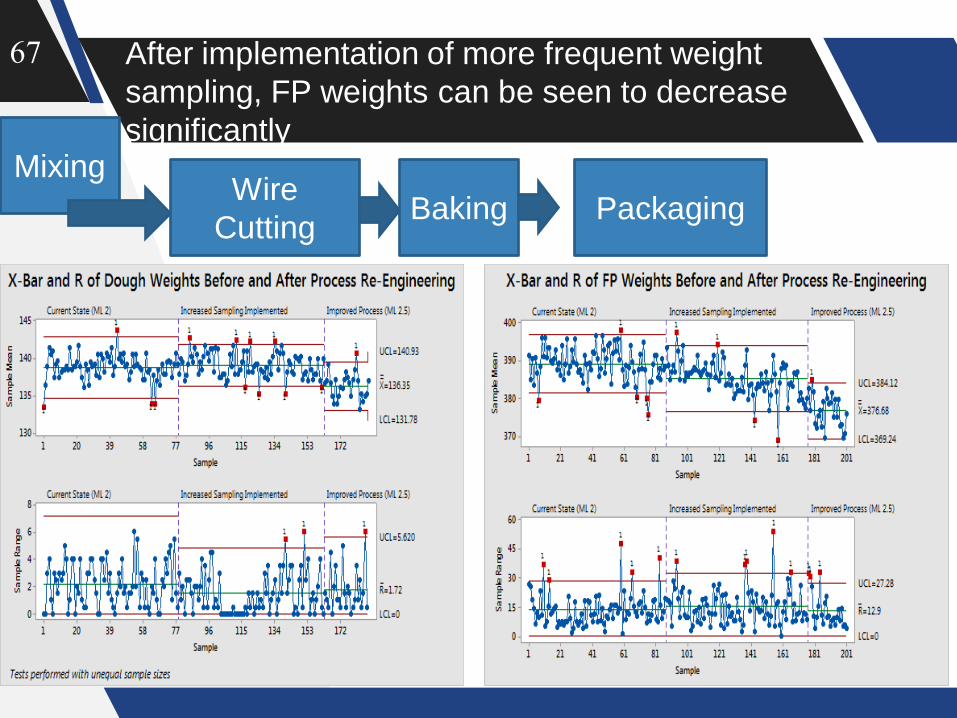
After implementation of more frequent weight
sampling, FP weights can be seen to decrease
significantly
67
Mixing Wire
Cutting Packaging Baking

68
THANKS! What questions do you have?

Agenda Highlights
ILSS Certification Program Overview
Case Study Presentations
• Katie Monaghan: Interim Healthcare Revenue Assurance via
Turnover Reduction.
• Daniel Low Pitroff: Kroger Bakery Yield Loss Reduction
(minimize overpack) via Enhanced Data Model to drive process
to Process Maturity Level 5
• Michael Beardsley—Designing and Developing a Model
to support dynamic make/buy decisions and to tap into full
capabilities of our key supplier. Peerless Saw
Peerless Saw Make/Buy Strategy
Improvement
ILSS Green Belt Candidate – Michael Beardsley, OSU
Coach - Dr. Scott Sink, ILSS Program Director, OSU
Sponsor – Tim Gase, President, Peerless Saw
4/26/2017 70
“This Project will be a ‘game breaker’ for us in the next couple of years.”
President, Peerless

Agenda
• Purpose: To share a case study that demonstrates the application of
ISE and ILSS Principles, Methods and Tools and that created
significant value for our Sponsor.
• Agenda:
– About Peerless Saw and the Value Stream being Improved
– Future State Vision—What was possible?
– Current State of the Value Stream and Opportunity
– What was the performance gap and why did it exist?
– The Solution—how we closed the gap, Pilot Results
– Rollout and Full Potential Performance
4/26/2017 71
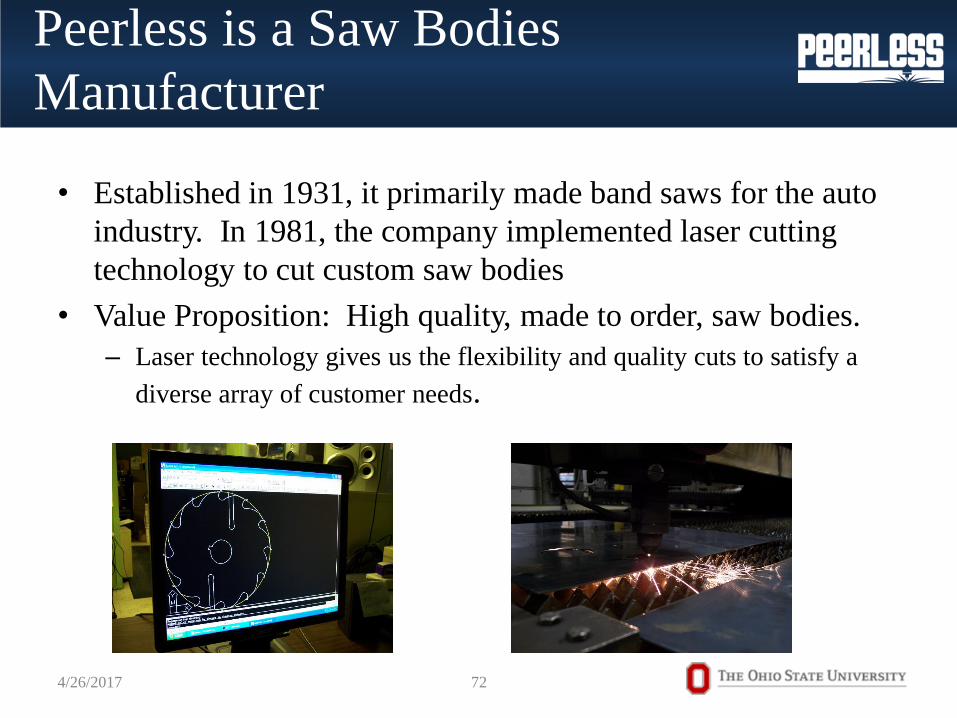
Peerless is a Saw Bodies
Manufacturer
• Established in 1931, it primarily made band saws for the auto
industry. In 1981, the company implemented laser cutting
technology to cut custom saw bodies
• Value Proposition: High quality, made to order, saw bodies.
– Laser technology gives us the flexibility and quality cuts to satisfy a
diverse array of customer needs.
4/26/2017 72
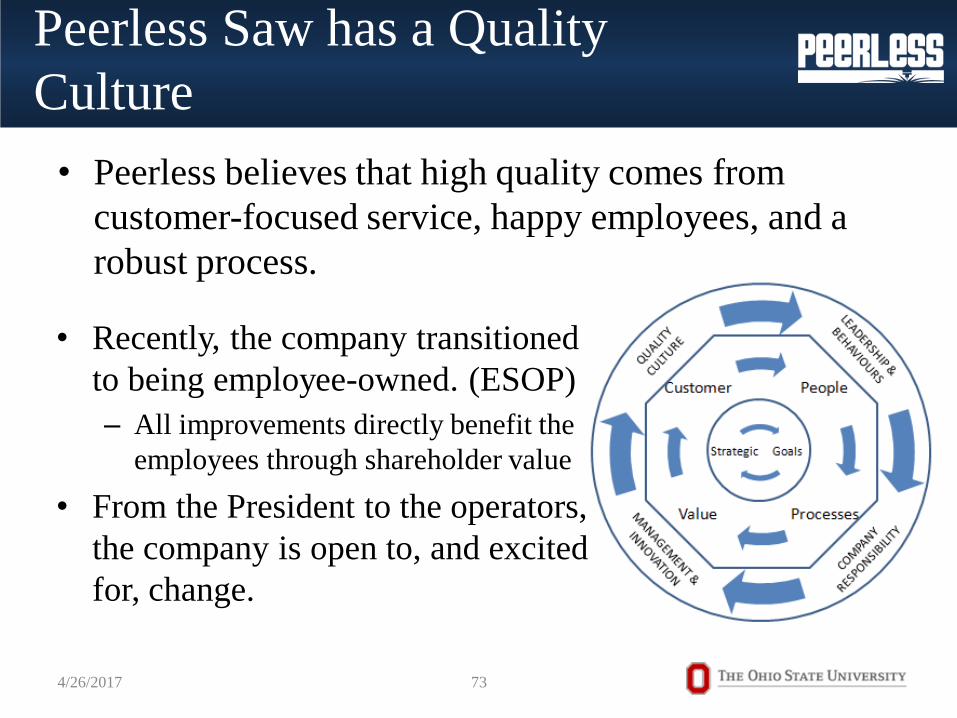
Peerless Saw has a Quality
Culture
• Peerless believes that high quality comes from
customer-focused service, happy employees, and a
robust process.
• Recently, the company transitioned
to being employee-owned. (ESOP)
– All improvements directly benefit the
employees through shareholder value
• From the President to the operators,
the company is open to, and excited
for, change.
4/26/2017 73
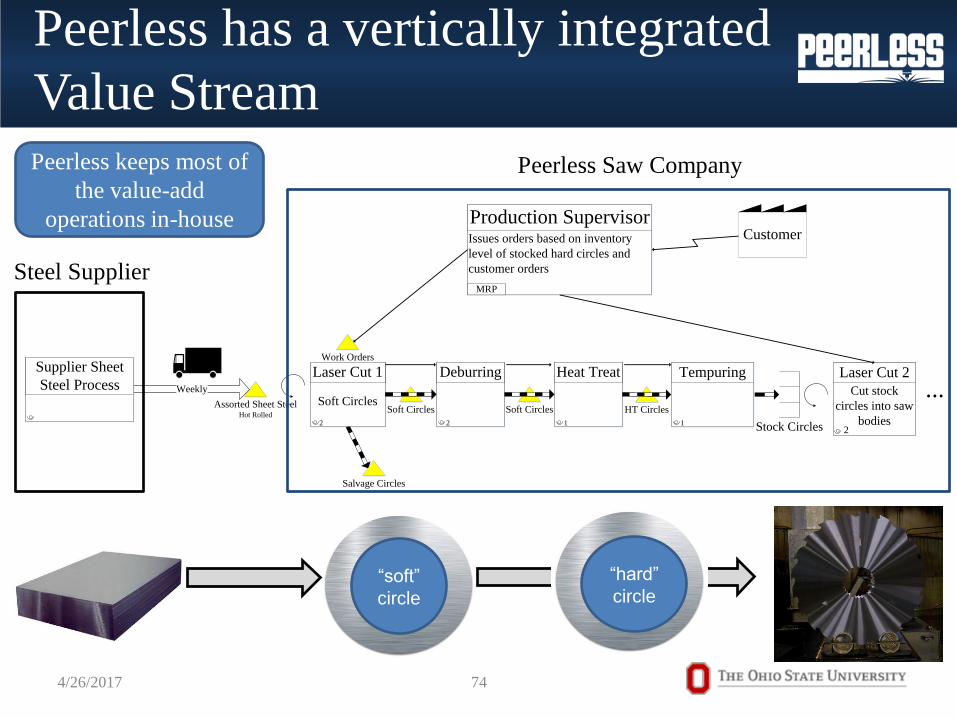
Peerless has a vertically integrated
Value Stream
4/26/2017 74
Issues orders based on inventory
level of stocked hard circles and
customer orders
Production Supervisor
MRP
Soft Circles
Laser Cut 1
Assorted Sheet SteelHot Rolled
Weekly
2
Soft Circles
Deburring
Salvage Circles
2
Heat Treat
Soft Circles HT Circles
Tempuring
Stock Circles
Cut stock
circles into saw
bodies
Laser Cut 2
1 12
...
Work Orders
Customer
Supplier Sheet
Steel Process
Steel Supplier
Peerless Saw Company Peerless keeps most of
the value-add
operations in-house
“soft”
circle
“hard”
circle

The Vision that Drove the Project
• Agenda:
– About Peerless Saw and the Value Stream being Improved
– Future State Vision—What was possible?
– Current State of the Value Stream and Opportunity
– What was the performance gap and why did it exist?
– The Solution—how we closed the gap, Pilot Results
– Rollout and Full Potential Performance
4/26/2017 75

Getting clear on DONE was a
first step for me and the team
Future State:
December 2017
• Business: o We have used the
make/buy tool to expand
to more sizes
o Now outsourcing: 0.210,
0.230
• Financial: o Estimated Cost
Save=$50,000 yearly
• Process: o 2 Product Families
Outsourced
o Labor and machine time
freed up
• People o Heavy Lifts less Frequent
o Less delays = less
frustration
4/26/2017 76
Pain Point: We knew that COGS was too high,
had been working to reduce it, internally, for a
number of years.
We needed a ‘breakthrough’, outside the box
approach.
We suspected our ‘steel supplier’ had capabilities
we were not taking advantage of and could create
a ‘Win-Win’ situation with them.
• For Peerless, a Win – Win that drives down
cost, improving Operating Margin which in
turn improves Shareholder Value
We envisioned a December 2017 DONE as seen
on the right.
END
GAME:
• Fully utilize
our supplier
capabilities
• With a
dynamic
make-buy
‘tool’
• to
continually
reduce,
minimize/
optimize
COGS
• and grow
our
Franchise
value
-40
-20
0
20
40
60
80
100
120
1995 1996 1997 1998 1999 2000 2001 2002 2003 2004 2005 2006 2007 2008 2009 2010 2011 2012 2013 2014 2015 2016
Val
ue
Years
Apple Computer: Operating Margin vs Stock Price
Operating Margin
Stock Price
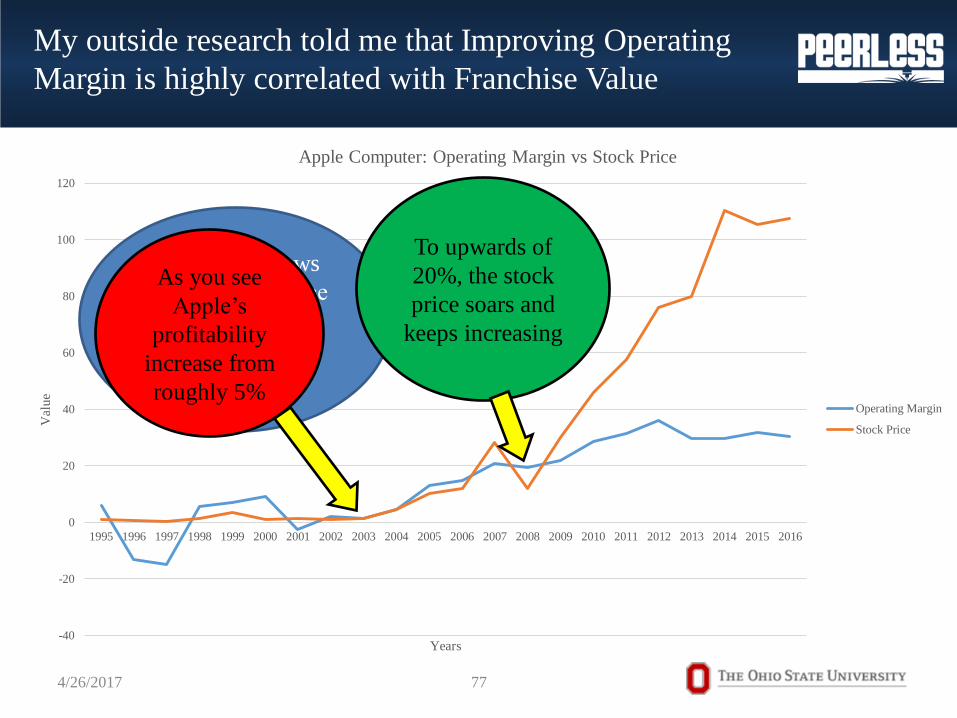
This graph shows
Apple’s stock price
and profitability
performance over
the years
My outside research told me that Improving Operating
Margin is highly correlated with Franchise Value
As you see
Apple’s
profitability
increase from
roughly 5%
To upwards of
20%, the stock
price soars and
keeps increasing
4/26/2017 77

In the ISE/ILSS training we learned to
apply the Deloitte Enterprise Value Map
4/26/2017 78
I utilized a more detailed version of this EVM to work with the Owner and team to
understand the full spectrum of things we wanted to get done on this project, but
COGS above was our primary metric of interest.
The other early focus was on
understanding the “current state”
• Agenda:
– About Peerless Saw and the Value Stream being Improved
– Future State Vision—What was possible?
– Current State of the Value Stream and Opportunity
– What was the performance gap and why did it exist?
– The Solution—how we closed the gap, Pilot Results
– Rollout and Full Potential Performance
4/26/2017 79
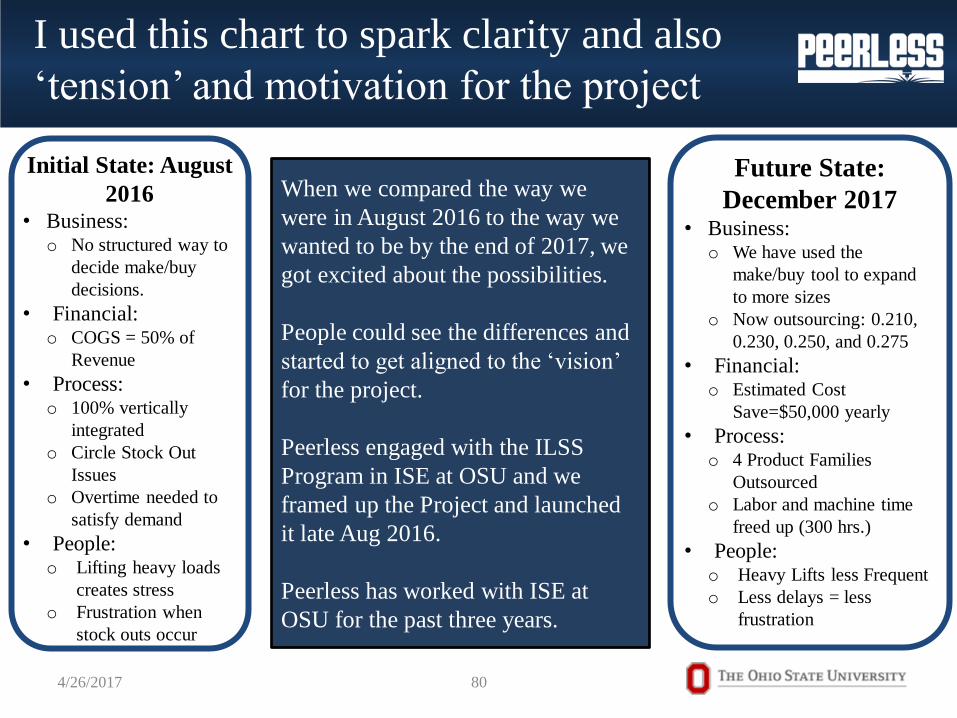
I used this chart to spark clarity and also
‘tension’ and motivation for the project
Initial State: August
2016 • Business:
o No structured way to
decide make/buy
decisions.
• Financial: o COGS = 50% of
Revenue
• Process: o 100% vertically
integrated
o Circle Stock Out
Issues
o Overtime needed to
satisfy demand
• People: o Lifting heavy loads
creates stress
o Frustration when
stock outs occur
Future State:
December 2017 • Business:
o We have used the
make/buy tool to expand
to more sizes
o Now outsourcing: 0.210,
0.230, 0.250, and 0.275
• Financial: o Estimated Cost
Save=$50,000 yearly
• Process: o 4 Product Families
Outsourced
o Labor and machine time
freed up (300 hrs.)
• People: o Heavy Lifts less Frequent
o Less delays = less
frustration
4/26/2017 80
When we compared the way we
were in August 2016 to the way we
wanted to be by the end of 2017, we
got excited about the possibilities.
People could see the differences and
started to get aligned to the ‘vision’
for the project.
Peerless engaged with the ILSS
Program in ISE at OSU and we
framed up the Project and launched
it late Aug 2016.
Peerless has worked with ISE at
OSU for the past three years.

And, as mentioned, COGS has been an issue and
focus for the company for many years
0.0%
10.0%
20.0%
30.0%
40.0%
50.0%
60.0%
COGS % Factory Expenses % Operating Margin %
Per
centa
ge
%
Cost and Operating Margin as a Percentage of Revenue
2014 2015 2016
4/26/2017
COGS has been reducing
the last few years.
Peerless may have the
opportunity to reduce it
again through closer
supplier engagement
81
50% of Revenue
is lost to Cost of
Goods Sold
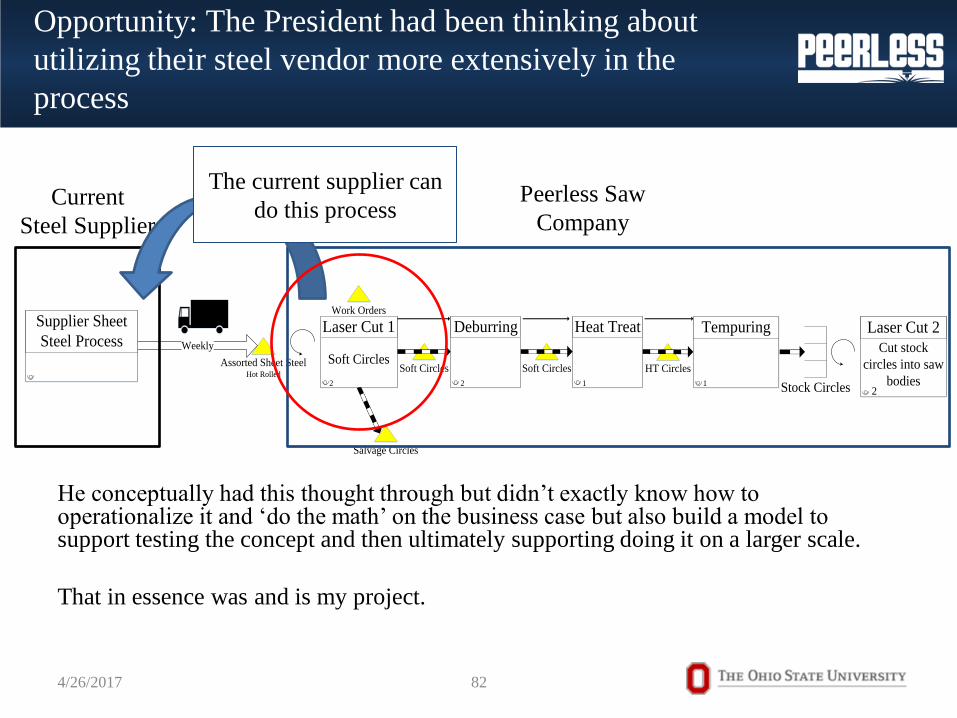
Opportunity: The President had been thinking about
utilizing their steel vendor more extensively in the
process
He conceptually had this thought through but didn’t exactly know how to operationalize it and ‘do the math’ on the business case but also build a model to support testing the concept and then ultimately supporting doing it on a larger scale.
That in essence was and is my project.
Soft Circles
Laser Cut 1
Assorted Sheet SteelHot Rolled
Weekly
2
Soft Circles
Deburring
Salvage Circles
2
Heat Treat
Soft Circles HT Circles
Tempuring
Stock Circles
Cut stock
circles into saw
bodies
Laser Cut 2
1 12
...
Work OrdersSupplier Sheet
Steel Process
Current
Steel Supplier
Peerless Saw
Company
4/26/2017 82
The current supplier can
do this process

The ‘root cause’ of the opportunity gap is
actually fairly simple to explain
• Agenda:
– About Peerless Saw and the Value Stream being Improved
– Future State Vision—What was possible?
– Current State of the Value Stream and Opportunity
– What was the performance gap and why did it exist?
– The Solution—how we closed the gap, Pilot Results
– Rollout and Full Potential Performance
4/26/2017 83
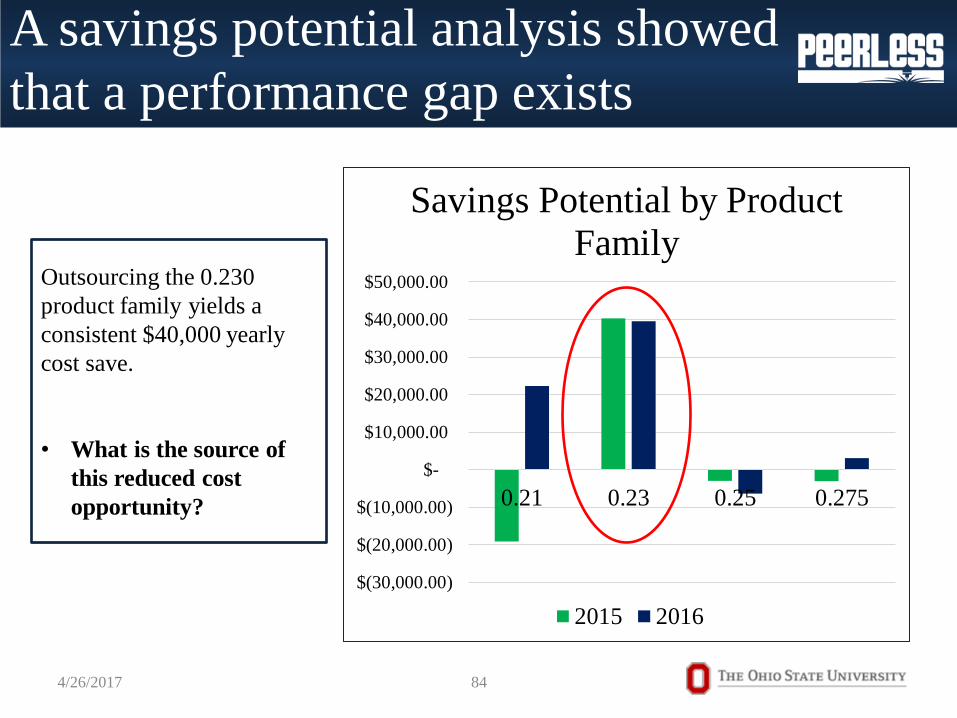
A savings potential analysis showed
that a performance gap exists
4/26/2017 84
$(30,000.00)
$(20,000.00)
$(10,000.00)
$-
$10,000.00
$20,000.00
$30,000.00
$40,000.00
$50,000.00
0.21 0.23 0.25 0.275
Savings Potential by Product
Family
2015 2016
Outsourcing the 0.230
product family yields a
consistent $40,000 yearly
cost save.
• What is the source of
this reduced cost
opportunity?

The supplier’s circle nest is more
material efficient
36.5” 36.5”
Peerless Nesting
Supplier Nesting
4/26/2017 85
In our case we want more
holes and less Swiss
cheese
They have bigger beds and better lasers,
so they can use bigger sheets of steel and
their nesting algorithms are better. This
reduces waste because the supplier has:
• More space to play with to efficiently
nest circles, and
• higher circle yield, less sheets needed
to satisfy demand.

Let’s now turn to the Solution I developed
with the team and for the Company
• Agenda:
– About Peerless Saw and the Value Stream being Improved
– Future State Vision—What was possible?
– Current State of the Value Stream and Opportunity
– What was the performance gap and why did it exist?
– The Solution—how we closed the gap, Pilot Results
– Rollout and Full Potential Performance
4/26/2017 86

Where we started with our pilot
with our Supplier
• We have 17 product families of circles, based on the different thicknesses of sheet steel needed to make the array of saws we sell, ranging from 0.045” to 0.375” sheet thickness.
– The products within those families are the 24 different diameters of circles, from 10.5” to 41”.
• As mentioned in the savings potential analysis, outsourcing the 0.230 family nets a consistent cost save. For this reason, the team selected 0.230 for the pilot
4/26/2017 87
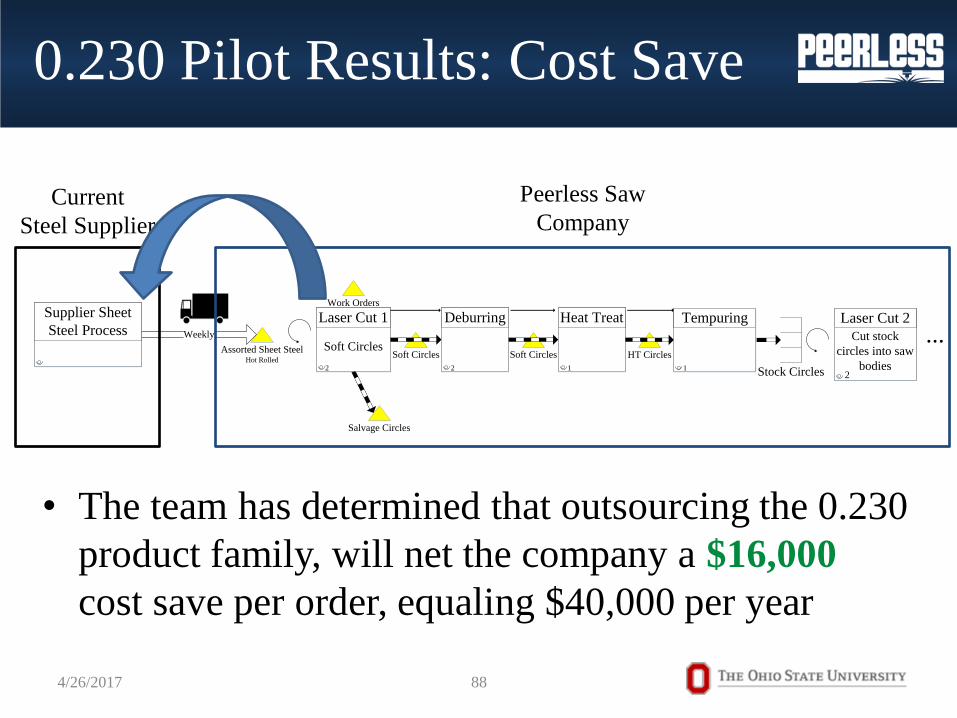
0.230 Pilot Results: Cost Save
• The team has determined that outsourcing the 0.230
product family, will net the company a $16,000
cost save per order, equaling $40,000 per year
Soft Circles
Laser Cut 1
Assorted Sheet SteelHot Rolled
Weekly
2
Soft Circles
Deburring
Salvage Circles
2
Heat Treat
Soft Circles HT Circles
Tempuring
Stock Circles
Cut stock
circles into saw
bodies
Laser Cut 2
1 12
...
Work OrdersSupplier Sheet
Steel Process
Current
Steel Supplier
Peerless Saw
Company
4/26/2017 88

0.230 Pilot Results: Employee
Satisfaction
• Employees have to lift sheet steel to put it on the laser.
• Ergonomically, this can be stressful on the employee’s back and shoulders
• Employee satisfaction will increase by outsourcing a painful operation.
A 4’ x 8’ x 0.230”
sheet of steel weighs
approximately 300
pounds!
4/26/2017 89
How was this done?

We created a model to compare
Make/Buy Alternatives
Material Cost Laser Labor Cost Deburr Cost
Cost to Make
Buy Cost per Circle
Cost to Buy
Make/Buy Comparison It takes spreadsheets of
measured data, and
combines them into a single
comparison spreadsheet
4/26/2017 90

$2,424 $3,447
$3,852 $5,198
$18,039
$30,346 $2,135
$2,927
$-
$5,000
$10,000
$15,000
$20,000
$25,000
$30,000
$35,000
$40,000
$45,000
$50,000
Total Cost to Buy Total Cost to Make
Make Yearly Cost to Make and Buy 0.230
Circle Family
10.5 14.5 22.5 30.5 32.5 36.5 41.0
Example: Make/Buy Comparison
• Per Circle costs are
totaled by demand
and annualized to
achieve a yearly
comparison
This is the $16,000 cost
save per order from the
0.230 pilot
4/26/2017 91

Agenda
• Agenda:
– About Peerless Saw and the Value Stream being Improved
– Future State Vision—What was possible?
– Current State of the Value Stream and Opportunity
– What was the performance gap and why did it exist?
– The Solution—how we closed the gap, Pilot Results
– Rollout and Full Potential Performance
4/26/2017 92

From Previous State to Current
State and Beyond Initial State:
August 2016
• Business:
o No structured way
to decide
make/buy
decisions.
• Financial: o COGS = $
4,900,000
• Process: o 100% vertically
integrated
o Circle Stock Out
Issues
o Overtime needed
to satisfy demand
• People o Lifting heavy
loads creates
stress
o Frustration when
stock outs occur
Current State:
April 2017
• Business:
o Has a make/buy
decision tool
o Capable of vetting more
thicknesses
• Financial: o Cost Save=$40,000
yearly
• Process: o Outsourced one
wasteful product family
o Reorder system
decreases chance of
stock out
o Labor and machine time
freed up
• People o Heavy Lifts less
Frequent
o Less delays = less
frustration
Make/Buy Decision
Tool Created
0.230 Circles Ordered
and Tested
New Ordering Model
Created
Failure Modes and
Fixes Determined
Future State:
December 2017
• Business:
o We have used the
make/buy tool to
expand to more sizes
o Now outsourcing:
0.210, 0.230
• Financial: o Estimated Cost
Save=$50,000 yearly
• Process: o 2 Product Families
Outsourced
o Labor and machine
time freed up
• People o Heavy Lifts less
Frequent
o Less delays = less
frustration
Make/Buy Decision Tool
Made Expandable
Standard Work for Tool
Updating Implemented
Standard Work for Circle
Ordering Done
Make/Buy Decision Tool
Updating Automated
Close the
Gap
Make the
Solution Stick
Quality Check Process on
Raw Material
Implemented
4/26/2017 93

How do we Sustain the
Improvement?
• Make the Make / Buy Model Fast, Easy to
Use, and Fit the Use Case
• Eternalize the New Processes with Standard
Work
• Effectively Transition the Project: Control and
Monitoring Plan
4/26/2017 94
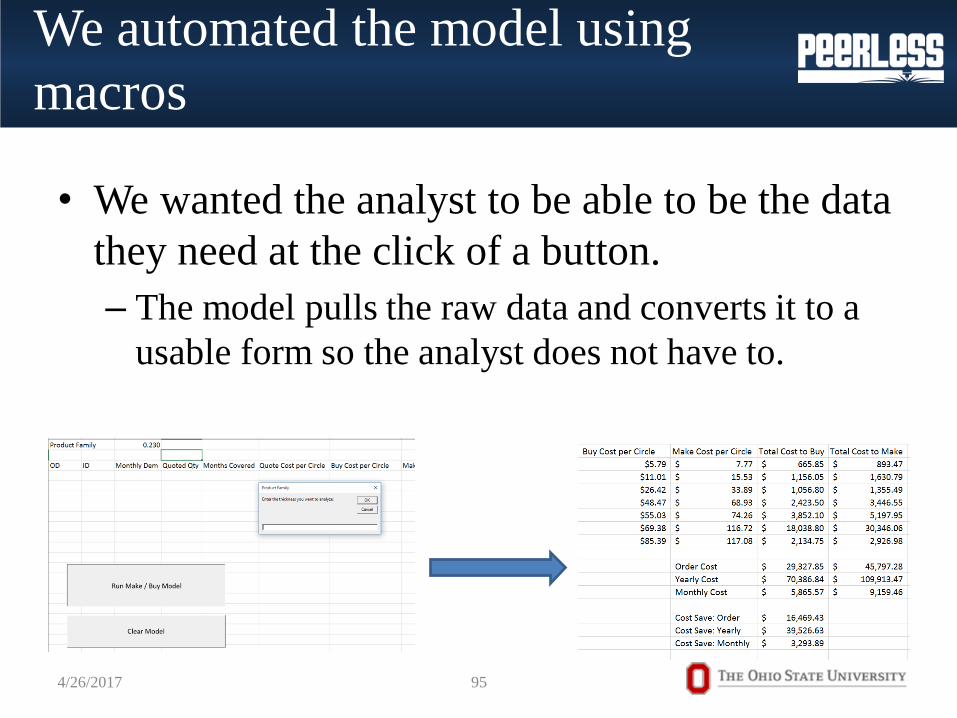
We automated the model using
macros
• We wanted the analyst to be able to be the data
they need at the click of a button.
– The model pulls the raw data and converts it to a
usable form so the analyst does not have to.
4/26/2017 95

The Intel Data Triangle
illustrates the process for
getting from raw data
capture to extracting
knowledge and
visualizing, by moving
up the triangle
Macros allowed us to eliminate the data
cleaning work to enable fast analysis
4/26/2017 96
Intel Data Triangle The automation allows the
analyst to spend most of
their time in Knowledge
Extraction and Visualization
VBA Work This is
where they
want to be!

We created standard work to
document process knowledge
• A documented process means people do not
have to completely relearn the process when
they have to reorder circles or conduct a study
4/26/2017 97
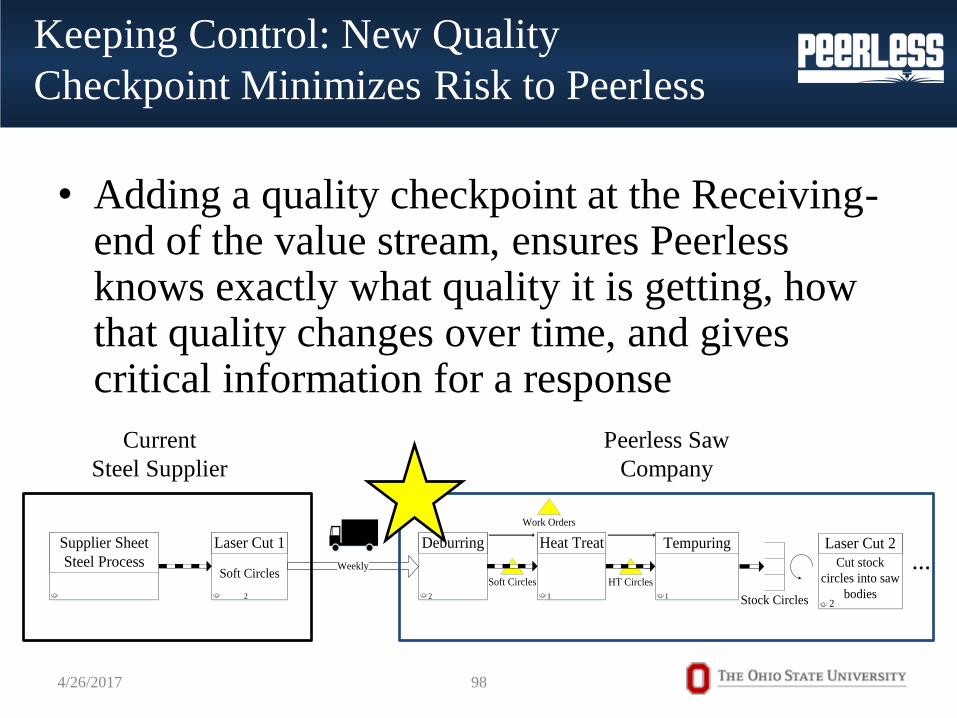
Keeping Control: New Quality
Checkpoint Minimizes Risk to Peerless
• Adding a quality checkpoint at the Receiving-end of the value stream, ensures Peerless knows exactly what quality it is getting, how that quality changes over time, and gives critical information for a response
4/26/2017 98
Soft Circles
Laser Cut 1
2
Deburring
2
Heat Treat
Soft Circles HT Circles
Tempuring
Stock Circles
Cut stock
circles into saw
bodies
Laser Cut 2
1 12
...
Work Orders
Supplier Sheet
Steel Process Weekly
Current
Steel Supplier
Peerless Saw
Company
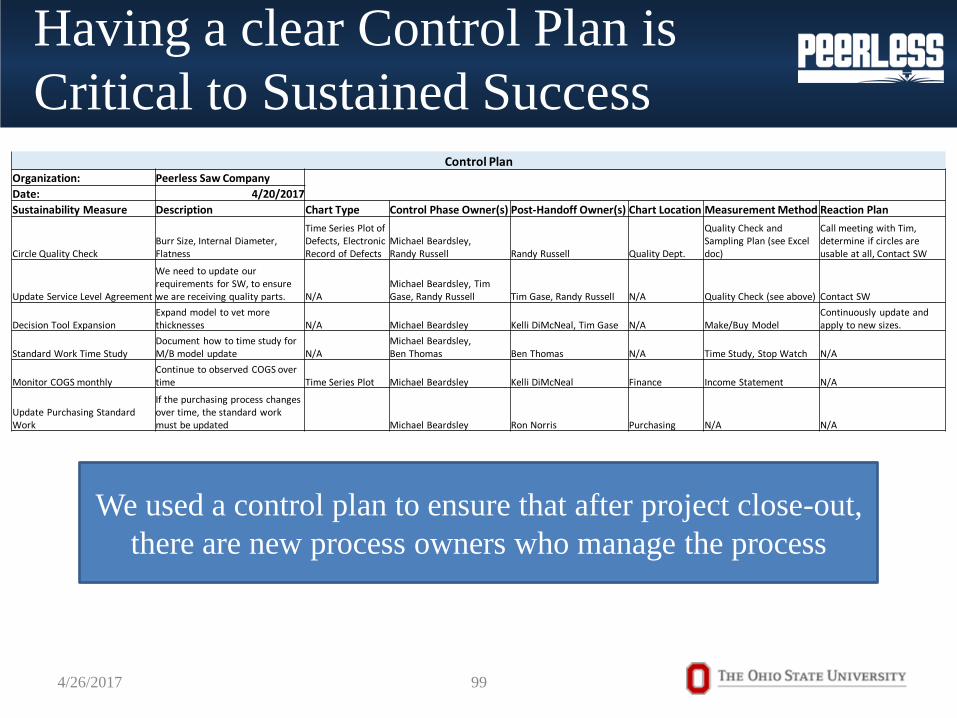
Having a clear Control Plan is
Critical to Sustained Success
4/26/2017 99
Control Plan Organization: Peerless Saw Company
Date: 4/20/2017
Sustainability Measure Description Chart Type Control Phase Owner(s) Post-Handoff Owner(s) Chart Location Measurement Method Reaction Plan
Circle Quality Check Burr Size, Internal Diameter, Flatness
Time Series Plot of Defects, Electronic Record of Defects
Michael Beardsley, Randy Russell Randy Russell Quality Dept.
Quality Check and Sampling Plan (see Excel doc)
Call meeting with Tim, determine if circles are usable at all, Contact SW
Update Service Level Agreement
We need to update our requirements for SW, to ensure we are receiving quality parts. N/A
Michael Beardsley, Tim Gase, Randy Russell Tim Gase, Randy Russell N/A Quality Check (see above) Contact SW
Decision Tool Expansion Expand model to vet more thicknesses N/A Michael Beardsley Kelli DiMcNeal, Tim Gase N/A Make/Buy Model
Continuously update and apply to new sizes.
Standard Work Time Study Document how to time study for M/B model update N/A
Michael Beardsley, Ben Thomas Ben Thomas N/A Time Study, Stop Watch N/A
Monitor COGS monthly Continue to observed COGS over time Time Series Plot Michael Beardsley Kelli DiMcNeal Finance Income Statement N/A
Update Purchasing Standard Work
If the purchasing process changes over time, the standard work must be updated Michael Beardsley Ron Norris Purchasing N/A N/A
We used a control plan to ensure that after project close-out,
there are new process owners who manage the process

These process sustaining actions
will help Peerless meet its vision
4/26/2017 100
Current State: April 2017 • Business: o Has a make/buy decision tool
o Capable of vetting more
thicknesses
• Financial: o Cost Save=$40,000 yearly
• Process: o Outsourced one wasteful
product family
o Reorder system decreases
chance of stock out
o Labor and machine time freed
up
• People o Heavy Lifts less Frequent
o Less delays = less frustration
Future State:
December 2017 • Business:
o We have used the make/buy
tool to expand to more sizes
o Now outsourcing: 0.210,
0.230
• Financial: o Estimated Cost
Save=$50,000 yearly
• Process: o 2 Product Families
Outsourced
o Labor and machine time
freed up (300 hrs.)
• People o Heavy Lifts less Frequent
o Less delays = less
frustration
Make/Buy Decision Tool Made
Expandable
Standard Work for Tool Updating
Implemented
Standard Work for Circle Ordering
Done
Make/Buy Decision Tool Updating
Automated
Make the
Solution Stick
Quality Check Process on Raw
Material Implemented

The Future State
• By transitioning to the new process, cost is
reduced, flow is improved due to less demand
on the lasers, and employees are happier
Soft Circles
Laser Cut 1
2
Deburring
2
Heat Treat
Soft Circles HT Circles
Tempuring
Stock Circles
Cut stock
circles into saw
bodies
Laser Cut 2
1 12
...
Work Orders
Supplier Sheet
Steel Process Weekly
Current
Steel Supplier
Peerless Saw
Company
4/26/2017 101

IISE
CHAPTER #1
Eastern Ohio Mini Region:
Columbus Chapter #1
Your Go To Virtual
Chapter for ISE’s on
the Go!!

Developed and Offered through IISE by the
Columbus Mini-Region of IISE
PANEL MEMBERS
D. Scott Sink, Team Lead Columbus Mini-Region Chapter, and Director ILSS ISE @ OSU
Elizabeth Schweizer, Industry Advisory Board, IISE, and Engineering Services, Disney
Jared Dunlap, President IISE Young Professionals, and Management Consultant, Accenture
Jared Frederici, Young Professionals Segment Owner, Columbus Chapter, and Senior
Consultant, The Poirier Group
IAB and Young
Professionals
The Second 7 Great Habits Successful Young Professionals Need
to Develop'. (and how IISE can help you acquire these faster)
Columbus/Eastern
Ohio Mini-Region
Developed and Offered through IISE by the
Columbus Mini-Region of IISE
PANEL MEMBERS
D. Scott Sink, Team Lead Columbus Mini-Region Chapter, and Director ILSS ISE @ OSU
Joan Tafoya, Intel Corporation
Director / Senior Principal Engineer, Manufacturing and Operations
Steve Savoie, Senior Manager, Industrial Engineering, GM
IAB and Young
Professionals
Making the Transition from Engineer to Leader
and Manager
Columbus/Eastern
Ohio Mini-Region

Developed and Offered through IISE by the
Columbus Mini-Region of IISE
PANEL MEMBERS
D. Scott Sink, Team Lead Columbus Mini-Region Chapter, and Director ILSS ISE @ OSU
Jim Tompkins, President Tompkins and Associates (Macro, Global, System Views)
Rick Wilkinson, SVP Supply Chain, Dollar Tree (Micro, within the DC Views)
IAB and Young
Professionals
ISE Full Potential Contribution to Supply Chain
Optimization (macro and micro views)
Columbus/Eastern
Ohio Mini-Region
Work on all continuing to Build you
Believability Index by attending the IISE
Conference in Pittsburgh!!
S