
A gis based framework for assessing and mapping potential irrigation areas in rwanda
i
Ashwin Dhakal
A Prototype for SAGRA Network, Alentejo Portugal
WEB GIS TO SUPPORT IRRIGATION MANAGEMENT

ii
WEB GIS TO SUPPORT IRRIGATION MANAGEMENT
A Prototype for SAGRA Network, Alentejo Portugal
Dissertation supervised by
Professor Miguel Neto, Ph.D
Dissertation co-supervised by
Professor Mario Caetano, Ph.D
Professor Filberto Pla, Ph.D
March 2010

iii
ACKNOWLEDGEMENTS
I would like express my sincere gratitude to my supervisors Professor Dr. Miguel Castro
Neto, Professor Dr. Mario Caetano and Prof Dr.Filberto Pla for their continuous support,
motivation, patience and immense knowledge and feedback. My special thanks and
appreciation goes to Prof. Marco Painho, Director of ISEGI, for his continuous checking
and giving important feedback for the completion of the project. I would also thank to
Professor Werner Kuhn and Christoph Brox from University of Muenster, Germany for
their support during the course.
Additionally, I want to thank to Eng. Jorge Maia, Technical Director of COTR and Enga
Marta Santos for providing information about weather station data and other related
information. I also like to thank ISEGI and IFGI staffs and friends who helped me
during my study.
I want to thank European Commission for Providing Scholarship to study Master of
Geospatial Technology under Erasmus Mundus program.
Lastly, I want to thank my parents and family members for their continuous help and
support.
iv
WEB GIS TO SUPPORT IRRIGATION MANAGEMENT
A Prototype for SAGRA Network, Alentejo Portugal
ABSTRACT
An efficient water management, not only allows significant savings in costs of irrigation,
but also an effective control on the quality of products, which can have obvious
consequences on income operation and reducing the environmental impact of irrigation.
As the Internet is becoming the easiest way of information distribution, irrigation
management system can also be benefitted with it. Integrating GIS functionality with
internet capacity will redefine the way of decision making, sharing and processing of
information. In irrigation systems weather plays an imperative role in decision making,
implementing and forecasting. Temperature, humidity, precipitation, and solar radiation
are the most important parameters to calculate evapotranspiration by which crop water
requirement can be determined.
SAGRA (Sistema Agrometeorológico para a Gestão da Rega no Alentejo) network is
providing information to the farmers through web but still lacks the use of GIS in their
information to decision support system. Irrigation management support system can be
benefitted with the use of Web GIS. In this thesis, web based GIS is designed using
popular open source tools and software. Using data from automatic weather station maps
are produced using Geo-statistical interpolation techniques and published in web map.
These maps can be viewed with popular online maps like Google maps, Microsoft Bing
and Openstreet maps.
Animated weather maps are also created which are useful for visualizing changing
pattern of weather parameters and water requirement over time.
v
KEYWORDS
Geovisualization
Map animation
Open source
Web GIS
Weather map
Weather stations
vi
ACRONYMS
API - Application Programming Interface CAOP - Carta Administrativa Oficial de Portugal COTR- Centro Operativo e de Tecnologia de Regadio DOM- Document Object Model
ET- Evapotranspiration EPSG - European Petroleum Survey Group EU - European Union FAO- Food and Agriculture Organization GIS - Geographic Information System OGC - Open Geospatial Consortium, Inc. PGI - Protected Geographical Indication SRS ID - Spatial Reference System Identifier SAGRA -Sistema Agrometeorológico para a Gestão da Rega no Alentejo TMS- Tiled Map Service TSG - Traditional Speciality Guaranteed WCS - Web Coverage Service WFS - Web Feature Service WKT - Well-known text WMS - Web Map Service WWW – World Wide Web
vii
TABLE OF CONTENTS ACKNOWLEDGEMENTS ...........................................................................................................iii
ABSTRACT ................................................................................................................................... iv
KEYWORDS ................................................................................................................................. v
ACRONYMS ................................................................................................................................. vi
INDEX OF TABLES ..................................................................................................................... ix
INDEX OF FIGURES ....................................................................................................................x
1.Introduction ................................................................................................................................. 1
1.1 Problem statement ................................................................................................................ 2
1.2Objectives.............................................................................................................................. 2
1.3Thesis structure ..................................................................................................................... 3
1.4Study Area Description ......................................................................................................... 3
1.5SAGRA Network .................................................................................................................. 5
2. Theoretical Framework .............................................................................................................. 8
2.1 Irrigation management ......................................................................................................... 9
2.1.1 Evapotranspiration ...................................................................................................... 10
2.2.2 Reference crop evapotranspiration (ETo) ................................................................... 12
2. 2.3 Crop Water Use .......................................................................................................... 12
2.2.4 FAO Penman-Monteith Equation................................................................................ 12
2.3 GIS and web Mapping ....................................................................................................... 13
2.3.1 Web Mapping .............................................................................................................. 13
2.3.2 Advantages of web mapping ....................................................................................... 15
2.4 Components of Web Mapping ........................................................................................... 16
2.4.1Presentation tier:........................................................................................................... 16
2.4.2 Logic tier: .................................................................................................................... 17
2.4.3 Data base tier: .............................................................................................................. 17
2. 5 Available Web Mapping Technologies ............................................................................. 18
2. 6 Web technologies for web-based GIS ............................................................................... 19
2.6.1 Web server .................................................................................................................. 19
2.6.2 Scripting language and JavaScript .............................................................................. 20
viii
2.6.3 Application Programming Interface ............................................................................ 20
2.7 Open Source and Open Standards ...................................................................................... 21
2.7.1 Open specifications standards ..................................................................................... 23
2.8 Geovisualization ................................................................................................................. 25
3 .Applications used for implementation ..................................................................................... 27
3.1 Openlayers ......................................................................................................................... 27
3.2 PostGIS .............................................................................................................................. 27
3.3 GeoServer ........................................................................................................................... 28
3.3.1 Configuration Design of Geoserver ............................................................................ 29
3.4 uDig .................................................................................................................................... 30
4. Materials and Methods Used .................................................................................................... 31
4.1 Data used ............................................................................................................................ 31
4.2 Requirement analysis ......................................................................................................... 31
4.3 Data processing .................................................................................................................. 32
4.4 Making weather Maps ........................................................................................................ 32
4.5 Configuring Geoserver ....................................................................................................... 33
4.5.2 Adding Data to GeoServer: ......................................................................................... 35
4.6 Working with open layers .................................................................................................. 36
4.7 Tile cache ........................................................................................................................... 37
4.7.1 Openlayers for Tiled map overlay ............................................................................... 37
4.8 Animating maps ................................................................................................................. 39
5. Implementation and Results ..................................................................................................... 41
5.1 Map Gallery ....................................................................................................................... 44
7. Limitations and Further Development ................................................................................. 47
8. Conclusion ........................................................................................................................... 48
Bibliographic References ............................................................................................................. 49
APPENDICES ............................................................................................................................. 56
1 Weather data ......................................................................................................................... 57
2 Google Earth Animation ....................................................................................................... 58

ix
INDEX OF TABLES
Table 1 Weather station number, location and Name ....................................................... 5 Table 2 Data Used ............................................................................................................ 31
x
INDEX OF FIGURES
Figure 1 Study Area (Alentejo, Portugal) .......................................................................... 4
Figure 3 Weather stations and locations ............................................................................ 6
Figure 4 Decision Support System scheme(Maia et al ,2005) ........................................... 7
Figure 5. Interface of SAGRA web page ........................................................................... 8
Figure 6 Weather map for North-eastern Colorado, NCWCD ....................................... 10
Figure 7 Conceptual diagram evapotranspiration, runoff, and recharge process. ........... 11
Figure 8 Elements for Evapotranspiration (MOAFF, BC) .............................................. 11
Figure 9 Components of Web Mapping,(Crocker Farallon Geographics.) .................... 16
Figure 10 Schematic view of an overall WebGIS architecture ( Milosavljević, et al ) .. 18
Figure 11 client Server Architecture, (Source: Webdevelopersnotes website, 2010) ..... 19
Figure 12 Relationship between clients/servers and some OGC protocols .................... 24
Figure 13 Geoserver services architecture (Source www.geoserver.org) ....................... 28
Figure 14 Geoserver Layer Diagram(source, geoserver.org,2010) ................................. 29
Figure 15 Interface flow Diagram ................................................................................... 30
Figure 16. Information flow diagram in GeoServer ( (Source: Refraction Inc, 2010) .. 34
Figure 17 part of code for accessing tiles from server (prldal, 2008) .............................. 38
Figure 18 Tile Map cutter generated resource xml code ................................................. 39
Figure 19 Map Tiles of Different Zoom level of study area ............................................ 39
Figure 20 ETO maps in different months ........................................................................ 40
Figure 21 Weather stations showing station information ................................................ 41
Figure 22 Contour maps using Vector layer from database ............................................ 42
Figure 23 Web interface showing overlay with online base layers (Google, yahoo,
virtual earth) ..................................................................................................................... 43
Figure 24 Average Evapotranspiration in Google maps .................................................. 43
Figure 25 Animation Page layout .................................................................................... 44
Figure 26 Map display interface ...................................................................................... 45
Figure 27 Full Map display interface ............................................................................... 46
1
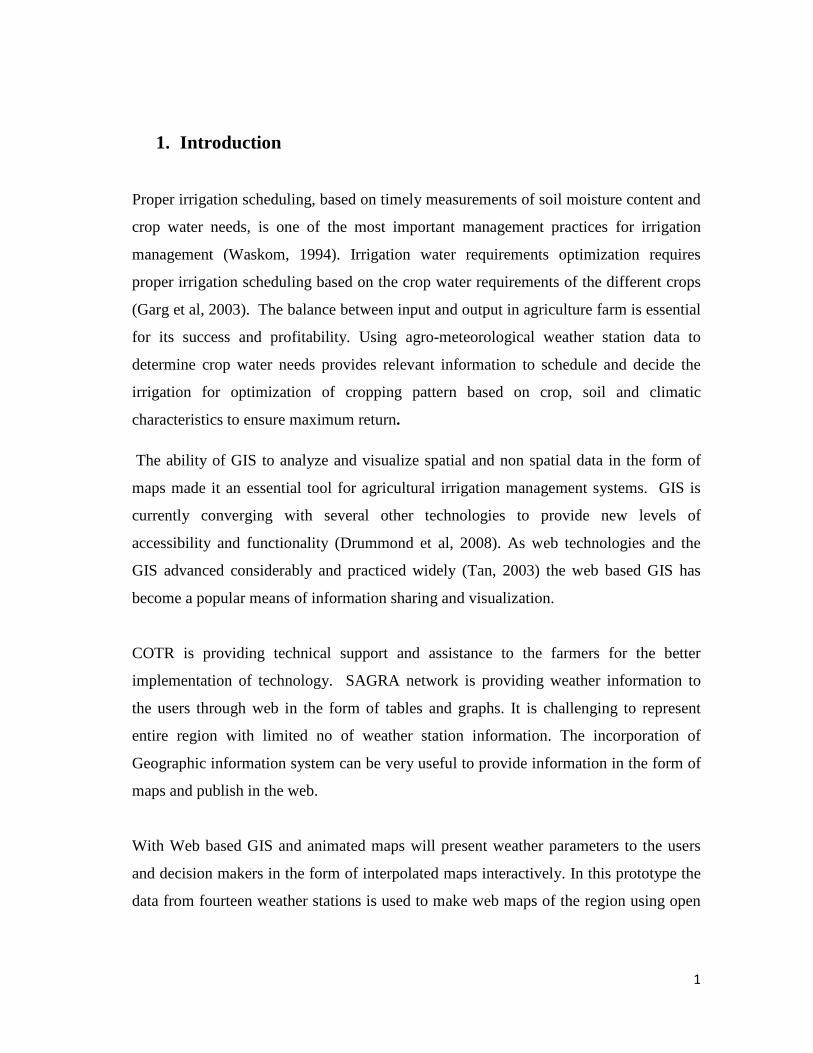
1. Introduction
Proper irrigation scheduling, based on timely measurements of soil moisture content and
crop water needs, is one of the most important management practices for irrigation
management (Waskom, 1994). Irrigation water requirements optimization requires
proper irrigation scheduling based on the crop water requirements of the different crops
(Garg et al, 2003). The balance between input and output in agriculture farm is essential
for its success and profitability. Using agro-meteorological weather station data to
determine crop water needs provides relevant information to schedule and decide the
irrigation for optimization of cropping pattern based on crop, soil and climatic
characteristics to ensure maximum return.
The ability of GIS to analyze and visualize spatial and non spatial data in the form of
maps made it an essential tool for agricultural irrigation management systems. GIS is
currently converging with several other technologies to provide new levels of
accessibility and functionality (Drummond et al, 2008). As web technologies and the
GIS advanced considerably and practiced widely (Tan, 2003) the web based GIS has
become a popular means of information sharing and visualization.
COTR is providing technical support and assistance to the farmers for the better
implementation of technology. SAGRA network is providing weather information to
the users through web in the form of tables and graphs. It is challenging to represent
entire region with limited no of weather station information. The incorporation of
Geographic information system can be very useful to provide information in the form of
maps and publish in the web.
With Web based GIS and animated maps will present weather parameters to the users
and decision makers in the form of interpolated maps interactively. In this prototype the
data from fourteen weather stations is used to make web maps of the region using open
2
source software. It also includes visualize maps visualization by animation and provides
platform to store and retrieve existing maps.
1.1 Problem statement
Operational and Technological Irrigation Centre (COTR) is operating SAGRA network
to provide weather information and calculated evapotranspiration through the web. All
the information they have been producing to support irrigation management to farmers is
made available through the web (desktop and PDA) in the form of tables and graphs
(Maia, Neto et al, 2007). The variability in spatial and temporal components is difficult
to transmit with traditional analytic techniques since the information is provided in
simple graphs and tables. The systems only provide information of point locations where
weather stations are located. Weather stations only provide the value of weather
parameters for a specific weather point. Geographic information Systems can be a very
useful tool to provide information to the farmers in the form of maps using interpolation.
These maps can be easily understood by farmers, planners and specialists for irrigating,
planning and research. Maps can provide information most effectively but currently
there is no such mechanism to provide web maps about crop water needs and weather
maps.
1.2 Objectives
1. Create different interpolated maps based on information provided by SAGRA
weather station using Geo statistical tools.
2. To develop a web GIS for the study area to visualize and analyze the crop water
requirement maps using data from weather the stations using open source
software and tools.
3. Animate weather and evapotranspiration map using Geovisualization techniques,
to support analysis and decision making process.
3
4. Display developed maps with Google maps, Bing Map, Google Earth and other
online mapping services also prepare animated maps to visualize change pattern.
5. Explore the different mapping technology to solve the problem.
6. Develop a system to store and display stored maps.
1.3 Thesis structure
There are six chapters in the thesis.
Chapter one introduces the thesis in general, and describes problem statement and
explains the study area.
Chapter two deals with theoretical background about irrigation water requirement
especially evapotranspiration. This chapter also describes theoretical background of web
mapping technologies, open standard specification, open standard software, components
of mapping technology and concept of geo-visualization.
In chapter three, provides general description of software used in this thesis work. This
chapter also describes features of software and implementation strategy of the software.
Chapter four describes the materials used in the work, data sources, and requirement
analysis of the prototype. This also describes methodology used in the implementation
of the prototype, including web map design, animation and storing map in server.
Chapter five provides the implementation results and shows the interfaces of web and
animation.
Chapter Six describes limitations and further development of the system.
Finally the conclusion of the thesis is described in the last chapter.
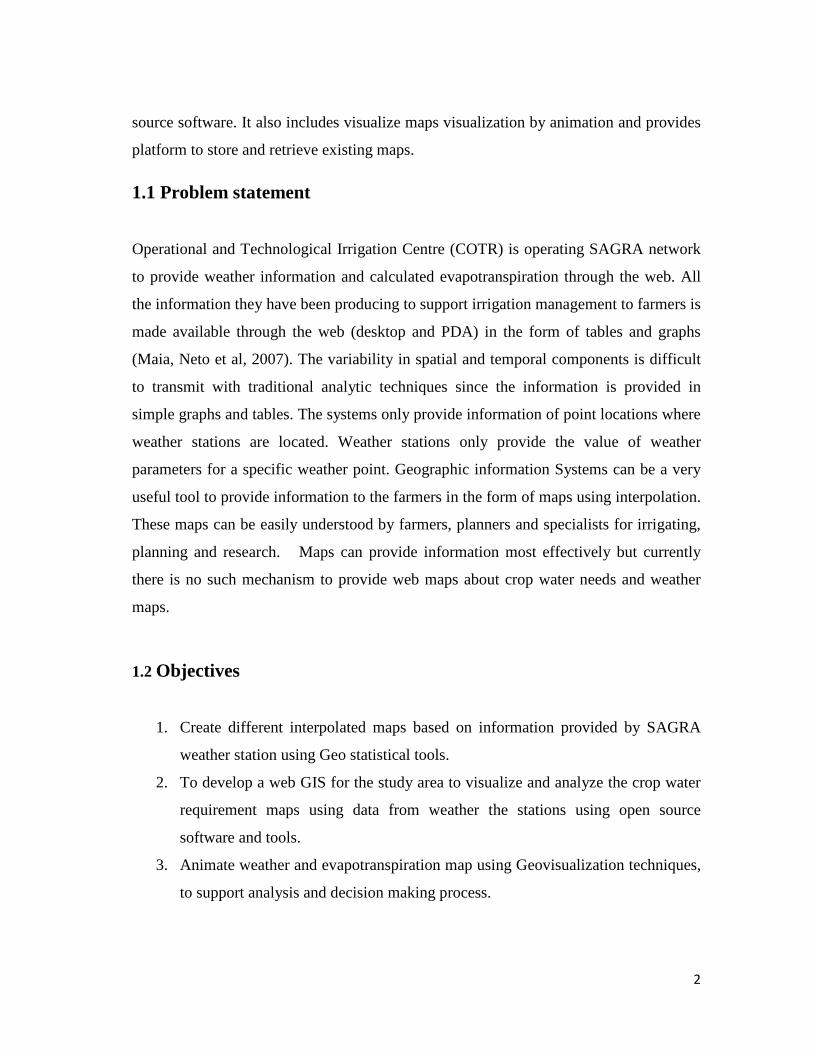
1.4 Study Area Description
The study area, Alentejo region, is situated south of Portugal between Tejo River and
Algarve Region in the south of Portugal. The area is bounded with Spain in the east,
with Atlantic Ocean in the west and Algarve region in the south. The area was
4
considered as bread basket of Portugal due to its extensive farming and cereal
production. The economic indicators are below the Portugal averages and population
density is low. Agriculture is important to the regional economy and employment but
available water resources are scarce and the rainfall has a significant spatial and
temporal variability (Fragoso and Lucas, 2009).This region is famous for its wheat
fields, cork and olive plantation. Other major crops produced in this region are maize,
potatoes, rice vine tomatoes, sunflower, and melon (Sen, 2004).
The study area was selected where The Irrigation Technology Center (COTR) is
working in irrigation management. The potential area consists of about 150000 hectors
of irrigated land (Maia, Neto et al, 2007).
Figure 1 Study Area (Alentejo, Portugal)
The climate is Mediterranean semi-arid and dry with oceanic influences, showing big
variation between summer and winter (Frances’, 2008). During June and September
temperature is warm and dry whereas during October and March 75% rainfall occurs.
Rainfall regime is highly irregular, with some torrential events (Cortez, 2004). The
5
significant amount of rainfall in the winter and spring there is excess of water for winter
crops (Sen, 2004)
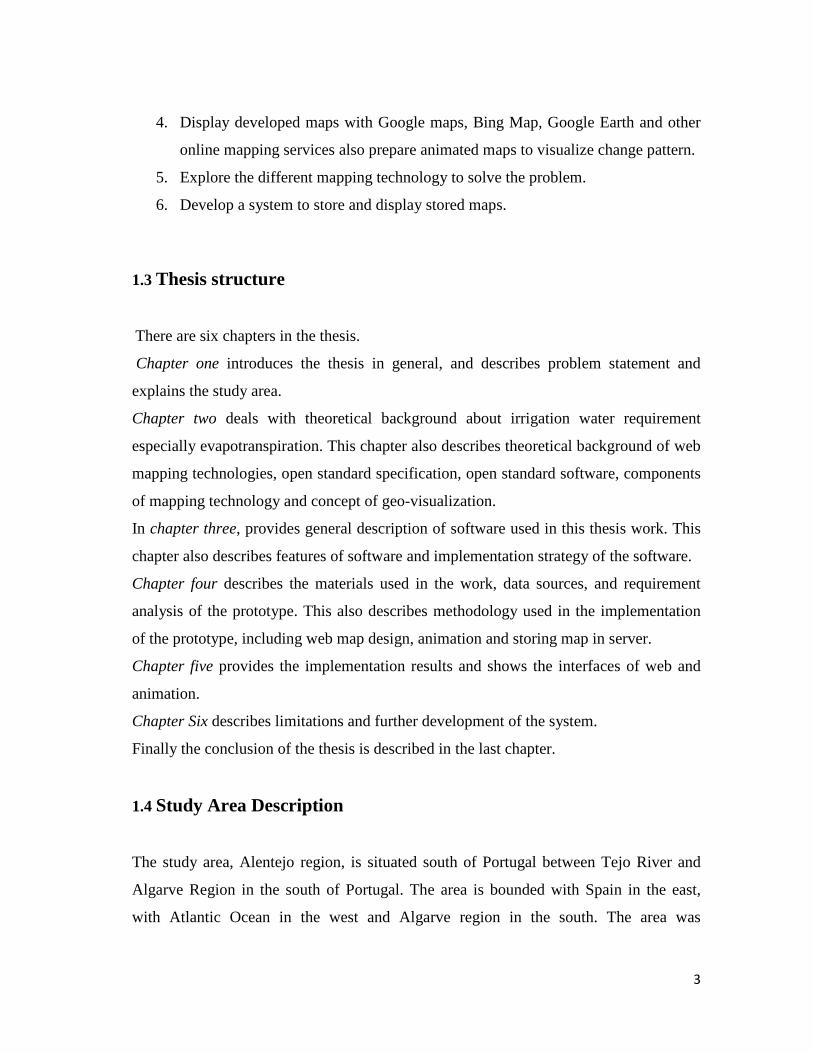
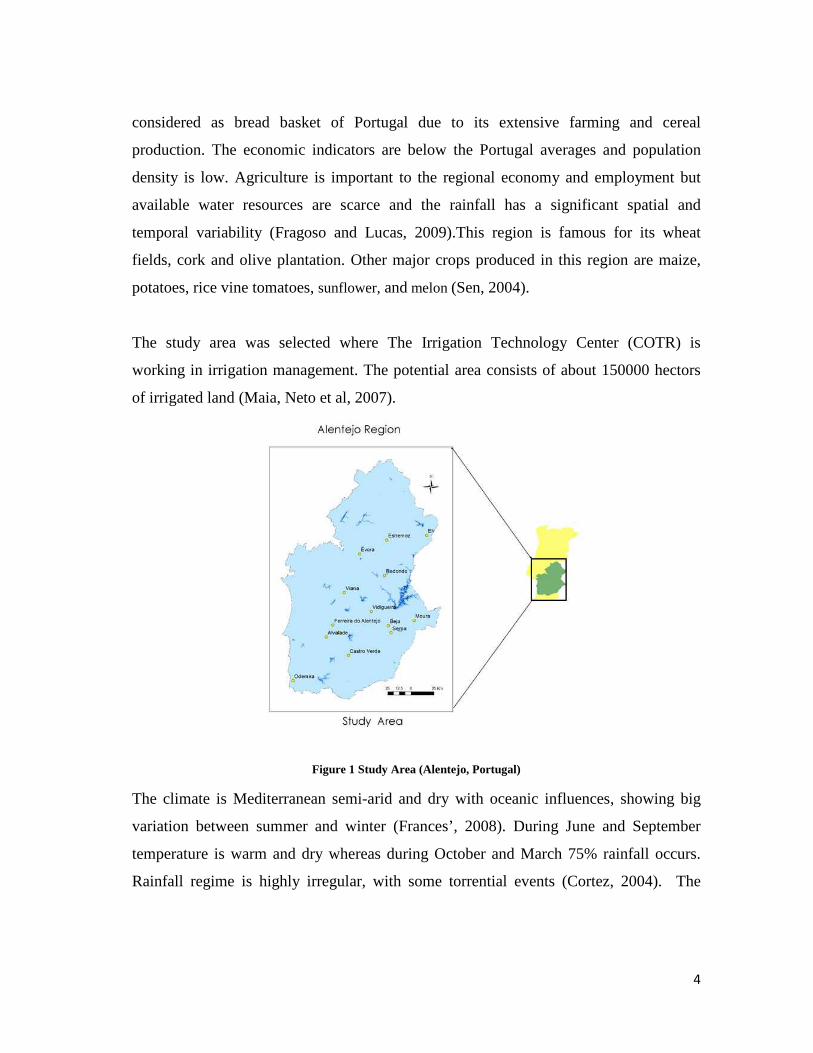
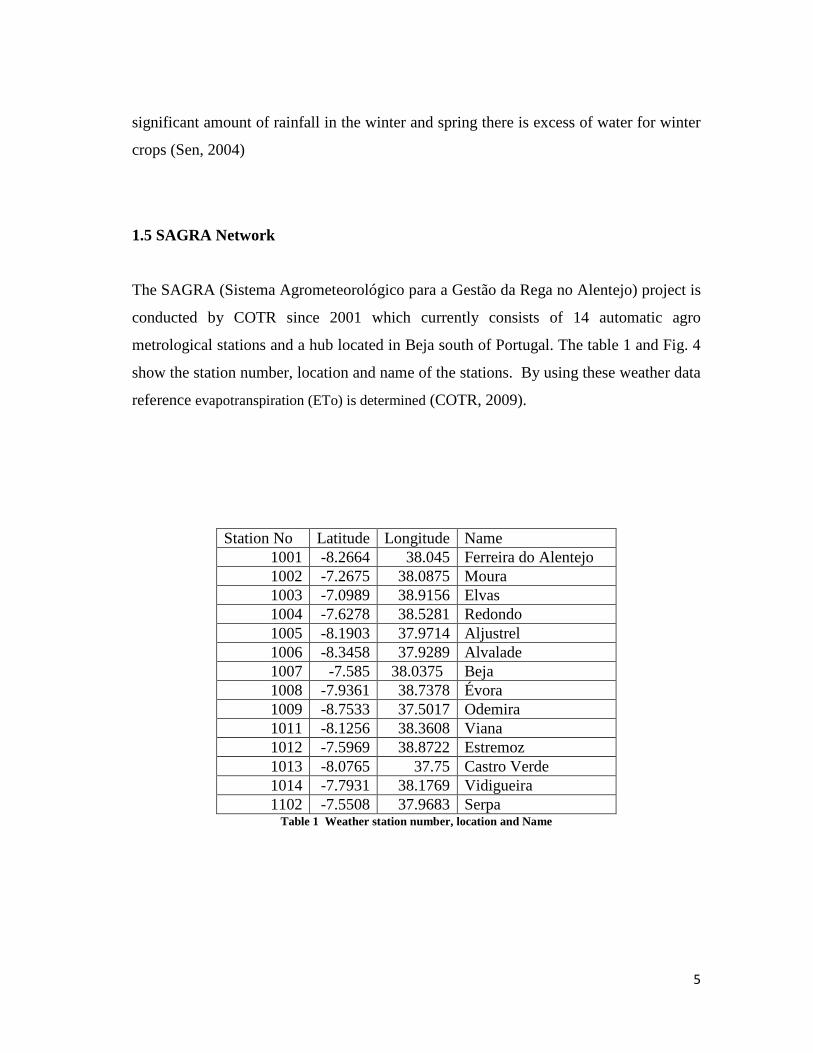
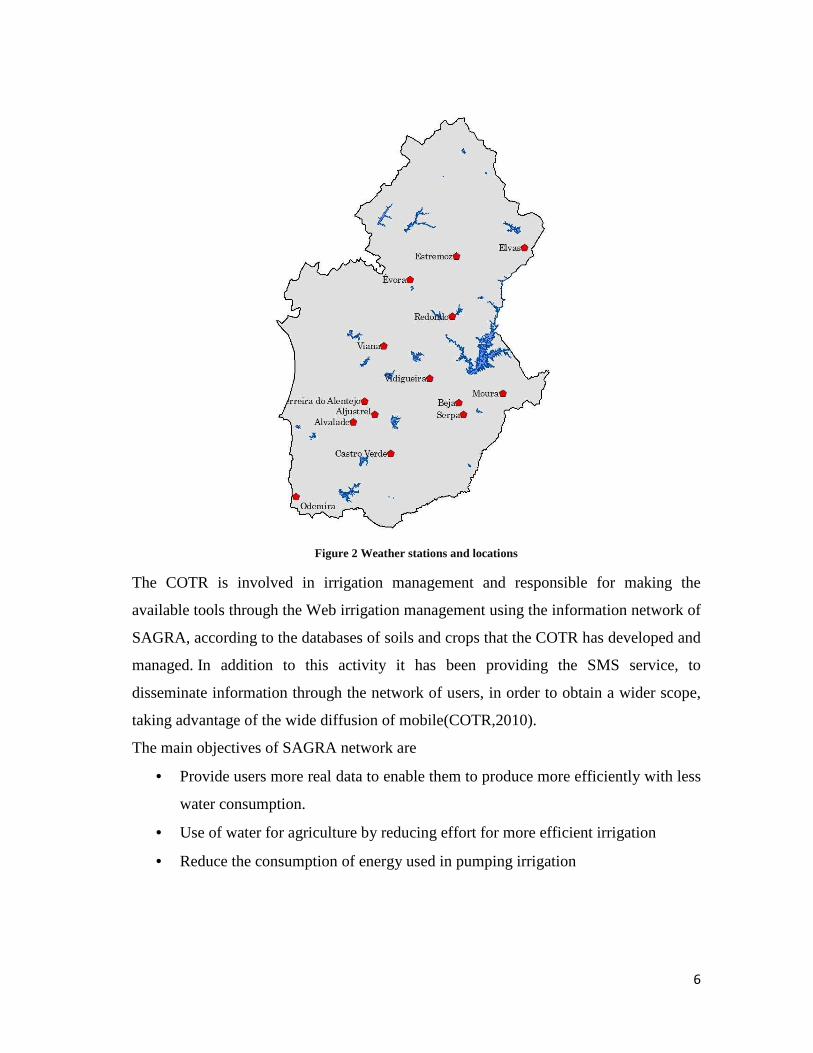
1.5 SAGRA Network
The SAGRA (Sistema Agrometeorológico para a Gestão da Rega no Alentejo) project is
conducted by COTR since 2001 which currently consists of 14 automatic agro
metrological stations and a hub located in Beja south of Portugal. The table 1 and Fig. 4
show the station number, location and name of the stations. By using these weather data
reference evapotranspiration (ETo) is determined (COTR, 2009).
Station No Latitude Longitude Name 1001 -8.2664 38.045 Ferreira do Alentejo 1002 -7.2675 38.0875 Moura 1003 -7.0989 38.9156 Elvas 1004 -7.6278 38.5281 Redondo 1005 -8.1903 37.9714 Aljustrel 1006 -8.3458 37.9289 Alvalade 1007 -7.585 38.0375 Beja 1008 -7.9361 38.7378 Évora 1009 -8.7533 37.5017 Odemira 1011 -8.1256 38.3608 Viana 1012 -7.5969 38.8722 Estremoz 1013 -8.0765 37.75 Castro Verde 1014 -7.7931 38.1769 Vidigueira 1102 -7.5508 37.9683 Serpa
Table 1 Weather station number, location and Name
6
Figure 2 Weather stations and locations
The COTR is involved in irrigation management and responsible for making the
available tools through the Web irrigation management using the information network of
SAGRA, according to the databases of soils and crops that the COTR has developed and
managed. In addition to this activity it has been providing the SMS service, to
disseminate information through the network of users, in order to obtain a wider scope,
taking advantage of the wide diffusion of mobile(COTR,2010).
The main objectives of SAGRA network are
• Provide users more real data to enable them to produce more efficiently with less
water consumption.
• Use of water for agriculture by reducing effort for more efficient irrigation
• Reduce the consumption of energy used in pumping irrigation
7
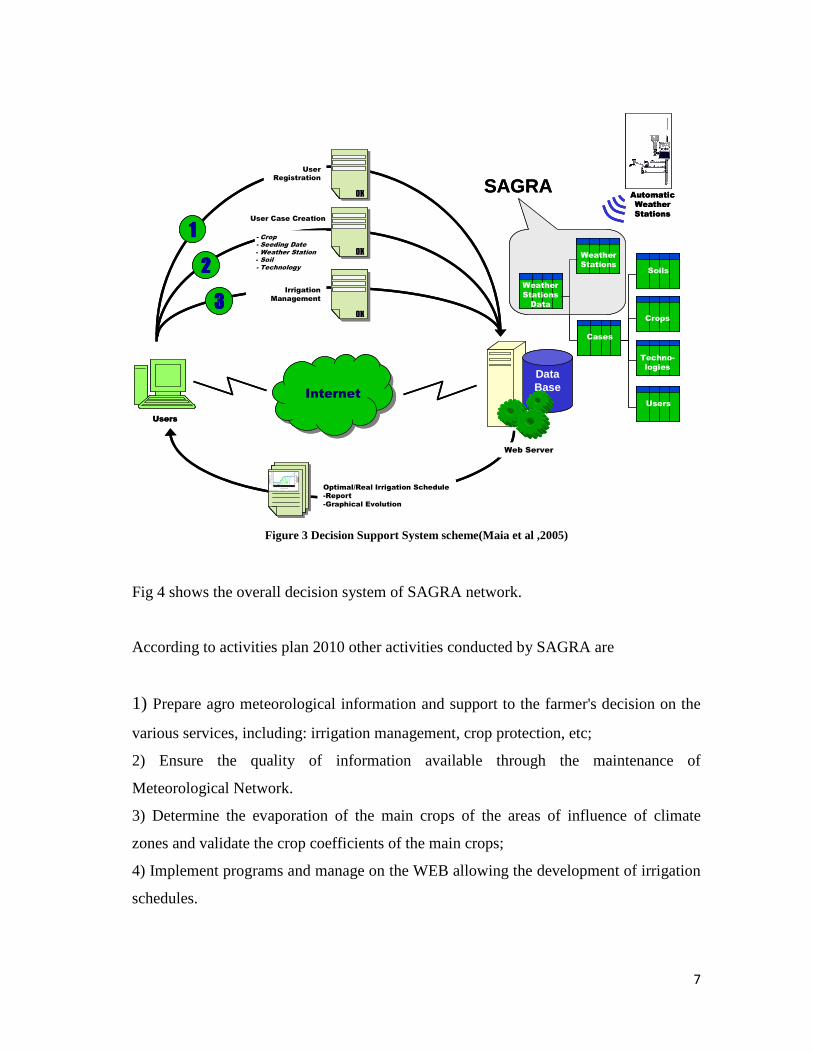
Figure 3 Decision Support System scheme(Maia et al ,2005)
Fig 4 shows the overall decision system of SAGRA network.
According to activities plan 2010 other activities conducted by SAGRA are
1) Prepare agro meteorological information and support to the farmer's decision on the
various services, including: irrigation management, crop protection, etc;
2) Ensure the quality of information available through the maintenance of
Meteorological Network.
3) Determine the evaporation of the main crops of the areas of influence of climate
zones and validate the crop coefficients of the main crops;
4) Implement programs and manage on the WEB allowing the development of irrigation
schedules.
DataBase
Internet
Users
OK
Optimal/Real Irrigation Schedule
-Report
-Graphical Evolution
Weather
Stations
Weather
Stations
Data
Crops
Soils
Users
Cases
Automatic
Weather
Stations
OK
Irrigation
Management
1111
2222
3333
Web Server
OK
User
Registration
SAGRA
0 ,0
10 ,0
20 ,0
30 ,0
40 ,0
50 ,0
60 ,0
70 ,0
80 ,0
135 150 165 180 195 210 225 240 255
Day of Year, 19 74
Dep
leti
on, m
m
0
40
80
120
160
200
Allo wable Dep letio n A ctu al De ple tio n precip itat io n ne t irr igat io n
- Crop- Seeding Date- Weather Station- Soil- Technology
User Case Creation
Techno-
logiesDataBase
Internet
Users
OKOK
Optimal/Real Irrigation Schedule
-Report
-Graphical Evolution
Weather
Stations
Weather
Stations
Weather
Stations
Data
Weather
Stations
Data
CropsCrops
SoilsSoils
UsersUsers
CasesCases
Automatic
Weather
Stations
OKOK
Irrigation
Management
1111
2222
3333
Web Server
OKOK
User
Registration
SAGRA
0 ,0
10 ,0
20 ,0
30 ,0
40 ,0
50 ,0
60 ,0
70 ,0
80 ,0
135 150 165 180 195 2 10 22 5 240 25 5
Day of Year, 19 74
Dep
leti
on, m
m
0
40
80
12 0
16 0
20 0
Allo wable Dep letio n A ctu al De ple tio n precip itat io n ne t irr igat io n
- Crop- Seeding Date- Weather Station- Soil- Technology
User Case Creation
Techno-
logies
8
5) Cooperate in providing support services to the irrigation management to individual
farmers Private, covering various cultures (vineyards, olive and tomato), with
elaboration of management reports customized watering weekly during the irrigation.
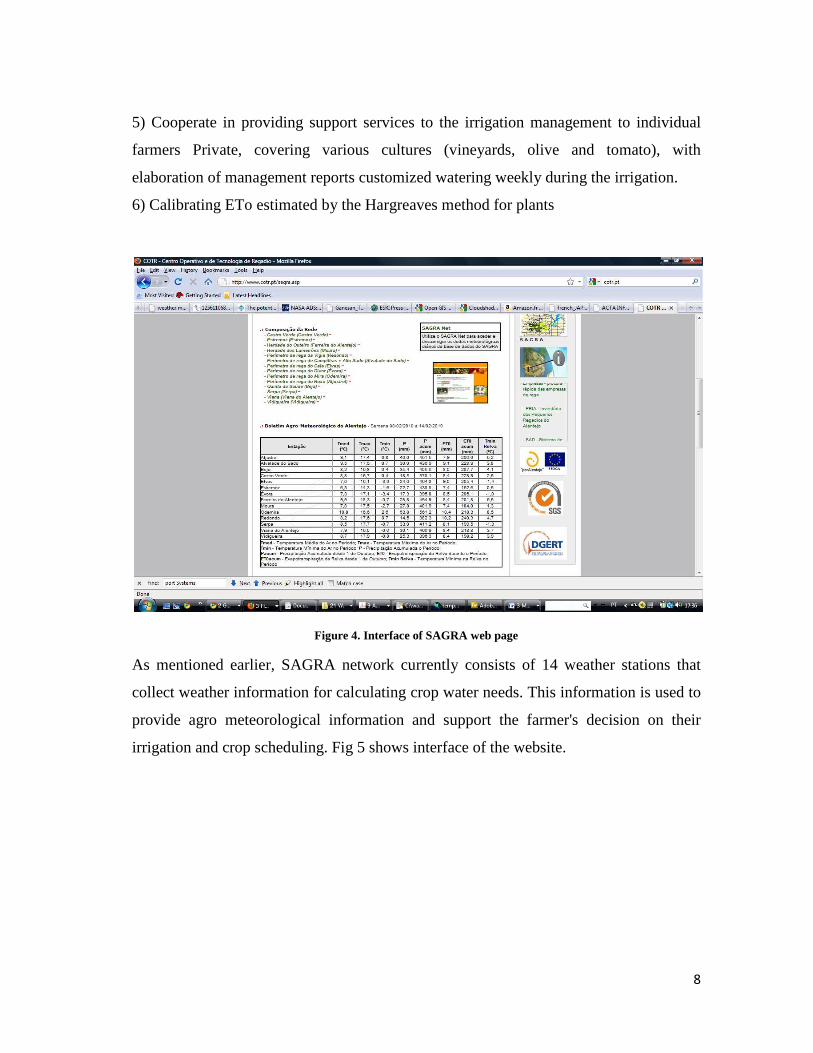
6) Calibrating ETo estimated by the Hargreaves method for plants
Figure 4. Interface of SAGRA web page
As mentioned earlier, SAGRA network currently consists of 14 weather stations that
collect weather information for calculating crop water needs. This information is used to
provide agro meteorological information and support the farmer's decision on their
irrigation and crop scheduling. Fig 5 shows interface of the website.
9
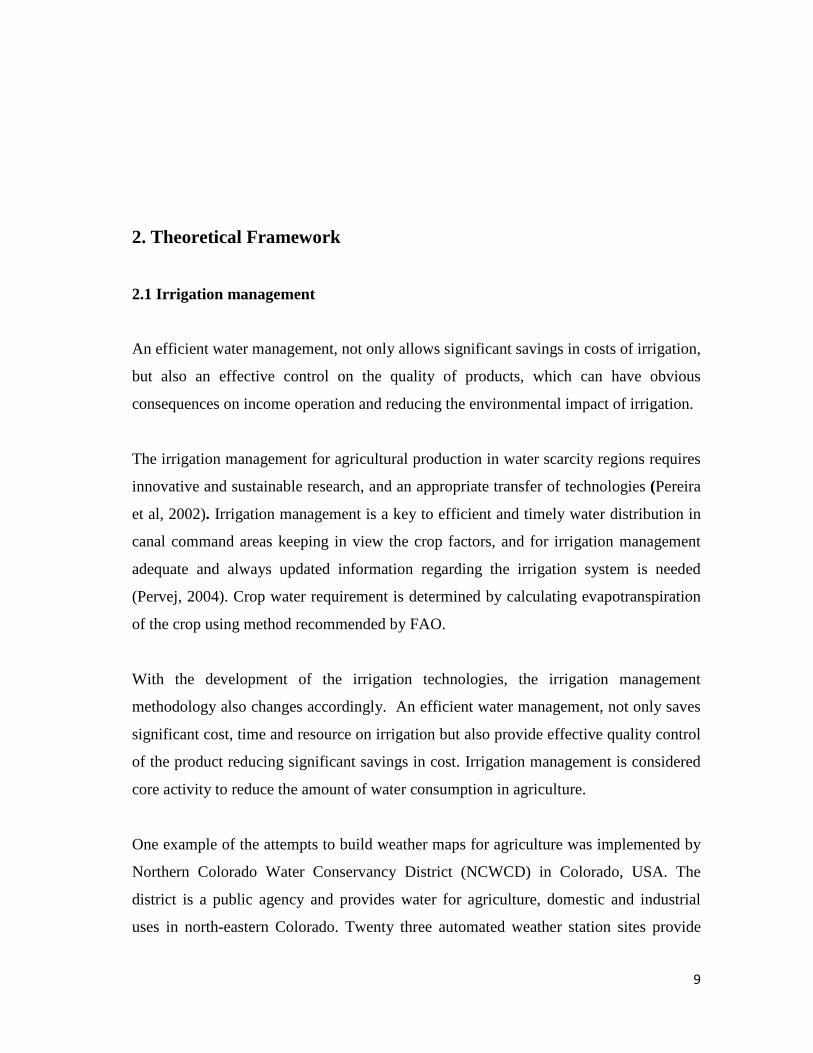
2. Theoretical Framework
2.1 Irrigation management
An efficient water management, not only allows significant savings in costs of irrigation,
but also an effective control on the quality of products, which can have obvious
consequences on income operation and reducing the environmental impact of irrigation.
The irrigation management for agricultural production in water scarcity regions requires
innovative and sustainable research, and an appropriate transfer of technologies (Pereira
et al, 2002). Irrigation management is a key to efficient and timely water distribution in
canal command areas keeping in view the crop factors, and for irrigation management
adequate and always updated information regarding the irrigation system is needed
(Pervej, 2004). Crop water requirement is determined by calculating evapotranspiration
of the crop using method recommended by FAO.
With the development of the irrigation technologies, the irrigation management
methodology also changes accordingly. An efficient water management, not only saves
significant cost, time and resource on irrigation but also provide effective quality control
of the product reducing significant savings in cost. Irrigation management is considered
core activity to reduce the amount of water consumption in agriculture.
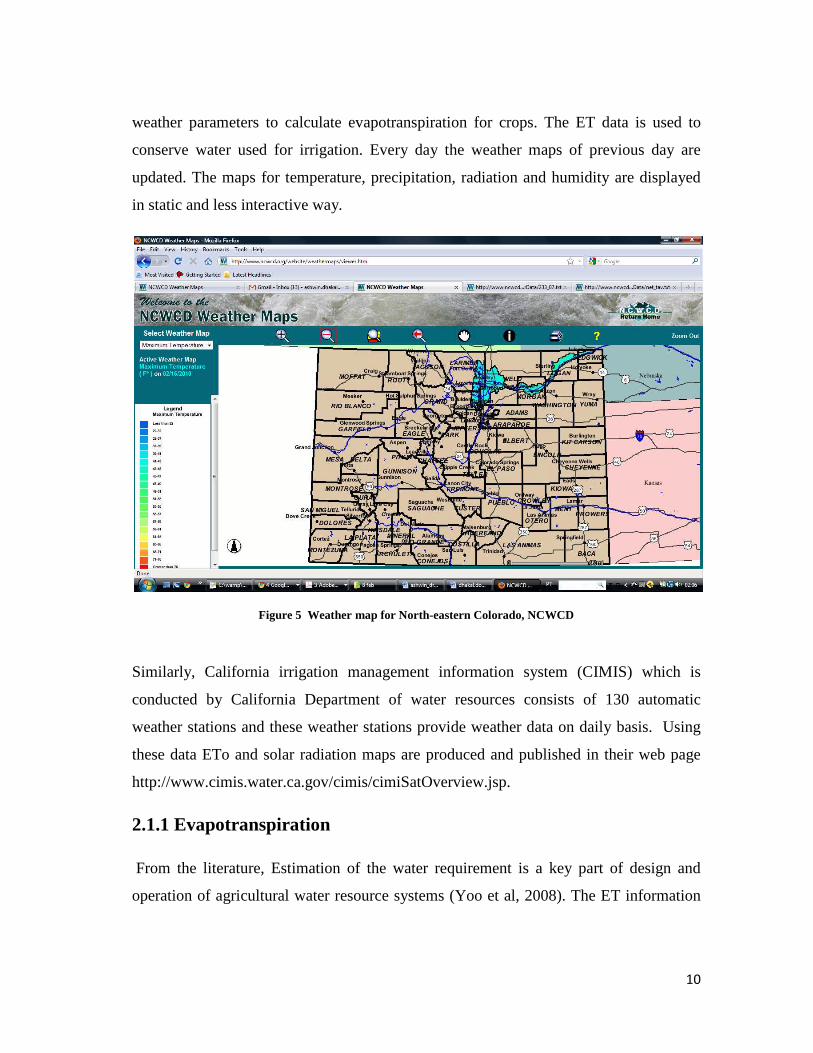
One example of the attempts to build weather maps for agriculture was implemented by
Northern Colorado Water Conservancy District (NCWCD) in Colorado, USA. The
district is a public agency and provides water for agriculture, domestic and industrial
uses in north-eastern Colorado. Twenty three automated weather station sites provide
10
weather parameters to calculate evapotranspiration for crops. The ET data is used to
conserve water used for irrigation. Every day the weather maps of previous day are
updated. The maps for temperature, precipitation, radiation and humidity are displayed
in static and less interactive way.
Figure 5 Weather map for North-eastern Colorado, NCWCD
Similarly, California irrigation management information system (CIMIS) which is
conducted by California Department of water resources consists of 130 automatic
weather stations and these weather stations provide weather data on daily basis. Using
these data ETo and solar radiation maps are produced and published in their web page
http://www.cimis.water.ca.gov/cimis/cimiSatOverview.jsp.
2.1.1 Evapotranspiration From the literature, Estimation of the water requirement is a key part of design and
operation of agricultural water resource systems (Yoo et al, 2008). The ET information
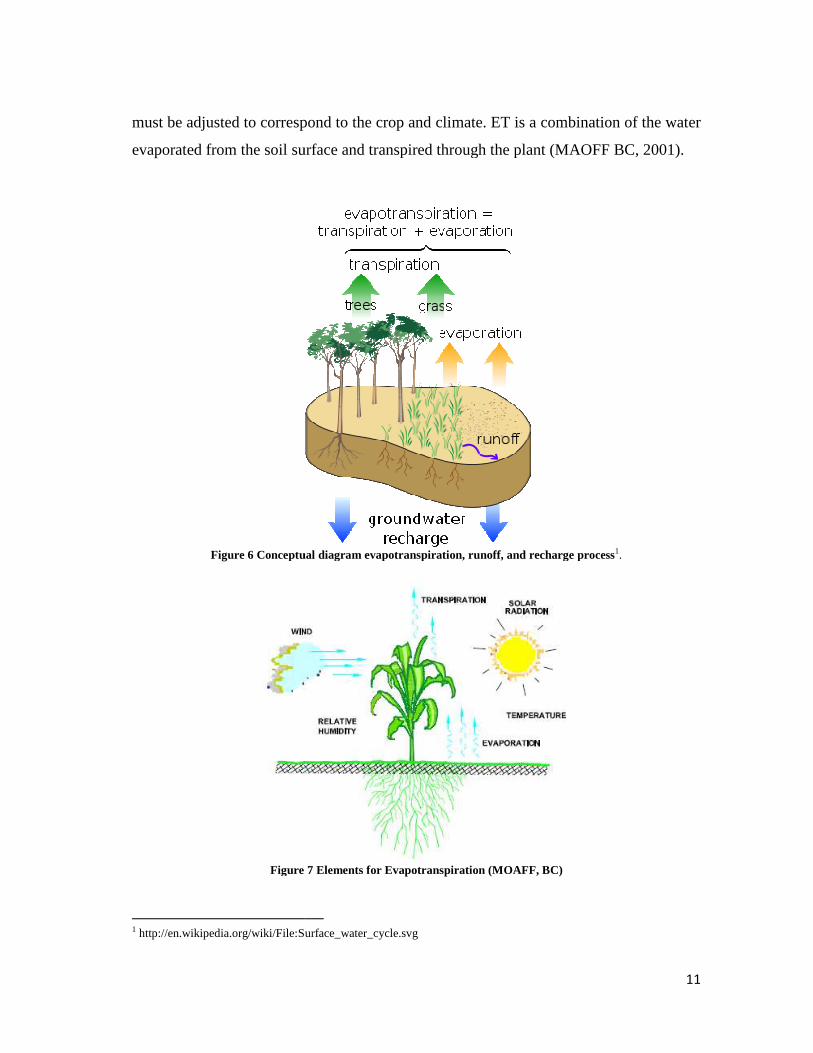
must be adjusted to correspond to the crop and climate. ET is a combination of the water
evaporated from the soil surface and transpired through the plant (MAOFF BC, 2001).
Figure 6 Conceptual diagram evapotranspiration, runoff,
Figure
1 http://en.wikipedia.org/wiki/File:Surface_water_cycle.svg
must be adjusted to correspond to the crop and climate. ET is a combination of the water
urface and transpired through the plant (MAOFF BC, 2001).
Conceptual diagram evapotranspiration, runoff, and recharge process
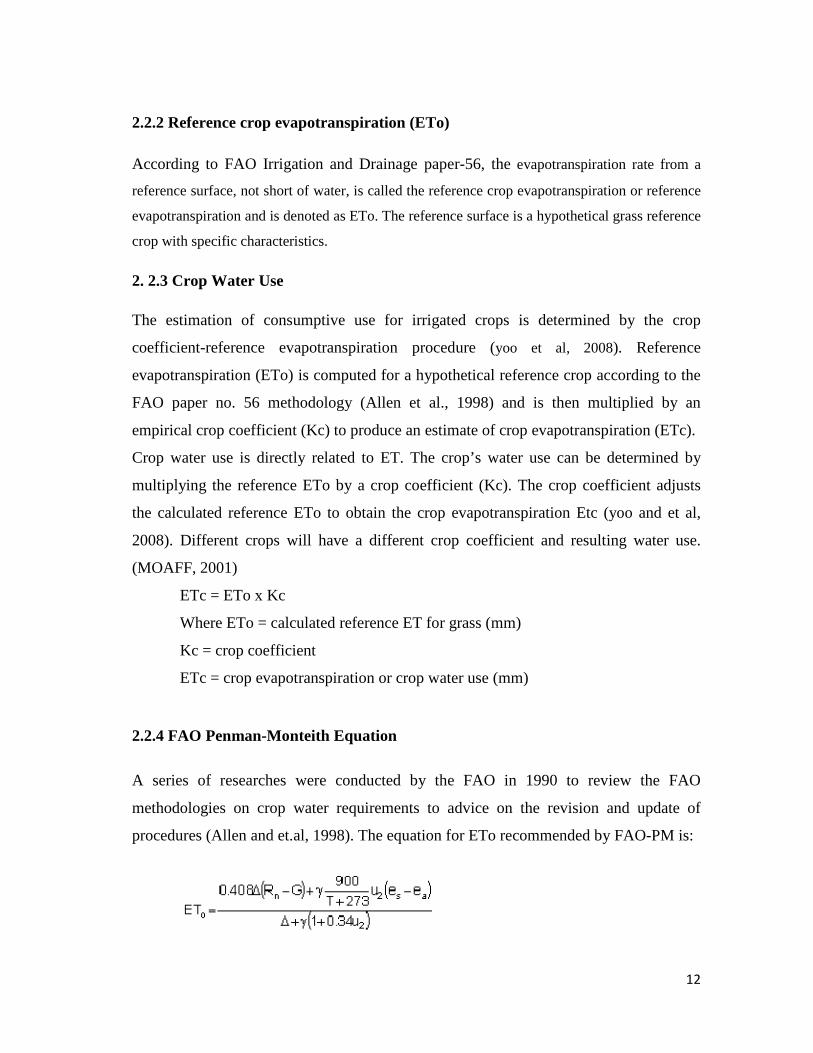
Figure 7 Elements for Evapotranspiration (MOAFF, BC)
http://en.wikipedia.org/wiki/File:Surface_water_cycle.svg
11
must be adjusted to correspond to the crop and climate. ET is a combination of the water
urface and transpired through the plant (MAOFF BC, 2001).
and recharge process1.
12
2.2.2 Reference crop evapotranspiration (ETo) According to FAO Irrigation and Drainage paper-56, the evapotranspiration rate from a
reference surface, not short of water, is called the reference crop evapotranspiration or reference
evapotranspiration and is denoted as ETo. The reference surface is a hypothetical grass reference
crop with specific characteristics.
2. 2.3 Crop Water Use The estimation of consumptive use for irrigated crops is determined by the crop
coefficient-reference evapotranspiration procedure (yoo et al, 2008). Reference
evapotranspiration (ETo) is computed for a hypothetical reference crop according to the
FAO paper no. 56 methodology (Allen et al., 1998) and is then multiplied by an
empirical crop coefficient (Kc) to produce an estimate of crop evapotranspiration (ETc).
Crop water use is directly related to ET. The crop’s water use can be determined by
multiplying the reference ETo by a crop coefficient (Kc). The crop coefficient adjusts
the calculated reference ETo to obtain the crop evapotranspiration Etc (yoo and et al,
2008). Different crops will have a different crop coefficient and resulting water use.
(MOAFF, 2001)
ETc = ETo x Kc
Where ETo = calculated reference ET for grass (mm)
Kc = crop coefficient
ETc = crop evapotranspiration or crop water use (mm)
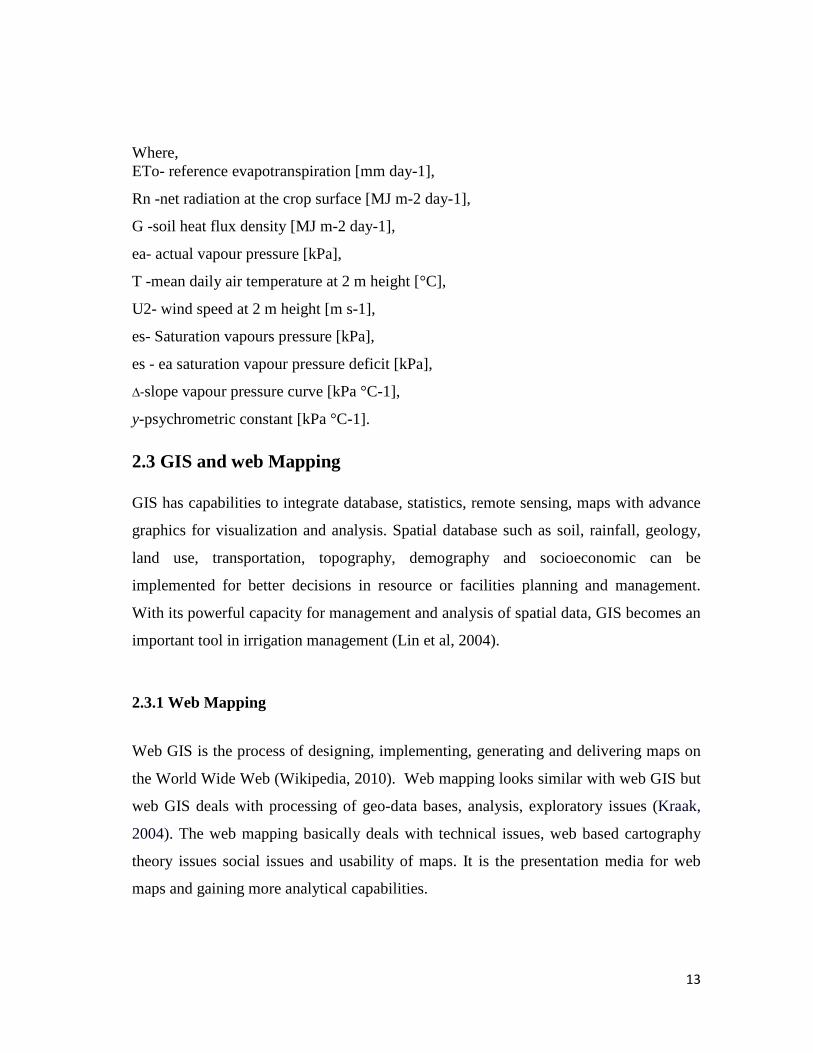
2.2.4 FAO Penman-Monteith Equation
A series of researches were conducted by the FAO in 1990 to review the FAO
methodologies on crop water requirements to advice on the revision and update of
procedures (Allen and et.al, 1998). The equation for ETo recommended by FAO-PM is:
13
Where, ETo- reference evapotranspiration [mm day-1],
Rn -net radiation at the crop surface [MJ m-2 day-1],
G -soil heat flux density [MJ m-2 day-1],
ea- actual vapour pressure [kPa],
T -mean daily air temperature at 2 m height [°C],
U2- wind speed at 2 m height [m s-1],
es- Saturation vapours pressure [kPa],
es - ea saturation vapour pressure deficit [kPa],
∆-slope vapour pressure curve [kPa °C-1],
y-psychrometric constant [kPa °C-1].
2.3 GIS and web Mapping GIS has capabilities to integrate database, statistics, remote sensing, maps with advance
graphics for visualization and analysis. Spatial database such as soil, rainfall, geology,
land use, transportation, topography, demography and socioeconomic can be
implemented for better decisions in resource or facilities planning and management.
With its powerful capacity for management and analysis of spatial data, GIS becomes an
important tool in irrigation management (Lin et al, 2004).
2.3.1 Web Mapping
Web GIS is the process of designing, implementing, generating and delivering maps on
the World Wide Web (Wikipedia, 2010). Web mapping looks similar with web GIS but
web GIS deals with processing of geo-data bases, analysis, exploratory issues (Kraak,
2004). The web mapping basically deals with technical issues, web based cartography
theory issues social issues and usability of maps. It is the presentation media for web
maps and gaining more analytical capabilities.
14
GIS integrates and relates data with spatial component and supports users to view in
proper format which supports in making complex spatial decisions through visualization,
interactive modelling and analysis environments. GIS is thus far utilized to help with
perception and understanding of spatially distributed phenomena in many areas of
decision making and evaluating problems (Sakamoto and Fukui 2004). Generally GIS
systems were considered as monolithic and platform-dependent applications (Wong et
al., 2002). The development and rapid growth of web and web based application created
a new platform for traditional GIS to grow and spread. Unfortunately, not everyone has
access to GIS, nor would be able to spend time necessary to use it effectively. Web GIS
became a cheap and easy way of disseminating geospatial data and processing tools
(Alesheikh et al, 2002). Web GIS have the highest number of users, although typically
Internet users focus on simple display and query tasks. (Goodchild et al, 2005). The
capability of Web GIS for interacting dynamically in distributed environment from cross
platform to client/ server computing system made it more interesting to develop and use
for accessing spatial information.
The major development of cartography is using web as a distribution medium. By the
means of web, now it has opened the possibility of the availability of real-time maps,
cheaper maps sharing, more frequently updated database sources and cheaper software
and hardware requirement. There are some problem and difficulties for fully
development of web mapping. Some technical difficulties such as bandwidth, lower
resolution of image are common. Reliability issues and security issues are limited the
expansion of web mapping.
The development of web cartography and GIS is steady as compare to web technologies.
Web 2.0, a new generation of Internet services and technology (Deshpande et al, 2006),
support user interaction significantly. This evolution leads GIS away from data
browsing, analyzing and managing for individual decisions, and more towards group
participating and communicating on social decision issues (Carver 1999). As Craig et al.
(1999) describe the Public Participation GIS principles as accessibility, understand
15
ability, and accountability, Web GIS continues to draw attention as a public participation
tool (Sakamoto et al 2004).
Nowadays, Google Maps, Google Earth, OpenStreet Map, Yahoo Maps, Microsoft’s
Live Search Maps and other many commercial as well as non-commercial applications
provide many kinds of geographical related information such as detailed maps, satellite
images and terrain maps covering all over the world and allow users to use their
APIs.(Zhelu, 2009).
2.3.2 Advantages of web mapping
Web mapping improves communication with the users who understand maps and it the
easiest way to improve the internal and external communication (Stachowicz , 2004). In
distributed and heterogeneous network environments web GIS provides interoperability,
reusability, and flexibility (Tsou et al, 2002). The clients or users are free to use the
stored large amount of data. It reduces the major problem of database collection and
searching.
16
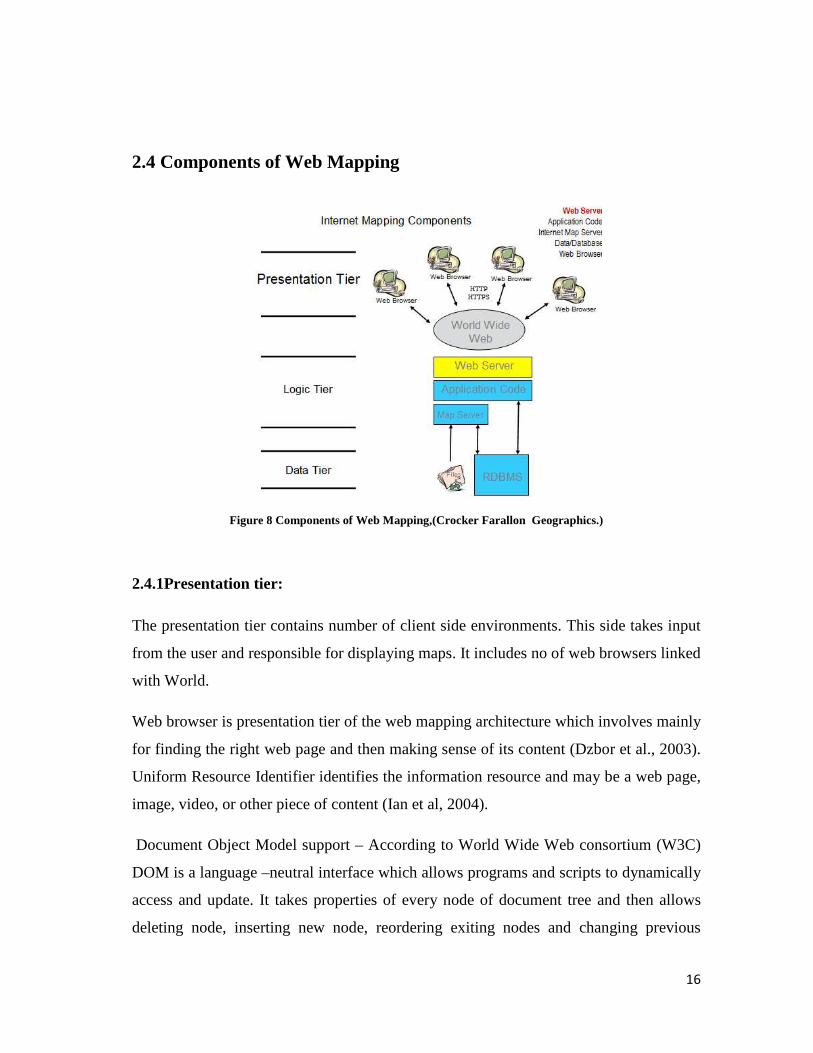
2.4 Components of Web Mapping
Figure 8 Components of Web Mapping,(Crocker Farallon Geographics.)
2.4.1Presentation tier: The presentation tier contains number of client side environments. This side takes input
from the user and responsible for displaying maps. It includes no of web browsers linked
with World.
Web browser is presentation tier of the web mapping architecture which involves mainly
for finding the right web page and then making sense of its content (Dzbor et al., 2003).
Uniform Resource Identifier identifies the information resource and may be a web page,
image, video, or other piece of content (Ian et al, 2004).
Document Object Model support – According to World Wide Web consortium (W3C)
DOM is a language –neutral interface which allows programs and scripts to dynamically
access and update. It takes properties of every node of document tree and then allows
deleting node, inserting new node, reordering exiting nodes and changing previous
17
nodes. Google Maps, yahoo and Microsoft live and other web mapping sites apply a
combination of Ajax, DHTML and SVG.
Scalable Vector Graphics support or image support – SVG integrates raster graphics,
vector graphics, and the text. SVG supports, scripting and XML extension, animation,
interactivity, mechanisms. SVG is ahead in providing high quality and providing
interactive maps. SVG is supported most of the client side browsers nowadays.
2.4.2 Logic tier:
Logic tier of consist web server, application code and webGIS server. Web server takes
user request and transfer output map result to the clients. Users request information is
transfer to application code where the request of user is compiled, detects the user
required information and sends the information to the map server. The map server
detects which map is requested and sends information to data base. After receiving map
data from data base server the map is processed. Editing, processing on map and
generating output map are done this tier. Output maps are sending to the client web
browser through the internet.
Web servers connect different software components with web server and a scripting
language. Web server applications can communication with the API of a GIS, web
server and with the spatial database of other applications. These Web servers are also
very useful when we are developing complex web mapped applications, real time web
maps or Web GIS.
2.4.3 Data base tier:
GIS and geospatial data are growing in importance for the Community, because they
allow users to examine new types of information in new ways (Meyer, 2004). This tier is
responsible for keeping map data in organized way. Relational database model is
responsible for making relational database table for efficient retrieval of data. It sends
and receives instruction and information through maps server and application code
18
compiling centre. Map file stores the whole map in a file which is accessed by map
server.
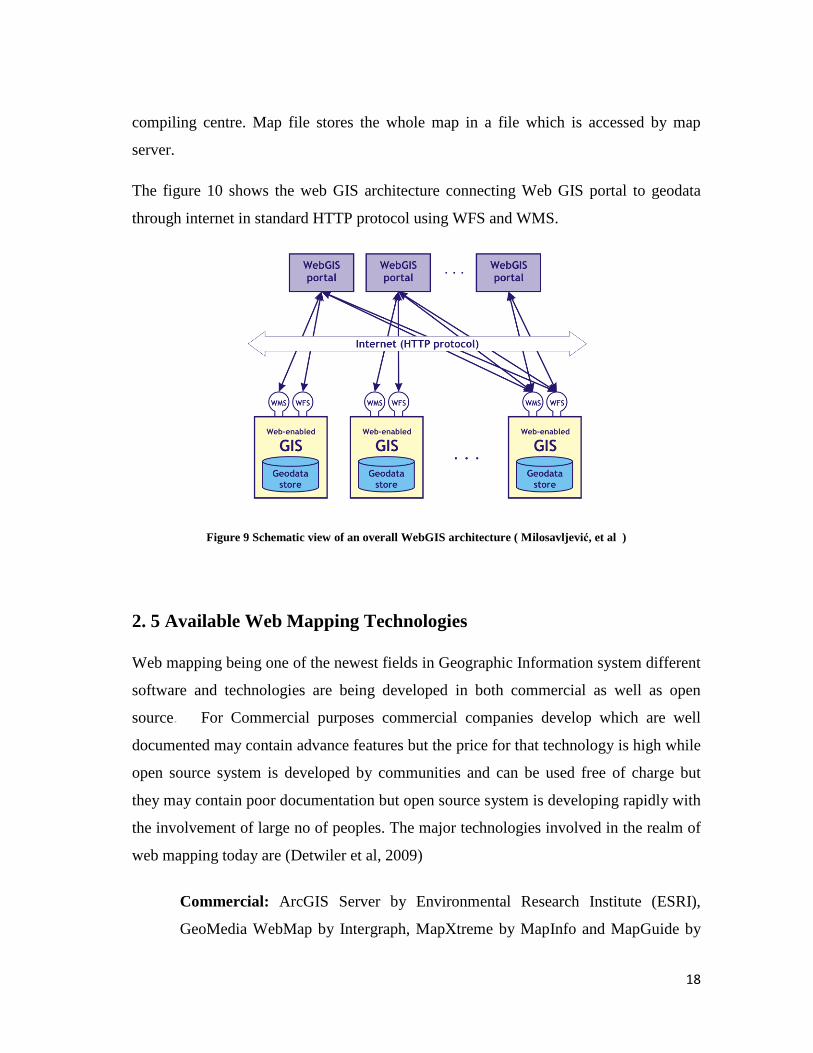
The figure 10 shows the web GIS architecture connecting Web GIS portal to geodata
through internet in standard HTTP protocol using WFS and WMS.
Figure 9 Schematic view of an overall WebGIS architecture ( Milosavljević, et al )
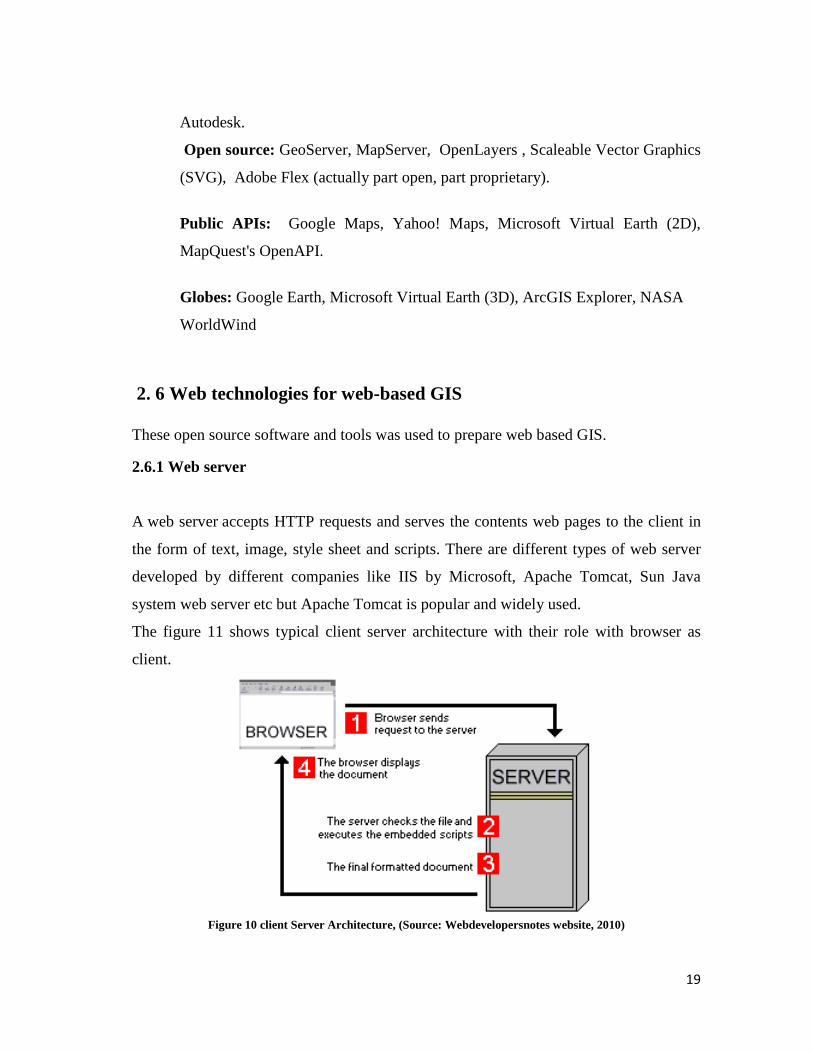
2. 5 Available Web Mapping Technologies
Web mapping being one of the newest fields in Geographic Information system different
software and technologies are being developed in both commercial as well as open
source. For Commercial purposes commercial companies develop which are well
documented may contain advance features but the price for that technology is high while
open source system is developed by communities and can be used free of charge but
they may contain poor documentation but open source system is developing rapidly with
the involvement of large no of peoples. The major technologies involved in the realm of
web mapping today are (Detwiler et al, 2009)
Commercial: ArcGIS Server by Environmental Research Institute (ESRI),
GeoMedia WebMap by Intergraph, MapXtreme by MapInfo and MapGuide by
19
Autodesk.
Open source: GeoServer, MapServer, OpenLayers , Scaleable Vector Graphics
(SVG), Adobe Flex (actually part open, part proprietary).
Public APIs: Google Maps, Yahoo! Maps, Microsoft Virtual Earth (2D),
MapQuest's OpenAPI.
Globes: Google Earth, Microsoft Virtual Earth (3D), ArcGIS Explorer, NASA
WorldWind
2. 6 Web technologies for web-based GIS These open source software and tools was used to prepare web based GIS.
2.6.1 Web server
A web server accepts HTTP requests and serves the contents web pages to the client in
the form of text, image, style sheet and scripts. There are different types of web server
developed by different companies like IIS by Microsoft, Apache Tomcat, Sun Java
system web server etc but Apache Tomcat is popular and widely used.
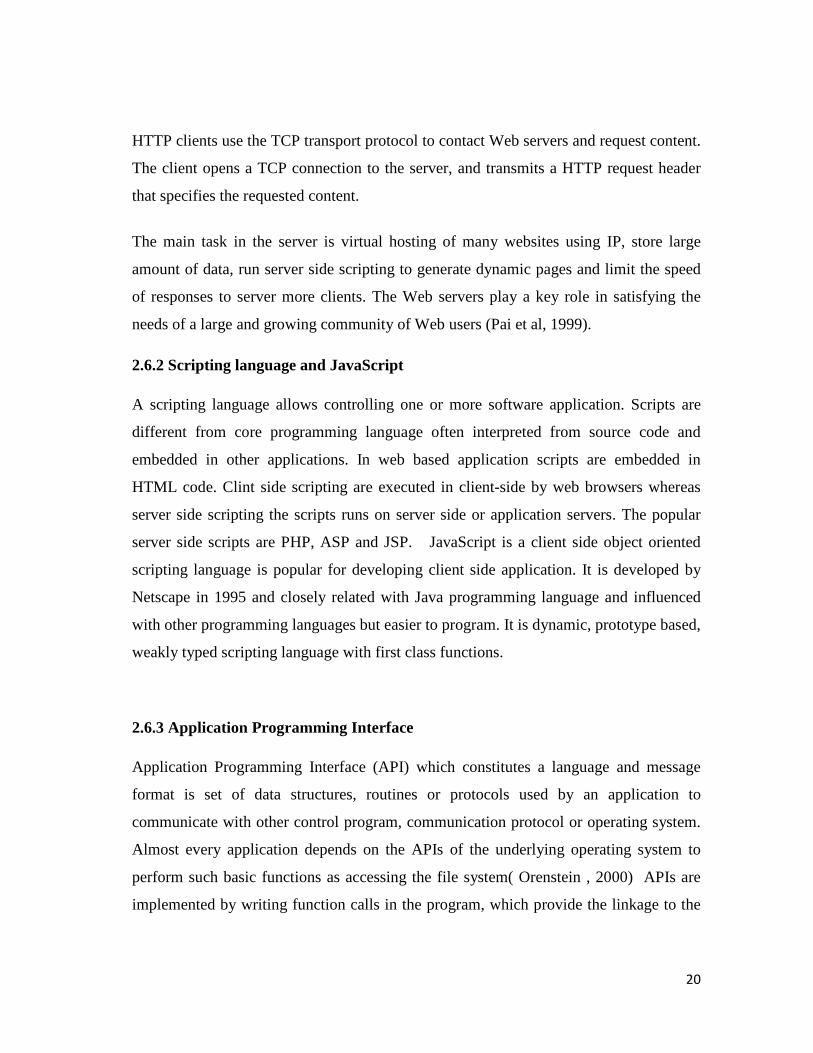
The figure 11 shows typical client server architecture with their role with browser as
client.
Figure 10 client Server Architecture, (Source: Webdevelopersnotes website, 2010)
20
HTTP clients use the TCP transport protocol to contact Web servers and request content.
The client opens a TCP connection to the server, and transmits a HTTP request header
that specifies the requested content.
The main task in the server is virtual hosting of many websites using IP, store large
amount of data, run server side scripting to generate dynamic pages and limit the speed
of responses to server more clients. The Web servers play a key role in satisfying the
needs of a large and growing community of Web users (Pai et al, 1999).
2.6.2 Scripting language and JavaScript A scripting language allows controlling one or more software application. Scripts are
different from core programming language often interpreted from source code and
embedded in other applications. In web based application scripts are embedded in
HTML code. Clint side scripting are executed in client-side by web browsers whereas
server side scripting the scripts runs on server side or application servers. The popular
server side scripts are PHP, ASP and JSP. JavaScript is a client side object oriented
scripting language is popular for developing client side application. It is developed by
Netscape in 1995 and closely related with Java programming language and influenced
with other programming languages but easier to program. It is dynamic, prototype based,
weakly typed scripting language with first class functions.
2.6.3 Application Programming Interface Application Programming Interface (API) which constitutes a language and message
format is set of data structures, routines or protocols used by an application to
communicate with other control program, communication protocol or operating system.
Almost every application depends on the APIs of the underlying operating system to
perform such basic functions as accessing the file system( Orenstein , 2000) APIs are
implemented by writing function calls in the program, which provide the linkage to the
21
required subroutine for execution. An API entails program module in computer to
perform the operation or links to the existing program to perform the tasks2.
Based on function and interaction the API also differs in the implementation in that
environment. Generic APIs are full set of APIs included in library of programming
languages. These API interacts with operating system, DBMS and other applications and
facilitate interaction between users and the computers. Specific API only addresses
defined specific problems like yahoo API, Google API. Language specific API operate
in a specific language using syntax and components of that language where as language
independent APIs can operate in different application and programming language. This
feature of language independent APIs is required feature of service oriented API which doesn’t
limit on specific system, process or platform and useful for web services.
The API itself is largely abstract in that it specifies an interface and the behaviour of the
objects specified in that interface. The API acronym may sometimes be used as a
reference not only to the full interface but also to a single function or even a set of
multiple APIs provided by an organization. Thus the scope is usually determined by the
person or document that communicates the information. Based on the API documents,
the user could learn and combine exist functions in the application more easily and
efficiently.
2.7 Open Source and Open Standards
The OGC was founded in 1994 as an international voluntary consensus standards
organization for geospatial data and web services. Now The OGC has more than 395
organizations specifically from government, Academia, industry, non-profit and research
organizations (Openspatial, 2010). The Consortium was founded for providing open
specifications at free of charge to acquire and/or Implement, thus provides standards-
based interfaces for geographical data discovery, access, manipulate, Visualization and
processing. The open specification provides information about a given specification as 2http://www.pcmag.com/encyclopedia_term/0,2542,t=application+programming+interface&i=37856,00.asp
22
well as specific programming rules and advice for implementing the interfaces and/or
protocols that enable interoperability between systems (Sanchez et al, 2007).
The OGC leverages existing efforts from other standards organizations such as the W3C,
ISO, and the Organization for the Advancement of Structured Information Standards
(OASIS), and builds upon them in reference to the spatial data domain (Kralidis, 2008).
OGC standards depend on a generalized architecture captured in a set of documents
collectively called the Abstract Specification, which describes a basic the data model for
representing geographic features3.
The members of abstract specification are developing and growing the number of
specification and provides the reference model for implementation of the consortium
specification. According to Kottman the main areas covered by the Abstract
Specification include (Kottman, 1999 and Kralidis, 2008).
• Spatial Referencing by Coordinates
• Feature Geometry
• Features
•The Coverage Type
• Relationships between Features
• Feature Collections
• The OpenGIS Service Architecture
The OGC has an advanced and progressive development process for its specification
which requires common consensus between specific working group members. These
specifications developed, tested in OGC testing environments called “testbeds, and pilot
project. Typical specification development takes place by defining, adopting, and
publishing the specification document for vendors and others to implement (Kralidis,
2008).
3 http://en.wikipedia.org/wiki/Open_Geospatial_Consortium
23
2.7.1 Open specifications standards
WMSA Web Map Service (WMS) is a standard protocol for serving geo-referenced map
images over the Internet that are generated by a map server using data from
a GIS database (Openspatial, 2009). The WMS contains a HTTP interface for requesting
geo registered maps from different distributed databases. A WMS sends a request to
server defining map layer and area of interest in the layer to be processed. The response
to the request is one is generally rendered in a pictorial format such as PNG, GIF or
JPEG, or occasionally as vector-based graphical elements in Scalable Vector Graphics
(SVG) or Web Computer Graphics Metafile (WebCGM) formats (OGC, 2002) which
can be displayed in browser.
WMS specifies different request types, out of which two are used by any WMS server
� GetCapabilities - returns parameters about WMS service, such as image formats
which it can serve and provides the lists of one or more map layers available in the
service. � GetMap - with parameters provided its requests returns a map from the server.
Clients are allowed to specify reference system, layers, geographic area and other
parameters.
Some other supported Request types that WMS providers include:
� GetFeatureInfo
� GetLegendGraphic
� DescribeLayer
Web Feature Service: The OGC WFS defines interfaces for data access and
manipulation operations on geographic features using HTTP as the distributed
computing platform. This standard specifies operations to retrieve a description of the
maps offered by a service instance, to retrieve a map, and to query a server about
features displayed on a map (Hampe et al., 2006). Data manipulation operations include
24
the ability to create, update, and query and delete spatial and non-spatial features. The
user generates the request and sends it to a WFS server using HTTP. The WFS server
then executes the request. Two encoding defined for WFS operations GET and POST.
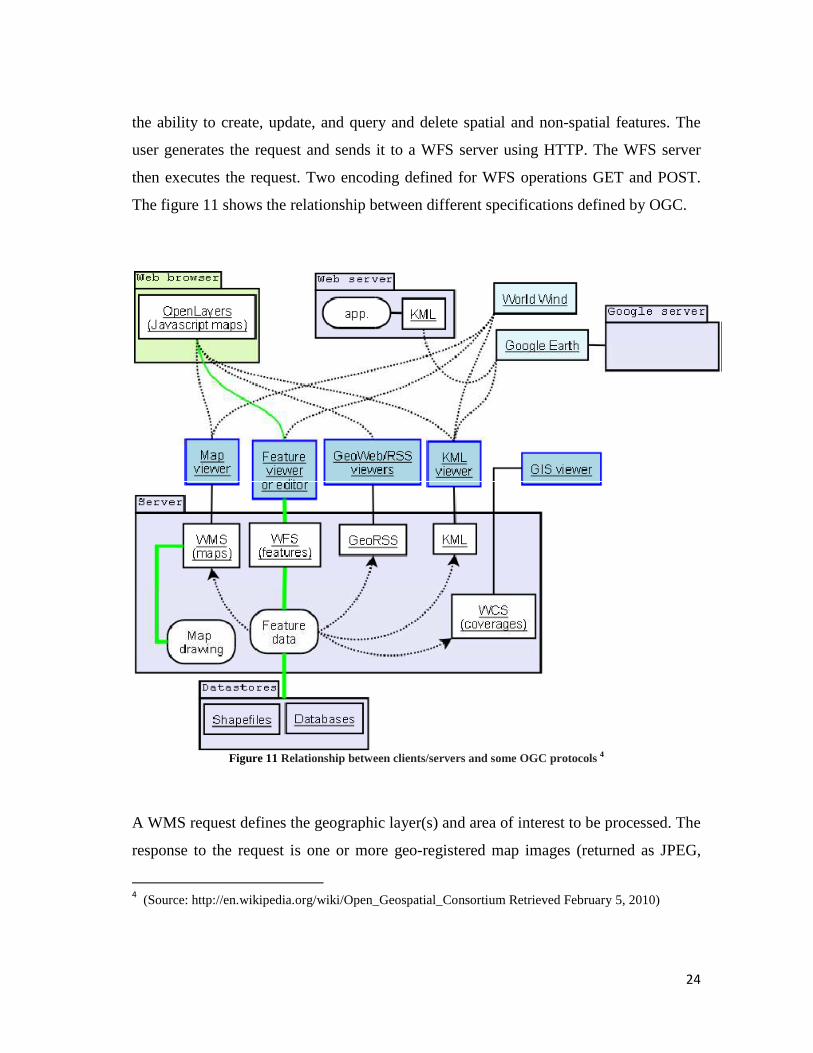
The figure 11 shows the relationship between different specifications defined by OGC.
Figure 11 Relationship between clients/servers and some OGC protocols 4
A WMS request defines the geographic layer(s) and area of interest to be processed. The
response to the request is one or more geo-registered map images (returned as JPEG,
4 (Source: http://en.wikipedia.org/wiki/Open_Geospatial_Consortium Retrieved February 5, 2010)
25
PNG, etc) that can be displayed in a browser application (Openspatial, 2010). The
interface also supports the ability to specify whether the returned images should be
transparent so that layers from multiple servers can be combined or not. Therefore, it
allows for a smooth integration of different (raster or vector) maps in web mapping
applications over the Internet (Schütze 2007).
The publishing way of traditional WebGIS includes raster-map mode and vector-map
mode. Recently, with the increasing popularity of global on-line web mapping
applications (e.g. Google Maps, Microsoft Virtual Earth, Yahoo Maps), the raster Tile-
Map mode replaces vector map gradually. A tile caches service has a set of map images
that have been pre-rendered for rapid display (Quinn et al, 2008). Map tiles are a set of
map images that have been pre-generated based on geographic vector data and the
adoption of tile-map technique in the developed system dramatically decreases the
loading time consumed for high quality image visualizations (Haiting et al, 2009). Map
tiles are extremely efficient and capable of running large images over the internet. In
Google maps commonly have zero to twenty pyramid layers covering entire globe.
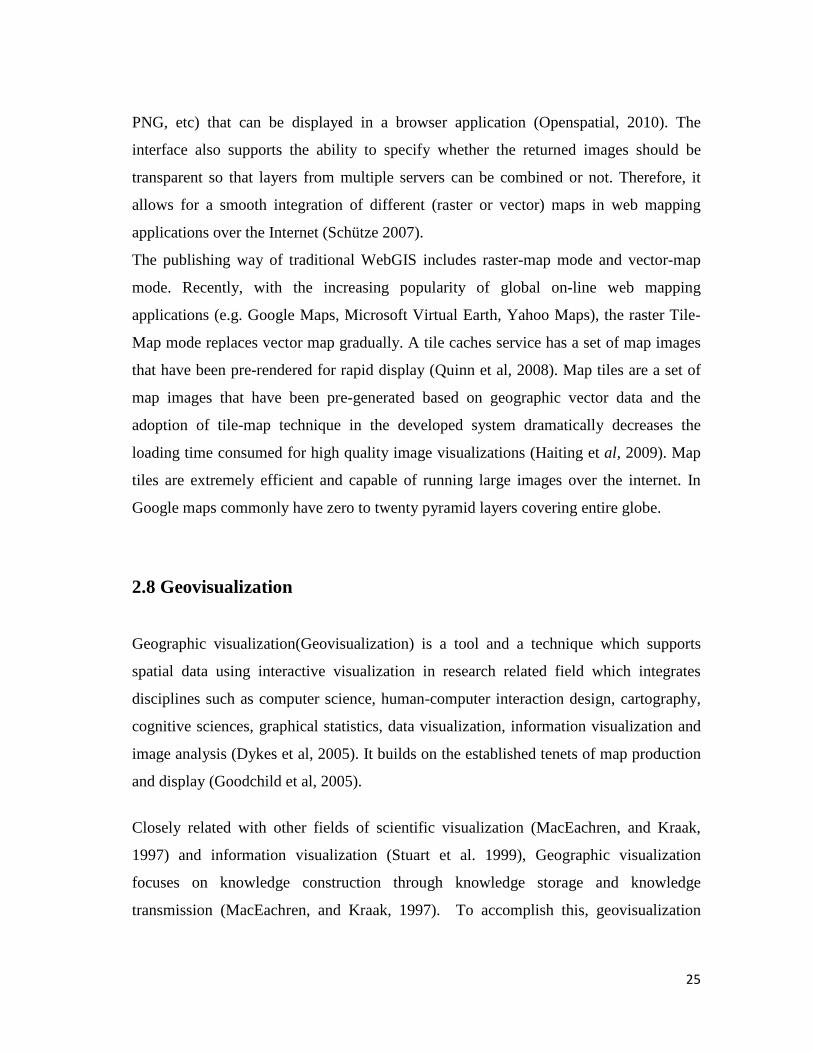
2.8 Geovisualization
Geographic visualization(Geovisualization) is a tool and a technique which supports
spatial data using interactive visualization in research related field which integrates
disciplines such as computer science, human-computer interaction design, cartography,
cognitive sciences, graphical statistics, data visualization, information visualization and
image analysis (Dykes et al, 2005). It builds on the established tenets of map production
and display (Goodchild et al, 2005).
Closely related with other fields of scientific visualization (MacEachren, and Kraak,
1997) and information visualization (Stuart et al. 1999), Geographic visualization
focuses on knowledge construction through knowledge storage and knowledge
transmission (MacEachren, and Kraak, 1997). To accomplish this, geovisualization
26
communicates with spatial information and combines with human vision and domain
expertise, which allow data exploration and support decision-making processes (Jiang et
al. 2005 and MacEachren, 2004).
Static maps have a limited exploratory capability while the animated maps spans the
spectrum of disseminating spatial knowledge to a wide audience to data exploration for
knowledge discovery by experts( Harrower, M., 2008) example of such animations are
weather maps animation in television. It also allows more interactive options like
changing visual appearance, zooming in or out and explores more layers (Jiang et al.
2003). Geovisualization characterizes a further improvement in cartography that takes
advantage of the modern computers power to render changes to a map, allowing users to
adjust the mapped data on the fly (MacEachren and Kraak, 1997).
Owing to its roots from cartography, geovisualization supports to visualize other non-
geographic attributes from other fields by the way of the map metaphor in the domains
of information and knowledge visualization (Jiang, and et al. 2005).
27
3 .Applications used for implementation
3.1 Openlayers
Openlayers is an OSGeo supported project and works in browser (JavaScript/AJAX)
application for accessing and displaying map tiles, features and markers from different
and wide range of data sources. Open source JavaScript library is released under a BSD-
style License for displaying a dynamic map in web browsers and provides the
functionality of managing and manipulating data in the browser. It is open source hence
it can be used for re-development, re-use, and updating. It supports different data
formats and web services which includes Keyhole Markup Language (KML),
Geography Mark-up Language(GML), WMS/WFS Services, Web Map/Feature
Services, Representational State Transfer requests(REST), Geographic JavaScript Object
(GeoJSON), GeoRSS, TileCache web accessible caches and other many commercial
and free web map services like Google maps, Yahoo! Maps , Microsoft bing map, World
Wind, etc. OpenLayers allows using JavaScript to display feature information on a map.
This feature information might come directly from a UI, or GeoJSON feed, or it might
originate from a GML or KML data source (Ganesan, 2009)
3.2 PostGIS PostGIS isn't only a geographic data storage extension. It has capabilities from other
projects that allow it to manipulate geographic data directly in the database. The ability
to manipulate data using simple SQL sets it ahead of many commercial alternatives that
act only as proprietary data stores. Their geographic data is encoded so that only their
proprietary tools can access and manipulate the data (Tyler, 2005).
PostGIS is popularly used in map data storage and manipulation. It is ideal for multi
tasking applications for accessing information simultaneously. Other GIS application
and mapping tools can interact with PostGIS. GeoServer uses the OGC Transactional
WFS (WFS-T) standard for accessing PostGIS and other formats. A PostGIS function
also returns Scalable Vector Graphics (SVG) formats.
A PostGIS spatial include many of the functions similar to normal databases like using
SQL commands to accessing data. It also includes the PostGIS geometry data which are
used to create, manipulate and summarize
allow for a range of manipulation as well as conversion into different data types (Tyler,
2005).
3.3 GeoServer
GeoServer is a Java-based server that allows users to view and edit geospatial data.
Implementing the Web Map
variety of output formats.
GeoServer, making map generation quick and easy. GeoServer is built on
open source Java GIS toolkit (Geoserver, 2010). There is much more to GeoServer than
nicely styled maps, though. GeoServer also conforms to the
(WFS) standard, which permits the actual sharing and editing of the data that is used to
generate the maps. Others ca
freeing your data and permitting greater transparency
Figure 12 Geoserver
and mapping tools can interact with PostGIS. GeoServer uses the OGC Transactional
T) standard for accessing PostGIS and other formats. A PostGIS function
ns Scalable Vector Graphics (SVG) formats.
A PostGIS spatial include many of the functions similar to normal databases like using
SQL commands to accessing data. It also includes the PostGIS geometry data which are
used to create, manipulate and summarize new spatial data. Many PostGIS functions
allow for a range of manipulation as well as conversion into different data types (Tyler,
based server that allows users to view and edit geospatial data.
Map Service (WMS) standard, GeoServer can create maps in a
variety of output formats. Openlayers, a free mapping library, is integrated into
GeoServer, making map generation quick and easy. GeoServer is built on
kit (Geoserver, 2010). There is much more to GeoServer than
nicely styled maps, though. GeoServer also conforms to the Web Feature
standard, which permits the actual sharing and editing of the data that is used to
generate the maps. Others can incorporate your data into their websites and applications,
permitting greater transparency (Geoserver, 2010)
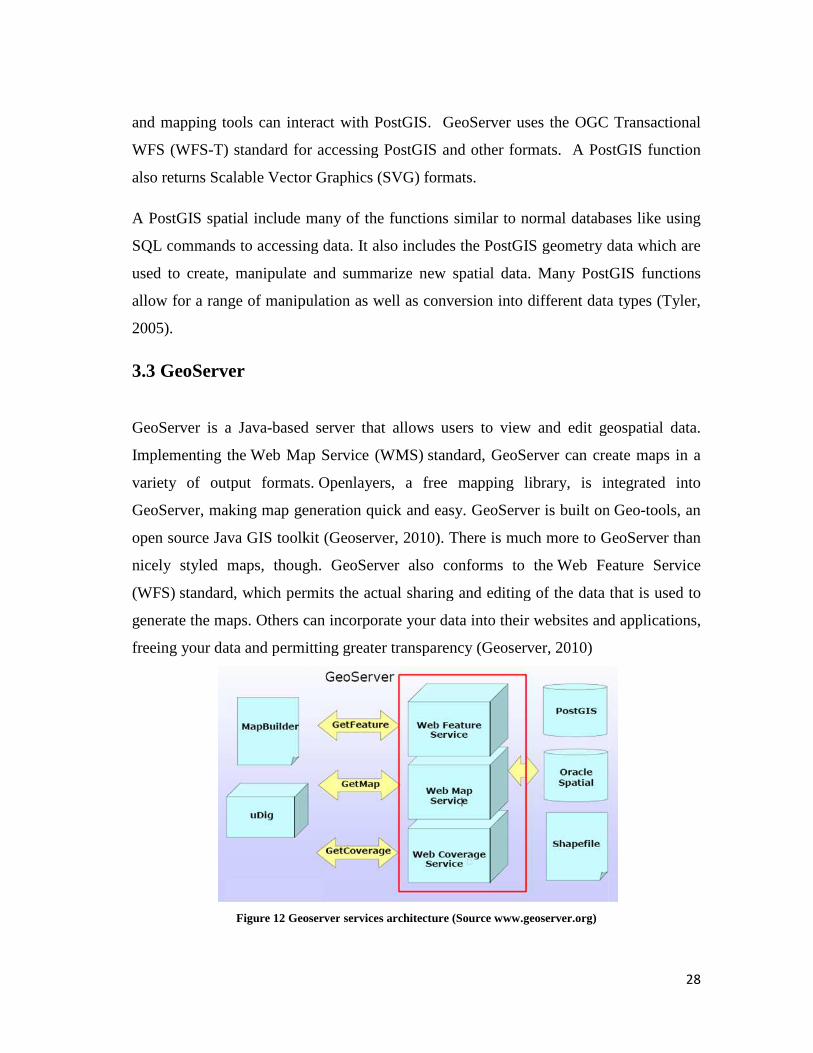
Geoserver services architecture (Source www.geoserver.org)
28
and mapping tools can interact with PostGIS. GeoServer uses the OGC Transactional
T) standard for accessing PostGIS and other formats. A PostGIS function
A PostGIS spatial include many of the functions similar to normal databases like using
SQL commands to accessing data. It also includes the PostGIS geometry data which are
PostGIS functions
allow for a range of manipulation as well as conversion into different data types (Tyler,
based server that allows users to view and edit geospatial data.
standard, GeoServer can create maps in a
, a free mapping library, is integrated into
GeoServer, making map generation quick and easy. GeoServer is built on Geo-tools, an
kit (Geoserver, 2010). There is much more to GeoServer than
Feature Service
standard, which permits the actual sharing and editing of the data that is used to
n incorporate your data into their websites and applications,
29
GeoServer is the reference Implementation of the WFS and WCS standards, as well as a
high performance certified compliant WMS. GeoServer forms a core component of the
Geospatial Web. Compared to the MapServer, GeoServer supports the most of GIS
functions rather than only publish spatial data (Zhelu, 2009).
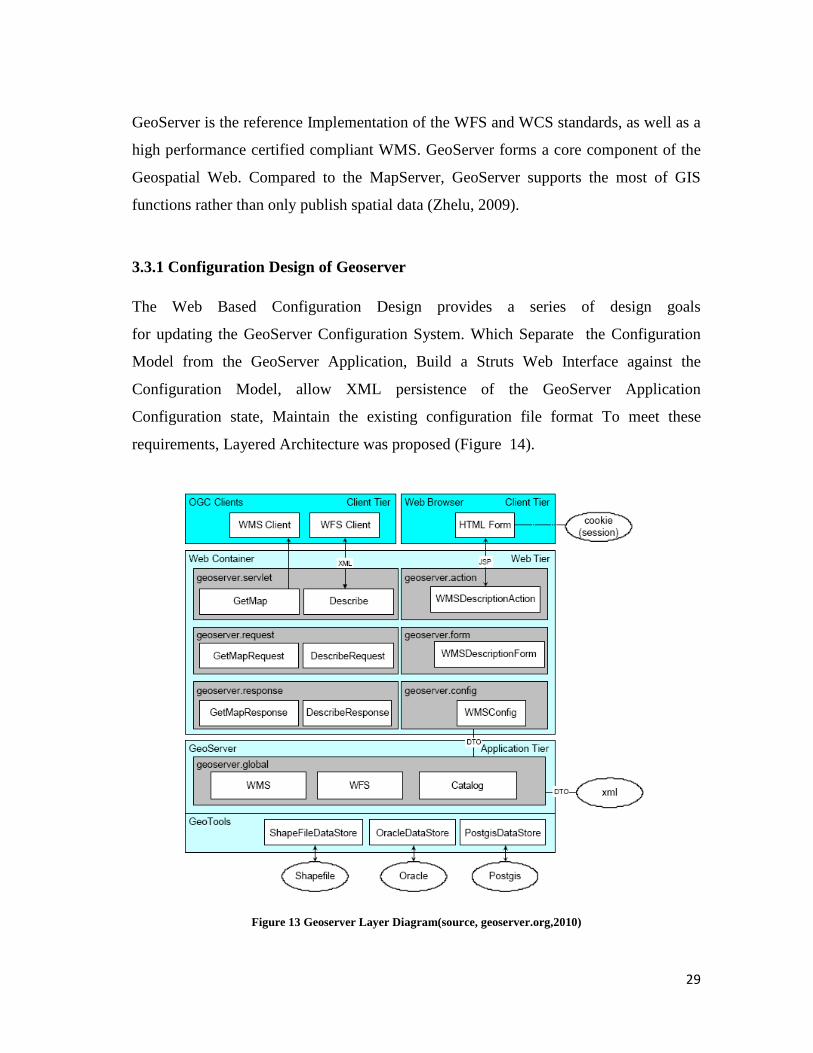
3.3.1 Configuration Design of Geoserver
The Web Based Configuration Design provides a series of design goals
for updating the GeoServer Configuration System. Which Separate the Configuration
Model from the GeoServer Application, Build a Struts Web Interface against the
Configuration Model, allow XML persistence of the GeoServer Application
Configuration state, Maintain the existing configuration file format To meet these
requirements, Layered Architecture was proposed (Figure 14).
Figure 13 Geoserver Layer Diagram(source, geoserver.org,2010)
30
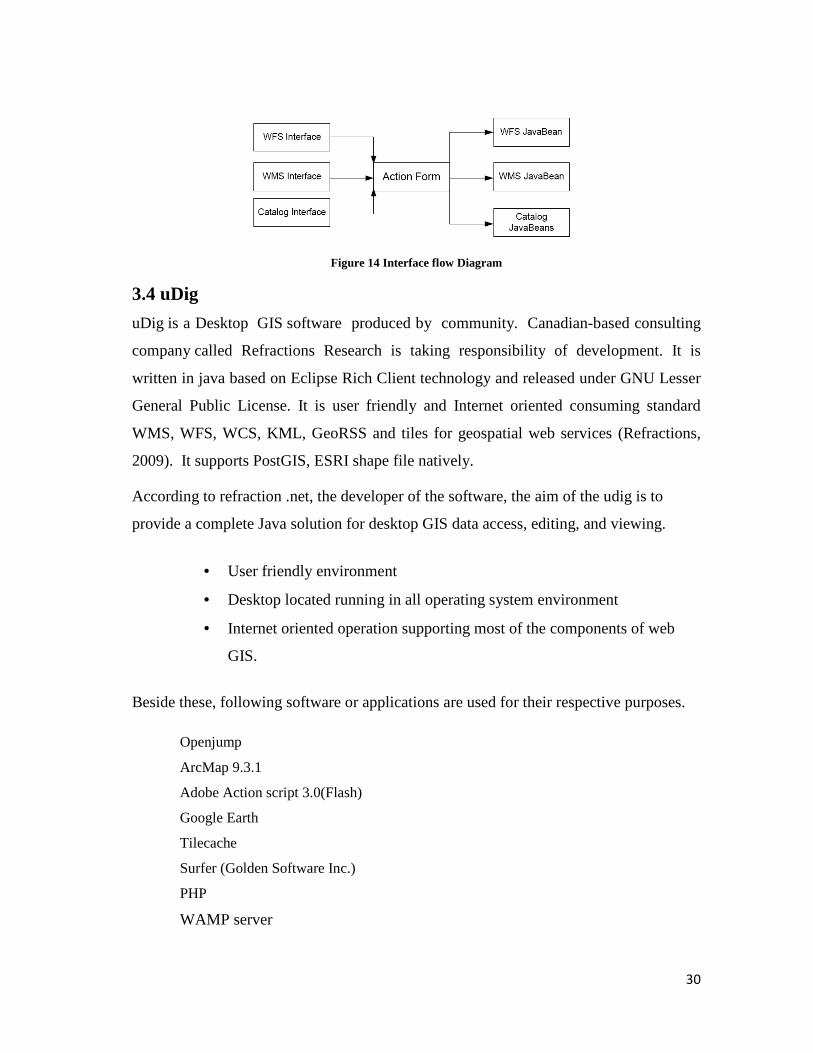
Figure 14 Interface flow Diagram
3.4 uDig
uDig is a Desktop GIS software produced by community. Canadian-based consulting
company called Refractions Research is taking responsibility of development. It is
written in java based on Eclipse Rich Client technology and released under GNU Lesser
General Public License. It is user friendly and Internet oriented consuming standard
WMS, WFS, WCS, KML, GeoRSS and tiles for geospatial web services (Refractions,
2009). It supports PostGIS, ESRI shape file natively.
According to refraction .net, the developer of the software, the aim of the udig is to
provide a complete Java solution for desktop GIS data access, editing, and viewing.
• User friendly environment
• Desktop located running in all operating system environment
• Internet oriented operation supporting most of the components of web
GIS.
Beside these, following software or applications are used for their respective purposes.
Openjump
ArcMap 9.3.1
Adobe Action script 3.0(Flash)
Google Earth
Tilecache
Surfer (Golden Software Inc.)
PHP
WAMP server
31
4. Materials and Methods Used
This chapter provides general information about methods and material used in the thesis.
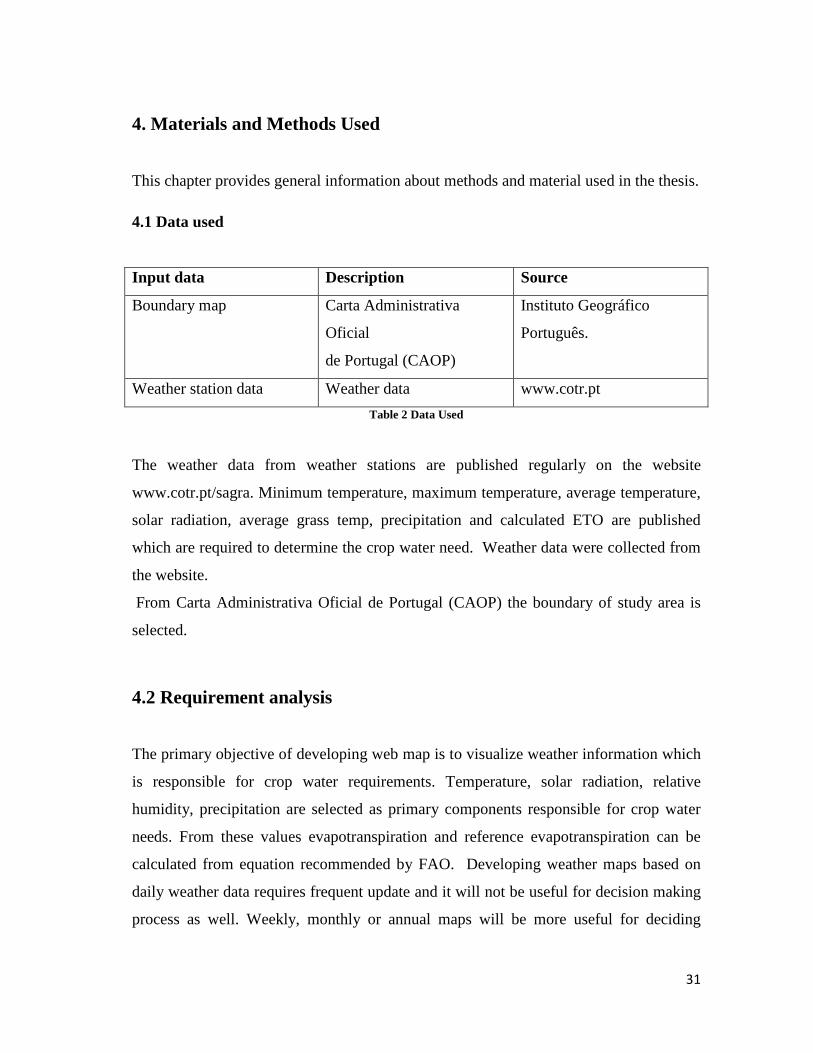
4.1 Data used
Input data Description Source
Boundary map Carta Administrativa
Oficial
de Portugal (CAOP)
Instituto Geográfico
Português.
Weather station data Weather data www.cotr.pt
Table 2 Data Used
The weather data from weather stations are published regularly on the website
www.cotr.pt/sagra. Minimum temperature, maximum temperature, average temperature,
solar radiation, average grass temp, precipitation and calculated ETO are published
which are required to determine the crop water need. Weather data were collected from
the website.
From Carta Administrativa Oficial de Portugal (CAOP) the boundary of study area is
selected.
4.2 Requirement analysis
The primary objective of developing web map is to visualize weather information which
is responsible for crop water requirements. Temperature, solar radiation, relative
humidity, precipitation are selected as primary components responsible for crop water
needs. From these values evapotranspiration and reference evapotranspiration can be
calculated from equation recommended by FAO. Developing weather maps based on
daily weather data requires frequent update and it will not be useful for decision making
process as well. Weekly, monthly or annual maps will be more useful for deciding
32
irrigation and irrigation planning. To meet this requirement, average weather values
were calculated from daily weather information for making weather maps. It should
contain basic map components to operate and interpret. To visualize and analyze the
trend of changing weather parameters and evapotranspiration animated maps will be
very helpful. Monthly average weather data for year 2008 and 2009 were selected to
animate weather maps which should contain basic control functions to display maps
interactively. Another requirement is to store old maps so that they can be retrieved
later. To fulfil the requirement a web map data gallery has to be created where user can
easily store maps and access easily.
4.3 Data processing
The weather station data are produced on a daily basis and it is inconvenient to produce
maps by daily updated data as it is not automatic. The data are averaged on a weekly,
monthly and yearly basis and merged in one sheet containing all weather points.
Precipitation, mean temperature, solar radiation, grass temperature, reference
evapotranspiration ETO are selected for this process. The entire database was more than
67 MB containing daily weather information from 2001.
4.4 Making weather Maps
The boundary of study area was identified and created the boundary map from the shape
file Carta Administrativa Oficial de Portugal (CAOP) version 2008.1 which was obtained
from Instituto Geográfico Português (www.igeo.pt). The weather station points are
converted to point shape file. The boundary, water body, and point shape files are
loaded into PostGIS database using Openjump. These shape files are loaded and
configured in Geoserver. But the Geoserver doesn’t have feature of geo-processing like
kriging interpolating of point data value over the surface. According to Wolf and et al.
(2009) Kriging is intensive processes currently not available in Geoserver. Web
processing service (WPS) is expected to solve this problem. The WPS module is
33
currently under development and not supported as part of the standard GeoServer
configuration (Geoserver, 2010). The SLD script is limited to basic functionality only
not for spatial interpolation like kriging.
For making interpolated weather map of evapotranspiration, precipitation, relative
humidity, temperature, grass temperature and solar radiation Geostatistical extension of
ArcGIS 9.3.1 and surfer from Golden software are used to develop interpolated maps.
While exporting to vector format it only stores the counter or filled counter but
predefined colour and respective value will be lost. Whereas the raster format preserves
coordinate system of the area only in Geotiff format using ‘world file’. This procedure is
repeated for all weather parameters.
.
4.5 Configuring Geoserver To serve map data to the internet we need to install GeoServer on a server connected to
the Internet or localhost. It requires web serving software like Apache web server.
Beside this Geoserver also requires more other components.
1. Servlet engine. A servlet engine called Jett which comes with Geoserver. There is
another popular servlet engine called Tomcat.
2. A Java development kit (JDK). To install the Geoserver Java development Kit is
required. We can download from Sun Microsystems freely.
GeoServer has a web interface where we can configure data. In this web development
process Geoserver is installed in localhost. The default servlet port used by Geoserver is
8080.
34
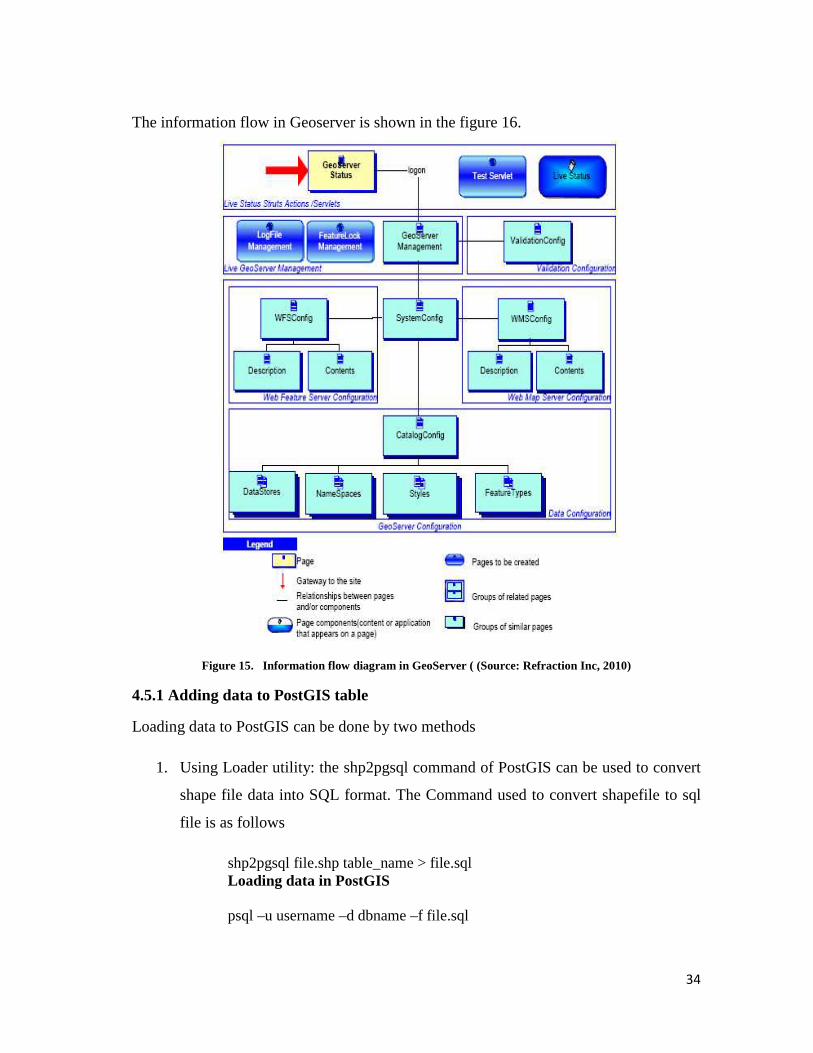
The information flow in Geoserver is shown in the figure 16.
Figure 15. Information flow diagram in GeoServer ( (Source: Refraction Inc, 2010)
4.5.1 Adding data to PostGIS table
Loading data to PostGIS can be done by two methods
1. Using Loader utility: the shp2pgsql command of PostGIS can be used to convert
shape file data into SQL format. The Command used to convert shapefile to sql
file is as follows
shp2pgsql file.shp table_name > file.sql Loading data in PostGIS psql –u username –d dbname –f file.sql
35
Change SRID Select updategeometrysrid('table name ', 'tem_col', <new_srid>);
2. Another way to convert shape file to SQL is using Openjump. It is also open
source software can be freely downloaded. Using Openjump shape file is
converted to SQL by loading shapefile file> Load datasets from file and selecting
the required shape file. Then the SRID (Spatial Reference System Identifier) is
defined as 4326.
4.5.2 Adding Data to GeoServer: New data can be added in Geoserver using config> datastore>New. Geoserver generally
takes shape files as input. In new feature data set selected PostGIS as new feature dataset
description. Feature data set ID is given to the shape file. In new Feature Data Set Editor
Panel, name space is defined as TOPP. Loading the data from database, localhost was
defined as host port 5432 which is the default port of postgreSQL. To define the new
feature type, new feature type as polygon was defined in config>data>featuretype>new.
New SLD is created to the datasets. The main purpose is display overlay maps in Google
maps or Bing maps so the SRS is defined as 4326.The SRS WKT (Spatial reference
system well known text) is shows the projection and coordinate of the data sets. By
selecting bounding box it generate the minimum and maximum longitude and latitude of
the data. Completing this configuration step data will be stored in Geoserver.
In this application most of the maps are created using interpolation in ArcGIS, exporting
interpolated maps into shape file loose predefined colour and output will not represent
the actual map. To solve this interpolated maps are exported into GeoTiff format which
preserve the projection co-ordinate system of the maps. The configuration of Geotiff
images is different from the shape files in Geoserver. Geoserver WCS coverage is used
to store coverage information of raster image files. The raster images are saved in
geoserver_install/data_dir/coverages/ directory Geoserver installation directory.
‘Coveragestore’ of Geoserver a new coverage data store tagged image file format
(GeoTIFF) with Geographic coordinates was selected with a required coverage data set
36
ID. To create coverage of the Geotiff image the style raster is selected in coverage
editor. The SRS and the bounding box parameters are configured for raster image.
Geoserver creates KML file which is modified to animate point location and
corresponding value with time using time stamp. The KML script can also shows
weather information with time. It can be viewed in standard Google Earth with changing
weather values with time.
4.6 Working with open layers
Openlayers is a Java script library and HTML is used to develop web interface and
connect WMS and WCS. GeoServer is connected to Openlayers client and CSS defined
for the page to display in browser. Shape file of water body, boundary and point are
loaded from database which can be fetched by GeoServer to Openlayers. Weather
station points were also determined giving longitude and latitude which can show
weather parameters value when clicked. It can be easily updated and modified through
database meanwhile Openlayers also accepts marker points through standard text page
which can be changed without any knowledge of database and GeoServer. All the WMS
layers were added to the map as overlay layer using map. Base layer were reserved for
yahoo, Google, Bing, Openstreet maps and their APIs were added in using in the script.
Basic mapping components were added using
map.addControl(new OpenLayers.Control.PanZoomBar());
map.addControl(new OpenLayers.Control.MousePosition());
map.addControl(new OpenLayers.Control.MouseDefaults());
map.addControl(new OpenLayers.Control.KeyboardDefaults());
37
4.7 Tile cache
TileCache provides a Python-based WMS-C/TMS server, with pluggable caching
mechanisms and rendering back ends. TileCache requires write access to a disk, the
ability to run Python CGI scripts, and a WMS to be cached. This creates local disk-based
cache of any WMS server, and use the result in any WMS-C supporting client, like
Openlayers, or any TMS supporting client. The TileCache library can speed up access
WMS by factors of 10-100, or more (Metacarta, 2008).
GeoServer supports TileCache as a caching layer in front of the WMS. For non-dynamic
mapping data in GeoServer using it will help users an experience that comes close to
matching Google Maps in terms of responsiveness and usability (Geoserver, 2010).
TileCache client supports multiple different rendering backend. Each rendering backend
also supports the ability to draw 'metatiles', where a large tile is rendered (Metacarta,
2008) and then chopped into smaller tiles using the Python Imaging library or Maptiler.
• MapServer -- render a tile using Python mapscript.
• Mapnik -- render a tile using the mapnik Python bindings.
• Cascading WMS -- fetch a tile from a remote WMS service
• DiskCache -- Store files on disk.
• MemoryCache
Tile cache’s configuration should do in ‘tileche.cfg’ file. Then customization of tile
cache in Geoserver and web client (Openlayers) is required. I used Openlayers WMS for
displaying tiled maps.
4.7.1 Openlayers for Tiled map overlay
Openlayers can create TMS overlay using map tiles. Map tiling technique is initially
used by Google Map and becoming popular as it is faster to display. Tiles are part of
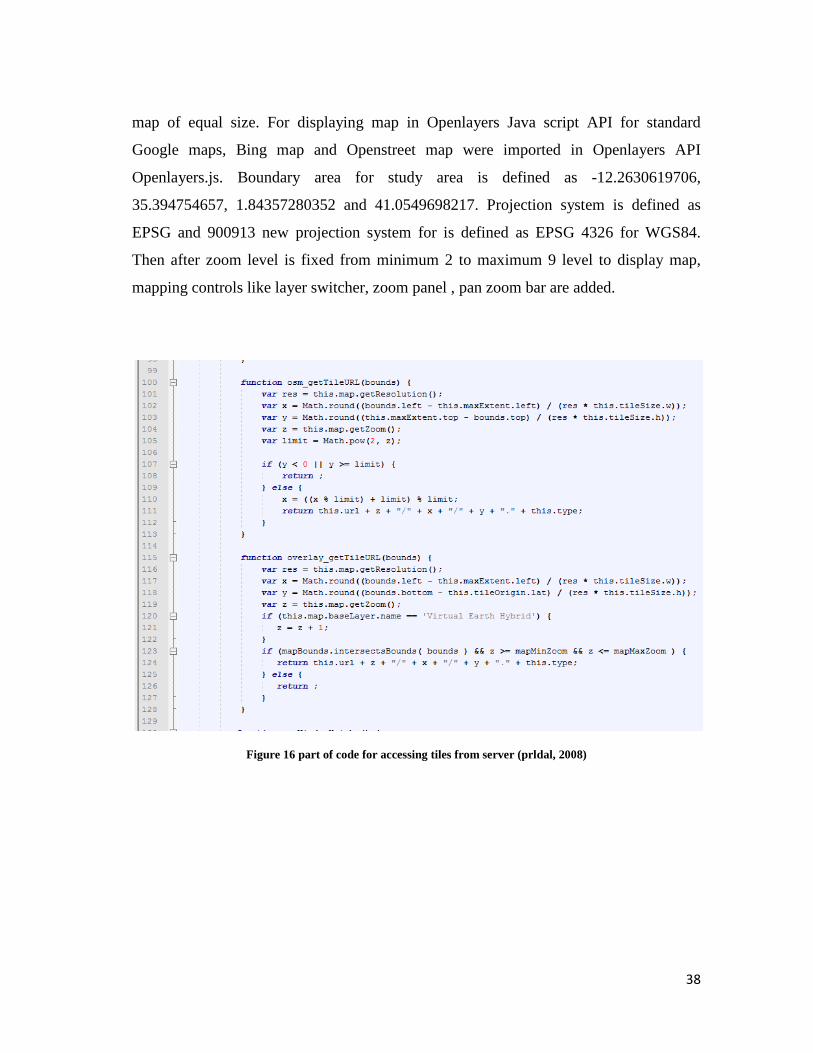
38
map of equal size. For displaying map in Openlayers Java script API for standard
Google maps, Bing map and Openstreet map were imported in Openlayers API
Openlayers.js. Boundary area for study area is defined as -12.2630619706,
35.394754657, 1.84357280352 and 41.0549698217. Projection system is defined as
EPSG and 900913 new projection system for is defined as EPSG 4326 for WGS84.
Then after zoom level is fixed from minimum 2 to maximum 9 level to display map,
mapping controls like layer switcher, zoom panel , pan zoom bar are added.
Figure 16 part of code for accessing tiles from server (prldal, 2008)
Figure
Figure
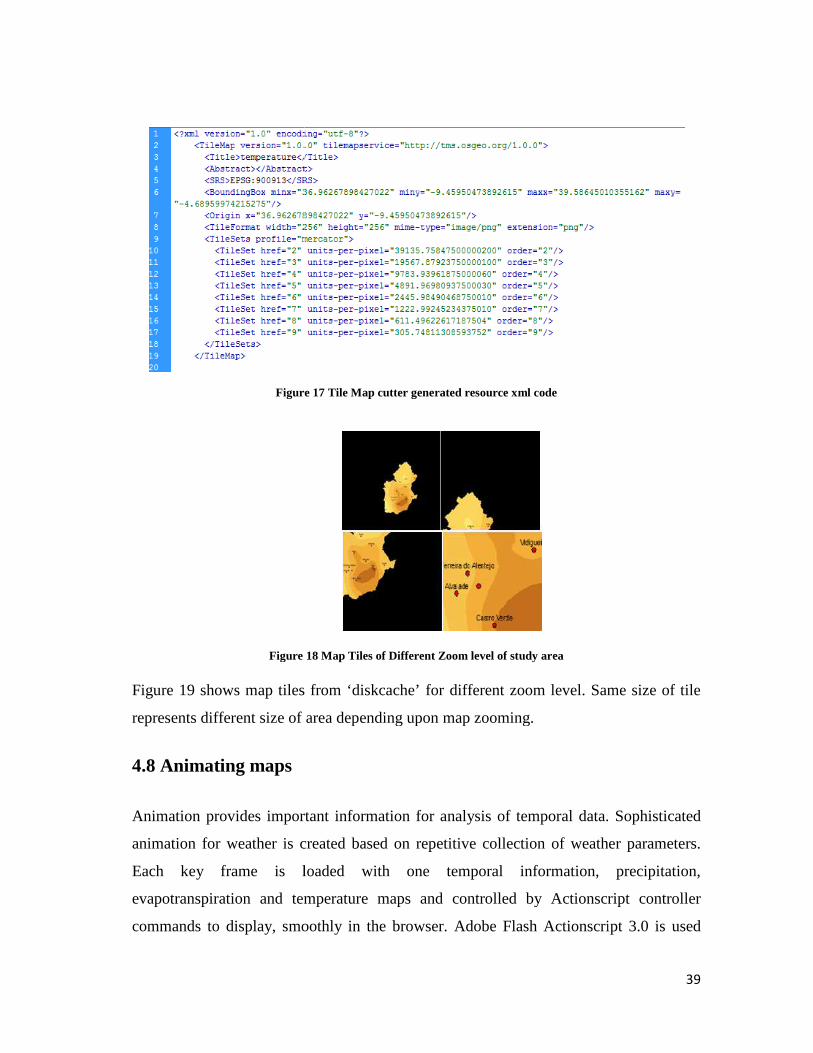
Figure 19 shows map tiles from ‘diskcache’ for different zoom level. Same size of
represents different size of area depending upon map zooming.
4.8 Animating maps
Animation provides important information for analysis of temporal data. Sophisticated
animation for weather is created based
Each key frame is loaded with one temporal information, precipitation,
evapotranspiration and temperature maps and controlled by
commands to display, smoothly in the browser.
Figure 17 Tile Map cutter generated resource xml code
Figure 18 Map Tiles of Different Zoom level of study area
shows map tiles from ‘diskcache’ for different zoom level. Same size of
different size of area depending upon map zooming.
Animation provides important information for analysis of temporal data. Sophisticated
for weather is created based on repetitive collection of weather parameters.
Each key frame is loaded with one temporal information, precipitation,
evapotranspiration and temperature maps and controlled by Actionscript controller
commands to display, smoothly in the browser. Adobe Flash Actionscript 3.0 is
39
shows map tiles from ‘diskcache’ for different zoom level. Same size of tile
Animation provides important information for analysis of temporal data. Sophisticated
weather parameters.
Each key frame is loaded with one temporal information, precipitation,
ctionscript controller
Actionscript 3.0 is used
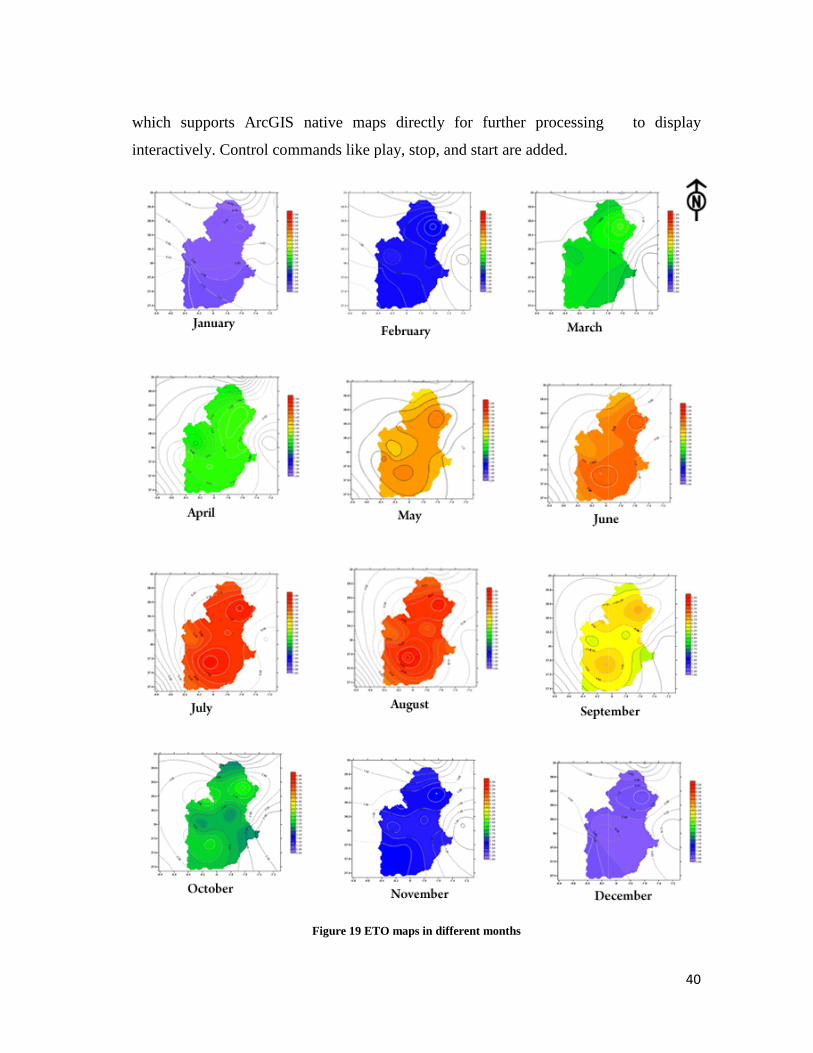
which supports ArcGIS native maps directly for further processing to display
interactively. Control commands like play, stop,
supports ArcGIS native maps directly for further processing to display
. Control commands like play, stop, and start are added.
Figure 19 ETO maps in different months
40
supports ArcGIS native maps directly for further processing to display
41
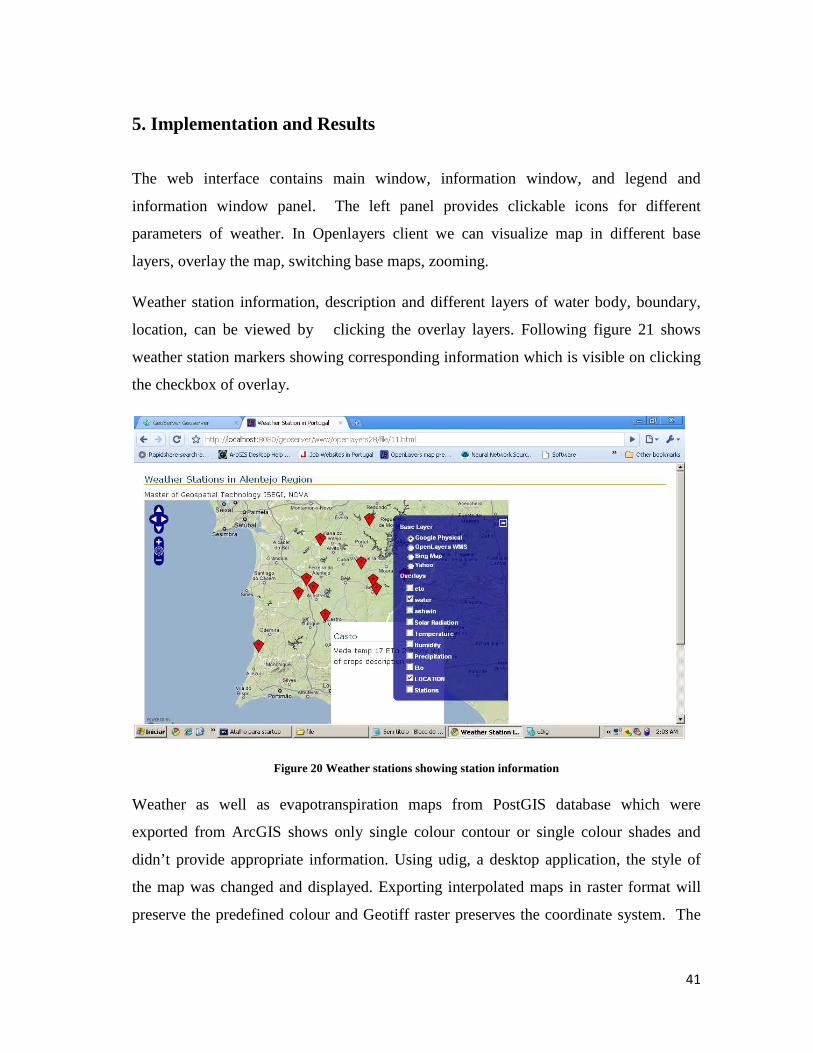
5. Implementation and Results
The web interface contains main window, information window, and legend and
information window panel. The left panel provides clickable icons for different
parameters of weather. In Openlayers client we can visualize map in different base
layers, overlay the map, switching base maps, zooming.
Weather station information, description and different layers of water body, boundary,
location, can be viewed by clicking the overlay layers. Following figure 21 shows
weather station markers showing corresponding information which is visible on clicking
the checkbox of overlay.
Figure 20 Weather stations showing station information
Weather as well as evapotranspiration maps from PostGIS database which were
exported from ArcGIS shows only single colour contour or single colour shades and
didn’t provide appropriate information. Using udig, a desktop application, the style of
the map was changed and displayed. Exporting interpolated maps in raster format will
preserve the predefined colour and Geotiff raster preserves the coordinate system. The
42
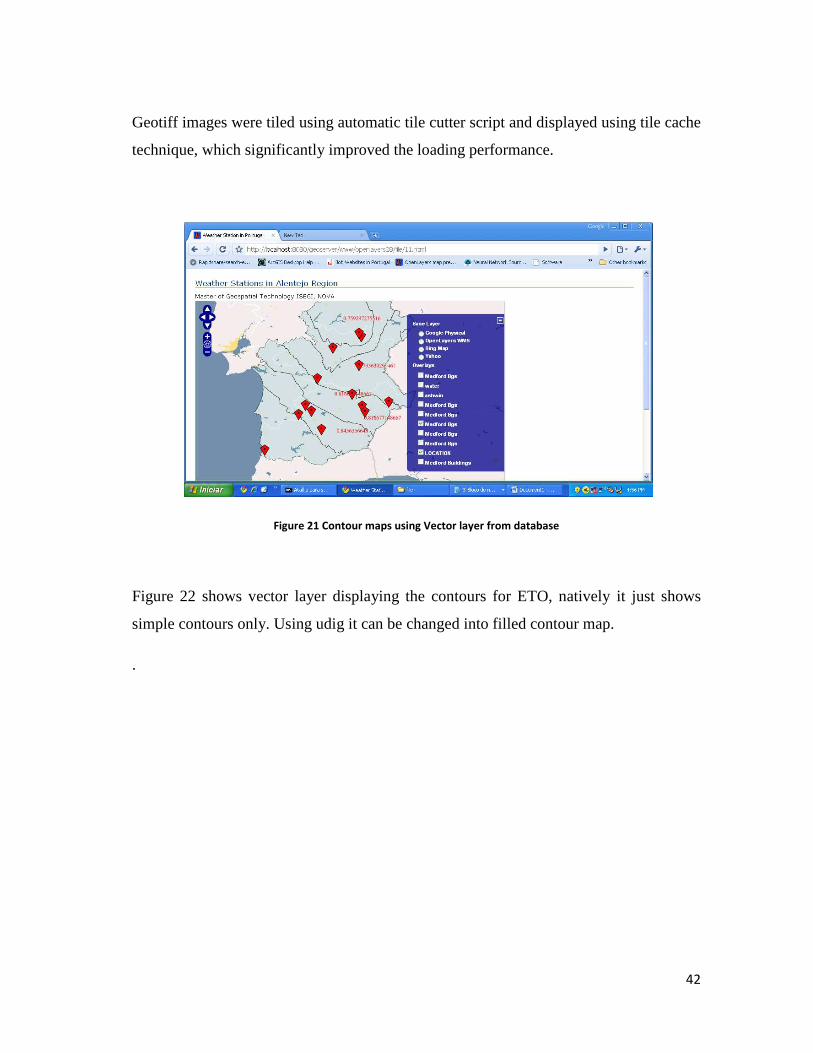
Geotiff images were tiled using automatic tile cutter script and displayed using tile cache
technique, which significantly improved the loading performance.
Figure 21 Contour maps using Vector layer from database
Figure 22 shows vector layer displaying the contours for ETO, natively it just shows
simple contours only. Using udig it can be changed into filled contour map.
.
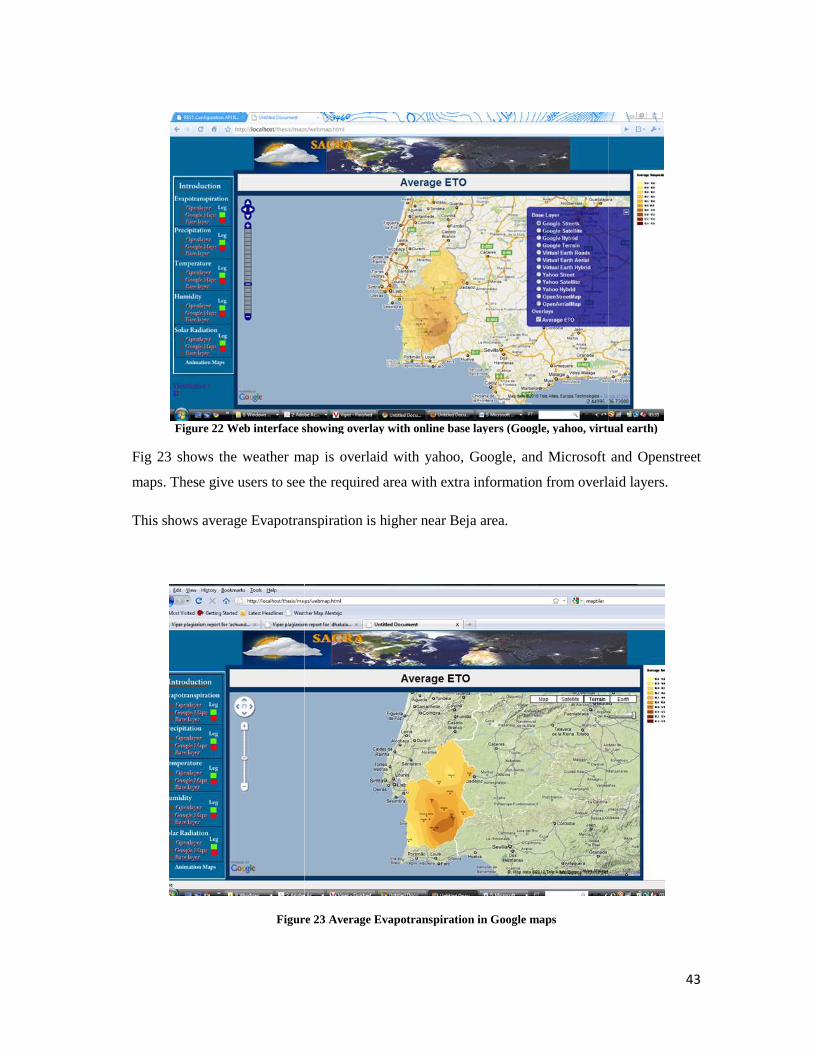
Figure 22 Web interface showing overlay with online base layers (Google, yahoo, virtual earth)
Fig 23 shows the weather m
maps. These give users to see the required area with extra information from overlaid layers.
This shows average Evapotranspiration is
Figure
Web interface showing overlay with online base layers (Google, yahoo, virtual earth)
shows the weather map is overlaid with yahoo, Google, and Microsoft and Openstreet
to see the required area with extra information from overlaid layers.
Evapotranspiration is higher near Beja area.
Figure 23 Average Evapotranspiration in Google maps
43
Web interface showing overlay with online base layers (Google, yahoo, virtual earth)
gle, and Microsoft and Openstreet
to see the required area with extra information from overlaid layers.
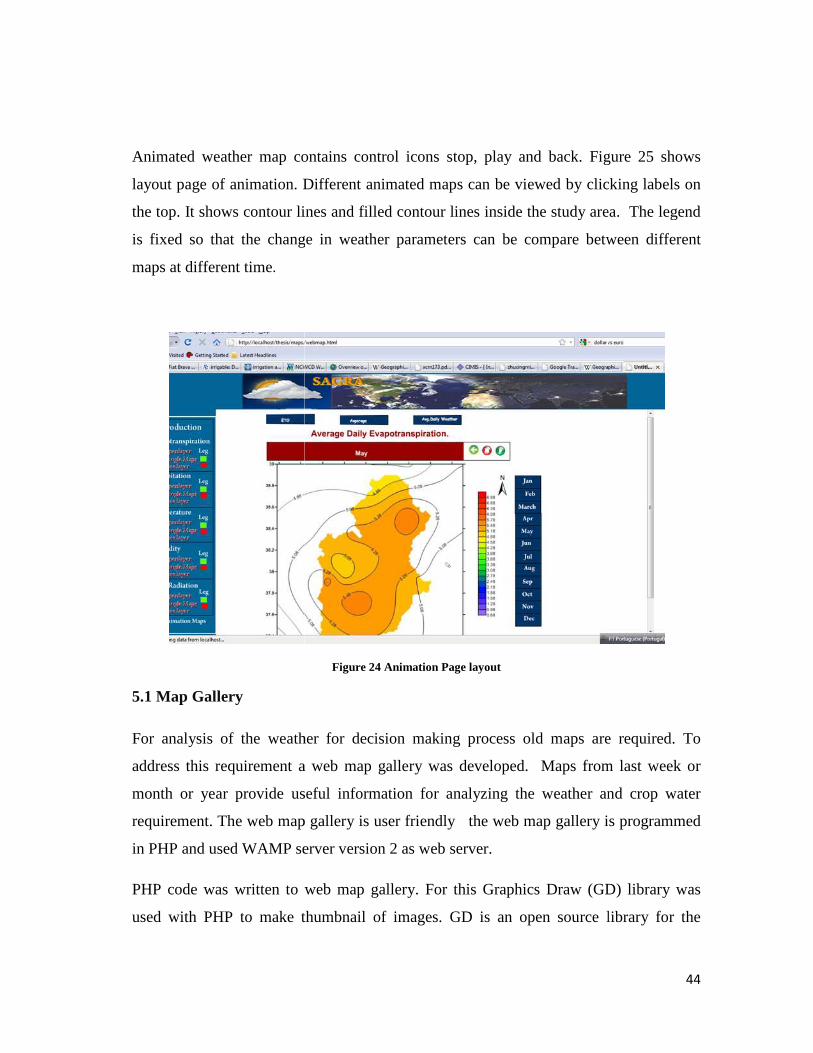
Animated weather map contains
layout page of animation. Different animated maps can be viewed by clicking labels on
the top. It shows contour lines and filled contour lines inside the study area. The legend
is fixed so that the chang
maps at different time.
5.1 Map Gallery For analysis of the weather for decision making process old maps are required. To
address this requirement a web map gallery
month or year provide useful information
requirement. The web map
in PHP and used WAMP server version 2 as web server.
PHP code was written to web map gallery. For this G
used with PHP to make thumbnail of
Animated weather map contains control icons stop, play and back. Figure 2
layout page of animation. Different animated maps can be viewed by clicking labels on
the top. It shows contour lines and filled contour lines inside the study area. The legend
is fixed so that the change in weather parameters can be compare between different
Figure 24 Animation Page layout
the weather for decision making process old maps are required. To
address this requirement a web map gallery was developed. Maps from last week or
month or year provide useful information for analyzing the weather and crop water
The web map gallery is user friendly the web map gallery is programmed
in PHP and used WAMP server version 2 as web server.
PHP code was written to web map gallery. For this Graphics Draw (GD)
thumbnail of images. GD is an open source library for the
44
control icons stop, play and back. Figure 25 shows
layout page of animation. Different animated maps can be viewed by clicking labels on
the top. It shows contour lines and filled contour lines inside the study area. The legend
e in weather parameters can be compare between different
the weather for decision making process old maps are required. To
developed. Maps from last week or
the weather and crop water
user friendly the web map gallery is programmed
raphics Draw (GD) library was
GD is an open source library for the
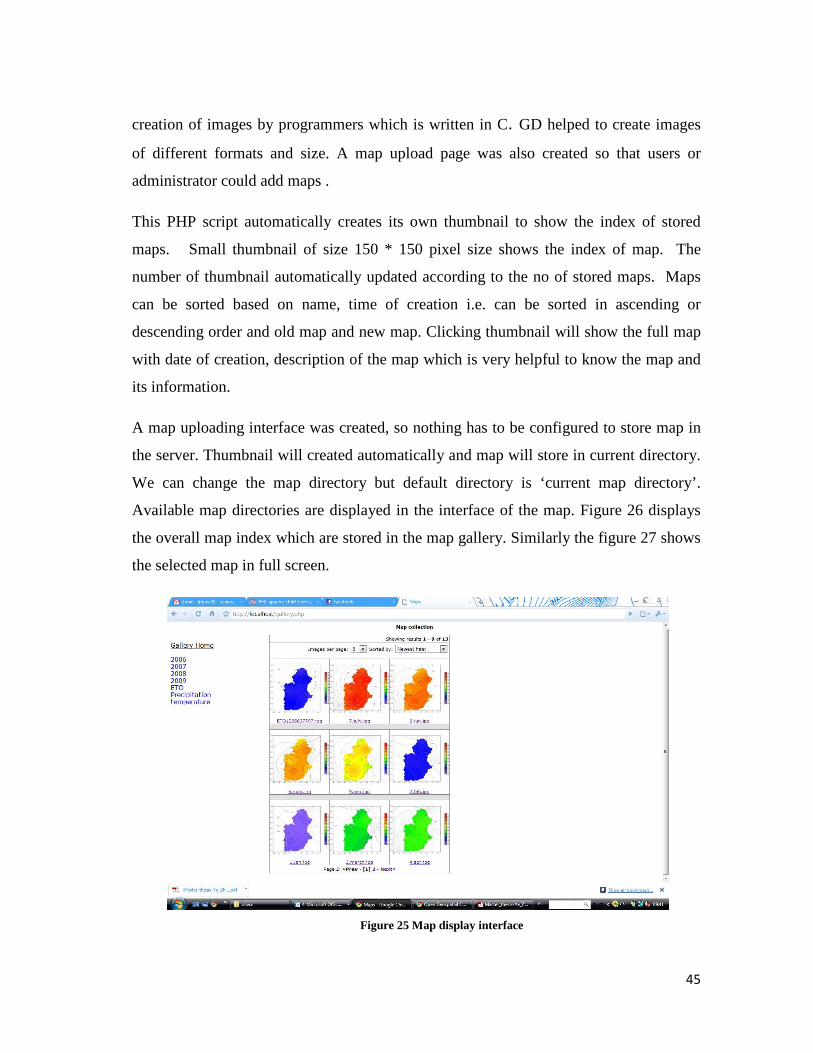
45
creation of images by programmers which is written in C. GD helped to create images
of different formats and size. A map upload page was also created so that users or
administrator could add maps .
This PHP script automatically creates its own thumbnail to show the index of stored
maps. Small thumbnail of size 150 * 150 pixel size shows the index of map. The
number of thumbnail automatically updated according to the no of stored maps. Maps
can be sorted based on name, time of creation i.e. can be sorted in ascending or
descending order and old map and new map. Clicking thumbnail will show the full map
with date of creation, description of the map which is very helpful to know the map and
its information.
A map uploading interface was created, so nothing has to be configured to store map in
the server. Thumbnail will created automatically and map will store in current directory.
We can change the map directory but default directory is ‘current map directory’.
Available map directories are displayed in the interface of the map. Figure 26 displays
the overall map index which are stored in the map gallery. Similarly the figure 27 shows
the selected map in full screen.
Figure 25 Map display interface
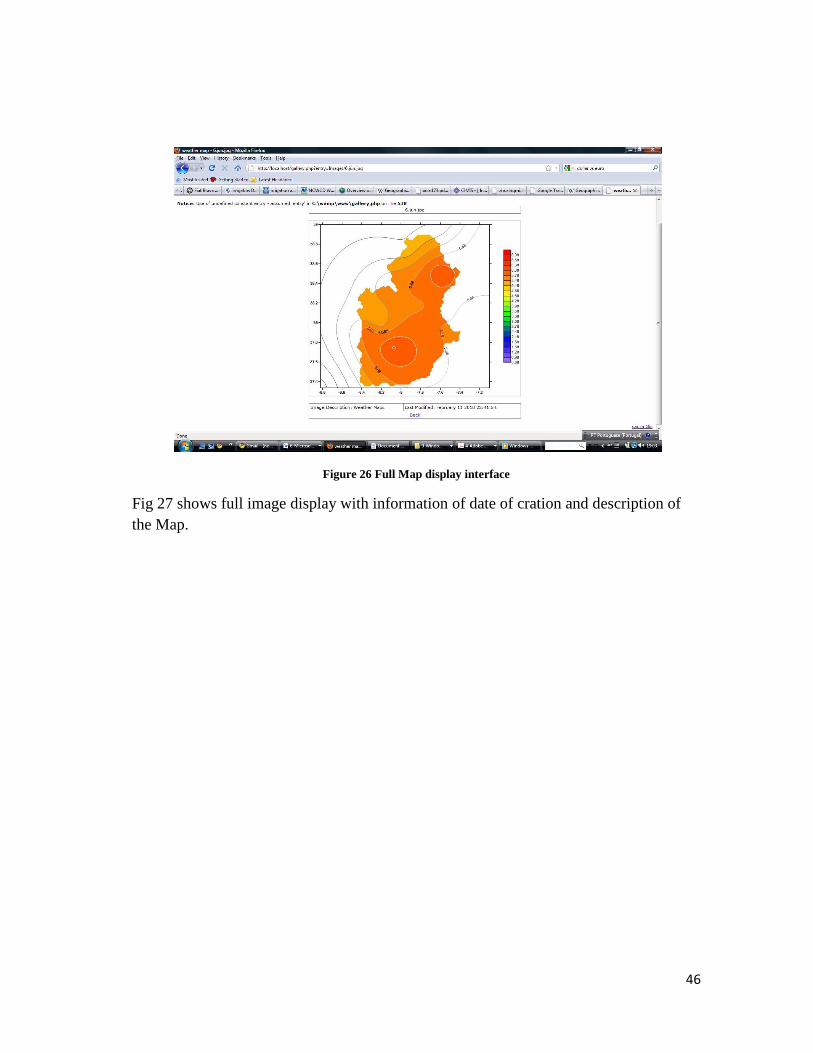
46
Figure 26 Full Map display interface
Fig 27 shows full image display with information of date of cration and description of the Map.
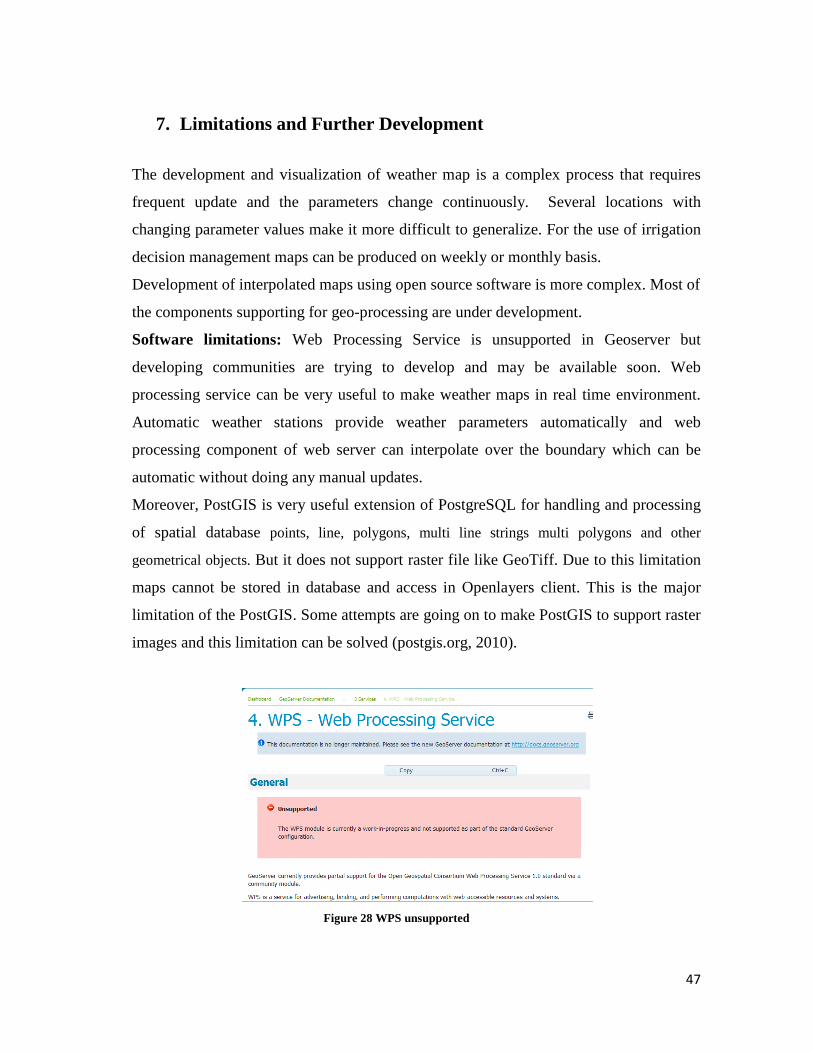
47
7. Limitations and Further Development
The development and visualization of weather map is a complex process that requires
frequent update and the parameters change continuously. Several locations with
changing parameter values make it more difficult to generalize. For the use of irrigation
decision management maps can be produced on weekly or monthly basis.
Development of interpolated maps using open source software is more complex. Most of
the components supporting for geo-processing are under development.
Software limitations: Web Processing Service is unsupported in Geoserver but
developing communities are trying to develop and may be available soon. Web
processing service can be very useful to make weather maps in real time environment.
Automatic weather stations provide weather parameters automatically and web
processing component of web server can interpolate over the boundary which can be
automatic without doing any manual updates.
Moreover, PostGIS is very useful extension of PostgreSQL for handling and processing
of spatial database points, line, polygons, multi line strings multi polygons and other
geometrical objects. But it does not support raster file like GeoTiff. Due to this limitation
maps cannot be stored in database and access in Openlayers client. This is the major
limitation of the PostGIS. Some attempts are going on to make PostGIS to support raster
images and this limitation can be solved (postgis.org, 2010).
Figure 28 WPS unsupported
48
8. Conclusion
The evolution of web and its rapid expansion in the last decades created a new platform
for information sharing with enormous potential and possibilities and increased
efficiency and speed. Due to enhanced features of sharing, accessing and manipulation
Geographic Information System also started growing in new platform through traditional
desktop application to web.
The spatial and temporal variability may create problem to traditional Irrigation
management support system, GIS can be solution in this regard. Integration of GIS with
web can be a good example of information sharing and visualization.
In this thesis work different methods of publishing maps over the web are implemented.
Average weather data are used to make web map using open source software and
specification. For this Geoserver and Openlayers are used while PostGIS is used as
database. Surfer and Adobe Flash with Actionscript are used to make time series
monthly animated maps. These animated maps will be very useful to analyze the change
pattern of weather. PHP with WAMP server is used to store and display maps. Tile
cache mapping is new in web mapping but it is becoming popular due to its
responsiveness and usability.
However, web mapping applications are not well developed like desktop GIS
applications especially for interpolation of point data. Research and developments are on
their way and will available soon.
49
Bibliographic References Alesheikh, A. Helali, H. and Behroz, H.A. Web GIS. 2002. Technologies and its
applications Symposium on Geospatial theory, Ottawa Toosi University of
technology pp 2-3
boutell.com, 2008 http://www.boutell.com/gd last accessed Feb. 19 2010
Cortez, R., 2004. Recharge assessment and groundwater modelling of the Pisoes aquifer
(Beja -Portugal). Master thesis ITC, Enschede. pp.86
Carver, S.J. 1999. Developing Web-based GIS/MCE: Improving access to data and
spatial decision support tools. A geographic information sciences approach
Ashgate, New York, pp. 49–76.
Craig, W. Harris. T. Weiner, D. 1999. Empowerment, marginalization and public
participation GIS.Report of Varenius Workshop, 15–17 October 1998, Santa
Barbara, NCGIA, pp 22–24.
Client_server_architecture
http://www.webdevelopersnotes.com/basics/client_server_architecture.php3
last accessed 15 Feb 2010
Detwiler J. and Dutton J. A., 2009 Introduction to Web Mapping e-Education Institute,
The Pennsylvania State University,
https://www.e-education.psu.edu/geog863/resources/l3_p5.html
Retrived in Feb 2 2010.
Dzbor M., Domingue J. and Motta E., 2003 Knowledge Media Institute, The Open
University, Milton Keynes, UK pp 1-3.
Drummond W. J. and French S. P. 2008 The Future of GIS in Planning, Converging
50
Technologies and Diverging Interests, Journal of the American Planning
Association, 74 (2), pp. 161
Dykes, j, MacEachren, A.M., Kraak M.J. 2005 Exploring Geovisualization,
International cartographic Association (Elsevier, Amsterdam) pp 3-4
Francés A. 2008 Spatio-temporal groundwater recharges assessment: data-integration
and modelling approach, Master thesis ITC, Enschede, pp 6
Fragoso, R., Lucas, M.R., 2009. Avaliação da competitividade da agricultura do
Alentejo no âmbito do ecossistema Montado, Revista de Economia e Sociologia
Rural, 27 (1), pp 9- 26.
Ganesan C., 2009 Introduction to OpenLayers NC GIS Conference, Open Technology
Group, Inc., Morrisville USA pp. 2-10
Garg V. and Seth R., 2003. Designing Decision Support Systems to aid Irrigation Water
Planning and Management in command areas, Map India Water & Power
Consultancy Services Gurgaon India pp 1-2
Greenwood Richard W., 2002 Using MapServer to Integrate Local Government Spatial
Data, Greenwood mapping Inc. pp. 2
Goodchild, M. F. Longley, P. A. Maguire, D. J. Rhind Rhind D. W. 2005 Geographical
Information Systems and Science John Wiley & Sons Ltd, 2 ed. pp 291-292
Goodchild M. and Kemp K Introduction to GIS, National Center for Geographic
Information and Analysis, University of California, 1991
Haiting L. Lifan, F. Qingshan P. Yanhong, L. 2009 TheApplication of Pre-generation
Thinking in Geographical Information Services. Journal of Geomatics, 34(1):31-
32.
Hampe M. Intas S., 2006 Extension of the OGC Web Feature Service Standard for
51
Multiple, Representation Data, ISPRS Technical Commission II Symposium,
Vienna, Austria pp. 1-3
Harrower, M., 2008. The Role of Map Animation for Geographic Visualization,
Geographic Visualization JohnWiley & Sons, Ltd pp 49.
Ian J. and Norman W. 2004. URI/Resource Relationships Architecture of the World
Wide Web, Volume One. World Wide Web Consortium.
http://www.w3.org/TR/webarch/#id-resources. Retrieved 2 Feb 2010.
Jiang, B., and Li, Z. 2005. Editorial: Geovisualization: Design, Enhanced Visual Tools
and Applications. The Cartographic Journal, 42(1), p. 3-4.
Jiang, B. Huang, B., and Vasek, V. 2003. Geovisualisation for Planning Support
Systems. In Planning Support Systems in Practice, Geertman, S., and Stillwell, J.
(Eds.) (Berlin: Springer).
Jorge M. J. Neto M. C. and Oliveria I. 2005 Supporting Irrigation Management
Strategies trough the Web: An application to the Portuguese Alentejo, European
Federation for Information Technology in Agriculture, Efita Congress 2005 Vila
Real, Portugal pp 2-5.
Kralidis A. T., 2008 Open Source Approaches in Spatial Data Handling Springer
(Berlin Heidelberg) pp 2-4.
Kottman, C. 1999 Open GIS Consortium & Gazetteer Data. Presented at the Digital
Gazetteer Information Exchange Workshop,Transcribed and edited from
audiotape
http://www.alexandria.ucsb.edu/~lhill/dgie/DGIE_website/Perspectives/kottman.
htm (retrieved 5 February 2010)
Lin, W.T., Fong, H. Y. and Ming, S. 2004 GIS for Irrigation Management in Irrigation
Associations National Taiwan University, Taipei pp D1-71
52
MacEachren, A.M. and Kraak, M.J. 1997. Exploratory cartographic visualization:
advancing the agenda. Computers & Geosciences, 23(4), pp. 335-343.
MacEachren, A.M. 2004. Geovisualization for knowledge construction and decision s
upport. IEEE computer graphics and applications, 24(1), pp.13-17.
Meyer N. V. 2004, The GIS and Land Records, The ArcGIS Parcel Data Model
ESRI press, USA
Metacarta , 2008 http://tilecache.org/
Mitchel T. 2005 web mapping illustrated, Oreilly Media, USA pp.34
Milosavljević S., Aleksandar, L. and Djordjević K. S. 2004 An architecture for open
and scalable WebGIS, , Department of Computer Science Faculty of Electronic
Engineering, University of Niš, Serbia and Montenegro, pp 1-3
MOAFF, 2010 Ministry of Agriculture Food and fisheries British Columbia, Water
conservation fact Sheet Crop Coefficients for use in Irrigation Scheduling
http://www.agf.gov.bc.ca/resmgmt/publist/500Series/577100-5.pdf last access 1
Feb 2010.
NCWCD http://www.ncwcd.org/website/weathermaps/viewer.htm retrieved 17 Feb 2010)
Orenstein, D. 2010 QuickStudy: Application Programming Interface (API)
http://www.computerworld.com/s/article/43487/Application_Programming_Inter
face Retrived 2 Feb
Paralta, E., 2001. Hidrogeologia e Modelação Estocástica da Contaminação por Nitratos
do Aquífero Gabro-diorítico da Região de Beja. Msc Thesis, IST, Lisbon, pp.157
Pai, V. S., Druschel P. and Zwaenepoel W., 1999 An efficient and portable web server
53
Source USENIX Association Berkeley, California, USA
Pereira, L. S, Oweis T. and Zairi A., 2002, Irrigation management under water scarcity,
Volume 57, Issue 3, ELSEVIER, pp. 175-180
Pervez, M. S. 2002 Interactive Information System for Irrigation Management
GIS and Remote Sensing Specialist, International Water Management Institute
pp 1
Pridai,2008.
http://code.google.com/p/maptiler/source/browse/trunk/mapptir/gdal2tiles.py?spec=svn3
1&r=31 , last access 20 Jan 2010
Potmesil, M, 1997 Maps Alive: Viewing Geospatial Information on the WWW Bell
Laboratories, Lucent Technologies,Sixth International World Wide Web
Conference. April 7-11, 1997 California, USA.
Postgis, 2010 www.postGIS.org last access 15 Feb. 2010.
Quinn, S. Bartley,J. Wilcox,D., 2008 Implementing and Optimizing ArcGIS Server
Map Caches, 2008 ESRI Developer Summit, March 17-20,2008.Palm Springs,
California, USA.
Refraction, 2009. Refractions Research, British Columbia Canada.
(http://udig.refractions.net/ Retrived 1 February 2010)
Sakamoto A. & Fukui, H., 2004. Development and application of a livable environment
evaluation support system using Web Gis. Journal of Geographical Systems,
Springer (Berlin / Heidelberg) 6(2) pp 175-195.
Sanchez M. R - , Anderson G, 2003 Building Web-Based Spatial Information Solutions
around Open Specifications and Open Source Software, Transactions in GIS,
John Wiley & Sons, Inc 7( 4), pp 447-449
Sen P. K., 2004 Water resource with multi sensor remote sensing and GIS techniques,
54
a case study of the Roxo Dam Irrigation System , Portugal. Master thesis ITC
Netherlands. Pp 5-12
Stuart, K. C., Mackinlay, J.D., and Shneidermann, B. 1999. Reading in Information
Visualization: Using Vision to Think. San Francisco: Morgan Kaumann
Publishers.
Stachowicz S. 2004 Geographical data sharing – advantages of web based technology to
local government, 10th EC GI & GIS Workshop 23-25 June 2004, ESDI State of
the Art, Warsaw, Poland, pp 1-2
Soomro T. R., Zheng K. and Pan, Y. Html and Multimedia Web Gis Department of
Computer Science, Zhejiang University, P.R.China.
http://ieeexplore.ieee.org/stamp/stamp.jsp?arnumber=00798559 Retrived 2 Feb 2010.
Tyler M. 2005 Web mapping illustrated Using Open Source GIS Toolkits Oreilly Media
first edition, California, USA pp 25-45
Tsou, M.H. and Buttenfield, B.P. 2002 A Dynamic Architecture for Distributed
Geographic Information Services. Transactions in GIS. 6(4) pp 355-381.
Tan C. H., 2003 Application of Geographic Information System in a Web-based Query
System for Farmland Irrigation in Taiwan, Agricultural Engineering Research
Center Taiwan pp 2-3
Waskom R. M., 1994 Best Management Practices for Irrigation Management
Extension Water Quality Specialist Colorado State University Cooperative
Extension pp. 1-3 (http://www.ext.colostate.edu/Pubs/crops/xcm173.pdf) last
access 10 Feb 2010.
Wolf E and Howe K., 2009 Web-client Based Distributed Generalization and

55
Geoprocessing US Geological Survey Center of Excellence in GIScience
Denver, Colorado, USA pp 1-4
www.php.net , last access 15 February 2010.
Yoo S.H., Choi J. Y and Jang M.W. Estimation of design water requirement using FAO
Penman–Monteith and optimal probability distribution function in South Korea,
Department of Rural Systems Engineering, Seoul National University, Seoul,
Republic of Korea pp 1-3
Wikipedia, http://en.wikipedia.org/wiki/Web_mapping last access 1 Feb. 2010
Zhelu, Y. 2009. A web-based Geographical Information System prototype on
Portuguese traditional food products, Msc Thesis ISEGI-UNL Portugal.

56
APPENDICES
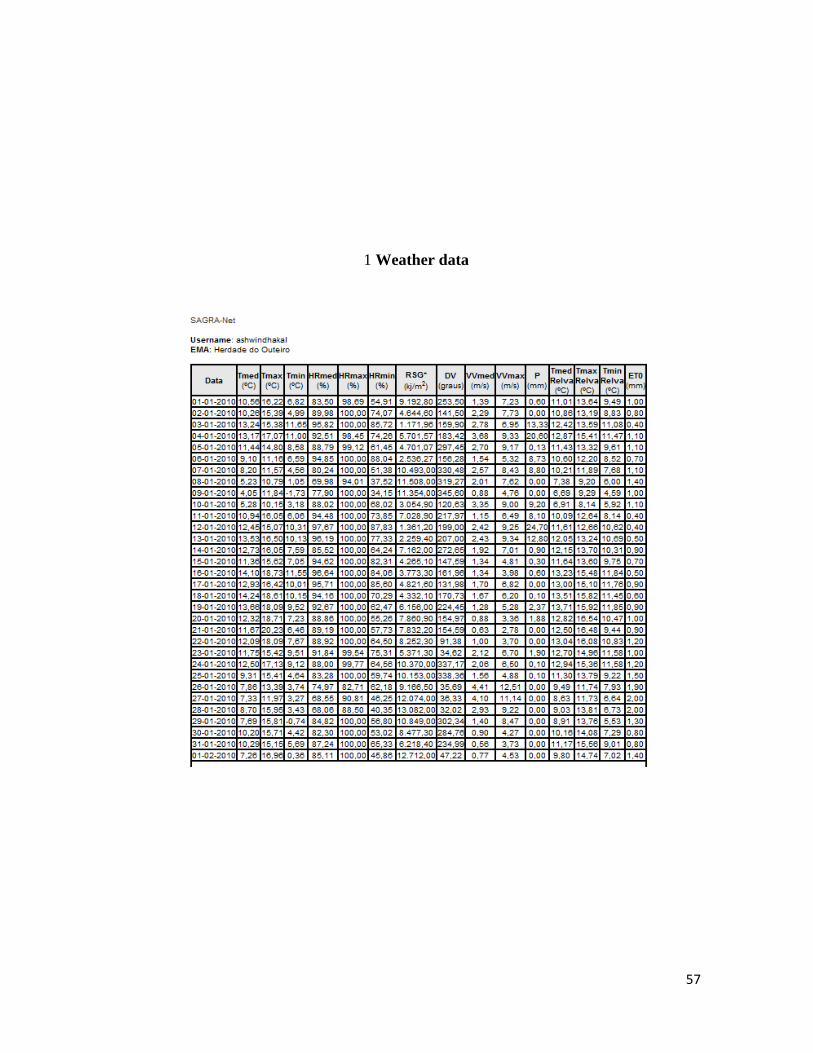
57
1 Weather data
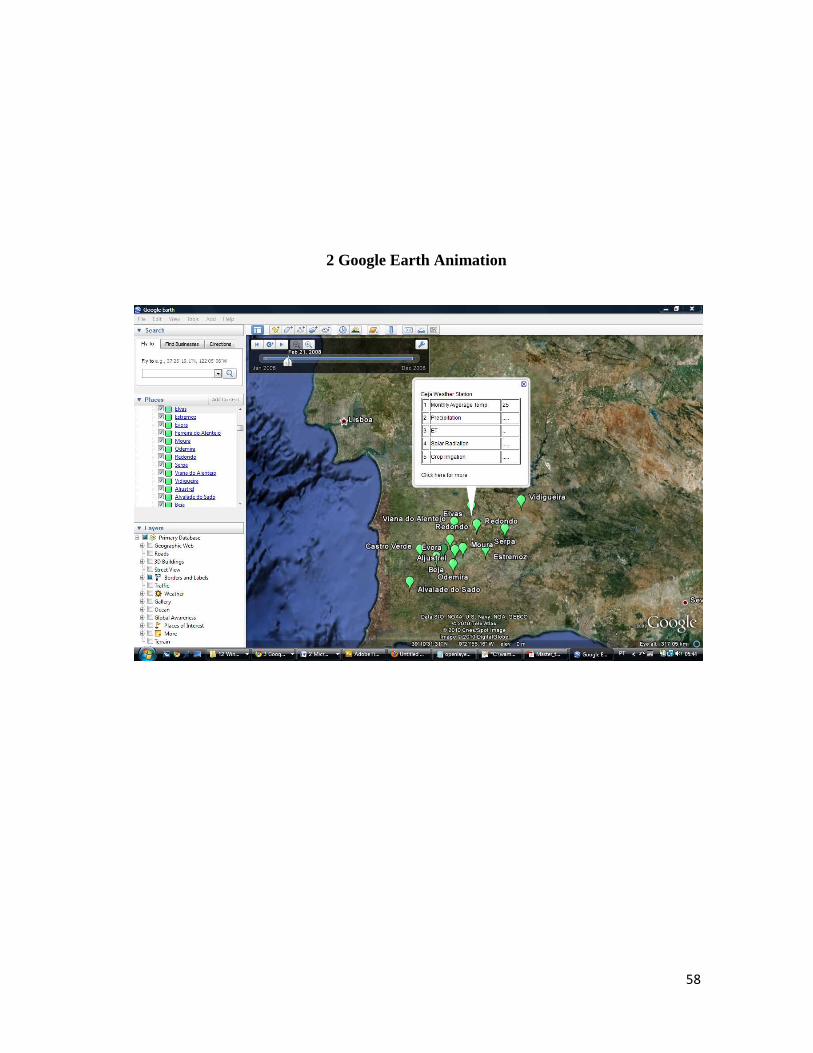
58
2 Google Earth Animation


![GIS-based irrigation water management for precision farming of rice · irrigation compartment and block should be carried out to evaluate compliance with water allocations[3]. Effective](https://static.fdocuments.in/doc/165x107/600e9ba2c77d6d419075b55a/gis-based-irrigation-water-management-for-precision-farming-of-irrigation-compartment.jpg)


