WEATHER AND - Madeira City Schools · What in uence does solar angle have on the heating of Earth?...
37
WEATHER AND WATER NAME: _______________________
Transcript of WEATHER AND - Madeira City Schools · What in uence does solar angle have on the heating of Earth?...
WEATHER AND
WATER
NAME: _______________________

Weather Words to Know
Weather factors – properties of air that affect weather; such as heat, pressure, moisture and motion Severe weather – weather that is dangerous or causes damage Compressed – forced into a smaller space Pressure – the push when compressed air pushes back Forecast – a prediction about what kind of weather to expect Atmosphere – the gases surrounding Earth Meteorology – the scientific study of day-to-day weather Climatology – the study of weather over a long period of time Meteorologist – a person who studies weather Mass – the amount of matter in something; it is the same on the Earth and moon Weight – the pull or force between the Earth and the matter in an object; this is different between the weight of something on the Earth and its weight on the moon
Weather Instruments Thermometer – measures temperature in degrees Celsius or Fahrenheit (°C or °F) Hygrometer – measures the percentage of humidity in the air ( % ) Wind Vane – measures the direction (N, S, E, W) the wind is coming from Anemometer – measures the speed at which the wind is blowing. (m.p.h.) Barometer – measures the amount of air pressure in millibars (mb).

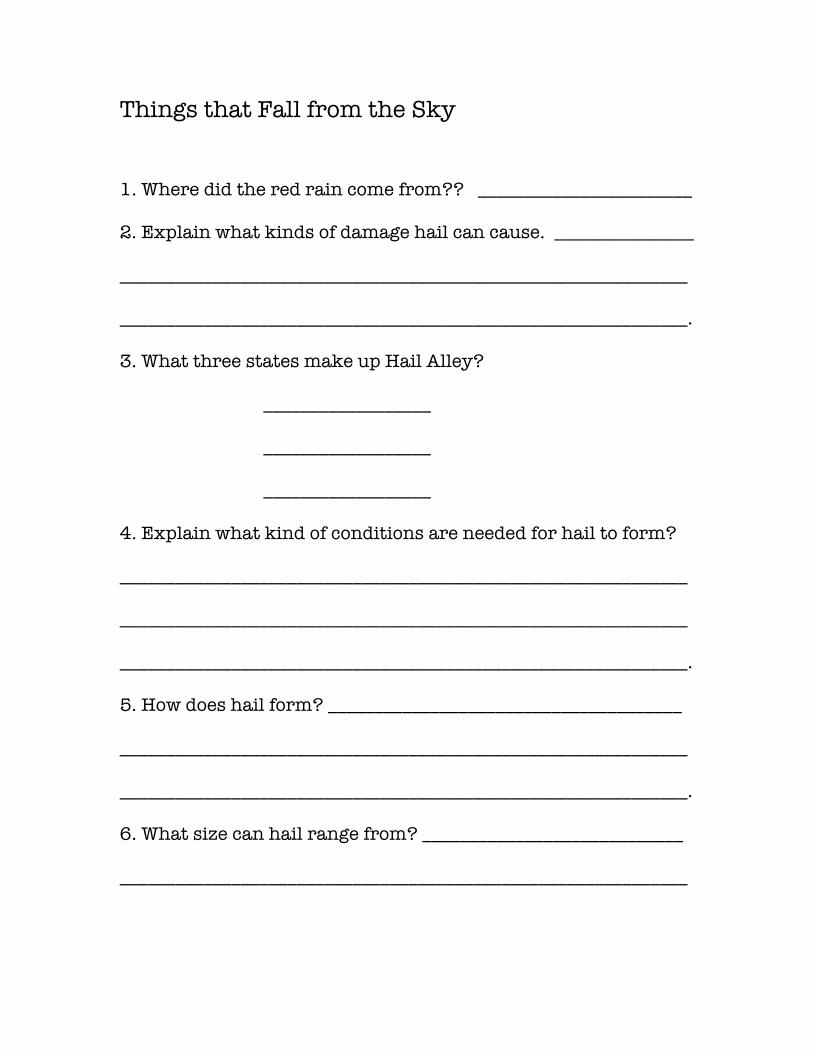
Things that Fall from the Sky 1. Where did the red rain come from?? _______________________ 2. Explain what kinds of damage hail can cause. _______________ _____________________________________________________________ _____________________________________________________________. 3. What three states make up Hail Alley? __________________ __________________ __________________ 4. Explain what kind of conditions are needed for hail to form? _____________________________________________________________ _____________________________________________________________ _____________________________________________________________. 5. How does hail form? ______________________________________ _____________________________________________________________ _____________________________________________________________. 6. What size can hail range from? ____________________________ _____________________________________________________________
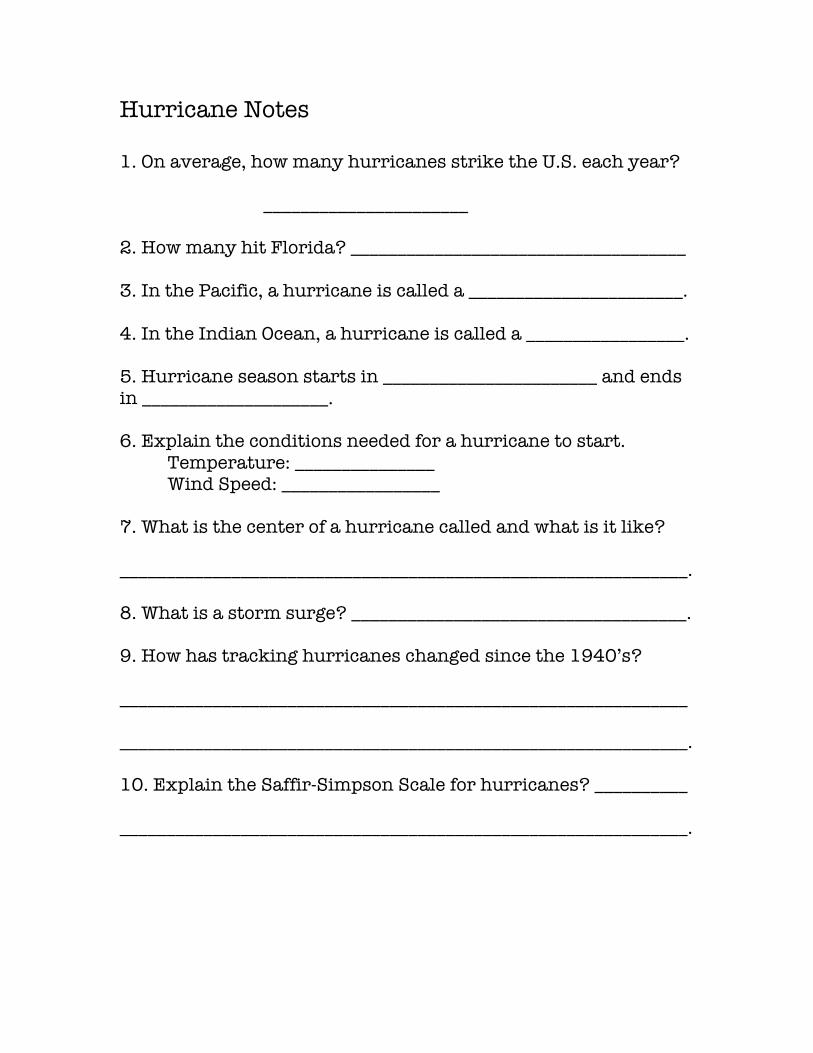
Hurricane Notes 1. On average, how many hurricanes strike the U.S. each year? ______________________ 2. How many hit Florida? ____________________________________ 3. In the Pacific, a hurricane is called a _______________________. 4. In the Indian Ocean, a hurricane is called a _________________. 5. Hurricane season starts in _______________________ and ends in ____________________. 6. Explain the conditions needed for a hurricane to start. Temperature: _______________ Wind Speed: _________________ 7. What is the center of a hurricane called and what is it like? _____________________________________________________________. 8. What is a storm surge? ____________________________________. 9. How has tracking hurricanes changed since the 1940’s? _____________________________________________________________ _____________________________________________________________. 10. Explain the Saffir-Simpson Scale for hurricanes? __________ _____________________________________________________________.
Weather Machine 1. Define weather. ___________________________________________ _____________________________________________________________. 2. The atmosphere was created ___________ billion years ago. 3. What does the atmosphere protect the earth from? __________ _____________________________________________________________. 4. Define temperature. What unit is used to measure it? _____________________________________________________________ _____________________________________________________________. 5. Why does the northern hemisphere experience winter while the southern hemisphere experiences summer? _______________ _____________________________________________________________. 6. The world’s deserts are found 30 degrees north and south of the _____________________. 7. What are jet streams? What are trade winds? _______________ _____________________________________________________________ _____________________________________________________________. 8. Where is the temperate zone? _____________________________. 9. Define dew point. __________________________________________ _____________________________________________________________.
Tornado 1. How does a tornado form? _________________________________ _____________________________________________________________. 2. Describe what a tornado looks like. _________________________ _____________________________________________________________. 3. What three states make up Tornado Alley? ____________________ ____________________ ____________________ 4. Tornado season is from __________________ to _______________. 5. What was the Vortex Project? ______________________________ _____________________________________________________________. 6. How long do most tornados last? __________________________. 7. A tornado’s wind speed can be more than ___________ m.p.h. 8. What tools do storm chasers and scientists use to detect tornados? __________________________________________________ _____________________________________________________________. 9. About how many tornadoes occur each year? _______________
Weather Notes #2 (con’t)
Troposphere • Lowest layer of atmosphere • Earth’s weather happens here
Stratosphere
• Layer above Troposphere • This is the Ozone layer
Mesosphere
• Above Stratosphere • Where meteors burn up and become shooting
stars Thermosphere
• Above Mesosphere • Not much air here
Exosphere
• Layer farthest from Earth • Thick layer, little air • Transition between Earth’s atmosphere &
outer space
Hurricanes
What is a hurricane? • An area of low pressure (rising air) where air rushes • Powerful winds created that spiral around a central
“eye” • Winds blow at least 75 mph
What conditions are necessary for a hurricane to occur?
• An ocean where water temperatures is 81° F or higher
• Area of low pressure (rising air) How do Meteorologists know when a hurricane is coming?
• Ground observations • Aircraft observations • Satellite images
3
Name
Period Date
FOSS Weather and Water Course© The Regents of the University of California Student SheetCan be duplicated for classroom or workshop use.
AIR INVESTIGATIONS
Part 1: Record observations and questions.While exploring air with a syringe, write three observations and three questions.
Observations
Questions
Part 2: Conduct an air investigation.
1. What do you want to fi nd out?
2. What materials will you use?
3. How will you do this? Describe and draw. (Use the facing page to draw your setup.)
4. What did you observe? (Use the facing page.)
5. What did you fi nd out? (Use the facing page.)
Investigation 2: Where’s the Air?
120-6523_Weather_LN_pg-1-60.indd3 3120-6523_Weather_LN_pg-1-60.indd3 3 6/6/08 1:47:03 PM6/6/08 1:47:03 PM
5
Name
Period Date
FOSS Weather and Water Course© The Regents of the University of California Student SheetCan be duplicated for classroom or workshop use.
EARTH’S-ATMOSPHERE QUESTIONS
1. What is the atmosphere?
2. Describe how the amount of air changes as you travel up through Earth’s atmosphere.
3. Describe how the composition of gases changes as you travel up through Earth’s atmosphere.
4. Describe how the temperature changes as you travel up through the atmosphere.
5. What layer of the atmosphere do you think is of greatest interest to meteorologists? Why do you think so?
6. What gases are found in the atmosphere? What gases are found only in the troposphere?
Investigation 2: Where’s the Air?
120-6523_Weather_LN_pg-1-60.indd5 5120-6523_Weather_LN_pg-1-60.indd5 5 6/6/08 1:47:03 PM6/6/08 1:47:03 PM
7
Name
Period Date
FOSS Weather and Water Course© The Regents of the University of California Student SheetCan be duplicated for classroom or workshop use.
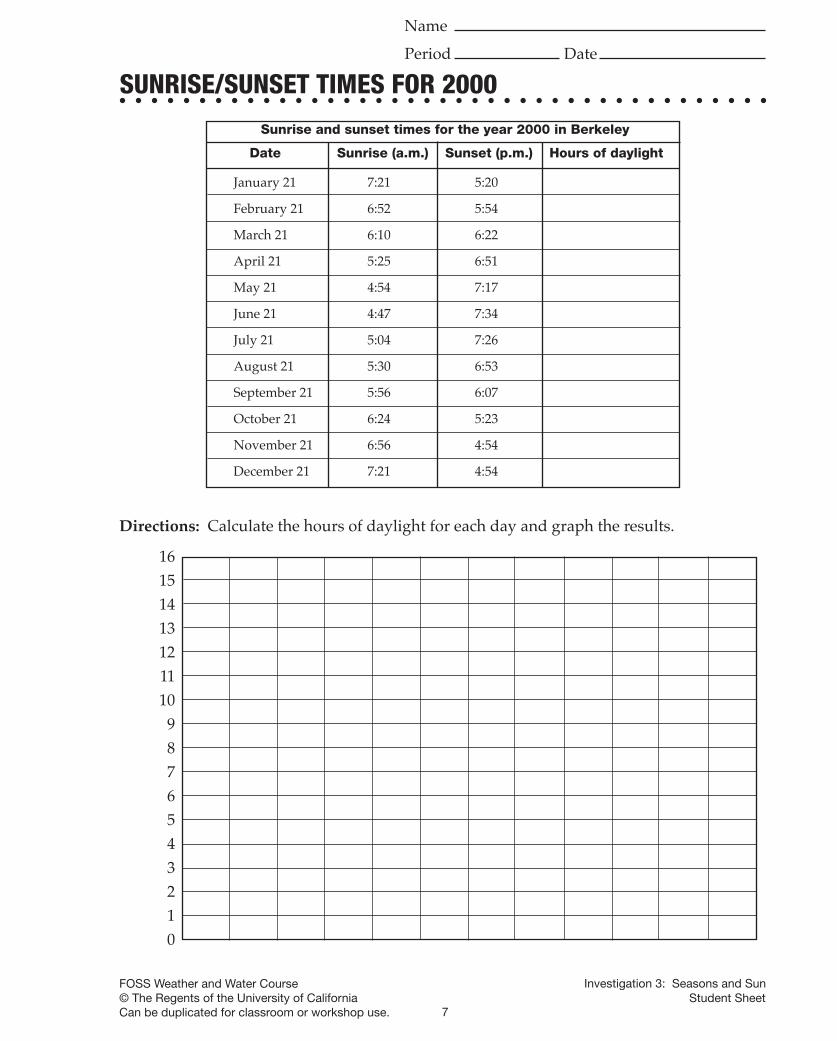
SUNRISE/SUNSET TIMES FOR 2000
January 21 7:21 5:20
February 21 6:52 5:54
March 21 6:10 6:22
April 21 5:25 6:51
May 21 4:54 7:17
June 21 4:47 7:34
July 21 5:04 7:26
August 21 5:30 6:53
September 21 5:56 6:07
October 21 6:24 5:23
November 21 6:56 4:54
December 21 7:21 4:54
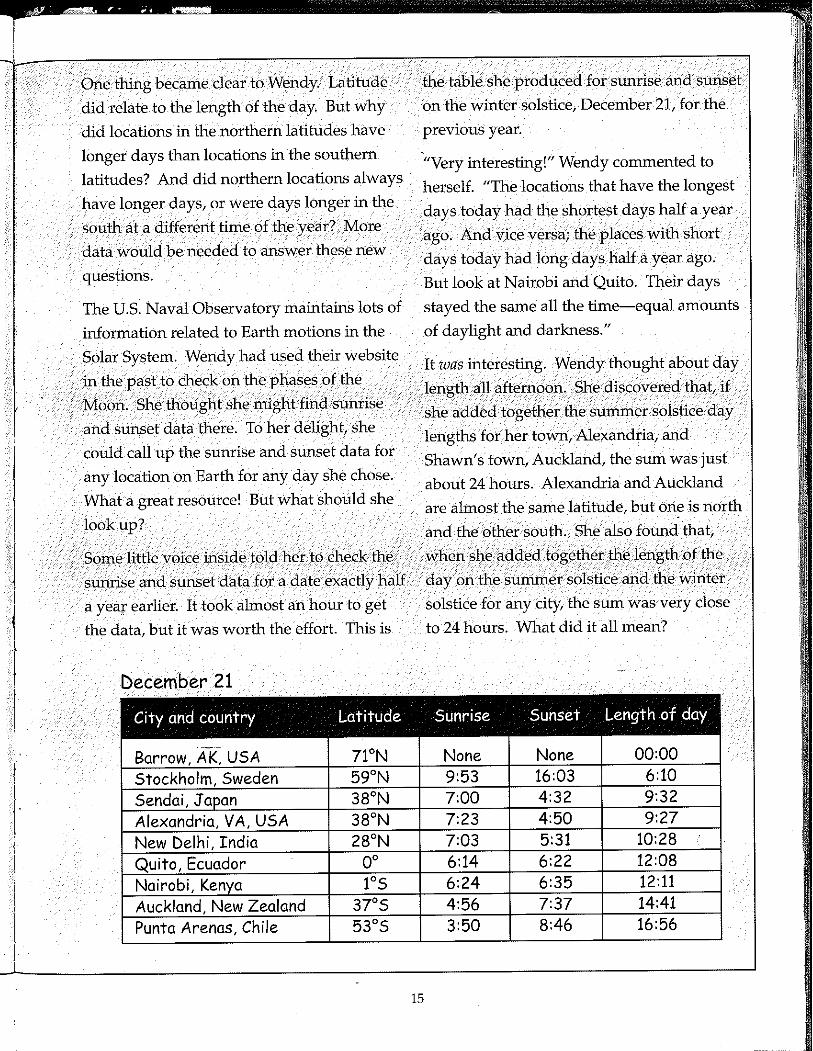
Date Sunrise (a.m.) Sunset (p.m.) Hours of daylight
Sunrise and sunset times for the year 2000 in Berkeley
Directions: Calculate the hours of daylight for each day and graph the results.
161514131211109876543210
Investigation 3: Seasons and Sun
120-6523_Weather_LN_pg-1-60.indd7 7120-6523_Weather_LN_pg-1-60.indd7 7 6/6/08 1:47:04 PM6/6/08 1:47:04 PM
9
Name
Period Date
FOSS Weather and Water Course© The Regents of the University of California Student SheetCan be duplicated for classroom or workshop use.
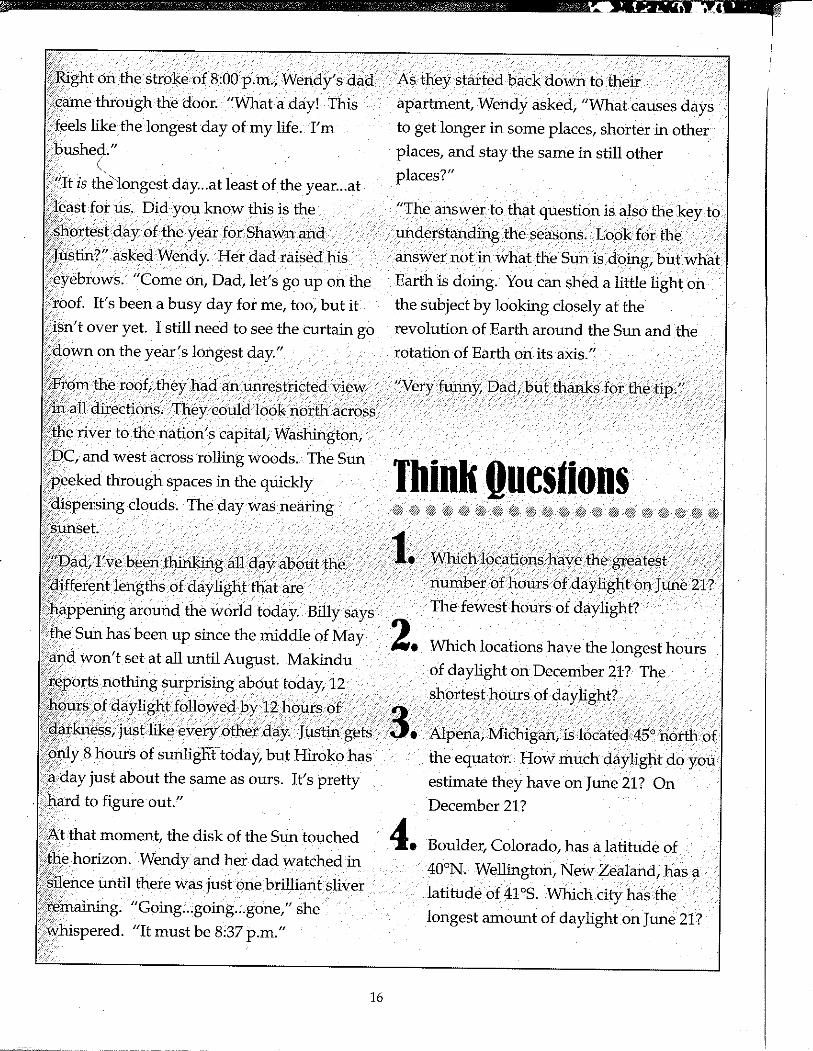
SEASONAL CHANGESDirections: Open the Seasons simulation. Select Berkeley from the fi rst list of cities. Click month by month through the year, stopping at the equinoxes and solstices.
1. Circle the description that best describes the amount of light and dark experienced in a day by people living in Berkeley at the times listed below.
Spring equinox (Mar. 21) More light Equal More darkness
Summer solstice (June 21) More light Equal More darkness
Fall equinox (Sept. 21) More light Equal More darkness
Winter solstice (Dec. 21) More light Equal More darkness
2. Set the Earth View to “Side.” You are now out in space looking at the Sun-Earth system (the same view seen in the Orbit View window). What does Earth look like at each of the times above? Draw a little picture of Earth in the boxes to the right. Show the parts of Earth in the light and in the dark. (Spring equinox is drawn already.)
3. What shape is the path traced by Berkeley as Earth completes one rotation? Describe and draw the shape.
(To make sure, click the Advanced button and look at the North Pole in the Earth View window.)
4. Where does the day/night line cross the Berkeley path at the summer solstice? Draw the top view, showing light and dark.
How long is the daylight?
5. Where does the day/night line cross the Berkeley path at the spring equinox? Draw the top view, showing light and dark.
How long is the daylight?
6. Select the cities between the equator and the North Pole one by one. Use the Earth View window to step through a day, hour by hour, on the summer solstice. Count and record the hours of daylight.Repeat the process for the winter solstice. Record the length of the day for each city. Graph the results. What is the relationship between latitude and day length?
Investigation 3: Seasons and Sun
120-6523_Weather_LN_pg-1-60.indd9 9120-6523_Weather_LN_pg-1-60.indd9 9 6/6/08 1:47:05 PM6/6/08 1:47:05 PM
11
Name
Period Date
FOSS Weather and Water Course© The Regents of the University of California Student SheetCan be duplicated for classroom or workshop use.
RESPONSE SHEET—SEASONS AND SUN
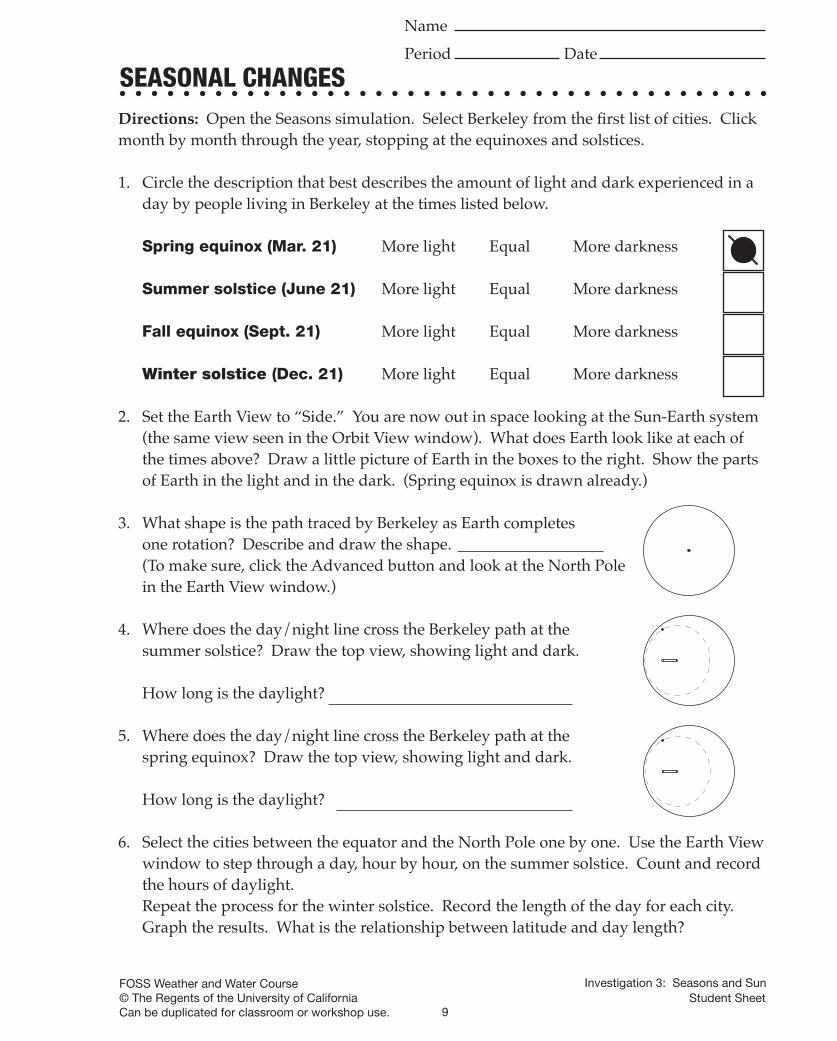
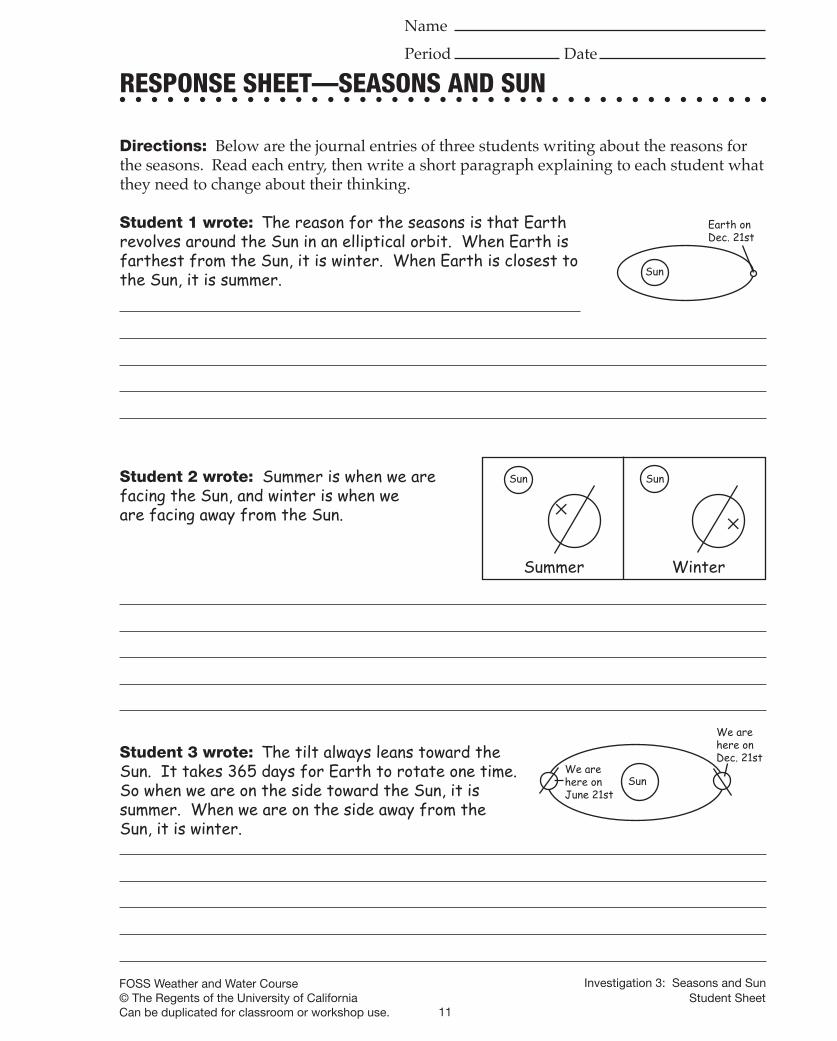
Directions: Below are the journal entries of three students writing about the reasons for the seasons. Read each entry, then write a short paragraph explaining to each student what they need to change about their thinking.
Student 1 wrote: The reason for the seasons is that Earth revolves around the Sun in an elliptical orbit. When Earth is farthest from the Sun, it is winter. When Earth is closest to the Sun, it is summer.
Student 2 wrote: Summer is when we are facing the Sun, and winter is when weare facing away from the Sun.
✕
Sun Sun
✕
Summer Winter
Sun
Earth on Dec. 21st
Student 3 wrote: The tilt always leans toward theSun. It takes 365 days for Earth to rotate one time. So when we are on the side toward the Sun, it is summer. When we are on the side away from the Sun, it is winter.
Sun
We are here on Dec. 21st
We are here on June 21st
Investigation 3: Seasons and Sun
120-6523_Weather_LN_pg-1-60.indd11 11120-6523_Weather_LN_pg-1-60.indd11 11 6/6/08 1:47:05 PM6/6/08 1:47:05 PM
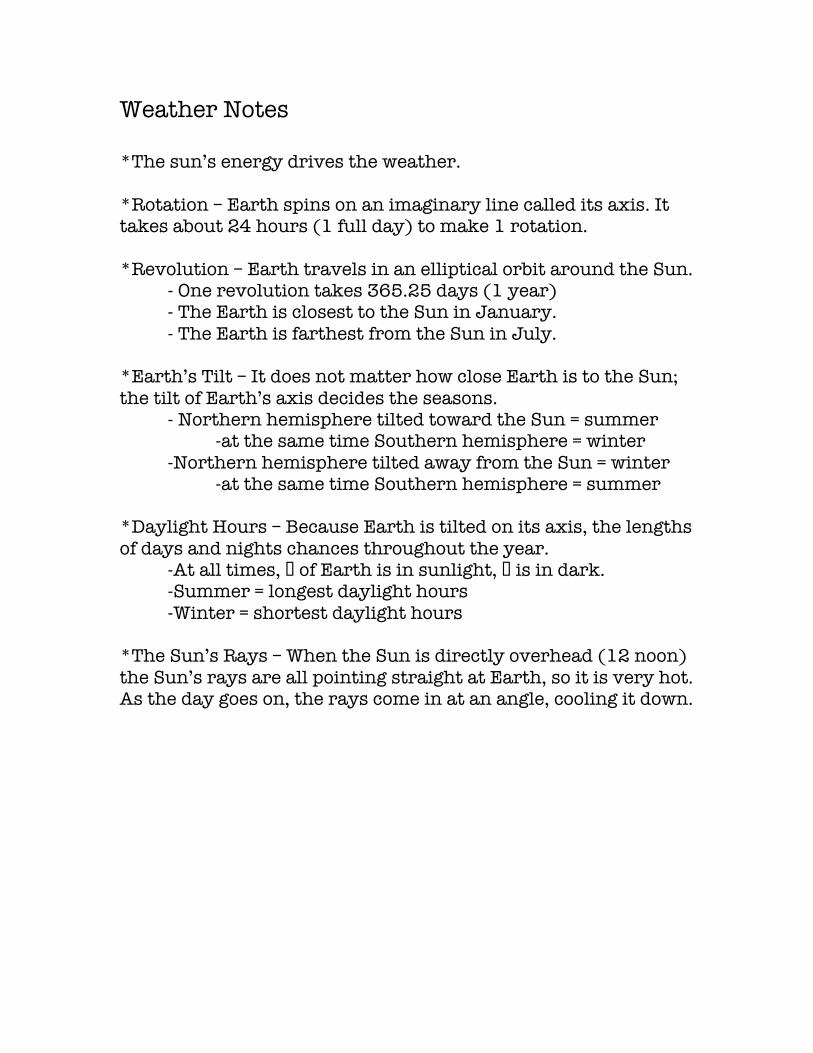
Weather Notes *The sun’s energy drives the weather. *Rotation – Earth spins on an imaginary line called its axis. It takes about 24 hours (1 full day) to make 1 rotation. *Revolution – Earth travels in an elliptical orbit around the Sun. - One revolution takes 365.25 days (1 year) - The Earth is closest to the Sun in January. - The Earth is farthest from the Sun in July. *Earth’s Tilt – It does not matter how close Earth is to the Sun; the tilt of Earth’s axis decides the seasons. - Northern hemisphere tilted toward the Sun = summer -at the same time Southern hemisphere = winter -Northern hemisphere tilted away from the Sun = winter -at the same time Southern hemisphere = summer *Daylight Hours – Because Earth is tilted on its axis, the lengths of days and nights chances throughout the year. -At all times, � of Earth is in sunlight, � is in dark. -Summer = longest daylight hours -Winter = shortest daylight hours *The Sun’s Rays – When the Sun is directly overhead (12 noon) the Sun’s rays are all pointing straight at Earth, so it is very hot. As the day goes on, the rays come in at an angle, cooling it down.
13
Name
Period Date
FOSS Weather and Water Course© The Regents of the University of California Student SheetCan be duplicated for classroom or workshop use.
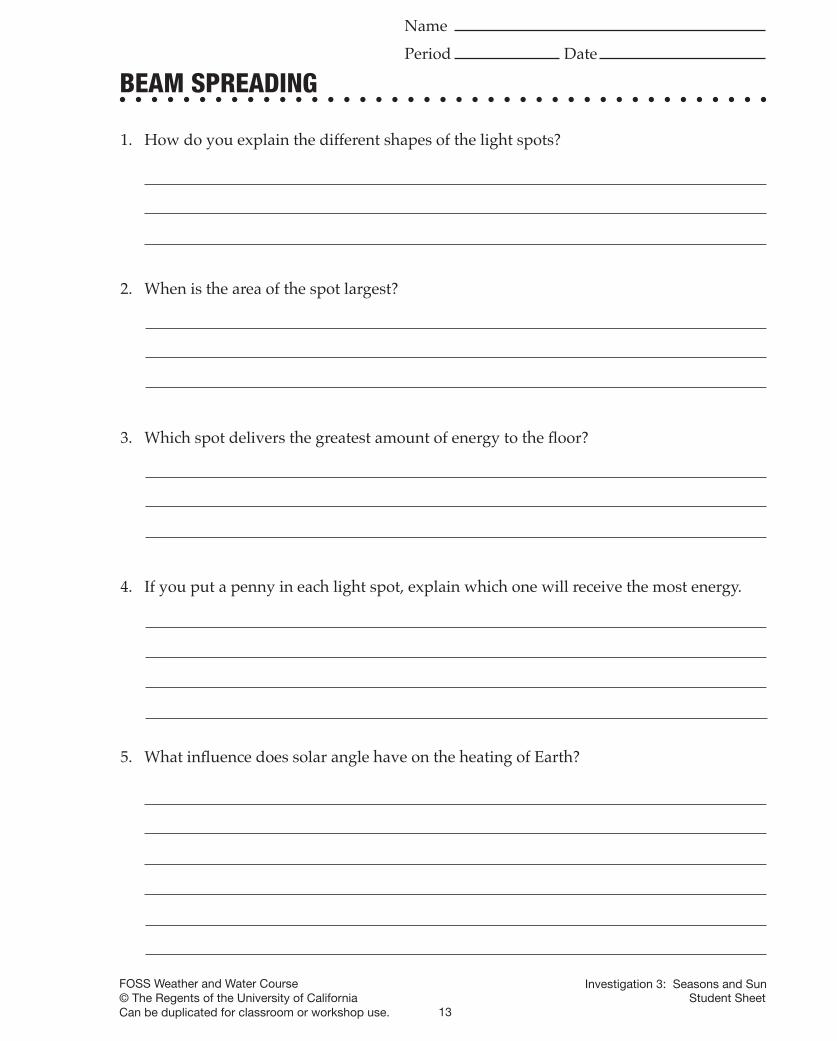
1. How do you explain the different shapes of the light spots?
2. When is the area of the spot largest?
3. Which spot delivers the greatest amount of energy to the fl oor?
4. If you put a penny in each light spot, explain which one will receive the most energy.
5. What infl uence does solar angle have on the heating of Earth?
BEAM SPREADING
Investigation 3: Seasons and Sun
120-6523_Weather_LN_pg-1-60.indd13 13120-6523_Weather_LN_pg-1-60.indd13 13 6/6/08 1:47:06 PM6/6/08 1:47:06 PM
14
Name
Period Date
FOSS Weather and Water Course© The Regents of the University of California Student SheetCan be duplicated for classroom or workshop use.
EARTH-MATERIAL TEMPERATURES CHARTTe
mp
.Te
mp.
Tem
p.
Tem
p.
Tem
p. c
hang
eTe
mp.
cha
nge
Tem
p. c
hang
eTe
mp.
cha
nge
Tim
e
S
and
Soil
W
ate
r
Air
3-m
inute
in
terv
als
Investigation 4: Heat Transfer
120-6523_Weather_LN_pg-1-60.indd14 14120-6523_Weather_LN_pg-1-60.indd14 14 6/6/08 1:47:06 PM6/6/08 1:47:06 PM

15
Name
Period Date
FOSS Weather and Water Course© The Regents of the University of California Student SheetCan be duplicated for classroom or workshop use.
EARTH-MATERIAL TEMPERATURES GRAPH
Investigation 4: Heat Transfer
120-6523_Weather_LN_pg-1-60.indd15 15120-6523_Weather_LN_pg-1-60.indd15 15 6/6/08 1:47:06 PM6/6/08 1:47:06 PM

17
Name
Period Date
FOSS Weather and Water Course© The Regents of the University of California Student SheetCan be duplicated for classroom or workshop use.
HEAT CONDUCTION
1. Write a defi nition for heat.
2. Describe heat conduction.
3. Explain your understanding of how heat transfers from one material to another.
4. Explain why a soda can feels cold when you take it out of the refrigerator.
Investigation 4: Heat Transfer
120-6523_Weather_LN_pg-1-60.indd17 17120-6523_Weather_LN_pg-1-60.indd17 17 6/6/08 1:47:07 PM6/6/08 1:47:07 PM
19
Name
Period Date
FOSS Weather and Water Course© The Regents of the University of California Student SheetCan be duplicated for classroom or workshop use.
Investigation 4: Heat Transfer
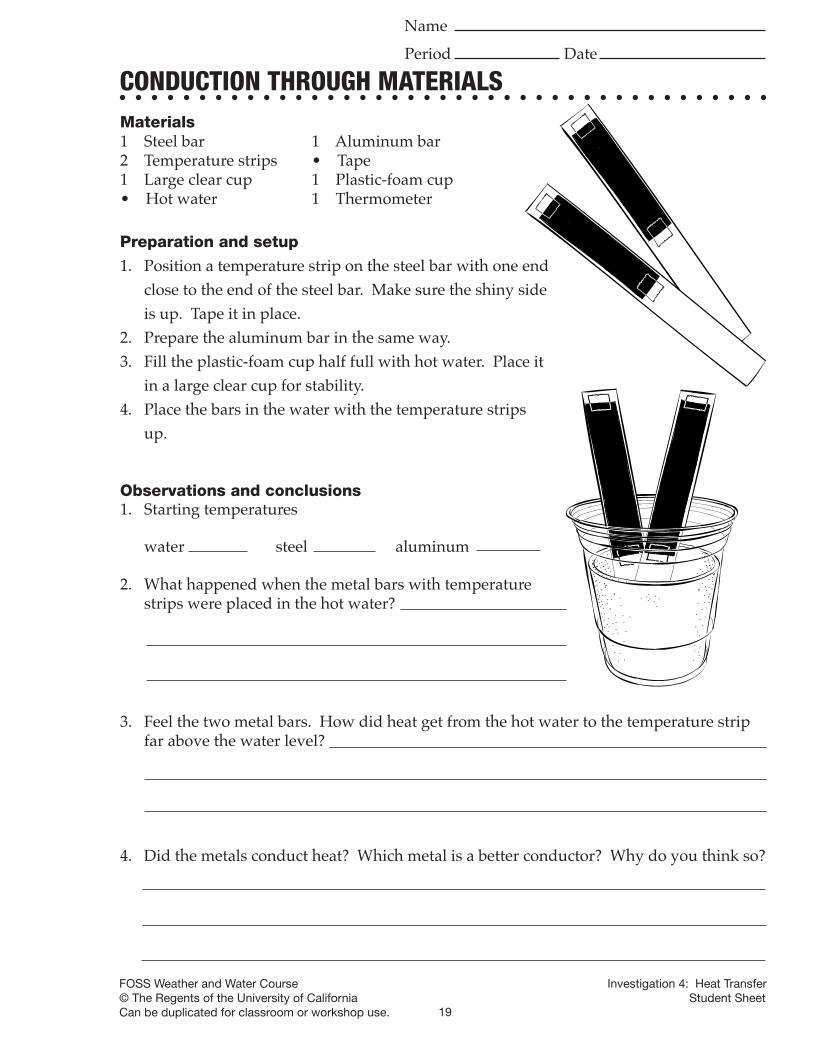
Observations and conclusions1. Starting temperatures
water steel aluminum
2. What happened when the metal bars with temperature strips were placed in the hot water?
CONDUCTION THROUGH MATERIALS
3. Feel the two metal bars. How did heat get from the hot water to the temperature strip far above the water level?
4. Did the metals conduct heat? Which metal is a better conductor? Why do you think so?
Materials1 Steel bar 1 Aluminum bar2 Temperature strips • Tape1 Large clear cup 1 Plastic-foam cup • Hot water 1 Thermometer Preparation and setup
1. Position a temperature strip on the steel bar with one end close to the end of the steel bar. Make sure the shiny side is up. Tape it in place.
2. Prepare the aluminum bar in the same way.3. Fill the plastic-foam cup half full with hot water. Place it
in a large clear cup for stability.4. Place the bars in the water with the temperature strips
up.
120-6523_Weather_LN_pg-1-60.indd19 19120-6523_Weather_LN_pg-1-60.indd19 19 6/6/08 1:47:07 PM6/6/08 1:47:07 PM
21
Name
Period Date
FOSS Weather and Water Course© The Regents of the University of California Student SheetCan be duplicated for classroom or workshop use.
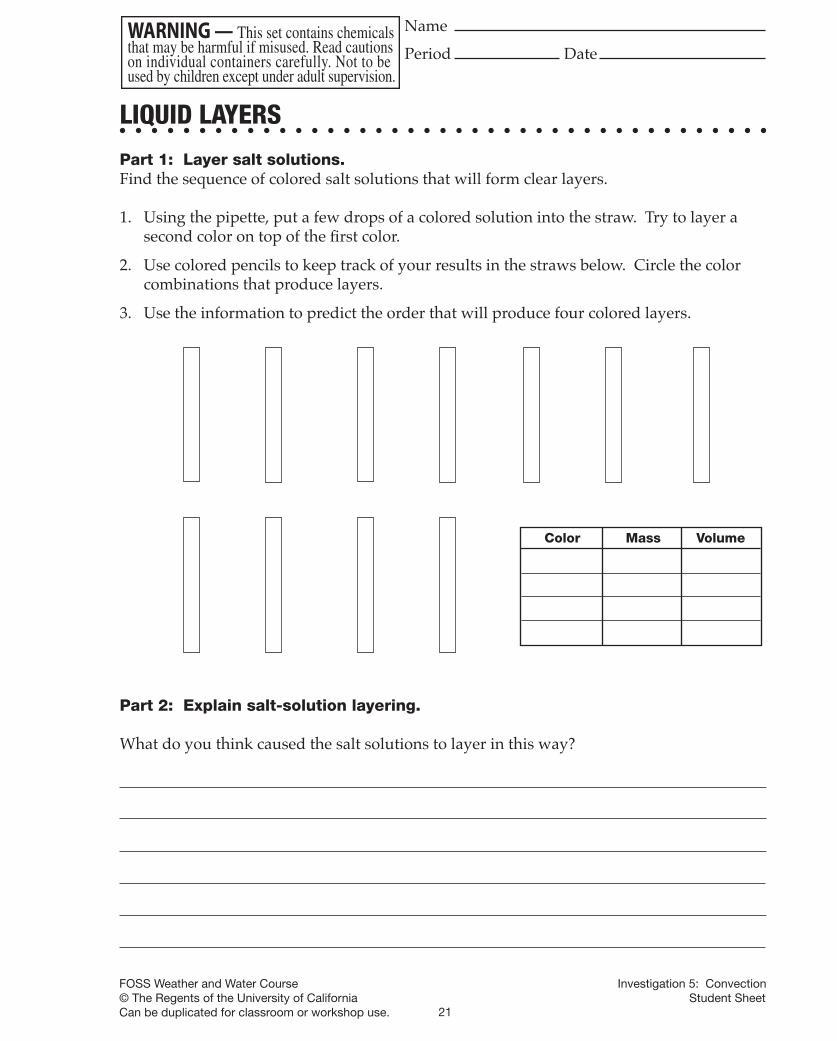
LIQUID LAYERS
Part 1: Layer salt solutions.Find the sequence of colored salt solutions that will form clear layers.
1. Using the pipette, put a few drops of a colored solution into the straw. Try to layer a second color on top of the fi rst color.
2. Use colored pencils to keep track of your results in the straws below. Circle the color combinations that produce layers.
3. Use the information to predict the order that will produce four colored layers.
Part 2: Explain salt-solution layering.
What do you think caused the salt solutions to layer in this way?
Color Mass Volume
Investigation 5: Convection
120-6523_Weather_LN_pg-1-60.indd21 21120-6523_Weather_LN_pg-1-60.indd21 21 6/6/08 1:47:08 PM6/6/08 1:47:08 PM
23
Name
Period Date
FOSS Weather and Water Course© The Regents of the University of California Student SheetCan be duplicated for classroom or workshop use.
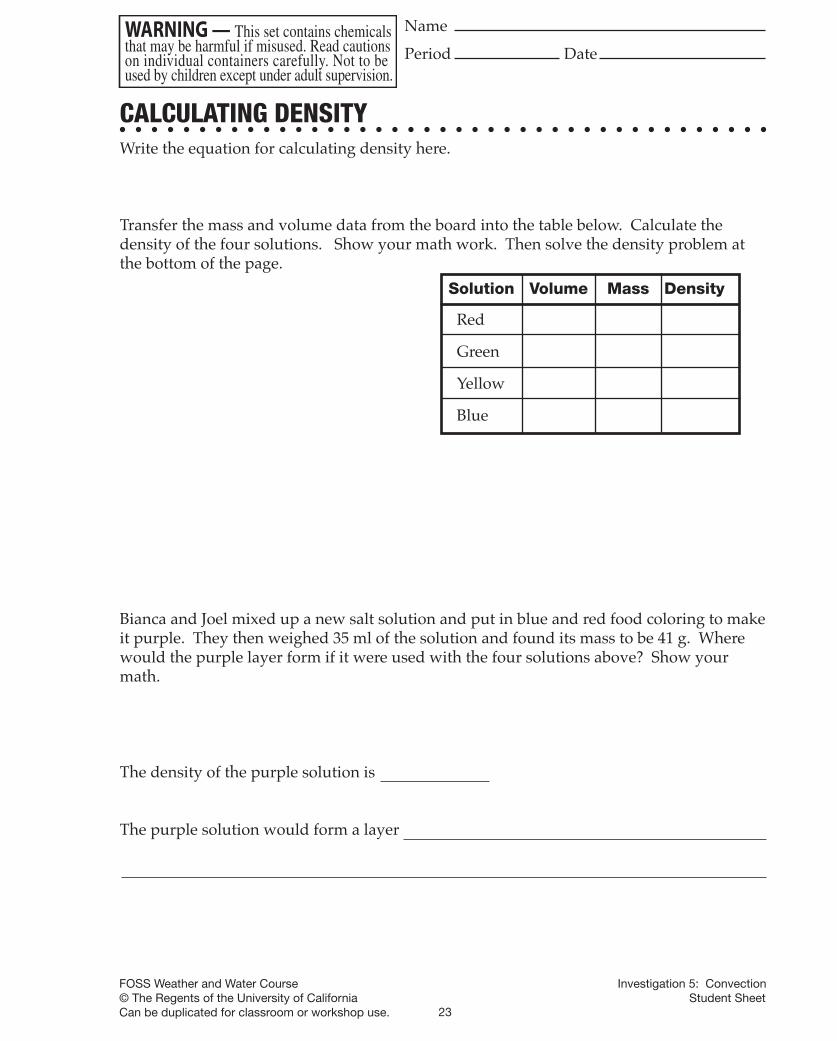
CALCULATING DENSITYWrite the equation for calculating density here.
Transfer the mass and volume data from the board into the table below. Calculate the density of the four solutions. Show your math work. Then solve the density problem at the bottom of the page.
Bianca and Joel mixed up a new salt solution and put in blue and red food coloring to make it purple. They then weighed 35 ml of the solution and found its mass to be 41 g. Where would the purple layer form if it were used with the four solutions above? Show your math.
The density of the purple solution is
The purple solution would form a layer
Solution Volume Mass Density
Red
Green
Yellow
Blue
Investigation 5: Convection
120-6523_Weather_LN_pg-1-60.indd23 23120-6523_Weather_LN_pg-1-60.indd23 23 6/6/08 1:47:09 PM6/6/08 1:47:09 PM
27
Name
Period Date
FOSS Weather and Water Course© The Regents of the University of California Student SheetCan be duplicated for classroom or workshop use.
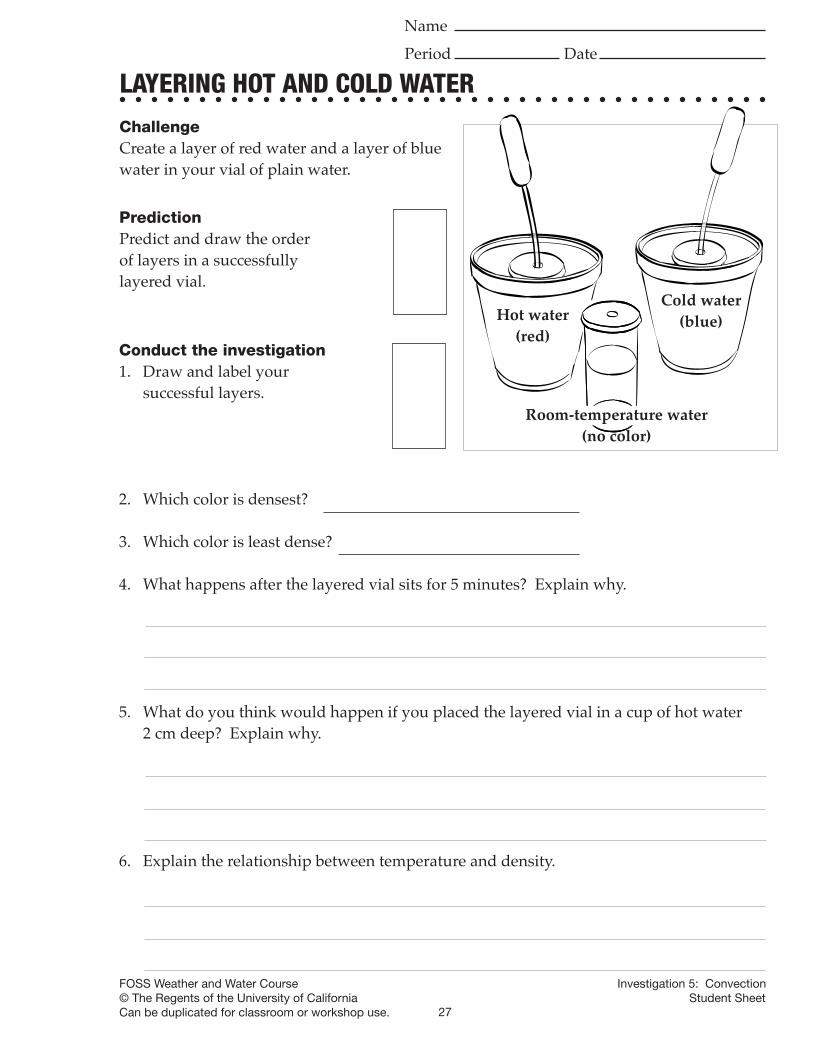
Conduct the investigation1. Draw and label your
successful layers.
2. Which color is densest?
3. Which color is least dense?
4. What happens after the layered vial sits for 5 minutes? Explain why.
5. What do you think would happen if you placed the layered vial in a cup of hot water 2 cm deep? Explain why.
6. Explain the relationship between temperature and density.
LAYERING HOT AND COLD WATERChallengeCreate a layer of red water and a layer of blue water in your vial of plain water.
PredictionPredict and draw the order of layers in a successfully layered vial.
Investigation 5: Convection
Cold water(blue)Hot water
(red)
Room-temperature water(no color)
120-6523_Weather_LN_pg-1-60.indd27 27120-6523_Weather_LN_pg-1-60.indd27 27 6/6/08 1:47:10 PM6/6/08 1:47:10 PM
29
Name
Period Date
FOSS Weather and Water Course© The Regents of the University of California Student SheetCan be duplicated for classroom or workshop use.
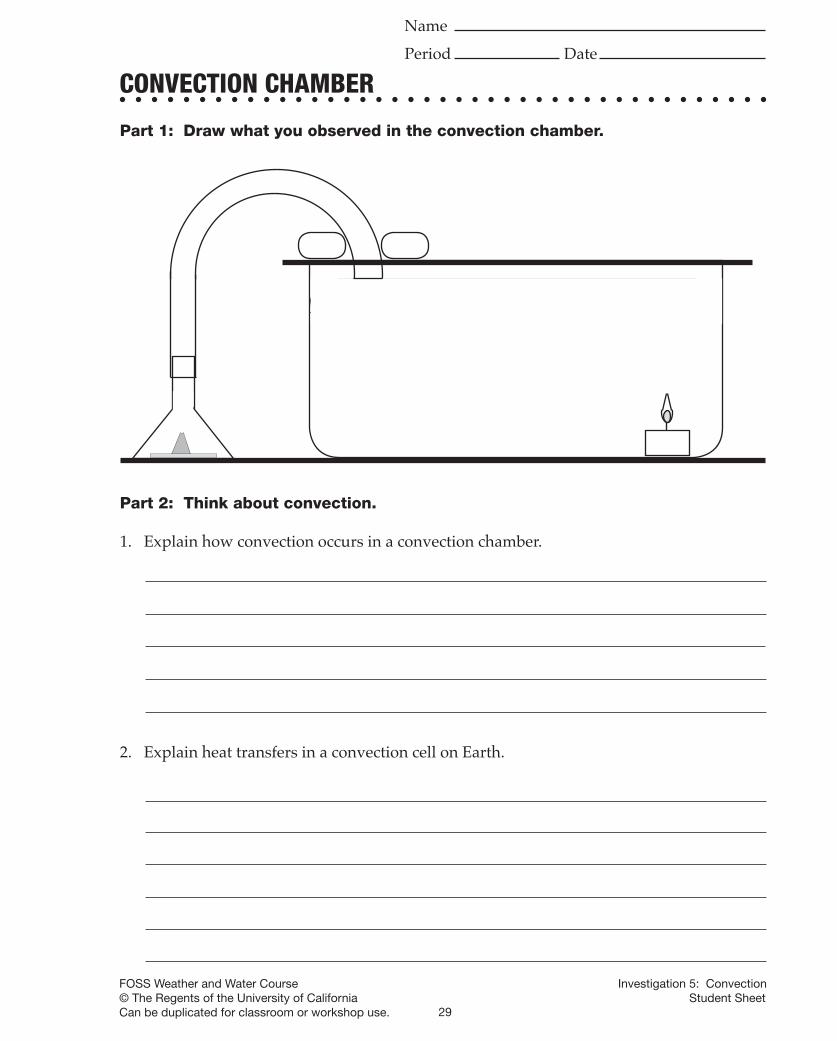
CONVECTION CHAMBER
Part 1: Draw what you observed in the convection chamber.
Part 2: Think about convection.
1. Explain how convection occurs in a convection chamber.
2. Explain heat transfers in a convection cell on Earth.
Investigation 5: Convection
120-6523_Weather_LN_pg-1-60.indd29 29120-6523_Weather_LN_pg-1-60.indd29 29 6/6/08 1:47:10 PM6/6/08 1:47:10 PM
Clouds & Precipitation
• When gas is squeezed into a smaller space (like when we squeezed the bottle) more molecule collisions occur, which results in increased temperatures.
• When pressure is reduced on a gas (more space in our
bottle), it expands. There is more space for molecules to move, so the temperature decreases or lowers.
• Warm air can hold more water vapor than cold air. • Just like dew on grass, water vapor in the air needs a
surface on which to condense. • Condensation Nucleus – Materials that water vapor
attaches to, to form a cloud. (Dust, smog, air pollution, smoke, salt, chemicals).
Air Mass
• A large mass of air that stays over a portion of Earth’s surface for a long time and doesn’t move is called stagnant air.
• The large body of stagnant air is called an air mass. They
stay the same temperature and humidity • Meteorologists name air masses according to where they
are. o Maritime Tropical – over tropical waters. o Continental Polar – forms over cool, dry land.
• Air masses rarely form over the United States (lower 48) because of all the different types of winds that blow over the land.
• When two air masses meet, a boundary forms between them, which is called a front
• Fronts cause weather to change. When one air mass
overtakes another, the weather we see and feel changes.
37
Name
Period Date
FOSS Weather and Water Course© The Regents of the University of California Student SheetCan be duplicated for classroom or workshop use.
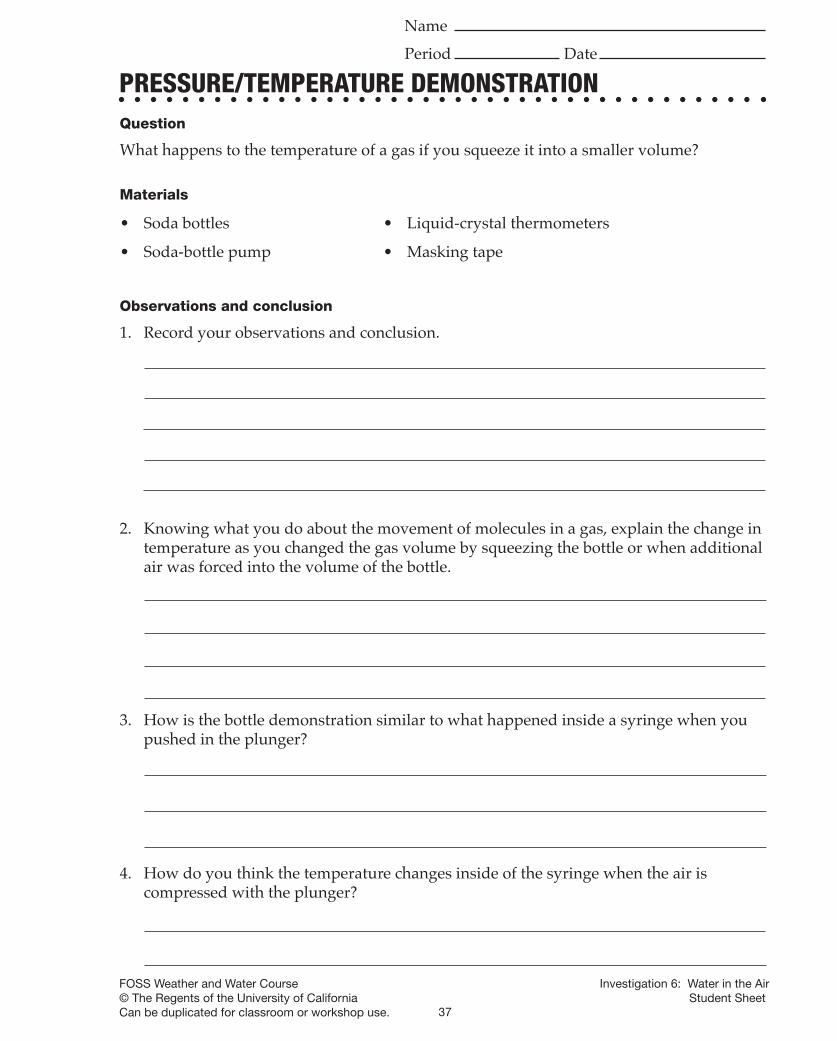
PRESSURE/TEMPERATURE DEMONSTRATIONQuestion
What happens to the temperature of a gas if you squeeze it into a smaller volume?
Materials
• Soda bottles • Liquid-crystal thermometers
• Soda-bottle pump • Masking tape
Observations and conclusion
1. Record your observations and conclusion.
2. Knowing what you do about the movement of molecules in a gas, explain the change in temperature as you changed the gas volume by squeezing the bottle or when additional air was forced into the volume of the bottle.
3. How is the bottle demonstration similar to what happened inside a syringe when you pushed in the plunger?
4. How do you think the temperature changes inside of the syringe when the air is compressed with the plunger?
Investigation 6: Water in the Air
120-6523_Weather_LN_pg-1-60.indd37 37120-6523_Weather_LN_pg-1-60.indd37 37 6/6/08 1:47:12 PM6/6/08 1:47:12 PM
45
Name
Period Date
FOSS Weather and Water Course© The Regents of the University of California Student SheetCan be duplicated for classroom or workshop use.
Part 1: PredictionPredict what will happen to the water in the clear tube when the jar is squeezed.
Part 2: Explore the jar1. Construct a bottle-in-a-jar pressure indicator. Give it a squeeze. What happens?
2. Why do you think it behaves that way?
3. If you reduced the air pressure in the jar, what would happen to the level of water in the clear tube? Why?
PRESSURE IN A JAR
Investigation 8: Air Pressure and Wind
120-6523_Weather_LN_pg-1-60.indd45 45120-6523_Weather_LN_pg-1-60.indd45 45 6/6/08 1:47:14 PM6/6/08 1:47:14 PM
57
Name
Period Date
FOSS Weather and Water Course© The Regents of the University of California Student SheetCan be duplicated for classroom or workshop use.
READING WEATHER MAPS
Use the Sample Weather-Map Symbol sheet and the Surface Observations map in the resources book to complete this sheet.
1. Find the weather-station data for San Francisco, California. Use the weather-map symbol to fi gure out the following:
Temperature (°F) Air pressure (mb)
Wind direction Cloud cover
Wind speed (knots)
2. Which cities are experiencing haze?
3. Which cities are experiencing rain?
4. Which cities are experiencing fog?
5. Which city has the highest air pressure? How high is it? The lowest? How low is it?
6. Which areas of the United States are experiencing the warmest temperatures?
7. List two other observations about the weather across the United States for this date.
Investigation 9: Weather and Climate
120-6523_Weather_LN_pg-1-60.indd57 57120-6523_Weather_LN_pg-1-60.indd57 57 6/6/08 1:47:18 PM6/6/08 1:47:18 PM