WeArePublicHealth.org twitter.com/Maricopahealth facebook.com/MCDPH CHIP Tracker Update Jackie Ward,...
41
WeArePublicHealth.org twitter.com/Maricopahealth facebook.com/MCDPH CHIP Tracker Update Jackie Ward, Office of Epidemiology October 13, 2015
-
Upload
rosalyn-diane-barrett -
Category
Documents
-
view
220 -
download
6
Transcript of WeArePublicHealth.org twitter.com/Maricopahealth facebook.com/MCDPH CHIP Tracker Update Jackie Ward,...
WeArePublicHealth.org twitter.com/Maricopahealth facebook.com/MCDPH
CHIP Tracker UpdateJackie Ward, Office of Epidemiology October 13, 2015
2
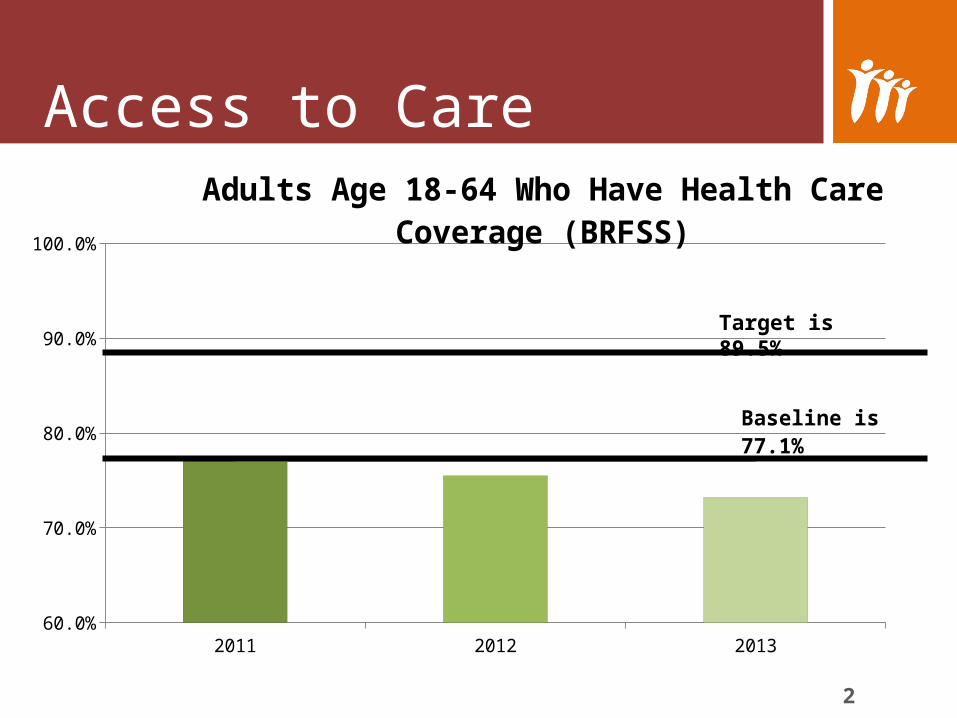
Access to Care
2011 2012 201360.0%
70.0%
80.0%
90.0%
100.0%
Adults Age 18-64 Who Have Health Care Coverage (BRFSS)
Baseline is 77.1%
Target is 89.5%
3
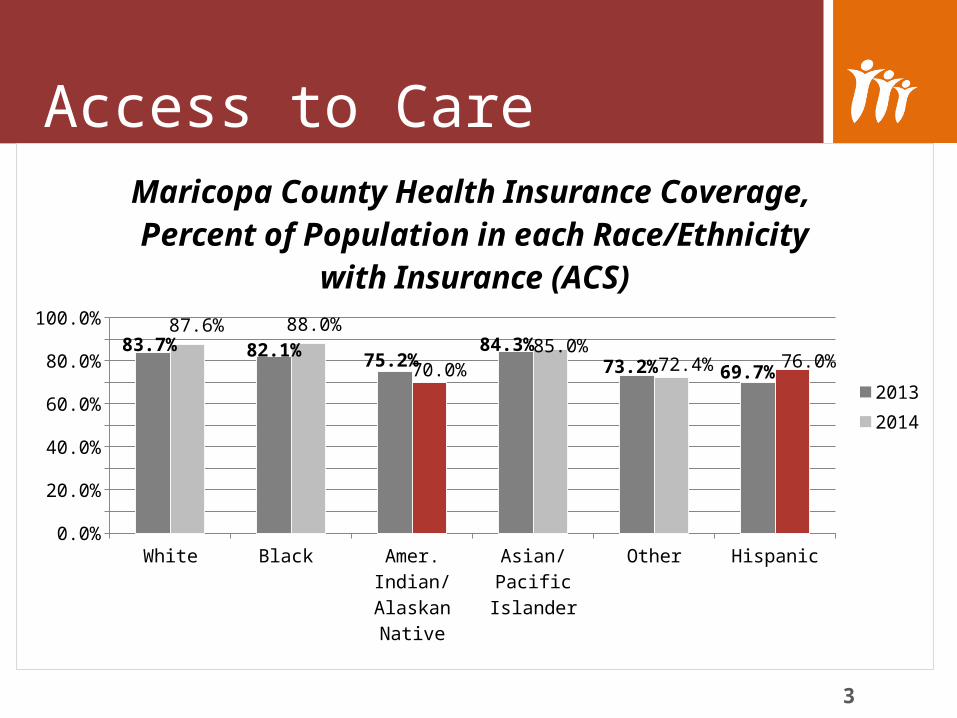
Access to Care
White
Black
Amer. Indian/ A
laskan Native
Asian/P
acific I
slander
Other
Hispanic
0.0%
20.0%
40.0%
60.0%
80.0%
100.0%83.7% 82.1% 75.2%
84.3%73.2% 69.7%
87.6% 88.0%
70.0%85.0%
72.4% 76.0%
Maricopa County Health Insurance Coverage, Percent of Population in each Race/Ethnicity with
Insurance (ACS)
20132014

4
Access to Care
2011 2012 201362.0%
64.0%
66.0%
68.0%
70.0%
72.0%
74.0%
76.0%
Adults Who Have a Usual Source of Health Care (BRFSS)
Baseline is 73.1%
Target is 72.4%
5
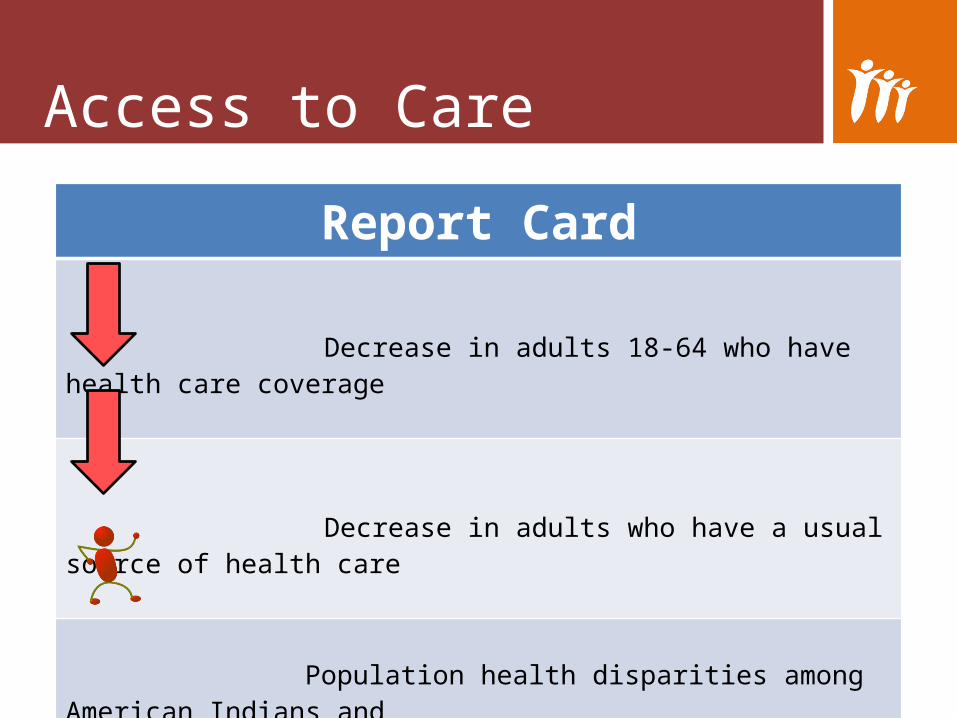
Access to Care
Report Card
Decrease in adults 18-64 who have health care coverage
Decrease in adults who have a usual source of health care
Population health disparities among American Indians and Hispanics
6
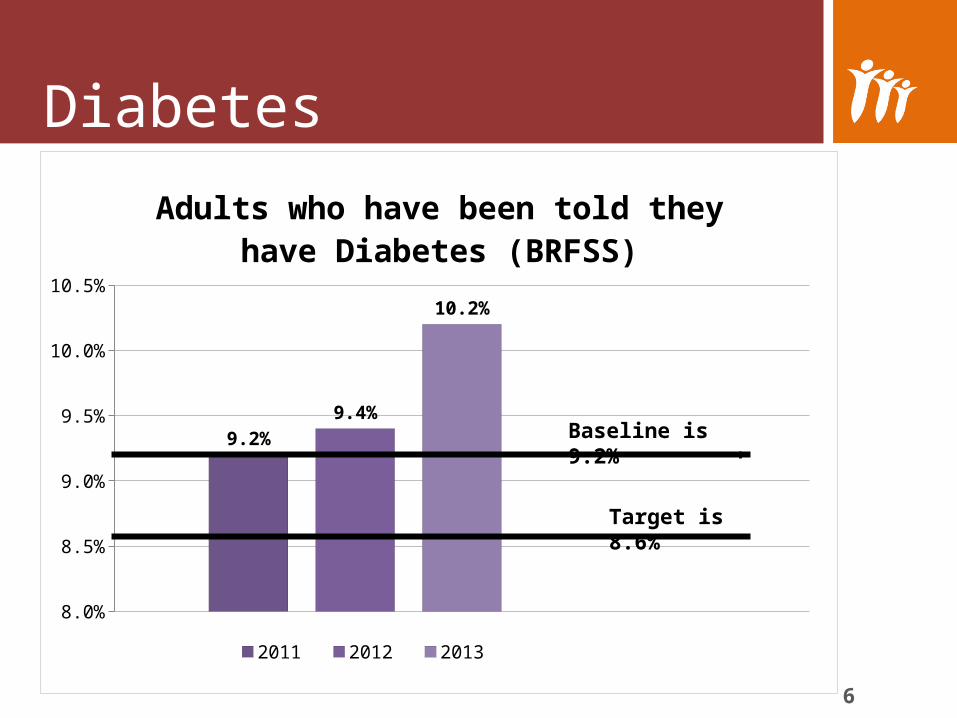
Diabetes
8.0%
8.5%
9.0%
9.5%
10.0%
10.5%
9.2%9.4%
10.2%
Adults who have been told they have Diabetes (BRFSS)
2011 2012 2013
Baseline is 9.2%
Target is 8.6%
7
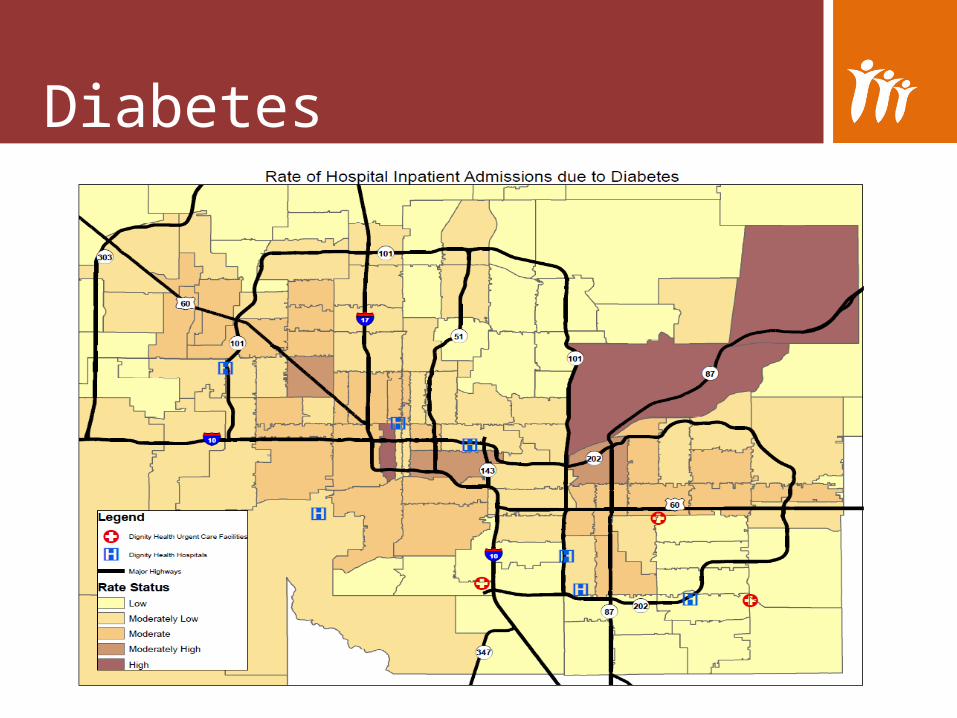
Diabetes

8
Diabetes
White Hispanic Black American Indian.
Asian Other/ Unknown
0.0
100.0
200.0
300.0
400.0
158.8142.0
289.3
338.8
42.172.6
2013 Diabetes-related Inpatient Dischargesby Race (Rate per 100,000 )
9
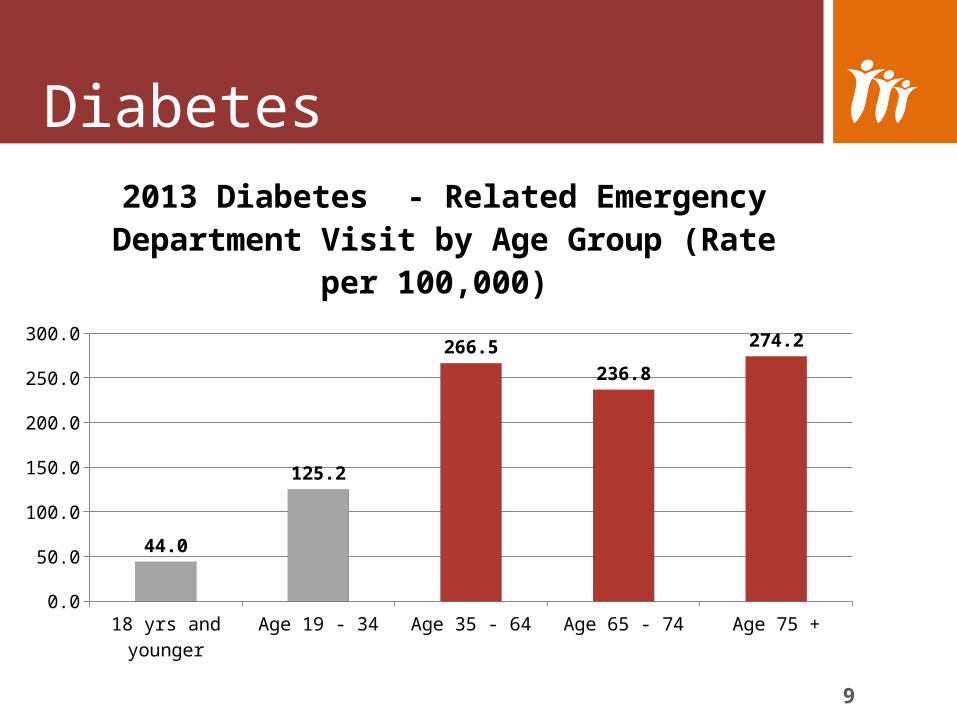
Diabetes
18 yrs and younger
Age 19 - 34 Age 35 - 64 Age 65 - 74 Age 75 +0.0
50.0
100.0
150.0
200.0
250.0
300.0
44.0
125.2
266.5
236.8
274.2
2013 Diabetes - Related Emergency Department Visit by Age Group (Rate per 100,000)

Diabetes
22.0
22.5
23.0
23.5
24.0
24.5
25.0
25.5
26.0
Death Rate due to Diabetes(Rate per 100,000)
2011 2012 2013
Baseline is 25.8
Target is 23.2
11
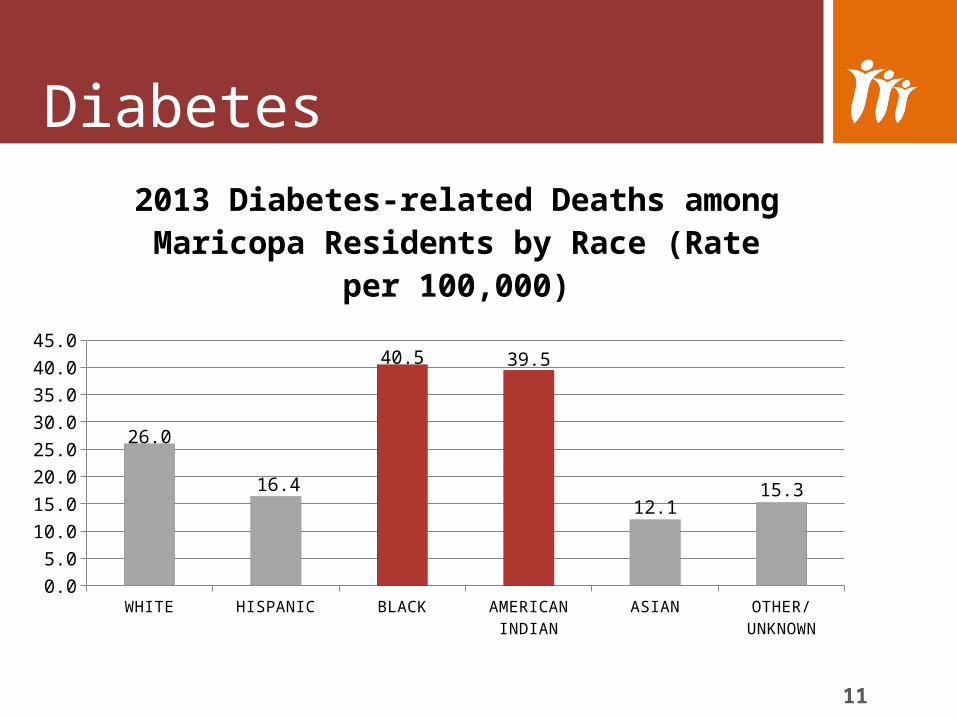
Diabetes
WHITE HISPANIC BLACK AMERICAN INDIAN
ASIAN OTHER/ UNKNOWN
0.0
5.0
10.0
15.0
20.0
25.0
30.0
35.0
40.0
45.0
26.0
16.4
40.5 39.5
12.115.3
2013 Diabetes-related Deaths among Maricopa Residents by Race (Rate per 100,000)
12
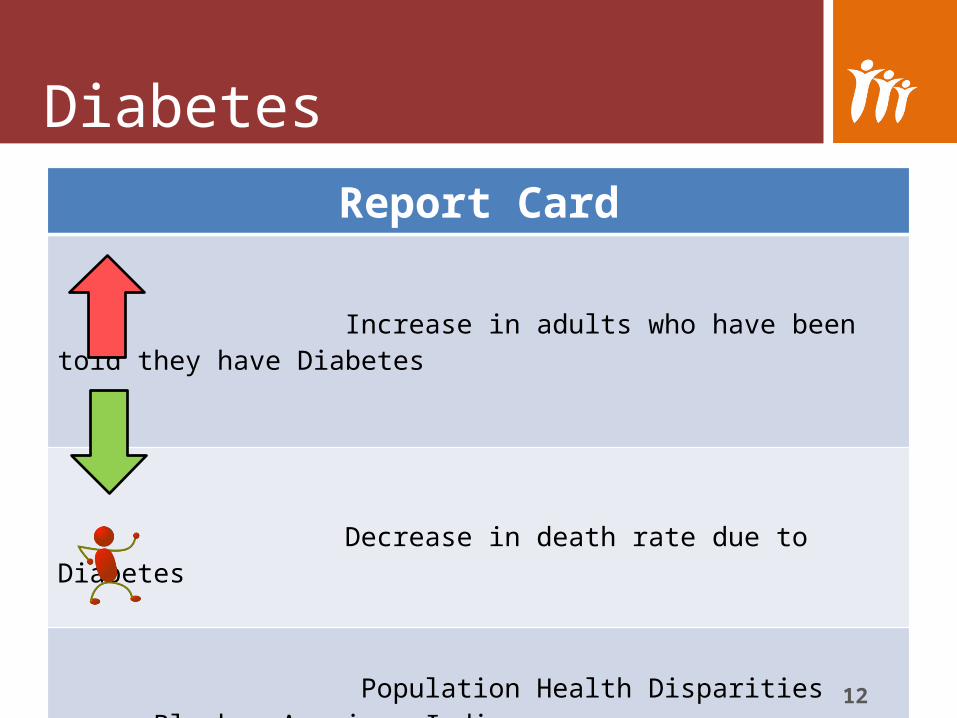
Diabetes Report Card
Increase in adults who have been told they have Diabetes
Decrease in death rate due to Diabetes
Population Health Disparities among Blacks, American Indians, 35-64 year olds and older adults 65+

13
Overweight
2011 2012 201332.5%
33.0%
33.5%
34.0%
34.5%
35.0%
35.5%
36.0%
36.5%
37.0%
37.5%
Overweight Adults (BRFSS)
Baseline is 37%
Target is 24.5%

14
Overweight
Maricopa County Total Male Female0.0%
10.0%
20.0%
30.0%
40.0%
50.0%
60.0%
70.0%
80.0%
90.0%
100.0%
36.0%43.8%
28.1%
Overweight Adults 2013 (BRFSS)
15
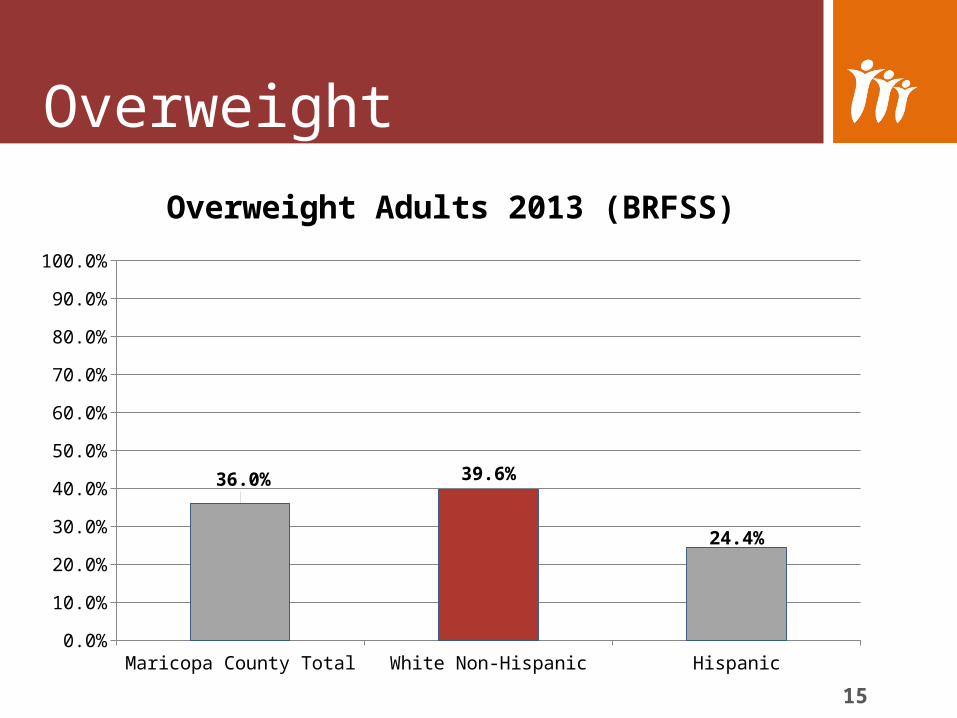
Overweight
Maricopa County Total White Non-Hispanic Hispanic0.0%
10.0%
20.0%
30.0%
40.0%
50.0%
60.0%
70.0%
80.0%
90.0%
100.0%
36.0% 39.6%
24.4%
Overweight Adults 2013 (BRFSS)
16
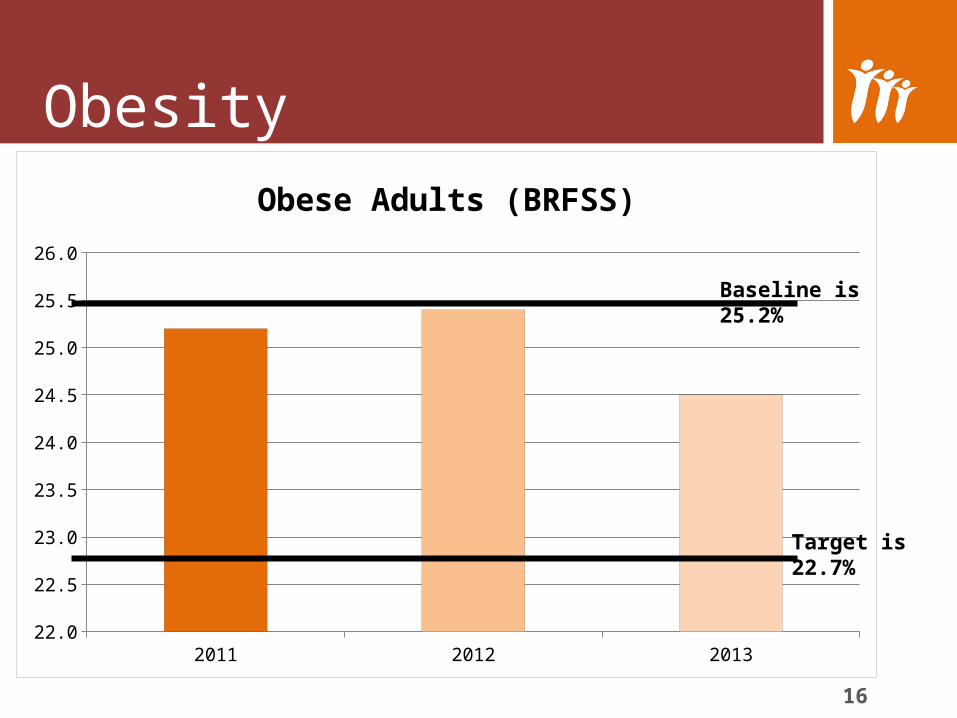
Obesity
2011 2012 201322.0
22.5
23.0
23.5
24.0
24.5
25.0
25.5
26.0
Obese Adults (BRFSS)
Baseline is 25.2%
Target is 22.7%

17
Obesity
Maricopa County Total White Non-Hispanic Hispanic0.0%
10.0%
20.0%
30.0%
40.0%
50.0%
60.0%
70.0%
80.0%
90.0%
100.0%
24.5% 20.3%
34.1%
Obese Adults 2013 (BRFSS)
18
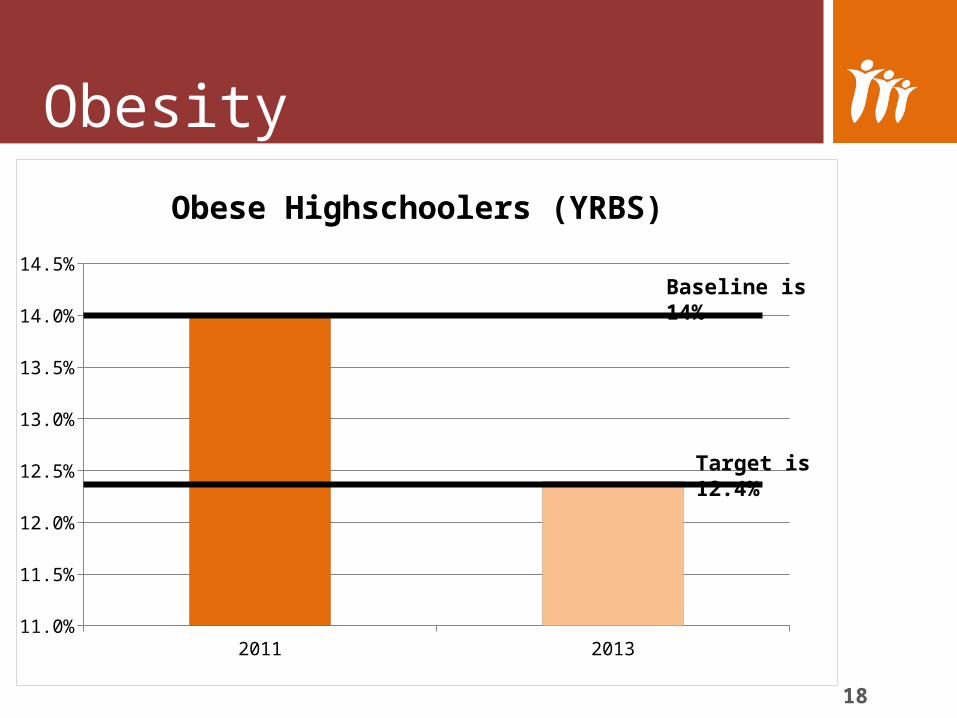
Obesity
2011 201311.0%
11.5%
12.0%
12.5%
13.0%
13.5%
14.0%
14.5%
Obese Highschoolers (YRBS)
Baseline is 14%
Target is 12.4%
19
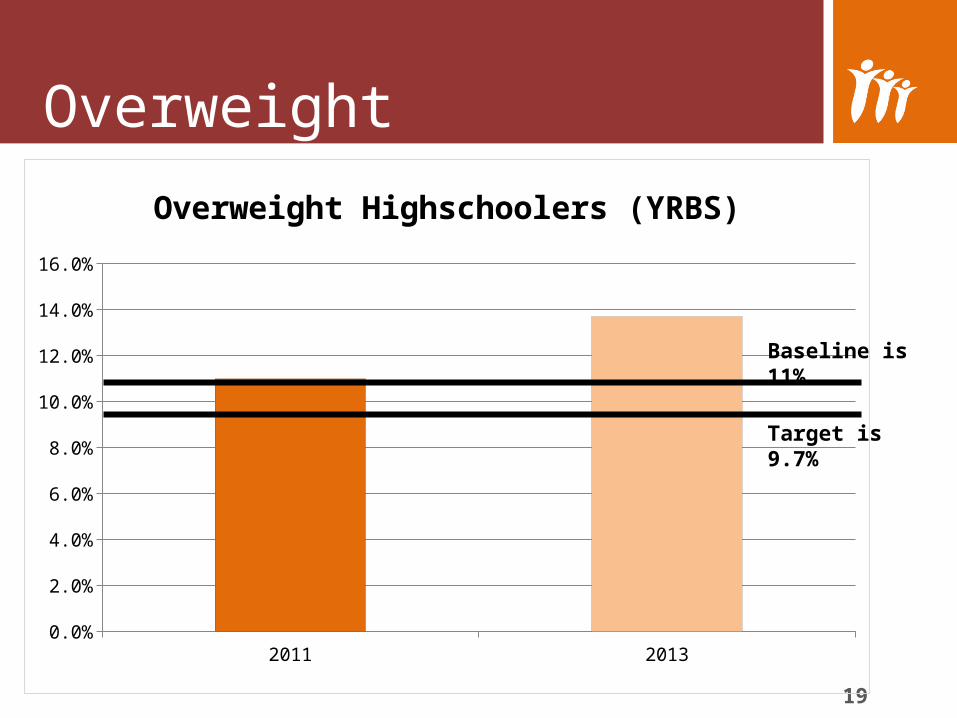
Overweight
2011 20130.0%
2.0%
4.0%
6.0%
8.0%
10.0%
12.0%
14.0%
16.0%
Overweight Highschoolers (YRBS)
Baseline is 11%
Target is 9.7%

20
Physical Activity
2011 201348.00%
50.00%
52.00%
54.00%
56.00%
58.00%
Adults who meet aerobic physical activity recom-mendations (BRFSS)
Baseline is 52.6%
Target is 57.9%

21
Physical Activity
Maricopa County Total White Non-Hispanic Hispanic0.0%
10.0%
20.0%
30.0%
40.0%
50.0%
60.0%
70.0%
80.0%
90.0%
100.0%
51.2% 55.6%47.1%
Adults who meet aerobic physical activity recom-mendations 2013 (BRFSS)
22
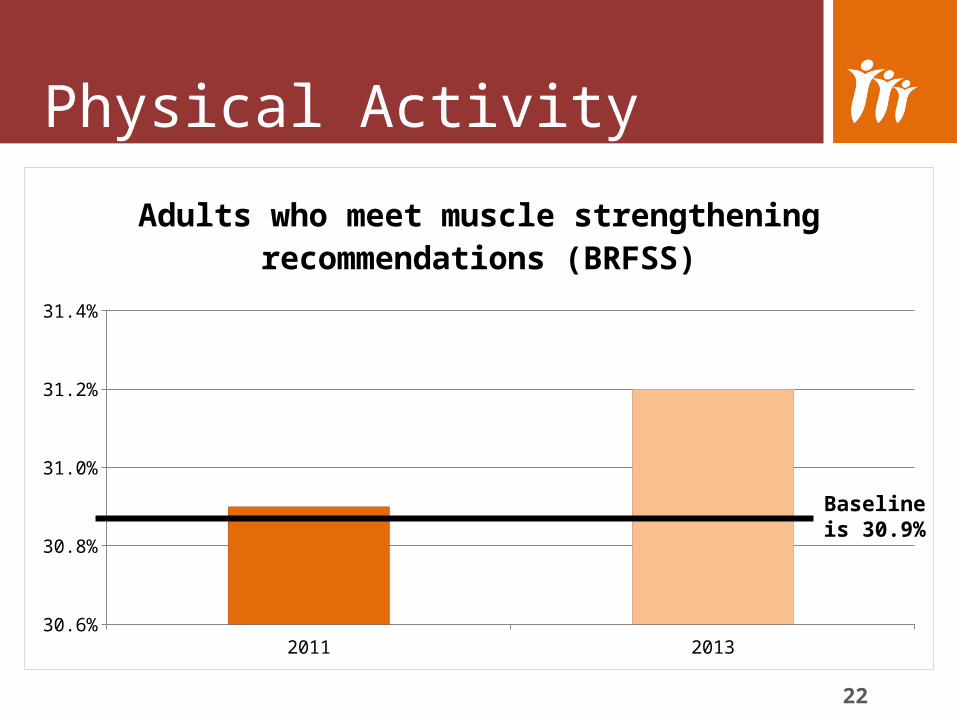
Physical Activity
2011 201330.6%
30.8%
31.0%
31.2%
31.4%
Adults who meet muscle strengthening recommenda-tions (BRFSS)
Baseline is 30.9%

23
Physical Activity
Maricopa County Total
18-24 25-34 35-44 45-54 55-64 65+0.0%
10.0%
20.0%
30.0%
40.0%
50.0%
60.0%
70.0%
80.0%
90.0%
100.0%
31.2%
44.5% 43.2%
22.6%29.4% 28.7%
22.2%
Adults who meet muscle strengthening recom-mendations 2013 (BRFSS)
24
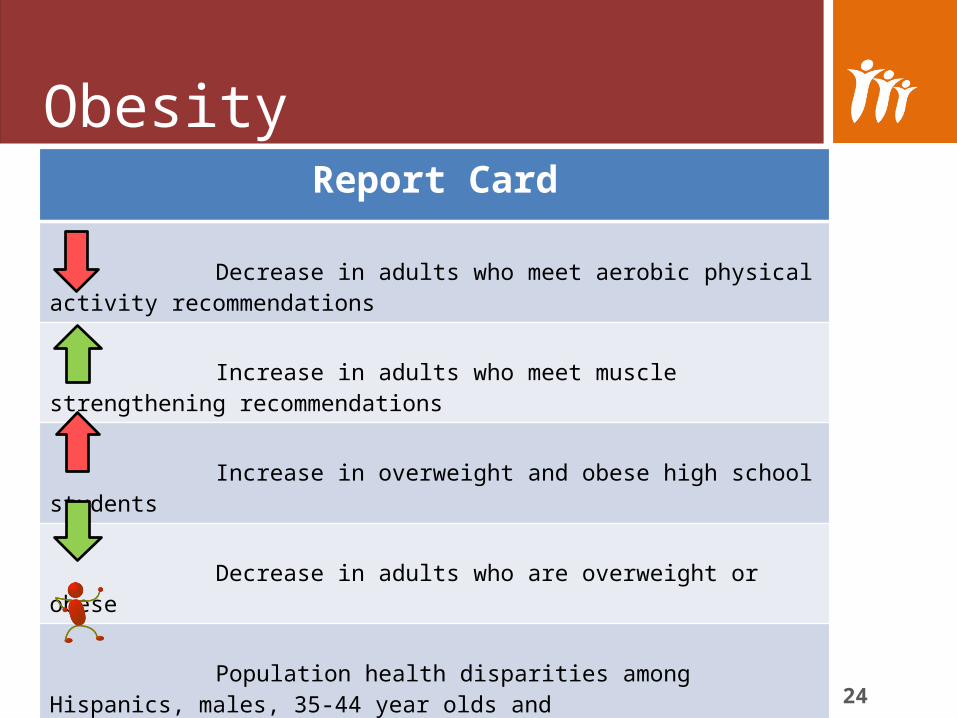
ObesityReport Card
Decrease in adults who meet aerobic physical activity recommendations
Increase in adults who meet muscle strengthening recommendations
Increase in overweight and obese high school students
Decrease in adults who are overweight or obese
Population health disparities among Hispanics, males, 35-44 year olds and older adults 65+
25
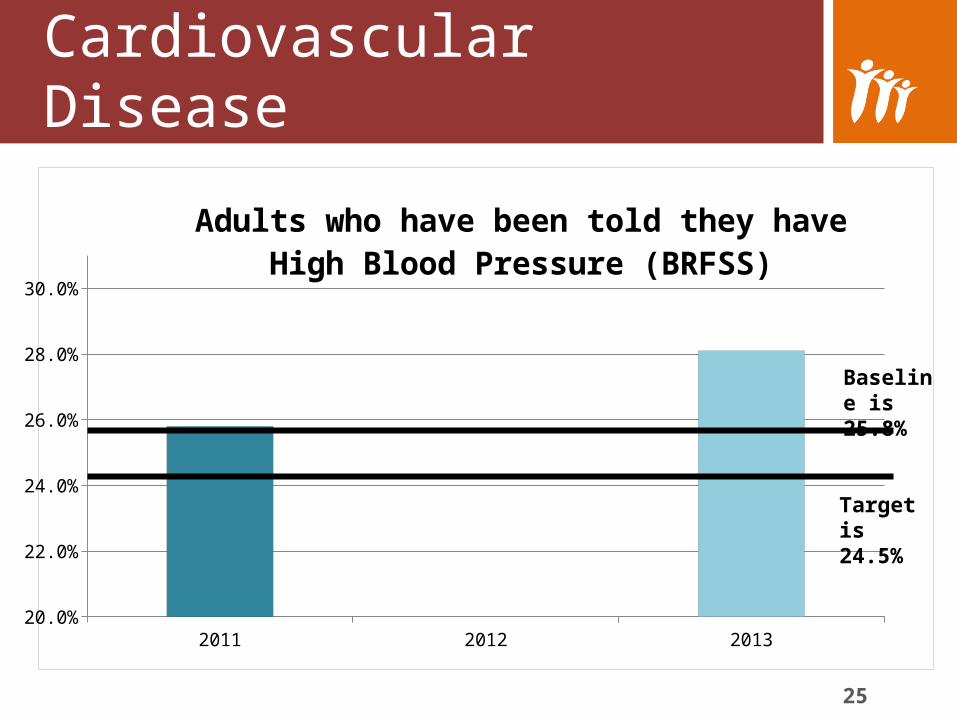
Cardiovascular Disease
2011 2012 201320.0%
22.0%
24.0%
26.0%
28.0%
30.0%
Adults who have been told they have High Blood Pressure (BRFSS)
Baseline is 25.8%
Target is 24.5%
262011 2012 2013
13.0%
18.0%
23.0%
28.0%
33.0%
38.0%
43.0%
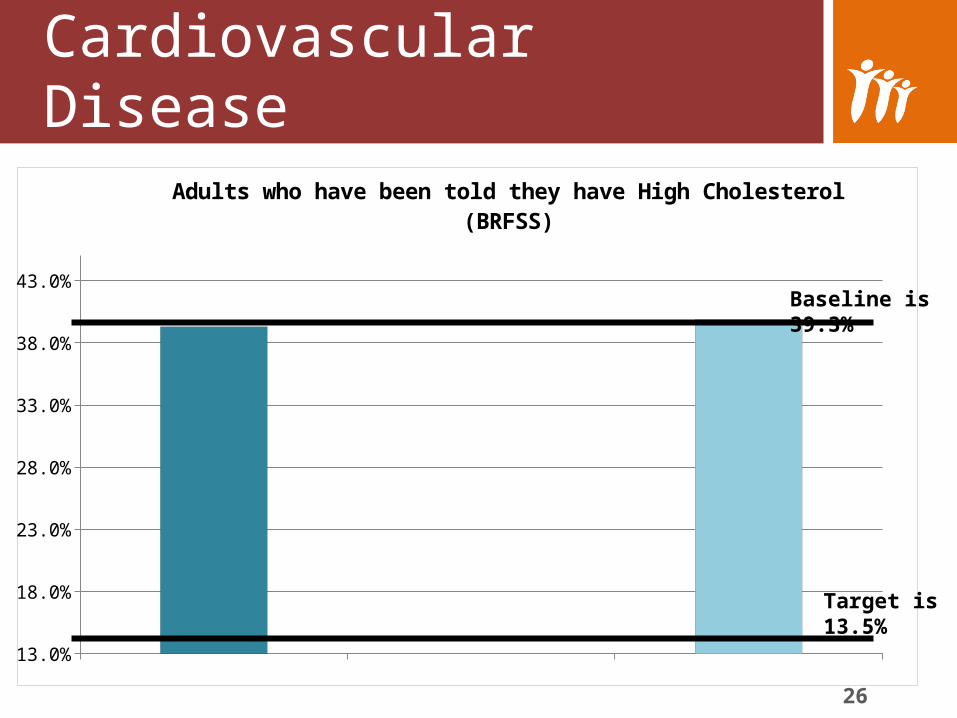
Adults who have been told they have High Cholesterol (BRFSS)
Cardiovascular Disease
Baseline is 39.3%
Target is 13.5%
27
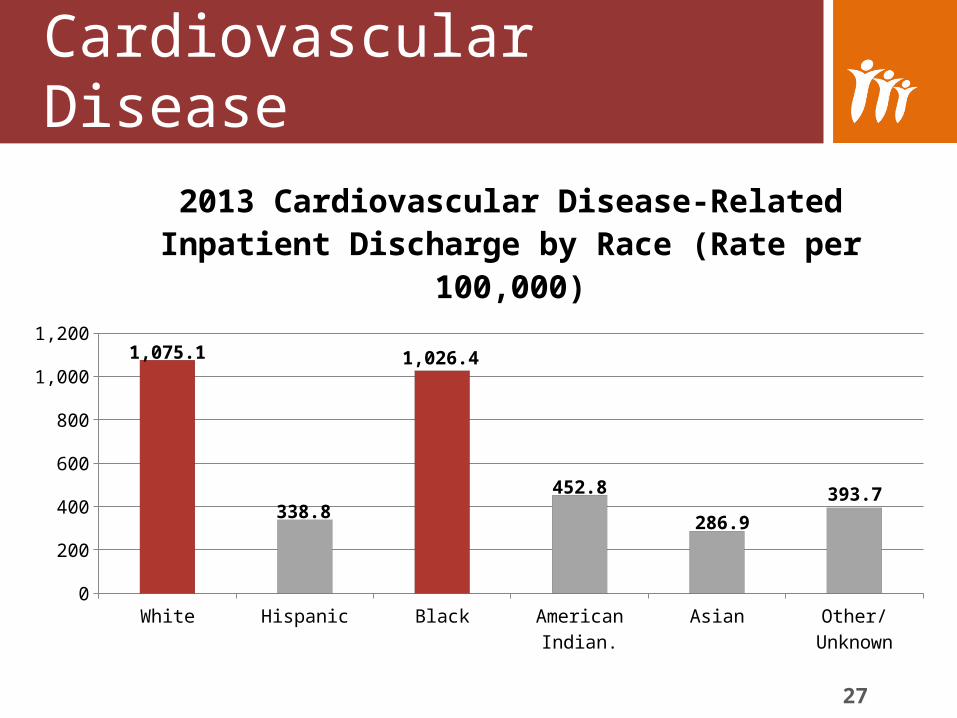
Cardiovascular Disease
White Hispanic Black American Indian.
Asian Other/ Unknown
0
200
400
600
800
1,000
1,200
1,075.1
338.8
1,026.4
452.8
286.9
393.7
2013 Cardiovascular Disease-Related Inpatient Discharge by Race (Rate per 100,000)
28
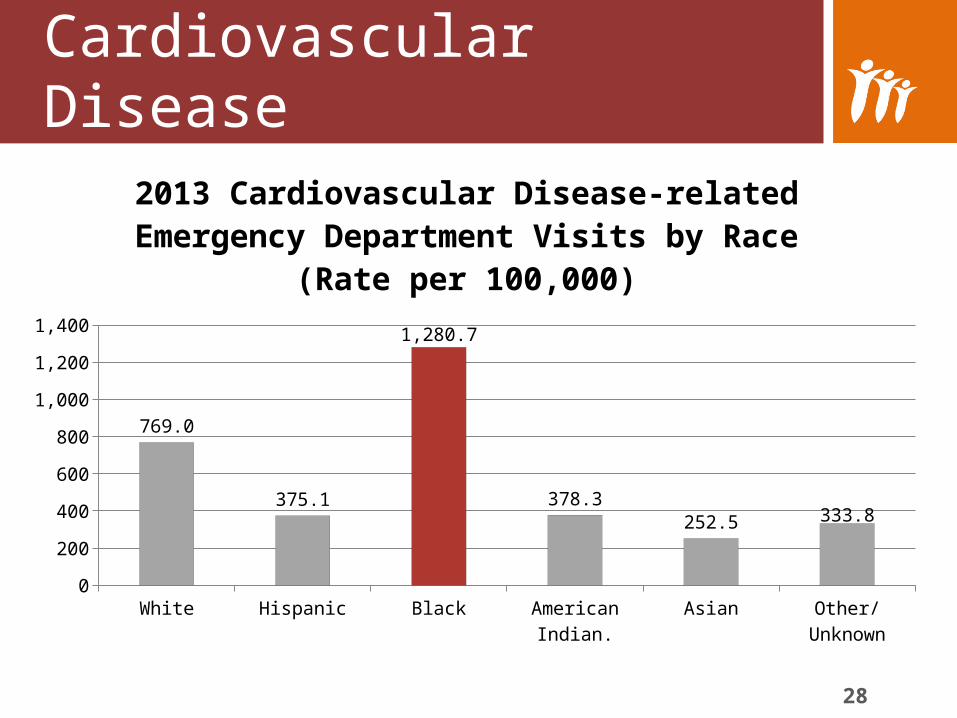
Cardiovascular Disease
White Hispanic Black American Indian.
Asian Other/ Unknown
0
200
400
600
800
1,000
1,200
1,400
769.0
375.1
1,280.7
378.3
252.5333.8
2013 Cardiovascular Disease-related Emergency Department Visits by Race (Rate per 100,000)

29
Cardiovascular Disease & Stroke
2011 2012 2013102.0
104.0
106.0
108.0
110.0
112.0
114.0
116.0
118.0
Deaths Due To Coronary Heart Disease (Rate per 100,000)
Baseline is 117.0
Target is 103.4
30
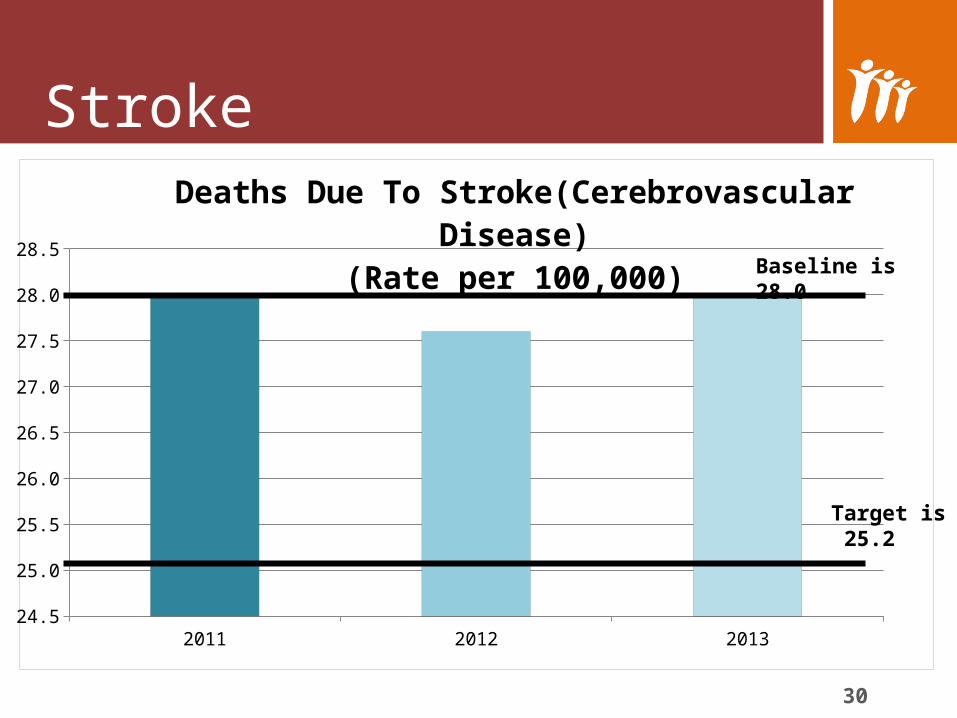
Stroke
2011 2012 201324.5
25.0
25.5
26.0
26.5
27.0
27.5
28.0
28.5
Deaths Due To Stroke(Cerebrovascular Disease)(Rate per 100,000)
Baseline is 28.0
Target is 25.2

31
Cardiovascular Disease

32
Cardiovascular Disease
WHITE HISPANIC BLACK AMERICAN INDIAN
ASIAN OTHER/ UNKNOWN
0
50
100
150
200
250
217.2
44.3
128.7
63.8 59.379.0
2013 Cardiovascular disease-related Deathsamong Residents by Race (Rate per 100,000)
33
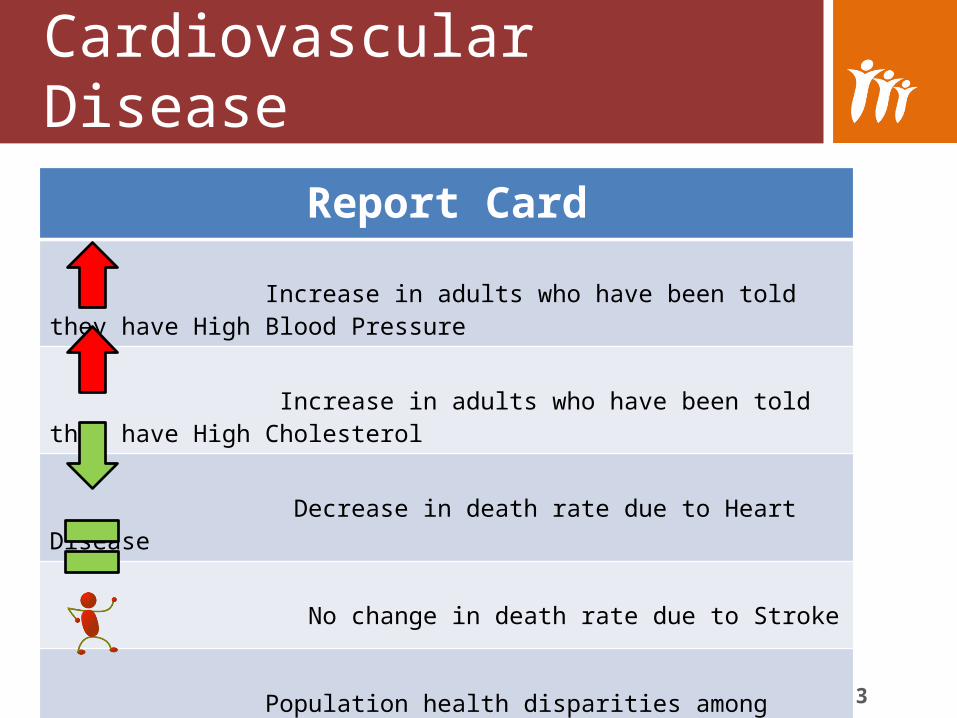
Cardiovascular DiseaseReport Card
Increase in adults who have been told they have High Blood Pressure
Increase in adults who have been told they have High Cholesterol
Decrease in death rate due to Heart Disease
No change in death rate due to Stroke
Population health disparities among Whites, Blacks and older adults 75+
34
2011 2012 201314.0%
14.5%
15.0%
15.5%
16.0%
16.5%
17.0%
17.5%
18.0%
18.5%
19.0%
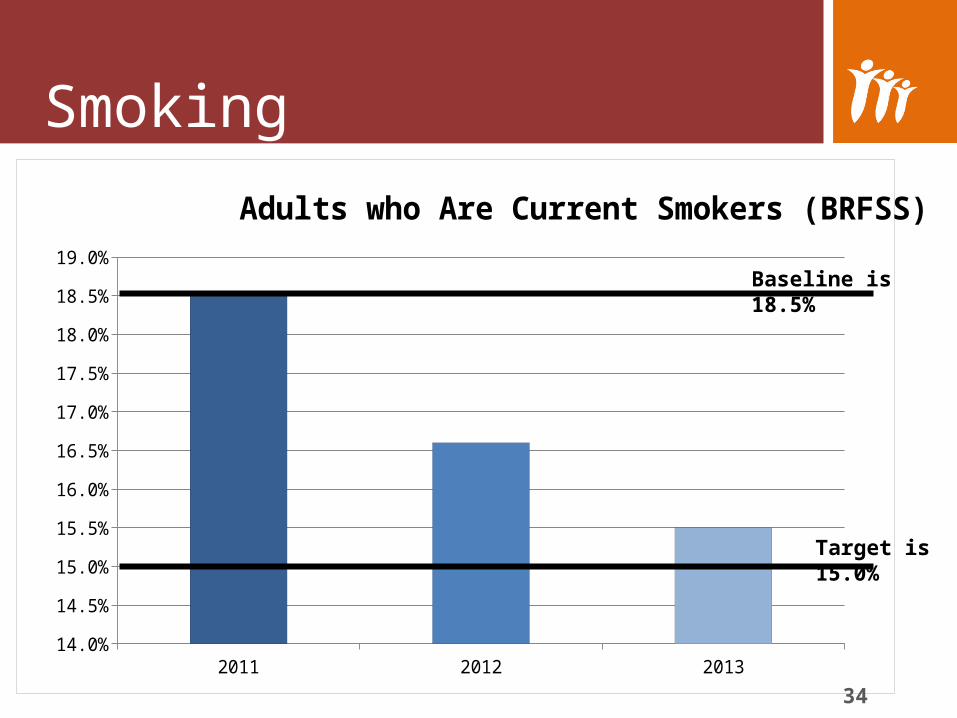
Adults who Are Current Smokers (BRFSS)
Smoking
Baseline is 18.5%
Target is 15.0%
35
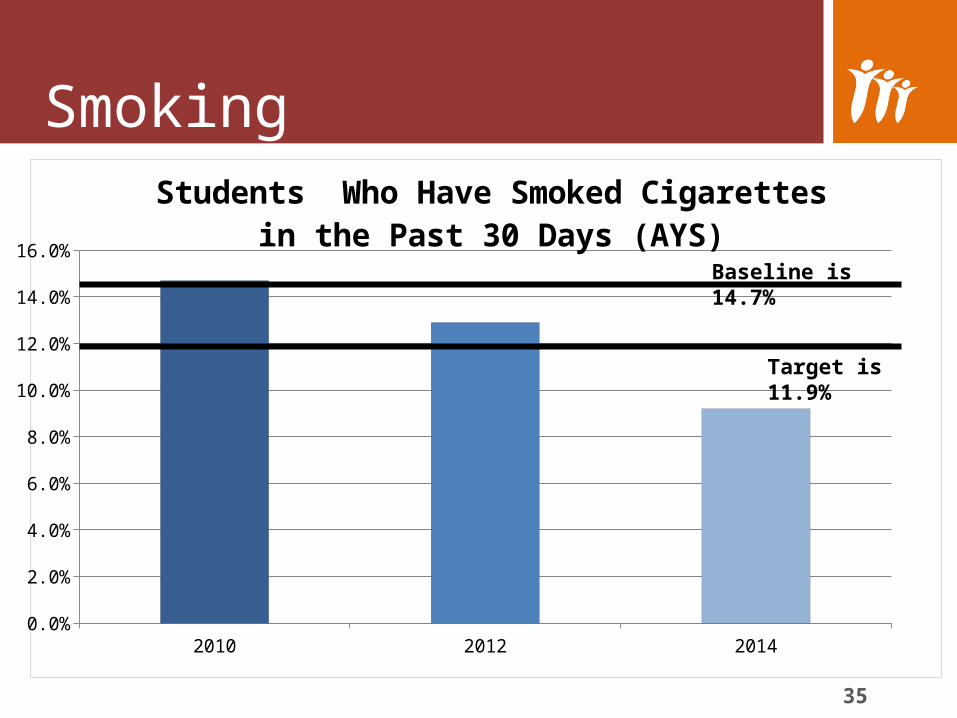
Smoking
2010 2012 20140.0%
2.0%
4.0%
6.0%
8.0%
10.0%
12.0%
14.0%
16.0%
Students Who Have Smoked Cigarettes in the Past 30 Days (AYS)
Baseline is 14.7%
Target is 11.9%
36
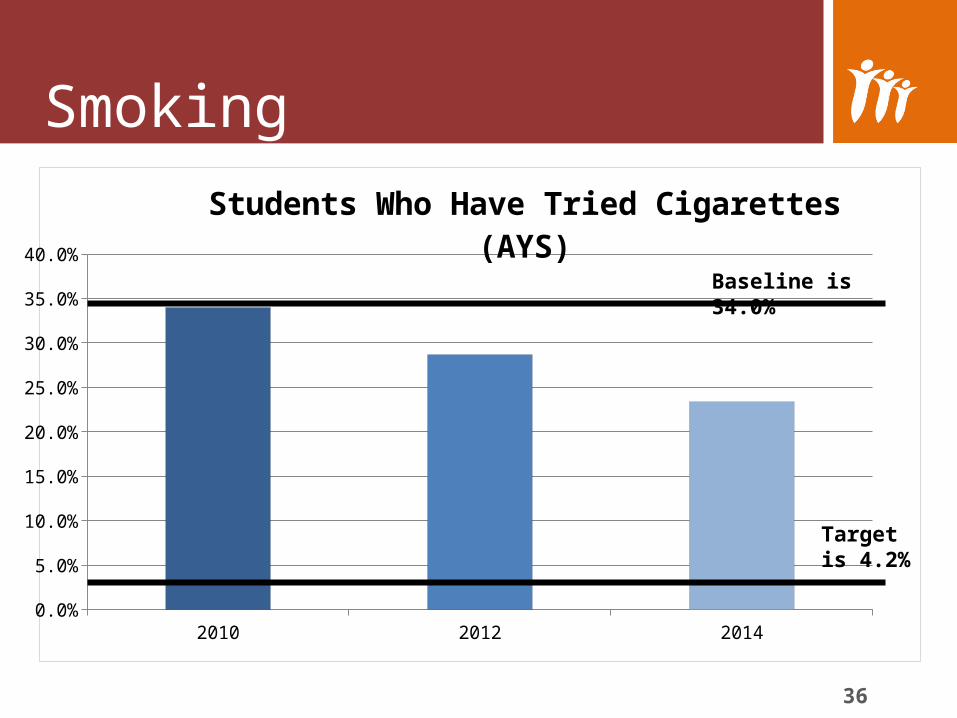
Smoking
2010 2012 20140.0%
5.0%
10.0%
15.0%
20.0%
25.0%
30.0%
35.0%
40.0%
Students Who Have Tried Cigarettes (AYS)
Baseline is 34.0%
Target is 4.2%

37
Lung Cancer
30
31
32
33
34
35
36
37
38
Lung Cancer Death Rate(Rate per 100,000)
2011 2012 2013
Baseline is 36.3
Target is 32.7
38
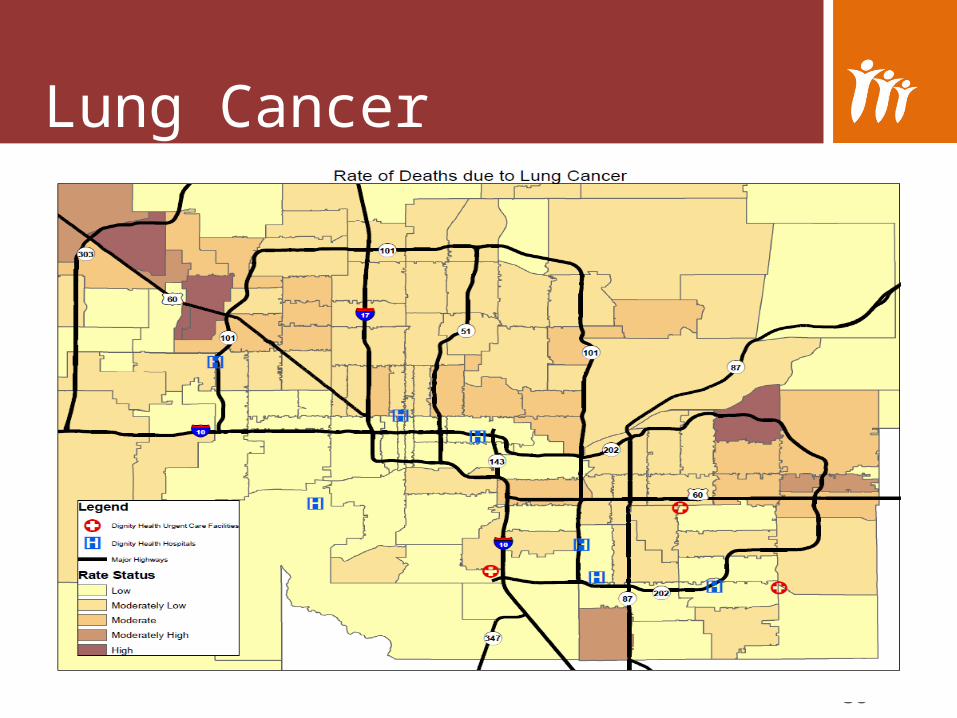
Lung Cancer
39
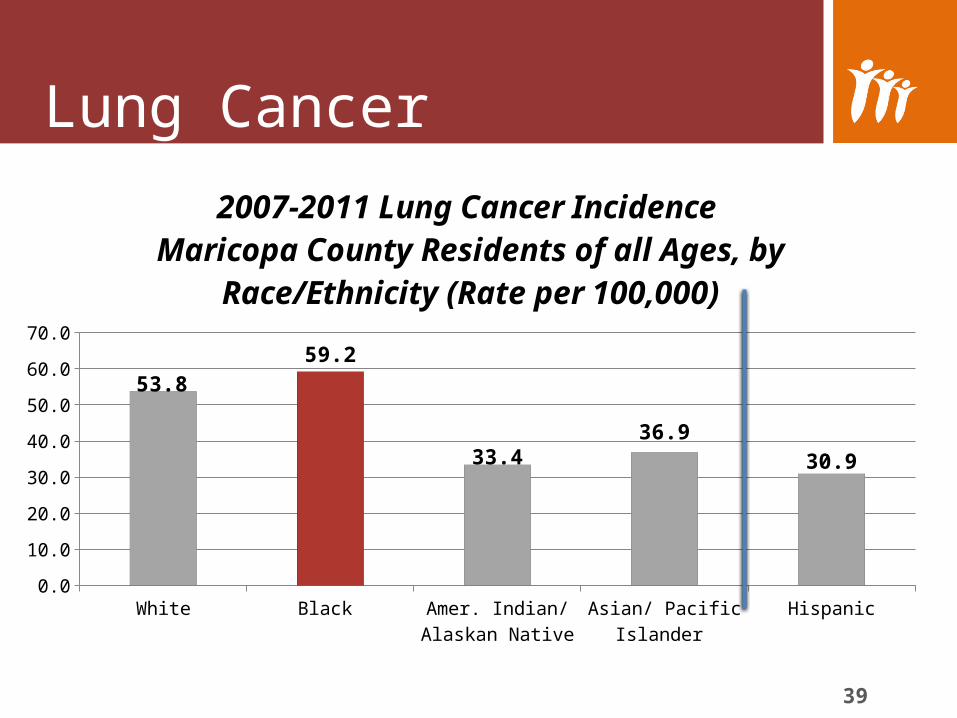
Lung Cancer
White
Black
Amer. Indian/ A
laskan Native
Asian/ P
acific I
slander
Hispanic
0.010.020.030.040.050.060.070.0
53.859.2
33.436.9
30.9
2007-2011 Lung Cancer Incidence Maricopa County Residents of all Ages, by Race/
Ethnicity (Rate per 100,000)

40
Lung CancerReport Card
Decrease in adults who are current smokers
Decrease in high school students who smoked in the last 30 days
Decrease in high school students who tried smoking
Increase in death rate due to lung cancer
Population health disparities among Blacks

Questions?
41