WE3.L09 - POLARIMETRIC SAR IMAGE VISUALIZATION AND INTERPRETATION WITH COVARIANCE MATRIX INVARIANTS
25
POLARIMETRIC SAR IMAGE VISUALIZATION AND INTERPRETATION WITH COVARIANCE MATRIX INVARIANTS Jaan Praks, Aalto University, Finland Elise Colin Koeniguer, ONERA, France Martti Hallikainen, Aalto University, Finland
description
Transcript of WE3.L09 - POLARIMETRIC SAR IMAGE VISUALIZATION AND INTERPRETATION WITH COVARIANCE MATRIX INVARIANTS

POLARIMETRIC SAR IMAGE VISUALIZATION AND INTERPRETATION WITHCOVARIANCE MATRIX INVARIANTS
Jaan Praks, Aalto University, FinlandElise Colin Koeniguer, ONERA, FranceMartti Hallikainen, Aalto University, Finland

Polarimatric SAR images are often presented as false color images. Many approaches is used. Simple RGB color composite image of three polarimetric channel amplitudes is used most often, but its has some limitations.
How colors should be used to achieve easiliy interpretative polarimetric SAR image for image browsing and quick interpretation?
In this study we try to give some hints, how good visualisation results can be achieved.
Introduction
Jaan PraksElise Colin KoeniguerMartti Hallikainen

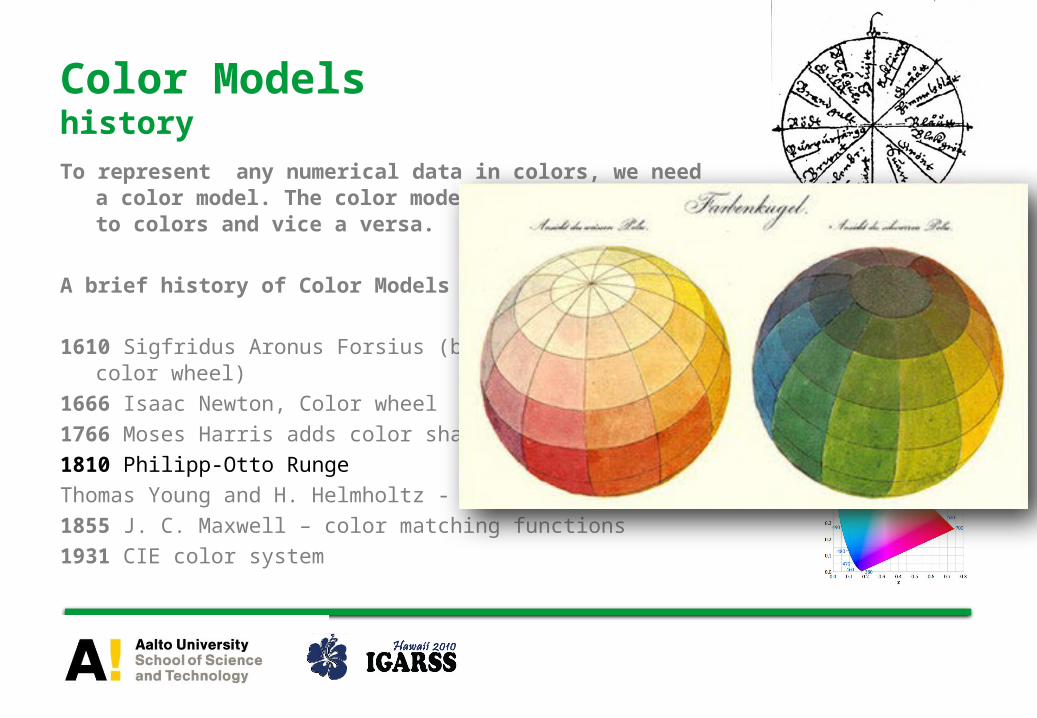
To represent any numerical data in colors, we need a color model. The color model converts numbers to colors and vice a versa.
A brief history of Color Models
1610 Sigfridus Aronus Forsius (basic colors and color wheel)
1666 Isaac Newton, Color wheel
1766 Moses Harris adds color shades
1810 Philipp-Otto Runge
Thomas Young and H. Helmholtz - thrichromatic vision
1855 J. C. Maxwell – color matching functions
1931 CIE color system
Color Modelshistory

The color models can be divided roughly into two categories:
1. The parameter triplet is based on direct sensory input values.
Red Green Blue (RGB) values in Cartesian coordinates, parameters
are linear.
2. The parameter triplet tries to mimic human comprehension of colors. HSV, HSI, HSL. Uses cylindrical or spherical coordinate system.
Parameters like hue, saturation, lightness etc. Some parameters are
periodic. Perceptual parameters are also often interconnected (if the
saturation is zero, the hue has no values).
Color ModelsRGB and HSV
Images by SharkD

y
xz
EHuman eye does not sense polarization, and therefore our understanding of polarization is based on abstract models
There are many ways to visualize polarization
• Stokes parameters• Polarization ellipse• Poincare sphere
Polarimetric measurement systems like SAR • Target polarimetric signature
Visualising polarization
0
90
180
-45
0
450
0.2
0.4
0.6
0.8
1
ellipticity angle
CO-POL RESPONSE
orientation anglenorm
alis
ed p
ow
er

Similarities between color- and polarization models
Philipp-Otto Runge color sphere
Poincare polarization sphere
Poincaré sphere and Runge color sphere are similar
Both use spherical coordinates, and periodic parameters
Fully polarized radiation can be presented in colors unambiguously

Maxwell color triangle and ternary use the same technique to represent three variables restricted by constant sum a + b + c = const
Situation where a = b = c has a special meaning (white color)
In polarimetry, we have similar variables, for example normalized eigenvalues (scattering mechanism probability) or normalized covariance matrix diagonal elements
Similarities between color- and polarization models
Maxwell color triangle
Polarimetric classification with ternary plot

SAR image has more dimensions than is possible to represent in color image
- all parameters cannot be visualized in the same image
- there will always be more than few representation approaches
Color model should be selected according to image parameter relations and nature, periodic variables should be connected with periodic and linear parameters with linear
Cylindrical color systems often provide easier way to separate different parameters for independent processing
(P. Imbo, J.C. Souyris, A. Lopes, and P. Marthon, “Synoptic representation of the polarimetric
information,” in Proceedings CEOS SAR Workshop, Toulouse, France, October 26-29 1999.)
Some remarks on polarimetric SAR image color representation
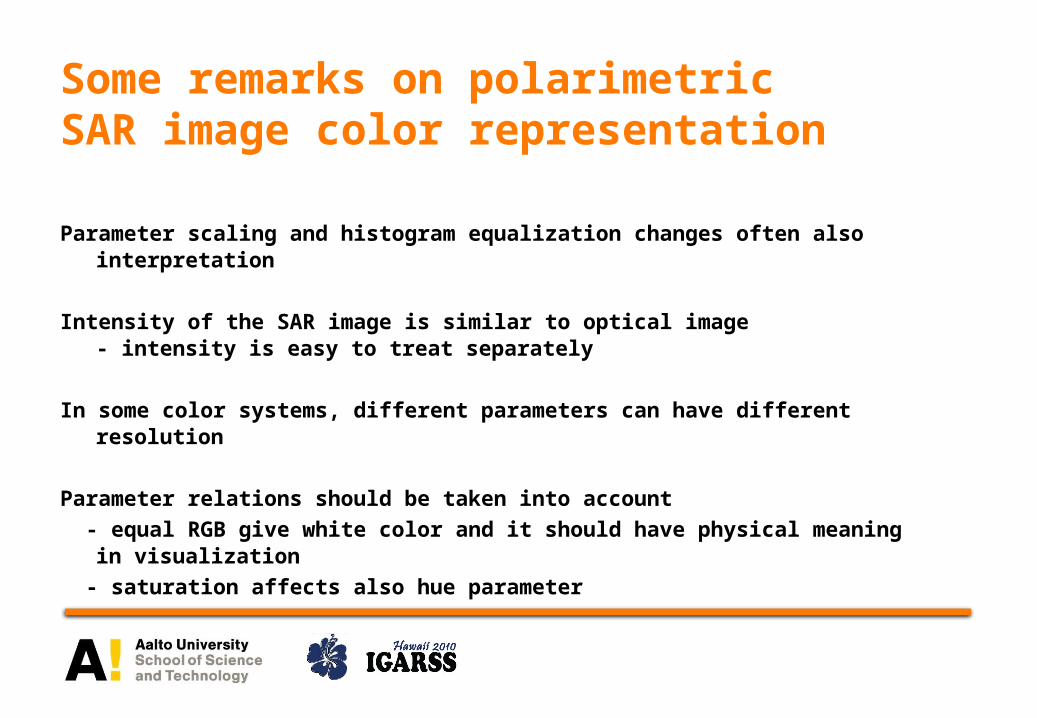
Parameter scaling and histogram equalization changes often also interpretation
Intensity of the SAR image is similar to optical image - intensity is easy to treat separately
In some color systems, different parameters can have different resolution
Parameter relations should be taken into account
- equal RGB give white color and it should have physical meaning in visualization
- saturation affects also hue parameter
Some remarks on polarimetric SAR image color representation

Different parameter layers can have different resolution in HSl type of color models without effect to interpretation.
This can be utilized in synoptic representation where depolarization related parameters are calculated for averaged image.
ExamplesLayers with different resolution

Z-4Z-5Z-6
Z-7Z-8
Z-9
Z-4Z-5Z-6
Z-7Z-8Z-9
Hue - hi-res alphaSaturation - entropyIntensity - hi-res span
Hue - alphaSaturation - entropyIntensity - span

When histogram of the parameter is narrow, parameter image has low dynamics. Histogram equalization gives usually visually pleasing results.
However, histogram manipulation can change also interpretation and/or physical relation between the parameters, if parameters are related.
Examplesparameter scaling

Nicolas Trouve, Preliminary
Polarimetric Segmentation on
SAR images. EUSAR 2010.

In addition to intensity, polarimetric parameters can be divided roughly into three classes
1. Parameters connected to phase change of eigenpolarization states
- often periodic variables, suitable for hue
2. Parameters connected to change of amplitude
- periodic and linear parameters
3. Parameters connected depolarization properties
- controls also other polarimetric parameters, suitable for saturation
E. Colin-Koeniguer, N. Trouvé, J. Praks ”A review about alternatives to classical Polarimetric SAR parameters”, EUSAR
2010
Classes of polarimetric parameters
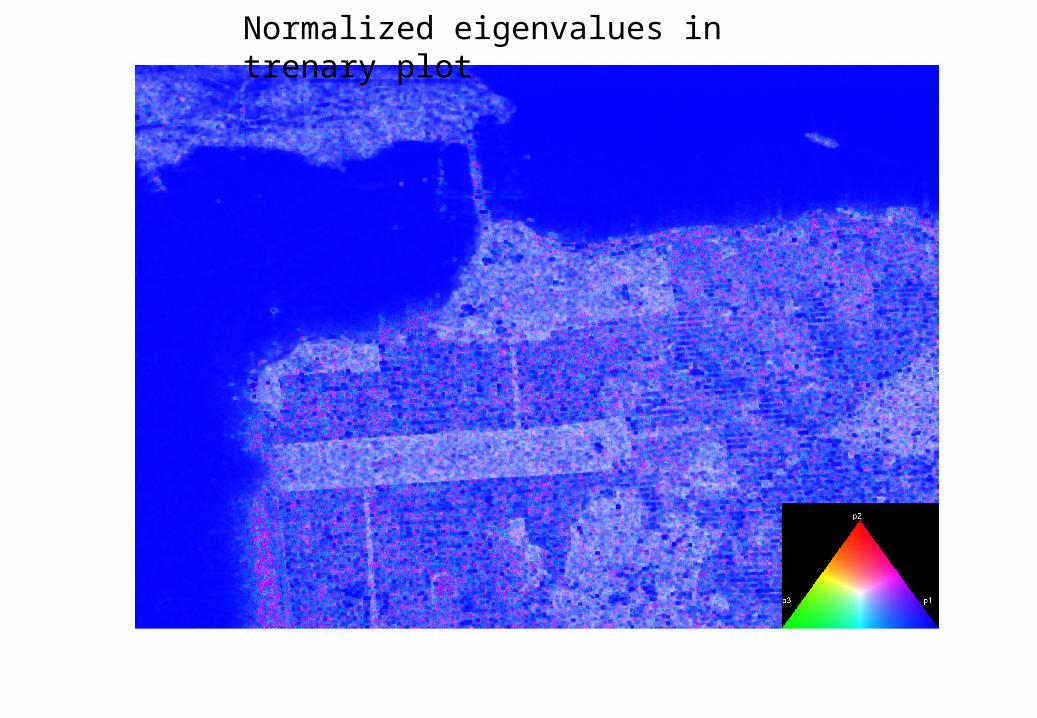
Normalized eigenvalues in trenary plot

Normalized eigenvalues in trenary plot, modulated with intensity

Covariance matrix and normalized covariance matrix
Surface scattering fraction (similar to alpha angle)
Scattering diversity (similar to entropy)
Normalized covariance Matrix invariants
k a b c S S S S S ST
hh vv hh vv hv vh
T , , , ,
1
2
cabab
bcbab
acaba
spankkkkN
**
**1* 1
Praks, Jaan; Koeniguer, Elise Colin; Hallikainen, Martti T., Alternatives to Target Entropy and Alpha Angle in SAR Polarimetry, IEEE Trans. Geoscience Rem. Sens., vol. 47, issue 7, pp. 2262-2274
span
SSN
vvhh
2
11
2
)1(2
3ˆ 2
FNH

Normalized Pauli components (N main diagonal)

Normalized Pauli components with intensity

Intensity, scattering diveristy and surface scattering fraction in synoptic representation

When visualizing SAR images with colors, special attention should be paid to color model selection for given parameters
Well selected color model and visualization scheme can be in the best case self explaining
Visualization scheme can explain also physical meaning of selected parameters
Parameter scaling for SAR images should be done with care and consideration, in order not to loose physical interpretation
Normalized covariance matrix provides suitable parameters for several good visualization schemes
Conclusions

Thank you!