SITM was established in 1996 as a pioneer in the field of ...


We at SITM are committed to develop world class Telecom Business Leaders, who can e� ectively handle the dynamic and ever - changing technological and business dynamics with absolute ease and authority. The team at SITM � rmly believes in strong academics combined with industry exposure through visits of several experts from the industry. The programs o� ered by SITM integrate a competitive learning environment through a broad curriculum encompassing classroom teaching, valuable industry inputs, research projects, seminars, workshops and a myriad of extra curricular activities. In the pursuit of excellence and to give the curriculum its distinctive � avour, the syllabus is continually revived based on the inputs from the faculty, industry and alumni. All the programs follow
intensive case studies based approach. SITM lays deep emphasis on an all-round development of an individual which includes improving communication skills, nurturing teamwork and inculcating a never say die attitude. The telecommunication systems and IT forms the backbone for any company hence managing them e� ectively and strategically is a need of the hour. SITM has 2000 + strong alumni network and most of our alumni are holding middle level to senior management positions in companies.
Last but not the least, we strive to instil human values to make better citizens with moral courage and zeal to follow their heart, make a di� erence and help them achieve their true potential.
© 2016, Symbiosis Institute of Telecom ManagementAll rights reserved. This publication is the sole property of SITM. No part of it may be circulated, quoted, copied or otherwise reproduced without the written approval of SITM
1

Dr. Sunil PatilDirector, SITM
DIRECTOR’S MESSAGESITM is the pioneer educational institution in Asia imparting management education to aspiring telecom and ICT managers. SITM has consistently endeavored to take up new initiatives in both business and research domains. One such e� ort is Prévision, SITM’s Annual Telecom Forecast. Prévision is in its 14th year and aims at providing the industry a neutral and insightful single point of view regarding the emerging trends in the telecom and ICT sectors for the forthcoming year. These domains continue to observe new emerging technologies and business models and all of this is making forecasting a challenge. The forecast is presented in the � agship event of SITM, International Telecom Seminar. It is noted that the forecast presented in this report is very well received by the industry.
Prévision involves accumulating inputs from detailed research into contemporary telecom technologies, telecom business and other determinants of change and meticulously analyzing them and forecasting future trends. It is a culmination of the collective endeavor of SITM students with 1500 man hours of e� orts put in by them. The student forecast team is guided by SITM faculty and some of our esteemed alumni. As part of ongoing process improvement for Prévision, SITM students for the past 4 years have been conducting a Corporate Interaction Program. The insights gained from such interactions with Industry Subject Matter Experts have improved the quality of our predictions and the students have bene� tted immensely from their knowledge & experience.
We are fortunate to have Deloitte Haskins & Sells for their continued initiatives in both business and research domains. At the release of the 14th edition of Prévision, I would like to thank the SITM Alumni community and the telecom industry for sharing their valuable insights with Prévision team. Your contribution has helped us in improving the quality of the predictions. I would also like to thank Dr. K.S.S. Iyer, Honorary Adjunct Professor, SITM for guiding the Prévision team in the application of forecasting models for statistical analysis.
2

Dr. Giri G HallurAsst. Professor & Faculty In charge
of Prévision, [email protected]
MESSAGE FROM FACULTY IN CHARGEIt gives me immense pleasure in presenting to you the fourteenth edition of Prévision, SITM’s Annual Telecom Forecast. SITM curriculum lays a lot of emphasis on nurturing research aptitude of the students in the form of Summer Project & Research Project. Prévision is an extension of this thought process. It provides the students a platform to understand the linkages between the theoretical learning and dynamic industry trends. Through the Prévision research process the students are able to understand the e� ect of macro-economic, technological & regulatory factors on the telecom industry in India as well as the world.
Prévision, which is in its 14th year was conceptualised in 2003 by one of our esteemed alumnus Mr. Kundan Das (Batch 1998 - 2000), who then teamed up with two other Alumni, Mr Rahul Sharma (Batch 1999 - 2001) & Mr. Aniruddha Harne (Batch 2002 - 2004). The Alumni team has, over the years grown with active participation by Alumni from subsequent batches, who havecontinuously guided the student team. Prévision was started with the aim of providing the industry a neutral and insightful single point of view regarding the emerging telecom trends. And this year’s Prévision is yet another step in that direction.
The three step research process starts with data collection, followed by data analysis with the help of statistical models and � nally culminates into forecast after incorporating inputs of SITM Alumni & Faculty. The MBA 1st year students, through the activity of data collection under the guidance of the 2nd year students get initiated into the forecast process. At the data analysis stage, the 2nd year students get an opportunity to assimilate knowledge from statistics, technology and experiential learning gained during their summer internships. Whitepapers, written by the students at the end of second stage are reviewed by some of our Alumni, SITM faculty & Industry mentors from Deloitte Haskins & Sells. The � nal Prévision document incorporates the comments/changes suggested by them. The entire Prévision process is closely monitored & guided by SITM faculty. And the process streamlining is supervised by Deloitte Haskins & Sells.
In Prévision 2017, we have, in our special feature discussed the technology, business and � nancial aspects of Smart Cities. In the opinion of the stake holders, Smart Cities need to adopt various models comprising of advertisements to utility based subscription to monetize on the smart city ecosystems. Another key area highlighted was the need for compliances and operation standards mandatory across vendors so as to ensure interoperability and collaboration across multiple platforms and heterogeneous data sources.
For the past 10 years, the SITM Alumni community has guided and provided the Prévision team with their insights on key trends in the telecom domain. I thank the SITM Alumni for their continued support. I also express my gratitude to the telecom fraternity for its support. We look forward for your comments/feedback.
3
Mr. Aniruddha HarneVodafone Group, UK
FOUNDER’S SPEAKSince inception (2003), Prevision from SITM has consistently raised the benchmark for a management institute to portray global telecom ecosystem forecast.
The objective behind this exercise was as dual i.e. to demonstrate the understanding of complex telecom value chain from regulatory impacts to value proposition including analyzing technology, consumer and industry impacts as whole and to venture a step beyond to forecast next year’s impact across various verticals.
SITM students has been successful over the years in demonstrating value in the annual ‘Telecom Forecast’ which is now within noticeable limits by the Industry leaders. Over the years with addition of social impact due to technologies, wider global coverage and added domains, this report has garner much wider interest in the telecom community.
To highlight some of the last year Prevision (2016) forecasts from the Indian telecom domain, they are almost in line with recent TRAI annual reports (FY15-16). This clearly demonstrate the deep value which students of SITM bring to the industry i.e. ability to comprehend and predict the change based on � rm analysis and research.
With inclusion of Mobile payments, VoLTE, IoT, Social Media and New initiatives within India and globally, Prevision has quintessentially become a much sought after report across telecom fraternity.
This entire process, I have been closely following since inception and the annual forecast has taken quantum leaps in terms of technology, global coverage and methodologies adopted for analysis across multiple domains.
‘Prevision’ has de� nitely turned into a powerful script produced every year; which is must read by all students of telecom management and sought after report for Telco professionals globally.
All the Best!
Mr. Rahul SharmaDirector – Digital Works
Cognizant Germany
Back in 2005 neutral academic research to predict technology, and predict it in the near-term which is measurable was totally missing in the Indian Technology landscape. 5-10 year predictions are relatively “safer” and somehow the challenge goes away to see the hits & misses in 5 years. The consumer view was also missing from the industry view and that was something that we wanted to change. The way Prevision has matured over the last decade, it’s an investment well made by SITM.
4

PREFACE“The pursuit of perfection often impedes improvement”
- George Will
Prevision, an endeavour by the students of SITM,under the guidance of our august alumni, industry experts and faculty members. Prevision strives to perfection every year through process improvisation and comprehensive parameter analysis. Smart Cities, the special feature edition of Prevision 17, attempts to present a holistic purview from regulatory, corporate and academic perspectives. As a gesture of our gratitude, we would like to mention all the experts who helped us in enriching the content and concepts of the magazine through their valuable time and constant guidance.
• Dr. A.Ravindra, Chairman, Smart cities India Foundation• Mr. Sohag Sarkar, Associate Director, KPMG Advisory Services Pvt. Ltd.• Mr. Sunit Kumar, Assistant Manager, KPMG Advisory• Mr. Aditya Basu, Product Manager, Happiest Minds Technologies• Mr. Anurag Walia, Vice President - Sales Strategy Execution, Tata Communications• Mr. Vikram Singh, Associate Manager- Smart cities, Sterlite Technologies• Mr. Sridhar Chalapathy, Mass Communication Head, Sify Technologies• Mr. Piyush Gandhi, Vice President, GIFT City, Gandhinagar• Mr. Nirav Patel, GIFT City, Gandhinagar• Mr. Sameer Jain, Sr. consultant, KPMG Advisory Services Pvt. Ltd• Mr. HimanshuJangwal, Manager, KPMG• Mr. Rajul Mehrotra, General manager- Smart cities, IBM
We sincerely appreciate their cooperation and look forward to such associations and interactions in the future.
INDUSTRY SPEAK
“Very Good work. Prevision was very professionally handled. Hard work shows, keep it up.”- Ms. Anjali Chatterjee, GM, VSNL, Mumbai
“Prevision was most impressive. The organisation and presentation of the event was of very high order”. - Mr. Abhay Arora, Technical Head, Sterlite Optical Technologies Ltd
“Well organised. Prevision was very interesting. A lot of good work, remarkable insights. Should organise more in depth interaction between students and delegates”. - Mr. Shrinivas Rao Addepalli, Head Corporate Strategy, Tata Communications
“A very wonderful and informative session. The Prevision was extremely informative.”- Mr. Sudhir Gupta, Advisor, TRAI
“Impressed by the Prevision presentation.” - Mr. Asit Tandon
“A very focussed forecast- Prevision . Thanks for the valuable inputs. “ - Mr. K.Seetaraman, TCS
5

PILLARS OF PRÉVISIONPRÉVISION PIONEERS
Kundan Das - Parallel Wireless Inc. Rahul Sharma –Cognizant, Germany Aniruddha Harne–Vodafone Group,UK
ALUMNI MENTORS
Sumit Gandhi - EY Saurabh Saxena - Accenture Nikilesh Kolipakula - Accenture Utkarsh Nalgundwarkar - EYSaksham Saxena - InfosysGaurav Chauhan - EYJaskaran Singh - Sify
INDUSTRY MENTORS
Hemant Joshi - Partner, Deloitte Haskins & SellsShrikrishna Sumant - Deloitte Haskins & Sells Anu Peisker - Deloitte Haskins & Sells
FACULTY MENTOR
STATISTICS
Dr. K.S.S. Iyer (Hon. Adjunct Professor)
FINANCE
Ramamurthy Venkatesh(International Adjunct Faculty)Chintan Vadgama(Assistant Professor - Finance)
FACULTY IN CHARGE
Dr. Giri HallurFaculty (Telecom)
STUDENT IN CHARGE
Sumit Singh
STUDENTS IN CHARGE (TECHNOLOGY)
Jimit RavalKushagra NagpalPrathamesh PandeRishika Ghosh
STUDENTS IN CHARGE (STATISTICS)
Arjun IyerArun SureshFaraaz Ahmed GauseeTanuj Gupta
STUDENT EDITORS
Arpita Ghosh Dhruvika SolankiArnab Mohapatra
STUDENTS IN CHARGE (DESIGN & SOCIAL MEDIA)
Naresh Kumar HegdeSurya Nair
STUDENT IN CHARGE (LOGISTICS)
Arjun Iyer
STUDENT INPUTS
Anoop MathewGirish KumarNayan Jyoti Bhuyan
DisclaimerIn no event shall Symbiosis Institute of Telecom Management, Pune, here after referred to as SITM, be liable for any indirect, punitive, incidental, special or consequential damages arising out of or in any way with any content (or any material provided here under) whether biased or on contract, tort, strict liability or otherwise even if SITM has been advised of the possibility of the damages.
Note to readers: The � nancial year for India is taken from April to March, where as for rest of the world, the calendar year is taken from January to December.© 2016, Symbiosis Institute of Telecom Management.All rights reserved. This publication is the sole property of SITM. No part of it may be circulated, quoted, copied or otherwise reproduced without the written approval of SITM.
6

PILLARS OF PRÉVISIONSTUDENT TEAMS
INDIAN TELECOM
Anubha Pandit (Head) Tanuj Gupta
ECONOMY
Shivam (Head) Dhruvika Solanki Rituraj Zala
CONSUMER ELECTRONICS
Prathamesh Pande (Head)Chetna Chandiramani
GLOBAL TELECOM
Nareshkumar Hegde (Head) Faraaz Ahmed Gausee Jimit Raval Nikhilesh Harde
TELECOM TECHNOLOGIES
Kushagra Nagpal (Head) Nilesh Bamotriya
STUDENT TEAMS
BROADBAND
Arun Suresh (Head) Roinak Sarkar Rishika Ghosh
COMMUNICATION INFRASTRUCTURE
Arjun Iyer (Head) Akash Agrawal
VAS & MOBILITY
Aakanksha Sharma (Head) Arnab Mohapatra
TELECOM SOFTWARE
Surya Nair (Head) Prashant Tandekar Nikhilesh Harde
SPECIAL FEATURE
Shilpy Sinha (Head) Shreyas Khase Arpita Ghosh Darset Merchant
DisclaimerIn no event shall Symbiosis Institute of Telecom Management, Pune, here after referred to as SITM, be liable for any indirect, punitive, incidental, special or consequential damages arising out of or in any way with any content (or any material provided here under) whether biased or on contract, tort, strict liability or otherwise even if SITM has been advised of the possibility of the damages.
Note to readers: The � nancial year for India is taken from April to March, where as for rest of the world, the calendar year is taken from January to December.© 2016, Symbiosis Institute of Telecom Management.All rights reserved. This publication is the sole property of SITM. No part of it may be circulated, quoted, copied or otherwise reproduced without the written approval of SITM.
7

INDIAN TELECOM
With a strong growth in the past few decades, the Indian Telecom Industry is currently the world’s second largest telecommunication market. Although the rate of growth has slowed over the past few years, it is still expected to contribute substantially to India’s GDP. The highlights for this year will be the spectrum auction of all bands from 700 MHz to 2500 MHz bands and the impact of RJio’s 4G launch on the telecom industry. The ecosystem for the 700 MHz band is yet to be developed and ambitious base price shall question the a� ordability aspect for TSPs. GSM service providers shall slowly start phasing out their services in the years to come. With the regulatory approval for interconnectivity between circuit switched tra� c and IP, there will be increase in call volumes for NLD/ILD. Also, the reduction of spectrum usage charges (SUC) rate this year will contribute positively to the � nancial health of the telcos and their ecosystem partners .
TELECOM SOFTWARE
Proli� c advancements in the � eld of telecom software are a result of increased subscriber base, frequent application downloads and customization of services. Models which were business oriented have shifted their focus on customers. This has in turn increased the demand for the CRM software, BI tools and customized OSS/BSS markets. The agenda to serve the customers is the best way possible and is gaining clarity at a faster rate. Personalization and customization have put pressures on improvement in the network e� ciency and resource optimization. Softwares like Service Ful� lment, Service Assurance and CRM can help telecom companies achieve these goals.
COMMUNICATION INFRASTRUCTURE
The communication infrastructure industry is set to grow as a result of the high market demand. The increasing subscriber base has encouraged the operators to adopt active and passive infrastructure sharing to reduce their CAPEX and OPEX. Also, with the increase in the number of antennas required for 4G, infrastructure providers are looking at newer implementations like streetlight antennas. Digital India, NOFN and Smart Cities will give impetus to various parameters like structured cabling, optical � bre layout and VSAT. The increase in data creation and consumption is going to lay a lot of emphasis on data centres, submarine cables and satellite antennas. Adoption of environment friendly energy resources will increase as a result of various government incentives .
TELECOM TECHNOLOGIES
Continuous innovations in the domains of network, devices and applications is driving telecom industry growth. Exhaustion of IPv4 addresses has caused service providers to move to more e� cient IPv6. Need for convergence , mobility and rich communication is driving the growth of IMS, 4G LTE, M2M and MPLS. Change of industry from hardware centric to software centric has led to the growth of Cloud Computing. MVNO, Telepresence, RCS-e and BYOD are growing trends in telecom due to the need for di� erentiation in a competitive market. Li� technology, a new parameter this year, is believed to be one of the disruptive technologies that can send large amount of information at very high data rates using light as medium. With exponential increase in the number of smart devices and need for higher data rates, these technologies will shape the future of the ICT industry.
CONSUMER ELECTRONICS
Consumer Electronics is a booming sector which witnesses an assorted range of products added to its list every year. With PC market now dominated by laptops and notebooks, tablet industry strives to grow as a result of convergence. Handset market trends has seen an inevitable shift from feature phones to smartphones. Gaming consoles are serving the niche segment whereas feature-rich smartphones grab casual gamers leading to further strain on sales of consoles. The television industry is now being dominated with OLED technology and ultra-high resolution TVs. The Consumer Electronics industry always has something new to o� er like Smart gadgets, telematics and IOT. With technological improvements, there is a paradigm shift in the adoption of smart devices that in turn will drive the future.
BROADBAND
India is witnessing a makeover in the digital world. A nationwide broadband network will improve the connectivity and access to public services like G2C communication, governance, health, education and entertainment. ADSL and 3G are the broadband technologies that are currently driving the internet market in India. By 2020, broadband in India is targeted to achieve a speed of 2Mbps with 100% coverage and at an a� ordable price. The standard technologies (DSL and cable modems) and the new technologies (VDSL and optical � ber) together are enabling telcos to retain their telephone and cable subscribers. India’s Bharat Broadband project aims to provide high-speed and high quality optical � bre connectivity to over 2.5 lakh
EXECUTIVE SUMMARY
8

village panchayats by 2017. An increase in the optical � ber penetration, shipment of low-cost smart wireless devices, subscribers’ engagement with mobile apps, usage of content-based services and adoption of social networking platforms are some of the factors leading to broadband penetration.
VAS AND MOBILITY
The increasing competition in the telecom industry has made value added services a key di� erentiator for the telcos. Rise in smartphone users and the ongoing rollout of 4G has helped the MVAS to proliferate quickly. Recently launched Pokémon Go is the best example of a rich and immersive M-gaming experience. Start-up India is also picking up pace and has an intention of promoting the spirit of entrepreneurship in India. Mobile connect, introduced by GSMA in 2014 is now gaining importance in India and lot of operators and security developers from around the world are being roped in to make Mobile connect very robust in its outlook. Thus, with the services like these , the VAS ecosystem is bound to expand in the future.
ECONOMY
In 2015-2016, many economies have faced challenges due to recent turmoil in several global markets such as stock market crash in China, Brexit, and reduction in oil Prices. Yet, India had done well during the year because of many current domestic initiatives by the government such as “Make in India”, “Smart Cities”, “Digital India” and macroeconomic stability ensured by regulatory initiatives of RBI. The GST bill is expected to improve the economic performance of the country. China’s GDP has slowed down due to the stock market crash thereby making Yuan weaker in the global economy.Japan’s GDP has also shrunk and is expected to continue the same in near future due to its National Gross Debt and ageing problem similar to that of Russia. Brexit has had a hard impact on the EU. The Geopolitical tension in Middle East, Greece has restrained global investments and con� dence, thereby building up the pressure on the current global economic growth.
GLOBAL TELECOM
Telecom industry continues to grow, but is approaching saturation in the conventional service o� erings. The telecom sector as a whole is shifting its focus towards utilizing trending and upcoming technologies in its service o� erings to the end user. 4G LTE and FTTX are the major trends as they have larger scope in immediate future in both developing and developed markets across the globe. Mobile broadband is seeing a strong growth especially in African countries. In 2015, Latin America witnessed more investments in network infrastructure as the operators are expecting increased customer demand for mobile data and FTTX services. India being one of the aggressive markets, is gearing up for 4G revolution. United States and European countries are moving towards saturation and have little room for immediate growth, whereas highly developed telecom markets like South Korea, Japan and Singapore have already started investing in future possibilities such as 5G, IoT and arti� cial intelligence.
SPECIAL FEATURE
The Smart Cities project intends provide core ICT infrastructure and o� er a decent quality of life to its citizens with a clean and sustainable environment and adoption of applications of ‘Smart’ Solutions. The project has an estimated investment of 113 bn USD over a period of 20 years. With the urban population contributing to 75% of the national GDP in India in the next 15 years, the project holds immense relevance. The government has allocated 100 smart cities across the states based on proportion of urban population and number of towns. The conceptualisation of Smart City, therefore, varies from city to city and state to state. It depends on the level of development, willingness to change and reform, resources and aspirations of the city residents. The cities shall be developed through public private partnership with private sector contributing to 80% of the total investments. Smart Grid, public utilities, security, health and education shall be the focal point of development.
..................................................................................................................................................................................................................................................................... PRÉVISIONSITM ANNUAL FORECAST 2017
9

METHODOLOGYPrévision - SITM Annual Telecom Forecast is in its 13th year, initiated in the year 2003, with the purpose of providing the industry a neutral and insightful single point of view regarding the emerging trends in the telecom sector for the forth coming year, after accumulating inputs from detailed research into contemporary telecom technologies, telecom business and other determinants of change.
STATISTICAL MODELS USED FORFORECASTING
Prévision is a culmination of the collective endeavour of SITM students with 1500 man hours of e� ort put in by them. The student forecast team is guided by the SITM faculty and some of our esteemed alumni. It is the only e� ort of its kind in the telecom domain at this level, which provides comprehensive coverage over various domains in the telecom sphere.
TIME SERIES ANALYSIS
A time series is a sequence of data points, measured typically at successive times, spaced at (often uniform)time intervals. Time series analysis comprises of methods that attempt to understand such time series.Time series forecasting is the use of a model to forecast future events based on known past events to forecast future data points.
EXPONENTIAL SMOOTHING
In statistics, exponential smoothing refers to a particular type of moving average technique applied to time series data, either to produce smoothed data for presentation or to make forecasts.
EXTRAPOLATION
This model statistically extrapolates established pattern and/or existing relationship in order to predict their continuation, assuming that such will not change during the forecasting phase.
LINEAR EXTRAPOLATION
Linear extrapolation means creating a tangent line at the end of the known data and extending it beyond that limit.
POLYNOMIAL EXTRAPOLATION
A polynomial curve can be created through the entire known data or just near the end. The resulting curve can then be extended beyond the end of the known data. The resulting polynomial may be used to extrapolate the data.
TREND ANALYSIS
When a series of measurements of a process is treated as a time series, trend estimation is the application of statistical techniques to make and justify statements about trends in the data.
REGRESSION ANALYSIS
Data regression analysis is a technique used for the modelling and analysis of numerical data consisting of values of a dependent variable (response variable) and of one or more independent variables (explanatory variables).
Linear Regression, y = a(x) + bNon-Linear Regression, log(y) = log (a) + x*log (b)
Student Research Projects
IndustryInputs
Industry Watch
Summer Internships
1900 Alumni Mentorship
METHODOLOGY
10

INDEX
INDIANTELECOM
TELECOM SOFTWARE
VAS AND MOBILITY
GLOBALTELECOM
CONSUMERELECTRONICS
TELECOM TECHNOLOGIES
BROADBAND
ECONOMY
COMMUNICATIONINFRASTRUCTURE
SPECIALFEATURE
PAG
E12
PAG
E40
PAG
E68
PAG
E54
PAG
E18
PAG
E48
PAG
E74
PAG
E62
PAG
E26 PAG
E32
11

SCOPE
The objective of this vertical is to provide insights on the current trends in the Indian Telecom industry. It forecasts various key parameters such as wireless and wire-line subscriber base, urban and rural teledensity, telecom revenue, ARPM, NLD and ILD revenue. It throws light on the business scenarios of 2G, 3G and LTE technologies. It also discusses the FDI in� ow in telecom, MNP status, data ARPU of operators and current telecom policies of the government. By using a new parameter coined as the Telecom Index, we try to convey the health of the telecom sector in India by analyzing the changes in AGR with the in� ation rate.
SUBSCRIBER BASE AND TELEDENSITY
Indian Telecom sector has witnessed a robust growth during FY 2015-16. The total subscriber base has reached 1058.86 mn, registering a growth of 6.26% whereas total teledensity has increased at the rate of 5.01% over FY ’14. This growth is accredited to the expansion of mobile networks and strong customer demand resulting from a� ordable tari� plans. Intense competition between operators has created a price war encouraging them to adopt innovative pricing strategies. Rural areas have a subscriber base of 449.17 mn with low teledensity as compared to urban teledensity. This gap is an opportunity for the TSPs to expand their footprint in rural areas. Operators have plans to invest huge amount on infrastructure along with special tari� plans and o� ers targeted at rural consumers. This will increase the subscriber base, bring in additional revenue for operators and enable telcos to provide better service to consumers.
In� uencing Factors
Investment on infrastructure by operators Liberal and progressive policies of government Huge potential for expansion in rural areas
Market Share
INDIAN TELECOM
Student TeamAnubha Pandit | Tanuj Gupta
*Trend Analysis ** Regression Analysis
ARPM (GSM): ₹0.48
PRÉVISION FORECASTFOR FY 2016-17
CURRENT STATISTICS FY 2015-16
Wireless Subscriber Base:1058.86 mn
Expected to increase to 1117.25 mn **Expected to come down to 24.77 mn *
Fixed-line Subscriber Base: 25.22 mnTotal Teledensity: 83.36%Urban Teledensity: 154.01%Rural Teledensity: 51.37%Total Telecom Revenue: ₹2637.08 bn
Expected to increase to 96.58% **Expected to increase to 182.32% **
Expected to increase to ₹2690.57 bn *Expected to come down to ₹0.42 *
Expected to increase to 58.39% **
Idea 17.01%
Bharti24.22%
Vodafone19.16%Reliance
9.93%
Aircel8.44%
BSNL8.26%
Tata5.87%
Telenor5.03%
Sistema0.75%
Videocon0.66% MTNL
0.35%
12

MNP
Pan-India MNP became a reality last year. It facilitated mobile users with the convenience of changing their service provider within the state as well as while moving between states keeping the same mobile number.
According to TRAI, around 4.9 mn requests for MNP were received by the telecom operators in April 2016, showing 11.46% hike from 4.4 mn requests received in March 2016. TRAI had also received a number of complaints from subscribers regarding the rejection of MNP requests, reduction in the timeline for number return process, non-payment disconnection issues and ease of process during MNP. To curb such issues, TRAI imposed a penalty of ₹9.45 cr on operators for not complying with MNP rules.
MNP has been a success so far in India and has helped set up a level playing � eld by giving operators opportunities to increase customer base and revenue. Owing to MNP, the subscriber base of Vodafone, Airtel and Idea has increased, but Reliance Communications did not see much success. Moreover, Reliance Jio is also preparing to o� er MNP to get more subscribers hooked on its network.
In� uencing Factors
Large number of call drops Dissatisfaction in terms of QoS, Price and Customer service support Availability of inter-circle portability
NLD AND ILD
*Trend Analysis
The NLD and ILD render national and international transport links between several telecommunication service providers’ networks. NLD operators provide reliable and high quality call completion anywhere in India. Agreements between Basic Service Operators(BSO), Mobile Operators and Telecom PSUs in the country have assisted NLD-ILD providers. Currently, there are more than 40 NLD providers. NLD and ILD revenues are generated through roaming and long distance calls. Better 3G penetration, introduction of 4G network and a� ordable devices will have a positive impact on the NLD-ILD ecosystem.
NLD and ILD contribute 13.28% and 3.12% respectively to AGR. NLD contribution to AGR has declined by ₹579 cr Y-O-Y since December 2014 while the ILD contribution to AGR has increased by ₹18 cr. As per the NLD/ILD amendment of March 2016, interconnectivity between circuit switched tra� c and IP is allowed, which will add call volumes but the impact on the NLD/ILD revenues will be mixed.
OTT players like Skype are posing a great threat to International Carriers, making it essential for the International Carriers to induce VoIP and NGN in their networks. ILD providers are making an endeavor to get into enterprise business backed by cloud IT service delivery and SDN technologies.
In� uencing Factors
Reduction in license fee of NLD Getting into enterprise businesses Increase in tra� c of NLD/ILD due to regulatory approval for VoIP to PSTN/Mobile interconnect
2G
Smartphone users consume more data than voice, due to which data usage is expected to increase many folds from 1.4 GB/ month in 2015 to 7 GB/ month by 2021. Moreover, the demand for high-speed data is increasing amongst young smartphone users leading to a decrease in 2G subscribers as operators are encouraging 2G to 3G migration by o� ering call and internet services at similar prices. Operators like Airtel and Idea have dropped 3G data tari� plans by 67% so as to incentivise users to migrate to 3G networks.
In addition to Government’s “Make in India” initiative, many Chinese handset manufacturers are entering Indian market resulting in pocket-friendly yet feature-rich 3G enabled handsets. This will further drive users to shift from 2G to 3G network. Moreover, government’s spectrum liberalization policy will enable the shifting of the users from one network to another.
As on June 2015, there were approximately 300 mn wireless internet users, out of which 207 mn were 2G users consuming about 200 MB of data per month. Though a� ordable 3G data tari� plans are in� uencing users, unavailability of good 3G network coverage is resulting in 2G driving data growth in such tier-II and tier-III regions.
In� uencing Factors
100% FDI in telecom infrastructure Pocket-friendly yet feature-rich smartphones Spectrum liberalization
IND
IAN
TELECOM
CURRENT STATISTICSFY 2015-16
NLD revenue: ₹323.35 bn
Expected to come down ₹316.43 bn *Expected to increase to ₹179.35 bn *
PRÉVISION FORECASTFOR FY 2016-17
ILD revenue: ₹160.95 bn
..................................................................................................................................................................................................................................................................... PRÉVISIONSITM ANNUAL FORECAST 2017
13

MHz in combination with 2300MHz. There would be a signi� cant uptake of 4G LTE dongles and their number is expected to reach 230 mn by 2020, which would account for around 17% of the total subscribers. In the coming years, 4G adoption rate in India will be about 1.5% of the total wireless subscriber base deployment and growth of 4G is not going to be easy with challenges like insu� cient backhaul capacity, quality of service, security and chipset compatibility, but it will bring a massive revolution in the telecom market.
In� uencing Factors
Need for higher data rate Increasing a� ordability of devices and services Intense competition among telcos Liberalization of spectrum
DATA USAGE
Data users in FY 2015-16(mn)
With a rapid increase in the number of smartphones, the number of people accessing mobile internet has increased, thus increasing mobile data consumption. During FY 2015-16, the data usage (GSM & CDMA) per subscriber per month was 136.63 mb. The data usage for GSM was 122.93 mb while that of CDMA was 412.91 mb. Mobile data usage has more than doubled in the last three years. The huge jump in data consumption can be attributed to the proliferation of social media apps, gaming apps, and e-commerce applications. The young population of India contributes maximum to data usage by streaming music, videos, playing games, accessing maps and GPS for navigation, movie ticket booking, doing mobile recharges and much more. In India, there has been a growth of 85% in 3G data consumption in the last year and has reached 753 mb per month. In the coming years, due to 4G rollouts by telecom operators, data consumption will touch new heights and will give tough competition to 2G and 3G data services, largely due to low introductory tari� s. Still, there is a long way to go in India for a stage where data overtakes the voice which would only be possible with acceptance of data services by the sizeable semi-urban & rural population.
Growth in data consumption in tier-II & tier-III regions
3G
In 2010, the Indian telecom sector underwent a paradigm shift when the government auctioned 3G spectrum for ₹ 67,719 cr across all the 22 circles. 3G turned out to be a huge disappointment mainly due to lack of infrastructure as the operators were burdened with the huge cost of spectrum acquisition. Till Dec 2015, only 93 mn subscribers had active 3G connections. With the increase in the use of smartphones and popularity of online services, demand for high-speed data is increasing day by day. However, the demand for 3G might not increase to a great extent as a superior 4G technology is in the rollout phase. Also, the spectrum usage has been liberalized leading operators to o� er 4G, 3G, and 2G services on any band. Operators are not willing to invest much in 3G as consumer preference shifts to 4G. To add to 3G woes, few subscribers are unable to distinguish between 2G and 3G speed making it pointless to switch from low-cost 2G to relatively high-cost 3G.
Telecom operators are � nding it really hard to push 3G services and it is a challenge for them to decide whether “to invest” or “not to invest” in 3G infrastructure.
In� uencing Factors
Demand for high speed Tari� war between 3G and 4G services Increase in popularity of online services, social networking Availability of smartphones at low cost
4G/LTE
2016 is going to be the year of LTE in India with telecom operators like Airtel and Vodafone launching high-speed 4G services and manufacturers coming up with LTE enabled handsets. Also, Reliance Jio commenced its pan-India commercial operations from September 2016. As a part of promotions, Jio has off ered 4G SIMs with unlimited data for 3 months with its LYF smartphones. Currently, the tari� for 3G and 4G are similar given the price-sensitive nature of Indian market. Operators will resort to competitive pricing for their 4G packages. The average data usage per subscriber in India is expected to double by 2018 and the number of smartphones would cross 200 mn by then. On the 4G front, customers expect seam less connectivity and high QoS across the regions, putting pressure on LTE networks. Operators will have to provide high data rates over larger areas. This will be made possible through the use of low operating frequencies such as 800 and 1800
350
340
330
320
310
300
319.42324.95
342.65
331.66
Q1 Q2 Q4Q3
..................................................................................................................................................................................................................................................................... PRÉVISIONSITM ANNUAL FORECAST 2017
IND
IAN
TEL
ECO
M
14
the ARPU from calls showed a depletion of 9.17%, the ARPU from SMS showed a depletion of 12.97% and the ARPU from VAS services showed a depletion of 6.8% during the above period. This depicts data ARPU is cannibalizing the ARPUs of other services.
Technology advancement is also contributing towards greater data usage, which further enhances the ARPU generated from the data services. An average 3G subscriber consumes approximately four times more data than an average 2G data user. The consumption further goes up with 4G services.
In� uencing Factors
Growing demand of online videos Expansion of 3G & 4G services Optimized data tari� s Availability of a� ordable feature-rich smart phones
FDI IN TELECOM SECTOR
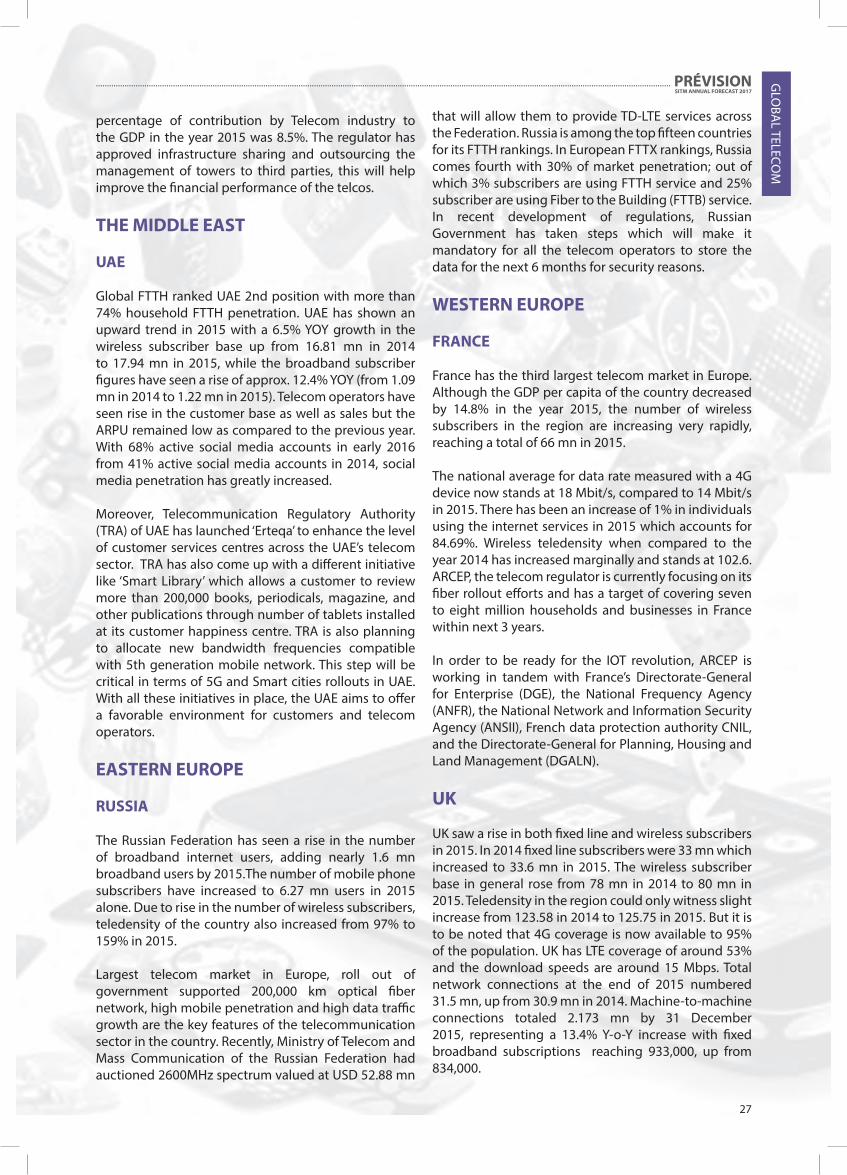
FDI in telecom in FY 2015-16
The Indian telecom market has registered a strong growth in the past decade and currently has the world’s second largest mobile subscriber base. It is likely to grow at 10.3% to reach US $103.9 bn by 2020 and contribute substantially to India’s GDP. The liberal and reformist telecom policies along with strong consumer demand have been instrumental in the rapid growth. The government has slowly raised the FDI permitted in telecom sector from 49% to 74% and � nally raised it to 100% in 2013. The deregulation of FDI norms has made the telecom sector one of the top � ve employment opportunity generator in the country. Over the last 20 years, operators have injected over ₹7.5 lakh cr in setting up the mobile networks. According to data released by Department of Industrial Policy and Promotion (DIPP), the telecom industry has attracted FDI worth US$ 18.38 bn from April 2000 to March 2016. In the last two years, from April 2014 to March 2016, the FDI in� ow has reached almost $4 bn, which is more than double the FDI generated in previous two years which stood at US$1.6 bn. Some recent investments being the ones made by Xiaomi, Axiata Digital, Sterlite Technologies and One Plus. India o� ers an excellent
In� uencing Factors
Aggressive 3G network expansion Increase in smartphone penetration Increased usage of mobile apps Streaming music and video on mobile A� ordable data tari� plans 4G rollout
TELECOM POLICIES
The government has provided opportunities for growth of telecom companies with its proactive and fast-tracked reforms throughout last year. The October 2016 auction will o� er 2,354.55MHz of spectrum at an estimated ₹5.66 trillion. These airwaves will enable operators in improving their QoS and address call drop issues. The government has liberalized the payment terms for spectrum auction by providing payment options i.e. upfront payment and payment in installments. TRAI has recommended alterations in the Uni� ed License so as to facilitate interconnection of IP with PSTN/Mobile amongst licensed operators. It has proposed a Public-Private Partnership model for BharatNet, which is the central government project for setting up of a broadband network in rural India. With a view to increasing consolidation, the government has approved the rules for spectrum trading, thus allowing telecom companies to buy and sell rights to unused spectrum among themselves. Also, spectrum sharing has been approved with an aim to improve spectral e� ciency and QoS. The government has also planned to provide free high-speed Wi-Fi in 2500 cities and towns over the next three years. Keeping in mind the operator friendly policies and introduction of 4G services, India is expected to emerge as a leading player in the telecom world.
DATA ARPU
* Trend Anaysis
Owing to rising popularity of online videos, apps, and other online services, the data services have become the leading revenue-generating segment for the telecom industry. This comes at the cost of depleting the revenue from traditional sources like voice, SMS, and VAS. High data rate from 3G & 4G services facilitates viewing of online videos & other services. Even in B & C circles, the demand for data services has gone up considerably. Data ARPU witnessed a gain of 25.37% from December 2014 to December 2015, whereas
10000
8000
6000
4000
2000
0
2517 Cr
4238 Cr
8637 Cr
6936 Cr
Q1 Q2 Q4Q3
PRÉVISION FORECASTFOR FY 2016-17
CURRENT STATISTICSFY 2015-16
Data ARPU: ₹28.31
Expected to increase to ₹31.76 *
..................................................................................................................................................................................................................................................................... PRÉVISIONSITM ANNUAL FORECAST 2017
IND
IAN
TELECOM
15

opportunity to telecom operators, equipment vendors, and manufacturers to diversify their operations in rural India and capture the gains of the telecom boom which is bound to occur in the coming years.
In� uencing Factors
Network expansion in rural India Expanding Indian economy with increased focus on the services sector Government initiatives such as “Make in India”
TELECOM INDEX
* Trend Analysis
Telecom Index analyses the telecommunication industry. The index helps in predicting the impact, positive or negative, on the industry and additionally facilitates in analyzing the trends and current market scenario. So, future choices and predictions regarding the industry are created in a rational manner. Predominantly, the idea of the telecommunication index lies in AGR. The de� nition of AGR keeps on changing as per TRAI recommendations. It is the total of all incomes earned through pure telecom operations adjusted for few pass through items. Any upward or downward movement within the AGR will re� ect the positive or negative impact on the industry. Apart from AGR, the growth of industry can also be expressed by factors like subscriber base, teledensity, and ARPU. The increase in all these factors implies that the industry is growing. But these are not many reliable measures. The basic methodology of Telecom Index is predicated on the fact that AGR or the revenue attained by the operators has to be increasing at a rate over the in� ation rate for that year. If in any year, the rise within AGR is less than the rate of in� ation, then there would be no real growth of telecommunication industry. Telecom Index is a color coded index. Colors and their interpretation are as follows:
According to our Index, the Indian telecom industry is declining and lies within the Pink zone as AGR is declining, but not at a signi� cant pace.
PRÉVISION FORECAST FOR FY 2016-17
CURRENT STATISTICS FY 2015-16
Adjusted Gross Revenue:`187857
Expected to reach:`197222.97 *
In� uencing Factors for AGR
Ease in spectrum trading and sharing Increasing subscriber base Digital India and smart India initiative High density Growth in ARPU
CONCLUSION
The market is expected to grow at 10.3% Y-o-Y. The subscriber base is increasing at a faster pace after reaching 1-bn-mark last year. Growth is attributed to the strong consumer demand and liberal policies of the government. The need for higher data rates and the TRAI regulations on call drop issues have forced operators to enhance network capacity and coverage. Last year saw huge developments with respect to technology and innovation. With 10 smart cities being built in the � rst phase, telecom operators need to provide the requisite infrastructure, which means more revenues for OEMs. The entry of Chinese handsets manufacturers in India will also boost the high-speed data demand of the subscribers increasing data ARPU and hence resulting in higher revenues of the telecom operators. We might also see some mergers and acquisitions of the operators in this � eld as small players are � nding it di� cult to survive in tough competition resulting in number of operators being reduced to 5-6 eventually.
Green
Red
Pink
Yellow
Positive growth
Industry contracting
Urgent revival needed
Trade is reviving
YearVa
lues
in c
rore
(Rs.
)
220000.00
200000.00
180000.00
160000.00
140000.00
120000.00
100000.00
2009-102010-11
20011-122012-132013-142014-152015-162016-17
AGR - Adjusted Gross RevenueUTL - Upper Threshold LimitLTL - Lower Threshold Limit
..................................................................................................................................................................................................................................................................... PRÉVISIONSITM ANNUAL FORECAST 2017
IND
IAN
TEL
ECO
M
16


SCOPE
This vertical throws light on the dynamics of the global economy by analyzing the past and current economic indicators for select countries. Economics has its implications on each and every industry vertical. The impact of various macroeconomic factors like in� ation, � scal de� cit, unemployment, exchange rate, import, and exports is taken into consideration with speci� c emphasis on India. These factors are analyzed using statistical tools to forecast the key trends for the economies of several countries. Moreover, the impact of di� erent qualitative and quantitative variables is studied for forecasting trends for key indicators. This vertical presents a snapshot of the way di� erent economies work and the impact of various � uctuations on the economic ecosystem.
INDIA
India is one of the fastest growing nations in the world with a total population of 1.311 bn and with GDP of 2.074 tn. With the growth rate of 7.244% in 2015 as compared to 6.639% in 2014, it is expected to increase in the coming years due to various foreign investments
and pro-growth government policies.
India in 2015 made investments of around $26.3 bn with almost 930 deals around the world with the telecom sector contributing to about 40% of it. Government initiatives such as the one to build new railway lines to Nepal and big ticket investments by foreign multinational giants (General Motors, Hyundai, Foxconn, etc.) are said to boost the economy even further.
The in� ation rate in 2015 in India was 5.89% as compared to 6.53% in 2014. This variation was due to drought and uneven rainfall in India. Moreover, the government had increased VAT and taxes on imported goods and services which added to the in� ation rates in last few years, speci� cally during the previous � scal year. The � scal de� cit of India in 2015 was 4.13% of GDP as compared to 4.6 % in 2014. The reason for this could be an increase in subsidies, defense expenditure and interest payments.
Unemployment Rate in India during 2015 was 3.4 %. Various government initiatives like Make in India, Digital India, and Smart Cities are expected to generate more employment opportunities and also foster the growth of India’s economy.
In� uencing Factors
Government Initiatives (Make in India, Smart Cities, Digital India) Mergers and Acquisitions made by India Inc. Foreign Investments Low Crude Oil Prices
ECONOMY
Student TeamShivam | Rituraj Zala | Dhruvika Solanki
*Trend Analysis ** Regression Analysis
PRÉVISION FORECASTFOR FY 2016-17
CURRENT STATISTICSFY 2015-16
GDP growth rate: 7.6% GDP growth rate: 8.0% **
IIP: 177.5 *IIP: 174.3
In� ation: 5.9%
PMI: 51.3:
In� ation: 4.45% *
PMI: 51.06 *
18

unemployment rate has increased from 8.7% in 2014 to 9.4% in 2015.
Greece’s bailout has heavily impacted EU’s � nances. EU has majorly been impacted by the exit of Britain. The announcement of referendum result sent shockwaves throughout the global economy leading to a dramatic drop in the value of Pound, which had already weakened ahead of the referendum.
Initially, the overall impact of Brexit seemed minor on the overall EU economy, but it remains a challenge for EU.
In� uencing Factors
Brexit Decline in growth in most of the member nations High unemployment rate
CHINA
China’s economy continues to grow moderately at 6.9% in 2015, one of the reasons being the shift of the Chinese economy from manufacturing industries to the service industries. The service sector of the country contributes 50% towards the economic growth of the country. People’s Bank of China surprised markets with devaluations of the Yuan, reducing over 3% of its value. The move was believed to be a desperate attempt by China to boost its exports to in an attempt to tide over the slowest growth rate in a quarter century. Britain’s unexpected decision to leave the European Union will cause a ripple e� ect in the global economy, a� ecting cross-border trade agreements, foreign direct investment strategies thus weakening of external demand for Chinese products.
Moreover, the in� ation rate has decreased to 1.4% as compared to the previous year when the government had targeted 3%. The major contributor towards in� ation rate is the hike in food prices. This price rise is likely to be temporary due to the proposed policy easing in near future.
Huge demand from the services and manufacturing sector has helped China in arresting the unemployment rate.
CAD
For the � scal year 2015-16, CAD remained at 1.1% of GDP i.e. $22.1 bn, as compared to 1.3% of GDP i.e. $26.8 bn in 2014-15. The reasons being reduction in the trade de� cit, which had narrowed to $130.1 bn last � scal from $144.9 bn in 2014-15 and moderation of overall Balance of Payment (BoP) during the � scal from $61.06 bn in 2014-15 to $17.9 bn. Initiatives like “Make in India” will provide a much, needed push to export which in turn will help in reducing CAD. Following Brexit, an anticipated slowdown in the global economy will lead to a decline in prices of commodities like crude. This too, will help India save a lot on its imports.
Although the private remittances received from abroad reduced, yet it stood at a substantial � gure of $15.8 bn. During the given period, exports too declined. FDI increased from $41 bn to $44bn in FY 2015-16.
In� uencing Factors
Reducing expenditure Make in India Trade relationship with countries Lower crude oil price Rise in the value of rupee
EUROPEAN UNION
The bird’s eye view of the EU economy shows that economic growth is moderate. However, the growth rate of individual EU members varied from positive to negative.
Greece is back in recession. Italy is barely growing. Portugal expanded but at half the expected rate. But some countries have also shown a positive growth rate. Germany showed a growth of 0.3% in fourth quarter of 2015 and 1.4% for the whole year. Exports are going to face a challenge in the international scenario in 2016, particularly with the Euro value appreciating in the foreign exchange market. Finland is back in recession with very little growth in the second half of 2015. The
*Trend Analysis
PRÉVISION FORECASTFOR FY 2016-17
CURRENT STATISTICSFY 2015-16
CAD: $22.1 bn CAD: $18.39 bn*
*Trend Analysis
PRÉVISION FORECASTFOR FY 2016-17
CURRENT STATISTICSFY 2015-16
GDP growth rate: 1.9% GDP growth rate: 2.02%*
In� ation: -0.1% In� ation: 0.27% *
*Trend Analysis
PRÉVISION FORECASTFOR FY 2016-17
CURRENT STATISTICSFY 2015-16
GDP growth rate: 6.9% GDP growth rate: 6.62% *
In� ation: 1.4% In� ation: 1.27% *
..................................................................................................................................................................................................................................................................... PRÉVISIONSITM ANNUAL FORECAST 2017
ECON
OM
Y
19

In� uencing Factors
Ageing population Shift towards service sector Decreasing exports to developed nations
SOUTH AFRICA
*Trend Analysis
PRÉVISION FORECASTFOR FY 2016-17
CURRENT STATISTICSFY 2015-16
GDP growth rate: 1.3% GDP growth rate: 1.11%*
In� ation: 4.6% In� ation: 3.89% *
South Africa, the second largest economy among the African nations, saw a GDP growth of 1.3 % in 2015 i.e. $312.798 bn as compared to about 1.5% i.e. $349.83 bn in 2014. In� ation was 4.6% in 2015 as compared to 6.4% in 2014. Monetary policy prioritizes in� ation control, both to encourage competitiveness in South African businesses and to protect individual purchasing power. A continuous struggle with the food price in� ation, which is at 9.8% in 2016, is proving to be one of the bottlenecks for SA. In 2015, the unemployment rate was 25.4% while in the � rst quarter of 2016 it has increased to 26.7%. In order to keep all these problems in check, the National Development Plan has aimed to reduce poverty and inequality by creating jobs and improving education by 2030. Following Brexit, the value of the Rand witnessed a huge plunge as SA has close � nancial and trade ties with U.K. To add to this, it had already su� ered a setback due the China’s devaluation of the currency with whom they had a trade and industry deal in the year 2015.
The government continues to remain committed to raising investment, improving labor relations and policy coordination, making it easier for doing business so that the South African economy is better placed to grow in future.
In� uencing Factors
High Food In� ation High Unemployment rate Poor Quality of Education Shrinking of Agriculture and Mining Industries
RUSSIA
*Trend Analysis
PRÉVISION FORECASTFOR FY 2016-17
CURRENT STATISTICSFY 2015-16
GDP growth rate: -3.7% GDP growth rate: -0.62% *
In� ation: 15.5% In� ation: 7.69% *
The Russian economy has faced a steep decline of 3.7% in GDP since 2009. Oil and gas account for half of the revenue of Russia. After a fall in the oil prices, per barrel cost of oil hovered around $30. The Russian government had to make cuts in the budget for 2016 as it was � nalized on the assumption of oil price touching $50 per barrel. The economic recession has hit consumers hard. 2.3 mn Russians have been impoverished in � rst 9 months of 2015. In� ation has risen up to 15.5% in 2015. However, the situation got worse with sanctions against Russia by western nations. Demand shifted towards domestic products due to the weakening of the Rouble. Russia’s population is also ageing and unemployment remains at 5.7%.
Russia declared that it had been out of recession for more than 6 months in May 2015 though many Russians still continue to feel the ongoing economic crisis in the country, with real wages falling by 9.5% in 2015. UK’s departure from the EU may send shockwaves across the global economy, which is likely going to have repercussions in the Russian economy too, yet the impact will probably be limited.
In� uencing Factors
Low crude oil price Sanctions by US & Europe Geopolitical issues leading to political uncertainties Weak Rouble
SOUTH KOREA
South Korea, the 11th largest economy in the world contributes 1.898% ($1393 bn) of the world’s nominal GDP. In terms of PPP, its contribution stands at 1.63% amounting to $1849 bn. Over the past 5 years, South Korea has experienced a steady growth of 2.96% although it is lot lower than 6.6% it experienced in 2010. Its annual GDP growth rate stayed at 2.6% in 2015, down from 3.3% in 2014. South Korea’s exports are continuing to fall over past 17 months, the major reason being China’s rising share in global exports. Also, as labour costs in China are comparatively cheaper than South Korea, China continues to be the preferred destination for imports by the United States, Europe and most of the nations. 2012 onwards, Korea’s exports have fallen by $10.4 bn. It currently stands at $45.9 bn as compared with $56.3 bn in 2012. Major exports from Korea include
*Trend Analysis
PRÉVISION FORECASTFOR FY 2016-17
CURRENT STATISTICSFY 2015-16
GDP growth rate: 2.6% GDP growth rate: 2.35% *
In� ation: 0.7% In� ation: 0.23% *
..................................................................................................................................................................................................................................................................... PRÉVISIONSITM ANNUAL FORECAST 2017
ECO
NO
MY
20

experience stagnancy till the questions about single market access are not answered.
In� uencing Factors
Brexit and its implication Decline in business investments Lower crude oil prices Higher cost of labor
JAPAN
Japan is the third largest economy in the world after US and China. GDP in the Jan-Mar quarter of 2016 has improved to 0.5% as compared to -0.4% in Oct-Dec quarter of 2015. Japan’s GDP in the Jan-Mar quarter of 2016 stood at 503.2 trillion Yen as compared to 500.2 trillion of Oct-Dec quarter of 2015.
Japan’s gross national debt is increasing year by year. In 2015 its debt to GDP ratio was 229.2 % and in 2016 (end of March it was ¥1,049.37 trillion) it is estimated at about 232.4%, which is twice as that of U.S and is highest in OECD. Amongst the working age population, 60.5% are above the age of 45 years. Ageing population is acting as a hindrance to the growth of the country. However, unemployment rate reduced to 3.2% in Jan-Mar quarter of 2016 and is the least since 21 years, which is a good sign for the near future.
Exports and imports were $468 bn and $471 bn respectively, which estimate to -25% and -54% Y-O-Y percentage change. Even devaluation of Yuan has a� ected the export earnings. The in� ation rate in 2015 was 0.8 % as compared to last year in� ation rate of 2.7 %. Japan’s infl ation rate is declining at a constant rate despite various e� orts taken by the government to keep in� ation high as de� ation has been a long standing issue in the Japanese economy.
In� uencing Factors
Ageing population Rising National Gross Debt Reduction in export of goods Low In� ation
IC chips (14%), cars (7%), petroleum products (8%) and ships (4%) as per 2014 data. The � scal de� cit of South Korea is a mere -0.2% of GDP. In 2015, South Korea’s exports were $674.7 bn and its imports were $564.25 bn, which is a surplus of $110.45 bn.
Weak external demand, tightening � scal policies and weak productivity in services, act as reasons for low GDP. Through its three-year Economic Innovation plan launched in 2014, the government is trying to address the problem of low productivity growth.
In� uencing Factors
Declining Exports Wage in� ation due to aging population Tighter � scal and monetary policy
UK
UK was the � rst largest economy in the world that was surrounded by the looming clouds of Brexit. Though Brexit as of now has not had any profound e� ect on the UK economy, growth may continue to be slow until 2017.
The sectors impacted most will be automobile and steel industries. Once the process of Brexit completes, car manufacturers in the UK would have to apply for separate certi� cation so as to sell their units in EU member countries. Brexit will also impact seamless trade of goods across Europe, a major chunk of which shall be steel.
The unemployment rate may reduce as Britain may impose stricter immigration control policies, making it tougher for immigrants to work in UK. This will also increase labor cost since local workers will be hired as cheaper immigrant skilled workers will not be available in large numbers. This could greatly a� ect manufacturing and agriculture.
Exports may reduce as UK would have to negotiate/re-negotiate terms and treaties with the single market or it could negotiate trade agreements with individual countries. Consequently, if the UK does not have access to the single market, exports and trade, in general, will have signi� cant impact on its economy. But till 2017, trade will not grow but will remain stable. FDI shall
*Trend Analysis
PRÉVISION FORECASTFOR FY 2016-17
CURRENT STATISTICSFY 2015-16
GDP growth rate: 2.25% GDP growth rate: 1.96% *
In� ation: 0.3% In� ation: 0.74% *
*Trend Analysis
PRÉVISION FORECASTFOR FY 2016-17
CURRENT STATISTICSFY 2015-16
GDP growth rate: 0.5% GDP growth rate: 0.96% *
In� ation: 0.8% In� ation: 0.47% *
..................................................................................................................................................................................................................................................................... PRÉVISIONSITM ANNUAL FORECAST 2017
ECON
OM
Y
21

Current standings indicate Brazil as the 9th largest economy in the world. Its GDP amounts to $1.77 trillion (US). It also continues to be the largest among the South American economies. As of 2015 Brazil contributed 2.812% to the world’s GDP with respect to Purchasing Power Parity (PPP). The backbone of the Brazilian economy is ever-growing service sector, contributing 72% of total GDP. The service sector was followed by industry and agriculture, which contributed ~22% and ~5% towards GDP respectively.
Brazil’s GDP has been on a continuous nose dive since 2010 with minor signs of revival, shortly before Dilma Rousse� s took over. The main reasons for this are ine� cient policy formulation & implementation, political scandals and instability. The GDP fell by 2.8% in 2015. Though investments are � owing into the country due to Rio Olympics, if number of tourists does not match up to the expectation, the fall in GDP will be even deeper.
The devaluation of Chinese Yuan is also hurting the Brazilian economy. Brazil has invested $38 bn in Rio Olympics, but will such investments pay dividends still remains a big question. If not, then GDP will fall further adding to the � scal de� cit. Brazil is unable to attract much foreign investment in the country due to prevailing recessional conditions. Due to an interim government change and implementation of policies, in� ation has eased from 9.3% to 8.8%, however, it is far away from central bank’s acceptable � gure of 4.5%.
In� uencing Factors
Rio Olympics Unstable political system and corruption Weakening Real (R$)
CRUDE OIL
India depends on its crude oil import (nearly about 80% of its crude oil requirement is met by import) and it has imported nearly 202.1 mn tonnes in 2015-2016 as compared to 189.4 mn tonnes of crude oil in previous year i.e. 2014-2015. Per barrel cost of crude oil in India in the year 2015-2016 was $46.17 as compared to $84.16 per barrel in 2014-2015. There are many factors that contribute to it. Some of them are as follows:
1) Increase in production: There are many countries which entered or doubled their output in last few years.
USA
USA continues to be the most powerful economy in the world. As per 2015 World Bank � gures, it held a prime position in terms of nominal GDP, which was a staggering $17,947 bn. In terms of purchasing power parity, it stood 2nd at $17,419 bn just behind China’s $18,031 bn. USA contributed ~25% to the nominal GDP of the world. The average economic growth rate for the past 5 years has been around 2.1 %.
In 2015 the unemployment rate in the US was 5.29% and, if the Republican Presidential candidate Donald Trump wins, US may see an early sharp fall due to stricter policies regarding working immigrants.
USA continues to be one of the major producers of petroleum and natural gas. USA is the third largest oil producer in the world accounting for 12% of the total world produce. USA has almost become self-su� cient in terms of oil production. Hence it has to import less due to which domestic oil prices are low. Thus the supply is more than demand resulting in low oil prices.Due to the Brexit, US may see a fall in trade temporarily. Although till the formal Brexit in 2017, trade � gures are expected to remain more or less the same with the UK. Similarly, China’s surprising move to devalue Yuan could hurt USA’s export to China and may also increase prices of some consumer goods manufactured in China.
In� uencing Factors
Presidential elections and the associated policy uncertainty Low Oil prices Brexit Strong US dollar Low-interest rates
BRAZIL
*Trend Analysis
PRÉVISION FORECASTFOR FY 2016-17
CURRENT STATISTICSFY 2015-16
GDP growth rate: 2.6% GDP growth rate: 2.72% *
In� ation: 1% In� ation: 1% *
*Trend Analysis
PRÉVISION FORECASTFOR FY 2016-17
CURRENT STATISTICSFY 2015-16
GDP growth rate: -3.8% GDP growth rate: -4.58% *
In� ation: 8% In� ation: 8.23% *
*Trend Analysis
PRÉVISION FORECASTFOR FY 2016-17
CURRENT STATISTICSFY 2015-16
Price per barrel: $46.17 Price per barrel: $41.99*
..................................................................................................................................................................................................................................................................... PRÉVISIONSITM ANNUAL FORECAST 2017
ECO
NO
MY
22

In� uencing Factors
Global oil prices Fed interest rate US Presidential Election
INR v/s YUAN
India and China are two of the biggest economies (seventh and second respectively) in the world, the former is an ITES & outsourcing hub while latter is manufacturing base for the world and hence, � uctuation in their currency matters to the world. In past few years, there have been constant ups and downs in the two currencies. In 2014, INR (Indian Rupee) per 1 CNY (Chinese Yuan Renminbi) was 9.855 and it increased to 10.25 in 2015, but there was a slight dip in the currency in last quarter of 2015 as it went down from 10.34 in the third quarter to 10.195 INR per 1 CNY.
There are few reasons that were responsible for the price � uctuation in the currencies. First is devaluation in the Yuan in the middle of the third quarter due to which INR per 1 CNY came down to 10.195 from 10.34. Second is Chinese market being hit by Britain’s exit from EU and as it represents one of China’s important markets and its � nancial base outside Asia.
The dip in the INR v/s CNY could be temporary as India’s dependency on Chinese products especially in the Automobile industry, Pharmaceuticals, Metal and Metal-based Products is more. Additionally, the import and export growth rate between the countries has an important contribution to this. In Pharmaceuticals Industry, about 80% need is ful� lled by Chinese import and India has nearly spent about $2.22 bn in drugs import from China. The above conditions hint at further � uctuations between the two currencies.
In� uencing Factors
Devaluation in Chinese currency Brexit High imports from China to India
CONCLUSION
Growth continues to lose momentum in developed economies, while there is a notable disparity in performance across developing nations and emerging markets. OPEC nations have been hit hard due to fall
U.S has increased its production to almost double in last several years. Also, Saudi Arabia, Algeria, and Nigeria are competing in Asian Market which has also a� ected the crude oil price.
2) Iran’s and Saudi Arabia’s role: Iran and Saudi Arabia hold the major imported share of the crude oil. Saudi Arabia and Iran contribute around 940,000 and 930,000 barrels per day crude oil respectively, which estimates around half of the total crude oil import.
Besides these, China’s devaluation of its currency and Iran-U.S nuclear deal has also made an impact on the reduction of crude oil prices all over the world. Moreover, automotive companies are making fuel e� cient vehicles which are further reducing the demand of crude oil.
In� uencing Factors
Increase in crude oil Production in world Geopolitical and economic events in oil producing regions China’s devaluation and Iran-U.S Nuclear deal impact
RUPEE v/s DOLLAR
Rupee performed quite well in 2015, withstanding the US Fed hike, Yuan devaluation, RBI rate cuts and declining crude oil prices.
The interest rate hike in the US, however just 25 bps, denoted a vital movement in Fed approach which has held interest rates consistent since June 2006. This may have strengthened US dollar, and provided a push to exports, while conceivably restricting the growth of imported products.
Subsequent to the beginning of 2015, the Indian Rupee had fallen by around 1.6% till mid- June, which made it one of the top performers in the list of emerging currencies for the year 2015.
Fate of rupee will largely be dependent on outcomes of US Presidential elections, the anticipated US’s narrow money policy which will tighten the liquidity and � ow of dollars in the global market. This will have a direct e� ect on exports and imports, leading to narrowing of current account de� cit and thus, future exchange rates.
*Trend Analysis
PRÉVISION FORECASTFOR FY 2016-17
CURRENT STATISTICSFY 2015-16
$1 = ` 65.46 $1 = ` 67.31*
*Trend Analysis
PRÉVISION FORECASTFOR FY 2016-17
CURRENT STATISTICSFY 2015-16
1 CNY = ₹10.2 1 CNY = ₹10.91*
..................................................................................................................................................................................................................................................................... PRÉVISIONSITM ANNUAL FORECAST 2017
ECON
OM
Y
23

of oil prices. Due to a lot of policies and uncertainties in developed economies, investment and growth continue to be on a slow pace. In China, industrial activity is slowing because of strong growth in the service industry. Russia and Brazil are still under the in� uence of recession. Growth in South Asia remains moderately high, led by India. Domestic demand will continue to be the key driver of growth in South Asia.
Britain’s referendum for exiting EU has sent shockwaves throughout the global economy. US saw slowing exports because of a strong dollar and weak demand from emerging markets, though low oil prices have helped US in cutting down its expenditure. All these reasons are evident to prove that the global economy will grow with the same sluggish growth as last year.
..................................................................................................................................................................................................................................................................... PRÉVISIONSITM ANNUAL FORECAST 2017
ECO
NO
MY
24


SCOPEGlobal Telecom vertical provides an insight on the latest happenings in the telecom domain across USA, South America, Southeast Asia, Africa, Middle East, Europe and Australia. Using facts and � gures, it provides a clear picture of upcoming developments and technologies on the Global Telecom arena. Spectrum auctions, 4G, 5G, FTTX and factors impacting the various telecom parameters globally have been put forward in this vertical.
KENYA
Kenya’s telecommunications market is undergoing some signi� cant changes. The rapid growth of mobile market can be seen with a rise in the number of wireless subscribers from 33,632,631 in 2014 to 37,715,944 in 2015. At the same time, the number of � xed line subscribers has gone to 85,496 in 2015 from 179,990 in 2014 showing a decrease of 52.5%. However, the teledensity is growing at a steady pace, rising from 73.84 in 2014 to 80.68 in 2015. The continued growth in mobile subscriptions indicates that there is still an opportunity for growth in the mobile telephony services.
The main reason behind this increase is the launch of LTE-Advanced network in Kenya. It o� ers speeds of up to 100 mbps, which is more than twice the speed o� ered by 3G technology, thereby boosting network capacity, data rate and performance. The existing operators are also rolling out 4G technology with the support of government’s revised open-access approach to license LTE network. With the laying out of four � ber-optic cable networks in recent years, several � ber infrastructure sharing agreements have happened which in turn have
resulted in an improved international connectivity.
Moreover, the Communication Authority of Kenya (CAK) has reduced the interconnection tari� s and implemented a new simpli� ed and converged licensing regime. It has lowered the barriers to market entry and increased competition by allowing operators to o� er any kind of service in a service & technological neutral regulatory framework.
NIGERIA
Nigerian telecom market is the largest and fastest growing market in Africa. Due to liberalization, the companies can now provide more and better services in an independently regulated market. There are 150 mn subscribers and as the number increases, service penetration is also likely to increase in urban, semi-urban and rural areas. The number of wireless subscribers in the country reached to 150.83 mn by end of 2015, witnessing a signi� cant growth of 8%. In 2015, the teledensity of the region saw an increase of 5%, reaching to a � nal count of 82.18.
Nigeria also houses one of the largest set of internet users with 28% users in Africa region. 3G, 4G and WiMAX wireless broadband services have been aggressively rolled out augmented by new national and international � ber links. The broadband internet penetration has deepened due to auctioning of the 2.6 GHz spectrum by the Nigerian Communication Commission (NCC) to MTN Nigeria Communications Limited.
Economic development in Nigeria is directly dependent on huge demand for data services and broadband deployment, giving a GDP per capita of $2640.3. The
GLOBAL TELECOM
Student TeamNareshkumar Hegde | Jimit Raval | Faraaz Ahmed Gausee | Nikhilesh Harde
26
percentage of contribution by Telecom industry to the GDP in the year 2015 was 8.5%. The regulator has approved infrastructure sharing and outsourcing the management of towers to third parties, this will help improve the � nancial performance of the telcos.
THE MIDDLE EAST
UAE
Global FTTH ranked UAE 2nd position with more than 74% household FTTH penetration. UAE has shown an upward trend in 2015 with a 6.5% YOY growth in the wireless subscriber base up from 16.81 mn in 2014 to 17.94 mn in 2015, while the broadband subscriber � gures have seen a rise of approx. 12.4% YOY (from 1.09 mn in 2014 to 1.22 mn in 2015). Telecom operators have seen rise in the customer base as well as sales but the ARPU remained low as compared to the previous year. With 68% active social media accounts in early 2016 from 41% active social media accounts in 2014, social media penetration has greatly increased.
Moreover, Telecommunication Regulatory Authority (TRA) of UAE has launched ‘Erteqa’ to enhance the level of customer services centres across the UAE’s telecom sector. TRA has also come up with a di� erent initiative like ‘Smart Library’ which allows a customer to review more than 200,000 books, periodicals, magazine, and other publications through number of tablets installed at its customer happiness centre. TRA is also planning to allocate new bandwidth frequencies compatible with 5th generation mobile network. This step will be critical in terms of 5G and Smart cities rollouts in UAE. With all these initiatives in place, the UAE aims to o� er a favorable environment for customers and telecom operators.
EASTERN EUROPE
RUSSIA
The Russian Federation has seen a rise in the number of broadband internet users, adding nearly 1.6 mn broadband users by 2015.The number of mobile phone subscribers have increased to 6.27 mn users in 2015 alone. Due to rise in the number of wireless subscribers, teledensity of the country also increased from 97% to 159% in 2015.
Largest telecom market in Europe, roll out of government supported 200,000 km optical � ber network, high mobile penetration and high data tra� c growth are the key features of the telecommunication sector in the country. Recently, Ministry of Telecom and Mass Communication of the Russian Federation had auctioned 2600MHz spectrum valued at USD 52.88 mn
that will allow them to provide TD-LTE services across the Federation. Russia is among the top � fteen countries for its FTTH rankings. In European FTTX rankings, Russia comes fourth with 30% of market penetration; out of which 3% subscribers are using FTTH service and 25% subscriber are using Fiber to the Building (FTTB) service. In recent development of regulations, Russian Government has taken steps which will make it mandatory for all the telecom operators to store the data for the next 6 months for security reasons.
WESTERN EUROPE
FRANCE
France has the third largest telecom market in Europe. Although the GDP per capita of the country decreased by 14.8% in the year 2015, the number of wireless subscribers in the region are increasing very rapidly, reaching a total of 66 mn in 2015.
The national average for data rate measured with a 4G device now stands at 18 Mbit/s, compared to 14 Mbit/s in 2015. There has been an increase of 1% in individuals using the internet services in 2015 which accounts for 84.69%. Wireless teledensity when compared to the year 2014 has increased marginally and stands at 102.6. ARCEP, the telecom regulator is currently focusing on its � ber rollout e� orts and has a target of covering seven to eight million households and businesses in France within next 3 years.
In order to be ready for the IOT revolution, ARCEP is working in tandem with France’s Directorate-General for Enterprise (DGE), the National Frequency Agency (ANFR), the National Network and Information Security Agency (ANSII), French data protection authority CNIL, and the Directorate-General for Planning, Housing and Land Management (DGALN).
UK
UK saw a rise in both � xed line and wireless subscribers in 2015. In 2014 � xed line subscribers were 33 mn which increased to 33.6 mn in 2015. The wireless subscriber base in general rose from 78 mn in 2014 to 80 mn in 2015. Teledensity in the region could only witness slight increase from 123.58 in 2014 to 125.75 in 2015. But it is to be noted that 4G coverage is now available to 95% of the population. UK has LTE coverage of around 53% and the download speeds are around 15 Mbps. Total network connections at the end of 2015 numbered 31.5 mn, up from 30.9 mn in 2014. Machine-to-machine connections totaled 2.173 mn by 31 December 2015, representing a 13.4% Y-o-Y increase with � xed broadband subscriptions reaching 933,000, up from 834,000.
..................................................................................................................................................................................................................................................................... PRÉVISIONSITM ANNUAL FORECAST 2017
GLO
BAL TELECO
M
27
UK has started with the ground work for the next spectrum auction, which will make more spectrum available for the mobile sector to meet the demands of the consumers towards high-speed data services. The spectrum to be released in future will allow telecom operators to expand their 4G coverage and improve on the quality.
In May 2015, the government published a statement regarding public sector spectrum release, which says that the companies will get awarded with 2.3GHz and 3.4GHz spectrum bands, which would be useful in providing very high capacity data transmission. The availability of new spectrum shall impact the competition in the mobile market.
NORTH AMERICA
USA
The � xed line subscriber base has decreased from 128.4 mn in 2014 to 121.9 mn in 2015. This is as a result of � xed mobile substitution and has led to an increase in the wireless subscriber base from 355.4 mn in 2014 to 382.3 mn in 2015. The rapid growth in LTE subscriptions is driven by consumer demand, strong competition and the migration of CDMA operators to LTE. The LTE coverage in USA is around 81% and the LTE download speed is around 10 Mbps.
The LTE has been the epicenter for growth, innovation, and disruption. Research shows that US consumers look at their devices over 8 bn times a day on an average. This augurs well for the telecom industry including wireless and wireline/broadband carriers and device manufacturers who are all vital participants of this ecosystem. Carriers have continued to focus on providing high quality voice and data quality that are reliable, economical and across wide coverage.
A big upcoming wave of change for the communications sector will be the emergence of � fth generation mobile networks (5G). And also it is expected that mPayments will be de� nitely see a boom in 2016.
SOUTH AMERICA
ARGENTINA
Argentina’s telecom industry is the third largest in Latin America with 60.66 mn wireless subscribers. The number of � xed line subscribers increased by 3% (10.12 mn) as compared to that of 2014. Wireless teledensity decreased marginally and stood at 158.74. While the number of wireless subscribers has been decreasing, � xed line subscribers are on the rise as has been
noticed since the last 2 years. Higher prices of mobile subscriptions along with a weak ICT infrastructure could be a reason for this trend.
Argentina’s pay TV market is the most developed in Latin America. The country has the highest pay TV penetration rate, with two thirds of the households subscribing to its services. Pay TV households are uniformly distributed throughout major cities in country. Two key operators dominate the DSL market controlling about 68% of all broadband connections between them.
As a latest development in data operations, the Federal Internet plan was presented in May 2016 that will connect 1200 locations across the country to ARSAT data network. The plan aims to provide broadband connections to 29 million Argentines in 2 years. The plan also o� ers sale of 4G equipped smart phones on subsidies and payment in instalments. The Digital Country Plan by the Ministry of Modernisation will be launched soon which will in its � rst stage ensure free public Wi-Fi in over 1,000 municipalities across the country.
AUSTRALIA
The number of internet subscribers in Australia increased by 2% as compared to December 2014 reaching 12.95 mn by the end of December 2015. Number of � xed line subscribers decreased to 9.08 mn and that of wireless subscribers increased to 31.77 mn. Wireless teledensity increased marginally to 132.80.
The 1800 MHz band spectrum in regional areas was auctioned in November 2015 and it resulted in revenues of approximately $543.5 mn. The 1800 MHz spectrum is already being used for providing 4G telecommunication services in Australia’s major cities. Now, with the auction of the 1800 MHz spectrum in the regional areas, the availability and performance of 4G services across Australia is expected to improve considerably.
National Broadband Network (NBN) is a government-funded initiative to connect the Australian population to a high-speed network by 2021. NBN launched its � rst Hybrid Fibre Coaxial (HFC) services in July 2016 as a part of the newly introduced multi-technology mix model. 875,000 HFC premises will be ready for service by June 2017.
EAST ASIA
SOUTH KOREA
South Korea is one the world’s innovative telecommunication and information technology market having more than 89% individual internet users.
..................................................................................................................................................................................................................................................................... PRÉVISIONSITM ANNUAL FORECAST 2017
GLO
BAL
TELE
COM
28

South Korea is also one of the few countries having more than 40% broadband subscribers. The stable economic condition of the country with per capita income of $34,549 (PPP) has made it imperative for the network operators to be in sync with the change in technology. The telecom industry is facing a technology transformation as many of the operators have come up with 4G+ and other personalized content service o� erings. Such technology transformation helped country to add 1.6 mn wireless subscribers in 2015. Country ARPU also shows positive signs notably by 1.4% growth in last couple of years.
The telecom industry in the country is surging ahead as the operators are considering LTE advanced, Smart Home, Internet of Things platform development and 5G deployment options in coming future. On the 5G deployment, one of the major mobile operators in South Korea has successfully tested 5G using Proof of Concept trial, using E-band spectrum. E-Band spectrum covers the frequency range of 70-80 GHz. South Korea leads the global FTTH ranking 74% market penetration out of which 28% of the homes are connected by the � ber to the home(FTTH) and 46% are connected by the � ber to the building (FTTB).
South Korean ministry will soon start reviewing process of spectrum auction of available block in the 700MHz, 1800MHz, 2100MHz, and 2600MHz bands and are expected to raise USD 2.3 bn in total. The Korean government is working with innovative private sector investment with aim of transforming South Korea into smart nation. At holistic level, the government continues to support the telecom sector by proactively easing out investment regulations and making environment conductive for price reduction.
SOUTH EAST ASIA
JAPAN
Japan has one of the world’s most advanced cellular network which makes the Japanese telecom sector one of the most developed markets with a mobile subscriber base of 158 mn as of 2015. The number of � xed line subscribers remained nearly the same with 63.63mn in 2015 compared to 63.61mn in 2014. The teledensity of the country increased from 120.23 to 125.05 in 2015.
LTE now represents majority of the mobile subscribers. Individuals using internet has increased by 4% in the year 2015. Japan’s mobile phone base station market covers more than 75% of the population with LTE. With the saturation of � xed line telephone subscribers, the users have shifted from DSL to FTTH. Due to advancements in technology there has been an increase in many factors like the speed of LTE, the number of FTTH connections
and number of operators who are at their initial stages of 5G network trials. There is basically no restriction on foreign investment in Japan’s telecommunications sector.
MYANMAR
Major changes can be witnessed in Myanmar’s telecom sector as the market undergoes liberalization. The rise in demand for mobile market has resulted in a dip of � xed line subscriptions from 526,792 in 2014 to 523,722 in 2015. However, the growth in number of wireless subscribers is fast and rapid. It has increased to 41,529,282 in 2015 from 29,029,342 in 2014, showing almost 85.6% growth rate. Even the teledensity has shown a considerable increase of 76.67 in 2015 up from 54.04 in 2014, with a growth rate of 41.87%.
The entry of two foreign operators in the local mobile market and joining Myanmar Post and Telecommunications (MPT) has increased the competition in the country. One of the new operators has launched 4G LTE services in some parts of the country and is planning to expand the high speed network to other locations once the required spectrum is granted.
In addition to this, China’s United Telecommunications Corp. has struck a deal to construct China’s � rst international undersea cable that shall link China and Myanmar. Myanmar Post and Telecommunications (MPT) which has expertise in construction of undersea cable has been given the charge of implementing this deal. However, internet services in Myanmar still remain slow and unstable. Myanmar being one of the underdeveloped telecommunication markets in Asia, has lot of scope for improvement.
SINGAPORE
Singapore has been a world leader in tele communications by building high quality and extremely progressive regulatory environment in the region. The � xed line subscribers increased from 19 mn in 2014 to 20 mn in 2015. In 2014, the wireless subscribers were 81mn which increased to 82 mn in 2015. Since the market has already reached saturation levels, teledensity didn’t witness any major change and remained at 146.
Singapore’s 3G market segment has seen a surge over recent years but in 2014, it decelerated into a state of decline with the arrival of 4G. Singapore is considered to be the best LTE network in terms of service quality and data rate. It has around 83% of the LTE coverage and LTE download data speed is around 37 mbps. By 2015, there were already 3.7 mn 4G subscribers, this
..................................................................................................................................................................................................................................................................... PRÉVISIONSITM ANNUAL FORECAST 2017
GLO
BAL TELECO
M
29

being a remarkable 68% penetration (population).
Singapore’s per capita income (PPP) of 2015 was $52,888.70 which was lesser than the previous year’s $56,007.03. This dip in economic growth will not have any direct impact on the telecom sector in the country. There are technological developments in the telecom sector due to constant support from the government. The country has been a major contributor to the telecom revolution in the entire Southeast Asian region. Cutting edge competition among the market players and the migration of 3G subscribers to 4G has not only resulted in technological innovation but has also created an alternate revenue path.
CHINA
China is the most populous digital economy with 1.3 bn mobile phone owners and 688 mn data users by end of 2015. Mobile applications and advertising are the drivers of growth in the Chinese market. The number of � xed line subscribers reduced to 231 mn in the last quarter of 2015 while the number of the wireless subscribers has increased to 1305.74 mn recording a growth of 1.53%. The wireless teledensity increased to 93.16.
The Chinese telecom sector is growing rapidly with the rollout of 4G gaining momentum and reaching 43% of the world’s 1.38 bn LTE connections by the end of June 2016. The percentage of individuals using the internet was more than 50% in 2015 for the � rst time. IP messaging services have contributed to the increase in mobile subscribers and have also a� ected the voice revenues that fell by 15.4% in February 2016. MVNO subscribers reached 20 mn with M2M and mobile money services pushing the growth.
China’s broadband users increased to 260 mn by the end of 2015. Launch of VoLTE will result in 2G services being switched o� or reallocating most of the 2G spectrum to 4G by 2020. IPTV may get a major boost in the coming years due to exponential growth in broadband penetration, adoption of 4G services, a robust television industry, � exible costing and a competitive environment. FTTX connections are expected to increase further by 200 mn by 2017.
CONCLUSION
The growth and development of the industry have been dependent on the political and economic factors across the globe. New technologies aimed at improving the data transmission rates are being deployed. The revenue generated by data is also increasing throughout the world. In the developed economies like USA, UK and Europe, 4G technology is booming. The � uctuating oil price saw its e� ect on the oil producing economies in the Middle East, which in turn made the telecom sector go through a tough time in those countries. The APAC countries are witnessing the LTE take over other technologies even in the non-urban regions. Countries like South Korea have started testing 5G technology, giving hopes of a commercial rollout of the same in coming years. The Latin American countries are trying to overcome the shortfalls in the broadband expansion by improving their � xed line infrastructure and telecom policies.
The telecom industry, therefore, is experiencing the expansion of 4G LTE technology globally with a few developed economies looking towards 5G technology.
..................................................................................................................................................................................................................................................................... PRÉVISIONSITM ANNUAL FORECAST 2017
GLO
BAL
TELE
COM
30


SCOPE
Latest technologies in the three domains namely network, devices, and applications have been driving innovations in Telecom Technologies. This vertical includes trends in the latest technologies like IPv6, Telepresence, WebRTC, 3.75G and beyond, IMS, M2M, VoLTE, MPLS, RCS-e, BYOD, Cloud Computing, MVNO, DTH, and predicts the future trends of these technologies. Li-� technology, a new parameter added this year, is believed to be a major disruptive technology that delivers very high data rates using light as the carrier.
3.75G AND BEYOND (GLOBAL)
Telecom operators around the world are in the process of replacing their legacy networks with high-speed LTE technology. This upgradation is almost complete in major markets such as US, Korea and China. Verizon of US carries 79% of its total data tra� c on 4G LTE network.
The huge increase in demand for data, declining voice revenues and increased penetration of smartphones are some of the primary reasons for increased adoption of LTE services.
There is a growth of 4G in India as operators expand to
TELECOM TECHNOLOGIES
Student TeamKushagra Nagpal | Nilesh Bamotriya
** Regression Analysis
PRÉVISIONFORECASTFOR FY 2016-17
CURRENT STATISTICSFY 2015-16
Global Subscriber Base: 1050 mn
Global Subscriber Base: 1573.22 mn **
new frequency bands to cater to high data consumption by subscribers driven primarily by the demand for social media platforms, mobile commerce and data consuming apps used in dailylife.
Although LTE adoption is on the rise, the 3G technologies are not going to be phased out, anytime soon and hence operators have to maintain two networks simultaneously and support interoperability, which translates intohigh cost. But as operators focus on su� cing the data requirements, 3.75G and Beyond technology will continue to expand.
In� uencing Factors
Increased Data consumption by users. Availability of high-end feature-rich a� ordable smartphones Solutions easily available for technology upgrade
TELEPRESENCE (GLOBAL)
Telepresence is a technology, which provides e� ective ways of communication and increased customer interactions without having to travel long distances. It can accelerate the speed of business and thus increase revenues for globally integrated enterprises. It also provides meaningful interactions for employee recruitment and gives new options for emergency response.
There are lot of companies in the market already providing their Telepresence products like CISCO, Polycom’s Immersive Telepresence, Array Telepresence’s patented Imaging System ‘Equal-I technology’ and DVE Telepresence. As there is a paradigm shift from
32

hardware-centered to software-centric solutions and the increasing need to curb infrastructure spending, there is a growth of telepresence technology.
The Telepresence equipment market may be a� ected by high initial capital investment, di� culty in setting up dedicated Telepresence sessions and the competitive cloud-based video service o� erings, but it is forecasted to grow globally due to increased use of Telepresence equipment in conducting telemedicine consulting.
In� uencing Factors
Availability of Telepresence equipment Shift towards software based solutions Use of Telepresence for telemedicine consulting
IP MULTIMEDIA SUBSYSTEM (IMS)
IP multimedia System has been developed by 3GPP for delivering multimedia services to mobile users. It enables a telecom operator to serve the latest interactive and interoperable services cost-e� ectively, while retaining the � exibility of the Internet. With the adoption of IMS by other industry sectors, there is the potential of a mass market that will bring substantial economies of scale and will provide a� ordable broadband wireless access regardless of how and where users connect to the internet. This service will work seamlessly as users move between di� erent accesses like LTE and Wi-Fi.
Some of the business applications where IMS can be used by operators are Push-to services, such as Push-to-talk, Push-to-view, Push-to-video, Multimedia advertising, Web/Audio/Video Conferencing and Full duplex video telephony. RJio in India has launched its own apps catering to a wide range of services from voice calling, VoD and mobile money. This is an important technology for operators to retain the voice and messaging business and stay relevant to their customers in the lopsided OTT vsTelco battle.
In� uencing Factors
Cost-e� cient and innovative approach for Telecom operators IMS enables Telcos to o� er “OTT” like services. More � exible and easy to use communication services for customers
MVNO (GLOBAL)
Despite facing sti� competition, MVNO’s have managed to survive and become successful especially in developed nations of Europe and North America. The developing nations such as India are now starting to see more virtual operators with the regulators approving
of the same. This development is interesting as during the same time, the DoT has allowed spectrum trading, opening the door for players who wanted to exit. With the MVNO lisense these players can o� er services without a high cost of spectrum acquisition, network roll-out and operations.
They have helped stimulate competition in the market by launching innovative tari� s and services besides attracting niche consumer segments. The opportunities in MVNO business is di� erent according to the geographical region, competition and the telecom policies of that nation. New startup MVNO’s are investing more on online distribution and social media marketing for their visibility.
The EMC researchers have predicted that as wireless services develop so will the availability of niche MVNO application. In future subscribers can use multiple network operators means multiple MVNO plus main network operator. In this way, each MVNO and network operator could focus on their own market and can expand their target segment.
In� uencing Factors
Pressures of a highly competitive reseller market Innovative Business Models are reshaping the Communications Sector The potential of new types of MVNOs to drive innovation Regulatory approval for MVNO in developing countries
WebRTC
The businesses are now more dynamic and thus require more � exible and e� cient technology to deliver content. WebRTC is a standard for enabling web browsers with real-time communication capabilities. It seamlessly embeds multimedia capabilities, enabling interactive communication in a browser environment. WebRTC accelerates time-to-market and curtails costs by e� ciently extending enterprise communication services to any browser-enabled device – smartphone, tablet, or PC. It further reduces IT expenses by containing client licensing fees, quali� cation e� orts and deployment costs. It also negates the requirement of dedicated hardware and software.
WebRTC adoption is increasing at a rapid rate. Giants like Microsoft and Apple have announced support to WebRTC completion and adoption in browsers. Support for videocodecs like H.264, V8 and V9 is still under development. In video conferencing front, Polycom and Avaya have added WebRTC services. WebRTC will continue to gain prominence when it comes to
..................................................................................................................................................................................................................................................................... PRÉVISIONSITM ANNUAL FORECAST 2017
TELECOM
TECHN
OLO
GIES
33

TELE
COM
TEC
HN
OLO
GIE
S
specially designed to use communication beyond voice and SMS. Now a days instant messaging, � le sharing and live video services are very popular. RCS, on one hand, will ensure that operators’ services retain relevance for consumers and on another side will open up new revenue streams for operators and help them to monetize on the large customer base.
In� uencing Factors
Increasing use of OTT Voice Calling and group calling Availability of RCS o� erings without IMS core
MPLS (GLOBAL)
Multi-Protocol Label Switching has received a broad market acceptance and is widely used by service providers and enterprises. MPLS plays a very vital role providing a secure way to connect various cloud-based applications.
MPLS o� ers the dual bene� ts of excellent performance at low cost and � exibility. MPLS bene� ts include more bandwidth at a relatively lower cost and faster provisioning. Most companies use apps speci� c to their organisation inaddition to cloud–based ones such as Salesforce, Microsoft 365 etc. With traditional WAN architecture, these cloud apps will su� er from low QoS whereas with MPLS VPN architecture, the corporate apps su� er. So, there is a move towards hybrid WAN. This trend can serve as a restrainer for MPLS growth.
Convergence of video, voice and data have further encouraged growth of MPLS market. The markets are threatened by new technologies such as SD-WAN.Although it will take a long time to a� ect the market signi� cantly.
In� uencing Factors
Increasing demand for convergence Secure services at low cost Adoption of hybrid WAN can be a restrainer
DTH (GLOBAL)
DTH a satellite-based distribution system for television and is growing prominently world over. Although the DTH market o� ers two modes of DTH signal
delivering real-time content in the most cost-e� ective manner.
In� uencing Factors
Lower upfront cost and lower operational costs Increased adoption by major players across mobile PC and enterprise equipment domains
BYOD (GLOBAL)
Mobility has moved to the top spot of any IT enterprise strategy. BYOD enables an organization to allow its employees to work on the device and place they choose - accessing corporate email on their devices like laptops and notebooks. It allow enterprises to increase employee satisfaction, increase productivity and save cost.
There are a few challenges with it. Security is one of the key pain points for several organizations. Other being the risk associated with data privacy and loss of information due to device theft. Strict policy controls can help minimize risk and protect sensitive data of company to avoid the misuse of BYOD.
BYOD adoption is increasing gradually and is becoming a requirement more than a privilege. The small organizations are leveraging the bene� ts and saving huge costs by BYOD strategy implementation. The plethora of mobile applications and cloud resources is further exemplifying the advantage of BYOD and improving collaboration, shared tasks, information repositories and better communication in the organization.
In� uencing Factors
Explosive growth of mobile devices Demand for High � exibility Reduced costs for company Increased productivity
RCS-e
The dominance of OTT services is impacting the operators severely. Rapid dip in SMS and voice call volume is a perfect example of it. Rich Communication Services is essentially enhanced SMS and MMS. It serves as an option for operators to re-capture market share. Some RCS vendors have RCS o� erings without the need for an IMS core. This is signi� cant especially in the case of developing countries, as most telcos there have not deployed IMS yet.
RCS market is increasing signi� cantly and also has a tremendous potential to grow in the future. RCS is
** Regression Analysis
PRÉVISION FORECASTFOR FY 2016-17
CURRENT STATISTICSFY 2015-16
Subscriber Base: 222.1 mn
Subscriber Base: 235.6 mn**
..................................................................................................................................................................................................................................................................... PRÉVISIONSITM ANNUAL FORECAST 2017
34

transmission the C-band and Ku-band, the latter is the dominant mode. For the Ku-band transmission, the DTH service providers have to lease the Ku-band transponders from the satellite. And so, the availability of satellite bandwidth is one of the growth drivers.
Compared to cable, DTH o� ers high-de� nition video quality, reliable signal availability and much needed signal security.
Cable was dominant analog technology which is now overpowered by DTH and other technologies. With Governments mandating digitization, one of the gainers is the DTH industry. Countries like China, India and USA will continue to be top the charts in terms of the number of subscribers and the number of digital subscribers. The governments will be taking e� orts towards digitization especially in the countries from the sub-Saharan region. Popularity and availability of Ultra-HD TVs can be another growth driver for DTH. The availability and popularity of OTT VoD apps can constrain the growth of DTH industry. Some DTH players have been proactive in o� ering their own “OTT-like” apps in an attempt to arrest this trend. With proposed launch of satellites across the globe such as Asiasat, Thaicom, Measat, INSAT etc, the industry will witness availability of required bandwidth for its growth.
In� uencing Factors
Large � at panel TV market size High demand for HD/UHD content worldwide Availability of satellite bandwidth Government mandate for digitization OTT apps can serve as a restrainer
IPv6 (GLOBAL)
IPv6 being a potent successor of IPv4, is aimed at addressing the most anticipated issue of IPv4 address exhaustion. Eliminating the need for DHCP, IPv6 also comes with enhanced security with a built in encryption and better performance.
In the worldwide adoption of IPv6, Belgium is leading with a whopping 44.29% adoption rate followed by USA (29.14%) and Switzerland (25.82%). India has also started rolling out IPv6 overseen by IRINN with an adoption rate of 1.6%. Across the world, Government have mandated the shift from IPV4 to IPV6. The top service providers for IPv6 in India are Reliance-Infotel, Set R4G TRAIL and Idea Cellular Limited whereas Comcast, AT&T and Virtua are leading the global market as service providers for IPv6.
Pv6 Adoption Rate (%)
According to Google, 8.94% of users across the globe access their services via IPv6. With this widespread implementation and the need to cater to the global internet subscriber base having a penetration rate of 46.1%, the IPv6 global adoption rate is expected to shoot up in coming years. But the biggest concern in implementation is migration. IPv4 and IPv6 are not interoperable and this might a� ect the adoption rate.
In� uencing Factors
Increased capacity E� cient routing Government mandate Improved Security Support for new services
VoLTE (GLOBAL)
Voice Over LTE or VoLTE enables operators to transmit voice services using the data network. It chops up voice calls into packets for e� cient transmission. LTE brings to the table features like HD Voice Call, Video Call, instant messaging, location based services and IP-based voice call which look much more attractive when compared with current OTT o� erings. With IMS- RCS combination as the backbone for VoLTE there are endless possibilities to what telcos can o� er to their customers.
The key bene� t of using VoLTE is that it supports high-quality calls with lower latency and the connection set-up is twice as much faster than 2G or 3G. With LTE deployment in 800 MHz, telcos can o� er their customers VoLTE across a wider coverage area and with the added feature of switching from VoLTEto 2G or 3G they can ensure call continuity while reducing battery consumption. One of the downsides of VoLTE is that the additional investment on a network is high. But the high demand for rich content with higher data rate, uni� ed communication are su� cient to negate this issue. Another restrainer was the availability of a� ordable VoLTE compliant smart phones. This has been overcome to some extent with increasing number of smartphones shipments.
100908070605040302010
0
Belgium
44.29
29.14
1.6
25.82
USA Switzerland India
IPv6 Adoption Rate (%)
..................................................................................................................................................................................................................................................................... PRÉVISIONSITM ANNUAL FORECAST 2017
TELECOM
TECHN
OLO
GIES
35

CLOUD COMPUTING (GLOBAL)
Cloud computing is an on-demand ubiquitous network with a shared pool of resources that requires minimal management e� orts and service provider interactions. With the advent of this technology, users can tap into this multidimensional realm which boasts a vast number of applications easily accessible to the users anytime and anywhere. Reduced capital expenditure and increased � exibility have resulted in the adoption of this technology worldwide.
End of 2015 saw cloud computing having a global market size of $175 bn dollars with a 14.4 % growth rate which clearly demonstrates that how companies are eagerly moving towards cloud-based approach. 90% businesses in U.K are using at least one cloud service which goes to show the power of cloud computing. Data security and Government regulations are two major concerns of cloud-based technology. As the data is shared over anetwork having multiple users and is stored on remote servers, there is a concern over security and data leakage. But despite its drawback, cloud computing is expected to bring a revolution in the � eld of technology because of its � exibility, increased collaboration and encouragement of work-from-home.
In� uencing Factors
Improved Business Agility Reduced Capital Expenditure Energy E� ciency Increased end user productivity and collaboration
M2M (GLOBAL)
Machine to Machine communication has enabled organizations in providing better products with increased quality of service and lowered cost because of process automation. This technology � nds its importance in multiple � elds like remote control, tra� c control, warehouse management, robotics, � eet management, supply chain management and others. This technology has also proven to be cost e� ective since it uses economical components for its functioning like sensors, RFID, high-speed data network etc. M2M is playing an important role in enabling IoT functions. It is becoming one of the important parts of
In� uencing Factors
High spectral e� ciency Demand for uni� ed communication and rich content. Availability of a� ordable smartphones
Li-Fi
Light Fidelity Technology or Li-Fi is a bi-directionalhigh-speed VLC technique which runs wireless communications at high speeds using visible light in the ranges of 400-800 Terahertz (THz). As envisioned by Harald Hass, Li-Fi uses Light Emitting Diodes or LED which act as wireless routers enabling data transfer rate up to 224 gigabits per second. Another important aspect of LED’s is their cost-e� ectiveness.
Li-Fi is a technology which might prove to a strong contender to Wi-Fi, the primary reason being that it can transmit 10Mbits/s Ethernet link under a mile.
Pilot deployment of Li-Fi in Tallinn, Estonia has seen data transmission at 1GB/s which is 100 times faster than Wi-Fi. It is a major contender in the process of harnessing the power of internet in delivering citizen-centric governance while cutting down on the cost of network infrastructure. Li-Fi will be viable for IoT and is expected to boost 5G and it will also � nd applicationin areas which are electromagnetic sensitive e.g. aircraft cabins, hospitals etc. It is much more secure compared to Wi-Fi. The drawback of this technology is that it cannot pass through walls and for full connectivity LED bulbs are required to be placed throughout the premise and this will be a constraint when compared with public Wi-Fi networks.
In� uencing Factors:
High Speed connectivity required Cost e� ective as a result of LEDs Enhanced Security Longer range as compared to Wi-Fi
400350300250200150100
500
Wi-Fi
328
1 0.8
Li-Fi(950 Mbps)
Power Consumption (in mW) per Mbps Wi-Fi vs Li-Fi
Li-Fi(1900 Mbps)
PRÉVISION FORECASTFOR FY 2016-17
CURRENT STATISTICSFY 2015-16
Global Market Size: $175 bn
Global Market Size: $201.55 bn **
..................................................................................................................................................................................................................................................................... PRÉVISIONSITM ANNUAL FORECAST 2017
** Regression Analysis
TELE
COM
TEC
HN
OLO
GIE
S
36

telecom business because of the enablers like coverage provisioning, decreasing costs, wide range and high reliability.
Global data shows that there are 600 mn M2M connections as of 2015 with a growth rate of 20%. This goes on to prove the massive potential M2M has across sectors and with increasing hunger for high connectivity M2M will � nd its extensive use in 5G networks. There are a number of factors that a� ect M2M in an adverse way, one of them being data security which is a huge concern. Moreover, governance and standardization are notable issues which M2M is facing. In� uencing Factors
Government-driven technology Ubiquitous connectivity Standardisation can be the key restrainer
CONCLUSION
The need for tomorrow’s technology at yesterday’s price has been the driving factor for innovation in the � eld of telecom technologies. With an increased hunger of reliable, secure and high-speed connections, new technologies like LTE have successfully captured the market. Next generation alternatives like IPv6 and Cloud computing are successfully penetrating the global market. The advent of newer technologies is helping telecom operators reduce their CAPEX. With an exponential increase in the number of smart devices and the ever increasing need for higher data rates, these technologies will shape the future of the telecom industry and strengthen the telecom operators to face the sti� competition from OTT players.
..................................................................................................................................................................................................................................................................... PRÉVISIONSITM ANNUAL FORECAST 2017
TELECOM
TECHN
OLO
GIES
37

..................................................................................................................................................................................................................................................................... PRÉVISIONSITM ANNUAL FORECAST 2017
..................................................................................................................................................................................................................................................................... PRÉVISIONSITM ANNUAL FORECAST 2017
38


SCOPE
Due to rapid changes in the technologies that form the base for Telecom Software, this sector has been able to achieve an exponential growth. A paradigm shift towards contextualization and personalization of services has made telecom software industry, a storehouse of opportunities. With the advent of various parameters in network strategies, which includes better coverage, quality and capacity, the overall network e� ciency has greatly improved. Operators are shifting from the hardware-based network equipment to software-based network functions which make Network Management more e� cient as well as e� ective helping the contributors of the ecosystem ecosystem gain competitive advantage.
Mergers and Acquisitions have led to a considerable growth rate in the proliferation of the CRM Softwares. Adoption of SDN and BI will contribute positively to the pro� t margins of TSP as these can be e� ectively utilized to optimize costs and enable e� ective and � exible utilization of the network.
CUSTOMER RELATIONSHIP MANAGEMENT
Growth in Customer Relationship Management continued as the overall market grew at 12.3%, from
TELECOM SOFTWARE
Student TeamSurya Nair | Prashant Tandekar | Nikhilesh Harde
* Trend Analysis
$23.1bn in 2014 to $26.3 bn in 2015. The top � ve market players were the same except Adobe replacing IBM. Salesforce remained at the top with 19.7% market share, SAP at second position with 10.2% market share. Oracle’s sales decreased by 3.4%, still remained at third position with 7.8% share, followed by Microsoft with 4.3% share. Adobe which has a market share of 3.6% grew the fastest this year at 26.9% and replaced IBM at � fth position.
There are four key factors that are driving the increase in demand of CRM. Digital technologies like mobile computing, cloud computing, in-memory technologies and social media o� er companies access to cost e� ective CRMs. Secondly, with the growth of business analytics, companies can now track what consumers need and products can be designed accordingly. The third factor that is majorly going to impact CRM is IoT , where di� erent devices will help companies capture customer data and convert them into useful information. Last but not the least, the increase in the use of CRM in Asia-Paci� c regions of China and India shall contribute majorly to the growth, proliferation and adoption of CRM.
The SaaS market recorded a growth of 27%; almost double the growth rate observed in the CRM market. North America is still at the top in SaaS market due to the widespread use of SaaS apps in HCM, emails, o� ce suites and others. Europe is the second biggest SaaS market, mainly because of Western European countries such as UK and Ireland. Major SaaS investments have been done in these countries in 2015. Asia-Paci� c is still the fastest growing market with 21.9% growth rate, followed by Greater China with 18.4% growth rate.
PRÉVISION FORECAST FOR CY 2016
CURRENT STATISTICSCY 2015
Global CRM Market: $26.3 bn
Expected to reach:$28.9 bn *
40

delivery models, data integration requirements, and dependence on management technologies.
The development of cloud based infrastructure o� ers greater e� ciency, scalability, and agility when compared with conventional technologies. The new role of innovation surrounding the Internet of Things (IoT) and transition to cloud services is helping to push AIM spending toward event-driven analysis and processes.
IBM held its position at the top with a growth of 12.8 % in 2015. Oracle, Microsoft, salesforce, and TIBCO software are the other major players in this business segment. It additionally has an expansive arrangement of service assurance products and strong partnerships with all the major infrastructure suppliers. North America and Western European Markets are the largest adopters of Middleware Integration Markets. Asia Paci� c, Middle East, and Africa are potential markets for AIM.
In� uencing Factors
Multiple delivery models Data integration requirements Dependence on management technologies
Global Application Software & Middleware Revenue Share
MOBILE OPERATING SYSTEM
Increased adoption of public, private and hybrid enterprise cloud services has caused LinkedIn to launch a new update. This update will equip sales professionals to connect with prospective customers via updated mobile apps that are in sync with Salesforce and Google Mail. Adoption of cloud services among common people has resulted in reciprocated growth for PC shipments. It can therefore be concluded that SaaS-based CRM is de� nitely going to experience high growth rates in near future.
In� uencing Factors
Increase in the use of digital technologies and mobile social media Increase in the ability of IT companies to predict consumer demands and design products accordingly Internet of things will change the business models having customer engagement Growth in the Asia-Paci� c region, especially India and China
Worldwide market players Share by Revenue, 2015
MIDDLEWARE INTEGRATION
The market revenue for Application Infrastructure and Middleware (AIM software) in the year 2015 totaled to $ 23.9 bn. The market grew at the rate of 7.80% as compared to 2014. This growth was observed to be majorly driven by growth in the platform as a service (PaaS) segment. Also, the investments in broadening integration capabilities through the utilization of PaaS (Platform as a Service) o� erings fuelled the growth. iPaaS and aPaaS markets grew 55% and 40% respectively.
The key factors driving the market were multiple
54%
20%
10%
8%
4%4%
Salesforce
SAP
Oracle
Microsoft
Adobe
Others
* Trend Analysis
PRÉVISION FORECAST FOR CY 2016
CURRENT STATISTICSCY 2015
Global (AIM) Market: $23.9 bn
Expected to reach:$24.05 bn *
IBM
Oracle
Microsoft
Salesforce
Tibco Software
Others
51.1
25.2
13.3
4.74.2
2.5
* Trend Analysis
Mobile Shipments
by Operating system (in mn)
Android
CURRENT STATISTICS
CY 2015
PRÉVISIONFORECAST
FOR CY 2016
iOS
Windows
Others
1186.441
199.173
37.255
10.030
1370.056
229.998
43.0212
11.583
Total 1432.9 1654.66*
..................................................................................................................................................................................................................................................................... PRÉVISIONSITM ANNUAL FORECAST 2017
TELECOM
SOFTW
ARE
41

Desktop OS
OSS/BSS
** Regression Analysis
The global OSS/BSS market generated revenues of $23.95 bn in the year 2015, up from $22.5 bn generated in 2014. This increase is due to big data adoption, convergent billing systems and further development in LTE deployments that include development in the spectrum, devices, services, network coverage etc. Amdocs, Ericsson, Huawei, Nokia Networks, Net cracker, Oracle, Redknee are the key players in OSS/BSS market.OSS BSS has been experiencing continuous change over past few years due to new emerging technological demands. Greater market concentration among suppliers of Telecom Operations Management Systems (TOMS) has caused vendors to progressively supplement their product o� erings. A key trend for this market is the demand for customized OSS-BSS software. The revenue generated is mainly from the deployment of OSS-BSS platforms and their applications in business systems of telecom operators. Cloud billing services have come up with new features like predictive maintenance of software and ease of installation. Operators are changing their business model from technology-centric to a customer-centric one. As a result, the adoption of customised OSS-BSS softwares is helping service providers in providing users with bundled o� erings thereby enhancing their customer experience.
Adoption of big data applications and virtualization by the operators has increasingly led to greater usage of network management services and virtualisation of vital network functions. Operators are moving towards Cloud. NFV and SDN have led to easy management of OSS/BSS systems. This has helped some operators gain a competitive advantage over competitors.
iPhone
Android
Windows + Others
43%
40%
17%
Windows
Mac OS
Others91%
5%4%
PRÉVISION FORECAST FOR CY 2016
CURRENT STATISTICSCY 2015
Global OSS/BSS Market: $23.95 bn
Expected to reach:$ 26.75 bn **
The global shipment of the smartphone market reached 1440 mn units and grew at the rate of 14.40% in 2015. The growth continued in the � rst quarter of 2016 where in 349.2 mn units were sold with a growth rate of 3.9% over the � rst quarter of 2015. In the � rst quarter of 2016, android continued to be the top player with 84.1%, IOS remained at second position with 14.8% market share. Windows and blackberry’s market share decreased to 0.7% and 0.2% respectively.
Because of the smaller app ecosystem of Windows and Blackberry, the level of adoption of these OSS remains low with users moving to Android and IOS. In quarter one of 2016, among the mobile manufacturers, Samsung led the market with 23.2% market shares. Apple with IOS remained at the second position with 14.8% market share. Three Chinese brands, Huawei, Oppo and Xiaomi together held around 17% of the market shares.
India is in the limelight for manufacturers in the smartphone segment. While other markets of North America, Europe and some regions of Asia-Paci� c are on the verge of reaching a state of saturation, India still holds a promising future for smartphone penetration. With more and more companies entering the Indian Market with phones under $250, the growth of smartphones is set to increase in India. These brands are selling products with high-end features at low prices. The launch of Reliance Jio and its cheap options of LYF 4G phones is said to increase smartphone sales.
In� uencing Factors
A� ordable feature-rich smart phones Evolution of mobile networks with high speed connectivity Increased dependence of people on smart devices because of user friendly features Mobile operating systems with more frequent � rmware updates
Mobile and Tablet OS
..................................................................................................................................................................................................................................................................... PRÉVISIONSITM ANNUAL FORECAST 2017
TELE
COM
SO
FTW
ARE
42

providers (CSPs), such as the total cost of ownership (TCO) and operational e� ciency The use of data analytics to improve the solutions given to customers on real time basis
Service Assurance Revenue Sales
SERVICE DELEIVERY PLATFORM
The major players in the Service Delivery Platform market are Ericsson, HP, Huawei, Open Cloud and Oracle.Ericsson and Huawei share the SDP revenue market as leaders.
The overall SDP market has increased due to improvement in monetization of the subscriber data with many operators following this trend. The recent development states that there are more than 500 4G operators with 4G connections approaching 570 mn. Further, increased data consumption, impact of LTE on Subscriber Data Management (SDM), Mobile Content Management and Delivery (CMD), Policy Management (PM), and Telecom Application Servers (TAS) for mobile data and VOLTE services are also the reasons for the increase in SDP market.
Nevertheless, challenges of the integration remain to be a hindrance to SDP investments. Some of these challenges are network complexity existing in current IT systems and network infrastructure.
Operators are looking beyond traditional Application Programming Interface and are exhibiting their capabilities on missed call alerts, authorization and authentication and subscriber analytics.
Also, the expenditure in SDP market will move from infrastructure to systems for digital services in near future.
6%
12%5%
8%
5% IBM
HP
JDS Uniphase
Netscount
PRÉVISION FORECAST FOR CY 2016
CURRENT STATISTICSCY 2015
Global SDP Market:$7.4 bn
Expected to reach:$9.33 bn *
* Trend Analysis
In� uencing Factors
Increased adoption of convergent billing systems. LTE Network Development: Spectrum, Devices, Services, Network coverage Integration of Big Data Solutions in OSS-BSS systems Adoption of network automation and customer self-care portals
SERVICE ASSURANCE
Service Assurance market registered a CAGR of 7.2% in 2015. with an overall revenue of $3.42 bn. It is expected to generate revenues of $3.62 bn by 2016.The core players in global telecom service assurance market are CA Technologies, Accenture, HP, Ericsson, JDSU, NSN, and IBM Corporation. These players are major forces driving this market and are in the process of making high investments in an attempt to maximize their gains. Vast amount of subscriber data is analysed in real time which is helping in issue analysis and providing resolutions to customers on the go. Service assurance market is now moving from network focused solutions to service and experience oriented solutions with customer experience being given the highest preference.
On the technical front, service assurance market is backed by the LTE rollout, RAN optimisation, VoLTE and VoWiFi for the emerging markets with CSP spending more on service assurance systems.The major trend in the foreseeable future is impact of IP virtualization on the service assurance market. Other trends such as the change from legacy systems to mobile solutions are set to generate huge revenues and would be an attractive segment in the near future.
In� uencing Factors
LTE roll-out in emerging markets, and new services such as VoLTE and VoWiFi, driving growth in CSP spending on service assurance systems SA evolving from the use of network-focused solutions to service- and experience-oriented solutions Vendors expanded into adjacent segments, such as RAN optimization, and some vendors started unifying their assurance solutions to address the challenges faced by communications service
PRÉVISION FORECAST FOR CY 2016
CURRENT STATISTICSCY 2015
Global SA Market: $3.4 bn
Expected to reach:$3.66 bn *
* Trend Analysis
..................................................................................................................................................................................................................................................................... PRÉVISIONSITM ANNUAL FORECAST 2017
TELECOM
SOFTW
ARE
43

In� uencing Factors
Improvement in monetization of the subscriber data Growing number of LTE subscribers and connected smart devices The partnership of operators with over-the-top (OTT) providers
SERVICE FULFILLMENT
Service ful� llment registered a CAGR of 9.8% for 2015 and is expected to generate revenue of $3.82 bn by 2016. This growth rate is attributed to the e� orts of Service ful� llment industry � rstly, through automation of all its functions for faster delivery; and secondly by realtime analysis of subscriber data for insights into customer preferences. Both these functions are helping CSP’s to decrease the time to market implementations, optimize cost and increase automated solution delivery. These functions are helping to reduce high fallout rate of customer services and contributing to business growth.
On the technical front we see that the industry is migrating to next-generations networks. These NGNs have taken over the traditional legacy network architectures providing discrete networks that deliver services on common, shared IP infrastructure using DSL, VOIP, Ethernet and VPN. Moving onto the next level, the service providers are looking for service delivery over the cloud and are adopting the SaaS delivery model to get an end to end view of the network. North America is expected to have the largest market size for service ful� llment, while MEA and APAC are expected to experience increased market traction during the forecast period.
In� uencing Factors
CSP’s spending on systems delivered on a Cloud based SaaS delivery model Pricing models for service ful� llment: changing to meet the needs of next-generation systems Major forces driving this market are the ongoing increasing operational cost and high scale investment in operations support system
BUSINESS INTELLIGENCE
Business Intelligence market registered a CAGR of 8.4% for 2015 with an overall revenue of $17.90 bn.It is expected to generate revenue of $26.72 bn in 2016. The current market trends associated with Business intelligence Software are: rising competition, popularity of the cloud delivery model and data proliferation model. Along with this, the rise in the number of users and their demand for customization is another important factor for the growth in this sector. The transformation of data warehouse as a repository with advancements in core capabilities of hardware and software have helped organization in the process of data cleansing. With this feature BI tools are now rich in there functionalities. These tools were non-existing few years back.The forces driving BI market include a combination of analytics tools, data and algorithms sourced from analytics marketplaces. These forces play an important role in improving deployments and compensating the scarcity of data. Trends in BI include Free data visualization as an o� ering by Microsoft Power BI and adoption of mobile BI by smaller companies.
Top players in BI tools market are DundasBI, Board, Microsoft Sharepoint and Halo.The top BI software products include Sisense, Informet, Teamgate, Necto. These prominent players are also seen acquiring the smaller or local market players in order to maintain their competitive edge within the BI market.
In� uencing Factors
Shifting interests in Visual BI, Mobile BI solutions, and increasing competition are some other factors contributing to market expansion & value creation Data Integration with transformation from legacy systems Cloud data and cloud analytics with core BI Integrating Big Data & IoT to BI
NETWORK MANAGEMENT SYSTEMS
PRÉVISION FORECAST FOR CY 2016
CURRENT STATISTICSCY 2015
Global SF Market:$ 3.82 bn
Expected to reach:$4.23 bn *
* Trend Analysis
PRÉVISION FORECAST FOR CY 2016
CURRENT STATISTICSCY 2015
Global BI Market: $16.06 bn
Expected to reach:$17.3 bn *
* Trend Analysis
PRÉVISION FORECAST FOR CY 2016
CURRENT STATISTICSCY 2015
Global NMS Market: $4.8 bn
Expected to reach:$5.08 bn *
* Trend Analysis
..................................................................................................................................................................................................................................................................... PRÉVISIONSITM ANNUAL FORECAST 2017
TELE
COM
SO
FTW
ARE
44

mobile app revenue while Google’s app store covered around 36% of direct revenue. But the number of apps downloaded showed something else, obviously because of the coverage of android handsets in the market, it captured 60% of the install volumes while Apple’s app downloaded captured only 15%. This shows that the people who are using Apple devices spend more on apps as comparison to Android users.
Most of the websites and sellers have developed their apps, and research shows that people prefer using these apps rather than mobile browsers. Users spend a lot of time with social networking and utility apps such as Uber, mobile money etc. Popular music apps such as Spotify, Gaaana, Savan, etc. are also trending. Games like Asphalt 8 and Candy crush are still popular and with the introduction of Pokemon Go, the number of people downloading games is set to increase. When it comes to Indian market, most downloaded category were shopping apps, followed by Entertainment and Games.
In� uencing Factors
Increased adoption and usage of social networking and utility apps High speed internet services and innovation in telecom technologies Faster and robust mobile devices to support heavy apps
Popular app install categories India, 2015
Y-O-Y GROWTH ON EXISTING
NMS is expected to generate revenues of $5.08 in 2016 showing year on year growth of $4.88 bn from $4.7 bn in 2015.The growth in revenues was primarily due to the data centre interconnectivity and higher spending of CSPs on LTE network deployments.
The key players in the NMS market are Ericsson, Huawei, Nokia Solutions and Networks, Alcatel-Lucent, Cisco Systems and Samsung. These six players accounted for 80% of revenue in this highly consolidated market. Huawei Technologies o� ers a broad portfolio that caters to all sub-segments and it is the market leader in all of them except mobile, where Ericsson leads.
Recent developments in SDN suggest that, hardware switches will become commoditized eventually, which is why SDN has been seen as an existential threat to Cisco. However, SDN adoption has largely been con� ned to cloud service providers, Telcos on the other hand have shown lower levels of adoption.
Deployments of SON for 3G /4G optimization by operators have led to an increase in the demand for automated network management systems. The optimization of business operations through network management tools with the help of small and medium enterprises will be driving the opportunities and technological growth of the industry.
In� uencing Factors
Communications service providers (CSPs) increased spending on LTE network deployments Data centre interconnectivity Increased adoption of SDN/NFV
MOBILE APPLICATIONS
In 2015, total number of mobile applications released increased to 156 bn from 138.8 bn in 2014 and it generated a direct revenue of $34.2 bn. The growth rate of number of app downloaded was 12.39% which decreased from 36.08% from 2014. The decrease in the growth rate is basically due to market maturation. Interestingly the number of apps people use daily remained at 27% while the number of hours they spent on phone increased to 40 hours.
Apple’s app store captured around 58% of direct
PRÉVISION FORECAST FOR CY 2016
CURRENT STATISTICSCY 2015
Global Mobile Applications Downloaded: 179.62 bn
Global Mobile Applications Downloaded:205.29 bn *
* Trend Analysis
Shopping
Entertainment
Games
Lifestyle
Communication
Music
Travel
Others
6%
25%
11%
16%
5%
15%
12%
10%
50
40
30
20
10
0
2013 2014
App Users
2015
..................................................................................................................................................................................................................................................................... PRÉVISIONSITM ANNUAL FORECAST 2017
TELECOM
SOFTW
ARE
45
CONCLUSION
The changes in telecom software market are evident due to the upcoming big data solutions as well big data solutions and growth in CSP’s infrastructure. The enterprises within the industry now have to completely adapt themselves to software-driven environment from
..................................................................................................................................................................................................................................................................... PRÉVISIONSITM ANNUAL FORECAST 2017
TELE
COM
SO
FTW
ARE
hardware-driven environment in order to have optimum utilisation of their existing resources. This evidently will bring in a lot of revenue for Telecom Software segment. The customer-driven era emphasizes on software development and updation in the � eld of BI. The new deployment in LTE and small cells will further drive the growth of Telecom Software.
46

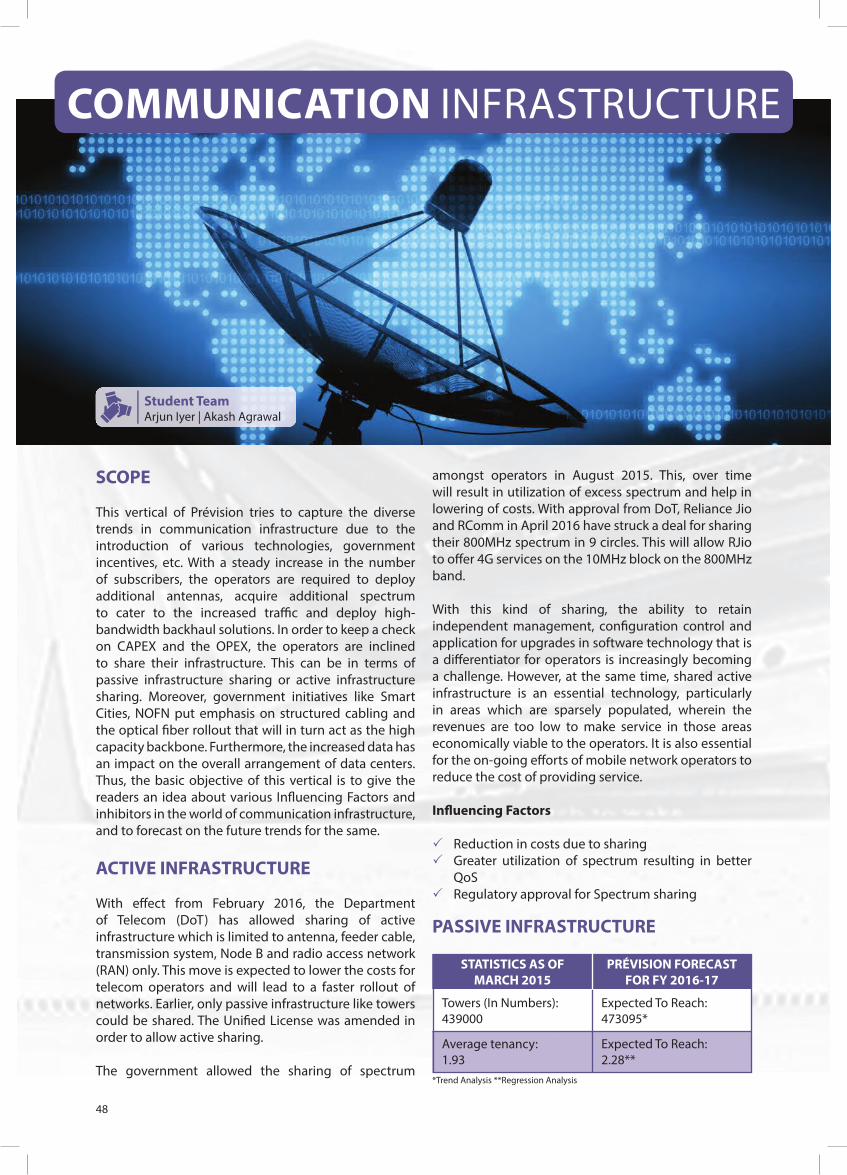
SCOPE
This vertical of Prévision tries to capture the diverse trends in communication infrastructure due to the introduction of various technologies, government incentives, etc. With a steady increase in the number of subscribers, the operators are required to deploy additional antennas, acquire additional spectrum to cater to the increased tra� c and deploy high-bandwidth backhaul solutions. In order to keep a check on CAPEX and the OPEX, the operators are inclined to share their infrastructure. This can be in terms of passive infrastructure sharing or active infrastructure sharing. Moreover, government initiatives like Smart Cities, NOFN put emphasis on structured cabling and the optical � ber rollout that will in turn act as the high capacity backbone. Furthermore, the increased data has an impact on the overall arrangement of data centers. Thus, the basic objective of this vertical is to give the readers an idea about various In� uencing Factors and inhibitors in the world of communication infrastructure, and to forecast on the future trends for the same.
ACTIVE INFRASTRUCTURE
With e� ect from February 2016, the Department of Telecom (DoT) has allowed sharing of active infrastructure which is limited to antenna, feeder cable, transmission system, Node B and radio access network (RAN) only. This move is expected to lower the costs for telecom operators and will lead to a faster rollout of networks. Earlier, only passive infrastructure like towers could be shared. The Uni� ed License was amended in order to allow active sharing.
The government allowed the sharing of spectrum
COMMUNICATION INFRASTRUCTURE
Student TeamArjun Iyer | Akash Agrawal
amongst operators in August 2015. This, over time will result in utilization of excess spectrum and help in lowering of costs. With approval from DoT, Reliance Jio and RComm in April 2016 have struck a deal for sharing their 800MHz spectrum in 9 circles. This will allow RJio to o� er 4G services on the 10MHz block on the 800MHz band.
With this kind of sharing, the ability to retain independent management, con� guration control and application for upgrades in software technology that is a di� erentiator for operators is increasingly becoming a challenge. However, at the same time, shared active infrastructure is an essential technology, particularly in areas which are sparsely populated, wherein the revenues are too low to make service in those areas economically viable to the operators. It is also essential for the on-going e� orts of mobile network operators to reduce the cost of providing service.
In� uencing Factors
Reduction in costs due to sharing Greater utilization of spectrum resulting in better QoS Regulatory approval for Spectrum sharing
PASSIVE INFRASTRUCTURE
PRÉVISION FORECAST FOR FY 2016-17
STATISTICS AS OF MARCH 2015
Towers (In Numbers): 439000
Expected To Reach: 473095*
Average tenancy:1.93
Expected To Reach: 2.28**
*Trend Analysis **Regression Analysis
48
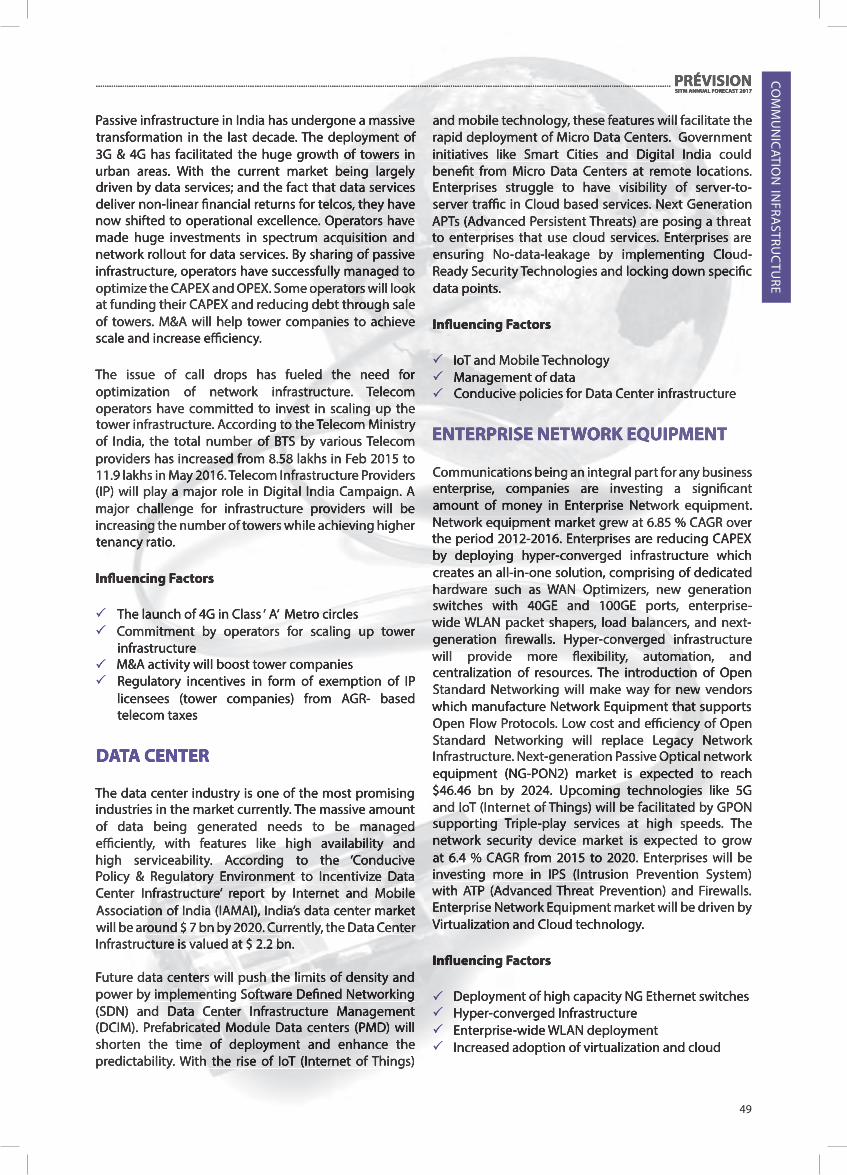
Passive infrastructure in India has undergone a massive transformation in the last decade. The deployment of 3G & 4G has facilitated the huge growth of towers in urban areas. With the current market being largely driven by data services; and the fact that data services deliver non-linear � nancial returns for telcos, they have now shifted to operational excellence. Operators have made huge investments in spectrum acquisition and network rollout for data services. By sharing of passive infrastructure, operators have successfully managed to optimize the CAPEX and OPEX. Some operators will look at funding their CAPEX and reducing debt through sale of towers. M&A will help tower companies to achieve scale and increase e� ciency.
The issue of call drops has fueled the need for optimization of network infrastructure. Telecom operators have committed to invest in scaling up the tower infrastructure. According to the Telecom Ministry of India, the total number of BTS by various Telecom providers has increased from 8.58 lakhs in Feb 2015 to 11.9 lakhs in May 2016. Telecom Infrastructure Providers (IP) will play a major role in Digital India Campaign. A major challenge for infrastructure providers will be increasing the number of towers while achieving higher tenancy ratio.
In� uencing Factors
The launch of 4G in Class ‘ A’ Metro circles Commitment by operators for scaling up tower infrastructure M&A activity will boost tower companies Regulatory incentives in form of exemption of IP licensees (tower companies) from AGR- based telecom taxes
DATA CENTER
The data center industry is one of the most promising industries in the market currently. The massive amount of data being generated needs to be managed e� ciently, with features like high availability and high serviceability. According to the ‘Conducive Policy & Regulatory Environment to Incentivize Data Center Infrastructure’ report by Internet and Mobile Association of India (IAMAI), India’s data center market will be around $ 7 bn by 2020. Currently, the Data Center Infrastructure is valued at $ 2.2 bn.
Future data centers will push the limits of density and power by implementing Software De� ned Networking (SDN) and Data Center Infrastructure Management (DCIM). Prefabricated Module Data centers (PMD) will shorten the time of deployment and enhance the predictability. With the rise of IoT (Internet of Things)
and mobile technology, these features will facilitate the rapid deployment of Micro Data Centers. Government initiatives like Smart Cities and Digital India could bene� t from Micro Data Centers at remote locations. Enterprises struggle to have visibility of server-to-server tra� c in Cloud based services. Next Generation APTs (Advanced Persistent Threats) are posing a threat to enterprises that use cloud services. Enterprises are ensuring No-data-leakage by implementing Cloud-Ready Security Technologies and locking down speci� c data points.
In� uencing Factors
IoT and Mobile Technology Management of data Conducive policies for Data Center infrastructure
ENTERPRISE NETWORK EQUIPMENT
Communications being an integral part for any business enterprise, companies are investing a signi� cant amount of money in Enterprise Network equipment. Network equipment market grew at 6.85 % CAGR over the period 2012-2016. Enterprises are reducing CAPEX by deploying hyper-converged infrastructure which creates an all-in-one solution, comprising of dedicated hardware such as WAN Optimizers, new generation switches with 40GE and 100GE ports, enterprise-wide WLAN packet shapers, load balancers, and next-generation � rewalls. Hyper-converged infrastructure will provide more � exibility, automation, and centralization of resources. The introduction of Open Standard Networking will make way for new vendors which manufacture Network Equipment that supports Open Flow Protocols. Low cost and e� ciency of Open Standard Networking will replace Legacy Network Infrastructure. Next-generation Passive Optical network equipment (NG-PON2) market is expected to reach $46.46 bn by 2024. Upcoming technologies like 5G and IoT (Internet of Things) will be facilitated by GPON supporting Triple-play services at high speeds. The network security device market is expected to grow at 6.4 % CAGR from 2015 to 2020. Enterprises will be investing more in IPS (Intrusion Prevention System) with ATP (Advanced Threat Prevention) and Firewalls. Enterprise Network Equipment market will be driven by Virtualization and Cloud technology.
In� uencing Factors
Deployment of high capacity NG Ethernet switches Hyper-converged Infrastructure Enterprise-wide WLAN deployment Increased adoption of virtualization and cloud
..................................................................................................................................................................................................................................................................... PRÉVISIONSITM ANNUAL FORECAST 2017
COM
MU
NIC
ATION
INFRA
STRUC
TURE
49

COM
MU
NIC
ATIO
N I
NFR
AST
RUC
TURE
GOVERNMENT INCENTIVES
The Government of India provides incentives to the telecom sector with a vision of promoting various policies like infrastructure sharing, Make in India, etc. These incentives can be in the form of tax holiday bene� ts to telecom equipment vendors and infrastructure sharing companies. Revised custom and excise duty will lead to cost bene� ts in key areas like IT hardware, capital goods, defence and textile, among others. There is also the complete exemption of customs duty in MRO (Maintenance, Repair, and Operations) sector. This is a good step, but wouldn’t help until and unless complete service tax is discarded. Also, in order to promote exports, the Indian players who export products are provided interest at a subsidized rate of 3%. The withholding tax rate on the commission has been slashed down to 5% from 10%. Further, the withholding tax for the non-residents without PAN (Permanent Account Number), who previously had to pay a higher withholding tax, has been reduced, providing relief to all telecom players in the industry. Also, the credit on service tax has been allowed to be paid in a phased manner, e� ective from 1st April 2016. With a view of supporting the “Make in India” initiative, various exemptions in BCD (Basic Customs Duty),Countervailing Duty (CVD), Special Additional Duty (SAD) and Excise duty on raw materials, manufacturing and IT and hardware sector are being provided.
In� uencing Factors
Increased exports due to subsidized interest as compared to various duties pertaining imports of parts Increased competition in telecom products manufacturing sector Increased competition with global players Ease of Compliance
GREEN TELECOM
In order to safeguard the environment, some major telecom operators have shifted to green technology. They have taken the initiative and have started to green technology for the towers. It will bene� t the environment as well as help the Network Service provider in building an imperishable network. This switch to green technology is expected to reduce the carbon emissions by 70% in 2018. By optimizing signal strength between network and device, operators will be in a position to reduce power consumption and airwaves emission. A sizeable number of towers operate without diesel with solar rooftops having base capacities of 770 kwp. Systems like free cooling units (FCUs) further help in reducing costs and emissions by
reducing the time required to run the air conditioners in the shelters. Regulatory compliance is being ensured by stringent checks by monitoring agencies. The telecom products, services, and equipment must now be certi� ed by “GREEN PASSPORT” by utilizing the ECR rating and the energy “passport”. To add to this, all service providers have to provide two reports for the carbon emission footprints- one in the month of September and other in the month of May. Sharing of infrastructure is encouraged so as to prevent the operators from setting up towers in close vicinity, thereby reducing power consumption and emissions.By 2020, 75% of rural towers and 33% of urban towers are expected to be hybrid powered and the industry aims at limiting the threshold power consumption for each BTS at 500 W.
In� uencing Factors
Need to lower cost of operations especially in rural areas Use of hybrid fuel and sharing of infrastructure Regulatory push for reduced carbon emissions
OPTICAL FIBER ROLLOUT
The “Digital India” initiative has created a lot of possibilities in India. Under this program, all the 2.5 lakh Gram Panchayats will be connected through optical � ber cable network by 2018. This will be done by using an optimal mix of underground � ber network, radio and satellite links, for providing basic broadband connectivity. The government’s digital push was facing obstacles from the right-of-way scheme. The government has now agreed to let the states implement their part of the scheme on their own. By 2023, the government is also planning to establish a network for the coming era of 5G services and the Internet of Things augmenting the existing base of underground optical � ber in the ring architecture. In addition to the 4G optical backhaul deployment by telcos,the smart cities initiative will provide a boost to the optical � ber rollout in the country. Initiatives such as the one taken by Sterlite Technologies in partnership with Bharti Airtel and Tata Teleservices to deploy massive network-neutral FTTH.The government is determined to build 100 smart cities in the country. The growing demand for data and the booming digital economy point out the need for higher broadband capacities in the country. For e� cient broadband services, we need a
PRÉVISION FORECAST FOR FY 2016-17
CURRENT STATISTICS FOR FY 2015-16
Total Fiber Rollout: 808327 kms
Expected Rollout: 841171.8 kms*
*Trend Analysis
..................................................................................................................................................................................................................................................................... PRÉVISIONSITM ANNUAL FORECAST 2017
50

strong optical � ber network and BharatNet provides the base for this network. This will be a robust and future-oriented network in which there will be a scope for network enhancement. PM Modi in his speech quoted, “Cities in the past were built on river banks. They are now built along highways. But in the future, they will be built based on the availability of optical � ber networks and next-generation infrastructure.’
In� uencing Factors
Increased adoption of 3G/4G and the associated services Increasing bandwidth requirement by new applications, speci� cally video services Deployment of network-neutral FTTH Initiatives under Digital India Scheme Smart Cities initiative
RADIO ACCESS NETWORKSThe current global research on 5G networks brings out a rising need for rework on the Radio Access Network (RAN) architecture beyond the incremental evolution of the current 3GPP LTE. The increased pressure on infrastructure valorization, novel services, usage scenarios and the new classes of tra� c place have put up some new requirements on RAN, particularly in terms of � exibility and recon� gurability. Future radio access networks are thus expected to depart from ‘one system � ts all services’ approach to exploit a broad portfolio of enabling technologies and frequency bands optimally. This will leverage cloud computing technologies and virtualization to adapt execution of logic to speci� c consumer service requirements. It would no longer necessitate the access and networking functions and the corresponding states to be situated in di� erent locations for joint performance optimization.
METIS-II visualizes the overall 5G RAN to operate in a wide range of spectrum bands in order to address the diverse services, for example, considering the frequencies below 6 GHz as most suitable to support mMTC services having high coverage requirements, and spectrum above 6 GHz essential to provide the massive capacity demanded by xMBB applications. Studies have found that large contiguous spectrum bands are preferred for various reasons, especially those related to device complexity. The 5G system will thus be built upon a set of spectrum usage forms such as the use of dedicated licensed spectrum, horizontal sharing of bands along with di� erentiation according to limited spectrum pools, mutual renting and unlicensed use and vertical sharing of bands.
In� uencing Factors
Launch of 4G networks and increased uptake of 3G in developing countries
5G Technology Large range of operating frequencies world over for Broadband Wireless Access ( BWA) Sharing of active infrastructure
STREET LIGHT ANTENNAS
The cellular data tra� c is growing at a rapid rate. Mobile data tra� c is expected to grow at a compound annual growth rate (CAGR) of 53% from 2015 to 2020, reaching 30.6 Exabyte per month by 2020. So, the infrastructure to handle this amount of tra� c must grow too. The telecom companies are now coming up with a concept of street light antennas as street light poles can provide a base for the infrastructure required. ERICSSON has come up with the concept of ZERO SITES, addressing the need of the rapidly growing population. Los Angeles will be the 1st city in the world to install 100 street light antennas along with Philips. These antennas will be fully equipped with the 4G-LTE technologies. The antennas will be connected to a core network via a digital link. In China, there is Fiberglass Street light Antenna cover which supports telecom services. On the same grounds, Indus Towers will be setting up a project management team in consultation with New Delhi Municipal Corporation authority and the telecom operators to set up 3000 street light poles which will be 2G/3G/4G enabled. The primary focus would be on installing an outdoor infrastructure which is weather-proof and has a tamper-proof casing. This project will enable many future energy saving initiatives like Wi-Fi, LED, CCTVs etc. which will help build Delhi as a world class future smart city.
In� uencing Factors
Facilitates the acquirement of sites in dense, urban environments Addresses the increasing needs for improved network coverage It strengthens the base for infrastructure sharing Allows municipalities to generate revenue from site leasing
SUBMARINE AND SATELLITE SYSTEMS
The adoption of high-speed submarine � ber cables of 100 Gbps capacity had started in 2010. Most of the vital submarine cable systems have been upgraded to 100Gbps already and with the 400Gbps technology expected to hit the market by the end of 2017, upgrade activities are expected to boost market growth. Investments in submarine � ber by social networking players and internet & OS companies such as Facebook and Microsoft will further lead to growth in this segment. During the period 2016-2020, the global submarine � ber cable market will grow at a CAGR (Compound
..................................................................................................................................................................................................................................................................... PRÉVISIONSITM ANNUAL FORECAST 2017
COM
MU
NIC
ATION
INFRA
STRUC
TURE
51

Annual Growth Rate) of 5.75%.
What is more likely to be seen is a complementary delivery of terrestrial networks supporting communication with satellites and vice versa. According to a recent research by the IEEE, in densely populated areas with terrestrial networks already deployed, the much-needed synergy to satisfy the growing demand for broadcast and internet on the move is now set to be provided by satellites. Rather than competing against established terrestrial networks, there’s a need for a hybrid solution to provide and enhance connectivity. Imagine a user who can switch to satellite connectivity whenever terrestrial internet access is weak in certain areas.
The need for a synergetic relationship in delivering in-� ight connectivity for densely populated areas, which necessitates the delivery of an e� cient satellite-powered in� ight broadband service to provide online internet access to airborne passengers and also the ground-based infrastructure to enhance the e� ciency, bandwidth and cost-e� ectiveness of providing this connectivity, is another example.
In� uencing Factors
Need for greater capacity submarine cables Growth in Bandwidth consumption Investments by non-telecom players Need for a hybrid solution for enhanced connectivity
VSAT
The continuous transformation in communication technologies has led to the implementation of VSAT (Very Small Aperture Terminal) networks which support a lot of diversi� ed applications. According to o� cial
PRÉVISION FORECAST FOR FY 2016-17
CURRENT STATISTICS FOR FY 2015-16
Total Connections: 273043
Expected To Cross: 281196**
**Regression Analysis
sources, Hughes, with a subscriber foundation of 102608 as on march 2015, and having an accumulation of 59% for FY 2014-15, is considered to be the leader in the industry. VSAT provide impetus to high-pro� t applications like e-learning, digital cinema, and banking among others. VSAT will be one of the most important verticals of the Digital India agenda. The Financial inclusion program, which was an initiative of the Government of India had created a boom in VSAT sector. As a part of the program, a large number of ATMs were installed. These ATMs had to be backed by a high quality and always on data, which could not be satis� ed by terrestrial networks. Thus, terrestrial networks failed to provide the desired results in remote areas. VSAT technologies provided an upper edge as compared to terrestrial networks in such scenarios. VSAT had helped to establish a large number of white label logos, which was provided by TCPSL, BTI Payments Pvt. Limited and Muthoot group. The white label logos, which is on the increase, and the Digital India initiative is set to propel the VSAT sector.
In� uencing Factors
Banking sector with more and more people switching to online medium Rural installations of ATMs White label ATM companies Financial inclusion program by Indian government
CONCLUSION
As a result of various government incentives and regulations regarding infrastructure sharing and spectrum sharing, we can expect an increase in their trends. Also, with the rollout of 4G systems and exponential growth in the amount of data that is created and consumed, various parameters like optical � ber rollout, data centers, VSATs and enterprise network equipment are all set to increase. 4G deployment is also poised to introduce newer infrastructure like streetlight antennas. Furthermore, with an increased importance of global connectivity, parameters like submarine cable rollout and satellite deployment too, are expected to grow.
..................................................................................................................................................................................................................................................................... PRÉVISIONSITM ANNUAL FORECAST 2017
COM
MU
NIC
ATIO
N I
NFR
AST
RUC
TURE
52


SCOPE
The consumer electronics industry is teeming with activity for the adoption of various innovative technologies. This vertical provides an insight into the consumer electronics industry and discusses the potential growth associated with it. With consumers spending more on tech savvy gadgets, the industry is expected to � ourish multi-fold times in the near future.
PERSONAL COMPUTING
Worldwide PC shipments for CY 2015 reached 276.2mn units, showing a decrease of 10.4% from CY 2014. The U.S. PC market experienced a decline of 4.3% Y-o-Y. Markets in Europe, Middle East, and Africa witnessed a double-digit Y-o-Y decline in PC shipments, as vendors focused on phasing out the older inventories of Windows 8 based PCs. The Asia-Paci� c market was a� ected by weak demand and high inventory levels in the channels. Currency � uctuations led to an increase in prices and lower sales, while the end users continued to focus their spending on other devices.
The PC market faced a sti� competition from
Student TeamPrathamesh Pande | Chetna Chandiramani
smartphone and tablet market. The other factors that contributed to the decline were launch and free upgrade of Windows 10 which acted as a barrier for new system purchases. The PC market is expected to upsurge as attractive PCs with new OS and variety of hardware upgrade options will be available in the near future. Acceleration of commercial Windows 10 adoption in 2016 is expected to stabilize the market.
Indian PC market is currently not very strong, with heavy rainfall and weakening demand during festival season acting as dampeners leading to low sales. Government and education projects are expected to contribute to the growth in the enterprise segment.
In� uencing Factors
Increased competition from mobile phones and tablets having high-end speci� cations Falling commodity prices and weak international currencies led to delay in purchases Longer life expectancy of PCs poses a hurdle in the frequent purchase
TABLETS
CONSUMER ELECTRONICS
#Factory-Out Shipments *Trend Analysis
PRÉVISION FORECAST FOR CY 2016
CURRENTSTATISTICS CY 2015
Global PC shipments: 276.2 mn units
Expected to reach 237.07 mn* units
Indian PC shipments (Approx): 9.25 mn units
Expected to reach7.84 mn* units
PRÉVISION FORECAST FOR CY 2016
CURRENTSTATISTICS CY 2015
Global tablet shipments: 206.8 mn units
Expected to reach 194.69 mn* units
Indian tablet shipments: 3.8 mn units
Expected to reach 4.24 mn* units
#Factory-Out Shipments *Trend Analysis
54

Current market conditions are pushing vendors to set up manufacturing units in India and Indonesia to avoid being hit by economic issues such as currency devaluations and high import taxes in the future.
In� uencing Factors
Increase in demand for low-end smartphones Growth in APAC and MEA markets Aggressive pricing strategy from local and Chinese brands Global scale rise in Chinese brands Launch of new LTE networks in developing countries
HANDSET (INDIA)
Indian Handset Market reached a total of 235.6 mn units in CY 2015, indicating a decline of 9.1% Y-o-Y. Smartphones constituted 39.8% of the total handset market, a Y-o-Y growth of 18%, while feature phones experienced a decline of 27.1% Y-o-Y. The feature phone market declined with increase in consumer demand for smartphones.
Indian Handset Market share 2015
Samsung led the smartphone market in 2015. Micromax su� ered from intense competition from local brands in $50-$100 price segment. Intex focused on $100 price band while other vendors used online retail to penetrate the market. Chinese vendors used Flipkart, Snapdeal and Amazon to drive � ash sales. Vendors also focused on launching 4G phones at a� ordable $100-$150 price points. For the � rst time, 4G-based smartphone shipments surpassed 3G volume in Q4 of 2015. ‘Make in India’ campaign, helped 50% of smartphones get manufactured in India by 20+ mobile phone brands
In� uencing Factors
Market growth due to online retail
13.50%
19.80%
39.50%
7.10%10.40%
9.70%
Samsung
Micromax
Intex
Lava
Microsoft
Others
Worldwide tablet shipments forCY2015 were 206.8 mn projecting a decline of 10.1% Y-o-Y from CY 2014.The shipments for tablets reached a record of 8.1 mn devices, despite market’s negative trajectory. However, the transition towards detachable tablets resulted in a decline of pure slate tablets market by 21.1%. The consumer focus was mainly diverted to tablets as an alternative to PC.
Apple became the market leader even though the company faced a decline of 24.8% Y-o-Y in terms of shipments. Samsung’s market share declined by 18.1% as compared to last year, but still it managed to maintain its second position. Lenovo too faced a decline of 13.5% Y-o-Y. Huawei’s focus remained on the low-end segment and international expansion.
The overall tablet market in India for 2015 saw a growth of 8.2% with approximately 3.8 mn units shipped in CY 2015 as compared to 3.5 mn in CY 2014. The majority of tablets shipped were primarily driven by local vendors such as Micromax and iBall. Datawind focused on entry-level $100 tablet segment. The tablet market is expected to witness a healthy growth in 2016 due to the upcoming launch of a� ordable windows based tablets, and an increase in adoption of 4G based tablets.
In� uencing Factors
Increase in demand for detachable tablets Launch of high-speed LTE networks High growth in shipments of large screen smartphone devices acts as a restrainer Rise in popularity of phablets acts as a restrainer
HANDSETS (GLOBAL)
Global mobile phone shipments reached a total of 1917 mn units in CY 2015, an increase of 2% from 2014. Strong demand for low cost and premium handsets continued to be the driving factor for an increase in mobile phone sales over the year. Samsung retained its topposition with a focus on lower-end smartphones. Huawei’s sales increased by 53% in Q4 of 2015 making it the best performer Y-O-Y. The worsening economic conditions also had a major impact on sales of smartphones. Apple iPhone sales were down by 4.4%, marking its � rst decline in sales of smartphones. Android OS phones accounted for 80.7% of the global market.
PRÉVISION FORECAST FOR CY 2016
CURRENT STATISTICSCY 2015
Global shipments: 1917# mn units
Expected to reach 1972.94*mn units
#End Sales *Trend Analysis
PRÉVISION FORECAST FOR CY 2016
CURRENT STATISTICSCY 2015
Indian shipments: 235.6 mn units
Expected to reach to 242.51 mn* units
#Factory-Out Shipments *Trend Analysis
..................................................................................................................................................................................................................................................................... PRÉVISIONSITM ANNUAL FORECAST 2017
CON
SUM
ER ELECTRO
NICS
55

In� uencing Factors
New gen smartphones with detachable parts Price cuts encouraging consumers to frequently change their smartphones Arrival of international vendors thus delivering value for money to customers Roll out of 4G LTE will increase smartphone demand
GAMING CONSOLES
Gaming console market is witnessing turmoil because of competition amongst the big three players-Sony, Microsoft and Nintendo. PCs, Smartphones and tablets have taken over TV and hand held consoles due to high market penetration and economical pricing.
Global gaming console market is dominated by TV gaming consoles with a market share of 82% while handheld gaming console accounts for the remaining market. Factors contributing to such unequal distribution are –
1. Consoles o� er better RAM and GPU improving the overall gaming experience 2. Casual gamers who have shifted to smartphones and tablets causing handheld devices to sink
GAMING CONSOLE GLOBAL MARKET SHARE 2015
Global gaming console market operates on the basis of product di� erentiation, portfolio and pricing. Technological advancements and innovations are playing a pivotal role in driving the market growth. Next generation gaming consoles seem to have a promising growth in near future. Moreover, the competition is predicted to intensify over the next four years due to increase in product extensions.
In� uencing Factors
PS 4.5 is expected to be a console with an external attachment having interfaces with upcoming VR systems Drastic shift of casual gamers from TV consoles to PC and smartphones Big players are investing in VR and gameplay that pushes 4K resolution
Global Chinese vendors tripled shipments in India Flash sales through online players such as Flipkart, Snapdeal, and Amazon Make in India campaign had a good impact on local manufacturing of smartphones
SMARTPHONES
The global smartphone market has expanded in terms of unit shipments at a rate of 22.7% in 2015, accounting for 1,432.9 mn units. In 2015 smartphone competition was driven by diverse parameters like screen quality, RAM size, � ngerprint scanner, slim body
GLOBAL SMARTPHONE MARKET SHARE 2015
Major Smartphone players like Samsung, Micromax and Intex have added to the growth and the potential of the market. Reliance Jio with its LYF smartphones managed e� ectively to penetrate the market.
INDIAN SMARTPHONE MARKET SHARE 2015
In 2015 new entrants like Xiaomi, LeEco, CoolPad and ZTE proved to be tough competitors for the existing players. Looking from a broader perspective, global players are intensively focusing on 4G LTE while domestic players can still make some pro� ts out of 3G. 2016-17 shall witness a major transformation in the telecom sector with respect to change in technologies.
PRÉVISION FORECAST FOR CY 2016
CURRENTSTATISTICS CY 2015
Global shipments: 1432.9 mn units
Expected to reach 1654.66 mn* units
Indian shipments: 103.6 mn units
Expected to reach 148.1 mn* units
#Factory-Out Shipments *Trend Analysis
16.20%
22.70%
43.60%
4.90% 7.40%5.20%
Samsung
Apple
Huawei
Lenovo
Xiaomi
Others
38%
10%14%
18%
20%
Samsung
Micromax
Intex
Lenovo
Reliance Jio
58%
12%
30% Sony
Microsoft
Nintendo
..................................................................................................................................................................................................................................................................... PRÉVISIONSITM ANNUAL FORECAST 2017
CON
SUM
ER E
LEC
TRO
NIC
S
56

SET TOP BOX
In CY 2015, global shipments of set-top box grew by 5% and reached 353.4 mn however revenue saw a fall of 5.4% in 2015.
Increase in pay TV subscribers and high demand for HD STB in market will account for boom in STB revenue in 2016. Prime players in STB market are ARRIS group, Broadcom, Cisco, Huawei Technologies, etc.
Modern STB devices have increased their storage space for personal video recording and caching of data broadcasts. Cable digitization will lead to higher volumes of 3D content and thus demand of HD STBs will increase. The Asia Paci� c STB market shall witness rapid growth due to encouraging government regulations in the region. Availability of satellite bandwidth will be further enhanced thanks to the proposed launch of new Ku-band satellites by ISRO.
The Indian STB device industry stands at $750 mn. Indian manufacturers are facing sti� competition from their Chinese counterparts. Top players in STB market in India are Videocon, Tata Sky, Dish TV, etc. Reduction in taxes on the goods will drive further sales.
In� uencing Factors
Cable digitization will lead to high demand of HD STB Reduction in the prices of smart TVs will increase STB shipments Availability of satellite bandwidth
TELEVISION
Television industry and related technologies have improved over a period of time. OLED technology is a new trend in the market. Ranging from features like high resolution and glare resistance to the reduction of visual geometric distortion, the industry has seen paradigm shifts in the mainstream de� nition of television. While the total annual TV shipments fell to 226 million units in 2015, 4K TV shipments have risen by 173 percent amounting to a total shipment of 32 million units.
The weakening of global demand for TV sets with continued LCD capacity expansion caused an oversupply in the market by the second half of 2015.
PRÉVISION FORECAST FOR CY 2016
CURRENT STATISTICSCY 2015
Global shipments: 353.4 mn units
Expected to reach: 397.1 mn* units
#Factory-Out Shipments *Trend Analysis
This, in turn, resulted in decline of LCD TV panel prices.
GLOBAL TELEVISION MARKET SHARE 2015
TV screen size growth saw a slowdown in 2015 at almost half the rate of growth as was observed in 2014. Sony is one of the biggest manufacturers of 4K TVs. There was an incremental rise witnessed in the demand for OLED television which has largely been shaping consumer demands in the coming future.
In� uencing Factors
4K Ultra HD and 8K Ultra HD technologies have been able to attract more customers Adaptation of Virtual Reality and increasing demand for HD content Internet Streaming and web search facilities in smart TV
SMART GADGETS
Smart gadget industry has seen an upsurge since 2014, with a positive growth witnessed in all four quarters of 2015. Total worldwide shipments of smart gadgets amounted to 72.1 mn units. The introduction of AI in low-cost powerful sensors has led to their speedy proliferation. These gadgets are capable of detecting potential problems and programming threats.
The ascent of new segment markets such as computerization (building and mechanical), therapeutic gadgets ensuring a person’s well-being, car security and infotainment are driving innovation in the sector.
HOME APPLIANCES
A smart home requires gadgets and appliances. Entertainment, utility and security needs are the areas with potential growth. Dominated by players like Haier, Whirlpool and Electrolux, the industry will be expected to grow at 16.8% CAGR in near future. The convergence of smart appliances with the mobile devices will enable the electronic giants to gain market share. Factors like energy e� ciency management, interoperability and marketplace dynamics emerge as key di� erentiators in this competitive landscape.
21%
6.4%
13.6%
22.7%
20.8%
11%4.5% LGE
Samsung
Sony
Videocon
Panasonic
Onida
Others
..................................................................................................................................................................................................................................................................... PRÉVISIONSITM ANNUAL FORECAST 2017
CON
SUM
ER ELECTRO
NICS
57

SMART WEARABLES
The biggest introduction in the consumer electronics market is smart wearables which has created a new market segment among smartphone users. Defense forces, business enterprises and medical professionals have been using wearable technology for decades. The generic consumers have recently accepted the idea of wearable items such as:
Smart watches Smart glasses Fitness & Health Trackers Hearables
As of 2015, wearables are the most successful and the most penetrated market segment. Health � tness trackers and smart watches are expected to account for 9 out of 10 wearables bought worldwide. The key producers of smart watches are Samsung, Pebble, Fitbit, Apple, Sony, LG and Lenovo. Nike, Fitbit and Jawbone are among the most successful � tness tracker.
SECURITY DEVICES
Each day 5.5 mn smart devices are getting connected in homes around the world. It is estimated that there will be around 6.4 bn IoT devices by the end of current year. With devices like SENSE to control your room temperature, lock system and vault code, security gadgets surely fascinate the customers. Smart security devices have large but so far unrealized potential.
In� uencing Factors
Convergence of consumer devices Innovation and miniature of smart devices IOT concept realization
GLOBAL TELEMATICS
Telematics refers to an integrated use of telecommunication with information technology. The technology deals with collection, analysis, trans-reception of real-time information related to remote objects like vehicles using telecommunication devices. The global telematics market is driven by availability of high speed internet technologies such as LTE, increasing demand and lowering cost of connectivity, greater governmental regulations pertaining to safety compliance. Growth in Telematics is primarily attributed to navigation services, rising number of vehicle accidents and thefts.
The global automotive telematics market was valued at $1.4 bn in 2015, growing at a pace of 20% Y-o-Y.
The key competitors in the global telematics market include Verizon, HARMAN, AT&T, Ford, BMW, TomTom, Telefonica SA, MiX Telematics, Vodafone, and Trimble. The Indian telematics market, growing at a CAGR of 22.8% is expected to reach $113.7 mn by 2018.
Today, telematics provides mobility solutions for intelligent transportation, integrated route planning and execution, driver behavior tracking, exoneration and vehicle diagnostics with its comprehensive set of services processed and analyzed in a cloud based environment.
SMART VEHICLES
Smart Vehicles are focused on improving comfort, navigation and safety by using smart technologies such as high-tech cruise control, self-driving technology, crash-avoidance systems, smart navigation assistance, e� cient parking system, e� cient fuel utilization management, night-vision enhancements and security measures.
Google and Tesla have launched their self-driving cars models. Features such as automatic music control, climate control, 360º cameras, smart payment facility and o� ine navigation assistance with voice assistance and control are driving the segment.
In� uencing Factors
Development and growth of Smart City Integration of smartphone device functions into the vehicle Government’s initiative to reduce accidents Increasing penetration of telematics in the developing countries
CONSUMER ELECTRONICS SHOW
Consumer Electronics Show (CES) is an annual trade exhibit show, targeted to attract the giants of the consumer electronics industry. CES evinces not only gadget manufacturers but also allied business manufacturers, retailers, software developers, advertisers and marketeers. Ideas like 4K TV, Virtual Reality, autonomous robots, drones and electric vehicles were presented in CES 2016 Let us take a glimpse at all happenings of this year’s “mega show”:
Endless Mini: An a� ordable mini PC comprising of applications, encyclopedia and entertainment which can be accessed even without Internet connection.
Next Gen Televisions: have an approachable reality. The Samsung SUHD with its Quantum dots is one masterpiece while TCL’s likely a� ordable 4K TV is another wondrous creation.
..................................................................................................................................................................................................................................................................... PRÉVISIONSITM ANNUAL FORECAST 2017
CON
SUM
ER E
LEC
TRO
NIC
S
58

Project Tango Smartphone: A technology platform initiated by Google that allows developers to inculcate experiences like 3D mapping, augmented reality, and indoor navigation.
Virtual Reality: Samsung came up with its Gear VR and started rolling it out along with Galaxy S7 and S7 edge in the month of March ‘16.
CONCLUSION
The worldwide Consumer Electronic industry is seeing a growth because of innovations and convergence. With newer technologies, consumer electronics segment is constantly evolving. The growth of multi-functional devices is going to be exponential causing the sales of single-function devices to diminish e.g. camera. Factors like reduced income growth, internet adoption etc. may cause a slight decrease in demand, but the need for innovation and the need to excel will be the igniters for this industry.
..................................................................................................................................................................................................................................................................... PRÉVISIONSITM ANNUAL FORECAST 2017
CON
SUM
ER ELECTRO
NICS
59

..................................................................................................................................................................................................................................................................... PRÉVISIONSITM ANNUAL FORECAST 2017
60


Optical Wireless Broadband is a new entrant. In India, 70% to 80% of the mobile towers are using microwave-based backhaul. To cater to the increased data tra� c, operators are relying more on optical � ber connectivity despite the fact that it incurs high initial operation costs and longer set up time than microwave technologies. So, the operators are expected to have � exible backhaul deployment strategies to manage data engagement and ful� l consumer expectations.
In� uencing Factors
Increase in smartphone shipments Increase in online video and audio streaming Rise in usage of mobile application Penetration of 3G technology and increased adoption of LTE
CABLE TV
Key factors responsible for the slow growth of net on cable in India are low quality cable network, unavailability of skilled manpower and regulations prohibiting interconnection of VoIP to PSTN/Mobile. In absence of last loop unbundling (LLU) on PSTN, cable has the potential to contribute in achieving broadband penetration. This is however changed now with the DoT allowing cable TV operators to provide last mile connectivity in almost all the tier I as well as tier II and
SCOPE
This vertical provides an insight into the broadband technologies present in India. Broadband consists of both wired and wireless domains which can provide a minimum speed of 512 kbps. New emerging parameters like TRAI regulations, Cable TV, and Broadband speed are the latest additions to this vertical. These parameters will provide an in-depth analysis leading to insights into India’s broadband penetration. Broadband already consists of basic parameters like broadband subscriber base, mobile broadband, backhaul, FTTx as services and VoIP, DSL and Wi-Fi as technologies. Here, we shall discuss about various initiatives by the government to improve broadband penetration in India along with their impact.
BACKHAUL
The mobile backhaul is a mobile network that connects the base stations to the network controllers within a coverage area and is extended to the core transport network. 3G data and 2G data usage witnessed 85% and 10% growth respectively in 2015 as compared to 2014. There are almost 47 mn 4G enabled devices in the market with � vefold increase in data rates. This is putting tremendous pressure on the Backhaul network. With attractive o� erings on high-bandwidth applications such as video sharing, enterprise and o� ce connectivity, many operators are moving towards the next generation backhaul.
Today’s mobile backhaul consists of various technologies that include Fiber, Microwave, and Millimeter Wave. A promising new technology called
Student TeamArun Suresh | Rishika Ghosh | Roinak Sarkar
BROADBAND
*Trend Analysis
PRÉVISION FORECAST FOR FY 2016-17
CURRENT STATISTICS FY 2015-16
Subscriber Base: 1.22 mn
Expected to reach:1.38 mn *
62

tier III cities and to interconnect VoIP and PSTN/mobile. This will enable net on cable companies to provide voice, video and data on IP platform using DOCSIS, thus making their business case viable.
To increase the penetration of the cable operators in rural areas, the Government of India is planning to utilize Universal Service Obligation Fund (USOF). Tamil Nadu’s Arasu Cable TV Corporation has tied up with local cable operators to provide internet and IPTV services to homes in the state by use of Internet Service Provider license. RailTel took another step in the direction to provide high speed internet in rural areas of Tamil Nadu by linking its optical � ber network to existing cable TV. CTAV networks show greater strength through which greater penetration can be achieved but cable modem has few limitations when compared with DSL in regard with the range of users from the head’s end. Unlike developed countries, broadband penetration using cable modem in developing countries remains relatively low.
In� uencing Factors
Increase in involvement of cable TV operators Regulatory approval for interconnection of VoIP with PSTN/Mobile Government initiatives Focus on rural areas Cost e� ectiveness
DSL
DSL is the most preferred technology for providing broadband in India, which dominates with 79% of total broadband subscribers. Forthcoming DSL acceleration technology like VDSL2 bonded, provides a maximum data rate of 100 Mbps while VDSL2, with bonding of up to eight copper pairs, can deliver speed close to a value of 300 Mbps there by increasing performance by cancelling the far-end crosstalk. The availability of low-cost smartphones with 3G and 4G technologies and absence of last loop unbundling(LLU) on PSTN may cause sluggishness in the growth of DSL in India. Advanced security, better resilience and cost-e� ectiveness will make DSL a stepping stone for Digital India Programme. However, debate continues as to which type of network architecture is best suited for
PRÉVISION FORECAST FOR FY 2016-17
CURRENT STATISTICS FY 2015-16
Subscriber Base: 13.3 mn
Expected to reach15.2 mn *
*Trend Analysis
wireline service providers. FTTH could be the best infrastructure for long-term future demands, but G.fast and Vplus could enable the postponement of FTTH spends for a decade or more where there are substantial numbers of DSL Subscribers on Copper Telecom Network.
In� uencing Factors
Smooth Vectoring evolution turbocharges the data rate through copper wire High Installation cost of � bre Increasing smartphone penetration as a restrainer NOFN and FTTC roll out can enable better data rates on DSL
FTTX
FTT x (FTTH, FTTB/P, FTTC, FTTN) networks are becoming necessary and dominant technology options to meet the required bandwidth de� cit across the geographies. With the proposed deployment of the Smart Cities, India needs to leapfrog to technologies like 4G, NGN, and FTTH. FTTH deployment is highly capital intensive, especially in the rural part of India and hence the Government has opted for GPON as the technology option for NOFN resulting in lower costs both in CAPEX and OPEX. FTTH can play a pivotal role in providing the required bandwidth in a populated country like India. Sterlite Technologies has partnered with Bharti Airtel and Tata Teleservices to deploy massive network-neutral FTTH. BSNL in Assam plans to lay 2747 km of the cable under the National Optical Fiber Network (NOFN) project. NOFN project is aimed to provide high-speed broadband connectivity to 2.5 lakh Gram Panchayats. This mission targets to achieve NOFN coverage for 36738 Gram Panchayats by 2017. The � ber-optic network expansion comes under the national government’s Digital India initiative. The Indian Government will be investing a total of $18 bn by 2019 to provide internet access nationwide. RJio is also planning to provide high bandwidth intensive services like high-speed internet, telephony and wireless connectivity through FTTH. RJio, the 4G entrant, is making use of FTTH to off er IP TV services and Live TV services.
In� uencing Factors
Government of India initiatives Network expansion and capacity augmentation by the telecom operators Broadband penetration in the rural areas Increased regulatory thrust on in Building Solutions (IBS)
..................................................................................................................................................................................................................................................................... PRÉVISIONSITM ANNUAL FORECAST 2017
BROA
DBA
ND
63

to 250,000 schools while “E-Choupal” promises to empower the small farmers with internet connectivity. These initiatives will help the rural population overcome the problems of a “digital divide” bridging this gap would create opportunities for e-education and job opportunities.
TRAI recommended a public-private partnership model (PPP) to combine the private sector’s capacity for delivery of broadband services with Government’s role as an enabler and regulator to overcome market failures. “BharatNet” is another project that was launched with a view of connecting 2.5 lakh gram panchayats present in the country through optical � ber cable to set up network infrastructure by 2018. “RaiTel” is expanding its project to take high-speed internet across rural homes in Tamil Nadu by linking its optic � ber network to existing cable TV connections. Google’s ‘Project Loon’ too aims at providing high-speed internet to rural areas. Also, Idukki district has recorded as, India’s � rst high-speed rural broadband network with all its gram panchayats connected through NOFN.
However, the adoption of rural broadband is bound with several challenges such as poor infrastructure, low computer penetration, � uctuating power supply and legal problems. But with government initiatives and support of the telecom operators, these obstacles can be overcome.
In� uencing Factors
Availability of cheaper smart devices Government initiatives to increase the awareness of the internet like Digital India, e-Kranti, etc Lower Data and Voice tari� rates
SUBSCRIBER BASE
The broadband is increasingly becoming popular in India because of DSL, net on cable, FTTH, IPTV and many other new technologies. The total broadband subscriber base for the year 2015-2016 stands at 149.75 mn as on 31st March 2016, with a monthly growth rate of 3.37%. Telcos are spending a huge chunk of money in setting up and maintaining the infrastructure for the internet. Increased optical � ber penetration, acquisition of spectrum, the broadband service quality, and data throughput is getting better with each passing day. The increase in 3G and 4G penetration, shipment
MOBILE BROADBAND
Mobile broadband is growing at an accelerated pace in emerging countries and India is no di� erent. With the growing tendency to remain connected 24*7, there’s an increase in the adoption of e-commerce and m-payments. Growing popularity of social networking sites, LTE launch by new operators & the associated reduction in data charges are driving this parameter.Availability of feature-rich yet a� ordable smartphones and multi-lingual mobile applications, mobile broadband in India looks ready for take-o� . Along with these, Government initiatives such as “Digital India”, “Make in India” and “Broadband for all” have been aimed at achieving all India broadband connectivity, helping in the rise of the mobile broadband subscriber base. As reported on 29th February 2016, the mobile broadband subscriber base stands at 127.61 mn, at a monthly growth rate of 3.71%. The government is taking initiatives to make the content available in regional languages owing to an increase in the subscriber base. Future of mobile broadband looks promising with the conceptualization of 5G technology, IoT, Next Generation Networks (NGN)which will impact the growth in subscriber numbers and their demands. Thus, Mobile broadband, with its ability to connect people to the Internet in an ultra-personal and pervasive manner, will have a far reaching impact in near future.
In� uencing Factors
Availability of lower cost 3G/4G handsets The popularity of E-commerce and social networking websites Launch of LTE services by new operators Several government initiatives like Digital India, Broadband for all, etc Availability of regional language content
RURAL BROADBAND
Upgrading the standard of living in rural India has always been a matter of concern for the government, especially when it comes to rural internet connectivity. Some initiatives have been taken up to promote broadband connectivity in rural areas such as “Digital India”, which aims at digitally connecting India’s villages and Gram Panchayats, thereby increasing broadband connectivity. Also, there is “e-Kranti” to provide broadband connectivity, free WiFi and online courses
PRÉVISION FORECAST FOR FY 2016-17
CURRENT STATISTICS FY 2015-16
Subscriber Base: 132.24 mn
Expected to reach:189.91 mn *
*Trend Analysis
**Regression Analysis
PRÉVISION FORECAST FOR FY 2015-16
CURRENT STATISTICS FY 2015-16
Wired Subscriber Base: 17.51 mn
Expected to reach:26.19 mn **
..................................................................................................................................................................................................................................................................... PRÉVISIONSITM ANNUAL FORECAST 2017
BRO
AD
BAN
D
64

of smart devices, popularity of mobile applications, mobile banking, and several other mobile broadband related activities have led to the increase in broadband subscriber base. Several government initiatives such as “Digital India”, “Make in India” and “Broadband for All” are aimed at an all India broadband connectivity, will also be instrumental in increasing the subscriber base. Apart from that, all the major operators have joined hands in laying down the optical � ber and the number stands at 762051 km as on March’15. These key initiatives will de� nitely strengthen the broadband connectivity in rural as well as urban sectors.
In� uencing Factors
Penetration of optical � ber in rural areas Sanchar Shakti Scheme evolving and successful in various parts of India Increased usage of Broadband based services Strengthening of broadband connectivity in rural as well urban areas
TRAI REGULATIONS
TRAI is an independent regulatory body of telecommunication industry in India. According to UN Broadband Commission report of Sept’15, India has moved down in the global ranking of broadband penetration. In an e� ort to improve the rankings, TRAI has issued guidelines for operators that download speed of any broadband subscriber should not be reduced below 512kbps in any of the tari� plans. Along with it, information in the form of alert should be given to subscriber when data usage reaches 80% in any of the plans. They have made recommendations to DoT for further increase the minimum download speed from 256kbps to 512kbps in Broadband Policy 2004. To promote ‘Digital India’, TRAI has recommended PPP model for rolling out of broadband network rural India. TRAI also reduced tari� rates by bringing down the ceiling rates of domestic bandwidth up to 60%, which in turn shall have a positive impact on rural India. TRAI has barred service providers from charging di� erential rates for data services, in accordance with Internet’s basic principle of being available to everyone on equal terms. The regulatory body has also issued a consultation paper building strong grounds for boosting broadband in public places through Wi-Fi with an aim to bring down the current price rates on the mobile network. This could also help in o� -loading data tra� c and reduce pressure on the mobile networks. TRAI keeps a check on the QoS o� ered by service providers and customer satisfaction through surveys by independent agencies. There are � xed penalties in case of any violations of the standards set by it.
VOIP
VoIP is an alternative way of making internet based calls at a very low cost and it delivers multimedia content over the internet. VoIP, over the years has shown explosive growth and a rapid increase in vendors and has created numerous choices for customers. With the DoT allowing interconnection of VoIP and OSTM/mobile networks, the adoption of VoIP will be accelerated. The integration of VoIP and Internet of Things (IoT) will further speed up the process of telecommuting. The advancement of VoLTE can support high de� nition voice and good QoS as compared to VoIP. 4G technology implementing VoLTE can give the new advancement for VoIP in future. TRAI is going to set charges for interconnection for VoIP once DoT compensates the clause of Uni� ed License framework. The future trends of VoIP in India will be in� uenced by TRAI’s decision.
In� uencing Factors
VoIP based landline calls Charges for interconnection for VoIP Trends in VoIP (IoT, standalone computing device)
WI-FI
The emitting frequency range of Wi-Fi is from 2.4GHz to 5GHz depending on the amount of data to be shared. Wireless technology has the potential to provide more reliable and faster connections with reduced costs without hampering the e� ciency. 802.11ac Wave2 technology is the latest Wi-Fi standard with a channel bandwidth of 160MHz; supporting more than three MIMO streams. The usage, maintenance, and support of high-density environment has become a top concern due to high proliferation of applications, users and devices. The new Wi� standard, 802.11ac Wave2 overcomes this problem by connecting all devices along with IoT network within a facility to support modern wireless infrastructure. A few cellular carriers are planning to deploy the unlicensed version of LTE in the Wi-Fi spectrum. Google is providing Broadband and VPN services at 23 railway stations in India as a part of its project “RailTel”, under Indian Railways. The vision of this project is to provide high-speed internet access to Indian Railways passengers. The Next Generation Wi� Hotspot has the capability to bypass the sign-on process to provide a seamless experience. The users will directly connect to the Wi-Fi network without any need for OTP,
*Trend Analysis
PRÉVISION FORECAST FOR FY 2016-17
CURRENT STATISTICS FY 2015-16
Minutes of Usage: 1082
Expected to reach:1228 *
..................................................................................................................................................................................................................................................................... PRÉVISIONSITM ANNUAL FORECAST 2017
BROA
DBA
ND
65

usernames, etc. This is also known as Hotspot 2.0, and is capable of both 802.1x and 802.11u functionalities. IEEE 802.1x authenticates networks while 802.11u does authentication and network identi� cation processes. Automatic authentication puts less load on the network since users are not connected to the network during veri� cation/connection attempt processes. It is the key component of India’s Smart Cities Initiative and with rightful implementation, it will end up being the future of Wi-Fi.
In� uencing Factors
802.11ac Wave 2 technology Wi-Fi analytics and IoT High speed Wi-Fi with Indian Railways and RailTel at railway stations NGH technology to be the future of Wi-Fi Availability of a� ordable 5GHz Wi-Fi access routers
BROADBAND SPEED
With an ever increasing demand for several Internet-related activities, the need for high internet speed is also increasing, especially the “Broadband” speed. This leads to having high bandwidth consumer plans with download speed from 10 Mbps to 100 Mbps available in the market. Now in India, as per TRAI norms, the minimum broadband speed is set at 512 kbps which seem poor in comparison with world average speed of 5.1 Mbps. India’s average speed has grown by 5.3% quarter on quarter and 26% year on year. In 2016, India stands at 91st out of 139 countries, but India has fared badly to reach there from a much better 68th out of 144 countries in 2013 in NRI (Network Readiness Index). These could be attributed to several factors like lack of value plans, fair usage plans adopted by many ISPs not being well received, dependency on copper wires, bandwidth- limited microwave backhaul, high cost for
� ber optics, and increased reliability on high cost for data, regulatory hurdles, lack of proper infrastructure, etc.
World Bank estimates that every 10% increase in broadband penetration increases the per capita GDP by 1.38% in the developing countries. With an important contribution to India’s economy, high broadband speed means faster data transfer and ease of business, which will help GDP by contributing to economic activities.
In� uencing Factors
Increase demand for online video services, e-commerce activities, social networking activities, etc Regulatory hurdles such as absence of LLU and VoIP and PSTN/mobile interconnection Government initiatives like Digital India, Broadband for All, Smart Cities etc Shift of several governments, commercial, educational activities towards the online way.
CONCLUSION
Broadband is the backbone for various initiatives and projects like smart cities, NOFN, etc. Lack of � ber connectivity, regulatory hurdles, requirement of high capital investment has a� ected the performance of broadband. It is visible through the comparison of the broadband speed of India with that of other countries. With an aim to promote ‘Digital India’, the government has initiated various projects to increase broadband penetration. E� orts have been intensi� ed to promote telemedicine, e-education, e-governance and e-entertainment in the rural parts of India with a strong broadband infrastructure backbone in place. Various other initiatives have also been taken by the government to increase rural internet penetration in India. The future 100 smart cities approved by the government need to have a strong broadband network in place to build on this mission. A minimum of 512 kbps has been recommended by TRAI is to be o� ered by every broadband service provider. Telecom industry is a major contributor to economic growth in India. Growing use of broadband-based services in telecom industry can revolutionize the way ICT works and provides support for the upcoming smart cities.
PRÉVISION FORECAST FOR FY 2016-17
CURRENT STATISTICS FY 2015-16
Broadband speed (India): 3.5 Mbps
Expected to reach:4.39 Mbps *
Broadband speed (Global): 6.3 Mbps
Expected to reach:7.32 Mbps *
*Trend Analysis
..................................................................................................................................................................................................................................................................... PRÉVISIONSITM ANNUAL FORECAST 2017
BRO
AD
BAN
D
66
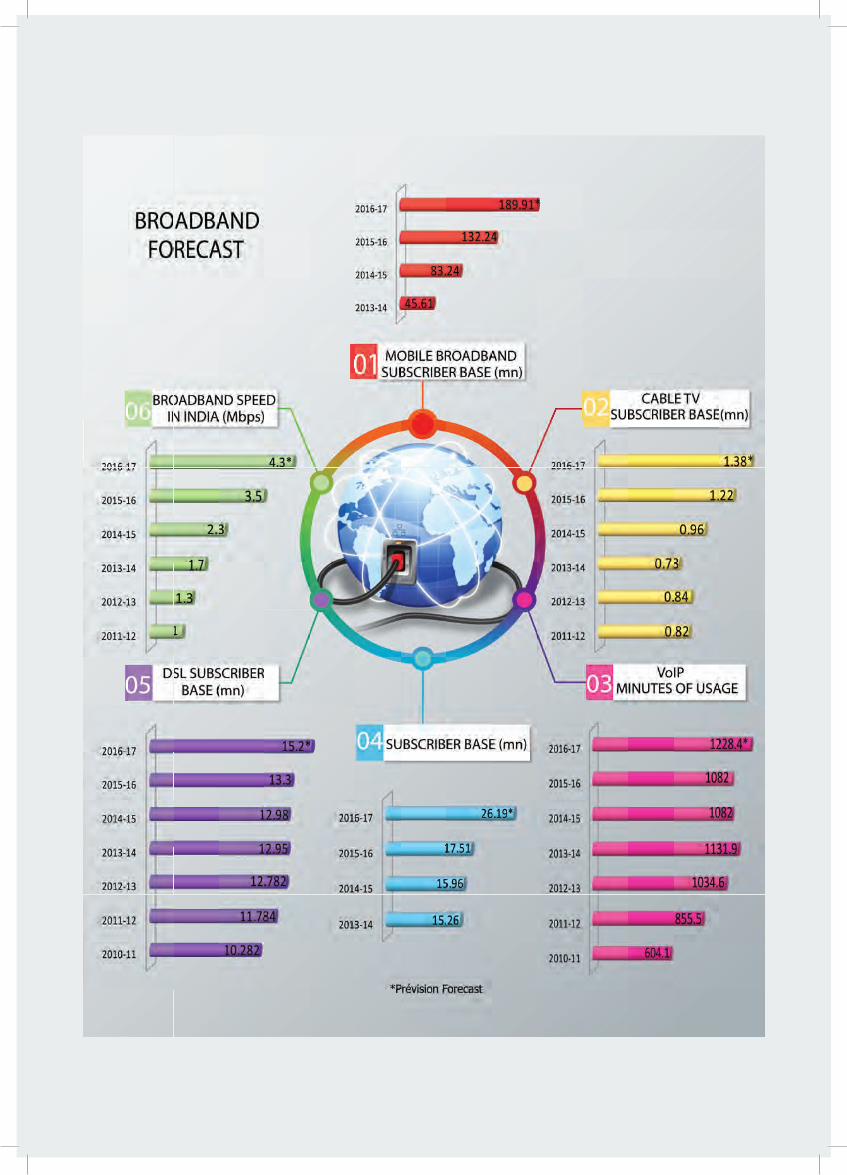

SCOPE
Value Added Services are enhanced non-core services, which add value to basic telecom services. The high growth in the subscriber base of mobile phone users has helped the emergence of mobile value added services (M-VAS). Data rate has been considered as a limiting factor in the growth of VAS but with the ongoing roll-out of 3G, 4G, and BWA services, the market for M-VAS is continuously growing. M-VAS is likely to emerge as a tool for additional revenue, service di� erentiation, and customer retention for service providers. It includes M-education, M-health, M-banking, M-agriculture, M-governance and other mobile services.
M-COMMERCE
Mobile commerce is the delivery of electronic commerce capabilities directly into the consumer´s mobile device, anywhere, anytime via wireless networks. Many companies like EBay Inc. have been making a strong push particularly in mobile commerce and developing new applications for its e-commerce platforms. Mobile Coupons are being used both to capture and redeem o� ers and discounts. Mobile self-scanning is gaining prominence as consumers in supermarkets are using their mobile phones to scan products for purchase and comparison. In order to provide customers with a true Omni-channel approach, retailers are now able to combine online, o� ine and mobile approaches through the adoption of in-store crossover functions such as click and collect. A survey from IBM suggested that 40% of all sales were completed on mobile devices. On Black Friday, 35.3% of sales were on mobile.
Issues faced by M-commerce are security, convenience,
Student TeamAakanksha Sharma | Arnab Mohapatra
availability, regulation, international standards and a� ordability. However, M-commerce is surely the digital sales channel of the future and has a vital role to play in the adoption of next-generation mobile payment instruments.
In� uencing Factors
Adoption of new business models Increase in General Consumer Awareness Availability of a� ordable feature-rich smartphones Roll-out and proliferation of wireless broadband technologies Incorporation of the “trust” factor into technology Interoperability of systems for M-commerce practices
ENTERPRISE MOBILITY
Sale of smartphones in 2013 was 969.72 mn which then grew by 28.30% in 2015. Smartphones empower users with mobility & personalization while simultaneously ensuring compliance and security. For successful implementation of enterprise mobility, BYOD (Bring Your Own Device) is playing a key role. The main issue of BYOD is securing mobile devices, addressing app related risks and managing the mobile environment. When BYOD policy is implemented, Mobile Device Manager (MDM) and Mobile Application Manager (MAM) become the critical components for the ecosystem. MDM theory suggests that the device be con� gured and owned by the enterprise. In the case of MAM, IT can take care of maintaining security and infrastructure integrity by blacklisting and whitelisting devices and applications. Accenture, IBM, Tech Mahindra and many other companies have shifted to enterprise mobility by providing various apps that help in achieving
VAS AND MOBILITY
68

operational expertise, within the organization. Samsung has developed solutions for many of its partner companies like Polycom Real Presence Mobile. Although Enterprise mobility has many advantages, there are some inadvertent risk factors associated with it such as data leakage, device damage, malicious and risky apps etc. Developing a robust and risk-free software is a major concern for enterprise mobility.
In� uencing Factors
Mobile device manager (MDM) and Mobile application manager (MAM) development Increase in the use of IT in delivering consumer services Enterprise applications on mobile devices Better security and privacy
M-ENTERTAINMENT
M-entertainment refers to a wide range of entertainment activities, such as games, music and TV, which can now be accessed on mobile devices. All the telcos and DTH players in India have their own VoD & m-entertainment apps to compete with similar OTT apps. The global M-entertainment market has observed a change in user demographics such as in the case of mobile games market where there has been an increase in the number of women and child gamers. This further has led to a shift in the focus of vendors from traditional sales to sales of virtual goods, subscription-based games, ad-based games and game as a service. For example, The Walt Disney Company is betting on next-generation mobile ticketing, virtual reality, live streaming and user-generated content as it works with cutting-edge technology and media companies to take their o� erings to the next level. For free apps, in-app advertising is one of the largest sources of revenue in this industry. Users can upgrade to a premium version that will cost them.
The main challenges faced by the mobile entertainment industry are privacy and security concerns. Another challenge comes in the form of lower data rates available on wireless networks in developing countries, which has been negated to certain extent by roll-out of 4G networks. Also, the competition among M-entertainment vendors is very intense as the market is highly fragmented with the presence of both global and local players posing high challenges to the vendors to bring creativity to the products and services for higher traction with the customers.
In� uencing Factors
Continuous increase in number of smartphone users Higher data rates available on wireless networks
Consequent rise in applications downloaded Growing number of consumers accepting the M-entertainment platforms in rich media content
M-EDUCATION
The progress of any country depends on the education system adopted by it to groom the next generation. In a country like India, mobile devices have good penetration in rural areas where other infrastructure does not exist. The motive of reaching huge masses with limited investment has been achieved through the use of mobile devices in quick conceptualization of smart education systems. M-education continues to integrate education with mobile industry by integrating games and interactive media into the curriculum, promoting digital content creation as a career choice, using consumer funded devices to bring content into the classroom and home, bringing textbooks to life with rich media such as Second Sight and tapping into new technology trends such as augmented reality, user-generated content and 3D.
There are various initiatives taken so far across the globe like Mobile Oxford (M.Ox) which is a mobile app created by Oxford University and was one of the � rst mobile information services in UK for higher education. CampusM is an application, from oMbiel, for universities to o� er branded mobile services to students. RM Slate – a tablet PC designed by RM for the education sector. National Program on Technology Enhanced Learning (NPTEL) aims to develop curriculum-based video lectures and web courses to enhance the quality of engineering education in India.
In� uencing Factors
Rise of global mobility i.e. widespread availability and adoption of mobile broadband technology Growth of high-skill job creation due to constantly evolving technologies Increase of remote and on-the-go work schedules Market penetration of low-cost smartphones
M-GOVERNANCE
M-governance is a tool to provide government services and information “anytime, anywhere” using wireless media on hand-held devices. It is not going to replace e-Governance but will compliment it. The number of mobile subscribers is increasing at a tremendous rate and currently, it stands at second spot after China. The telecom operators and mobile handset-makers, as stakeholders, will play a very crucial role in this government-led initiative. Mobile Seva is conceptualized to evolve as a one-stop solution to facilitate all transactions that the citizens
..................................................................................................................................................................................................................................................................... PRÉVISIONSITM ANNUAL FORECAST 2017
VAS A
ND
MO
BILITY
69

VAS
AN
D M
OBI
LITY
would have with the government departments. The C-DAC on behalf of DeitY has drafted platforms and implemented gateways for transmission of integrated government assistance to citizens over mobile devices using mobile communication like SMS (Short Message Service), USSD (Unstructured Supplementary Service Data), IVRS (Interactive Voice Response), and through mobile applications installed on the smartphones. M-governance has been implemented in healthcare services by private sectors but it needs a big push with smartphones playing an integral part for facilitating data transfers on real time basis.
In� uencing Factors
Government services “anytime, anywhere” Increasing number of mobile subscribers Mobile Seva - one stop solution Complimentary for e-governance Availability of apps in local languages Government services to each individual using wireless services
M-HEALTHM-health gives providers an opportunity to access the patient’s clinical data and latest medical o� erings at any time and place. It also helps patients with chronic conditions to remain in constant touch with the doctors without them having to be physically available at the hospital which saves time and enables them to provide optimum treatment to the patient. The apps are readily available on smartphones and tablets.
M-health apps provide better accessibility to healthcare, especially for patients living in remote areas. Monitoring and collecting health data using apps, helps patients and healthcare professionals manage conditions better. Various apps like UptoDate provide doctors a medical library. DocsApp is a mobile-only doctor consultation app that ensures doctors are easily accessible to patients all across India. Lantern app helps users deal with stress, anxiety and body image. The Joyable app o� ers cognitive behavioral therapy (CBT) techniques to overcome social anxiety.
The challenges faced by M-health are con� dentiality of data, market volatility, integration with existing IT systems and innovation. It also includes a high level of involvement from the government and needs to address the relative variation in reach & capabilities of healthcare systems between countries.
In� uencing Factors
Expansion of high-speed wireless access, like 4G and the adoption of electronic health records (EHR) Promotion of mobile health applications to patients by healthcare provider organizations
Creation of universal apps with new mobile web technologies which can run on any operating system Free and easily accessible information about healthcare
M-BANKINGM-banking refers to the mechanism provided to a smartphone or another cellular device users to execute � nancial transaction such as monitoring account balances, bill payment, instant fund transfer, etc. using their handsets On review of six Indian banks namely Axis bank, Citibank India, DBS Digibank, HDFC Bank, ICICI Bank, and State Bank of India, it was foundthat none of them scored above the global average of 65 out of 100. This evaluation was done across 14 countries, including Australia, Canada, China, France, Germany, India, Italy, Netherlands, Poland, Singapore, Spain, Turkey, UK and the US. Australia’s Westpac ranked � rst, scoring 86 points out of 100 in this list and in India ICICI ranked � rst, scoring 63 out of 100. The major challenge for adoption of m-banking is thelack of con� dence customers have in the security of the mobile banking services.
According to RBI, transactions through mobile apps in India has increased seven-fold between 2013 and 2016. In the latest report released by RBI, the top � ve banks, accounts more than 92% of the entire value of mobile transactions in the country. Out of these � ve banks, SBI is on the top with 36% market share followed by ICICI Bank and HDFC bank with 21.5% and 17.8% market share respectively. The mobile banking sector in India has been expanding and the primary reasons being increasing smartphone and increased adoption of mobile. There are 286.3 mn smartphone users in India in 2016 and Indian smartphone market has recorded a CAGR of 61.25% in the number of smartphone users since 2010. With the launch with UPI in August 2016, as stated by NPCI, Uni� ed Payments Interface (UPI) is a system that powers multiple bank accounts into a single mobile application (of any participating bank), merging several banking features, seamless fund routing & merchant payments . Through the UPI, users can send/receive funds without the need for bank details such as IFSC code, branch details etc. This is a bank-centric initiative and hence can lead to a drop in adoption for third party mobile payment apps. So, as combined market segment, M-banking is ahead of internet banking in terms of a number of logins as well as transactions.
In� uencing Factors
More degree of connectivity and freedom to users Increasing smartphone users Increasing internet market Increasing transaction through mobile apps Greater adoption due to launch of UPI in India
..................................................................................................................................................................................................................................................................... PRÉVISIONSITM ANNUAL FORECAST 2017
70
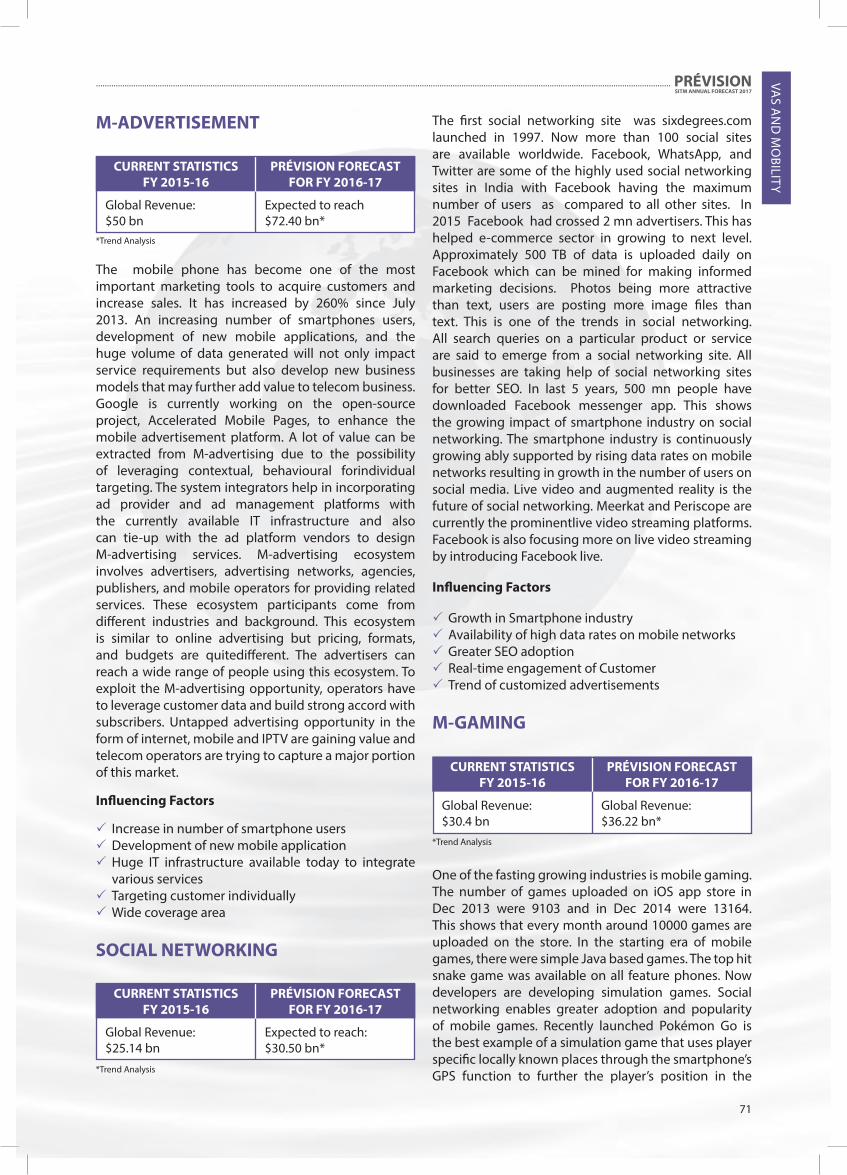
The � rst social networking site was sixdegrees.com launched in 1997. Now more than 100 social sites are available worldwide. Facebook, WhatsApp, and Twitter are some of the highly used social networking sites in India with Facebook having the maximum number of users as compared to all other sites. In 2015 Facebook had crossed 2 mn advertisers. This has helped e-commerce sector in growing to next level. Approximately 500 TB of data is uploaded daily on Facebook which can be mined for making informed marketing decisions. Photos being more attractive than text, users are posting more image � les than text. This is one of the trends in social networking. All search queries on a particular product or service are said to emerge from a social networking site. All businesses are taking help of social networking sites for better SEO. In last 5 years, 500 mn people have downloaded Facebook messenger app. This shows the growing impact of smartphone industry on social networking. The smartphone industry is continuously growing ably supported by rising data rates on mobile networks resulting in growth in the number of users on social media. Live video and augmented reality is the future of social networking. Meerkat and Periscope are currently the prominentlive video streaming platforms. Facebook is also focusing more on live video streaming by introducing Facebook live.
In� uencing Factors
Growth in Smartphone industry Availability of high data rates on mobile networks Greater SEO adoption Real-time engagement of Customer Trend of customized advertisements
M-GAMING
One of the fasting growing industries is mobile gaming. The number of games uploaded on iOS app store in Dec 2013 were 9103 and in Dec 2014 were 13164. This shows that every month around 10000 games are uploaded on the store. In the starting era of mobile games, there were simple Java based games. The top hit snake game was available on all feature phones. Now developers are developing simulation games. Social networking enables greater adoption and popularity of mobile games. Recently launched Pokémon Go is the best example of a simulation game that uses player speci� c locally known places through the smartphone’s GPS function to further the player’s position in the
M-ADVERTISEMENT
The mobile phone has become one of the most important marketing tools to acquire customers and increase sales. It has increased by 260% since July 2013. An increasing number of smartphones users, development of new mobile applications, and the huge volume of data generated will not only impact service requirements but also develop new business models that may further add value to telecom business. Google is currently working on the open-source project, Accelerated Mobile Pages, to enhance the mobile advertisement platform. A lot of value can be extracted from M-advertising due to the possibility of leveraging contextual, behavioural forindividual targeting. The system integrators help in incorporating ad provider and ad management platforms with the currently available IT infrastructure and also can tie-up with the ad platform vendors to design M-advertising services. M-advertising ecosystem involves advertisers, advertising networks, agencies, publishers, and mobile operators for providing related services. These ecosystem participants come from di� erent industries and background. This ecosystem is similar to online advertising but pricing, formats, and budgets are quitedi� erent. The advertisers can reach a wide range of people using this ecosystem. To exploit the M-advertising opportunity, operators have to leverage customer data and build strong accord with subscribers. Untapped advertising opportunity in the form of internet, mobile and IPTV are gaining value and telecom operators are trying to capture a major portion of this market.
In� uencing Factors
Increase in number of smartphone users Development of new mobile application Huge IT infrastructure available today to integrate various services Targeting customer individually Wide coverage area
SOCIAL NETWORKING
PRÉVISION FORECAST FOR FY 2016-17
CURRENT STATISTICS FY 2015-16
Global Revenue: $50 bn
Expected to reach $72.40 bn*
*Trend Analysis
PRÉVISION FORECAST FOR FY 2016-17
CURRENT STATISTICS FY 2015-16
Global Revenue: $25.14 bn
Expected to reach: $30.50 bn*
*Trend Analysis
PRÉVISION FORECAST FOR FY 2016-17
CURRENT STATISTICS FY 2015-16
Global Revenue: $30.4 bn
Global Revenue: $36.22 bn*
*Trend Analysis
..................................................................................................................................................................................................................................................................... PRÉVISIONSITM ANNUAL FORECAST 2017
VAS A
ND
MO
BILITY
71

game. Graphics is the backbone of all latest games namely Asphalt 8: Airborne, Badland, Crashland, etc. A� ordable smartphones with high-end processing capability and larger memory have provided the much needed impetus to this industry. The expenditure on games is continuously increasing. The freemium model is the most popular mode of adoption for mobile games. Before developing any game company has to decide on di� erent parameters such as platform, hardware, maintenance, and users. Depending upon all these factors a game is being developed. Di� erent companies are following di� erent types of marketing strategy. Clash of Clans is using ‘Website as a selling tool’ marketing strategy. Google Play and App Store are the best places to upload and sell games and apps by reaching maximum customers. In-game advertisement is one of the revenue sources for most of the m-gaming companies.
In� uencing Factors
Growth of a� ordable feature-rich smartphones Popularity of freemium model both from players as well as advertisers High-quality simulation games Easy availability of games on app stores
STARTUPSIn the last few years, Startups have become one of the most attractive segments for the investors in the Indian market. India is on the third position among global startup ecosystems with more than 4,200 new-age companies. In September 2014, Prime Minister Narendra Modi introduced a big initiative “Make in India” to promote the manufacturing sector by promoting companies to invest in the sector. In August 2015, he declared a new drive “Standup India” to help startups with bank funding and strengthen entrepreneurship among the young Indians. The government wants to make “Start-up India Hub” the bridging link between entrepreneurs, start-ups and investors and follow a ‘hub and spoke’ model association with government bodies, VCs, � nancial and R&D institutions. The government is planning to build a mechanism called SETU (Self-Utilization and Talent Utilization), under the newly formed NITI Aayog, to provide technical assistance and incubation to startups. In 2015 Union Budget, Finance Minister Arun Jaitley set aside ₹1,000 crores to support startups. Startups in India have managed to get funding from various informal channels including corporate, Angel/Seed or VC funding. There are a few startups with innovative business ideas, which have managed to raise funds through “Crowdfunding”.
In� uencing Factors
Government’s initiative on digital India Government push for meeting zero net import targets by the year 2020
Young population of India
MOBILE CONNECTMobile connect is a product developed by personal data program of G.S.M.A. for mobile network operator. Users can authenticate themselves using a mobile phone by mobile connect. They will be allowed to access websites and applications without the need to remember password and username. There are 2 Application Programming Interfaces (APIs) used in mobile connect. First is Discovery API, it helps in recognizing mobile network and association of network with mobile connect. Second is mobile connect API which takes care of authentication via mobile connect. Security is a key aspect. There are 4 levels of assurance (LOA). LOA 4 is much more secure than LOA 1. Users can choose any type of authenticator from the 5 authenticators. SIM Application Toolkit and Smartphone Application are more secure than Seamless authentication, SMS+URL, and USSD. There is a large demand for mobile connect. It was launched in 2014 and its implementation in the city of London was a success. And by 2015, 17 mobile operators from 13 countries had accepted and implemented it. The huge growth potential can be gauged from the fact that there were 34 mobile operators connecting 2 bn subscribers from over 21 countries participated in the mobile connect project held at the end of 2015.
In� uencing Factors
GSMA is driving the adoption of Mobile connect User-friendly and easy to learn E� ective and secure way to authenticate Growing telecom and mobile users
CONCLUSIONThe VAS ecosystem is evolving fast; owing to the increasing role of apps, app stores, smartphone adoption and high-speed data technology. Thus, the service providers can garner a healthy market share in the coming years by providing high quality yet a� ordable 3G. 4G services that will help in the growth of M-commerce and M- entertainment. There has been a push by governments around the world to personalize interaction between citizens and government and this has led to widespread adoption of numerous G2C apps among citizens. Virtual reality is changing the way mobile games are being looked at. By introducing Mobile Connect, the GSMA has intensi� ed its e� orts in bringing a paradigm shift to the way mobile security concerns are being addressed. This can also be viewed as an opportunity for creating new jobs for security developers. The start-up India project is picking up pace and has a noble intention of promoting the spirit of entrepreneurship in India and contributing to the country’s economy.
..................................................................................................................................................................................................................................................................... PRÉVISIONSITM ANNUAL FORECAST 2017
VAS
AN
D M
OBI
LITY
72


INTRODUCTION
The “Smart City” project with an estimated investment of $113 bn over a period of 20 years, aims to o� er a benchmarked quality of life for Indian citizens. It is an urban development vision that uses ICT systems to achieve e� ciency of operations and governance. The smart city ecosystem envisions to meet the needs
of present and future generations with respect to economic, social and environmental aspects. India today stands at the point where it witnesses massive urbanization with an expectation of urban population contributing to 75% of the national GDP in the next 15 years. The smart cities initiatives will focus on management of water supply, electricity, transport, a� ordable housing, health, e-governance and robust IT networks.
SPECIAL FEATURE-SMART CITIES
Last date to submit proposal for 2nd
Budget set by � nance minister for smart cities Smart Cities Awas
Government releasesLaunch of AMRUT
MoUD announces list of top
2nd list of selected smart cities
1st smart city expo held in New Delhi
2nd smart cities expo held in New Delhi
Celebration of 1st anniversary and launch of 20 selected
3rd Smart City expo to be held in New Delhi
2014 Budget
24 May 2016 20 May 2016 11 May 2016 25 jun 2016
25 Jun 2015
10 May 2017
28 Jun 2015 27 Aug 2015 28 Jan 2016 15 Apr 2016
TIMELINE
74
Student TeamShilpy Sinha I Shreyas Khase I Arpita Ghosh I Darset Merchant

FINANCIALThe ambitious smart city project is highly capex and opex intensive. The initial estimate investment amounts to 113 bn USD over a period of 20 years. Following the global footprint, the Indian smart city ecosystem has identi� ed a combination of traditional and innovative instruments to raise the enormous capital requirement which includes Coupon bearing bonds, PSU bonds, REITS, crowd funding, grants, subsidies, FDI etc.
USE CASESGLOBAL USE CASES
UK intends to invest £200 million in the development of Smart London. The Smart London Plan aims to focus on Smart Energy, Smart Water Management, Smart Waste Management, Smart Transport, Health and Assisted Living to overcome various challenges of transport congestion and commotion, quality of urban air, active public participation and pressure on urban infrastructure. Smart Seoul is focusing on various areas such as Smart Metering Project, U-Seoul Net, Smart Work Centers, Community Mapping, u-Seoul Safety Service and Smart Devices for the masses. Various services have been developed such as Seoul Bus app which provides real time accurate bus timings and delays, Mobile Seoul (m.Seoul) which is a mobile based service providing Seoul citizens with 62 di� erent services on over 11 types of mobile devices, u-Shelter which are State-of-the-art bus stops equipped with Digital Map, Destination Search, Tra� c Broadcasting Station and Weather Forecast.
INDIAN USE CASE
GIFT(Gujarat International Finance Tec-City) is a government initiative in partnership with Fairwood India Pvt. Ltd, ECADI, BT and McKinsey & Company to meet the needs of modern Gujarat with technology and infrastructure. The city holds a strategic location at the banks of Sabarmati river on the Delhi-Mumbai industrial corridor and sea link connectivity to International ports of Kuala Lumpur, Dubai, and London .The major highlights of the projects are listed below:
To develop and implement the project, Gujarat International Finance Tec-City Company Limited (GIFTCL), a joint venture company, between Gujarat Urban Development Company Limited(GUDC) and Infrastructure Leasing and Financial Services Limited(IL&FS) has been established. GIFT is being developed on 886 acres of land consisting of Multi Service SEZ with 261 acres dedicated for IFSC and remaining for domestic Finance Centre.
GIFT project is being implemented in 3 phases of 4 years each. Currently, Phase 1(2012 – 2016) is in progress. Union Budget 2016 has given several major tax incentives to GIFT including a reduction in MAT from 18.5% to 9%, waving o� Securities Transaction Tax (STT), Commodities Transaction Tax (CTT) & Long Term Capital Gain Tax & no Dividend Distribution Tax. 0.5 mn direct job opportunities in� uencing the lives of 4mn people will be created.
In� uencing Factors
Rapid urbanization rate in India Major technology advancements- IoT, electric vehicles, HetNet, wireless sensor networks Ageing infrastructure Current GDP growth rate of 7.4% and pro-growth policies of the government. 100% FDI limits in multiple sectors including Telecom and Real Estate
INSIGHTS FROM STAKEHOLDERS’ INTERACTION
The Prevision team interviewed diverse set of stakeholders from ICT vendor companies, system integrators, Government o� cials and industry participants from Smart city implemented in the state of Gujarat. Following are the key insights from these interactions which includes challenges and key points to be considered for planning and implementation of Smart Cities.
CHALLENGES
Leadership and vision at States and ULBs that can play a key enabling role within the development of Smart Cities Proactive participation of citizens E� cient funding structure and monetizing model Management of multivendor environment and Turnkey projects Securing RoW and e� ective planning so as to meet implementation SLAs. Co-ordination amongst Central, State and Local Government bodies Diverse socio-cultural-economic aspect of Indian demography
STANDARDS AND COMPLIANCES
The stakeholders have highlighted the need for interoperability and collaboration across multiple platforms and heterogeneous data. The standards of operation need to be implemented and ensured
..................................................................................................................................................................................................................................................................... PRÉVISIONSITM ANNUAL FORECAST 2017
SPECIAL FEATU
RE
75

SPEC
IAL
FEAT
URE
across the layers of smart city ecosystem ranging from physical layer to transport layer to data and application layer. The National Security Council secretariat, GoI in consultation with Industry (NASSCOM) has prepared Technology Model Framework for Smart Cities which is mandatory to be followed by the companies. The MoUD has also sketched out energy e� ciency requirements for Smart City Proposal such as 10% of city’s energy resources coming from solar power and 80% of the buildings should be energy e� cient and green.
REVENUE MODEL FOR MONETIZATION The domain experts believe Smart cities in India could leverage the below techniques for monetization:
Subscription/utility fees for services like smart metering, parking lot, Wi-Fi usage etc. Short/Long Term Financial Instruments like securities, bonds, commercial papers etc. Renting of land for commercial purposes Advertisement in parking/commercial areas Smart Cards for transport and utility based services. Taxation of public services E� ective waste segregation and treatment for generating commercial agricultural manures and biogas
SECURITY CONCERNS
Security standards shall be enforced and maintained across the layers of the ecosystem. The robust Cyber Security Model Framework de� ned by the GoI after industry consultation shall be intuitively followed to ensure safety across the data, network, device and application layers of the ecosystem. The compliance to Cyber Security Act 2013 shall also be ensured. However the data intensive and technology driven environment is vulnerable majorly to:
Hacking of equipment’s sensors and feeding of false data into the system Destruction of ICT infrastructure due to natural calamities Safety of con� dential data stored on the cloud and other online platforms/applications. Illiteracy and lack of awareness at the citizen end may also lead to major privacy breaches
HUMAN RESOURCES
Smart cities initiative will increase employments in sectors such as IOT, sensor technology, manufacturing, real estate, data analytics, programming, high-end consulting, system and network integration and green
technologies. The smart city project will trigger the demand for skilled and semi-skilled workforce. The corporate professionals and government stakeholders have appreciated key developments in Human capital planning such as:
The government is trying to create a skilled, e� cient workforce which can handle complex ICT systems through initiatives like Make in India and Skill India initiatives (PMKVY) The Ministry of Human Resource Development plans to have 1,000 private universities for producing trained manpower to meet services and industry requirement
STRATEGY FOR INDIAN SCENARIO
Domain experts in cloud technologies have recommended the use of hybrid cloud models to deploy the sensitive and public data depending upon applications and services. A distributed data center architecture serving states across India could be adopted rather than a centralized data center serving all cities Classi� cation of data on priority basis and application of di� erent levels of security based on priorities. Identi� cation of appropriate development strategy i.e. retro� tting/ green� eld/ redevelopment/ pan- India depending upon expected population growth and city area for development into smart city Basic infrastructure development will be the top priority for India Ensuring optimum participation of citizens and adopting the smart lifestyle may be considered at the social front through awareness programs and activities by NGOs Greater e� ectiveness could be achieved by converging the smart city initiative with Digital India, Swachh Bharat Abhiyan, PMJDY and MNREGA etc. for holistic socio-economic development E� cient e-waste management, air quality monitors, air and water purifying towers and increased dependency on renewable energy source shall strengthen bene� ts of the mission
ROLE OF TELECOM OPERATORS
Telecom operators are expected to play either of the below mentioned roles:
Owner: Leading/active participation in consortium for co-development, deployment and operations of smart cities. Operator: Sustenance, support and management of critical component and services like Security & Surveillance, NOC, and Data centers.
..................................................................................................................................................................................................................................................................... PRÉVISIONSITM ANNUAL FORECAST 2017
76

ARCHITECTURE OF SMART CITIES
INSTITUTIONAL INFRA
DATA CENTRE,CLOUD &BACKEND
PLATFORMS
(M2M Platforms,
Service Enablement
Solution, Application
Services, Device
Management Software,
Cloud Services, Integration
and Managed Services,
SDN / NFV)
(Wired and Wireless
Networks, Satellite
Networks, Transmission
Protocols (MQTT), M2M Connectivity,
MAN, WAN, PAN, HAN)
COMMUNICATIONS NETWORK
DEVICES AND CHIPSETS
(Sensors, RFID Tags, Chipsets, Mobile devices,
Embedded Software)
SERVICES / APPLICATIONS THAT COVER
PHYSICAL INFRA
DASHBOARD&
INTEGRATEDMANAGEMENT
AND COMMAND
CENTRE
ECONOMIC I
NFRA
SOCIAL
INFRA
GOVERNANCE(Central, State, City)
SAFETY & SECURITY(City Surveillance,
RemoteMonitoring)
TRANSPORT(Smart Ticketing,
Smart Signage & Parking)
UTILITIES(Smart Electricity,
Power grid Smart Meters)
HEALTHCARE(Remote assistance,
Smart Physical Safety)
BUILDINGS(Remote Appliances
Control, Security, Climate Control)
INFORMATION AND DIGITAL SECURITY
Enabler: Laying down of communication network for end to end connectivity, consisting of transport and access technologies
CONCLUSION
The industry interactions clearly depicted that soft infrastructure such as quality of life, education and
environment besides the physical infrastructure will be the true success of Smart cities. Strong regulatory guidelines and political stability with commendable PPP will be vital success factors for smart cities. Citizens will be empowered to see their cities as interactive, e� cient, � exible and adaptive by being engaged and informed about their activities, their neighborhood, and the wide urban ecosystem on a real time basis.
..................................................................................................................................................................................................................................................................... PRÉVISIONSITM ANNUAL FORECAST 2017
SPECIAL FEATU
RE
77

INTRODUCTION
Prevision’15 special features focused on SDN/NFV technologies in an e� ort to decrease the complexity of the network by virtualization and following the principle of Centralizing what is possible and distributing what is must.
SDN as an architecture disassociates the control plane and the data plane disengaging the network control and forwarding functions. The aim is to make the underlying infrastructure in a metaphysical state and the network to be controlled by a centralised control. NFV aims to consolidate the network equipments onto the high volume servers and storages. The industry has witnessed wide spread adoption of SDN/NFV concepts. The underlying article intends to capture some of the major highlights of SDN/NFV.
CURRENT TRENDS IN SDN / NFV
The SD-WAN as a solution for enterprises builds on the growth of cloud computing and the business need of reduction in MPLS costs. These bene� ts will drive a signi� cant number of enterprises into adopting SD-WAN. Concept of “ Service chaining” allows operators to con� gure network requirements in software without touching the hardware thus addressing the problem of the proprietary hardware that telecom network operator faces.
OEM
Project “Calico v1.0” by the Metaswitch which implements Layer 3 approach instead of overlay networks or tunnels, plugs into the same APIs as the other SDN / NFV tool, o� ers much simpler way to get IP packets from one workload to another
IT SERVICE PROVIDERS
Apstra provided solution for multi vendorSDN by automating the operations of the data centre right from the design phase to the deployment or operational phase HP has partnered with Accton and Cumulus Networks for its new line of open network switches, o� ering its customers a choice of hardware and software on switches with HP support One of the major concerns of NFV is security. However, the automation in the tools and solutions of NFV will solve this issue. With network topology being no longer static, the Infrastructure Management plays a pivotal role
which will allow things to be changed programmatically through SDN controllers
CSP
A project called “OpenDayLight” consists of a many vendors to address the need for an open reference framework programmability for customers of varied sizes and domains With 63% of large enterprises in India planning to deploy SDN as a part of their network architecture in 2016, it is considered as the next game changer in the networking industry NFV is having a huge in� uence on the carrier cloud plans which had enabled telcos carriers to leverage the advantages of cloud computing The major challenge with respect to NFV is to deploy it on real, multiservice, optimum � eld deployment and to earn full revenue opportunities. Though none of the telcos have announced plans to adopt NFV, yet Reliance Jio has announced that its network is NFV ready and Airtel with, Vodafone have started exploring its potential. Operators in other regions such as AT&T, SK Telecom, NTT Docomo etc. have started using NFV to provide better services to enterprise customers. Another challenge faced today with NFV is migration where operators are seeking steady path to virtualization for running them parallel with the existing OSS and organizational processes.
FUTURE SCOPE OF SDN AND NFV
The optical network vendors are on the verge of deploying SDN and NFV to improve the programmability and operations thus reducing their CAPEX and OPEX Large service providers will implement SDN and NFV with COTS as the platform into their mainstream cloud and network architectures Network automation model which will consist of all-IP / Ethernet/ optical network architecture from access to core will enable dynamic pricing, on demand resource access, service instantiation, assurance and analytics SDN and NFV which were traditionally linked with the � xed wireline networks will now move wireless which will demand the telcos to transform their / networks into something resembling the facebook – style network As of now, every service providers’ APIs and languages are unique and they provide services based on these languages. But in coming future we could see service providers use same languages, with much needed � exibility to users because of the power vested in them i.e. full interoperability
SDN / NFV REVISITING PREVISION’15
78

• 3GPP: 3rd Generation Partnership Project• ADSL: Asynchronous Digital Subscriber Line• AGR: Adjusted gross revenue• AMRUT: Atal Mission for Rejuvenation and Urban Transformation• API: Application Programming Interface• APT: Advanced Persistent Threats• BT: British Telecom• BTS: Base Transceiver Station• BWA: Broadband Wireless Access• BYOD: Bring Your Own Device• CBT:Cognitive Behavioral Therapy• C-DAC:Centre for Development of Advanced Computing• CES:Consumer Electronics Show • CTT:Commodities Transaction Tax• DCIM:Data Centre Infrastructure Management• DHCP: Dynamic Host Con� guration Protocol• DoT: Department of Telecommunication• DSL: Digital Subscriber Line• ECADI: East China Architectural Design & Research Institute• FCU: Free Cooling Unit• FDI:Foreign direct investment• FTTx: Fiber to the x(Home/Building/ Premises/Cabinet/Neighborhood)• G2C: Government to Citizen• GIFT:Gujarat International Finance Tec-City• GIFTCL:Gujarat International Finance Tec-City Company Limited• GPON: Gigabit Passive Optical Network• GSM: Global system for mobile communication• GSMA: Groupe Special Mobile Association• GUDC:Gujarat Urban Development Company Limited• HetNet:Heterogeneous Network• HFC:Hybrid Fiber Coaxial
• ICT: Information and Communications Technology• IFSC: International Financial Services Centre• IL&FS:Infrastructure Leasing and Financial Services Limited• IMS: IP Multimedia Subsystem• IoT: Internet of Things• IPS: Intrusion Prevention System• IVRS: Interactive Voice Response• LOA: Levels of Assurance• LTE: Long Term Evolution• M2M: Machine to Machine• MAM: Mobile Application Manager• MDM: Mobile Device Manager• MoUD: Ministry of Urban Development• MPLS: Multi-Protocol Label Switching• MVNO: Mobile Virtual Network Operator• NBN: National Broadband Network• NFC: Near Field Communication• NGN: Next Generation Network• NLD/ILD: National/International long distance• NOC: Network Operations Center• NOFN: National Optical Fiber Network• OTT: Over the Top• PDA:Personal Digital Assistant• PMD:Prefabricated Module Data Centers• PPP: Public-Private Partnership Model• PSTN: Public Switched Telephone Network• PSU: Public Sector Undertaking• RAN: Radio Access Network• RCS-e: Rich Communication Services• REITS: Real Estate Investment Trusts• RFID: Radio Frequency Identi� cation• SD-WAN: Software De� ned Wide Area Network• STT:Securities Transaction Tax• TRAI: Telecom Regulatory Authority of India
• ULB: Urban Local Bodies• UPI:Uni� ed Payment Interface• VLC: Visible Light Communication• VoD: Video on Demand• VoLTE: Voice over LTE• VR:Virtual Reality
REFERENCES
• News Services• Business Standard• Press Trust of India• Reuters• Times News Network• Voice & Data
WEBSITES
• www.adb. org• www.africaneconomicoutlook.org• www.billingworld.com• www.bloomberg.com• www.booz.com• www.channelworld.in• www.cisco.com• www.communicationstoday.co.in• www.comsnets.org• www.dot.gov.in• www.economictimes.com• www.economist.com• www.eia.doe.gov• www.engadget.com• www.entrepreneur.com• www.� nancialexpress.com• www.frost.com• www.gizmodo.com• www.idc.com• www.imf.org• www.informationweek.com• www.itu.int• www.knowledgefaber.com• www.moneymint.in• www.outlookindia.com• www.pcworld.com• www.planningcommission.nic.in• www.telecomtiger.com• www.tmcnet.com• www.trai.gov.in• www.worldbank.org
ABBREVIATIONS
79

Starting from front row, left to right:Jimit Raval, Chetna Chandiramani, Shilpy Sinha, Arpita Ghosh, Anubha Pandit, Dhruvika Solanki, Rishika Ghosh, Nilesh Bamotriya, Sumit Singh, Prof. Giri Hallur, Shrikrishna Sumant – Deloitte Haskins & Sells, Surya Nair, Darset Merchant, Aakanksha Sharma, Nikhilesh Harde, Arnab Mohapatra, Prathamesh Pande, Tanuj Gupta, Akash Agrawal, Roinak Sarkar, Kushagra Nagpal, Naresh kumar Hegde, Prashant Tandekar, Shreyas Khase, Shivam, Rituraj Zala, Arjun Iyer, Arun Suresh, Faraaz Ahmed Gausee
PRÉVISION 2016: JUNIOR AD-HOC TEAM
BROADBAND• Dhaval Rabadiya• Abhishek Sapra• Garima Bhutani
CONSUMER ELECTRONICS
TELECOMSOFTWARE
VAS &MOBILITY
GLOBALTELECOM
• Vishal Kumar• Kislay Bhardwaj• Shriya Sontakke
• Nisarg Patel • Viraj Thakur• Abhilash Katkar
• Vaibhav Kulkarni• Rohit Mohite• Sakshum Vaneet Gupta• Neela Sakhardande
• Abhishek Tambulwadkar• Sabarinath Reddy• Titiksha Singh• Shivangi• Siddhesh Hule
COMMUNICATIONINFRASTRUCTURE
• Saurabh Mukherjee• Aniket Chavan• Siddharth Sheth
ECONOMY
• Saurabh Vispute• Nikhil Thakare• Arnab Chakrabortty
INDIANTELECOM
• Yash Nalawade• Akshar Gohel• Rahul Menon
TELECOMTECHNOLOGIES
• Amey Deole• JyotsnaVerma• Saurabh• Swapnil Labhane
SPECIAL FEATURE
• Omkar Lad• Nakul Bhakri• Hitesh Patil• Kasti Joshi
TEAM PRÉVISION
80