
WC/93/006 Selenium in the environment: an appropriate ...Selenium in the environment : an...
39
Transcript of WC/93/006 Selenium in the environment: an appropriate ...Selenium in the environment : an...

British Geological Survey
TECHNICAL REPORT WC/93/6 Overseas Geology Series
SELENIUM IN THE ENVIRONMENT : AN APPROPRIATE ANALYTICAL METHODOLOGY M CAVE, K HARMON, N MITCHELL, J-L DECKER, H LEFRANC, P BLACKWELL AND S REEDER
A report prepared for file Overseas Development Administration under the ODNBGS Technology Development and Research Programme, Project 9 1/16
ODA classificabz : Subsector: Geoscience Theme: G2 - Identify and ameliorate minerals-related and other geochemical toxic hazards Project title: Environmental geochemical mapping Project reference: R5547
Biblwgraphu reference : Cave M and others 1995. Selenium in the environment : an appropriate analytical methodology BGS Technical Report WC/93/6
Kkywords : Selenium, environmental samples, hydride generation, flow injection sample introduction
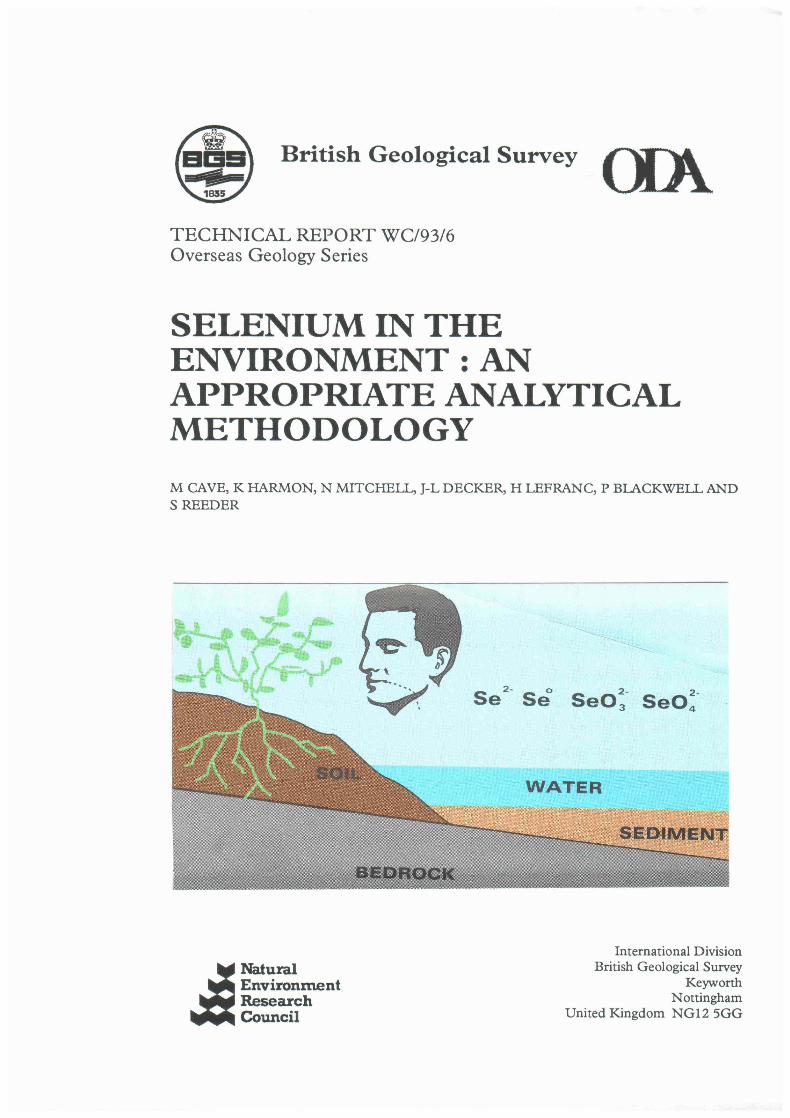
Front cover illustration : The chemical forms of selenium found in the environment
8 NERC 1995
Keyworth, Nottingham, British Geological Survey, 1995

CONTENTS
EXECUTIVE SUMMARY 1. 2.
3.
4.
5.
6. 7. 8.
INTRODUCTION EXPERIMENTAL 2 1 Instrumentation 2.2 Reagents SYSTEM OPTIMISATION AND CHARACTERISATION 3.1 Acid Carrier Manifold
3.1.1 3.1.2
Determination of Optimum Experimental Conditions Procedure for the Analysis of Water Samples
3.2 NaBH, Carrier Manifold INTERFERENCE EFFECTS 4.1 Acid Carrier Manifold 4.2 NaBH, Carrier Manifold 4.3 Conclusions and recommendations DIGESTION PROCEDURES 5.1 Test Materials 5.2 Alkaline Extraction 5.3 Acid Extraction 5.4 Total Digestion Procedure 5.5 Digestion of Plant Material CONCLUSIONS AND RECOMMENDATIONS ACKNOWLEDGEMENTS REFERENCES
APPENDIX 1 - Recommended Methods for the Determination of Selenium in Environmental Materials
A1 INSTRUMENTATION A2 REAGENTS
Page no. 3 4 6 6 6 7 7 7 10 10 12 13 17 18 19 19 19 22 23 24 27 29 29
33 33 34
A3 ANALYSIS OF TOTAL INORGANIC SELENIUM IN WATERS 35 A4 ANALYSIS OF TOTAL SELENIUM IN SOILS AND SEDIMENTS 36 A5 ANALYSIS OF TOTAL SELENIUM IN PLANT MATERIAL 37
2

EXECUTIVE SUMMARY
This report forms part of the ODABGS Technology Development and Research (TDR) Programme "Environmental Geochemical Mapping" project (R5547, 9 1/16) studying the use of regional geochemical data, including that from ODA sponsored mineral exploration surveys, for environmental studies in developing countries.
Selenium is the rarest of all elements considered essential for human health , occurring at an average crustal abundance of only 0.05 mg kg-1. In combination with vitamin E, it fulfils a vital role in preventing the degradation of biological membranes by forming a component of the cytosolic enzyme glutathione-peroxydase (GSH-Px). A dietary selenium intake of approximately 0.1 mg kg-1 is generally recognised as necessary. At significantly lower levels, susceptibility to certain forms of carcinoma and a wide range of cardio-vascular and osteoarthropatic diseases is markedly increased.
The phenomenon of natural selenosis (selenium poisoning) is less widespread than selenium deficiency, being primarily restricted to regions underlain by organic rich shales, or localities hosting extensive sulphide mineralisation. Toxicity effects such as 'alkali disease' and 'blind staggers' have been recognised in ruminants for over a century, and have been more recently implicated in human Iodine Deficiency Disease (IDD).
In order to assess the relationships between the geochemistry of selenium and the environment and to monitor its effect on human and animal health it is necessary to be able to quantify selenium in environmental materials. Because of the low natural abundance of this element many of the standard analytical methods for measuring trace metal concentrations in natural materials are not sensitive enough for selenium.
This report describes a simple and relatively inexpensive analytical method for selenium determination using hydride generation atomic absorption analysis with flow injection sample introduction. Optimisation of instrumental conditions, methods for minimising interference effects and sample digestion procedures for environmental materials are investigated. Recommended methods for the determination selenium in natural water, soils and sediments and plant material are described with detection limits of 0.8 pgl-1, 0.005-0.015 mgkg-1 and 0.005- 0.010 mgkg-1 respectively. The methods have been validated by the analysis of standard and certified reference materials.
This study provides analytical chemists in developing countries with an effective methodology for monitoring selenium in the environment. This will be of particular benefit in countries where selenium deficiency and toxicity may be having a negative impact on human health and animal health and productivity.
3

1. INTRODUCTION
This report forms part of the ODA/BGS Technology Development and Research (TDR) Programme "Environmental Geochemical Mapping" project (R5547, 9 1/16) studying the use of regional geochemical data, including that from ODA sponsored mineral exploration surveys, for environmental studies in developing countries.
Selenium is the rarest of all elements considered essential for human health , occurring at an average crustal abundance of only 0.05 mg kg-1. In combination with vitamin E, it fulfils a vital role in preventing the degradation of biological membranes by forming a component of the cytosolic enzyme glutathione-peroxydase (GSH-Px). A dietary selenium intake of approximately 0.1 mg kg-1 is generally recognised as necessary. At significantly lower levels, susceptibility to certain forms of carcinoma and a wide range of cardio-vascular and osteoarthropatic diseases is markedly increased. In animals this leads to negative effects in productivity.
While natural selenium deficiency is inherent to many areas with igneous or high-grade metamorphic bedrock, thin soils and predominantly acid drainage, the avoidance of concomitant health problems is now possible through the careful application of selenium compounds in agricultural fertiliser or as a direct dietary supplement. Excessive additions must be avoided however, as Se-toxicity problems are encountered by most mammals if ingested at levels of above 2 mgkg-1.
The phenomenon of natural selenosis (selenium poisoning) is less widespread than selenium deficiency, being primarily restricted to regions underlain by organic rich shales, or localities hosting extensive sulphide mineralisation. Toxicity effects such as 'alkali disease' and 'blind staggers' have been recognised in ruminants for over a century, and have been more recently implicated in human Iodine Deficiency Disease (IDD).
In order to assess the relationships between the geochemistry of selenium and the environment and to monitor its effect on human and animal health it is necessary to be able to quantify selenium in environmental materials. Because of the low natural abundance of this element many of the standard analytical methods for measuring trace metal concentrations in natural materials are not sensitive enough for selenium. This report concentrates on the development of a suitable method for the determination of selenium in natural water, soil and sediments. The information provided within this report should allow a competent analytical chemist, using existing or relatively inexpensive equipment, to set up a method to analyse selenium at the levels found in natural materials. It will also provide background information on how to adapt
4

procedures to cope with particular sample types and provide some insights into measuring the chemical forms of selenium in environmental materials.
Following a detailed review of recent methodologies for the determination of selenium in environmental materials (Cave et al., 1993), a method is proposed for selenium determination using hydride generation atomic absorption analysis with flow injection sample introduction. The method was chosen to meet the following criteria:
i The detection limit is e 1 pgl-1 in solution;
ii The analysis time is relatively fast (Welz and Schubert-Jacobs (1991) give a sample throughput of 180 sample h-1) and the instrumentation is relatively inexpensive to run;
iii Interference effects are well understood and can be corrected;
iv The method is a solution technique applicable to both waters and solid digests;
v The method is relatively simple to run and has the capability of being automated.
Flow injection - hydride generation - atomic absorption spectrometry has been used by a number of workers to determine selenium (Chan, 1985; Chan and Sadana, 1992; Guo et al., 1990; Offley et al., 1991; Welz and Schubert-Jacobs, 1991; Xu et al., 1990; Zhang et al., 1989). In the studies of Chan (1985) and Chan and Sadana (1992), Flow Injection Analysis (FIA) hydride generation AAS was used specifically for environmental materials. Possibilities for lowering the detection limits and working in more complex matrices are illustrated in the FIA manifolds set up by Offley et al. (1991), Xu et al. (1990) and Zhang et al. (1989), where on-line ion exchange columns were used to remove matrix effects or preconcentrate the selenium.
Although these initial studies have shown that this technique has the potential for monitoring selenium in natural materials there is a specific need to assess its applicability in terms of
0 Optimising the sensitivity of the technique to measure selenium at the low levels required for analysis of natural materials.
Assessing the susceptibility of the method to chemical interferences likely to be found in natural materials and suggest methods for overcoming them.
Optimising the sample preparation and digestion methods to ensure rapid and quantitative dissolution of natural materials.
This report provides a systematic experimental approach to all of these areas.
5
2. EXPERIMENTAL
2.1 Instrumentation
The instrumentation used consists of a Perkin-Elmer 3 100 atomic absorption spectrometer with a selenium electrodeless discharge lamp (EDL) light source (Perkin-Elmer P/N N066- 121 8) operated from a Perkin-Elmer EDL power supply at 6W. The spray chamber and burner were removed and replaced with a custom built tube furnace (Carbolite Furnaces Ltd., Sheffield, England) operated at 900°C with a quartz tube atomiser (Perkin-Elmer P/N B018-2997). A 24 cm Nafion membrane drying tube (Permapure Products, Monmouth Airport, Farmingdale, N.J., U.S.A.) connects the quartz tube atomiser to the glass gas-liquid separator (Perkin-Elmer P/N B019-3772). The instrumentation is shown schematically in Figure 1. The two different FI manifolds used in this work to produce the H2Se are shown in Figure 2. The manifolds are fed by a four channel peristaltic pump (Gilson Minipuls 2) and the sample is injected into the carrier stream with a manual 6 port valve with a 0.5 ml sample loop (Omnifit, Cambridge, England). The signal is measured on a chart recorder (Kipp and Zonen, Holland) attached to the recorder output and an Epson printer attached to the RS232 interface of the AAS.
2.2 Reagents
The chemical reagents used are: 35% w/v hydrochloric acid (BDH Chemicals Aristar grade); 40% w/v hydrofluoric acid (BDH Chemicals Aristar grade); 70% w/v nitric acid (BDH Chemicals Aristar grade); 70% w/v perchloric acid (BDH Chemicals Aristar grade); hydrated magnesium nitrate (MgNO3.6H20 BDH Chemicals Aristar grade); sodium hydroxide (BDH Chemicals Analar grade); potassium iodide (BDH Chemicals Analar grade); sodium borohydride pellets (BDH Chemicals Spectrosol grade); 1000 mg/l Se(1V) as selenous acid (H2Se03 BDH Chemicals Spectrosol grade); 1000 mg/l Se (VI) as sodium selenate in 1% NaOH (Na2SeOq.(lOH20) Aldrich Chemical Co. Ltd.), 1000 mg/l copper in 1% nitric acid (BDH Chemicals Spectrosol grade); 10,000 mg/l iron in 1 M nitric acid (Fisons standard metal solution). High purity analytical reagent grade water (resistivity 18 Mmcm) was prepared using a commercial laboratory reverse osmosis/deioniser system (Elga Ltd).
6

Furnace ( 900°C)
Ar in a Ar out
Drying tube
Glass beads
Figure 1. Schematic diagram of the hydride gas liquid separator and the gas transfer manifold to the quartz tube atom cell
(a) Acid Carrier Manifold (b) NaBH, Carrier Manifold
Pump Argon in
To quartz
and AA &\ 0 . A sample loop furnace
iste . T -
t
Pump 0.5ml sample Argon
I
in
To quartz furnace and AA
Figure 2. FIA manifolds for sample introduction into the gas liquid separator via (a) acid carrier and (b) NaBH4 carrier
3. SYSTEM OPTIMISATION AND CHARACTERISATION
3.1 Acid Carrier Manifold
3.1.1 Determination of Optimum Experimental Conditions
Initial experiments were carried out to determine the effect of the major operating parameters (carrier and reagent pump rates, argon carrier gas flow rate, concentration of the acid in the
7

carrier solution and concentration of NaBH4 reductant solution) on the selenium absorption signal. The effect of combined HC1 carrier and NaBH4 reductant flow rates and the argon gas flow are summarised in Figure 3. The optimum argon gas flow rate is 108 ml/min and is relatively independent of the reagent flow rate. At the maximum achievable pump rate, equivalent to a total reagent flow rate of 12.3 ml min-1, the peak height was still increasing. The optimum conditions adopted for subsequent work are summarised in Table 1.
0.14
0.12
5 0.1
Zi ' 0.08
2 0.06 3 & 0.04
0.02
T
--
--
--
--
--
-~
- 4.0 - 6.3 - 8.6 - 12.2
Fluid flow description
0 4 I
0 50 100 150 200 250
Argon gas flow rate (ml/min)
Flow rate (ml min-1) Reagent
Figure 3. Effect of argon flow rate and combined reagent flow rate on the peak height signal for 10pgl-1 Se. The values in the legend represent combined HC1 carrier and NaBH4 reductant flow rates (ml min-1).
Reduc tan t
Acid sample carrier Hydride stripping
gas
3.7 0.2% NaE3H4 w/v +
8.6 1 M HC1 108 Argon gas
O.OS%NaOH
Table 1. Optimum conditions for acid carrier FIA manifold using a 0.5ml sample loop
Figure 4 shows the effect of varying the concentration of HCl in the sample and the NaE3H4 reductant concentration. The HCl concentration effect is relatively small compared to that of
8

changing the concentration of the reductant. The peak height is still increasing at the highest NaBH4 concentration of 0.4%. With prolonged operation at NaBH4 levels higher than 0.4%, however, the increased evolution of hydrogen causes the reaction solution to be forced out of the GLS and into the quartz atomisation cell. As this causes the production of steam and prevents further measurements being made, it was decided not to exceed NaBH4 concentrations of 0.2%.
'vi
1 X i= 0.16 +, 0.14 2 & 0.12 3 0.1 e 0.08 2 .!$ 0.06 iZ 0.04
0.02 a
HC1 Concentration (% w/v) 6 0 . 1
+ 0.5 + I
*3
- 5
I I I
0 0.1 0.2 0.3 0.4
Sodium borohydride concentration (% w/v)
Figure 4. EfSect of varying the concentration of HCl in the sample and the concentration of NaBH4 reductant on the peak height signal for I0 pg/l Se
The peak height of the absorbance signal, in the continuous flame mode, was measured on a chart recorder output with instrument gain set to 10. With this option, different integration times can be selected through the instrument software ranging from a minimum of 0.1s upwards. This, in effect, gives a signal averaged output at the recorder. At the optimum conditions identified in Table I , a solution of 1 pg1-l Se (IV) gave 30 detection limits of 0.41 pgl-1 with a 0.1s integration time and 0.14 pg 1-1 with a 0.4s integration time. Above 0.4-0.5s integration time, there was no significant improvement in detection limit and peak resolution deteriorated at about 1s integration time. An integration time of 0.5 s was therefore chosen as optimum when using the chart recorder. Using the 'Peak Height' mode on the instrument and an integration time of lOs, similar detection limits could be obtained using direct digital printout to the Epson dot matrix printer.
To summarise the detection limit for the acid carrier manifold is 0.14 pg 1-1 in solution
9
3.1.2 Procedure for the Analysis of Water Samples
Found pg/l
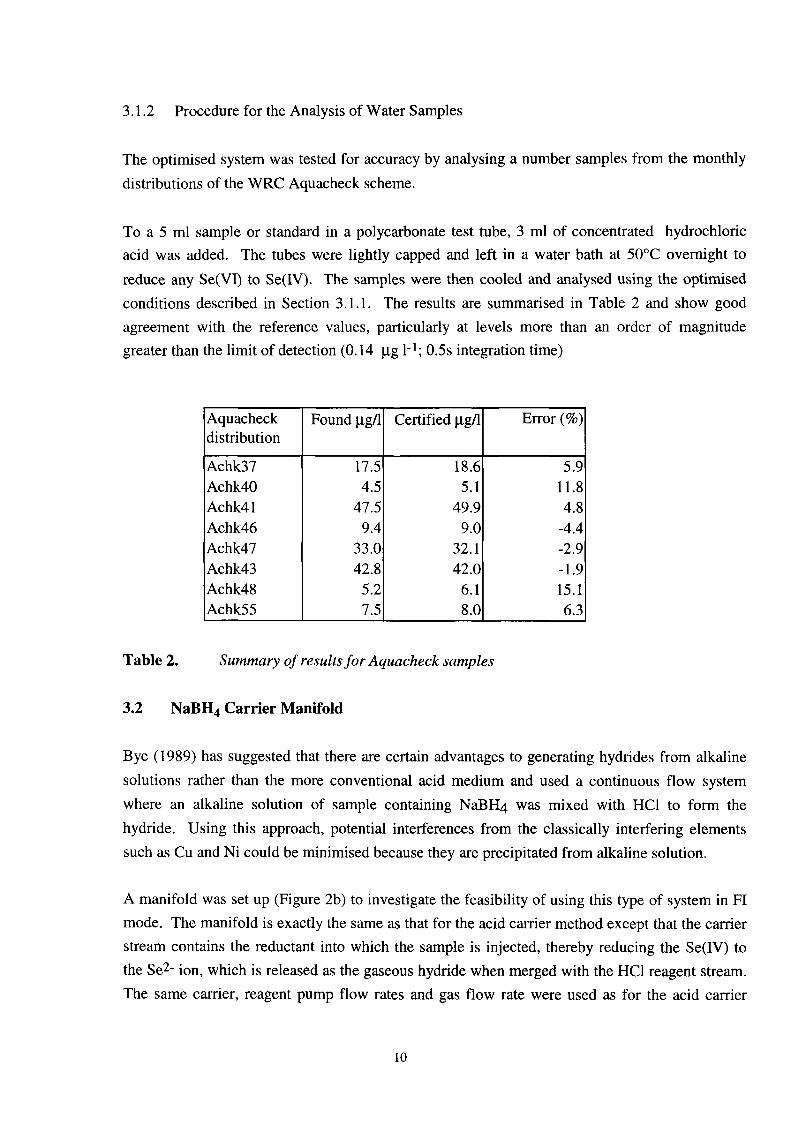
The optimised system was tested for accuracy by analysing a number samples from the monthly distributions of the WRC Aquacheck scheme.
Certified pg/l Error (%)
To a 5 ml sample or standard in a polycarbonate test tube, 3 ml of concentrated hydrochloric acid was added. The tubes were lightly capped and left in a water bath at 50°C overnight to reduce any Se(V1) to Se(IV). The samples were then cooled and analysed using the optimised conditions described in Section 3.1.1. The results are summarised in Table 2 and show good agreement with the reference values, particularly at levels more than an order of magnitude greater than the limit of detection (0.14 pg 1-1; 0.5s integration time)
17.5 4.5
47.5 9.4
33.0 42.8
5.2 7.5
Aquacheck distribution
18.6 5.9 5.1 11.8
49.9 4.8 9.0 -4.4
32.1 -2.9 42.0 -1.9
6.1 15.1 8.0 6.3
Achk37 Achk40 Achk4 1 Achk46 Achk47 Achk43 Achk48 Achk55
Table 2. Summary of results for Aquacheck samples
3.2 NaBH4 Carrier Manifold
Bye (1989) has suggested that there are certain advantages to generating hydrides from alkaline solutions rather than the more conventional acid medium and used a continuous flow system where an alkaline solution of sample containing NaBH4 was mixed with HCl to form the hydride. Using this approach, potential interferences from the classically interfering elements such as Cu and Ni could be minimised because they are precipitated from alkaline solution.
A manifold was set up (Figure 2b) to investigate the feasibility of using this type of system in FI mode. The manifold is exactly the same as that for the acid carrier method except that the carrier stream contains the reductant into which the sample is injected, thereby reducing the Se(IV) to the Se2- ion, which is released as the gaseous hydride when merged with the HCl reagent stream. The same carrier, reagent pump flow rates and gas flow rate were used as for the acid carrier
10
method. The concentrations of NaBH4, NaOH, and HC1 in the carrier and reagent for this manifold were calculated to give the same delivery of reagent per ml of total solution arriving at the gas liquid separator as for the acid carrier method and are summarised in Table 3. For this method the standard selenium solutions were made up in a solution containing the same concentrations of NaBH4 Detection limits were calculated using the same signal processing as in the acid carrier method. An integration time of 0.5s gave a similar detection limit of 0.16pgl-1.
and NaOH as the reductant carrier flow.
Gas flow Sample loop
To summarise, the detection limit for the NaBH4 carrier manifold is 0.16 pg 1-1 in solution
108 ml/min Ar 0.5ml
Hydride releasing reagent 2.33 M HC1 Flow rate 3.7 ml/min
Carrier 0.09% NaBH4 w/v + 0.02%NaOH Flow rate 8.6 ml/min
Table 3. Operating conditions for the NaBH4 carrier manifold
This arrangement shows potential for the determination of Se(IV) in an alkaline medium but, if Se(V1) is to be determined a reduction to Se(N) must be carried out first. In the analysis of selenium in copper, Wickstrom et al. (1991) digested the sample in HC1, thereby reducing all the selenium to Se(IV), and then made the solution alkaline. For routine use in environmental applications this would introduce another sample preparation step and require the addition of relatively large amounts of reagent to make the acidified sample alkaline, which may produce high blank values and have cost implications. In this work some attempts have been made to reduce Se(V1) to Se(IV) in alkaline solution using H202 (suggested by Neve et al. (1980)) and NH2OH. We have found that these reagents have a number of drawbacks associated with the reduction being non-quantitative. Bye (1988) and Krivan et al. (1985) confirm that the reagents interfere with the action of the borohydride reductant during the hydride formation and state that excess reagent must be removed before analysis. Until a simple method of reduction of Se(VI) to Se(1V) in an alkaline solution can be devised, the use of this method will have its limitations.
The performance of this manifold with regard to interference effects is discussed in Section 4.2.
11

4. INTERFERENCE EFFECTS
Interferent Transition metals (particularly Cu and Ni)
Hydride forming elements Nitrite Organics (particularly humic material)
The benefits that accrue from hydride generation sample introduction are tempered by the interference effects of concomitant chemical species in the sample matrix. The nature of these interference effects has been widely reported in the literature. Examples of recent studies include: Agterdenbos and Bax (1986); Bye (1987); Cutter (1983); Roden and Tailman (1982); Welz and Stauss (1993). The interferences that occur in real sample matrices cause suppression relative to samples containing selenium alone and can be divided into two categories:
Remedy Use >6M HC1 sample matrix Complex transition metals Remove by ion exchange Generate hydride from alkaline solution Use Fe(II1) as releasing agent Use FI sampling and optimised operating conditions Complex with sulfanilamide Digest organics with oxidising agents Selectively remove organics by solid phase extraction
i Those that prevent the quantitative formation of SeH2 from selenium in solution;
ii Those which affect the atomisation process after the gaseous hydride has been formed.
The major interferences and the usual method of counteracting the interference are summarised in Table 4
Table 4. Summary of interfierences encountered in the determination of Se by hydride generation AA
For natural water samples, the transition metals and other hydride forming elements are usually not present at sufficiently high levels to cause significant effects. There is evidence, however, (e.g. Cutter, 1983; Roden and Tailman, 1982) that sufficient nitrite or organic material can occur in natural waters to necessitate the remedial methods outlined in Table 4 to be used to remove interferences. For the solid environmental samples such as vegetation, sediments and soils, the transition metal content is much higher than in natural waters and is potentially the most important interferent.
12

4.1 Acid Carrier Manifold
100
90
g 80 --
e t 70
.z 60
2 50
8~ 40
E E
- E
C I
.z 3 30 B .5 20 e,
I - 2 10
0 .
In this work the interference studies have been focused on the removal of the most likely interferent in environmental samples, which is that of copper. There are a number of approaches to removing the interferent effects of copper on SeH, formation which are summarised in Table 4. The use of high concentrations of HCl (>6M) has been shown to be effective (e.g. Buckley et al., 1992) but can be cost prohibitive due to the use of large volumes of high purity acid and because the acid vapours from the samples can cause corrosion of instrumentation and are unpleasant to operators. Bye (1987) has shown that iron can be an effective releasing agent when copper and nickel are present and, as Chan (1985) points out, many environmental samples contain appreciable amounts of Fe which acts as a 'natural' interferent suppressor. Another simple approach is that used by Buckley et al. (1992) in which iodide is added to the Nal3H4 reductant.
-
~~
~~
~~
--
~~
--
I --
--
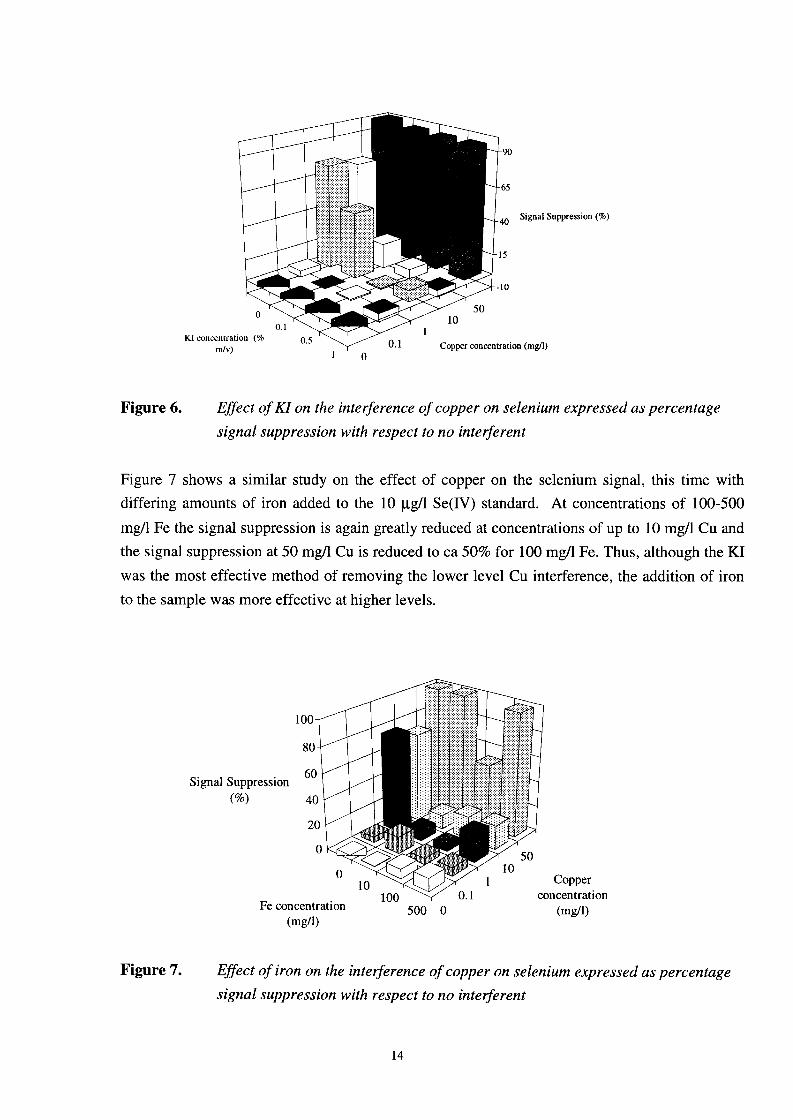
In this study, the effect of HC1, Fe and KI concentration on the removal of the copper interference have been investigated. Figure 5 shows how the acid carrier manifold exhibits the classic interference of copper on the selenium signal. Figure 6 shows the effect of varying the concentration of KI in the reductant at different copper concentrations in a 10 pgA Se (IV) standard. At concentrations of 0.5-1.0% w/v KI in the borohydride reagent the effect of 10 mg/l Cu are greatly reduced, although at 50 mg/l Cu the Se signal was still completely suppressed. As NaBH4 rapidly decomposes when increasing concentrations of KI are added a concentration of 1% KI w/v was not exceeded.
Figure 5. EfSect of copper on the relative peak height obtained when no intel3rerent is present
13
Signal Suppression
Copper concentrati KI concentration (I
' 0 d v )
Figure 6. Effect of KI on the interference of copper on selenium expressed as percentage signal suppression with respect to no interferent
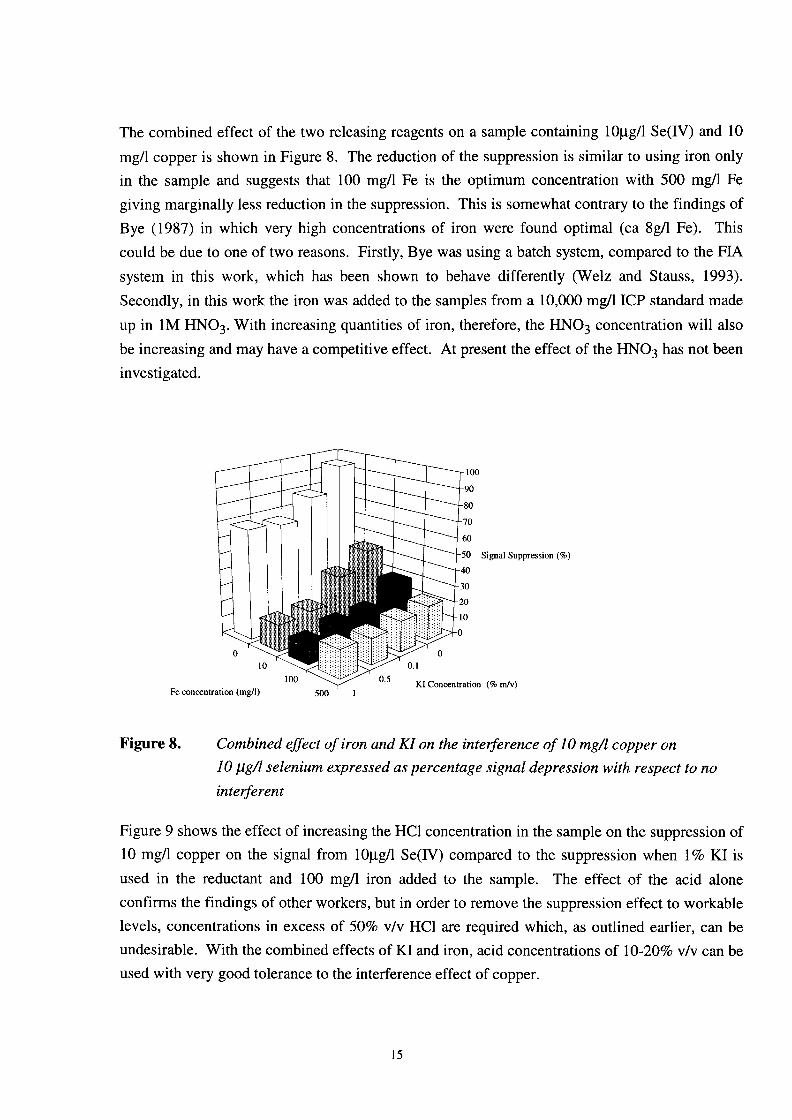
Figure 7 shows a similar study on the effect of copper on the selenium signal, this time with differing amounts of iron added to the 10 pg/l Se(IV) standard. At concentrations of 100-500 mg/l Fe the signal suppression is again greatly reduced at concentrations of up to 10 mg/l Cu and the signal suppression at 50 mg/l Cu is reduced to ca 50% for 100 mg/l Fe. Thus, although the KI was the most effective method of removing the lower level Cu interference, the addition of iron to the sample was more effective at higher levels.
Signal Suppression (%)
Copper 100 'r/ 0.1 concentration
500 0 (mdl) Fe concentration (mg/l)
Figure 7. EfSect of iron on the interference of copper on selenium expressed as percentage signal suppression with respect to no interferent
14
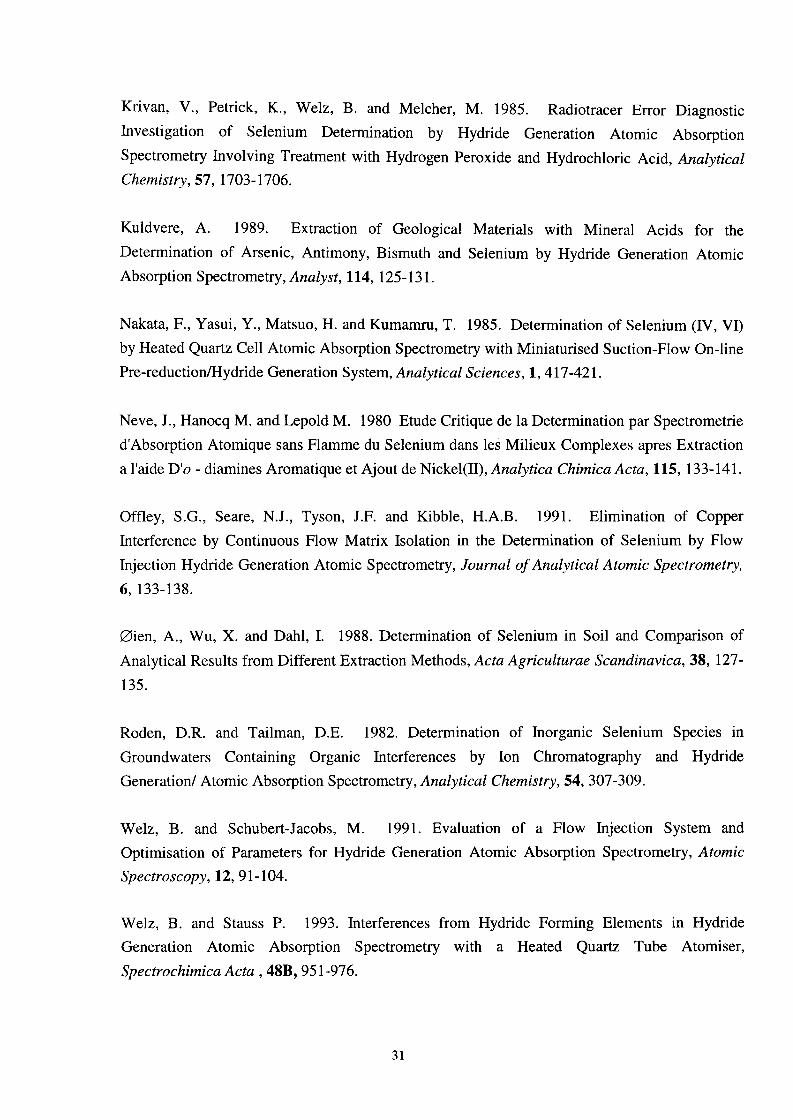
The combined effect of the two releasing reagents on a sample containing lOpg/l Se(IV) and 10 mg/l copper is shown in Figure 8. The reduction of the suppression is similar to using iron only in the sample and suggests that 100 mg/l Fe is the optimum concentration with 500 mg/l Fe giving marginally less reduction in the suppression. This is somewhat contrary to the findings of Bye (1987) in which very high concentrations of iron were found optimal (ca 8g/l Fe). This could be due to one of two reasons. Firstly, Bye was using a batch system, compared to the FIA system in this work, which has been shown to behave differently (Welz and Stauss, 1993). Secondly, in this work the iron was added to the samples from a 10,000 mg/l ICP standard made up in 1M HN03. With increasing quantities of iron, therefore, the HNO, concentration will also be increasing and may have a competitive effect. At present the effect of the HNO, has not been investigated.
Figure 8. Combined efSect of iron and KI on the interference of 10 mgA copper on 10 pg/l selenium expressed as percentage signal depression with respect to no interferent
Figure 9 shows the effect of increasing the HC1 concentration in the sample on the suppression of 10 mg/l copper on the signal from lOpg/l Se(IV) compared to the suppression when 1% KI is used in the reductant and 100 mg/l iron added to the sample. The effect of the acid alone confirms the findings of other workers, but in order to remove the suppression effect to workable levels, concentrations in excess of 50% v/v HCl are required which, as outlined earlier, can be undesirable. With the combined effects of KI and iron, acid concentrations of 10-2096 v/v can be used with very good tolerance to the interference effect of copper.
15

T 80
20
0
with 1% KI and 100 mg/l Fe added
e i
0 10 20 30 40 SO 60 70 80
HCL concentration(% v/v)
Figure 9. Efsect of HCl acid concentration on the inte$erence of 10 mgA copper on IO pgl-1 selenium
Figure 10 shows the combined effects of 1 % KI and 100 mg/l Fe at an HCl concentration of 20% v/v on the signal from lOpg/l Se(lV) with increasing concentrations of copper. For up to 20 mg/l Cu, the suppression is less than 10% on 10pgA Se(IV).
90 T
70 8o I
.M 30 Lo
0 10 20 30 40 so 60 70 80 90 100
Copper concentration (mg/l)
Figure 10. The combined efsects of 1 % KI and 100 mg/l Fe at an HCl concentration of 20% v/v on the signal from 1 OpgA Se(IV) with increasing concentrations of copper
16

There are number of conclusions from this study of interferences. Firstly, if the material under study contains appreciable concentrations of Fe and the Cu levels are not too high then the samples will have a 'natural immunity' to interference. For sample digests containing up to 10 mg/l Cu the addition of KI to the NaBH4 reagent is a simple and effective way of removing interferences. For higher levels of Cu, the addition of Fe to the sample can help alleviate suppression effects. Chan and Sadana (1992) have shown that an additional flow of 0.5% 1,lO- phenanthroline mixed with the carrier allows 50 mg/l Cu in solution to be tolerated, although the exact 'tolerance limit' is not defined. From a practical point of view, if KI is to be used as a masking reagent, it may be better to mix it with the NaBH4 reductant 'on-line' rather than to mix it directly in order to prevent the reductant decomposing prematurely. If Fe is used as a masking agent, it could be added to the HC1 carrier stream to avoid the need to add known quantities to each sample.
Because of the variable effectiveness of different masking reagents, it is helpful to know something of the history of the samples being analysed, ideally their major and trace metal composition, so that steps can be taken to optimise the analysis in order to minimise interference effects.
4.2 NaBH4 Carrier Manifold
For reasons outlined in the section on system optimisation and characterisation, the NaE3H4 carrier manifold has certain limitations to its operation. However, some preliminary experiments were performed to look at the tolerance of this system to Cu interference.
Figure 1 1 summarises the effects of varying the concentrations of copper and NaOH on the signal obtained from lOp,g/l Se(IV). The solutions were left in a water bath at 60°C overnight, the NaBH, reductant was then added to the alkaline solutions and the samples were filtered just before analysis. For the lower NaOH concentrations, the selenium signal is not greatly affected by increasing copper concentrations. However, at concentrations of 0.3% NaOH and above, there is a rapid decrease in selenium signal with increasing copper. This was not the expected outcome as it was assumed that, for higher concentrations of alkali, the copper would be more efficiently precipitated and hence less likely to interfere with the SeH, generation. A possible explanation may be that at higher pH the selenium is being co-precipitated with the copper hydroxide. Wickstrom et al. (1991) generated Se hydride from an alkaline solution from which copper had been precipitated but did not note any problems with co-precipitation of the selenium. This was probably due to the fact that the solution was boiled after precipitation of the copper from the sample, thereby redissolving any selenium trapped in the copper hydroxide precipitate before the addition of the NaBH, reductant. This shows that, although the Cu interference can be
17

controlled using hydride generation from alkaline solutions, care must be taken in the way in which the sample solutions are made alkaline.
Signal Suppression (8)
NaOH ’ WO,, concentration (% WIV)
copper concentration (rngll) 50
Figure 11. EfSect of sodium hydroxide concentration on the interference of copper on 10 pgA selenium expressed as percentage signal depression with respect to no interferent
4.3 Conclusions and recommendations
I Copper concentrations as low as 1 mg 1-1 in the sample solution have been shown to cause I serious depression of the selenium signal.
As long as the concentration of copper is less than 10 mg 1-1 in the sample solution signal depression can be kept to less than 10% by:
1. maintaining a high acid strength in the sample (> 3M HCl) 2. maintaining an Fe concentration of >100 mg I-lin the sample solution 3. adding 1% w/v KI to the reductant solution.
These reagent can be used in combination.
For solid samples, assuming a 1 % m/v sample digestion, signal depression effects may appear if the copper concentration in the sample exceeds 100 mg kg-1 and the methods suggested above should be used to overcome the interference. If, however, the concentration of Fe in the sample is >1% then copper concentrations of up to 1000 mg kg-1 can be tolerated without serious effects.
Although this report has concentrated on the effect of copper interference, other trace metals (e.g. nickel) have also been shown to interfere (Bye 1987) by a similar mechanism. Copper is generally agreed to cause the most severe signal suppression. Interferences caused by the presence of nickel in samples will also be controlled using the above criteria.
18

5. DIGESTION PROCEDURES
SRM Code No.
GBW 07405 GBW 07310 GBW 07312 GBW 08504 CRM 281
5.1 Test Materials
Description Comments Certified Uncertainty
value (pLg/g> (pgk) Soil 1.56 0.12 Stream sediment 0.28 0.03 Stream sediment High in copper 0.25 0.02 Cabbage 0.083 0.008 Rye Grass 0.028 0.004
The Standard Reference Materials (SRMs) used for these studies are shown in Table 5. The GBW code numbers denote materials from the National Research Centre for Certified Reference Materials, China (NRCCRM) and the rye grass standard came from the Community Bureau of Reference (BCR). One of the sediment samples (GBW 07312) was chosen specifically for its high Cu content (1230 pg/g) in order to assess possible interference effects.
Table 5. Standard reference materials used to validate selenium analysis methodology
5.2 Alkaline Extraction
Cutter (1985) in solid state speciation studies suggests that mild alkaline extraction can be used to measure the inorganic selenium content of sediments. It was decided to look at the use of alkaline extraction combined with an oxidising agent as a method for the extraction of total selenium (inorganic and organic). This combination has the possibility of removing inorganic and organic selenium whilst not dissolving other trace metals (e.g. Cu) which are potential interferents at the hydride generation stage. Two reference materials were used for the alkaline extraction study, the soil and the low copper sediment sample GBW 073 10.
The extraction were carried out in 50 ml Oakridge centrifuge tubes in aqueous media with differing concentrations of sodium hydroxide and potassium persulphate oxidising agent. Samples were reacted at 70°C in a water bath, centrifuged and the supernatant fluid then removed. HCl was added to neutralise the alkali and reduce the selenium to Se(IV). This was followed by further heating at 70°C to complete the selenium reduction. The conditions for each of the seven test methods are shown in Table 6. Additionally, a control sample containing 0.1 ml of 100 mg/l Se(IV) in place of the 0.5 g of solid sample was subjected to each test method. The
19

results, expressed as percentage recovery of the certified value or the nominal spiked value, are shown in Figure 12. The excess acid concentration present in the final solution is ca. 1M for methods 1, 3 and 5, approximately 5M for methods 2 , 4 and 6 and approximately 8M for method 7.
Table 6. Summary of conditions used in the alkaline leach tests
Method7
Method6
Method5
Method4
Method3
Method2
Method1
Recovery Control
+::. ecovery sediment
ecovery soil
O R U O R
0 20 40 60 80 100
Recovery (%)
Figure 12. Selenium recoveries obtained from alkaline leaching tests of standard materials
The overall conclusion from this work is that the alkaline digestion with or without oxidising agent gives low recoveries for the samples studied.
There are, however, a number of interesting points which arise.
20

For method 1, in which no oxidising agent is added, the excess acid after neutralising the alkali is not sufficient to reduce the Se(V1) to Se(IV). Also, the high recovery for the Se(IV) control indicates that the NaOH leach does not significantly oxidise Se(IV) to Se(V1). Method 1 results, therefore, represent the alkaline extractable natural Se(IV) content of the sample and show that the sediment sample has no Se(1V) and the soil ca 20% Se(1V).
In method 2, for which oxidising agent is still absent, sufficient acid is now present to enable reduction of Se(V1) to Se(IV). These results, therefore, represent the sum of the alkaline extractable Se(IV) and Se(VI). It can be seen that the soil sample contains virtually all of its alkali extractable selenium in the Se(IV) state but that the sediment sample contains all of its extractable selenium (which is ca. 60% of the total selenium present) in the Se(V1) state.
In methods 3 and 5, for which oxidising agent is present and the smaller quantity of HCl used, the extractable selenium is almost all converted to Se(VI) by the potassium persulphate (as shown by the low recovery for the Se(IV) controls) and is, therefore, not measured by the hydride AAS method.
Methods 2 and 6 show the effect of the addition of oxidising reagent on the amount of Se extracted. As can be seen, the amounts extracted are almost identical and suggest that there is very little selenium bound to organics in these samples. There is qualitative evidence that the oxidising agent was attacking the organic matter in the sample as the extract containing only alkali was a pale yellowish brown colour whilst the extract with oxidising agent was colourless.
Method 7 uses much higher concentrations of NaOH and oxidising agent and shows a much higher efficiency for the extraction of the sediment sample but still has a low recovery for the soil. For all methods the soil sample recovery is only 20-30% showing that the alkaline/oxidation attack is not accessing 70-80% of the total Se content.
The control samples for methods 1, 2 ,4 and 6 tend to be a little low. It is not thought that this is due to volatilisation losses, as the digestions are carried out in sealed tubes and the digestion temperature was relatively low, although the effect could be due to adsorption on the tube wall. With the higher alkaline concentrations (method 7) the control recovery is much better and indicates that the selenium may be held in solution better at higher pH. This could also explain the increase in efficiency in extracting selenium from the sediment with the higher alkaline concentration which prevents the Se being re-absorbed onto the sediment sample.
21

0 The alkaline extraction is useful in indicating the chemical form of the selenium in the sample but requires further study to validate the methodology. This highlights the need for standard reference materials which are certified not only in the total selenium content but also in the different chemical forms of the selenium in the material. -
5.3 Acid Extraction
Step number 1 2
3
Kuldevere ( 1989) suggested that partial digestion with HN03/HCl quantitatively removes total selenium from sediment samples, although the presence of high concentrations of HN03 in the digest suppresses the signal obtained in hydride generation AAS. For this study, an HN03/HC1 extraction was performed using a programmable heating block. A 0.5g sample was weighed into a 15 ml PTFE tube with 1.25 ml of HNO, and 3.75 ml of HC1. The samples were taken to dryness using the temperature programme shown in Table 7 and finally dissolved in 10 ml of 50% w/v HCl.
Temperature ("C) Time (h)
60 0.75 1 00 1 .oo 120 3 .OO
4 125 3 .OO
Table 7. Heating block temperature program for aqua regia digestion of soils and stream sediments
The recovery for the three samples tested (the soil and both stream sediments) is shown Table 8. The recoveries for the two sediments are >75%, although that from the high copper sediment is a little lower than that from the low copper sediment probably due to copper interference as no interference suppression was used during this analysis. It is interesting to note that the recovery for the soil is again low (ca 50%), suggesting the remaining selenium is bound up in a unreactive form which is not attacked by aqua regia.
22

Sample Reference value Found m&g mgk?
I GBW 07405 I 1.56 I 0.803 I 51.5 I
Recovery %
I GBW 07312 I 0.25 I 0.196 I 78.4 I
Step number 1 2 3
I GBW 07310 I 0.28 I 0.263 I 93.9 I
Temperature ("C) Time (h) 100 3.0
140 1 .o 190 10
Table 8. Selenium recovery from an aqua regia digestion of soil and sediment reference materials
5.4 Total Digestion Procedure
The inability of the extraction procedures to give a full recovery for all standard materials led to the use of a total digestion procedure designed to attacked the silicate matrix. The following method is a standard BGS 'in house' method for the dissolution silicate rocks. A 0.1 mg sample was weighed into a 15 ml PTFE tube, to this was added 1 ml of 40% w/v hydrofluoric acid, 0.8 ml of concentrated nitric acid and 0.4 ml of concentrated perchloric acid. The samples were digested in the programmable heating-block according to the temperature programme shown in Table 9.
Table 9. Heating block temperature programme for total digestion of soils and stream sediments
The dry residue resulting from this procedure was dissolved in 10 ml of 50% w/v HC1. The instrumental conditions used for analysis are those shown in Table 1. To minimise the breakdown of the reductant by KI ( as noted in section 4.1) it was mixed 'on line' using a 'T'-piece at the reductant inlet, before the peristaltic pump. To maintain the same concentrations of the reductant and KI, a 2% KI solution was used in one arm of the IT' and a 0.4% NaE3H4 + 0.1% NaOH solution was used in the other arm. As a further precaution against transition metal interferences, 0.1 ml of 10,000 mg/l iron (in 1M HN03) was added for every 10 ml of sample or standard. Blank samples were run to correct for reagent contamination. To check for selenium losses due to volatilisation, 0.2 ml of 1 mg/l Se (IV) standard was pipetted into a 15 ml PTA test tube and taken through the acid digestion procedure in triplicate. The average recovery of these solutions was 99.5%.
23

The selenium concentrations resulting from these digestions are shown with the certified data in Figure 13. The results are an average of three replicates and the error bars represent the standard deviation.
0 Within the error of the analysis the results from the total digestion procedure agree with the certificated values.
1 o n 1 .ou
1.60
1.40
3 1.20 E .r( E 1.00
8
U cd 5 0.80
2 0.60
0.40
8
I
0.00 o.20 L
T r 4
T T
i
GBW GBW GBW 07310 07312 07405 (soil)
(sediment) (sediment)
I.BGS 0 Certified
Figure 13. Summary of selenium data for soil and stream sediment reference materials using a total digestion procedure.
The results for the sediment samples show a slight positive bias which may indicate variable reagent blanks or slight contamination from digestion vessels. There is no indication, however, of suppression of the selenium from the high levels of copper (1230 mgkg) in the stream sediment, GBW 07312, showing that the steps taken to minimise copper interference had been effective. For the soil sample, GBW 07405, which had shown consistently low recoveries for the partial extraction techniques, there is now very good agreement with the certified value, suggesting the remaining selenium is bound up in a unreactive form which is not attacked by the partial extraction methods.
5.5 Digestion of Plant Material
When carrying out a geochemical survey for selenium it is also informative to be able to measure the selenium levels in the vegetation growing in the area under study. This provides information
24

on whether the selenium in the soil is in a form that can be easily assimilated by plants and hence how easily the selenium is being mobilised into the food chain.
Step number 1 2 3 4 5
The method of digestion of plant material for selenium determination requires a strong oxidising
medium to break down the organic matrix and release organically bound selenium. Perchloric acid, in combination with other mineral acids, has been found to be very effective for digesting organic material, but there is a risk of explosion. Hansson et al. (1987) compared the use of perchloric acid digestion with a safer method which entailed digesting the sample in concentrated HCl and HNO, with Mg(NO& as an ashing aid, heating to dryness, ashing at 500°C and finally dissolving the remaining solid in HC1. Both methods gave comparable results with no loss of selenium; the ashing method was recommended because there was less risk of explosion compared to the perchloric digestion method. This ashing method has also been used successfully by Brumbaugh and Walther (1989), Buckley et al. (1992), Ebdon and Sparkes (1987), Horler (1989), Nakata et al. (1985) and 0ien et al. (1988) and is recommended by the Department of the Environment Standing Committee of Analysts (1987).
Temperature ("C) Time (h)
50 1 .o 85 1 .o 105 1 .o 125 2.0 200 3.0
The magnesium nitrate technique was therefore chosen as being most suitable for plant material. The method was adapted for use on small sample sizes so that the digestion stage could be carried out using the programmable heating-block and was used to analyse rye grass and cabbage standard reference materials.
A 0.2 g sample was weighed into a 30 ml Pyrex glass test tube to which was added 2 g of magnesium nitrate followed by 2 ml of concentrated nitric acid. As with the total acid digestion procedure, reagent blank samples and selenium standard solutions (to check for recovery) were taken through the same digestion procedure as the samples. The tubes were placed into the heating block and the samples digested under the temperature programme given in Table 10.
Table 10. Heating block temperature programme for the digestion of plant material
25

The test tubes, containing the dry magnesium nitrate residues produced from the first stage, were placed in a muffle furnace at 450°C for 2 hours to complete the ashing and convert the
magnesium nitrate to magnesium oxide. Finally, the tubes were removed from the furnace and allowed to cool and the ash was taken up in 2 ml of concentrated HCl and diluted to 10 ml with deionised water. Clear colourless solutions were obtained for both standard materials. The AAS and FIA operating conditions were the same as those used for the total acid digestion of soils and sediments (section 5.4). The recovery from the digested standard solutions was an average of 106% after blank correction.
0 ,
The selenium values obtained from this analysis are compared to the certified values in Figure 14. The results are the average of three replicates and the error bars represent the standard devi ation.
0 As with the total acid digestion of the soils and stream sediments the values obtained for the plant material agree well with the certified values.
If the plant material is particularly inhomogeneous the relatively small sample size suggested in this method (0.2g) may not be truly representative of the bulk material. In this case it is suggested the method is scaled up to use I-2g of sample with same relative proportions of digestion reagents.
0.1 0.09 0.08
$$ 0.07 E
z i 0.05 E 8 0.04 8 0.03 U
0.02 0.01
ba
0.06 0
U
0
1r
T
Cabbage
Figure 14. Summary of selenium results for the plant material reference samples
26

6. CONCLUSIONS AND RECOMMENDATIONS
The general conclusions from this report are:
0
0
0
0
1. 2. 3. 4.
0
0
0
The detection limit for the acid carrier manifold is 0.14 pg 1-1 in solution
The detection limit for the NaBH4 carrier manifold is 0.16 pg 1-1 in solution
Copper concentrations as low as 1 mg 1-1 in the sample solution have been shown to cause serious depression of the selenium signal.
As long as the concentration of copper is less than 10 mg 1-1 in the sample solution signal depression can be kept to less than 10 % by: maintaining a high acid strength in the sample (> 3M HCl) maintaining an Fe concentration of >100 mg 1-lin the sample solution adding 1 % w/v KI to the reductant solution These reagent can be used in combination.
For solid samples, assuming a 1 % m/v sample digestion, signal depression effects may appear if the copper concentration in the sample exceeds 100 mg kg-1 and the methods suggested above should be used to overcome the interference. If, however, the concentration of Fe in the sample is >1% then copper concentrations of up to 1000 mg kg-1 can be tolerated without serious effects.
Although this report has concentrated on the effect of copper interference, other trace metals (e.g. nickel) have also been shown to interfere (Bye 1987) by a similar mechanism. Copper is generally agreed to cause the most severe signal suppression. Interferences caused by the presence of nickel in samples will also be controlled using the above criteria.
The alkaline digestion with or without oxidising agent gives low recoveries for the samples studied.
21

The alkaline extraction is useful in indicating the chemical form of the selenium in the sample but requires further study to validate the methodology. This highlights the need for standard reference materials which are certified not only in the total selenium content but also in the different chemical forms of the selenium in the material.
Within the error of the analysis the results from the total digestion procedure for the analysis of standard soils and sediments agree with the certificated values.
Within the error of the analysis the results from the total digestion procedure
for the analysis of standard plant materials agree with the certificated values.
This study has produced a relatively simple and interference free analytical methodologies for the determination of selenium with the sensitivity required for the determination of the natural levels found in waters, soils, sediments and plant materials . However, because of the complexity of the interference correction techniques available, it is important to know something of the history of the samples to be analysed, ideally their major and trace metal compositions, so that steps can be taken to optimise the analysis in order to minimise interference effects.
The sample digestion stage has been developed for use with a programmable heating block to maximise the sample throughput if large batches of samples are to be analysed. As this digestion requires a small sample size (0.1-0.2 g), it is essential that sample material is milled to a suitably small particle size ( 50pm maximum) to ensure representative sampling. If a programmable heating block is not available or samples cannot be easily prepared to the sample size suggested above, the digestion methods can be adapted to more conventional methods. Conventional methods will in general, however, require more reagents and more operator supervision which will have possibly have financial implications.
In addition to methods for the determination of the total selenium content, selective leaching methodologies which will allow the chemical form of selenium in solid samples to be determined have been investigated although validation of these methodologies is required. Selenium speciation studies on solid materials highlight the need, however, for standard reference materials which are certified not only for the total selenium content but also in the different chemical forms of the selenium in the material.
The methodologies developed in this work have been used for the determination of selenium in forage and soil samples for the north east Zimbabwe project (Fordyce and Appleton, 1994).
28

The standard recommended methods for the determination of total selenium in water, soils and plant material are summarised in Appendix 1.
7. ACKNOWLEDGEMENTS
We would like to thank Linda Ault and Charles Gowing for their help in the development of the hot block digestion procedures and Mark Allen for his help and advice on sample preparation of solid samples.
8. REFERENCES
Agterdenbos, J. and Bax, D. Study on the Generation of Hydrogen Selenide and Decomposition of Tetrahydroborate in Hydride-Generation Atomic-Absorption Spectrometry, Analytica Chimica Acta, 188, 127-135.
1986.
Bmmbaugh, W.G. and Walther, M.J. 1989. Determination of Arsenic and Selenium in Whole Fish by Continuous-Flow Hydride-Generation Atomic Absorption Spectrophotometry, Journal. Association of Official Analytical Chemists, 72,484-486.
Buckley, W.T., Budac, J.J., Godfrey, D.V. and Koenig, K.M. 1992. Determination of Selenium
by Inductively Coupled Plasma Mass Spectrometry Utilising a New Hydride Generation Sample Introduction System, Analytical Chemistry, 64,724-729.
Bye, R. 1987. Iron (IQ as Releasing Agent for Copper Interference in the Determination of Selenium by Hydride Generation Atomic Absorption Spectrometry, Analytica Chimica Acta, 192, 115-1 17.
Bye, R. 1988. Presence of Hydroxylamine in the Phosphoric Acid - Nitric Acid-Hydrogen Peroxide Digestion Procedure for Selenium Determination, Analytical Chemistry, 60, 163 1 - 1632.
Bye, R. 1989. Generation of Selenium Hydride from Alkaline Solutions: a New Concept of the Hydride Generation Atomic Absorption Technique, Journal of Automated Chemistry, 11, 156- 158.
29

Cave M.R., Reeder, S. and Blackwell, P.A. 1993. Critical Evaluation of Current Analytical Literature for Methods to Determine Selenium in Geochemical Survey Samples, BGS Technical Report WI/92/6.
Chan, C.C.Y. 1985. Materials Using a Flow Injection Analysis Technique, Analytical Chemistry, 57, 1482- 1485.
Semiautomated Method for the Determination of Se in Geological
Chan, C.C.Y. and Sadana, R.S. 1992. Determination of Arsenic and Selenium in Environmental Samples by Flow-Injection Hydride Generation Atomic Absorption Spectrometry, Analytica Chimica Acta, 270,23 1-238.
Cutter, G.A. Hydride Generation, Analytica Chimica Acta, 149, 39 1-394.
1983. Elimination of Nitrite Interference in the Determination of Selenium by
Cutter, G.A. 1985. Determination of Selenium Speciation in Biogenic Particles and Sediments, Analytical Chemistry, 57,295 1-2955.
Department of the Environment Standing Committee of Analysts. 1987. Selenium in Waters 1984. Selenium and Arsenic in Sludges, Soils and Related Materials 1985. A Note on the use of Hydride Generator Kits 1987, Methods for the Examination of Waters and Associated Materials, HMSO 1987 (ISBN 0 11 751933 2).
Ebdon, L. and Sparkes S.T. 1987. Determination of Arsenic and Selenium in Environmental Samples by Hydride Generation - Direct Current Plasma - Atomic Emission Spectrometry, Microchemical Journal, 36, 198-206.
Fordyce, F.M., Appleton J.D. and Masara, D., 1994. Final Report on Stream Sediment, Soil and Forage Chemistry as Indicators of Cattle Mineral Status in North-east Zimbabwe, British Geological Survey Technical Report WC/94/3R.
Guo, T., Erler, W., Schulze, H. and McIntosh, S. 1990. Determination of Hydride-Forming
Elements with the FIAS-200 Flow Injection-MercuryMydride System, Atomic Spectroscopy, 11, 24-28.
Hansson, L., Petterson, J. and Olin, A. 1987. A Comparison of Two Digestion Procedures for the Determination of Selenium in Biological Materials, Talanta, 34, 829-833.
Horler, B.A.T. Samples by X-Ray Fluorescence Spectrometry Using Coprecipitation, Analyst, 114,9 19-922.
1989. Determination of Arsenic and Selenium in Vegetable and Herbage
30
Krivan, V., Petrick, K., Welz, B. and Melcher, M. 1985. Radiotracer Error Diagnostic Investigation of Selenium Determination by Hydride Generation Atomic Absorption Spectrometry Involving Treatment with Hydrogen Peroxide and Hydrochloric Acid, Analytical Chemistry, 57, 1703-1706.
Kuldvere, A. 1989. Extraction of Geological Materials with Mineral Acids for the Determination of Arsenic, Antimony, Bismuth and Selenium by Hydride Generation Atomic Absorption Spectrometry, Analyst, 114, 125- 13 1.
Nakata, F., Yasui, Y., Matsuo, H. and Kumamru, T. 1985. Determination of Selenium (N, VI) by Heated Quartz Cell Atomic Absorption Spectrometry with Miniaturised Suction-Flow On-line Pre-reduction/Hydride Generation System, Analytical Sciences, 1 , 4 17-42 1 .
Neve, J., Hanocq M. and Lepold M. 1980 Etude Critique de la Determination par Spectrometrie d'Absorption Atomique sans Flamme du Selenium dans les Milieux Complexes apres Extraction a l'aide D'o - diamines Aromatique et Ajout de Nickel(II), Analytica Chimica Acta, 115, 133-141.
Offley, S.G., Seare, N.J., Tyson, J.F. and Kibble, H.A.B. 1991. Elimination of Copper Interference by Continuous Flow Matrix Isolation in the Determination of Selenium by Flow Injection Hydride Generation Atomic Spectrometry, Journal of Analytical Atomic Spectrometry, 6, 133-138.
0ien, A., Wu, X. and Dahl, I. 1988. Determination of Selenium in Soil and Comparison of Analytical Results from Different Extraction Methods, Acta Agriculturae Scandinavica, 38, 127- 135.
Roden, D.R. and Tailman, D.E. 1982. Determination of Inorganic Selenium Species in Groundwaters Containing Organic Interferences by Ion Chromatography and Hydride Generation/ Atomic Absorption Spectrometry, Analytical Chemistry, 54,307-309.
Welz, B. and Schubert-Jacobs, M. 1991. Evaluation of a Flow Injection System and Optimisation of Parameters for Hydride Generation Atomic Absorption Spectrometry, Atomic Spectroscopy, 12,9 1 - 104.
Welz, B. and Stauss P. 1993. Interferences from Hydride Forming Elements in Hydride Generation Atomic Absorption Spectrometry with a Heated Quartz Tube Atomiser, Spectrochimica Acta ,48B, 95 1-976.
31

Wickstrom, T., Lund, W. and Bye, R. 1991. Hydride Generation Atomic Absorption Spectrometry from Alkaline Solutions: Determination of Selenium in Copper and Nickel Materials, Journal of Analytical Atomic Spectrometry, 6, 389-39 1.
Xu, S.-K., Zhang, S.-C. and Fang, Z.-L. 1990. Determination of Ultra-Trace Amounts of Selenium (IV) in Water and Soil Extracts by Flow-Injection On-Line Ion-Exchange Pre- Concentration - Hydride Generation Atomic-Absorption Spectrometry, Kexue Tongbao, 35, 526- 527.
Zhang, S., Xu, S. and Fang, Z. 1989. Determination of Hydride Forming Elements at Ultra- Trace Levels by Flow Injection Hydride Generation Atomic Absorption Spectrometry with On- Line Ion-Exchange Column Preconcentration, Quimica Analytica, 8, 19 1 - 199.
32

APPENDIX 1
Recommended Methods for the Determination of Selenium in Environmental Materials
A1 INSTRUMENTATION Furnace
900°C)
Sample + reagents + Ar
Glass beads
Acid Carrier Manifold
Hydride stripping gas - Argon Pump
Reductant - NaBH,
To quartz furnace and AA Acid samole carrier - HCI 0.51111 sample loop
Set up the gas liquid separator and flow manifold, shown in the diagrams above, on an existing atomic absorption instrument. If an electric furnace is not available then the quartz cell can be mounted above the air acetylene burner and heated with the air acetylene flame. The recommended flow rates for the reagents and gases and the reagent concentrations are summarised in the table below.
33

Fluid flow description Reductant
Acid sample carrier Hydride stripping
gas
If argon is not available, the hydride stripping gas can be replaced with nitrogen.
Flow rate (ml min-1) Reagent
3.7 0.2% N&H4 wlv +
8.6 1 M HCl 108 Argon gas
O.OS%NaOH
The equipment used in this study is described in section 2.1. It is not necessary to use exactly the same components. More suitable equivalent parts may be more easily available locally.
Using this equipment and reagents with a 0.5 ml sample loop, a calibration curve for Se(IV) similar to that shown below should be obtained. A detection limit of 0.5 pg 1-1 of selenium or better should obtained. The relative standard deviation on three replicate measurements of a sample above 1 .O pg 1-'should be 2-5%.
Typical Calibration Curve
I
0 5 10 15 20
Selenium concentration ug/l
A2 REAGENTS
The reagents manufacturer and grade used in this study for the analysis of selenium in environmental materials are summarised in section 2.2. Where possible all reagents should be of
34

analytical reagent grade but it may be possible to use cheaper, less pure, reagents if higher grades are not available. To monitor the effects of chemical reagents on the determination it is recommended that reagent blanks are run with every analysis.
A3 ANALYSIS OF TOTAL INORGANIC SELENIUM IN WATERS
1. Prepare at least three Se(IV) calibration standards over the range of 0-20 pg 1-1 by dilution of a suitable stock standard. 2. Prepare at least one 1Opg 1-1 standard of Se (VI) by dilution of a suitable stock standard (this sample is used to check that the reduction step which converts Se(V1)to Se(1V) is quantitative). 3. Samples should be filtered to 0.45 pm and preserved in 1% HC1. (blank samples of the HC1 preservative should also be run). 4. To 5.0 ml of sample or standard, in suitable glass or plastic test tube add 3.0 ml of concentrated hydrochloric acid. N.B. Samples and standards should be treated in the same manner. (Care should be taken in handling concentrated acids. All work should be carried out in a fume cupboard and suitable protective equipment should be used by the operator.) 5. Place the acidified sample or standard into a water bath at 70°C for 20 mins. Remove the
sampleshtandards and allow to cool to room temperature. 6. To each samplektandard add 0.5 ml of a freshly prepared 2% w/v sulphanilamide (dissolved in dilute HC1). 7. Calibrate the instrument with the calibration standards and check that the Se(V1) standard has been quantitatively reduced in the reduction step. Run the samples, taking the average of three replicates. Samples with concentrations over the top calibration standard should be diluted into the calibration range and rerun.
Interferences
Interferences from naturally occurring nitrite levels are removed by the addition of sulphanilamide. Copper concentrations as low as 1 mg 1-1 in the sample solution have been shown to cause serious depression of the selenium signal. As long as the concentration of copper is less than 10 mg 1-1 in the water sample (this is true for most natural waters) signal depression can be kept to less than 10% by the presence of the 4M HCl matrix used to reduce the Se(V1) to Se(1V) (step 4).
Comments
The reduction step described in step 5 is a little different to that described in section 3.1.2 but has been found to be more reproducible than the original method. If a water sample with a certified
35

selenium content is available this should be analysed using the above procedure to check the accuracy of the method. Reagent blanks for the acid reductant and the sulphanilamide should be run with every batch of samples. Using this method a detection limit of 0.8 pgl-1 selenium in the water sample should be obtained. For relatively clean water the relative standard deviation on a water sample analysed a number of times during an analytical run should be 5-10%
Step number 1 2
A4 ANALYSIS OF TOTAL SELENIUM IN SOILS AND SEDIMENTS
Temperature ("C) Time (h)
100 3 .O 140 1 .o
1. Air dry or dry the sample at a maximum of 50°C (to prevent loss of volatile selenium compounds) in a drying oven. 2. Mill the sample to 50pm or less. 3. Accurately weigh 0.100 g of sample into a 15 ml PTFE test tube. 4. Add 1 ml of 40% w/v hydrofluoric acid, 0.8 ml of concentrated nitric acid and 0.4 ml of concentrated perchloric acid to each sample. (Care should be taken in handling concentrated acids, particularly hydrofluoric acid. All work should be carried out in a fume cupboard and suitable protective equipment should be used by the operator.) 5. Prepare 100 pgl-1 aqueous standards of Se(W) and Se(V1) by dilution of suitable stock standards and pipette 1.00 ml of each standard into two 15 ml PTFE tubes. To each tube add the same acids as specified in step 4. These standards are used to check that selenium is not lost during the digestion and to check the selenium reduction step. 6 . Place the samples and standards in a programmable hot block and take them through the temperature programme outlined in the table below.
3 190 10
7. The dry residue resulting from this procedure was dissolved in 10 ml of 4M HCl heating to 70°C for 20 mins in a water bath. 8. Prepare at least three Se(1V) calibration standards in a 4M HC1 matrix over the range of 0-20 pg 1-1 by dilution of a suitable stock standard. 9. Calibrate the instrument with the calibration standards and check that the Se(VI> standard has been quantitatively digested and reduced in the reduction step. Run the samples taking the average of three replicates. Samples with concentrations over the top calibration standard should be diluted into the calibration range and rerun.
36

Interferences
For this sample digestion method, signal depression effects may appear if the copper concentration in the sample exceeds 100 mg kg-1 and the methods suggested in section 4.2 should be used to overcome the interference. If, however, the concentration of Fe in the sample is >1% then copper concentrations of up to 1000 mg kg-1 can be tolerated without serious effects.
Comments
The reduction step described in step 7 is a little different to that described in section 5.4 but has been found to be more reproducible than the original method. If sediment or soil sample with a certified selenium content is available this should be analysed using the above procedure to check the accuracy of the method. Reagent blanks should be run with every batch of samples. Using this method a detection limit of .005-.015 mgkg -1 selenium in the solid should be obtained. For the standard soils and stream sediments analysed by this method relative standard deviations of 27% were found at ca 0.3 mgkg-1 selenium and 5% at ca 1.5 mgkg-1 selenium.
A5 ANALYSIS OF TOTAL SELENIUM IN PLANT MATERIAL
1. Air dry or dry the sample at a maximum of 50°C (to prevent loss of volatile selenium compounds) in a drying oven. 2. Mill the sample to 50pm or less. 3. Accurately weigh 0.200 g of sample into a 30 ml Pyrex test tube. 4. Add 2g of magnesium nitrate followed by 2.0 ml of concentrated nitric acid. (Care should be taken in handling concentrated acids. All work should be carried out in a fume cupboard and suitable protective equipment should be used by the operator.) 5. Prepare 100 pgl-1 aqueous standards of Se(IV) and Se(VI) by dilution of suitable stock standards and pipette 1 .OO ml of each standard into two 15 ml PTFE tubes. To each tube add the same reagents as specified in step 4. These standards are used to check that selenium is not lost during the digestion and to check the selenium reduction step. 6 . Place the samples and standards in a programmable hot block and take them through the temperature programme outlined in the table below.
37

Step number 1 2
Temperature ("C) Time (h) 50 1 .o 85 1 .o
7. Heat the test tubes containing the dry magnesium nitrate residues in a muffle furnace at 450°C to complete the ashing and convert the magnesium nitrate to magnesium oxide. 8. Dissolve the dry residue resulting from this procedure in 15 ml of 4M HCI heating to 70°C for 20 mins in a water bath.
9. Prepare at least three Se(1V) calibration standards in a 4M HC1 matrix over the range of 0-20 pg 1-1 by dilution of a suitable stock standard. 10. Calibrate the instrument with the calibration standards and check that the Se(VI) standard has been quantitatively digested and reduced in the reduction step. Run the samples taking the average of three replicates. Samples with concentrations over the top calibration standard should be diluted into the calibration range and rerun.
3 4 5
Interferences
105 1 .o 125 2.0
200 3 .O
For this sample digestion method, signal depression effects may appear if the copper concentration in the sample exceeds 100 mg kg-1 and the methods suggested in section 4.2 should be used to overcome the interference.
Comments
The reduction step described in step 8 is a little different to that described in section 5.5 but has been found to be more reproducible than the original method. If a vegetation sample with a certified selenium content is available this should be analysed using the above procedure to check the accuracy of the method. Reagent blanks should be run with every batch of samples. Using this method a detection limit of ,005-,010 mgkg-1 selenium in the solid should be obtained. For the standard vegetation samples analysed by this method relative standard deviations of 18% were found at ca 0.025 mgkg-1 selenium and 14% at ca 0.075 mgkg-1 selenium.
If the samples cannot be ground to 50pm or less, the above method should be adapted for larger samples sizes. This will give selenium values which are more representative of the bulk material (e.g. if the sample is prepared to <2mm then approximately 1-2g of sample should be used for digestion).
38
![[320] Web 3: Selenium · for Selenium Java module for Selenium Ruby module for Selenium JavaScript mod for Selenium Chrome Driver Firefox Driver Edge Driver. Examples. Starter Code](https://static.fdocuments.in/doc/165x107/5eadce82cc4f0d7405687f01/320-web-3-selenium-for-selenium-java-module-for-selenium-ruby-module-for-selenium.jpg)


![wc EME žäC&ff DAIOU ILLUST MAP (77? wc wc wc ÞY5 260 260 ... · DAIOU ILLUST MAP (77? wc wc wc ÞY5 260 260 wc (DÎIÉ] 167 wc 9155} 7—Jb wc -k ;knlc 220km 61 km 55B R 167 45](https://static.fdocuments.in/doc/165x107/5f097c067e708231d4270c2d/wc-eme-cff-daiou-illust-map-77-wc-wc-wc-y5-260-260-daiou-illust.jpg)

