WaveFormRevealer 1-D – An Analytical Predictive Tool for ... · Simulation of Multimodal Guided...
18
Report # USC-ME-LAMSS-2012-101 WaveFormRevealer 1-D – An Analytical Predictive Tool for the 1-D Simulation of Multimodal Guided Waves Propagation and Interaction with Damage: User’s Guide and Theoretical Foundation Yanfeng Shen, Victor Giurgiutiu University of South Carolina, Columbia, South Carolina, USA, 29208 ABSTRACT: This report presents the WaveFormRevealer 1-D (WFR) – an analytical predictive tool for the simulation of 1-D guided waves propagation and interaction with damage. This report consists of two parts: (1) user’s guide; (2) Theory foundation of WFR. The user’s guide provides information about steps of running WFR, interface introduction and main functions of WFR. Then the theoretical foundation is provided on inserting damage effects into the analytical model, including wave transmission, reflection, mode conversion and nonlinear higher harmonics. Table of Contents Part 1: WFR User’s Guide ................................................................................................. 1 1 Overview ....................................................................................................................... 1 2 Fundamental Guide of WFR........................................................................................... 1 3 WFR Interface and Main Functions ................................................................................ 2 Part 2: Theory of WaveFormRevealer ................................................................................ 6 1 Introduction ................................................................................................................... 6 2 PWAS Fundamentals...................................................................................................... 7 3 Analytical Modeling of Lamb Waves Interacting with Damage ...................................... 8 3.1 Analytical modeling of guided Lamb waves propagation in a pristine structure ....... 8 3.2 Insertion of damage effects into the analytical model ............................................ 12 3.2.1 Linear damage interaction ........................................................................................ 14 3.2.2 Nonlinear damage interaction .................................................................................. 14 4 Acknowledgements ...................................................................................................... 15 References .......................................................................................................................... 15
Transcript of WaveFormRevealer 1-D – An Analytical Predictive Tool for ... · Simulation of Multimodal Guided...

Report # USC-ME-LAMSS-2012-101
WaveFormRevealer 1-D – An Analytical Predictive Tool for the 1-D Simulation of Multimodal Guided Waves Propagation and Interaction
with Damage: User’s Guide and Theoretical Foundation
Yanfeng Shen, Victor Giurgiutiu University of South Carolina, Columbia, South Carolina, USA, 29208
ABSTRACT: This report presents the WaveFormRevealer 1-D (WFR) – an analytical predictive tool for the simulation of 1-D guided waves propagation and interaction with damage. This report consists of two parts: (1) user’s guide; (2) Theory foundation of WFR. The user’s guide provides information about steps of running WFR, interface introduction and main functions of WFR. Then the theoretical foundation is provided on inserting damage effects into the analytical model, including wave transmission, reflection, mode conversion and nonlinear higher harmonics.
Table of Contents
Part 1: WFR User’s Guide ................................................................................................. 1
1 Overview ....................................................................................................................... 1
2 Fundamental Guide of WFR........................................................................................... 1
3 WFR Interface and Main Functions ................................................................................ 2
Part 2: Theory of WaveFormRevealer ................................................................................ 6
1 Introduction ................................................................................................................... 6
2 PWAS Fundamentals ...................................................................................................... 7
3 Analytical Modeling of Lamb Waves Interacting with Damage ...................................... 8
3.1 Analytical modeling of guided Lamb waves propagation in a pristine structure ....... 8
3.2 Insertion of damage effects into the analytical model ............................................ 12
3.2.1 Linear damage interaction ........................................................................................ 14
3.2.2 Nonlinear damage interaction .................................................................................. 14
4 Acknowledgements ...................................................................................................... 15
References .......................................................................................................................... 15

Report # USC-ME-LAMSS-2012-101
PART 1: WFR USER’S GUIDE
1 OVERVIEW
The WaveFormRevealer (WFR) 3.0 is a predictive tool to simulate 1-D multimode guided waves propagation and interaction with damage. This software allows users to obtain the theoretical solution for dispersion curve, tuning curve, frequency components for S0 and A0 wave modes, and the plate transfer function. It can calculate the analytical waveforms under arbitrary engineering situations. Arbitrary, hereby, means different kinds of materials, various setup geometries (plate thickness, PWAS distance, PWAS size, and damage location), linear/nonlinear interaction with damage, and any kind of excitation signal desired by the users. WFR is also capable of obtaining solution of time-spatial guided waves propagation, which allows users to see how guided waves propagate and interact with damage in the plates. The WaveFormRevealer GUI and its tutorial are available on LAMSS website at: http://www.me.sc.edu/Research/lamss/html/software.html.
2 FUNDAMENTAL GUIDE OF WFR
To use the WaveFormRevealer, one needs to follow the steps below: STEP 1: MATLAB compiler runtime 7.13 is required to run WaveFormRevealer. One needs to download MCRInstaller.zip from our website and install it on the computer. Download WaveFormRevealer.zip from LAMSS website, unzip and run WFR.exe. STEP2: After running the exe-file named ‘WFR.exe’, the WFR GUI will show up. Click ‘Material Library’ on the up-left corner of the interface, and a file-selection interface will jump out. Open or double click on the ‘Material.txt’ file, and the materials will appear in the pop-up Manu on the right-down corner. STEP 3: Select the material of the plate, the default values of corresponding parameters will appear in the blanks: density, Young’s modulus and so on. All the values of the parameters are changeable according to specific situations. For example, new materials, a different count number excitation, various plate thickness, PWAS distance and frequencies, etc. STEP 4: Press ‘APPLY DATA’ button to obtain analytical waveforms and analysis plots, for instance, the dispersion curve, tuning curve, frequency components of S0 and A0 wave packets and plate transfer function 𝐺𝐺(𝑥𝑥,𝜔𝜔).One can click on the slider to see the waveform change corresponding to a continuous change of frequencies, just as seeing the change on a digital oscilloscope. Signal time range could be adjusted by entering in the desired range one wants to see in the ‘RANGE’ blank. STEP 5: All the analytical solutions shown in the figures (current activated ones) are available for the users and could be saved into Excel files by clicking the ‘SAVE’ buttons. For example, one can obtain the numerical data of theoretical waveform, dispersion curve, tuning curve, frequency components, and plate transfer function, etc. Above are the basic steps of running WFR. Details of more advanced functions will be introduced in the next section.
1

Report # USC-ME-LAMSS-2012-101
3 WFR INTERFACE AND MAIN FUNCTIONS
The analytical representation of 1-D guided Lamb wave propagation and interaction with damage was coded in MATLAB and resulted in the graphical user interface (GUI) called WaveFormRevealer (WFR) shown in Figure 1.
Figure 1: Main GUI of WaveFormRevealer
WFR allows users to control several parameters: structure material properties, PWAS size, location of sensors, location of damage, damage type (linear/nonlinear damage of various severities), and excitation signal (frequencies, count numbers, signal mode excitation, arbitrary waveform type, etc.). Dual display of waveforms allows for the sensing signals to be shown at two different sensor locations. For instance, Figure 1 shows two receiver waveforms
at locations 1 0 mmx = and 2 500 mmx = as measured from the transmitter (in this case
1 0 mmx = means that receiver PWAS-1 collocated with the transmitter PWAS). Thus,
PWAS-1 shows the reflections from damage, and PWAS-2 shows the signal modified after passing through the damage. Users are able to conduct fast parametric studies with WFR. It may take several hours for commercial finite element software to obtain an acceptable-accuracy solution for high frequency, long distance propagating waves; but it takes only several seconds to obtain the same solution with WFR. Besides analytical waveform solutions, the WFR can also provide users with wave speed dispersion curves, tuning curves, frequency components of received wave packets, structure
2

Report # USC-ME-LAMSS-2012-101
transfer function, etc. All the calculated results are fully available to the user, and could be saved in Excel files by clicking the ‘SAVE’ button. Figure 2 shows a case study for Lamb wave propagation of a 100 kHz tone burst in a 1-mm thick aluminum plate. Figure 2 shows the dispersion curves; Figure 2b shows the excitation spectrum overlap with the S0 and A0 tuning curves. Figure 2c shows the spectra of the S0 and A0 packets displaying frequency shifts to the right and to the left, respectively, due to the interaction between excitation
spectrum and the tuning curves. Figure 2d shows the structure transfer function ( ),G x ω .
Figure 2: Calculation of various quantities in Lamb wave propagation: (a) wave speed dispersion curve; (b)
tuning curve; (c) frequency contents of received wave packets; (d) structure transfer function
Besides the main interface, WFR has two sub-interfaces shown in Figure 3: (1) damage information platform; (2) guided wave spatial propagation solver. The damage information platform allows users to input the damage location and damage interaction coefficients. We use three letters to describe the interaction between Lamb waves and the damage. The first letter is the wave source, the second the resulting wave, and the third the propagation direction (transmission or reflection). For example, SST represents the magnitude of transmitted S0 mode generated by an incoming S0 mode; whereas, SAT and phi-SAT represent the magnitude and phase of the transmitted A0 mode resulting from the mode-conversion of an incoming S0 mode. The values of these damage interaction coefficients are not calculated by the WFR.
(a) 0 2000 4000 6000 8000 10000
0
0.5
1
1.5
2x 10
4 Wave Speed Dispersion Curve
f (kHz)
c (m
/s)
A0
S0
A1S3A3A2
S2
S1
0 200 400 600 800 10000
0.2
0.4
0.6
0.8
1
1.2
Frequency kHz
Nor
mal
ized
Am
plitu
de
Tunning Curve
S0
A0
Excitation
0 50 100 150 2000
0.2
0.4
0.6
0.8
1
1.2
Frequency kHz
Nor
mal
ized
Am
plitu
de
Frequency Contents
S0A0
Excitation 100 kHz
0 100 200 300 400 5000
0.5
1
1.5Structure Transfer Function G
Frequency kHz
Mag
nitu
de
(d) (c)
(b)
3

Report # USC-ME-LAMSS-2012-101
This gives the users the freedom to define their own specific problem. For instance, a particular type of damage (plastic zone, fatigue, cracks) with certain degree of severity will have different interaction characteristics with the interrogating guided waves. These coefficients may be determined experimentally or calculated through other methods: analytical, finite element method (FEM), boundary element method (BEM).
Figure 3: User interfaces: (a) damage information platform; (b) guided wave spatial propagation solver
The spatial propagation solver is like a B-scan. Using the analytical procedure, we obtain the time domain waveform solution at various locations along the structure. Thus, the time domain waveform solutions of a sequence of points along the wave propagation path are obtained. If we select the sequence of solution points fine enough, a time-spatial domain solution of the wave field is obtained. The spatial solution of wave field at a particular instance in time is available as shown in Figure 3b. After the time-spatial solution of wave field is obtained, we can do the frequency-wavenumber analysis [1] to see the wave components of the signal (Figure 4).
(a) (b)
4

Report # USC-ME-LAMSS-2012-101
Figure 4: Frequency-wavenumber display window
5

Report # USC-ME-LAMSS-2012-101
PART 2: THEORY OF WAVEFORMREVEALER
1 INTRODUCTION
Guided waves retain a central function in the development of structural health monitoring (SHM) systems using piezoelectric wafer active sensor (PWAS) principles. The modeling of Lamb waves is challenging, because Lamb waves propagate in structures with multi-mode dispersive characteristics. At a certain value of the plate thickness-frequency product, several Lamb modes may exist simultaneously, and their phase velocities vary with frequency [2, 3, 4]. When Lamb waves interact with damage, they will be transmitted, reflected, scattered and mode converted. Nonlinear interaction with damage may also exist and this will introduce distinctive features like higher harmonics [5, 6, 7]. These aspects give rise to the complexity of modeling the interaction between Lamb waves and damage. To solve such complicated problems, numerical methods like finite element method (FEM) and boundary element method (BEM) are usually adopted. However, to ensure the accuracy of simulating high-frequency waves of short wavelengths, the transient analysis requires considerably small time step and
very fine mesh ( , 20 30FEM
Tt l
l≥
∆ ), which is expensive both in computational time and
computer resources [8, 9]. Analytical model provides an alternative approach to attack the same problem with much less cost [10]. PWAS transducers are a convenient way of transmitting and receiving guided waves in structures for SHM applications [4]. The analytical model of PWAS generated Lamb waves and its tuning effect has been investigated, and a close-form solution for straight crested guided Lamb wave was derived in ref [11]. Extension of tuning concepts to 2-D analytical models of Lamb waves generated by finite-dimensional piezoelectric transducers was given in ref [12]. These analytical developments facilitate the understanding of PWAS-coupled Lamb waves for SHM applications. However, these analytical solutions only applied to guided wave propagation in pristine structures, whereas the use of Lamb waves in SHM applications requires that their interaction with damage be also studied. After interacting with damage, Lamb waves will carry damage information resulting in waveforms with special characteristics (phase change, new wave packets generation through mode conversion, higher-harmonic components, etc.), which need to be investigated for damage detection. Several investigators have studied the interaction between guided waves and damage analytically using normal-mode expansion and boundary-condition matching [13, 14, 15, 16, 17, 18, 19]. Damage interaction coefficients were derived to quantify the guided-wave transmission, reflection, mode conversion, and scatter at the damage site. Due to their mathematical complexity, these analytical solutions are restricted to simple damage geometries: notches, holes, partially through holes. Extension to more complicated damage geometries has been attempted through series expansion of the rugged damage contour. In the generic case of arbitrary-shape damage, the numerical approaches using space discretization (FEM, BEM) are used due to their convenience, but on the expense of orders of magnitude increase in
6

Report # USC-ME-LAMSS-2012-101
computational time and/or computer resources. The design of a SHM system requires computationally-efficient predictive tools that permit the exploration of a wide parameter space to identify the optimal combination between the transducers type, size, number and guided wave characteristics (mode type, frequency, and wavelength) to achieve best detection and quantification of a certain damage type. Such parameter space exploration desiderate can be best achieved with analytical tools which are fast and efficient. In this report, we describe an analytical approach based on the 1D (straight crested) guided wave propagation analysis. In our study, we inserted the damage effect into the analytical model by considering wave transmission, reflection, mode conversion, and higher harmonics components described through damage interaction coefficients at the damage site. We do not attempt to derive these damage interaction coefficients here, but assume that they are available either from literature or from FEM, BEM analysis performed separately in a separate computational module. This analytical approach was coded into MATLAB and the WaveFormRevealer (WFR) graphical user interface (GUI) was developed. The WFR can generate fast predictions of waveforms resulting from Lamb waves propagation and interaction with damage for arbitrary positioning of PWAS transmitters and receivers with respect to damage and with respect to each other. The users may choose their own excitation signal, PWAS size, structural parameters, and damage description. The current version of the WFR code is limited to 1D (straight crested) guided wave propagation; extension of this approach to 2D (circular crested) guided wave propagation will be attempted in the future.
2 PWAS FUNDAMENTALS
Piezoelectric wafer active sensors (PWAS) couple the electrical and mechanical effects
(mechanical strain, ijS , mechanical stress, klT , electrical field, kE , and electrical
displacement, jD ) through the tensorial piezoelectric constitutive equations
E
ij ijkl kl kij k
Tj kij kl jk k
S s T d E
D d T Eε
= +
= + (1)
where Eijkls is the mechanical compliance of the material measured at zero electric field
( 0E = ), Tjkε is the dielectric permittivity measured at zero mechanical stress ( 0T = ), and
kijd represents the piezoelectric coupling effect. PWAS utilize the 31d coupling between
in-plane strains, 1 2,S S and transverse electric field 3E .
PWAS transducers can be used as both transmitters and receivers. Their modes of operation are shown Figure 5. PWAS can serve several purposes [4]: (a) high-bandwidth strain sensors; (b) high-bandwidth wave exciters and receivers; (c) resonators; (d) embedded modal sensors
7

Report # USC-ME-LAMSS-2012-101
with the electromechanical (E/M) impedance method. By application types, PWAS transducers can be used for (i) active sensing of far-field damage using pulse-echo, pitch-catch, and phased-array methods, (ii) active sensing of near field damage using high-frequency E/M impedance method and thickness gage mode, and (iii) passive sensing of damage-generating events through detection of low-velocity impacts and acoustic emission at the tip of advancing cracks (Figure 5). The main advantage of PWAS over conventional ultrasonic probes is in their small size, lightweight, low profile, and small cost. In spite of their small size, PWAS are able to replicate many of the functions performed by conventional ultrasonic probes.
Figure 5: Schematic of PWAS application modes (from Ref [20])
3 ANALYTICAL MODELING OF LAMB WAVES INTERACTING WITH DAMAGE
3.1 Analytical modeling of guided Lamb waves propagation in a pristine structure
One aspect of the difficulties in modeling Lamb wave propagation is due to their multi-mode feature. WFR is capable of modeling multi-mode Lamb wave propagation in structures. From Rayleigh-Lamb equation, the existence of certain Lamb mode depends on the plate thickness-frequency product. The fundamental S0 and A0 modes will always exist, but the higher modes will only appear beyond the cutoff frequencies [2]. This section describes how an electrical tone burst applied to a transmitter PWAS transducer (T-PWAS) propagates through a structural waveguide to the receiver PWAS transducer (R-PWAS) in pitch-catch mode (Figure 6).
8

Report # USC-ME-LAMSS-2012-101
Figure 6: A pitch-catch configuration between a transmitter PWAS and a receiver PWAS
The propagation takes place through ultrasonic guided Lamb waves which are generated at the T-PWAS through piezoelectric transduction and then captured and converted back into electric signal at the R-PWAS. Since several Lamb wave modes traveling with different wave speeds exist simultaneously, the electrical tone-burst applied on the T-PWAS will generate several wave packets. These wave packets will travel independently through the waveguide and will arrive at different times at the R-PWAS where they are converted back into electric signals through piezoelectric transduction. The predictive analytical model for Lamb wave propagation between the T-PWAS and R-PWAS is constructed in frequency domain in the following steps (Figure 8a).
STEP 1: Perform Fourier transform of the time-domain excitation signal ( )TV t to obtain the
frequency domain excitation spectrum, ( )TV ω . For a tone burst, the signal ( )TV t and its
Fourier transform ( )TV ω .look like in Figure 7.
Figure 7: Tone burst signal: (a) time domain; (b) frequency domain. (From ref [4], page 153)
Piezoelectric transduction
Mech.→Elec.
Transmitter PWAS Excitation:
Piezoelectric transduction
Elec.→Mech.
Ultrasonic guided waves from T-PWAS undergo dispersion according to structural
transfer function
Receiver PWAS Signal:
T-PWAS R-PWAS
(a)
(b)
Tone burst of frequency Frequency spectrum of tone burst Main lobe
Side lobe
Center frequency
9

Report # USC-ME-LAMSS-2012-101
Figure 8: WaveFormRevealer flow charts: (a) propagation in a pristine structural waveguide; (b) propagation
and interaction with damage at location dx
STEP 2: Calculate the frequency-domain structural transfer function ( , )rG x ω from
T-PWAS to R-PWAS. The structure transfer function ( ),rG x ω is given by Eq. (99) of ref.
[4], page 327, which gives the in-plane wave strain at the plate surface as
( ) ( )( )
( ) ( )( )
( )0' '
, (sin ) (sin )S A
S A
S Ai x t i x tS AS A
x S AS A
N Nax t i a e a eD D
x ω x ω
x x
x xtε x xµ x x
− − − − = − + ∑ ∑ (2)
where x is the frequency dependent wave number of each Lamb wave mode and the superscripts S and A refer to symmetric and antisymmetric Lamb wave modes. If only the two
fundamental modes, S0 and A0, are present, then ( ),rG x ω can be written as
Perform inverse Fourier transform
Multiply excitation with structural transfer function
Calculation of structural transfer function
Fourier transform of excitation signal
This new wave source is multiplied with structural transfer function from damage till R-PWAS
New wave source
Transmission, reflection, mode conversion, higher harmonics
Perform inverse Fourier transform
Multiply excitation with structural transfer function to the damage location
Calculation of structural transfer function up to damage location
Fourier transform of excitation signal
Flow chart for pristine guided wave propagation
Flow chart for guided wave propagation with damage interaction
(a)
(b)
10
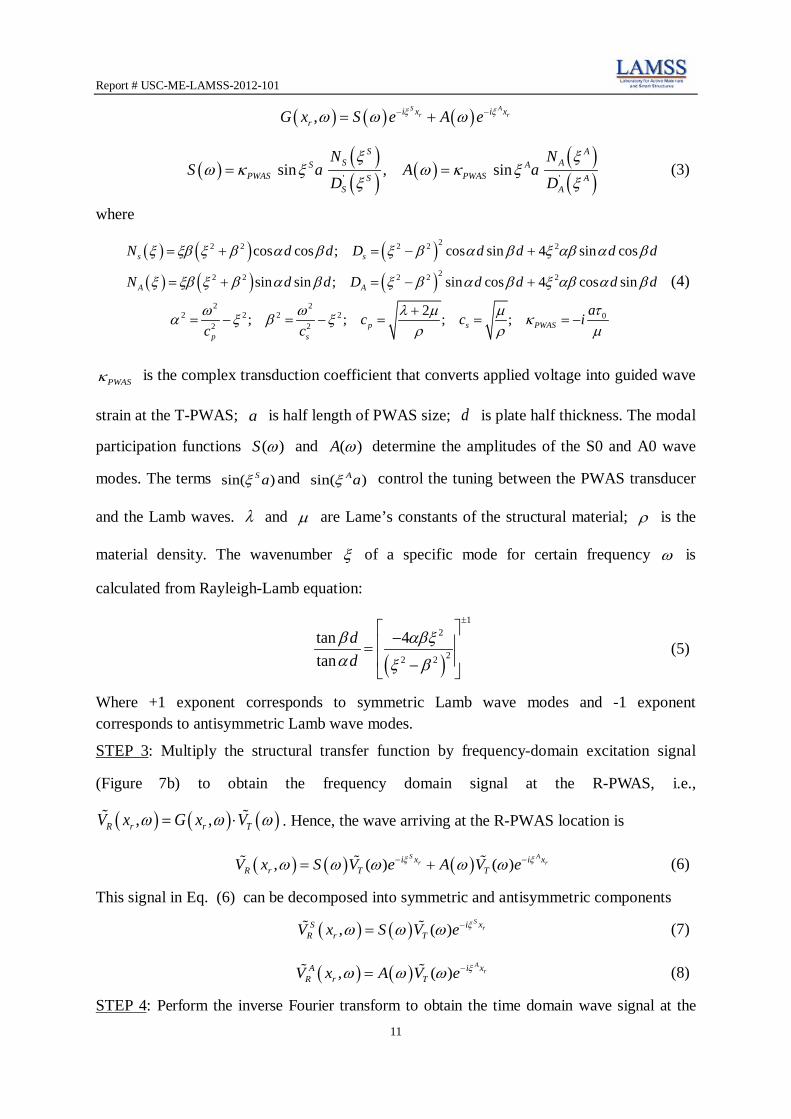
Report # USC-ME-LAMSS-2012-101
( ) ( ) ( ),S A
r ri x i xrG x S e A ex xω ω ω− −= +
( ) ( )( ) ( ) ( )
( )' 'sin , sin
S AS AS A
PWAS PWASS AS A
N NS a A a
D D
x xω κ x ω κ x
x x= = (3)
where
( ) ( ) ( )( ) ( ) ( )
22 2 2 2 2
22 2 2 2 2
2 22 2 2 2 0
2 2
cos cos ; cos sin 4 sin cos
sin sin ; sin cos 4 cos sin
2; ; ; ;
s s
A A
p s PWASp s
N d d D d d d d
N d d D d d d d
ac c ic c
x xβ x β a β x β a β x aβ a β
x xβ x β a β x β a β x aβ a β
tω ω l µ µa x β x κρ ρ µ
= + = − +
= + = − +
+= − = − = = = −
(4)
PWASκ is the complex transduction coefficient that converts applied voltage into guided wave
strain at the T-PWAS; a is half length of PWAS size; d is plate half thickness. The modal
participation functions ( )S ω and ( )A ω determine the amplitudes of the S0 and A0 wave
modes. The terms sin( )S ax and sin( )Aax control the tuning between the PWAS transducer
and the Lamb waves. l and µ are Lame’s constants of the structural material; ρ is the
material density. The wavenumber x of a specific mode for certain frequency ω is
calculated from Rayleigh-Lamb equation:
( )
12
22 2
tan 4tan
dd
β aβxa x β
± − = −
(5)
Where +1 exponent corresponds to symmetric Lamb wave modes and -1 exponent corresponds to antisymmetric Lamb wave modes.
STEP 3: Multiply the structural transfer function by frequency-domain excitation signal
(Figure 7b) to obtain the frequency domain signal at the R-PWAS, i.e.,
( ) ( ) ( ), ,R r r TV x G x Vω ω ω= ⋅ . Hence, the wave arriving at the R-PWAS location is
( ) ( ) ( ), ( ) ( )S A
r ri x i xR r T TV x S V e A V ex xω ω ω ω ω− −= + (6)
This signal in Eq. (6) can be decomposed into symmetric and antisymmetric components
( ) ( ), ( )S
ri xSR r TV x S V e xω ω ω −= (7)
( ) ( ), ( )A
ri xAR r TV x A V e xω ω ω −= (8)
STEP 4: Perform the inverse Fourier transform to obtain the time domain wave signal at the 11

Report # USC-ME-LAMSS-2012-101
R-PWAS, i.e.,
( , ) { ( , )}R r R rV x t IFFT V x ω= (9)
Due to the multi-mode character of guided Lamb wave propagation, the received signal has at least two separate wave packets, S0 and A0 (Figure 9). This analysis can be extended to include higher guided wave modes (S1, A1, etc.) , i.e.,
( ) ( ) ( ), ( ) ( )S A
r r
S A
i x i xR r T TV x S V e A V ex x
x x
ω ω ω ω ω− −= +∑ ∑ (10)
All the wave modes propagate independently in the structure. The final waveform will be the superposition of all the propagating waves and will have the contribution from each Lamb mode.
Figure 9: T-PWAS signal and R-PWAS signal
3.2 Insertion of damage effects into the analytical model
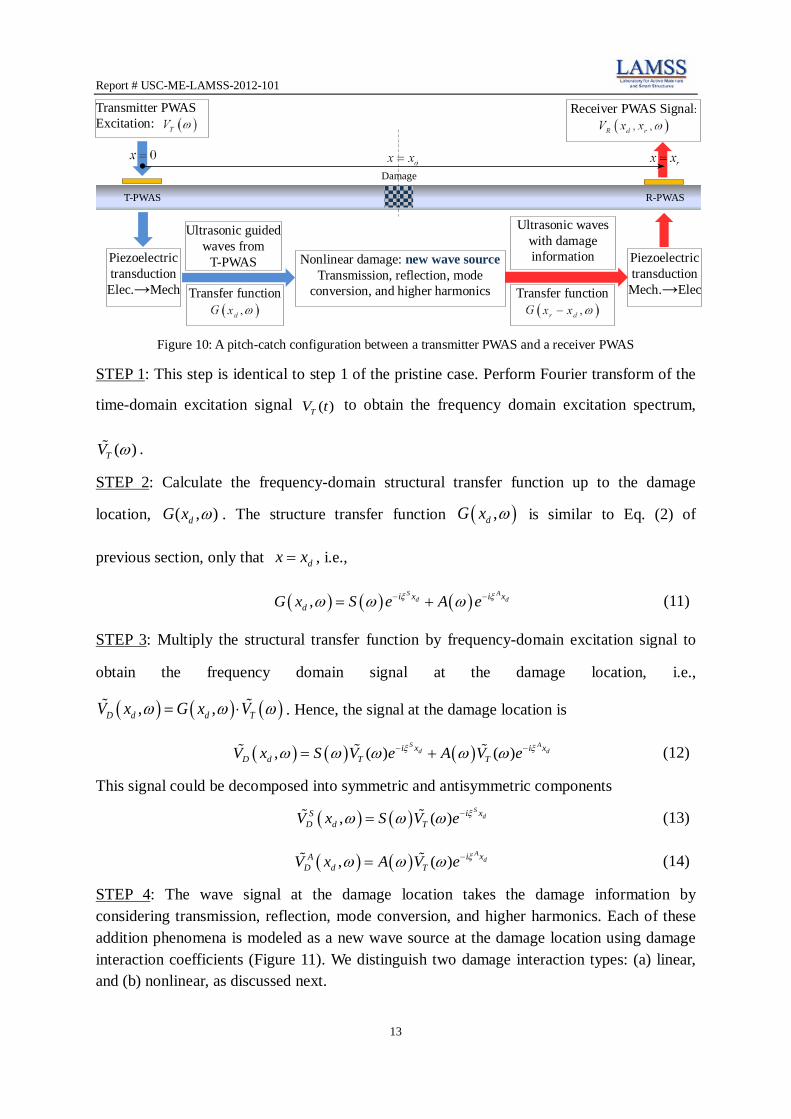
Figure 10 shows the pitch-catch active sensing method for damage detection: the T-PWAS transducer generates ultrasonic guided waves which propagate into the structure, interact with
structural damage at dx x= , carry the damage information with them, and are picked up by
the R-PWAS transducer at rx x= .
To model the damage effect on Lamb wave propagation, we consider the damage as a new
wave source at dx x= and we add mode conversion and nonlinear sources at the damage
location through damage interaction coefficients. The predictive analytical model for Lamb wave interaction with damage is constructed in frequency domain in the following steps:
T-PWAS signal
R-PWAS signal
S0
A0
12
Report # USC-ME-LAMSS-2012-101
Figure 10: A pitch-catch configuration between a transmitter PWAS and a receiver PWAS
STEP 1: This step is identical to step 1 of the pristine case. Perform Fourier transform of the
time-domain excitation signal ( )TV t to obtain the frequency domain excitation spectrum,
( )TV ω .
STEP 2: Calculate the frequency-domain structural transfer function up to the damage
location, ( , )dG x ω . The structure transfer function ( ),dG x ω is similar to Eq. (2) of
previous section, only that dx x= , i.e.,
( ) ( ) ( ),S A
d di x i xdG x S e A ex xω ω ω− −= + (11)
STEP 3: Multiply the structural transfer function by frequency-domain excitation signal to
obtain the frequency domain signal at the damage location, i.e.,
( ) ( ) ( ), ,D d d TV x G x Vω ω ω= ⋅ . Hence, the signal at the damage location is
( ) ( ) ( ), ( ) ( )S A
d di x i xD d T TV x S V e A V ex xω ω ω ω ω− −= + (12)
This signal could be decomposed into symmetric and antisymmetric components
( ) ( ), ( )S
di xSD d TV x S V e xω ω ω −= (13)
( ) ( ), ( )A
di xAD d TV x A V e xω ω ω −= (14)
STEP 4: The wave signal at the damage location takes the damage information by considering transmission, reflection, mode conversion, and higher harmonics. Each of these addition phenomena is modeled as a new wave source at the damage location using damage interaction coefficients (Figure 11). We distinguish two damage interaction types: (a) linear, and (b) nonlinear, as discussed next.
Transfer function
Ultrasonic waves with damage information Piezoelectric
transduction Mech.→Elec
Transmitter PWAS Excitation:
Piezoelectric transduction
Elec.→Mech
Nonlinear damage: new wave source Transmission, reflection, mode
conversion, and higher harmonics
Ultrasonic guided waves from
T-PWAS Transfer function
Receiver PWAS Signal:
T-PWAS R-PWAS
Damage
13

Report # USC-ME-LAMSS-2012-101
Figure 11: Modeling wave transmission, reflection, mode conversion, higher harmonics components.
3.2.1 Linear damage interaction
Wave transmission, reflection, and mode conversion are realized by using complex-amplitude damage interaction coefficients. Our notations are as follows: we use three letters to describe the interaction phenomena, with the first letter denoting the incident wave type, the second letter standing for resulting wave type, and the third letter meaning propagation direction (transmission/reflection). For instance, SST (symmetric-symmetric-transmission) means the incident symmetric waves transmitted as symmetric waves, while SAT (symmetric-antisymmetric-transmission) means incident symmetric waves transmitted and mode converted to antisymmetric waves. Thus the complex-amplitude damage interaction
coefficient SSTiSSTC e ϕ−⋅ denotes the transmitted symmetric mode generated by incident
symmetric mode with magnitude SSTC and phase SSTϕ . Similarly, SATiSATC e ϕ−⋅ represents
the transmitted antisymmetric mode generated by incident symmetric mode with magnitude
SATC and phase SATϕ . These coefficients are determined by the features of the damage and
are to be imported into the WFR model.
3.2.2 Nonlinear damage interaction
The center frequency of waves arriving at the damage location can be obtained from Eq. (13)
and (14) as cω . The 2nd and 3rd higher harmonics act as wave sources with center frequencies
of 2 cω and 3 cω respectively. Modeling of higher harmonics is achieved by moving the
frequency domain signal at the damage location to the right hand side of the frequency axis
by cω and 2 cω , i.e., ( ) ( )2 , ,D d D d cV x V xω ω ω= − and ( ) ( )3 , , 2D d D d cV x V xω ω ω= −
Frequency
Am
plitu
de
Reflection: Transmission:
Reflection + mode conversion:
Transmission + mode conversion:
Signal spectrum at damage
Damage acts as new wave source
14

Report # USC-ME-LAMSS-2012-101
represent the 2nd and 3rd higher harmonics nonlinear wave source. The nonlinear damage interaction coefficients are defined in the same way as the linear ones.
For instance, the complex-amplitude damage interaction coefficient MSST
SST
iMC e ϕ−⋅ denotes the
Mth higher harmonics transmitted symmetric mode generated by incident symmetric mode
with magnitude SST
MC and phase SST
Mϕ .
STEP 5: The guided waves from the new wave sources created at the damage location
propagate through the rest of the structure and arrive at the R-PWAS. The received wave
signal is calculated in frequency domain as
( ) ( ) ( ) ( )
( ) ( ) ( )
1
1
, , , ,
, ,
SM Mr dSST AST
AMMr dSATAAT
mi x xi iM S M A
R d r SST MD d AST MD dM
mi x xiiM A M S
AAT MD d SAT MD dM
V x x C e V x C e V x e
C e V x C e V x e
xϕ ϕ
xϕϕ
ω ω ω
ω ω
− −− −
=
− −−−
=
= ⋅ + ⋅
+ ⋅ + ⋅
∑
∑
(15)
where M is the number of higher harmonics considered. For linear interaction with damage, M equals to one. STEP 6: Perform inverse Fourier transform to obtain the time domain receiver sensing signal
( , , ) { ( , , )}R d r R d rV x x t IFFT V x x ω= (16)
It should be noted that the above analysis only considers S0 and A0 modes. But the principle could be easily extended to higher modes (S1, A1, etc.). The difficulty with extending to higher modes will be on defining the increasing number of transmission, reflection, mode conversion coefficients. For each excited Lamb mode, the interaction with damage may result in more mode conversion possibilities. In this study, the WFR has been designed to simulate: (a) multimode (S0, A0, S1, A1) Lamb waves propagation in pristine plates; (b) fundamental modes (S0 and A0) Lamb waves interaction with damage.
4 ACKNOWLEDGEMENTS
Support from Office of Naval Research # N00014-11-1-0271, Dr. Ignacio Perez, Technical Representative; Air Force Office of Scientific Research #FA9550-11-1-0133, Dr. David Stargel, Program Manager; are thankfully acknowledged. Note: A concise version of this report has been submitted in 2013 to Structural Health Monitoring – An International Journal, manuscript # SHM-13-0016
REFERENCES
[1] M. Ruzzene, "Frequency-wavenumber domain filtering for improved damage visualization," Smart Materials and Structures, vol. 16, pp. 2116-2129, 2007.
[2] K. F. Graff, Wave motion in elastic solids, New York: Dover publications, INC., 1991.
15

Report # USC-ME-LAMSS-2012-101
[3] J. L. Rose, Ultrasonic Waves in Solid Media, Cambridge: Cambridge University Press, 1999.
[4] V. Giurgiutiu, Structural healthing monitoring with piezoelectric wafer active sensors, Elsevier Academic Press, 2007.
[5] K. Y. Jhang, "Nonlinear Ultrasonic Techniques for Nondestructive Assessment of Micro Damage in Material: A Review," International journal of Materials, pp. 123-135, 2009.
[6] D. Dutta, H. Sohn and K. A. Harries, "A nonlinear acoustic technique for crack detection in metallic structures," Structural Health Monitoring-an international journal, pp. 573-573, 2009.
[7] Y. Shen and V. Giurgiutiu, "Simulation of interaction between Lamb waves and cracks for structural health monitoring with piezoelectric wafer active sensors," in ASME 2012 Conference on Smart Materials, Adaptive Structures and Intelligent Systems, Stone Moutain, Georgia, USA, 2012.
[8] F. Moser, L. J. Jacobs and J. Qu, "Modeling elastic wave propagation in waveguides with the finite element method," NDT&E International, pp. 225-234, 1999.
[9] M. Gresil, Y. Shen and V. Giurgiutiu, "Predictive modeling of ultrasonics SHM with PWAS transducers," in 8th International Workshop on Structural Health Monitoring, Stanford, CA, USA, 2011.
[10] V. Giurgiutiu, M. Gresil, B. Lin, A. Cuc, Y. Shen and C. Roman, "Predictive Modeling of Piezoelectric Wafer Active Sensors Interaction with High-frequency Structural Waves and Vibration," Acta Mechanica, pp. 1681-1691, 2012.
[11] V. Giurgiutiu, "Tuned Lamb wave excitation and detection with piezoelectric wafer active sensors for structural health monitoring," Journal of intelligent material systems and structures, pp. 291-306, 2005.
[12] A. Raghavan and C. E. S. Cesnik, "Finite-dimensional piezoelectric transducer modeling for guided wave based structural health monitoring," Smart Materials and Structures, vol. 14, pp. 1448-1461, 2005.
[13] A. N. Norris and C. Vemula, "Scattering of flexual waves in thin plates," Journal of Sound and Vibration, pp. 115-125, 1995.
[14] C. Vemula and A. N. Norris, "Flexual wave propagation and scattering on thin plates using Mindlin theory," Wave Motion, vol. 26, pp. 1-12, 1997.
[15] J. C. P. McKeon and M. K. Hinders, "Lamb waves scattering from a through hole," Journal of Sound and Vibration, pp. 843-862, 1999.
[16] M. K. Hinders, "Lamb waves scattering from rivets," Quantitative Nondestructive Evaluation, vol. 15, 1996.
[17] T. Grahn, "Lamb wave scattering from a circular partly through-thickness hole in a plate," Wave Motion, 2002.
[18] L. Moreau, M. Caleap, A. Velichko and P. D. Wilcox, "Scattering of guided waves by flat-bottomed cavities with irregular shapes," Wave Motion, 2012.
16
Report # USC-ME-LAMSS-2012-101
[19] L. Moreau, M. Caleap, A. Velichko and P. D. Wilcox, "Scattering of guided waves by through-thickness cavities with irregular shapes," Wave Motion, vol. 48, pp. 586-602, 2011.
17