
Watson Wyatt 2007 Pharmaceutical Sector Meeting … Watson Wyatt 2007 Pharmaceutical Sector Meeting...
43
watsonwyatt.com Watson Wyatt 2007 Pharmaceutical Sector Meeting 21st February Sheraton Hotel, Karachi
-
Upload
doannguyet -
Category
Documents
-
view
219 -
download
1
Transcript of Watson Wyatt 2007 Pharmaceutical Sector Meeting … Watson Wyatt 2007 Pharmaceutical Sector Meeting...

watsonwyatt.com
Watson Wyatt 2007Pharmaceutical Sector Meeting
21st February Sheraton Hotel, Karachi
Copyright © Watson Wyatt Worldwide. All rights reserved.
1
Meeting Objectives
● Review of 2006 survey process and outputs to● Review country level developments & issues● Receive your feedback on our survey delivery in
2006● Provide feedback on your input in 2006● Identify potential areas for improvement● Prepare for 2007

Copyright © Watson Wyatt Worldwide. All rights reserved.
2
Methodology, Submission & Verification
● 5 incumbents/5 companies still to be used as range minimum– Focus on increasing no. of companies in the survey database– Focus on optimising data submission from all companies– Focus on individual job matching initially for WW/Sidat to get closer to
each pharma company– Consolidation of findings at a group session to ensure consistent
matching for similar roles
● Participants will be informed of likely issues regarding outputsbefore survey is published
● SurveyJob Desciptions to be expanded to include Production,Research and Quality families

Copyright © Watson Wyatt Worldwide. All rights reserved.
3
Methodology, Submission & Verification
● Years of experience data to be collected in PAKISTAN● All incumbent input to be maintained● Expand comp elements to cover certain parks / benefits
/allowances● First stage of alignment of survey jobs across whole
EMEA● Executive data to be supplied wherever possible● Pharma career map XLS document to be used
extensively in job matching sessions, detailing key role competencies

Copyright © Watson Wyatt Worldwide. All rights reserved.
4
Survey Cycle 2007
Dispatching the survey materialApril 2007
Paper questionnaire - Electronic input via the Web - InstructionsFull previous input provided
(except sales volume, number of employees & sal. increases)April & May
Individual and Group Job Matching Support(consultants available to assist in job matching queries)
Data @ April 1st 2007Submission Deadline end May 2007
All Participants Who Submit On TimeAll Participants Who Submit On TimeWill Receive the Comptrack Export Module FREE!!Will Receive the Comptrack Export Module FREE!!
Data processing & report deliveryReports for Pakistan to be produced in August

watsonwyatt.com
Middle East & Africa 2006 - the Year in Review

Copyright © Watson Wyatt Worldwide. All rights reserved.
6
• Pharma survey running in 43 EMEA countries
• Participant growth sustained for the 4th
consecutive year in MEA club surveys
• Successful 2006 campaign Central & Eastern Europe 3 additional country pharma reports produced (Estonia, Latvia, Lithuania)
• CEE – added 3 additional GIS countries (Azerbaijahn, Georgia & Moldova)
2006: The Year In Review – WWDS & the Pharmaceutical Sector

Copyright © Watson Wyatt Worldwide. All rights reserved.
7
2006: The Year In Review
● Participation: overall large increases in both survey participation and data points received
● Particularly good years for Pharma participation in– UAE (31% growth) - Tunisia (80% growth)– Pakistan (43% growth) - Cyprus (133% growth)– Algeria (44% growth)– Jordan (50% growth)
● However the above growth has been somewhat offset by changes to survey methodology

Copyright © Watson Wyatt Worldwide. All rights reserved.
8
0
20
40
60
80
100
120Morocco
Saudi
Egypt
UAE
Lebanon
Pakistan
Oman
Qatar
GISPharma
Pharma/GIS 2005 Participation

Copyright © Watson Wyatt Worldwide. All rights reserved.
9
0
20
40
60
80
100
120Morocco
Saudi
Egypt
UAE
Lebanon
Pakistan
Oman
Qatar
GISPharma
Pharma/GIS 2006 Participation

Copyright © Watson Wyatt Worldwide. All rights reserved.
10
-20%0%
20%40%60%80%
100%120%140%160%180%
Morocco
Saudi
Egypt
UAE
Lebanon
Pakistan
Oman
Qatar
Algeria
Cyprus
Tunisia
Kuwait
Jordan
Bahrain
GISPharma
Pharma/GIS 2006 – Growth %
Copyright © Watson Wyatt Worldwide. All rights reserved.
11
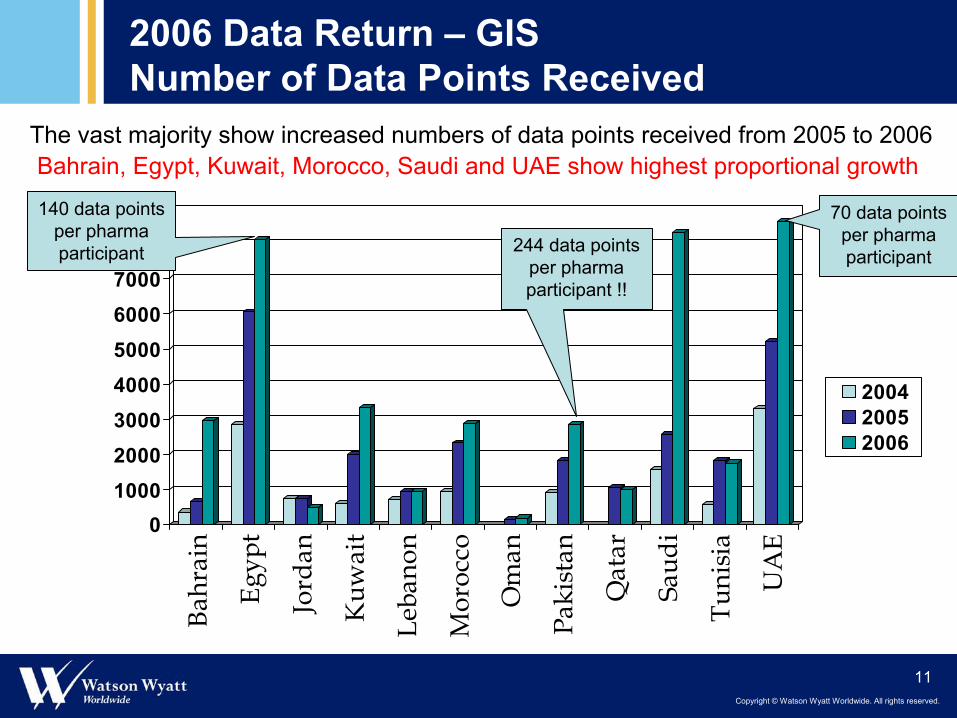
2006 Data Return – GIS Number of Data Points Received
0100020003000400050006000700080009000
Bahrain
Egypt
Jordan
Kuwait
Lebanon
Morocco
Oman
Pakistan
Qatar
Saudi
Tunisia
UAE
200420052006
The vast majority show increased numbers of data points received from 2005 to 2006Bahrain, Egypt, Kuwait, Morocco, Saudi and UAE show highest proportional growth
244 data points per pharma participant !!
140 data points per pharma participant
70 data points per pharma participant

watsonwyatt.com
Middle East & Africa: Methodology Review & Feedback

Copyright © Watson Wyatt Worldwide. All rights reserved.
13
The cycle that saw many changes…• All incumbent output as opposed to the maximum of 5 incumbents per benchmark job per company as in previous reports
• Minimum 5 incumbents across 5 companies required to produce a range in response to US Anti-Trust legislation
• Production of pharma compa-ratios vs. equivalent GISbenchmarks in the event of reduced numbers of market ranges resulting from the above methodological alterations
• Collection of Years of Experience data in UAE, Egypt & Pakistan
• Pharma executive data supplemented by General Industry executive data
• All incumbent
5 incumbents across 5 companies
pharma compa-ratios vs. equivalent GISbenchmarks
Years of Experience

Copyright © Watson Wyatt Worldwide. All rights reserved.
14
…and the implications thereof
• Minimum 5 incumbent across 5 companies resulted in the publication of fewer benchmark ranges despite overall growth in participation and datapoints
• All incumbent output resulted in the skewing of some ranges as more data was contributed
• All incumbent output resulted in the need to adopt “sample swamping” measures

Copyright © Watson Wyatt Worldwide. All rights reserved.
15
2006 Data Return – Pharma Executive Data
0
10
20
30
40
50
60
70Egypt
Pakistan
Algeria
Morocco
UAE
Saudi
Tunisia
Lebanon
Cyprus
Jordan
Kuwait
Oman
Bahrain
Qatar
TMDatapoints
GMDatapoints
No executive data received in Bahrain or QatarEgypt, Pakistan, Algeria, Morocco, UAE & Saudi show highest return levels
Few pure-pharma GM Ranges published

Copyright © Watson Wyatt Worldwide. All rights reserved.
16
Years of Experience - UAE, EGY, PAK
YY0Wyeth
Y0Ranbaxy
Y0Novartis CH
YYY0MSD
Y0Macter
YY0JanCil
Y0ISL
YY0BMS
YY0Astrazeneca
YY0Alcon
NY1Servier
NYY1Roche
N1Organon
NY1Novartis
NY1Lilly
N1J&J ME
N1Baxter
NN2Sanofi
NYN2Pfizer
NNY2GSK
UAEPakistanEgypt# NCompany

watsonwyatt.com
MEA Survey Data Trends

Copyright © Watson Wyatt Worldwide. All rights reserved.
18
123456789
1011121314151617
Algeria
Egypt
Lebanon
Morocco
Pakistan
Saudi
UAE
GIS Pharma Hi Tech
2006 Median Actual Increases by Sector*
*Where independent sector reports are published
Expr
esse
d as
a %
Copyright © Watson Wyatt Worldwide. All rights reserved.
19
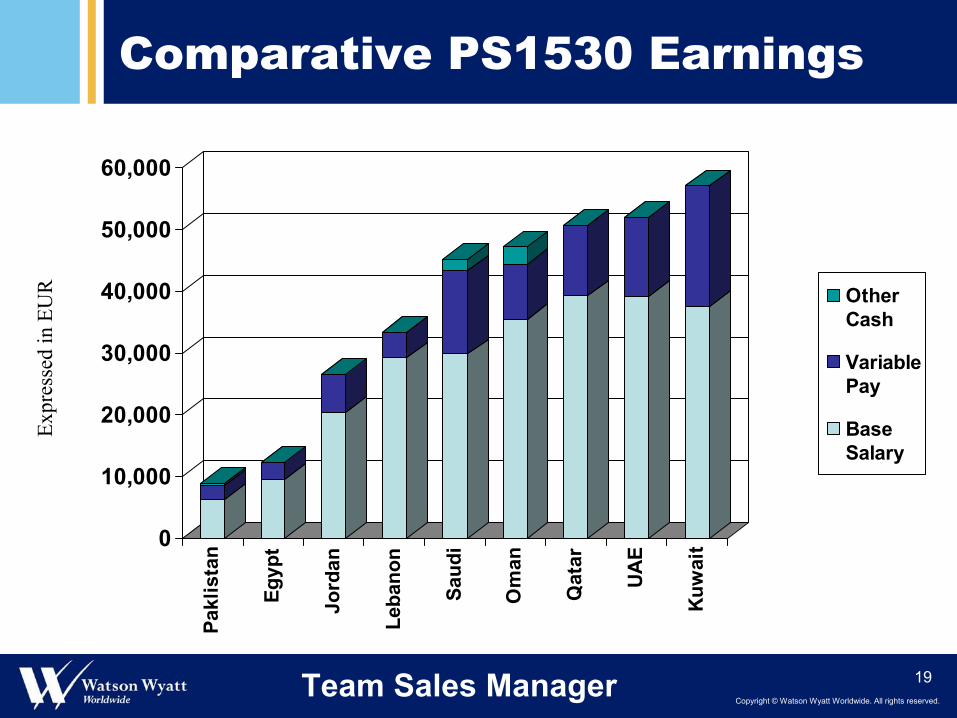
Comparative PS1530 Earnings
0
10,000
20,000
30,000
40,000
50,000
60,000
Pakl
ista
n
Egyp
t
Jord
an
Leba
non
Saud
i
Om
an
Qat
ar
UA
E
Kuw
ait
OtherCash
VariablePay
BaseSalary
Expr
esse
d in
EU
R
Team Sales Manager

Copyright © Watson Wyatt Worldwide. All rights reserved.
20
Comparative PS2030 Earnings
0
10,000
20,000
30,000
40,000
50,000
60,000Eg
ypt
Alg
eria
Jord
an
Mor
occo
Tuni
sia
Leba
non
Saud
i
UA
E
Bah
rain
Om
an
Qat
ar
Kuw
ait
OtherCash
VariablePay
BaseSalary
Expr
esse
d in
EU
R
Senior Pharma Sales Rep
Copyright © Watson Wyatt Worldwide. All rights reserved.
21
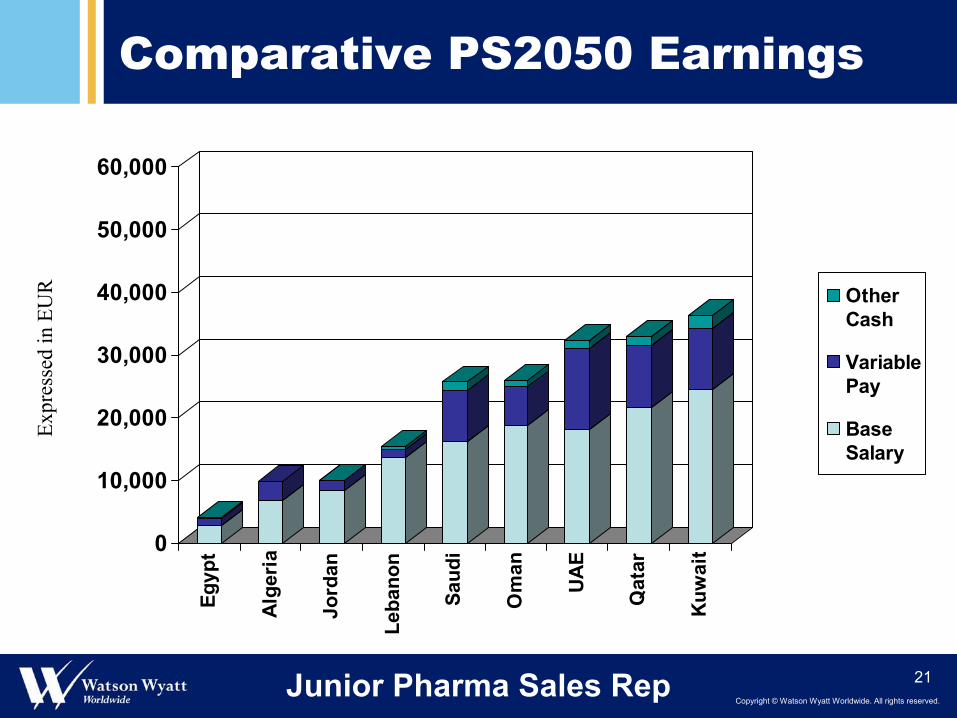
Comparative PS2050 Earnings
0
10,000
20,000
30,000
40,000
50,000
60,000
Egyp
t
Alg
eria
Jord
an
Leba
non
Saud
i
Om
an
UA
E
Qat
ar
Kuw
ait
OtherCash
VariablePay
BaseSalary
Expr
esse
d in
EU
R
Junior Pharma Sales Rep

Copyright © Watson Wyatt Worldwide. All rights reserved.
22
To Summarise…
• Kuwait sales employees consistently command the highest total cash salaries in Euro terms
• Unsurprisingly, the Gulf region exhibits the highest pay levels in the MEA
• At the other end of the scale are Egypt and Pakistan where employees may receive salaries amounting to 10 - 20% of that of employees in Kuwait
•Comparative COL not considered of course!

watsonwyatt.com
Job MappingJob MappingBest PracticesBest Practices
Copyright © Watson Wyatt Worldwide. All rights reserved.
24
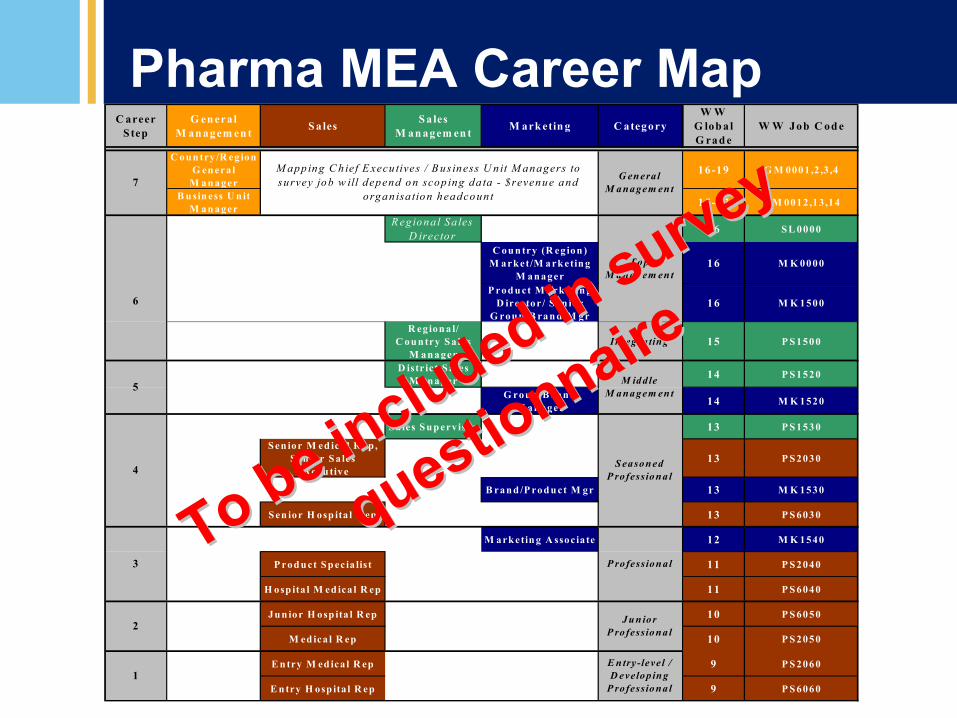
Pharma MEA Career MapC areer
S tepG en era l
M an agem en t S ales S a les M an agem en t M ark etin g C ategory
W W G lob al G rad e
W W Job C od e
C ou n try /R egion G en era l
M an ager16-19 G M 0001,2 ,3 ,4
B u sin ess U nit M an ager 15-17 G M 0012,13 ,14
R egiona l Sa les D irecto r 16 S L 0000
C ou n try (R egion ) M arket/M ark etin g
M anager 16 M K 0000
P rod u ct M ark etin g D irector / Sen ior
G rou p B ran d M gr16 M K 1500
R egion a l/ C ou n try S a les
M anagerIn tegra tin g 15 P S 1500
D istr ict S a les M anager 14 P S 1520
G rou p B rand M an ager 14 M K 1520
S ales Su p erv isor 13 P S 1530
S en ior M ed ica l R ep , S en ior S a les
E xecu tive13 P S 2030
B ran d /P rod u ct M gr 13 M K 1530
S en ior H osp ita l R ep 13 P S 6030
M ark etin g A ssociate 12 M K 1540
P rod u ct Sp ecia list 11 P S 2040
H osp ita l M ed ica l R ep 11 P S 6040
Ju n ior H osp ita l R ep 10 P S 6050
M ed ica l R ep 10 P S 2050
E n try M ed ica l R ep 9 P S 2060
E n try H osp ita l R ep 9 P S 6060
2
P rofession al
Ju n ior P rofessiona l
6
4
7M apping C h ief E xecu tives / B usiness U nit M anagers to survey job w ill depend on scop ing da ta - $revenue and
organ isa tion headcount
E n try-leve l / D evelop in g
P rofessiona l
S eason ed P rofessiona l
G en era l M anagem en t
M iddle M anagem en t
3
1
5
T op M anagem en t
To be included in survey
To be included in survey
questionnaire
questionnaire

Copyright © Watson Wyatt Worldwide. All rights reserved.
25
Global Grading System
● Underpins all Watson Wyatt Surveys● Assists Job Matching, not a substitute for!!!● Grades are consistent across families● Benchmark jobs have suggested grades● Can link to other providers grading systems based on
empirical referencing (Hay, Mercer)● Standard Simple Methodology which is useful for Job
Matching● Always starts with defining the Business in terms of
scope

Copyright © Watson Wyatt Worldwide. All rights reserved.
26
'ROLE' CONTRIBUTES (THROUGH)'ROLE' CONTRIBUTES (THROUGH)
WW Salary Survey Structure
GRADEGRADE
BANDBANDASSISTANCE INDEPENDENTLY LEADERSHIP
1 2 3 4 5 6 7 8 9 10 11 12 13 14 15 16 17 18
EXPERTISE2 31 4
24
SUPERVISOR
STRATEGY5
VISION6
FIRST-LINE TOPMANAGEMENT
TOPMANAGEMENT
MIDDLEMANAGEMENT
SALES
PS SALES EXECUTIVE
FAMILYFAMILY
POSITION/POSITION/SUB SUB
FUNCTIONFUNCTION
PROFESSIONAL
TECHNICIAN
Sr CLERICAL/ ADMIN
CLERICAL /ADMIN
ANCILLARY
SENIORPROFESSIONAL
MW
OGSS
PRO
19 20 21 22 23 25
MM
TMGM

Copyright © Watson Wyatt Worldwide. All rights reserved.
27
COMPLEXITY OF MARKETPRODUCTDIVERSIFICATION
LOWMEDIUM
HIGH
Domestic International Global161820
192123
202224
EMPLOYMENT100,00010,000 50,0005,0001,000 2,00050075 150
24 252321 222018 191716
200,00027,500 75,00010,6001,600 4,10062090 240
TURNOVER
Scope the Business
● Set the CEO grade and the “ceiling” for all other jobs in the organisation

Copyright © Watson Wyatt Worldwide. All rights reserved.
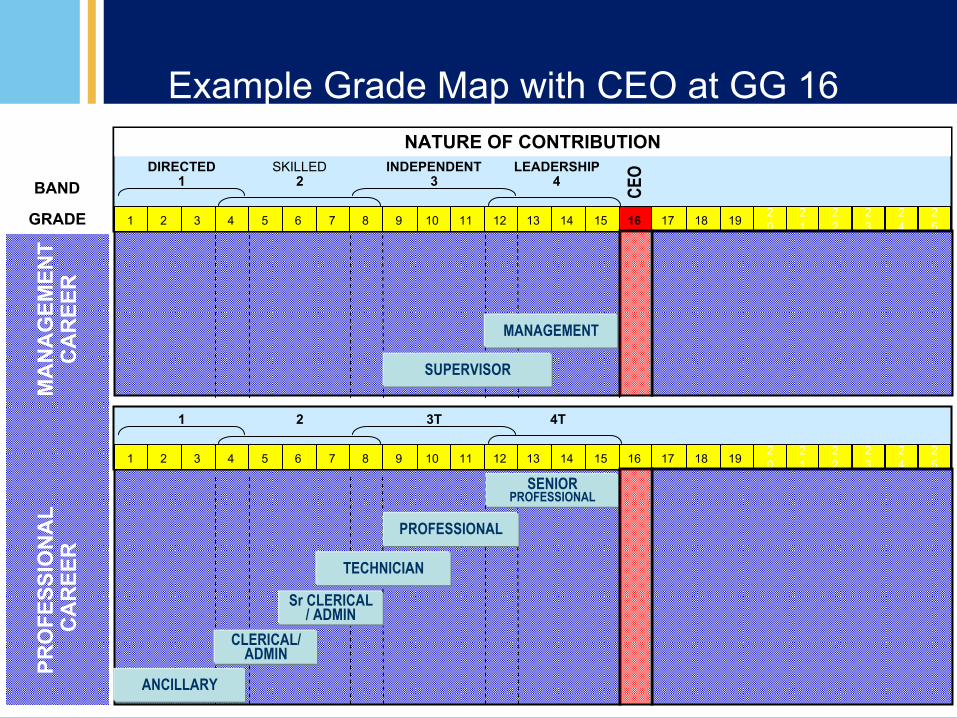
28
GRADE
BANDDIRECTED SKILLED LEADERSHIP
1 2 3 4 5 6 7 8 9 10 11 12 13 14 15 16 17 18 19 20
INDEPENDENT
MA
NA
GEM
ENT
CA
REE
RPR
OFE
SSIO
NA
L C
AR
EER
NATURE OF CONTRIBUTION
2 31 4
21
22
23
24
25
Example Grade Map with CEO at GG 19
CEO
MIDDLEMANAGEMENT
SUPERVISOR
SENIORPROFESSIONAL
PROFESSIONAL
TECHNICIAN
Sr CLERICAL/ ADMIN
CLERICAL/ ADMIN
ANCILLARY
1 2 3 4 5 6 7 8 9 10 11 12 13 14 15 16 17 18 1920
2 3T1 4T
21
22
23
24
25
STRATEGY5BS
TOPMANAGEMENT
Copyright © Watson Wyatt Worldwide. All rights reserved.
29
GRADE
BANDDIRECTED SKILLED LEADERSHIP
1 2 3 4 5 6 7 8 9 10 11 12 13 14 15 16 17 18 1920
INDEPENDENT
MA
NA
GEM
ENT
CA
REE
RPR
OFE
SSIO
NA
L C
AR
EER
NATURE OF CONTRIBUTION
2 31 4
21
22
23
24
25
CEO
MANAGEMENT
SUPERVISOR
SENIORPROFESSIONAL
PROFESSIONAL
TECHNICIAN
Sr CLERICAL/ ADMIN
CLERICAL/ ADMIN
ANCILLARY
1 2 3 4 5 6 7 8 9 10 11 12 13 14 15 16 17 18 1920
2 3T1 4T
21
22
23
24
25
Example Grade Map with CEO at GG 16

Copyright © Watson Wyatt Worldwide. All rights reserved.
30
CEO
HR HR MngrMngr..
C&B C&B MngrMngr..
20
19
18
17
16
15
Scope data setting the ceiling
Copyright © Watson Wyatt Worldwide. All rights reserved.
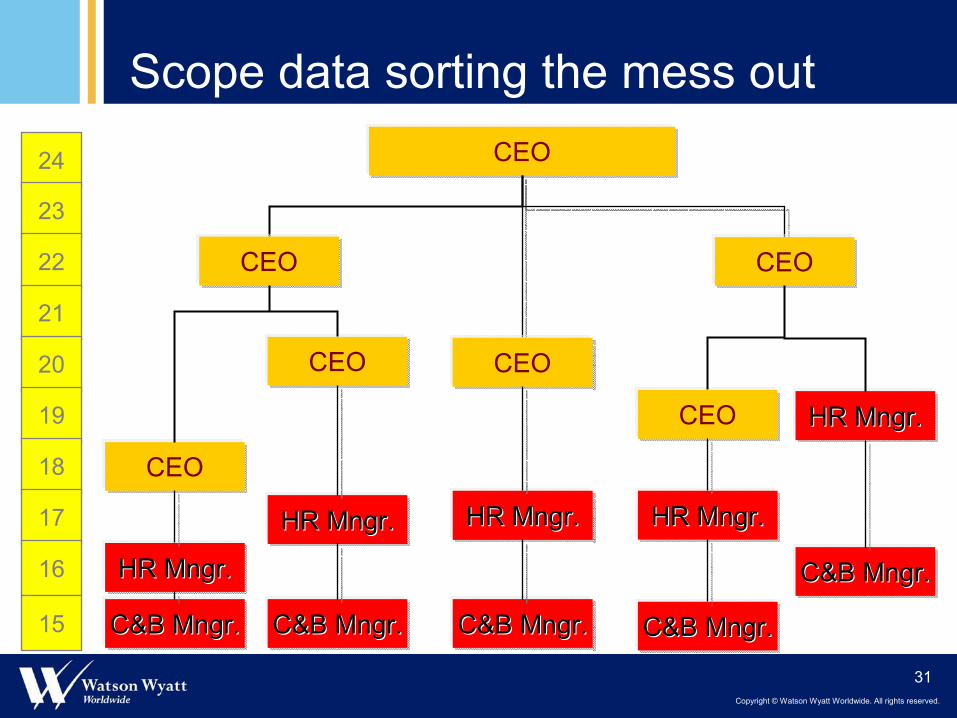
31
24 CEO
CEO
HR HR MngrMngr..
C&B C&B MngrMngr..
23
22
21
20
19
18
17
16
15
CEO
HR HR MngrMngr..
C&B C&B MngrMngr..
CEO
CEO
HR HR MngrMngr..
C&B C&B MngrMngr..
CEO
HR HR MngrMngr..
C&B C&B MngrMngr..
CEO
HR HR MngrMngr..
C&B C&B MngrMngr..
Scope data sorting the mess out
Copyright © Watson Wyatt Worldwide. All rights reserved.
32
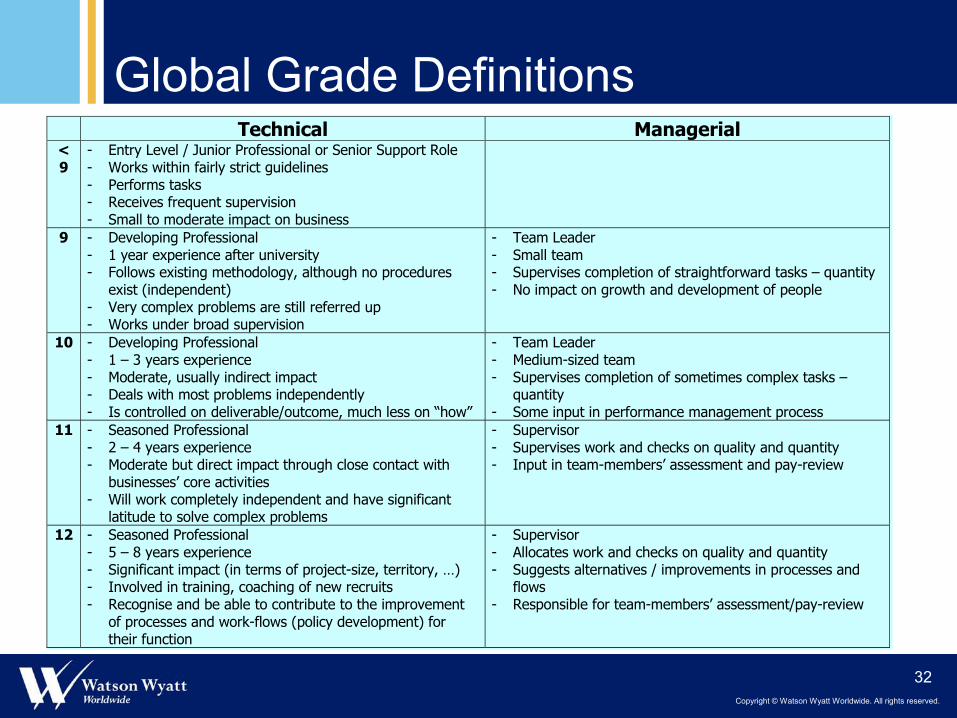
Technical Managerial<9
- Entry Level / Junior Professional or Senior Support Role- Works within fairly strict guidelines- Performs tasks- Receives frequent supervision- Small to moderate impact on business
9 - Developing Professional- 1 year experience after university- Follows existing methodology, although no procedures
exist (independent)- Very complex problems are still referred up- Works under broad supervision
- Team Leader- Small team- Supervises completion of straightforward tasks – quantity- No impact on growth and development of people
10 - Developing Professional- 1 – 3 years experience- Moderate, usually indirect impact- Deals with most problems independently- Is controlled on deliverable/outcome, much less on “how”
- Team Leader- Medium-sized team- Supervises completion of sometimes complex tasks –
quantity- Some input in performance management process
11 - Seasoned Professional- 2 – 4 years experience- Moderate but direct impact through close contact with
businesses’ core activities- Will work completely independent and have significant
latitude to solve complex problems
- Supervisor- Supervises work and checks on quality and quantity- Input in team-members’ assessment and pay-review
12 - Seasoned Professional- 5 – 8 years experience- Significant impact (in terms of project-size, territory, …)- Involved in training, coaching of new recruits- Recognise and be able to contribute to the improvement
of processes and work-flows (policy development) fortheir function
- Supervisor- Allocates work and checks on quality and quantity- Suggests alternatives / improvements in processes and
flows- Responsible for team-members’ assessment/pay-review
Global Grade Definitions

Copyright © Watson Wyatt Worldwide. All rights reserved.
33
Technical Managerial13 - Strategic Professional
- 8 – 10 years experience- Stays abreast of latest developments in own field and
contributes to strategy by applying in own job /organisation
- Significant impact through deliverables
- Operational Manager- Responsible for planning of short term action plans and
activities- Responsible for people’s growth and development- Involved in planning of resources for future (1-year)
14 - Strategic Professional- +10 years experience- Follows latest trends and developments in own field and
adapts these to apply in own job / organisation
- Operational Manager- Leads and directs team of professionals- Responsible for short- to medium-term planning of actions
and resources for own area-
15 - Strategic Professional- +15 years experience- Develops new techniques, methodologies, approaches …
in own field to directly impact the work of others and theresults of the organisation
- Thought leader
- Manager with Strategic Impact- Manages through managers, large group of senior
professionals- Responsible for medium-term (1-3 years) planning- Sizeable section of the business – big direct impact
16 - Future Nobel-price winner !- +20 years experience- Internally and externally recognised Guru that influences
the way things are done in the entire industry / world!(just to say you won’t find a lot of these and they willprobably not participate in surveys !)
- Strategy Setting Manager- Responsible for long-term (+3 years) planning- Integrating different disciplines / sections of the business- Covering diverse functions or one major function in a
large organisation
Global Grade Definitions

Copyright © Watson Wyatt Worldwide. All rights reserved.
34
Employee categories
● General Management (GM) GG 16 - 21● Top Management (Heads of) (TM) GG 16 - 21● Middle Management (MM) GG 14 - 16● Professionals (PRO) GG 9 -13● Other General Salaried Staff (OGSS) GG 4 - 9● Manual Workers (MW) GG 1 - 5
6 Typical Levels

Copyright © Watson Wyatt Worldwide. All rights reserved.
35
General Management (GM)
● The most senior executive position in the organisation directing the full range of functions in a territory or Business Unit
● Provides leadership and has overall direction and control of the company's operations/divisions
● Responsible for strategic long-range planning and establishment of basic policy
● Size of role determined by Scope Data Matrix. Global Grade will set cap for organisation and provide a reference for jobs reporting into it
Copyright © Watson Wyatt Worldwide. All rights reserved.
36
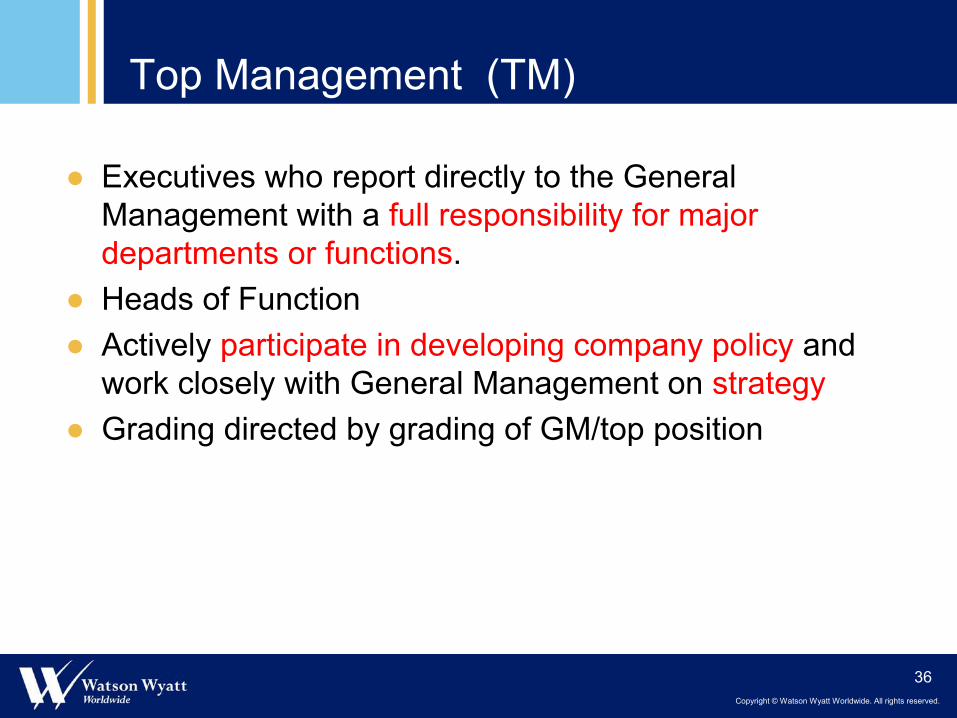
Top Management (TM)
● Executives who report directly to the General Management with a full responsibility for major departments or functions.
● Heads of Function● Actively participate in developing company policy and
work closely with General Management on strategy● Grading directed by grading of GM/top position
Copyright © Watson Wyatt Worldwide. All rights reserved.
37
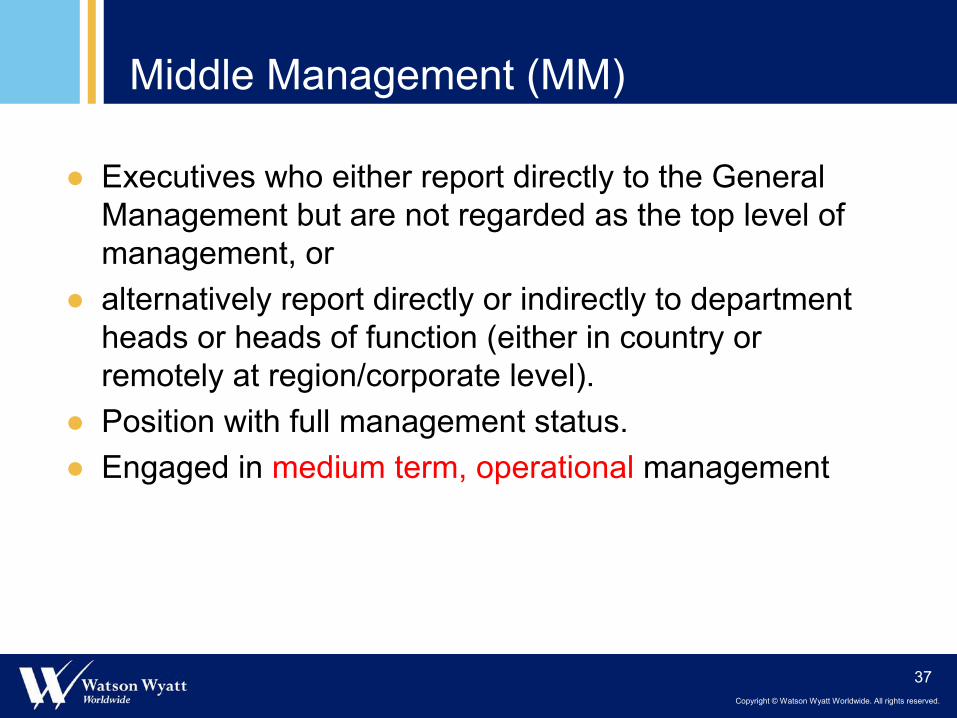
Middle Management (MM)
● Executives who either report directly to the General Management but are not regarded as the top level of management, or
● alternatively report directly or indirectly to department heads or heads of function (either in country or remotely at region/corporate level).
● Position with full management status. ● Engaged in medium term, operational management
Copyright © Watson Wyatt Worldwide. All rights reserved.
38
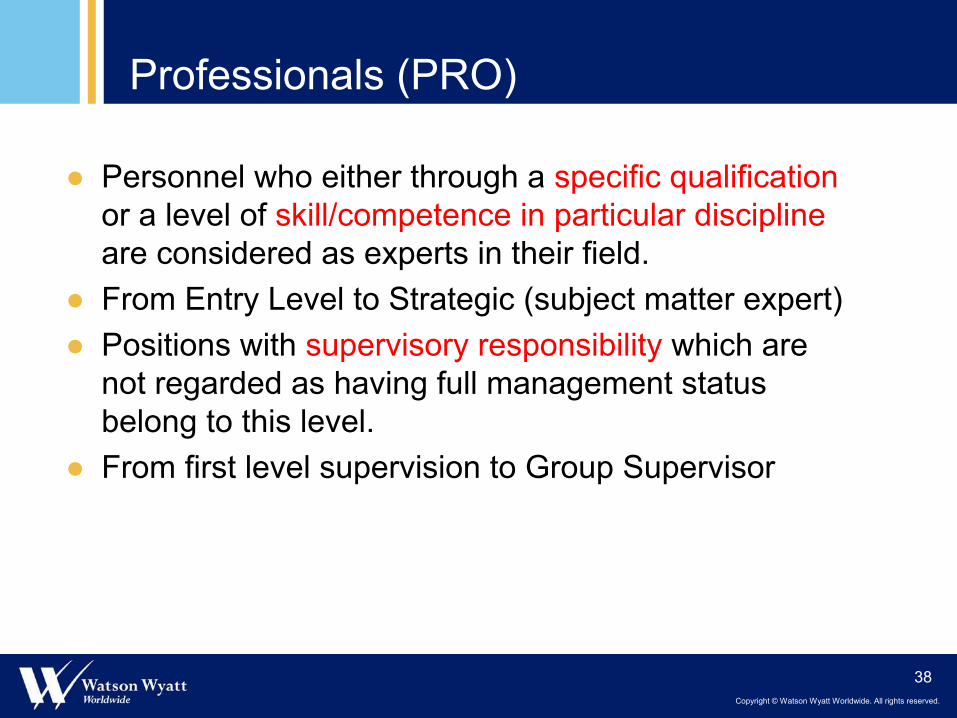
Professionals (PRO)
● Personnel who either through a specific qualificationor a level of skill/competence in particular disciplineare considered as experts in their field.
● From Entry Level to Strategic (subject matter expert)● Positions with supervisory responsibility which are
not regarded as having full management status belong to this level.
● From first level supervision to Group Supervisor

Copyright © Watson Wyatt Worldwide. All rights reserved.
39
Other General Salaried Staff (OGSS)
● White collar personnel employed directly by an organisation, either in the office environment or in the field.
● Involved in Administration/Technical activities● Typically eligible for overtime

Copyright © Watson Wyatt Worldwide. All rights reserved.
40
Manual Workers (MW)
● Blue collar personnel employed in a plant/factory environment. Levels can vary from unskilled to highly skilled.
● Typically eligible for overtime

Copyright © Watson Wyatt Worldwide. All rights reserved.
41
Desirable Benchmarking Trends
● Centralised approach to benchmarking● Job Mapping Tables of company’s versus
consultant’s benchmark jobs across regions● Creation of link between company’s and
consultant’s grading systems● Development of Career Maps
Copyright © Watson Wyatt Worldwide. All rights reserved.
42
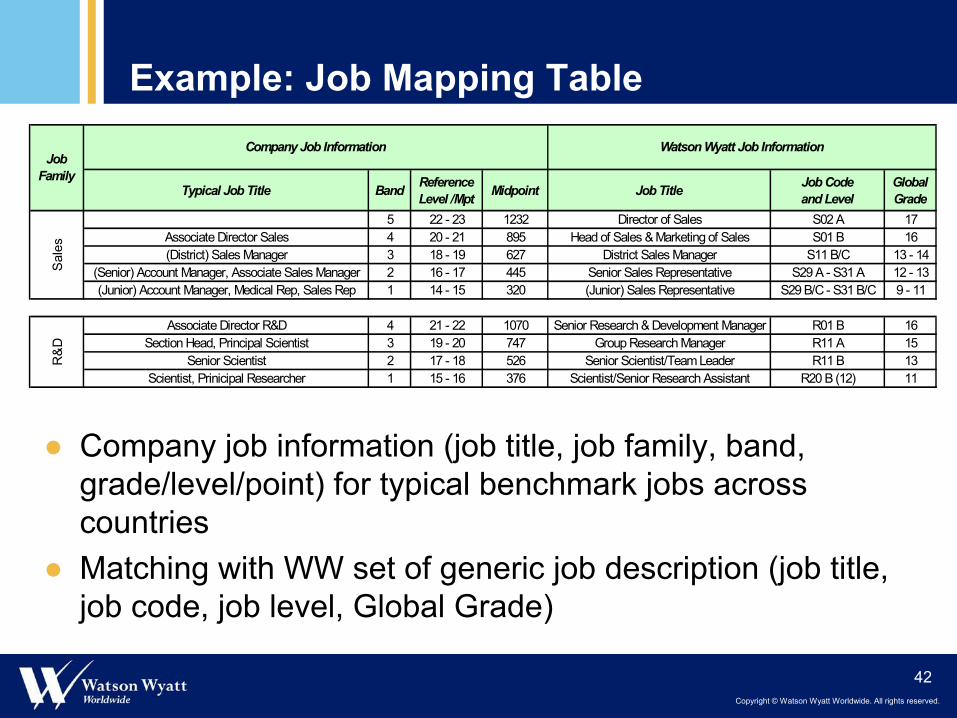
Example: Job Mapping Table
Typical Job Title Band Reference Level /Mpt Midpoint Job Title Job Code
and LevelGlobal Grade
5 22 - 23 1232 Director of Sales S02 A 17Associate Director Sales 4 20 - 21 895 Head of Sales & Marketing of Sales S01 B 16(District) Sales Manager 3 18 - 19 627 District Sales Manager S11 B/C 13 - 14
(Senior) Account Manager, Associate Sales Manager 2 16 - 17 445 Senior Sales Representative S29 A - S31 A 12 - 13(Junior) Account Manager, Medical Rep, Sales Rep 1 14 - 15 320 (Junior) Sales Representative S29 B/C - S31 B/C 9 - 11
Associate Director R&D 4 21 - 22 1070 Senior Research & Development Manager R01 B 16Section Head, Principal Scientist 3 19 - 20 747 Group Research Manager R11 A 15
Senior Scientist 2 17 - 18 526 Senior Scientist/Team Leader R11 B 13Scientist, Prinicipal Researcher 1 15 - 16 376 Scientist/Senior Research Assistant R20 B (12) 11
Watson Wyatt Job Information
R&
DS
ales
Company Job InformationJob
Family
● Company job information (job title, job family, band, grade/level/point) for typical benchmark jobs across countries
● Matching with WW set of generic job description (job title, job code, job level, Global Grade)