Watershed discretization based on multiple factors and … as Ansai, ... Spatial discretization most...
10
Hydrol. Earth Syst. Sci., 16, 59–68, 2012 www.hydrol-earth-syst-sci.net/16/59/2012/ doi:10.5194/hess-16-59-2012 © Author(s) 2012. CC Attribution 3.0 License. Hydrology and Earth System Sciences Watershed discretization based on multiple factors and its application in the Chinese Loess Plateau Y. D. Xu 1 , B. J. Fu 1 , C. S. He 2 , and G. Y. Gao 1 1 State Key Laboratory of Urban and Regional Ecology, Research Center for Eco-Environmental Sciences, Chinese Academy of Sciences, P.O. Box 2871, Beijing 100085, China 2 Department of Geography, Western Michigan University, Kalamazoo, MI 49008-5054, USA Correspondence to: B. J. Fu ([email protected]) Received: 29 September 2011 – Published in Hydrol. Earth Syst. Sci. Discuss.: 10 October 2011 Revised: 22 December 2011 – Accepted: 27 December 2011 – Published: 9 January 2012 Abstract. The spatial discretization of watersheds is an in- dispensable procedure for representing landscape variations in eco-hydrological research, representing the contrast be- tween reality and data-supported models. When discretiz- ing a watershed, it is important to construct a scheme of a moderate number of discretized factors while adequately considering the actual eco-hydrological processes, especially in regions with unique eco-hydrological features and intense human activities. Because of their special lithological and pedologic characteristics and widespread man-made vege- tation, discretization of watersheds in the Loess Plateau in Northern China is a challenge. In order to simulate the rainfall-runoff process, a watershed in the Loess Plateau, referred as Ansai, was spatially discretized into new units called land type units. These land type units were delin- eated under a scheme of factors including land use, vege- tation condition, soil type and slope. Instead of using units delineated by overlaying land use and soil maps, the land type units were used in the Soil and Water Assessment Tool (SWAT). Curve numbers were assigned and adjusted to sim- ulate runoff, using the US Natural Resources Conservation Service (NRCS) curve number method. The results of the runoff simulation better matched actual observations. Com- pared to the results that used the original units, the coef- ficient of determination (R 2 ) and the Nash-Sutcliffe coef- ficient (E NS ) for monthly flow simulation increased from 0.655–0.713 and 0.271–0.550 to 0.733–0.745 and 0.649– 0.703, respectively. This method of delineating into land type units is an easy operation and suitable approach for eco- hydrological studies in the Chinese Loess Plateau and other similar regions. It can be further applied in soil erosion simu- lation and the eco-hydrological assessment of re-vegetation. 1 Introduction Watersheds are commonly spatially discretized in ecologic and hydrological studies. The purpose of spatial discretiza- tion is to objectively represent the differences in ecological or hydrological characteristics that exist within the watershed (Kumar et al., 2010; Hellebrand and van den Bos, 2008). By using spatial discretization, a watershed is divided into units, which are treated as statistical objects or calculated units for statistical analysis or simulation. Spatial discretization can be regarded as a tradeoff between reality and a model repre- sented by supported data. The more discretized factors and more detailed discretization, the more reliably the discretiza- tion represents the true watershed (Das et al., 2008); how- ever, at the same time, more physical mechanisms and data are needed. Over-parameterization and scaling problems also take effect (Doherty, 2003), so it is crucial to select a mod- erate number of discretized factors with major influences on the eco-hydrological processes, and have plenty of data and theory to support the discretization. Spatial discretization most commonly divides a watershed into hydrological response units (HRUs). The crucial as- sumption for HRU discretization is that the hydrological characteristic variation within a HRU must be little compared to the dynamics in different HRUs (Fl¨ ugel, 1995). The pa- rameters within each HRU should be uniform. HRUs are generated by overlaying maps of selected factors. Based on existing theories and experimental data, re- searchers can construct a scheme of delineated factors and calculate or simulate the eco-hydrological processes within each HRU. A typical approach for HRU delineation is the combination of land use and soil types (Beldring et al., 2003; Das et al., 2008), which can be seen in a multitude Published by Copernicus Publications on behalf of the European Geosciences Union.
Transcript of Watershed discretization based on multiple factors and … as Ansai, ... Spatial discretization most...

Hydrol. Earth Syst. Sci., 16, 59–68, 2012www.hydrol-earth-syst-sci.net/16/59/2012/doi:10.5194/hess-16-59-2012© Author(s) 2012. CC Attribution 3.0 License.
Hydrology andEarth System
Sciences
Watershed discretization based on multiple factors and itsapplication in the Chinese Loess Plateau
Y. D. Xu1, B. J. Fu1, C. S. He2, and G. Y. Gao1
1State Key Laboratory of Urban and Regional Ecology, Research Center for Eco-Environmental Sciences,Chinese Academy of Sciences, P.O. Box 2871, Beijing 100085, China2Department of Geography, Western Michigan University, Kalamazoo, MI 49008-5054, USA
Correspondence to:B. J. Fu ([email protected])
Received: 29 September 2011 – Published in Hydrol. Earth Syst. Sci. Discuss.: 10 October 2011Revised: 22 December 2011 – Accepted: 27 December 2011 – Published: 9 January 2012
Abstract. The spatial discretization of watersheds is an in-dispensable procedure for representing landscape variationsin eco-hydrological research, representing the contrast be-tween reality and data-supported models. When discretiz-ing a watershed, it is important to construct a scheme ofa moderate number of discretized factors while adequatelyconsidering the actual eco-hydrological processes, especiallyin regions with unique eco-hydrological features and intensehuman activities. Because of their special lithological andpedologic characteristics and widespread man-made vege-tation, discretization of watersheds in the Loess Plateau inNorthern China is a challenge. In order to simulate therainfall-runoff process, a watershed in the Loess Plateau,referred as Ansai, was spatially discretized into new unitscalled land type units. These land type units were delin-eated under a scheme of factors including land use, vege-tation condition, soil type and slope. Instead of using unitsdelineated by overlaying land use and soil maps, the landtype units were used in the Soil and Water Assessment Tool(SWAT). Curve numbers were assigned and adjusted to sim-ulate runoff, using the US Natural Resources ConservationService (NRCS) curve number method. The results of therunoff simulation better matched actual observations. Com-pared to the results that used the original units, the coef-ficient of determination (R2) and the Nash-Sutcliffe coef-ficient (ENS) for monthly flow simulation increased from0.655–0.713 and 0.271–0.550 to 0.733–0.745 and 0.649–0.703, respectively. This method of delineating into landtype units is an easy operation and suitable approach for eco-hydrological studies in the Chinese Loess Plateau and othersimilar regions. It can be further applied in soil erosion simu-lation and the eco-hydrological assessment of re-vegetation.
1 Introduction
Watersheds are commonly spatially discretized in ecologicand hydrological studies. The purpose of spatial discretiza-tion is to objectively represent the differences in ecologicalor hydrological characteristics that exist within the watershed(Kumar et al., 2010; Hellebrand and van den Bos, 2008). Byusing spatial discretization, a watershed is divided into units,which are treated as statistical objects or calculated units forstatistical analysis or simulation. Spatial discretization canbe regarded as a tradeoff between reality and a model repre-sented by supported data. The more discretized factors andmore detailed discretization, the more reliably the discretiza-tion represents the true watershed (Das et al., 2008); how-ever, at the same time, more physical mechanisms and dataare needed. Over-parameterization and scaling problems alsotake effect (Doherty, 2003), so it is crucial to select a mod-erate number of discretized factors with major influences onthe eco-hydrological processes, and have plenty of data andtheory to support the discretization.
Spatial discretization most commonly divides a watershedinto hydrological response units (HRUs). The crucial as-sumption for HRU discretization is that the hydrologicalcharacteristic variation within a HRU must be little comparedto the dynamics in different HRUs (Flugel, 1995). The pa-rameters within each HRU should be uniform. HRUs aregenerated by overlaying maps of selected factors.
Based on existing theories and experimental data, re-searchers can construct a scheme of delineated factors andcalculate or simulate the eco-hydrological processes withineach HRU. A typical approach for HRU delineation is thecombination of land use and soil types (Beldring et al.,2003; Das et al., 2008), which can be seen in a multitude
Published by Copernicus Publications on behalf of the European Geosciences Union.
60 Y. D. Xu et al.: Watershed discretization in the Chinese Loess Plateau
of research and some hydrological models, including theErosion Productivity Impact Calculator or EPIC (Williams,1995), SWRRB (Williams et al., 1985; Arnold et al., 1990),Soil and Water Assessment Tools or SWAT (Arnold et al.,1998), etc. Other factor combinations that have been used todetermine HRUs are the combinations of land use, topogra-phy and aquifers (Bloschl et al., 2008), the combinations ofslope, aspect, elevation, soil particle size, soil water holdingcapacity and vegetation (Legesse et al., 2003), etc.
As far as runoff is concerned, to account for the lack ofsub-daily meteorological data, physical soil properties andthe physiological attributes of plants, the Soil Conserva-tion Service (now the Natural Resources Conservation Ser-vice, NRCS) curve number method (NRCS, 1972) is themost common method for predicting runoff volume (Arnoldet al., 1998; Mishra and Singh, 2004; Garen and Moore,2005). It is an empirical method developed by the US De-partment of Agriculture based on measured precipitation andrunoff. Accompany with this method, HRUs were delin-eated by the combination of land use and soil types, thenthe curve number of each HRU is determined according toland use, its hydrological condition (mostly represented byground coverage), as well as the soil’s hydrological group.
The hydrological condition of the vegetation is an im-portant factor in determining the curve number for an HRU(NRCS, 1986). In existing studies, the HRU curve numberswith the same vegetation type and the same soil hydrologicalgroup are uniform, creating an assumption that the hydrolog-ical conditions for certain vegetation within the study areaare the same. This assumption does not hold true in somestudies, especially in some regions intensely influenced byhuman activities, exhibiting fractured vegetation patterns.
Hydrological processes are also dramatically affected byslope. The curve numbers obtained from the NRCS hand-book (NRCS, 1986) are usually assumed to correspond to aslope of 5 %. Most studies do not account for the slope whendetermining the CN. Some hydrological models (e.g. SWAT)allow users to adjust CNs by slope. The adjustment, how-ever, must be done prior to inputting the curve numbers,and according to the average slope in the study area. If theslope factor is excluded, there are many disadvantages us-ing the CN method, especially in some regions with vari-ous landforms and steep slopes. Some attempts have modi-fied curve numbers by slope (Williams, 1995; Huang et al.,2006). Using slope as a factor for HRU delineation and ad-justing the curve numbers accordingly would be helpful forrunoff simulation.
The Chinese Loess Plateau is a region with fractured vege-tation pattern and steep slopes (Huang et al., 2006; Fu, 1989).In the plateau’s Yanhe watershed, for example, the averageslope is 23.4◦. Vegetation in the Chinese Loess Plateau isintensely influenced by human activities including reclama-tion, abandonment, afforestation, etc. (Fu et al., 2006, 2009;Li et al., 2009). Before the 1970s, sloping cropland and natu-ral grassland were the two dominant land use types. After the
1970s, several conservation projects were enforced in orderto control soil erosion. Consequently, the landscape has beenintensely adjusted by the redesigned land use patterns. Vari-ous vegetation types, including natural forest, planted forest,natural shrubland, planted shrubland, natural grassland, arti-ficial grassland and cropland constitute a mosaic landscapepattern. The hydrological condition of the vegetation, usingcoverage as an indicator, is influenced by several environ-mental factors, such as climate, topography (slope, aspect,etc.), soil (soil organic matter, soil moisture, etc.) and soon. Nonnative vegetation coverage is also affected by ageand some human factors, such as plant density and mainte-nance measures. Even within a watershed, the hydrologicalcondition of the vegetation varies immensely.
Because of the lack of data of the aforementioned fac-tors, especially plant age and human factors, quantificationor simulation of the coverage of the vegetation in the ChineseLoess Plateau is difficult. Remote sensing data is relativelyeasy to access and time-efficient. The vegetation indices de-rived from remote sensing images, such as the normalizeddifference vegetation index (NDVI), are commonly used toretrieve vegetation coverage (Zribi et al., 2003; Leprieur etal., 1994). This is more reliable than simulation methods todetermine the hydrological condition of the vegetation in theLoess Plateau.
A subwatershed in the upstream section of the Yanhe wa-tershed in the Loess Plateau is the study area for this research.The area was spatially discretized into new units called “landtype units” (units with relatively homogenous land use andenvironmental factors), a flexible concept employed by sev-eral researchers (Gustafson et al., 2004; Kupfer and Franklin,2000; Rykken et al., 1997). The land use type, soil type,hydrological condition of vegetation and slope were all in-cluded as discretizing factors for delineating the land typeunits. The hydrological condition of the vegetation was de-termined by coverage retrieved from NDVI. The curve num-bers of the land type units were determined by land use type,hydrological condition of vegetation and the soil’s hydrolog-ical group, then further modified by slope. The monthlyrunoff processes were simulated by SWAT in periods nearremote sensing image acquisition date. The results werecompared with initial unit results. Also discussed is theadvantages and further application of land type units.
2 Materials and methods
2.1 Study area
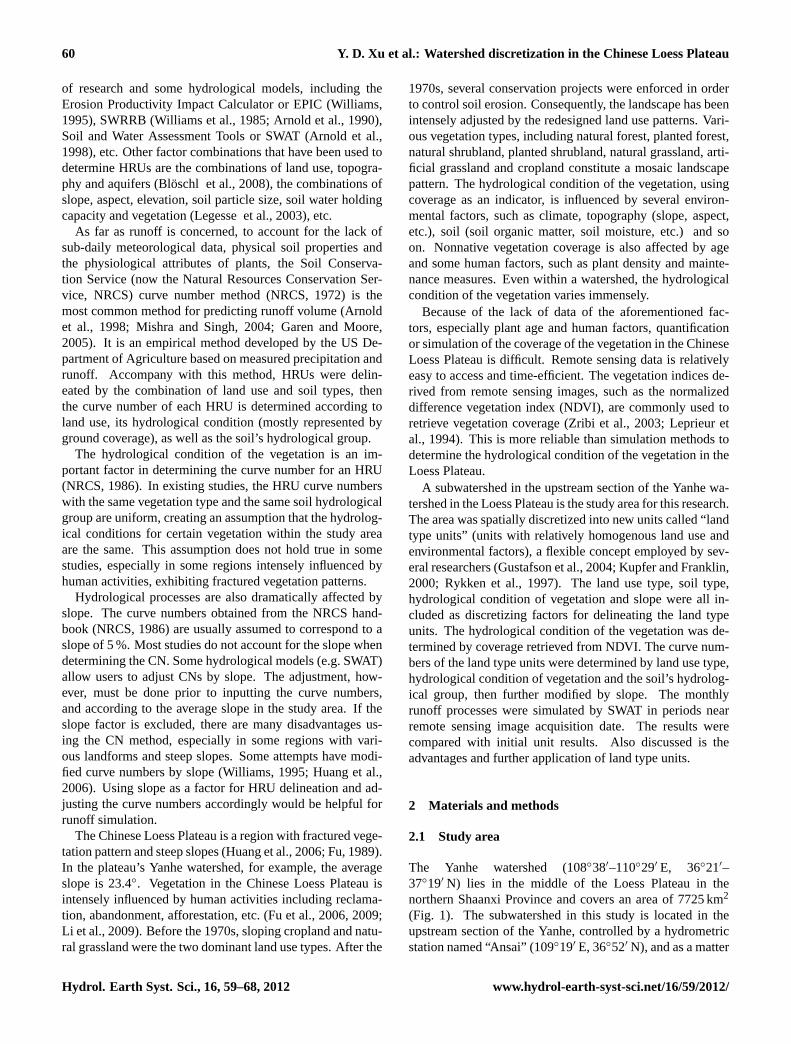
The Yanhe watershed (108◦38′–110◦29′ E, 36◦21′–37◦19′ N) lies in the middle of the Loess Plateau in thenorthern Shaanxi Province and covers an area of 7725 km2
(Fig. 1). The subwatershed in this study is located in theupstream section of the Yanhe, controlled by a hydrometricstation named “Ansai” (109◦19′ E, 36◦52′ N), and as a matter
Hydrol. Earth Syst. Sci., 16, 59–68, 2012 www.hydrol-earth-syst-sci.net/16/59/2012/
Y. D. Xu et al.: Watershed discretization in the Chinese Loess Plateau 61
Fig. 1. Study area and the distribution of hydrometric station and precipitation stations.
of convenience, it is referred to as the Ansai watershed. Thearea is 1334 km2 with an average slope 23.9◦. It has a typicalsemiarid continental climate with an average temperature of8.8◦ and an average annual precipitation of 505 mm. Rainfallshows high seasonal variability, with more than 60 % of theannual precipitation occurring between July and September.The landform is a typical loess hilly-gullied landscapewith elevations ranging from 1057 m to 1743 m above sealevel, with an average of 1362 m. Covering 86.4 % of thewatershed, loess soil, derived from loess parent material, isdominant.
Prior to conservation projects, sloping cropland and nat-ural grassland were the two dominant land use types in theYanhe watershed. After the 1970s, cropland abandonmentand re-vegetation was implemented, dramatically chang-ing the land use pattern. Croplands declined while for-est shrubland and grassland expanded. Various land usetypes constitute a mosaic landscape pattern. Even alonga slope surface, the landscape structure is often fragmen-tized. The major crop species are maize (Zea maysL.),potatoes (Solanum tuberosumL.), beans (Phaseolus vul-garis L.) and millet (Panicum miliaceumL.). The grass-land is dominated by Gmelin Sagebrush (Artemisia gmeliniiWeb. ex Stechm.), Argy Sagebrush (Artemisia. argyiLevl. etVant.) and Bunge Needlegrass (Stipa bungeanaTrin.). Theforests are mainly manmade and comprise of Black Locust(Robinia pseudoacaciaL.). The shrubland is dominatedby Intermediate Peashrub (Caragana IntermediaKuang
et H. C. Fu), Sandthorn (Hippophae rhamnoidesL.) andVetchleaf Pagodatree (Sophora viciifoliaLindl.).
2.2 Data sets
Land use type, soil type, topographical, meteorological, andhydrological data of the Ansai watershed, as well as satelliteimagery, were collected for this research.
A year 2000 land use map (1:50 000 scale) was interpretedby the Institute Of Remote Sensing Applications, ChineseAcademy of Sciences from remotely sensed Landsat TM im-ages. Six land use types were identified: forest, shrubland,grassland, cropland, water bodies and residential areas.
A soil survey map (1:10 000 scale) was provided by theInstitute of Soil and Water Conservation, Chinese Academyof Sciences. The soil types were divided into four cate-gories: dark-purple loess soil, loess soil, red clay soil andalluvial soil.
A 25 m-resolution digital elevation model (DEM) for thewatershed, derived from a 1:50 000 scale contour map, wassupplied by the National Geomatics Center of China. Theslope was calculated using the DEM.
Meteorological and hydrological data of 1995 to 2002were collected. Daily data from five precipitation stationsin or near the Ansai watershed and the daily flow data ofAnsai hydrometric station were collected from the Hydrol-ogy and Water Resources Investigation Bureau in YananCity. The daily precipitation data, maximum and minimum
www.hydrol-earth-syst-sci.net/16/59/2012/ Hydrol. Earth Syst. Sci., 16, 59–68, 2012
62 Y. D. Xu et al.: Watershed discretization in the Chinese Loess Plateau
temperatures, average wind speeds and relative humidityof the Yanan (109◦30′ E, 36◦36′ N) and Wuqi (108◦10′ E,36◦55′ N) meteorological stations was downloaded fromChina Meteorological Data Sharing Service System (http://new-cdc.cma.gov.cn).
Landsat TM imagery of 17 October 1999 was downloadedfrom the International Scientific Data Service Platform ofChinese Academy of Sciences (http://datamirror.csdb.cn).
2.3 Methods
2.3.1 Land type units delineation
Land type units for the Ansai watershed were delineated bya factor scheme including land use and soil type, the hydro-logical condition of vegetation and slope. These four factorswere determined as follows:
According to the US National Engineering Handbook(NRCS, 1986), land use was reclassified into the followingcategories: woods, brush, grassland, straight row crops, wa-ter and residential districts.
The hydrological groups of the four kinds of soil were de-termined according to the infiltration rate, texture and claylayer of the soil. Other properties of each soil were ob-tained from field sampling investments and supplemented bysoil survey data, data from prior research and estimations ofthe empirical model Soil-Plant-Air-Water (SPAW) Soil Wa-ter Characteristics (Saxton, 2002).
The determination of the hydrological condition of vege-tation included the following three steps:
(1) calculation of the normalized difference vegetation in-dex (NDVI). NDVI is defined as the normalized ratio of thenear infrared reflectance response to the red response of asurface. It was calculated as:
NDVI =Rnir −Rred
Rnir +Rred(1)
whereRnir is the reflectance at the near infrared band, andRred is the reflectance at the red band. In this study, band 4(infrared) and band 3 (red) of the Landsat-TM imagery wereused for the NDVI derivation.
(2) Vegetative coverage inversion using NDVI. Vegetationcoverage of the watershed was inversed by NDVI using adimidiated pixel model (Leprieur et al., 1994; Zribi et al.,2003). The main formula of this model is:
fc =NDVI −NDVIsoil
NDVIveg−NDVIsoil(2)
wherefc is vegetation coverage expressed as fraction; NDVIis the value of NDVI for the image cell; NDVIsoil is the valueof NDVI for bare soil; NDVIveg is the value of NDVI forfull-covered vegetation. NDVIsoil and NDVIveg was set tothe value of NDVI at which the cumulative frequency was5% and 95%, respectively.
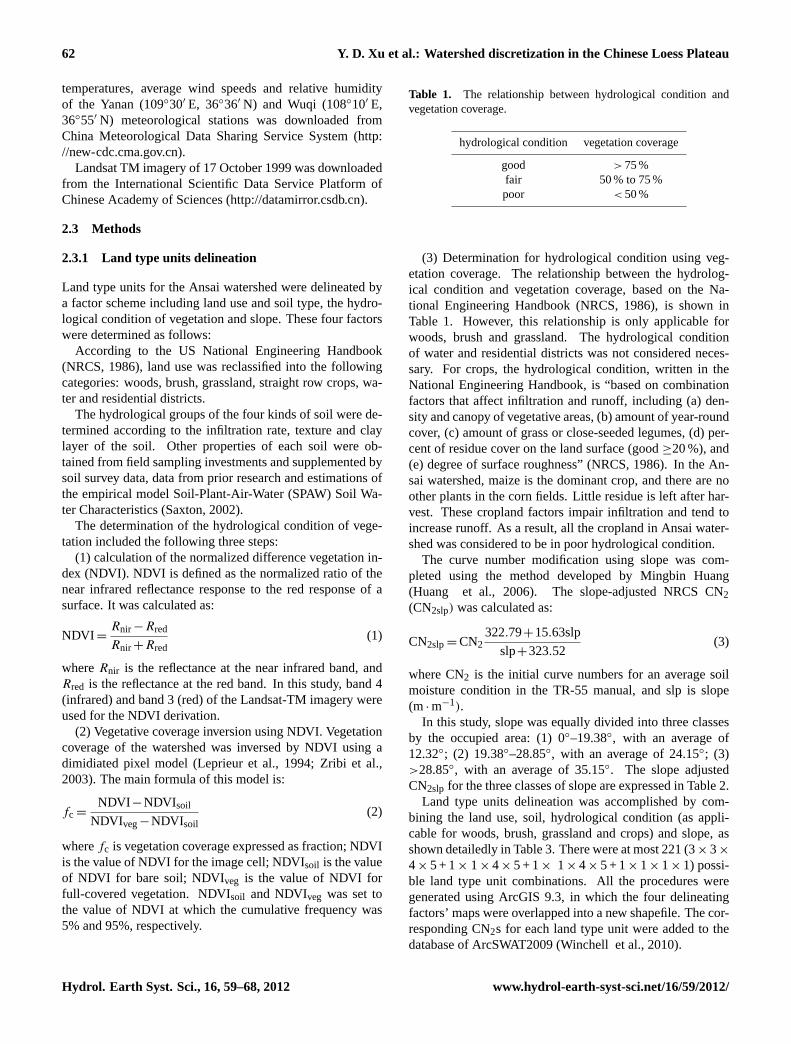
Table 1. The relationship between hydrological condition andvegetation coverage.
hydrological condition vegetation coverage
good > 75 %fair 50 % to 75 %poor < 50 %
(3) Determination for hydrological condition using veg-etation coverage. The relationship between the hydrolog-ical condition and vegetation coverage, based on the Na-tional Engineering Handbook (NRCS, 1986), is shown inTable 1. However, this relationship is only applicable forwoods, brush and grassland. The hydrological conditionof water and residential districts was not considered neces-sary. For crops, the hydrological condition, written in theNational Engineering Handbook, is “based on combinationfactors that affect infiltration and runoff, including (a) den-sity and canopy of vegetative areas, (b) amount of year-roundcover, (c) amount of grass or close-seeded legumes, (d) per-cent of residue cover on the land surface (good≥20 %), and(e) degree of surface roughness” (NRCS, 1986). In the An-sai watershed, maize is the dominant crop, and there are noother plants in the corn fields. Little residue is left after har-vest. These cropland factors impair infiltration and tend toincrease runoff. As a result, all the cropland in Ansai water-shed was considered to be in poor hydrological condition.
The curve number modification using slope was com-pleted using the method developed by Mingbin Huang(Huang et al., 2006). The slope-adjusted NRCS CN2(CN2slp) was calculated as:
CN2slp= CN2322.79+15.63slp
slp+323.52(3)
where CN2 is the initial curve numbers for an average soilmoisture condition in the TR-55 manual, and slp is slope(m · m−1).
In this study, slope was equally divided into three classesby the occupied area: (1) 0◦–19.38◦, with an average of12.32◦; (2) 19.38◦–28.85◦, with an average of 24.15◦; (3)>28.85◦, with an average of 35.15◦. The slope adjustedCN2slp for the three classes of slope are expressed in Table 2.
Land type units delineation was accomplished by com-bining the land use, soil, hydrological condition (as appli-cable for woods, brush, grassland and crops) and slope, asshown detailedly in Table 3. There were at most 221 (3× 3×
4× 5 + 1× 1× 4× 5 + 1× 1× 4× 5 + 1× 1× 1× 1) possi-ble land type unit combinations. All the procedures weregenerated using ArcGIS 9.3, in which the four delineatingfactors’ maps were overlapped into a new shapefile. The cor-responding CN2s for each land type unit were added to thedatabase of ArcSWAT2009 (Winchell et al., 2010).
Hydrol. Earth Syst. Sci., 16, 59–68, 2012 www.hydrol-earth-syst-sci.net/16/59/2012/
Y. D. Xu et al.: Watershed discretization in the Chinese Loess Plateau 63
Table 2. The three classes of slope and the expressions of the slope-adjusted CN2.
Slope Average Area percentage expression of theclasses slope in watershed slope-adjusted CN2
0◦–19.38◦ 12.32◦ 33.33 % CN2slp= 1.008 CN219.38◦–28.85◦ 24.15◦ 33.33 % CN2slp= 1.018·CN2
> 28.85◦ 35.15◦ 33.33 % CN2slp= 1.030·CN2
Table 3. Detail factors for land type unit delineation.
Land use Hydrological condition Soil slope
WoodsBrush Good, fair, poor dark-purple loess soil
0◦–19.38◦Grassland loess soil19.38◦–28.85◦
Crops Poorred clay soil
> 28.85◦
residential districtsNot applicable
alluvial soil
water Not applicable Not applicable
2.3.2 Rainfall-runoff process simulation
The Soil and Water Assessment Tool (SWAT) (Arnold et al.,1998) was applied for rainfall-runoff process simulation inthis study. It is a watershed scale model for simulating long-term runoff and nutrient losses from rural watersheds. In thehydrology module of SWAT, there are two methods for runoffsimulation: the NCRS CN and the Green & Ampt infiltra-tion method. The former was applied in this research. Themethod used rainfallP and a retention parameterS to predictrunoff Q, all expressed in mm:
Q =(P −0.2S)2
P +0.8Sfor P > 0.2S
Q = 0 for P ≤ 0.2S (4)
The retention parameterS was calculated by:
S =25400
CN−254 (5)
where CN is the curve number.NRCS defines three antecedent moisture conditions: I-dry
(wilting point), II-average moisture, and III-wet (field capac-ity). The corresponding curve numbers are CN1, CN2 andCN3. The values of CN2 are listed in the National Engineer-ing Handbook (NRCS, 1986) for various land uses, manage-ments, hydrological conditions and soil hydrological groups.CN1 and CN3 are calculated by CN2 .
SWAT adjusts the daily curve numbers with soil pro-file water content or accumulated plant evapotranspiration.
When the former adjustment is applied, the followingequation is used:
S = Smax·
[1−
SW
SW+exp(w1−w2 ·SW)
](6)
whereS is the daily retention parameter (mm),Smax is themaximum value of the retention parameters (mm), SW is thesoil profile water content excluding the amount of water heldin the profile at wilting point (mm),w1 and w2 are shapecoefficients.Smax is calculated by CN1 :
Smax=25400
CN1−254 (7)
w2 is a function ofSmax, CN3, soil profile water content atfield capacity (mm) and soil profile water content when com-pletely saturated;w1 is a function ofSmax, CN3, soil profilewater content at field capacity(mm) andw2.
When the daily retention parameter (S) is adjusted with ac-cumulated plant evapotranspiration, the following equation isused:
S = Sprev+E0 ·exp
(−cncoef−Sprev
Smax
)−R−Q (8)
whereSprev is the retention parameter for the previous day(mm), E0 is the potential evapotranspiration for the day(mm), cncoef is the weighting coefficient for calculatingthe daily retention coefficient based on plant evapotranspi-ration, R is the daily rainfall (mm), andQ is the surfacerunoff (mm).
www.hydrol-earth-syst-sci.net/16/59/2012/ Hydrol. Earth Syst. Sci., 16, 59–68, 2012

64 Y. D. Xu et al.: Watershed discretization in the Chinese Loess Plateau
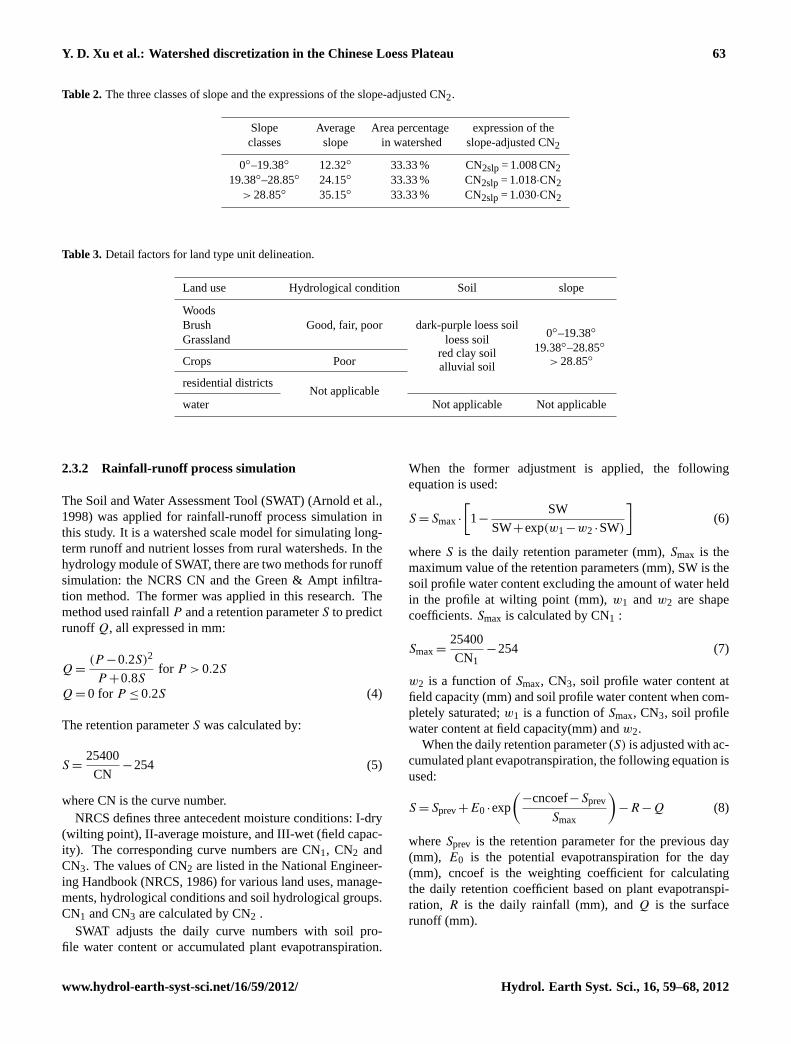
Fig. 2. Main land type units distribution within the Ansai watershed.
The daily curve number value is adjusted by the retentionparameter calculated for that soil moisture content or accu-mulated plant evapotranspiration:
CN=25400
S +254(9)
All above is presented in the theoretical documentation ofSWAT (Neitsch et al., 2005) in detail. Actually, for the deter-mined relationship between the retention parameter (S) andthe curve number (CN), the NCRS CN method is a one pa-
rameter model. The typical curve number (CN2) is the mostimportant parameter for runoff simulation.
Before units delineation, watershed should be divided intosubbasins in ArcSWAT. Because prior research has shownthat the number of subbasins have little influence on runoffsimulations (Jha et al., 2004; Tripathi et al., 2006), the An-sai watershed was divided into 21 subbasins, for when thenumber of subbasins was equal or greater than 21, the rain-fall data of all the five precipitation stations would be readby the model, otherwise some precipitation stations wouldbe excluded.
Hydrol. Earth Syst. Sci., 16, 59–68, 2012 www.hydrol-earth-syst-sci.net/16/59/2012/
Y. D. Xu et al.: Watershed discretization in the Chinese Loess Plateau 65
Table 4. Unit amounts and simulation results based on HRUs and land type units.
ThresholdDiscretized for units Unit Ens for R2 forunits delineation amounts monthly runoff monthly runoff
HRUs0 256 0.550 0.7135 83 0.440 0.704
12 60 0.271 0.655
Land type units0 1547 0.703 0.7445 285 0.692 0.745
12 85 0.649 0.733
In each subbasin, discretized units were delineated. Whenthe initial method was applied, the subbasins were dis-cretized into HRUs defined by land use and soil. When thenew discretization method was applied, the land type unitswere generated instead.
There were thresholds of “land use area percentage oversubbasin”, “soil class percentage over land use area” and“slope class percentage over soil area”. Slope classificationwas not applied in this study. In order to exclude the influ-ence of the discretized unit amounts on the runoff simulation,land use and soil thresholds were set to three values: 0, 5 and12. The unit amounts based on these different thresholds areshown in Table 4.
Runoff of the Ansai watershed from 1995 to 2002 was sim-ulated using SWAT. Discharges were observed daily at theAnsai monitoring center from April to October, but observedon fixed dates in other months. So the simulation results ofthese seven months per year were evaluated.
The purpose of this study was to compare the performanceof Hydrological Response Units (HRUs) and land type units,so no calibration was performed for the model; that is, theinfluence of model parameters was excluded. The first threeyears (1995–1997) were used as a warm up period. Simu-lated monthly flow from April to October in 1998 to 2002was evaluated against the observation.
The agreement between the simulated and measured flowwas quantitatively evaluated using the coefficient of determi-nation (R2) and the Nash–Sutcliffe coefficient (ENS) (Nashand Sutcliffe, 1970), calculated as:
R2=
[∑i
(Qm,i −Qm
)(Qs,i −Qs
)]2
∑i
(Qm,i −Qm
)2∑i
(Qs,i −Qs
)2
ENS= 1−
∑i
(Qm−Qs)2i∑
i
(Qm,i −Qm
)2(10)
whereQm is the measured runoff, andQs is the simulatedrunoff.
3 Results
The Ansai watershed was divided into 177 kinds of land typeunits. The five dominant combinations (listed as: land use– hydrological condition of vegetation – slope – soil), to-taling 32.91 % of the watershed, were (1) crops – poor –19.38◦∼28.85◦ – loess soil, (2) grassland – poor –>28.85◦ –loess soil, (3) grassland – poor – 19.38◦
∼28.85◦ – loess soil,(4) crops – poor – 0◦∼19.38◦ – loess soil and (5) grassland –poor – 0◦∼19.38◦ – loess soil. The dominant woodland typeunit combination was woods – good –>28.85◦ – loess soil.The dominant brushland type unit combination was brush –good –>28.85◦ – loess soil. The main land type units andtheir distribution is shown in Fig. 2.
The values ofR2 and ENS for monthly flow, based onHRUs and land type unit discretization, are shown in Table 4.
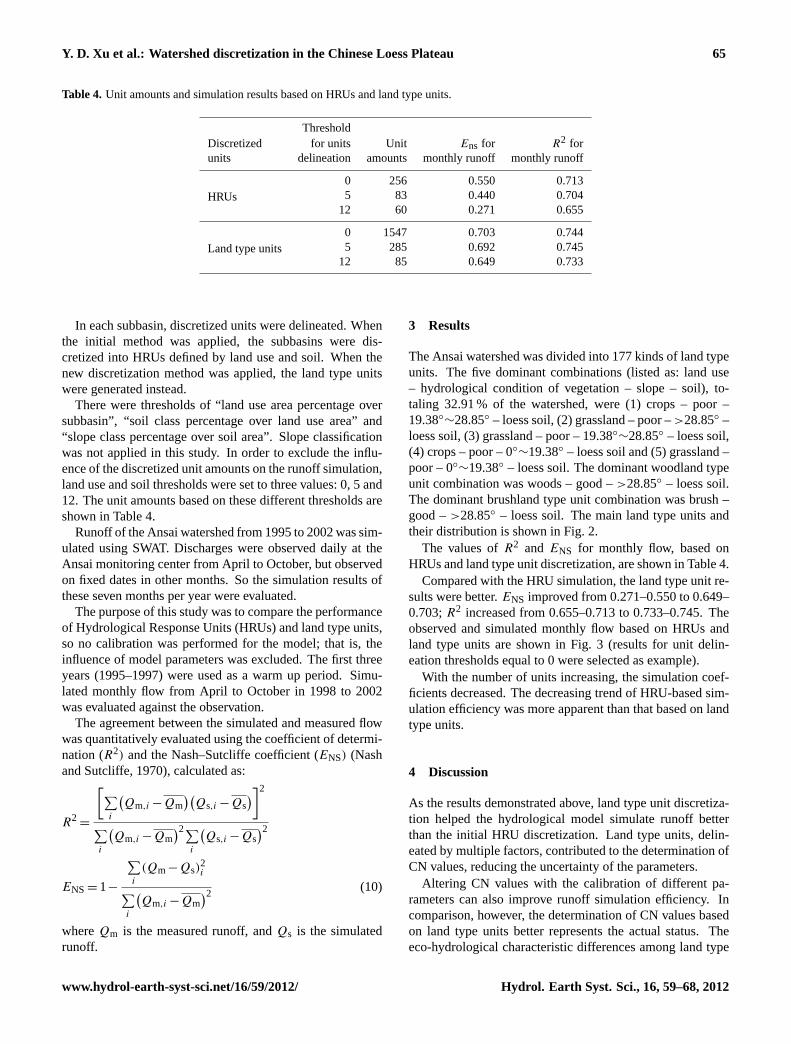
Compared with the HRU simulation, the land type unit re-sults were better.ENS improved from 0.271–0.550 to 0.649–0.703;R2 increased from 0.655–0.713 to 0.733–0.745. Theobserved and simulated monthly flow based on HRUs andland type units are shown in Fig. 3 (results for unit delin-eation thresholds equal to 0 were selected as example).
With the number of units increasing, the simulation coef-ficients decreased. The decreasing trend of HRU-based sim-ulation efficiency was more apparent than that based on landtype units.
4 Discussion
As the results demonstrated above, land type unit discretiza-tion helped the hydrological model simulate runoff betterthan the initial HRU discretization. Land type units, delin-eated by multiple factors, contributed to the determination ofCN values, reducing the uncertainty of the parameters.
Altering CN values with the calibration of different pa-rameters can also improve runoff simulation efficiency. Incomparison, however, the determination of CN values basedon land type units better represents the actual status. Theeco-hydrological characteristic differences among land type
www.hydrol-earth-syst-sci.net/16/59/2012/ Hydrol. Earth Syst. Sci., 16, 59–68, 2012
66 Y. D. Xu et al.: Watershed discretization in the Chinese Loess Plateau
Fig. 3. Observed and simulated monthly flow.
units and subbasins can be indicated more accurately on thebasis of land type unit discretization.
By means of remote sensing, the vegetation condition canbe inversed and considered for an eco-hydrological simu-lation based on land type units. The hydrological processof vegetation on different slopes can also be better simu-lated, so the hydrological effect of land use changes can bemore reliably reflected. This is helpful for assessing the re-vegetation projects (e.g. the Grain for Green project) in theLoess Plateau.
Land type units can also be applied to soil erosion simu-lation. Several types of erosion exist in the Loess Plateau,for instance, sheet erosion, rill erosion, gully erosion, gravi-tational erosion, etc. Lots of research has focused on the crit-ical slope gradient and simulation of different erosion pro-cesses (Wu and Cheng, 2005; Valentin et al., 2005; Hes-sel and van Asch, 2003). Slope was taken into account inthe land type unit delineation. Accompanied with the priorresearch, the land type units can be used to better simulatesoil erosion.
Monthly discharges for April, May and October werecommonly underestimated in the simulation of this study.Two probable reasons exist. Firstly, the base flow was notaccurately simulated. Secondly, the curve numbers for thesemonths were higher than the exact status. In the study area,April and May are the early period of growing season. Mostcrops are not planted until the end of May. As for October,it’s a declining period for plant growth, as well as the harvest
time for crops. Though the plant growth cycle and intercep-tion is simulated in SWAT, there may be some deviation incurve number adjustment and canopy storage simulation ininitial and last growing season in this study. Assigning curvenumbers for agricultural lands, especially cultivated landsseparately for different growth period may solve this error.
5 Conclusions
Land type units were delineated for the spatial discretizationof a watershed in the Chinese Loess Plateau. The discretizedfactors were composed of land use and soil types, the hydro-logical condition of vegetation and slope.
The runoff curve number for each kind of land type unitwas defined by land use type, soil type and the hydrologicalcondition of vegetation (according to the National Engineer-ing Handbook) and modified by slope.
The runoff processes of the studied watershed were simu-lated by Soil and Water Assessment Tools (SWAT), in whichthe NRCS curve number method was applied. When the ini-tial HRUs were used for the spatial discretization of the wa-tershed, the coefficient of determination (R2) and the Nash–Sutcliffe coefficient (ENS) for the monthly flow simulationwere 0.655–0.713 and 0.271–0.550, respectively. When landtype units were used for the spatial discretization of the wa-tershed, the simulation efficiency was improved.R2 andENS for the monthly flow simulations were 0.733–0.745 and0.649–0.703, respectively.
Hydrol. Earth Syst. Sci., 16, 59–68, 2012 www.hydrol-earth-syst-sci.net/16/59/2012/

Y. D. Xu et al.: Watershed discretization in the Chinese Loess Plateau 67
Compared to the initial HRU discretization, the land typeunits help to determine the CN value and more accuratelyrepresent the actual status. This is a suitable approach foreco-hydrological studies in the Chinese Loess Plateau andsimilar regions. This method can be further applied to soilerosion simulations and the eco-hydrological evaluation ofland use changes in the Chinese Loess Plateau.
Acknowledgements.This research was supported by the NationalNatural Science Foundation of China (no. 40930528), the ExternalCooperation Program of the Chinese Academy of Sciences(No. GJHZ0948) and the CAS/SAFEA International PartnershipProgram for Creative Research Teams of “Ecosystem Processesand Services.”
Edited by: J. Liu
References
Arnold, J. G., Williams, J. R., Nicks, A. D., and Sammons, N. B.:SWRRB – A Basin Scale Simulation Model for Soil and WaterResourcesManagement, Texas A&M University Press: CollegeStation, TX, 1990.
Arnold, J. G., Srinivasan, R., Muttiah, R. S., and Williams, J.R.: Large area hydrologic modeling and assessment part I:model development, J. Am. Water Resour. As., 34, 73–89,doi:10.1111/j.1752-1688.1998.tb05961.x, 1998.
Beldring, S., Engeland, K., Roald, L. A., Slthun, N. R., andVoks, A.: Estimation of parameters in a distributed precipitation-runoff model for Norway, Hydrol. Earth Syst. Sci., 7, 304–316,doi:10.5194/hess-7-304-2003, 2003.
Bloschl, G., Reszler, C., and Komma, J.: A spatially distributedflash flood forecasting model, Environ. Modell. Softw., 23, 464–478,doi:10.1016/j.envsoft.2007.06.010, 2008.
Das, T., Bardossy, A., Zehe, E., and He, Y.: Compari-son of conceptual model performance using different repre-sentations of spatial variability, J. Hydrol., 356, 106–118,doi:10.1016/j.jhydrol.2008.04.008, 2008.
Doherty, J.: Ground Water Model Calibration Using Pi-lot Points and Regularization, Ground Water, 41, 170–177,doi:10.1111/j.1745-6584.2003.tb02580.x, 2003.
Flugel, W.-A.: Delineating hydrological response units by ge-ographical information system analyses for regional hydro-logical modelling using PRMS/MMS in the drainage basinof the River Brol, Germany, Hydrol. Process., 9, 423–436,doi:10.1002/hyp.3360090313, 1995.
Fu, B. J.: Soil erosion and its control in the loess plateauof China, Soil use Manage., 5, 76–82,doi:10.1111/j.1475-2743.1989.tb00765.x, 1989.
Fu, B. J., Zhang, Q. J., Chen, L. D., Zhao, W. W., Gulinck, H., Liu,G. B., Yang, Q. K., and Zhu, Y. G.: Temporal change in landuse and its relationship to slope degree and soil type in a smallcatchment on the Loess Plateau of China, Catena, 65, 41–48,doi:10.1016/j.catena.2005.07.005, 2006.
Fu, B. J., Wang, Y. F., Lu, Y. H., He, C. S., Chen, L. D., and Song,C. J.: The effects of land-use combinations on soil erosion: acase study in the Loess Plateau of China, Prog. Phys. Geog., 33,793–804,doi:10.1177/0309133309350264, 2009.
Garen, D. C. and Moore, D. S.: Curve number hydrology in wa-ter quality modeling: uses, abuses, and future directions, J. Am.Water Resour. As., 41, 377–388, 2005.
Gustafson, E. J., Zollner, P. A., Sturtevant, B. R., He, H.S., and Mladenoff, D. J.: Influence of forest manage-ment alternatives and land type on susceptibility to fire innorthern Wisconsin, USA, Landscape Ecol, 19, 327–341,doi:10.1023/B:LAND.0000030431.12912.7f, 2004.
Hellebrand, H. and van den Bos, R.: Investigating the use of spa-tial discretization of hydrological processes in conceptual rainfallrunoff modelling: a case study for the meso-scale, Hydrol. Pro-cess., 22, 2943–2952,doi:10.1002/hyp.6909, 2008.
Hessel, R. and van Asch, T.: Modelling gully erosion for a smallcatchment on the Chinese Loess Plateau, Catena, 54, 131–146,doi:10.1016/s0341-8162(03)00061-4, 2003.
Huang, M. B., Gallichand, J., Wang, Z., and Goulet, M.: A mod-ification to the Soil Conservation Service curve number methodfor steep slopes in the Loess Plateau of China, Hydrol. Process.,20, 579–589,doi:10.1002/hyp.5925, 2006.
Jha, M., Gassman, P. W., Secchi, S., Gu, R., and Arnold, J.: Ef-fect of Watershed Subdivision on SWAT Flow, Sediment, andNutrient Predictions, J. Am. Water Resour. As., 40, 811–825,doi:10.1111/j.1752-1688.2004.tb04460.x, 2004.
Kumar, R., Samaniego, L., and Attinger, S.: The effects of spa-tial discretization and model parameterization on the predic-tion of extreme runoff characteristics, J. Hydrol., 392, 54–69,doi:10.1016/j.jhydrol.2010.07.047, 2010.
Kupfer, J. A. and Franklin, S. B.: Evaluation of an ecological landtype classification system, Natchez Trace State Forest, west-ern Tennessee, USA, Landscape Urban. Plan., 49, 179–190,doi:10.1016/s0169-2046(00)00070-0, 2000.
Legesse, D., Vallet-Coulomb, C., and Gasse, F.: Hydrological re-sponse of a catchment to climate and land use changes in Trop-ical Africa: case study South Central Ethiopia, J. Hydrol., 275,67–85,doi:10.1016/s0022-1694(03)00019-2, 2003.
Leprieur, C., Verstraete, M. M., and Pinty, B.: Evaluation of theperformance of various vegetation indices to retrieve vegetationcover from AVHRR data, Remote Sensing Reviews, 10, 265–284, 1994.
Li, Z., Liu, W. Z., Zhang, X. C., and Zheng, F. L.: Impacts of landuse change and climate variability on hydrology in an agricul-tural catchment on the Loess Plateau of China, J. Hydrol., 377,35–42,doi:10.1016/j.jhydrol.2009.08.007, 2009.
Ministry of Water Resources of the People’s Republic of China:Standards for classification and gradation of soil erosion, ChinaHydroelectricity Press, Beijing, 1997 (in Chinese).
Mishra, S. K. and Singh, V. P.: Longterm hydrological simulationbased on the Soil Conservation Service curve number, Hydrol.Process., 18, 1291–1313, 2004.
Nash, J. and Sutcliffe, J.: River flow forecasting through conceptualmodels part I-A discussion of principles, J. Hydrol., 10, 282–290,1970.
NRCS: SCS National Engineering Handbook, Section 4, Soil Con-servation Service, US Department of Agriculture, Washington,DC, 1972.
NRCS: Urban Hydrology for Small Watersheds, Technical Release55 (TR-55), Natural Resources Conservation Service, US De-partment of Agriculture, Washington, DC, 1986.
Rykken, J. J., Capen, D. E., and Mahabir, S. P.: Ground bee-
www.hydrol-earth-syst-sci.net/16/59/2012/ Hydrol. Earth Syst. Sci., 16, 59–68, 2012

68 Y. D. Xu et al.: Watershed discretization in the Chinese Loess Plateau
tles as indicators of land type diversity in the Green Mountainsof Vermont, Conserv. Biol., 11, 522–530,doi:10.1046/j.1523-1739.1997.95336.x, 1997.
Saxton, K.: SPAW Soil Water Characteristics Version 6.02. 74.USDA Agricultural Research Service, Pullman, WA, 2002.
Tripathi, M. P., Raghuwanshi, N. S., and Rao, G. P.: Effect of wa-tershed subdivision on simulation of water balance components,Hydrol. Process., 20, 1137–1156,doi:10.1002/hyp.5927, 2006.
Valentin, C., Poesen, J., and Li, Y.: Gully erosion:Impacts, factors and control, Catena, 63, 132–153,doi:10.1016/j.catena.2005.06.001, 2005.
Williams, J. R.: The EPIC model, in: Computer models of water-shed hydrology, edited by: Singh, V. P., Water Resources Publi-cations, Highlands Ranch, Colorado, 909–1000, 1995.
Williams, J. R., Nicks, A. D., and Arnold, J. G.: Simulator for WaterResources in Rural Basins, J. Hydraul. Eng.-ASCE, 111, 970–986, 1985.
Winchell, M., Srinivasan, R., Di Luzio, M., and Arnold, J.: Arc-SWAT Version 2009.93.5, Stone Environmental, Inc., TexasA&M Spatial Sciences Laboratory, Blackland Research and Ex-tension Center, 2010.
Wu, Y. and Cheng, H.: Monitoring of gully erosion on the LoessPlateau of China using a global positioning system, Catena, 63,154–166, 2005.
Zribi, M., Hegarat-Mascle, S. L., Taconet, O., Ciarletti, V., Vidal-Madjar, D., and Boussema, M. R.: Derivation of wild vegetationcover density in semi-arid regions: ERS2/SAR evaluation, Int. J.Remote Sens., 24, 1335–1352, 2003.
Hydrol. Earth Syst. Sci., 16, 59–68, 2012 www.hydrol-earth-syst-sci.net/16/59/2012/


![[2014] - Triangular regular discretization system](https://static.fdocuments.in/doc/165x107/57906cf81a28ab68748de0d8/2014-triangular-regular-discretization-system.jpg)