
WATERLAND Investment Forum 20170829 Handout17 2Q'17 3Q'17(E) 4Q'17(E) 1Q'18(E) 2Q'18(E) 3Q'18(E)...
23
August 29 2017 © 2017 Nanya Technology Corp. Presentation to Investors & Analysts, August 29 th , 2017 Joseph Wu, AVP & Deputy Spokesman Nanya Technology WATERLAND Investment Forum 2017
Transcript of WATERLAND Investment Forum 20170829 Handout17 2Q'17 3Q'17(E) 4Q'17(E) 1Q'18(E) 2Q'18(E) 3Q'18(E)...

August 29 2017 © 2017 Nanya Technology Corp.
Presentation to Investors & Analysts, August 29th, 2017
Joseph Wu, AVP & Deputy Spokesman
Nanya Technology WATERLAND Investment Forum 2017

2August 29 2017 © 2017 Nanya Technology Corp.
Safe Harbor
The information herein and the presentation made during the
conference contain forward-looking statements and are provided for
information purposes only.
Neither Nanya Technology Corp. nor any other person assumes
responsibility for the accuracy and completeness of the forward-
looking statements or undertakes duty to update the statements. You
are urged to review the information provided herein carefully, and
please don’t distribute, reproduce or disclose the information in whole
or in part without prior written permission of NANYA Technology Corp.

3August 29 2017 © 2017 Nanya Technology Corp.
01. DRAM Industry Landscape
02. NTC Overview
03. Business Strategy
Outline

4August 29 2017 © 2017 Nanya Technology Corp.
Tablets
PhonesWearables
Big
DataPortable
Devices
Servers
PC Era
IoT, AI
Smart Car
Smart Home,
Smart Office,
Smart City
IoT
DRAM Essential to Electronic Devices
Diversified applications create segmented opportunities

5August 29 2017 © 2017 Nanya Technology Corp.
Smart Home Health
Care
Machine
Learning
Smart
Vehicle
Smart
Devices
Smart
Industry
Smart City
New data era has been expediting the proliferation of semiconductor
Memory (DRAM and NAND) plays as key semiconductor components
Vigorous Development of New Data Era
6August 29 2017 © 2017 Nanya Technology Corp.
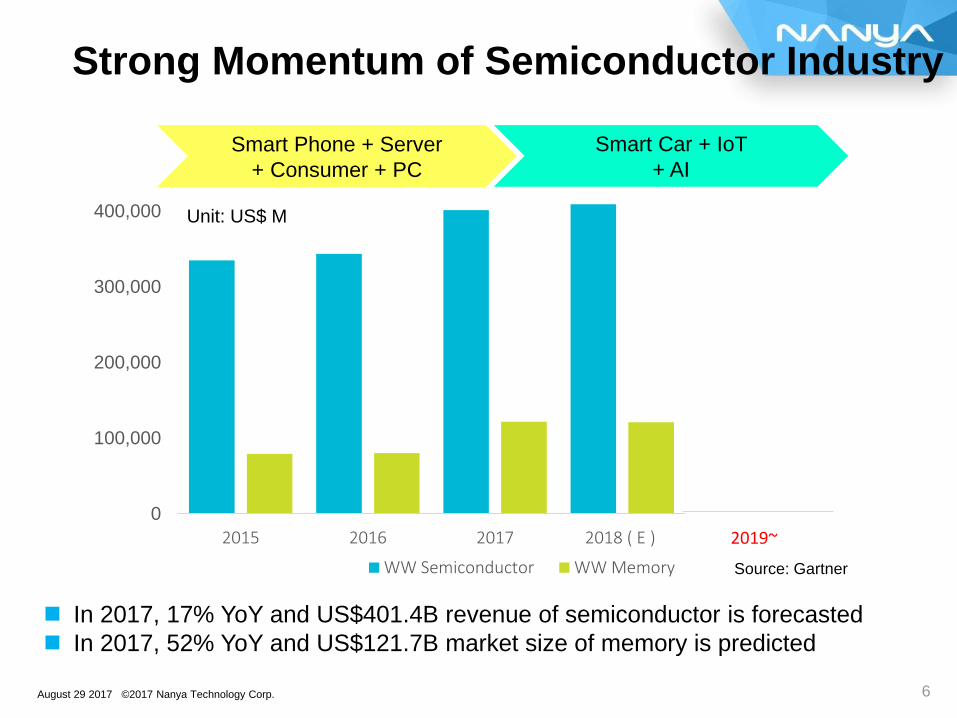
Unit: US$ M
Source: Gartner
Smart Phone + Server
+ Consumer + PC
2019~
Smart Car + IoT
+ AI
In 2017, 17% YoY and US$401.4B revenue of semiconductor is forecasted
In 2017, 52% YoY and US$121.7B market size of memory is predicted
Strong Momentum of Semiconductor Industry
0
100,000
200,000
300,000
400,000
2015 2016 2017 2018 ( E )
WW Semiconductor WW Memory

7August 29 2017 © 2017 Nanya Technology Corp.
~2013 2013~2017 2018~
MarketASP
Fluctuation
Supply
Supplier>40
(Keen
Competition)
3 Major + 1 Medium
+ 2 Small
(Oligopoly)
3 Major + 1 Medium +
2 Small
(New comers facing
enormous barrier)
Technology,
Cost &
Product
Cost down due to
rapid technology
conversion
Product portfolio
diversified and
technology
conversion slowed
down
New generation
product and cost
reduction continue
slowing down
Demand
Driving
ForcePC
Smart Phone,
Server, Consumer ,
PC
Smart Phone, Server,
Consumer, PC, Smart
Car, IoT, AI
Product
Spec.Standard module
eMCP, Component,
Module, SiP
eMCP、Component,
Module, SiP, TSV
Stable DRAM Industry Structure

8August 29 2017 © 2017 Nanya Technology Corp.
Significant NAND capex expected for 3D NAND
DRAM capex mainly for technology conversion and maintaining current capacity
level
Capacity non-exchangeable between NAND and DRAM
Annual bit growth forecast: DRAM 20%~25%, NAND>45%
Source: Gartner
Unit: US$ M
Memory Capex Allocation Shift
-
5,000
10,000
15,000
20,000
25,000
2015 2016 2017 2018 ( E )
DRAM NAND
9August 29 2017 © 2017 Nanya Technology Corp.
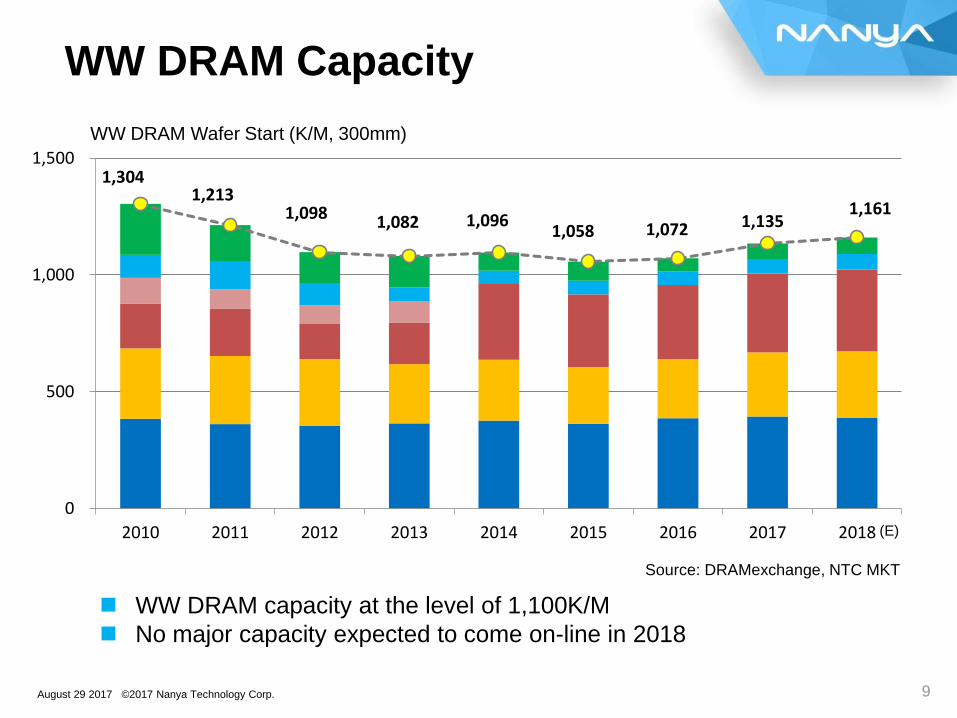
Source: DRAMexchange, NTC MKT
WW DRAM Wafer Start (K/M, 300mm)
1,304 1,213
1,098 1,082 1,096 1,058 1,072 1,135
1,161
0
500
1,000
1,500
2010 2011 2012 2013 2014 2015 2016 2017 2018
WW DRAM capacity at the level of 1,100K/M
No major capacity expected to come on-line in 2018
WW DRAM Capacity
(E)
10August 29 2017 © 2017 Nanya Technology Corp.
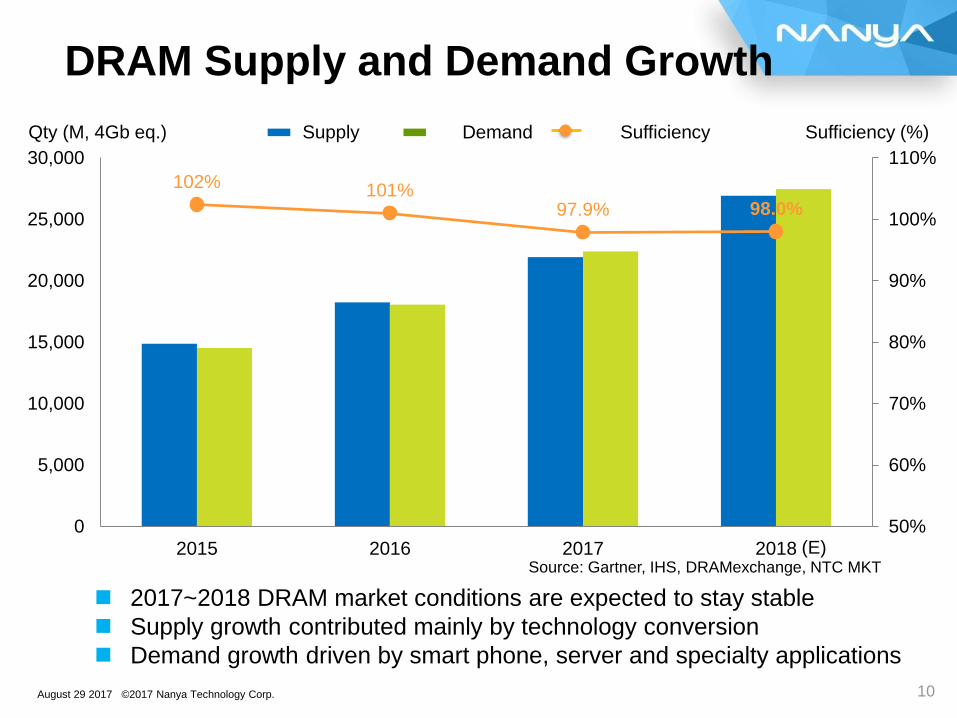
Source: Gartner, IHS, DRAMexchange, NTC MKT
Supply Demand SufficiencyQty (M, 4Gb eq.) Sufficiency (%)
102% 101%97.9% 98.0%
50%
60%
70%
80%
90%
100%
110%
0
5,000
10,000
15,000
20,000
25,000
30,000
2015 2016 2017 2018
2017~2018 DRAM market conditions are expected to stay stable
Supply growth contributed mainly by technology conversion
Demand growth driven by smart phone, server and specialty applications
DRAM Supply and Demand Growth
(E)
11August 29 2017 © 2017 Nanya Technology Corp.
01. DRAM Industry Landscape
02. NTC Overview
03. Business Strategy
Outline

12August 29 2017 © 2017 Nanya Technology Corp.
1H’2017 1H’2016 Growth Rate
Revenue 24.9B 19.3B 28.6%
Gross Profit
Gross Margin (%)
10.4B
42.0%
5.9B
30.7%76.0%
Operating Income
Operating Margin (%)
8.0B
32.3%
4.3B
22.2%87.2%
Non-operating Income 3.3B (1.4B)
Net Income
Net Margin (%)
9.8B
39.3%
2.2B
11.6%334.9%
Capital 27.5B 27.5B
EPS 3.55 0.82
NT$B: Billion
Company highlights
• 1Q’17 Net Income of NT$ 3,275M, Net Margin 26.8%, EPS NT$ 1.19
• 2Q’17 Net Income of NT$ 6,490M, Net Margin 51.4%, EPS NT$ 2.36
* Financial numbers are reviewed by CPA
P&L Results
13August 29 2017 © 2017 Nanya Technology Corp.
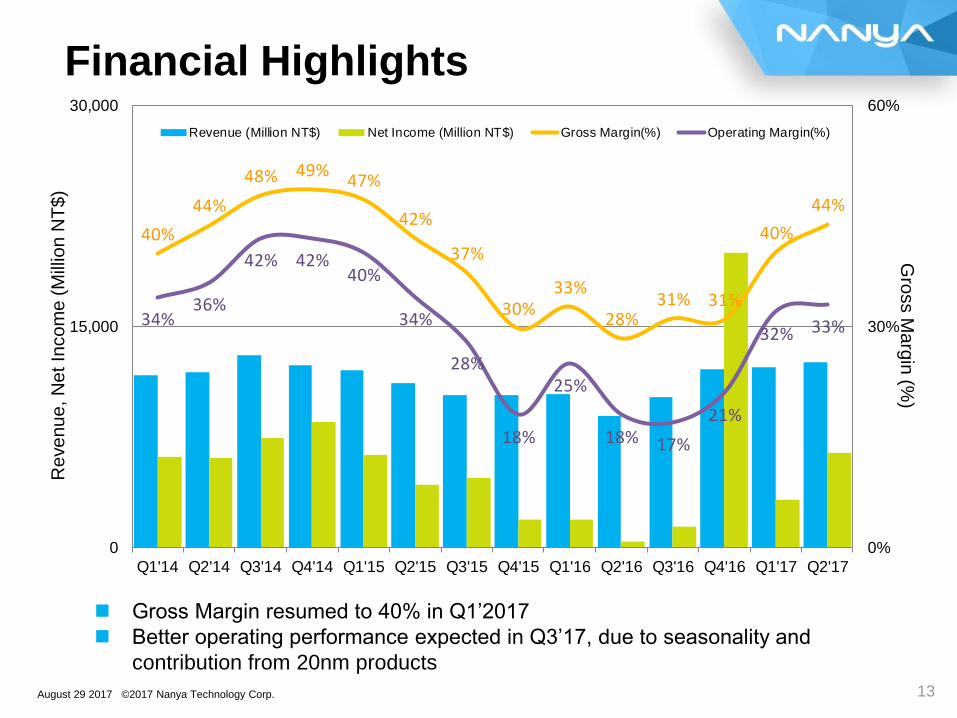
40%
44%
48% 49%47%
42%
37%
30%33%
28%31% 31%
40%
44%
34%36%
42% 42%40%
34%
28%
18%
25%
18% 17%
21%
32% 33%
0%
30%
60%
0
15,000
30,000
Q1'14 Q2'14 Q3'14 Q4'14 Q1'15 Q2'15 Q3'15 Q4'15 Q1'16 Q2'16 Q3'16 Q4'16 Q1'17 Q2'17
Revenue (Million NT$) Net Income (Million NT$) Gross Margin(%) Operating Margin(%)
Re
ve
nu
e, N
et In
co
me
(M
illio
n N
T$
)G
ross M
arg
in (%
)
Gross Margin resumed to 40% in Q1’2017
Better operating performance expected in Q3’17, due to seasonality and
contribution from 20nm products
Financial Highlights
14August 29 2017 © 2017 Nanya Technology Corp.
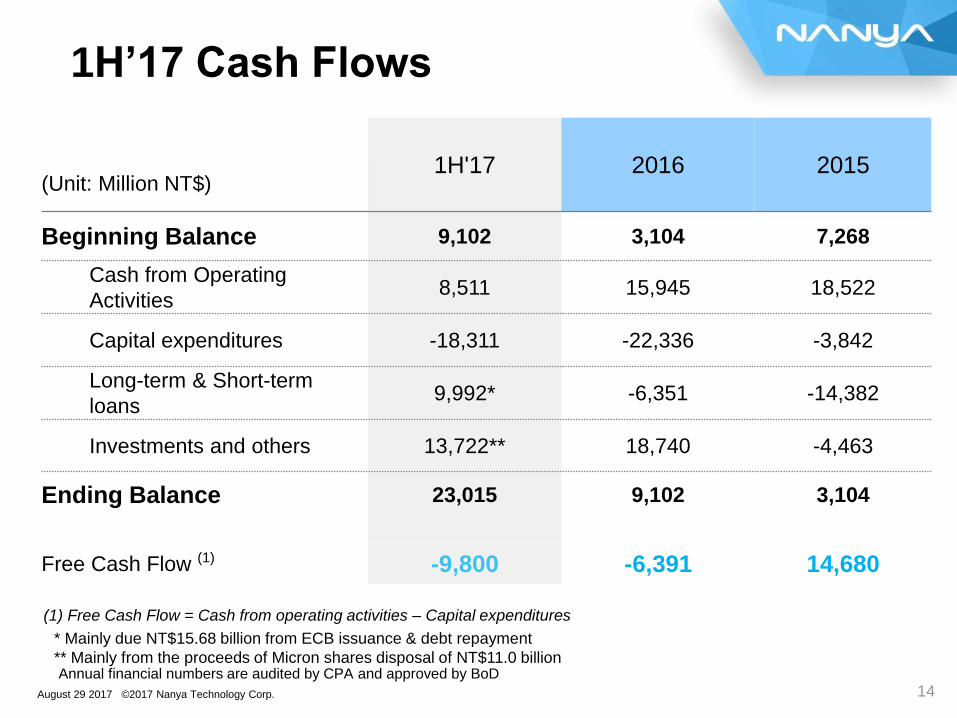
1H'17 2016 2015(Unit: Million NT$)
Beginning Balance 9,102 3,104 7,268
Cash from Operating
Activities8,511 15,945 18,522
Capital expenditures -18,311 -22,336 -3,842
Long-term & Short-term
loans9,992* -6,351 -14,382
Investments and others 13,722** 18,740 -4,463
Ending Balance 23,015 9,102 3,104
Free Cash Flow (1) -9,800 -6,391 14,680
1H’17 Cash Flows
(1) Free Cash Flow = Cash from operating activities – Capital expenditures
* Mainly due NT$15.68 billion from ECB issuance & debt repayment
** Mainly from the proceeds of Micron shares disposal of NT$11.0 billionAnnual financial numbers are audited by CPA and approved by BoD
15August 29 2017 © 2017 Nanya Technology Corp.
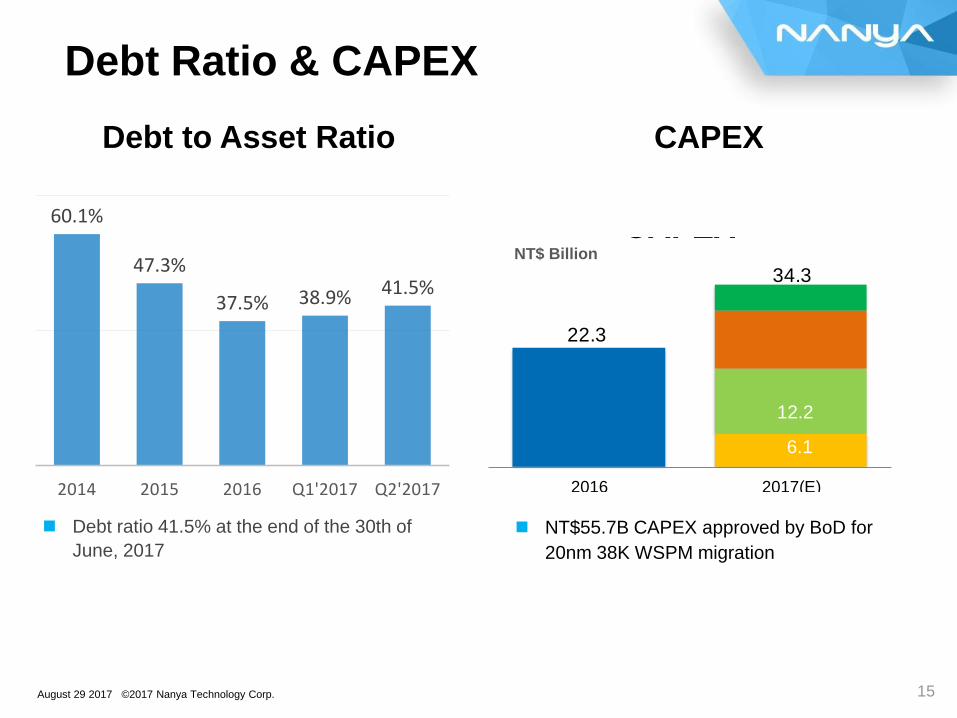
22.3
2016 2017(E)
CAPEX
34.3
Debt to Asset Ratio
Debt ratio 41.5% at the end of the 30th of
June, 2017
NT$55.7B CAPEX approved by BoD for
20nm 38K WSPM migration
60.1%
47.3%
37.5% 38.9% 41.5%
2014 2015 2016 Q1'2017 Q2'2017
NT$ Billion
6.1
12.2
CAPEX
Debt Ratio & CAPEX

16August 29 2017 © 2017 Nanya Technology Corp.
20nm Monthly
Wafers Input Plan
• >10K / month in Q3’17
• 30K / month in Q4’17
• 38K / month in 1H’18
Product Delivery
• 4Gb DDR3 shipment commenced in Q2’17
• 8Gb DDR4, 2Gb DDR3 in 2H’17
• 8Gb LPDDR3 offering in 1H’18
• LPDDR4X offering in 2H’18
Monthly Wafer Capacity*WSPM: wafer starts per month
• 20nm technology to reach 38K WSPM in 2018.
• Total capacity will amount to 68K WSPM (20nm + 30nm)
Product Line-up
• DDR3/DDR4
• LPDDR3/LPDDR4X
• Custom
Production 8Gb DDR4
Q2’17 2H’17
LPDDR4X
2H’18 2019~
Continuous Optimization
1H’18
8Gb LPDDR3
20nm Conversion
17August 29 2017 © 2017 Nanya Technology Corp.
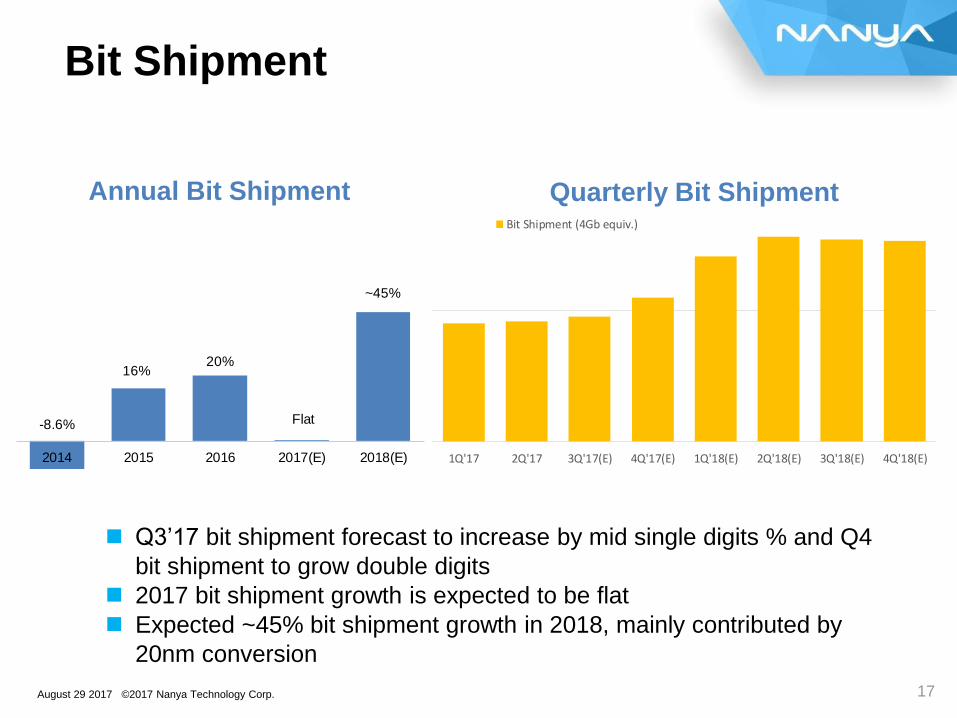
0
150,000
300,000
1Q'17 2Q'17 3Q'17(E) 4Q'17(E) 1Q'18(E) 2Q'18(E) 3Q'18(E) 4Q'18(E)
Bit Shipment (4Gb equiv.)
Q3’17 bit shipment forecast to increase by mid single digits % and Q4
bit shipment to grow double digits
2017 bit shipment growth is expected to be flat
Expected ~45% bit shipment growth in 2018, mainly contributed by
20nm conversion
Annual Bit Shipment Quarterly Bit Shipment
Bit Shipment
-8.6%
16%20%
Flat
~45%
2014 2015 2016 2017(E) 2018(E)
BIT SHIPMENT (YOY)

18August 29 2017 © 2017 Nanya Technology Corp.
01. DRAM Industry Landscape
02. NTC Overview
03. Business Strategy
Outline

19August 29 2017 © 2017 Nanya Technology Corp.
Consumer 20%
Auto & Industrial
3%
Smart Phone38%
Server22%
PC14%
Tablet3%
2017 DRAM Demand
20nm enhances Nanya Technology competitiveness in specialty market as well as
participation in other major segments
Source: Gartner, NTC
Specialty DRAM
Market Characteristics
Nanya Established Stronghold in Specialty
Increased customers basis
Diversified product spec
Long-life and stable supply
Demand growth
• Solid in Consumer
• Strong in Auto
• Emerging (IoT…)
20August 29 2017 © 2017 Nanya Technology Corp.
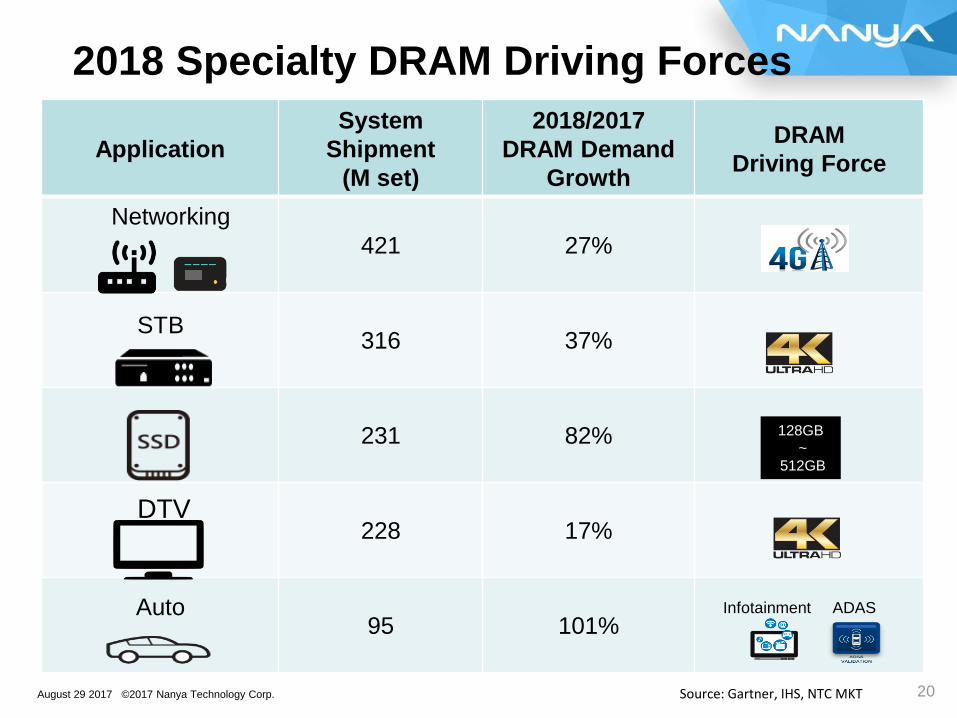
Application
System
Shipment
(M set)
2018/2017
DRAM Demand
Growth
DRAM
Driving Force
421 27%
316 37%
231 82%
228 17%
95 101%
DTV
STB
Networking
Infotainment ADAS
128GB
~
512GB
Auto
Source: Gartner, IHS, NTC MKT
2018 Specialty DRAM Driving Forces
21August 29 2017 © 2017 Nanya Technology Corp.
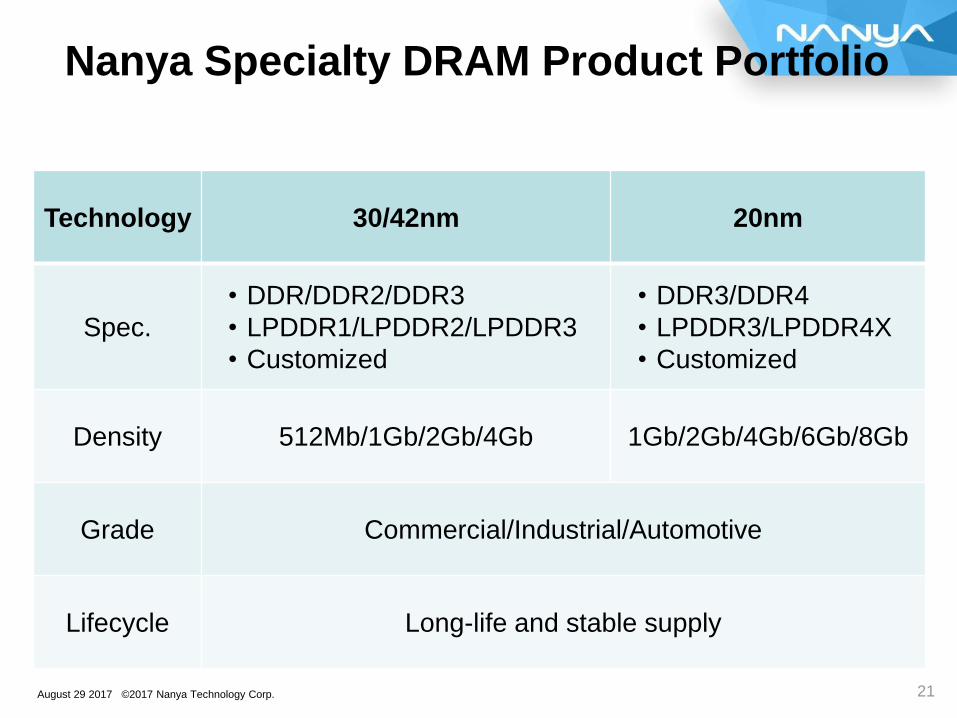
Technology 30/42nm 20nm
Spec.
• DDR/DDR2/DDR3
• LPDDR1/LPDDR2/LPDDR3
• Customized
• DDR3/DDR4
• LPDDR3/LPDDR4X
• Customized
Density 512Mb/1Gb/2Gb/4Gb 1Gb/2Gb/4Gb/6Gb/8Gb
Grade Commercial/Industrial/Automotive
Lifecycle Long-life and stable supply
Nanya Specialty DRAM Product Portfolio
22August 29 2017 © 2017 Nanya Technology Corp.
Tight supply continued in Q4’17, solid ASP movement
2018 DRAM market in balance and overall healthy environment
Nanya Technology Operation Focuses:
• 20nm execution better than expected, >10% QoQ bit shipment
growth in Q4’17
• 20nm capacity ramp-up, ~45% YoY bit output in 2018 forecasted
• 20nm product design and production efficiency to further enhance
competitiveness
• 20nm + 30/42nm comprehensive product offering & long-term
commitment to specialty DRAM market
Key Takeaways

23August 29 2017 © 2017 Nanya Technology Corp.23
Thanks & Questions


