NEEP 541 – Swelling Fall 2002 Jake Blanchard. Outline Swelling.
WATER
WATER
WATER 4, 129 - 154, March 8th 2013 129
Abstract
Experimental measurements of electrostatic potential and the bulk concentration of bisulfite anions in water close to Nafion (a proton - exchange membrane) interface have revealed jump - like changes of these characteristics at a distance of approximately 150 µm from the interface. Furthermore, the temperature behavior of the bisulfite anion concentration exhibits a sort of hysteresis loop, which can be regarded as a manifestation of multi-stability in the system. Additionally, it is experimentally shown that in the vicinity of Nafion interface the refractive index of water grows approximately by a factor of 1.1 as compared with the value in bulk water. The obtained results can be interpreted as evidence of the formation of a new phase in water adjacent to Nafion interface.
Introduction
At the present time the proton - exchange membrane Nafion developed by the DuPont
Company is widely used in manufacturing the low - temperature (< 1000 С) hydrogen fuel cells. Nafion is a sulfonated tetrafluoroethylene based fluoropolymer-copolymer. Its unique ionic properties result from incorporating perfluorovinyl ether groups terminated with sulfonate groups onto a tetrafluoroethylene backbone (Mauritz 2004). Its chemical formula is the following:
⎯[(CFCF2)(CF2CF2)m]⎯
OCF2CFOCF2CF2SO3H
CF3;
where m is the number of side chains; protons located on the SO3H (sulfonic acid) groups can “hop” from one acid site to another one. Our interest to research of such membranes is first caused by their wide applications in the hydrogen power
Study of the Phase States of Water Close to Na-fion InterfaceBunkin NF1*, Ignatiev PS2, Kozlov VA1, Shkirin AV1, Zakharov SD3 and Zinchenko AA4 1A.M. Prokhorov General Physics Institute, Moscow, Vavilova 38, 119991 Russia
2Amphora Labs Co. Ltd, Moscow, 5th Magistralnaya 11, 123557 Russia
3P.N. Lebedev Physical Institute, Moscow, Leninskiy prospekt 53, 119991 Russia
4Donetsk National University, Shchorsa 46, Donetsk 83050, Ukraine
*Correspondence E-mail: [email protected]
Key Words: Nafion, Exclusion Zone, Photonic Crystal, Refractive Index, Modulation Interference Microscopy
Received February 8th, 2013; Accepted March 1st, 2013; Published March 8th, 2013; Available online March 15th, 2013
doi: 10.14294/WATER.2013.1
WATER
WATER 4, 129 - 154, March 8th 2013 130
engineering. The design of electrochemical cell based on the use of Nafion membrane, where the molecular hydrogen is effectively generated, is given in Ref (Heitner-Wirguin 1996). Additionally, in contact with water such membrane exhibits well-expressed hydrophilic properties (Mauritz 2004). Therefore it is quite natural to expect that Nafion should have an influence upon the near-surface molecular layers of water. It is worth noticing that the problem of interaction of a surface having hydrophilic or hydrophobic properties with polar liquids is still beyond complete comprehension; see, for example, the study (Ninham and Lo Nostro 2010) and the references therein. Nonetheless, the conventional point of view concerning the hydrophilic hydration radius (i.e. the spatial scale, where it is possible to treat the molecular structure of water as an ordered one) consists in this size is about several tens of nanometers. At the same time, in some works (see, for example, (Kepler and Fraden 1994; Crocker and Grier 1996; Xu and Yeung 1998; Squires and Brenner 2000)) it was noted that the effective radius of interaction of colloidal particles can exceed one micron.
In this connection it is necessary to note that according to numerous experimental results obtained in the group of Prof. G.H. Pollack, University of Washington, Seattle, the spatial scale of the water layer adjacent to Nafion interface, inside which the water is believed to be structured, can amount to hundreds of microns (Chai and Pollack 2009; Chai and Pollack 2010; Bhalerao and Pollack 2011; Yoo et al. 2011a; Yoo et al. 2011b; Zheng and Pollack 2003; Chai et al. 2008; Zheng et al. 2006). Particularly, it was shown that near to the interface “Nafion - polar liquid” the so-termed “exclusion zone (EZ)” from the side of a liquid is formed, whose macroscopic characteristics essentially differ from those in the bulk of the liquid. Any colloid particles are effectively pushed out of the EZ (and therefore this
area is referred to as the exclusion zone); the effective size of this area was determined as the distance between Nafion interface and the border of colloid particles suspension and was found with the help of an optical microscope. This technique revealed that for water the EZ radius is 220 μm (Chai and Pollack 2010). It appeared that this size depends on the diameter of colloid particles, their concentration and the material they were made of (Zheng and Pollack 2003). It is important to say that the scale of the EZ grows with time, and the rate of this growth essentially increases provided that the liquid sample is irradiated at a wavelength absorbed by that liquid: see Refs. (Chai and Pollack 2009; Chai and Pollack 2010)
The results of measuring the spatial distribution of electrostatic potential inside the EZ for water and aqueous solutions of various salts are given in works (Chai and Pollack 2010; Zheng et al. 2006): it appeared that in this area the potential is negative and amounts up to -120 mV. Based on these data the authors of these works assumed that inside the EZ the excess of negative ions is realized. The absolute value of the potential decreases with increasing the distance from Nafion interface and approaches the zero level approximately at 1000 µm from the interface. As was obtained in (Chai and Pollack 2009; Yoo et al. 2011b), immersing a Nafion plate in water results in the decrease of the equilibrium рН value from 7 to approximately 5.5; these measurements were carried out at the distance of about 1 cm from the interface. To evaluate the рН value at the micron scale in the very close vicinity of the interface, the authors of (Chai and Pollack 2009; Yoo et al. 2011b) have used particles of pH-sensitive dye; its color varied from red (acid) to green (neutral water) as dependent on рН. It was revealed that the dye particles leave the EZ just like the colloid particles. This is why it appeared impossible to measure pH inside the EZ, while immediately behind
WATER
WATER 4, 129 - 154, March 8th 2013 131
WATER
the EZ the value of рН was < 3. Moreover, as was obtained in (Yoo et al. 2011), the EZ exhibits the birefringence property. It is worth mentioning the results of (Zheng et al. 2006), where the spatial temperature distribution in the EZ was studied with the help of a thermal image camera. As was shown in this experiment, the EZ temperature is less than the equilibrium temperature in the bulk of water far from the EZ, i.e. system studied in the quoted works was not equilibrium with respect to temperature. It should basically follow from here that while exploring the dynamics of colloid particles inside the EZ it is necessary to take into account the convective counter-flow, since a temperature gradient ∇Т ~ ΔТ/Δх should exist, where Δх is the effective size of the EZ. Some of the above-mentioned experiments were carried out in vertical geometry in the field of gravity, i.e. the Archimedes and the Stokes friction forces, as well as the gravity force were applied to the colloid microspheres. Therefore the results of measurements should be very sensitive to the convective counter-flow in a liquid; in case of water such counter-flow is generated already at the temperature gradient of about 2 K/m, see (Kreuer and Membr 2001). Unfortunately, in the cited works the estimations of ∇Т were not made; however, the contribution of convection in these experiments, certainly, was present. Finally, as was shown in Refs. (Chai et al. 2008; Zheng et al. 2006), the light absorption band, centered at a wavelength of 270 nm, arises in the EZ. It appeared (Chai et al. 2008a) that the absorptivity at the given wavelength grows at admixing of some additives, in particular, chlorides of alkaline metals. Finally, as was indicated in (Zheng et al. 2006), the capability of pushing out the colloid microspheres was found not only for the interface “Nafion – water”, but also for the border of polyacrylic acid gel, biological tissue, hydrophilic monolayer, containing COOH groups. Exclusion zones
have also been seen adjacent to collagen gels and vascular endothelium, using both colloid microspheres and erythrocytes. This fact has allowed the authors of works (Chai and Pollack 2009; Chai and Pollack 2010; Bhalerao and Pollack 2011; Yoo et al. 2011a; Yoo et al. 2011b; Zheng and Pollack 2003; Chai et al. 2008; Zheng et al. 2006) to assume that the EZ effect should be observed for a wide class of hydrophilic substrates.
Summarizing the review of experimental works devoted to the EZ study, it is necessary to recognize that the question of essential divergence between the EZ size and the hydrophilic hydration radius still remains open. The goal of the experiments described below is to find out a physical reason for such divergence and to understand the physical nature of EZ. We have limited the class of hydrophilic surfaces under study only by Nafion.
Materials and MethodsPreparation of Samples
In the experiments, specimens of Nafion manufactured by DuPont Company have been investigated; their thickness was ei-ther 175 or 25 μm. The water samples for the immersion of Nafion plates were of 5 МΩ⋅сm resistivity with pH = 5.8 – 7.2. Ad-ditionally, we performed qualitative chemi-cal reactions and studied various solutions of electrolytes with the use of certain chem-ical reagents, which were all of analytical grade and utilized as purchased.
Measurements of pH and Electrostatic Po-tential.
First, the pH of water close to Nafion inter-face was measured by means of pH-meter with measuring probe, having a diameter of approximately 1 cm; i.e., we could estimate only some integral (non-local) value of pH. The measurements were carried out as fol-
WATER
WATER 4, 129 - 154, March 8th 2013 132
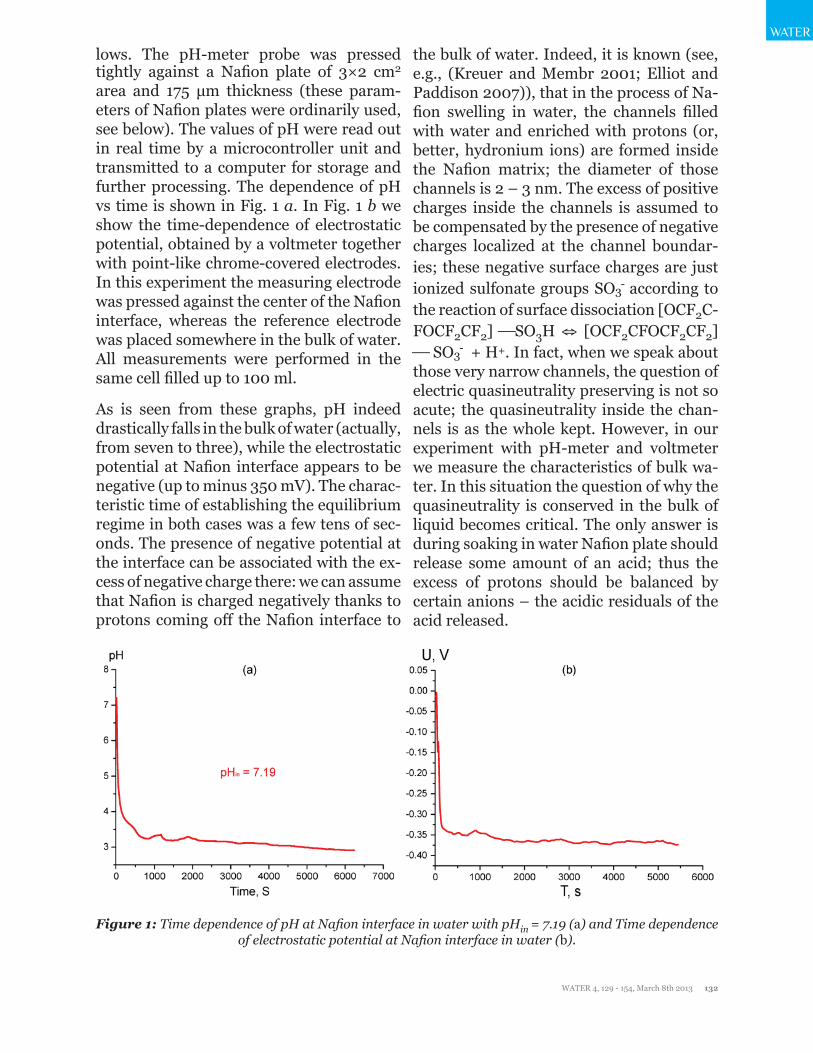
lows. The pH-meter probe was pressed tightly against a Nafion plate of 3×2 сm2 area and 175 μm thickness (these param-eters of Nafion plates were ordinarily used, see below). The values of pH were read out in real time by a microcontroller unit and transmitted to a computer for storage and further processing. The dependence of pH vs time is shown in Fig. 1 a. In Fig. 1 b we show the time-dependence of electrostatic potential, obtained by a voltmeter together with point-like chrome-covered electrodes. In this experiment the measuring electrode was pressed against the center of the Nafion interface, whereas the reference electrode was placed somewhere in the bulk of water. All measurements were performed in the same cell filled up to 100 ml.
As is seen from these graphs, pH indeed drastically falls in the bulk of water (actually, from seven to three), while the electrostatic potential at Nafion interface appears to be negative (up to minus 350 mV). The charac-teristic time of establishing the equilibrium regime in both cases was a few tens of sec-onds. The presence of negative potential at the interface can be associated with the ex-cess of negative charge there: we can assume that Nafion is charged negatively thanks to protons coming off the Nafion interface to
the bulk of water. Indeed, it is known (see, e.g., (Kreuer and Membr 2001; Elliot and Paddison 2007)), that in the process of Na-fion swelling in water, the channels filled with water and enriched with protons (or, better, hydronium ions) are formed inside the Nafion matrix; the diameter of those channels is 2 – 3 nm. The excess of positive charges inside the channels is assumed to be compensated by the presence of negative charges localized at the channel boundar-ies; these negative surface charges are just ionized sulfonate groups SO3- according to the reaction of surface dissociation [OCF2C-FOCF2CF2] ⎯SO3H ⇔ [OCF2CFOCF2CF2] ⎯ SO3- + H+. In fact, when we speak about those very narrow channels, the question of electric quasineutrality preserving is not so acute; the quasineutrality inside the chan-nels is as the whole kept. However, in our experiment with pH-meter and voltmeter we measure the characteristics of bulk wa-ter. In this situation the question of why the quasineutrality is conserved in the bulk of liquid becomes critical. The only answer is during soaking in water Nafion plate should release some amount of an acid; thus the excess of protons should be balanced by certain anions – the acidic residuals of the acid released.
Figure 1: Time dependence of pH at Nafion interface in water with pHin = 7.19 (а) and Time dependence of electrostatic potential at Nafion interface in water (b).

WATER
WATER 4, 129 - 154, March 8th 2013 133
WATER
In our viewpoint, the presence of acid sta-bilizes Nafion in water. Indeed, in Fig. 2 we display the time dependences of pH mea-sured by the routine described above (see Fig. 1 a) in acidic or alkaline aqueous solu-tions. The value of pH was varied by adding of NaOH/HCl; the content of Na+/Cl- ions was kept constant by admixing NaCl.
Figure 2: Time dependences of established values pHfin at Nafion interface in acidic / alkaline solu-tions with various pHin .
In this graph the ordinate-axis is scaled in the values of рНfin, which is established af-ter immersing a plate of Nafion in acidic / alkaline solution with the initial pH value denoted as pHin. We see that pH is practi-cally not changed over time in acidic liquids, whereas its value dramatically falls in alka-line media, i.e. initially-alkaline liquid is transformed to an acid. We can see that the pH value is not steady in time in very con-centrated alkaline solutions; see the curve for pHin = 9.13. Thus Nafion should create an acidic medium just to keep stability with respect to the dissolution in alkaline medi-um. The question arises: what kind of acid is this or, more exactly, what the acidic resi-dues are present there? We consider it to be sulfurous acid. A reason for such assump-tion was the pungent smell of burnt matches, which we could feel while Nafion plate was soaking in water (that was clearly sensed at temperatures T > 30° C). This smell could
be associated with the reaction H2SO3 ⇔ H2O + SO2. Additionally, the surface of Na-fion plate became studded with small bub-bles that we presumed to contain SO2. It is assumed that in the process of swelling the Nafion sample in water the covalent bond [OCF2CFOCF2CF2] ⎯SO3H (this bond is between carbon and sulfur atoms) is rup-tured, and SO3H- together with H+ ions are generated. In our opinion, we deal with the reaction [OCF2CFOCF2CF2]⎯SO3H + H2O ⇔ [OCF2CFOCF2CF2]⎯OH + HSO-
3 + H+. A question arises of how the covalent bond C⎯S can be ruptured in water? In our (very qualitative) opinion, it can occur because the carbon atom is also bonded with two fluorine atoms (normally to the C⎯S bond). The fluorine atoms draw back the electrons from the carbon atom. Thus the C⎯S bond is a highly polar one. Water molecule is a polar molecule as well; the presence of a water molecule close to C⎯S bond strongly affects the electronic configuration of the bond, which could result in its rupture. It is possible that swelling in water leads to the nucleophylic substitution of SO3H-group by highly reactive OH-group from water mol-ecule with the formation of H2SO3 – sul-furous acid. More comprehensive analysis should be based on a computer simulation and additional experimental studies; the re-sults of these explorations will be published elsewhere.
Study of Ionic Composition in Qualitative Reactions
First of all, we carried out qualitative color reactions with aqueous potassium perman-ganate solution as follows. A plate of Nafion (DuPont) with the area 3×2 cm2 and thick-ness 175 μm was soaked in 100 ml of water with pH = 6.7 during a day. After stabilizing the value of pH at a level of 3.8 in the bulk of the water sample, the plate was removed from the obtained acidic solution. Then some amount of potassium permanganate

WATER
WATER 4, 129 - 154, March 8th 2013 134
was added to a sample of the solution. In this case the solution color was changed due to the production of insoluble deep brown MnO3. In nearly neutral medium the polar-izing effect of water molecules is essentially weaker than that of hydronium ions, and this is why permanganate ions are polarized only slightly. In such solutions the manga-nese Mn+7 is reduced to Mn+4. We assume that it was due to the following reaction of oxidation of sulfur S+4 in SO2-3 group to S+6 in SO4
2- group:
2 MnO4- + 3 SO3
2- + 2H+ ⇒ 2 MnO2 ↓ + 3 SO4
2- + H2O.
Alternatively, to another samples of the same solution a certain amount of NaOH was added for preparing concentrated al-kaline medium, where permanganate ions MnO4
- are reduced to green manganate ions MnO4
-, containing manganese atoms in the state of oxidation +6:
2 MnO4- + SO3
2- + 2OH- ⇒ 2 MnO42- + SO4
2- +
H2O
Let us remark that we could fix the change of the solution color from pink to colorless and transparent (in the first case), brown (in the second case) or green-blue (in the third case) only after 1 day of settling the liquids with the reaction products, i.e. the rates of these reactions are rather low. We also carried out a few qualitative chemical reactions to verify the presence of sulfate anions SO4
2- in the solution produced after Nafion swelling: the reactions did not con-firm the existence of these anions. Then we constructed an electrochemical cell with copper electrodes; when the voltage was ap-plied to the electrodes, the solution became blue and the anode was covered by a layer of some substance of deep blue color. After ap-plying the voltage qualitative chemical tests for sulfate anions indicated their presence in the liquid, and therefore that blue color substance was obviously copper sulfate.
Thus it is concluded that the sulfuric acid is generated in water with Nafion plate in the presence of electric current. In addition, it is commonly known that sulfuric acid can result from the oxidation of sulfurous acid, and this oxidation reaction goes more effec-tively with electric current.
In addition to the pH-electrode a calibrated (by means of NaHSO3 solutions) ion-selec-tive electrode for SO4
2- / SO32-/ HSO3- ions
was used; since sulfate ions were definitely absent in our samples, the electrode re-sponds only to the concentration of sulfite / bisulfite-ions. We prepared liquid samples resulted from soaking the Nafion in water analogously to the experiments with the qualitative reactions. It appeared that con-centrations of both ions measured by these electrodes were fairly the same: 1.4⋅10-4 M for hydronium ions, and 1.2⋅10-4 M for an-ions. Thus we can conclude that H3O+ - ions are approximately compensated by uni-valent anions; those anions are evidently HSO3- - ions, and, assuming that the cations in the solution are solely the hydronium ions, it is not necessary to check other an-ions. This conclusion is based upon the fact that the dissociation constant of the reaction H2SO3 ⇔ H+ + HSO3- is KI = 2⋅10-2, whereas the constant of the reaction HSO3- ⇔ H+ + SO3
2- is KII = 6⋅10-8. Thus the concentration of SO3
2- - ions is several orders of magnitude less than that of HSO3- - ions.
These data persuade us that we basically deal with univalent bisulfite anions HSO-3. The bisulfite-sensing electrode operates within the temperature range 5° – 45° C; it was employed together with a thermo-electrode to introduce the temperature cor-rection of ion activity. The advantage of this ion-selective electrode with respect to pH electrode is that its measuring probe, containing porous ceramics (through this ceramics the ions penetrate inside the elec-trode) is planar and very thin: its thickness
WATER
WATER 4, 129 - 154, March 8th 2013 135
WATER
amounts to just several tens of microns. So we can measure local values of the bulk concentration of bisulfite anions inside and outside the EZ.
Study of EZ Characteristics with Ion - Se-lective Electrode
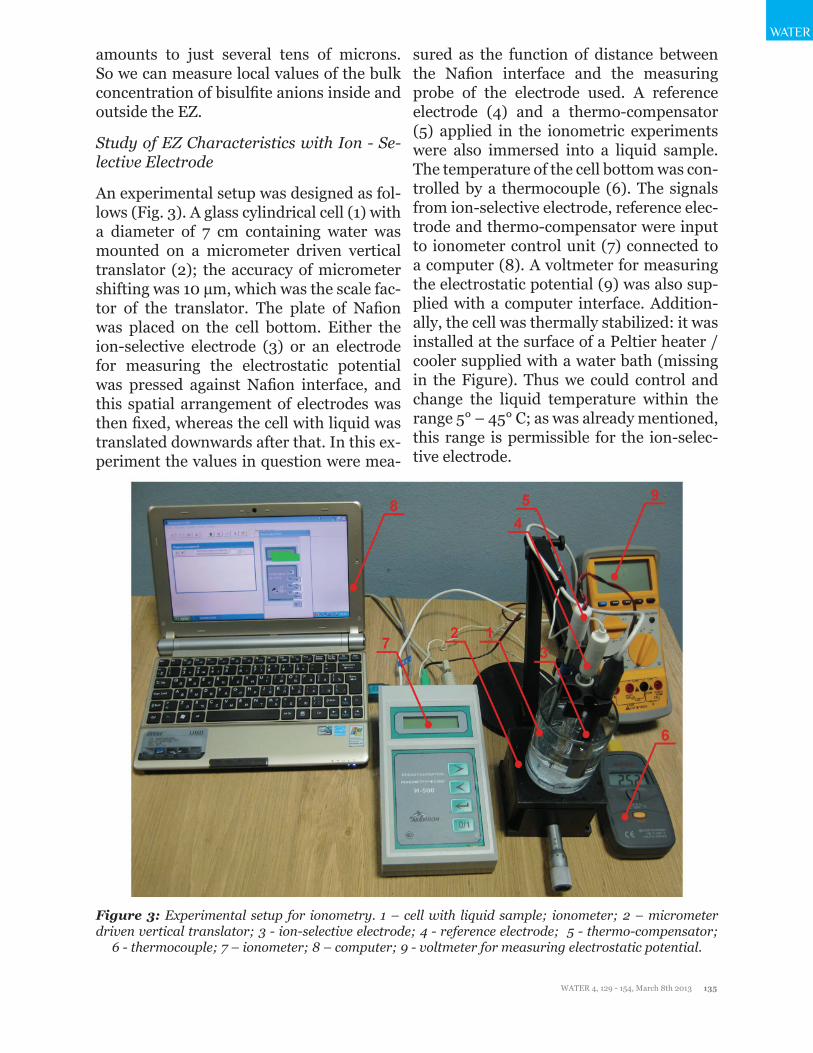
An experimental setup was designed as fol-lows (Fig. 3). A glass cylindrical cell (1) with a diameter of 7 cm containing water was mounted on a micrometer driven vertical translator (2); the accuracy of micrometer shifting was 10 μm, which was the scale fac-tor of the translator. The plate of Nafion was placed on the cell bottom. Either the ion-selective electrode (3) or an electrode for measuring the electrostatic potential was pressed against Nafion interface, and this spatial arrangement of electrodes was then fixed, whereas the cell with liquid was translated downwards after that. In this ex-periment the values in question were mea-
sured as the function of distance between the Nafion interface and the measuring probe of the electrode used. A reference electrode (4) and a thermo-compensator (5) applied in the ionometric experiments were also immersed into a liquid sample. The temperature of the cell bottom was con-trolled by a thermocouple (6). The signals from ion-selective electrode, reference elec-trode and thermo-compensator were input to ionometer control unit (7) connected to a computer (8). A voltmeter for measuring the electrostatic potential (9) was also sup-plied with a computer interface. Addition-ally, the cell was thermally stabilized: it was installed at the surface of a Peltier heater / cooler supplied with a water bath (missing in the Figure). Thus we could control and change the liquid temperature within the range 5° – 45° C; as was already mentioned, this range is permissible for the ion-selec-tive electrode.
Figure 3: Experimental setup for ionometry. 1 – cell with liquid sample; ionometer; 2 – micrometer driven vertical translator; 3 - ion-selective electrode; 4 - reference electrode; 5 - thermo-compensator;
6 - thermocouple; 7 – ionometer; 8 – computer; 9 - voltmeter for measuring electrostatic potential.
WATER
WATER 4, 129 - 154, March 8th 2013 136
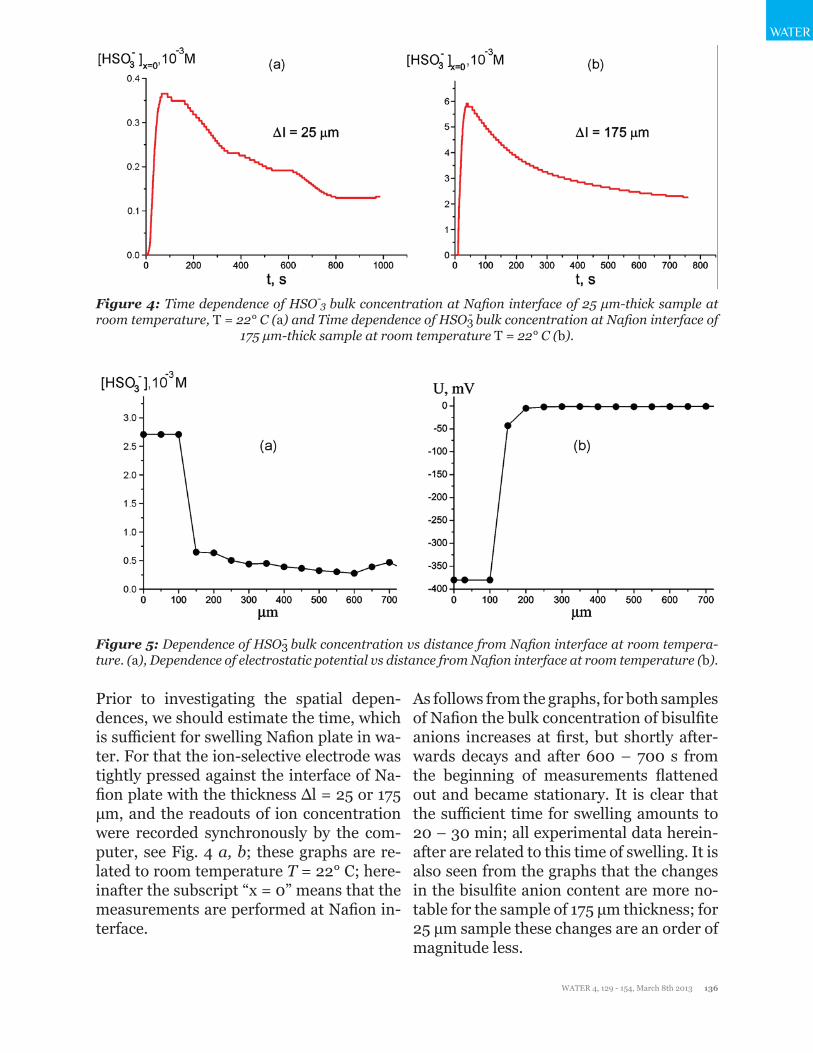
Prior to investigating the spatial depen-dences, we should estimate the time, which is sufficient for swelling Nafion plate in wa-ter. For that the ion-selective electrode was tightly pressed against the interface of Na-fion plate with the thickness Δl = 25 or 175 µm, and the readouts of ion concentration were recorded synchronously by the com-puter, see Fig. 4 a, b; these graphs are re-lated to room temperature T = 22° C; here-inafter the subscript “x = 0” means that the measurements are performed at Nafion in-terface.
As follows from the graphs, for both samples of Nafion the bulk concentration of bisulfite anions increases at first, but shortly after-wards decays and after 600 – 700 s from the beginning of measurements flattened out and became stationary. It is clear that the sufficient time for swelling amounts to 20 – 30 min; all experimental data herein-after are related to this time of swelling. It is also seen from the graphs that the changes in the bisulfite anion content are more no-table for the sample of 175 μm thickness; for 25 µm sample these changes are an order of magnitude less.
Figure 4: Time dependence of HSO-3 bulk concentration at Nafion interface of 25 μm-thick sample at room temperature, T = 22° C (а) and Time dependence of HSO3- bulk concentration at Nafion interface of
175 μm-thick sample at room temperature T = 22° C (b).
Figure 5: Dependence of HSO3- bulk concentration vs distance from Nafion interface at room tempera-ture. (а), Dependence of electrostatic potential vs distance from Nafion interface at room temperature (b).

WATER
WATER 4, 129 - 154, March 8th 2013 137
WATER
In Fig. 5 the dependencies of the bisulfite anions bulk concentration (case a), and the electrostatic potential (case b) versus the distance from Nafion interface are given.
As is seen from the graphs, the electrostat-ic potential and the bulk concentration of HSO-3 ions have a jump-like change: at a distance of about 150 µm these values ap-proach the zero level. It is important that this jump appears regardless of whether we approach to Nafion interface or move away from the interface. Thus we can assume that we deal with distinct interphase boundary. Recall that according to the results of (Chai et al. 2008a), 150 µm is just the approxi-mate size of the EZ. Thus this size can be estimated with rather high precision as the coordinate of a steep jump of the anions density and the electrostatic potential. Note that we could not discern the EZ for 25 μm thickness samples of Nafion, which is ap-parently associated with very small changes in the anion bulk concentration (see Fig. 4 a) and correspondingly an essential contri-bution of fluctuations. This is why all exper-imental results reported below are related to 175 μm samples of Nafion soaked within 25 minutes in water.
It means that we can study the EZ size as a function of temperature (anyway, within the range 5° - 45° С, see Fig. 6). The tem-perature measurements with Nafion were performed as follows: the temperature of water sample was established at 5° C, then the Nafion plate was soaked in this water, and then the temperature was increased up to 45° C, and the EZ size was measured for each temperature (the heating regime is marked by red curve and red arrow, direct-ed to higher temperature). The next series of measurements was performed at cooling water from 45° to 5° C (blue curve and blue arrow). In this series other Nafion plate was at first soaked in water at 45° C, and the temperature was decreased. The time inter-val between two neighboring temperature
points is 1 – 2 minutes; this time is required for the temperature establishing.
It is seen that the EZ size depends not only on the liquid temperature, but also on the way of achieving a particular temperature: cooling or heating. Qualitatively quite simi-lar results were obtained in measurements of the bulk concentration of HSO3- (Fig. 7 a) and the electrostatic potential (Fig. 7 b) at Nafion interface. Here, of course, it makes no sense to speak of a correlation between the temperature behavior of the EZ size and the bisulfite anions concentration. It is important that the electrostatic potential behaves like the anion content, which rein-forces our results.
As follows from the graphs in Figs. 6 and 7, water close to Nafion interface “remem-bers” the scenario of changing its tempera-ture. We should remark in this connection that dry (water-free) Nafion samples are commonly stored in our laboratory at room temperature, i.e. 22° C. A question arises of whether some peculiarities are revealed in the EZ temperature behavior, when the initial temperature would be 22° C (neither 5° nor 45° C)? In other words, can Nafion “remember” the temperature of its storage? Indeed, the so-termed “memory shape ef-fect” is generally known for dry (water-free)
Figure 6: Dependence of EZ size H vs temperature at heating (red curve and red arrow) and cooling (blue curve and blue arrow).
WATER
WATER 4, 129 - 154, March 8th 2013 138
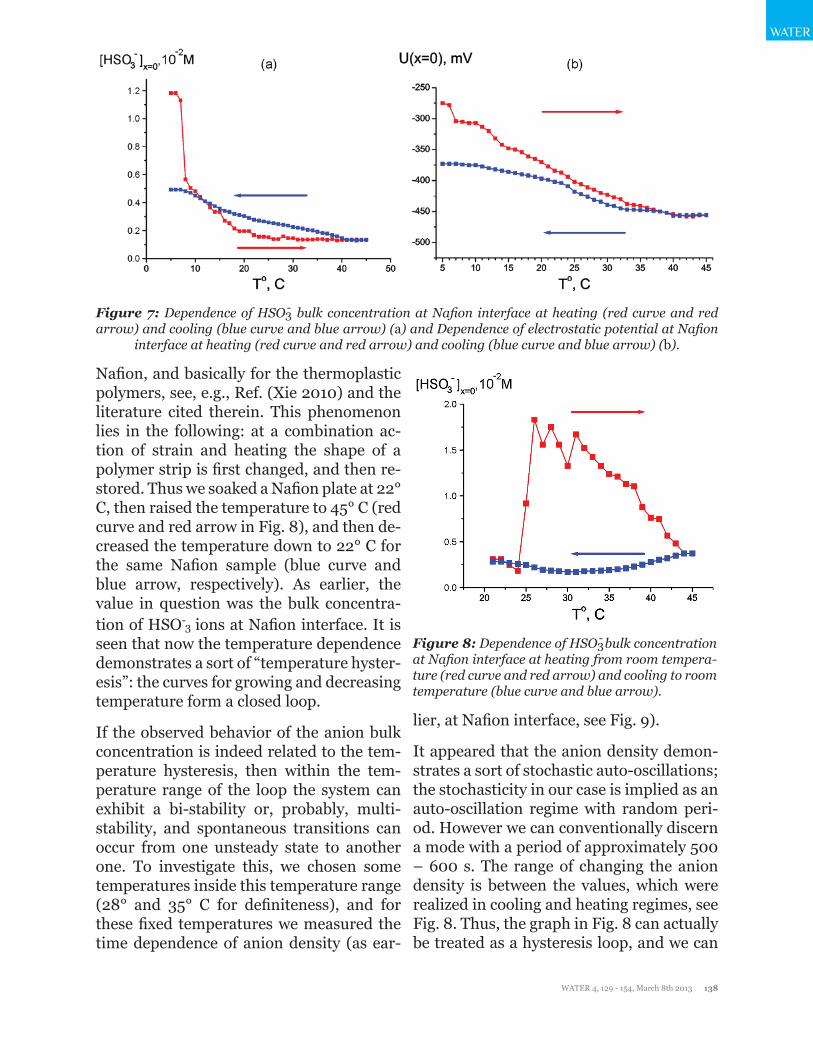
Nafion, and basically for the thermoplastic polymers, see, e.g., Ref. (Xie 2010) and the literature cited therein. This phenomenon lies in the following: at a combination ac-tion of strain and heating the shape of a polymer strip is first changed, and then re-stored. Thus we soaked a Nafion plate at 22° C, then raised the temperature to 45° C (red curve and red arrow in Fig. 8), and then de-creased the temperature down to 22° C for the same Nafion sample (blue curve and blue arrow, respectively). As earlier, the value in question was the bulk concentra-tion of HSO-3 ions at Nafion interface. It is seen that now the temperature dependence demonstrates a sort of “temperature hyster-esis”: the curves for growing and decreasing temperature form a closed loop.
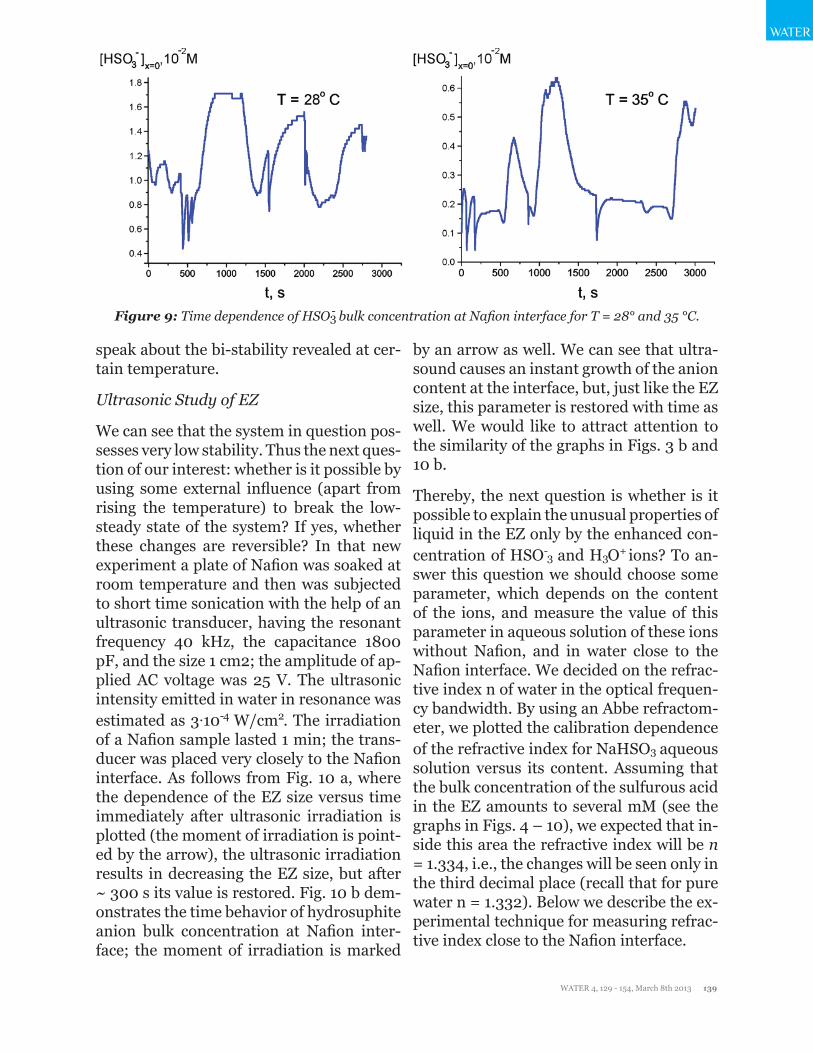
If the observed behavior of the anion bulk concentration is indeed related to the tem-perature hysteresis, then within the tem-perature range of the loop the system can exhibit a bi-stability or, probably, multi-stability, and spontaneous transitions can occur from one unsteady state to another one. To investigate this, we chosen some temperatures inside this temperature range (28° and 35° C for definiteness), and for these fixed temperatures we measured the time dependence of anion density (as ear-
lier, at Nafion interface, see Fig. 9).
It appeared that the anion density demon-strates a sort of stochastic auto-oscillations; the stochasticity in our case is implied as an auto-oscillation regime with random peri-od. However we can conventionally discern a mode with a period of approximately 500 – 600 s. The range of changing the anion density is between the values, which were realized in cooling and heating regimes, see Fig. 8. Thus, the graph in Fig. 8 can actually be treated as a hysteresis loop, and we can
Figure 7: Dependence of HSO3- bulk concentration at Nafion interface at heating (red curve and red arrow) and cooling (blue curve and blue arrow) (а) and Dependence of electrostatic potential at Nafion
interface at heating (red curve and red arrow) and cooling (blue curve and blue arrow) (b).
Figure 8: Dependence of HSO3- bulk concentration at Nafion interface at heating from room tempera-ture (red curve and red arrow) and cooling to room temperature (blue curve and blue arrow).
WATER
WATER 4, 129 - 154, March 8th 2013 139
WATER
speak about the bi-stability revealed at cer-tain temperature.
Ultrasonic Study of EZ
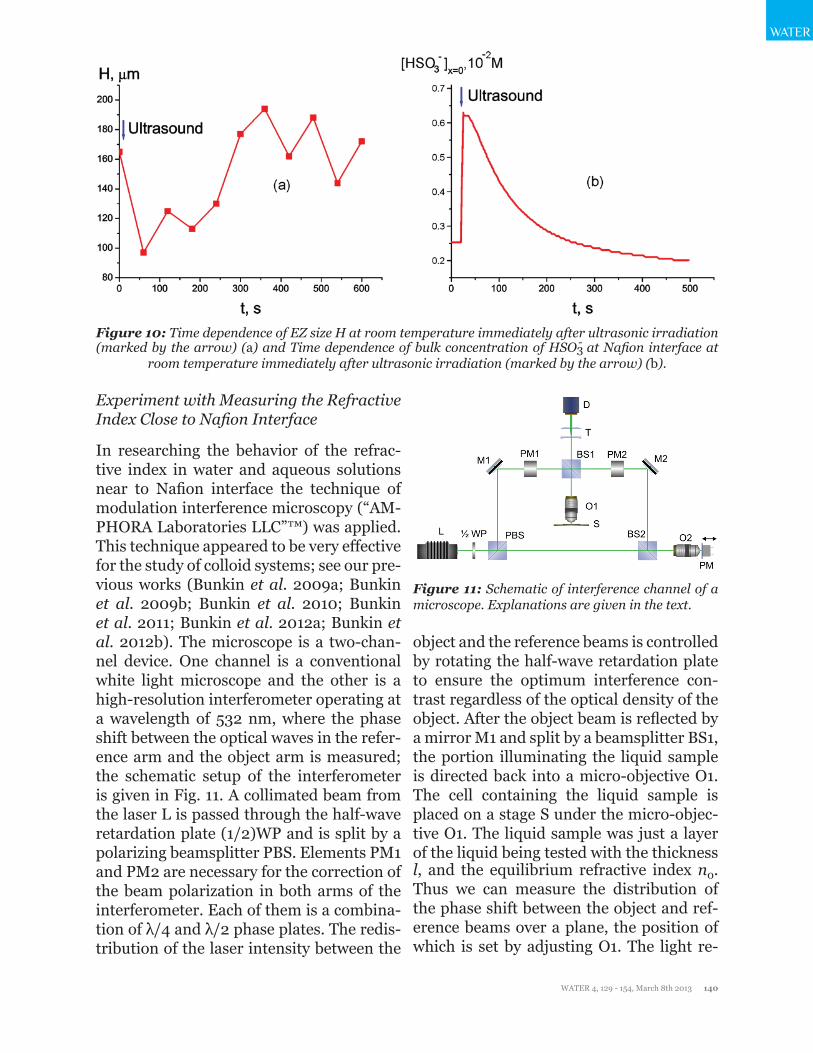
We can see that the system in question pos-sesses very low stability. Thus the next ques-tion of our interest: whether is it possible by using some external influence (apart from rising the temperature) to break the low-steady state of the system? If yes, whether these changes are reversible? In that new experiment a plate of Nafion was soaked at room temperature and then was subjected to short time sonication with the help of an ultrasonic transducer, having the resonant frequency 40 kHz, the capacitance 1800 pF, and the size 1 cm2; the amplitude of ap-plied AC voltage was 25 V. The ultrasonic intensity emitted in water in resonance was estimated as 3⋅10-4 W/cm2. The irradiation of a Nafion sample lasted 1 min; the trans-ducer was placed very closely to the Nafion interface. As follows from Fig. 10 a, where the dependence of the EZ size versus time immediately after ultrasonic irradiation is plotted (the moment of irradiation is point-ed by the arrow), the ultrasonic irradiation results in decreasing the EZ size, but after ~ 300 s its value is restored. Fig. 10 b dem-onstrates the time behavior of hydrosuphite anion bulk concentration at Nafion inter-face; the moment of irradiation is marked
by an arrow as well. We can see that ultra-sound causes an instant growth of the anion content at the interface, but, just like the EZ size, this parameter is restored with time as well. We would like to attract attention to the similarity of the graphs in Figs. 3 b and 10 b.
Thereby, the next question is whether is it possible to explain the unusual properties of liquid in the EZ only by the enhanced con-centration of HSO-3 and H3O+ ions? To an-swer this question we should choose some parameter, which depends on the content of the ions, and measure the value of this parameter in aqueous solution of these ions without Nafion, and in water close to the Nafion interface. We decided on the refrac-tive index n of water in the optical frequen-cy bandwidth. By using an Abbe refractom-eter, we plotted the calibration dependence of the refractive index for NaHSO3 aqueous solution versus its content. Assuming that the bulk concentration of the sulfurous acid in the EZ amounts to several mM (see the graphs in Figs. 4 – 10), we expected that in-side this area the refractive index will be n = 1.334, i.e., the changes will be seen only in the third decimal place (recall that for pure water n = 1.332). Below we describe the ex-perimental technique for measuring refrac-tive index close to the Nafion interface.
Figure 9: Time dependence of HSO3- bulk concentration at Nafion interface for T = 28° and 35 °C.
WATER
WATER 4, 129 - 154, March 8th 2013 140
Experiment with Measuring the Refractive Index Close to Nafion Interface
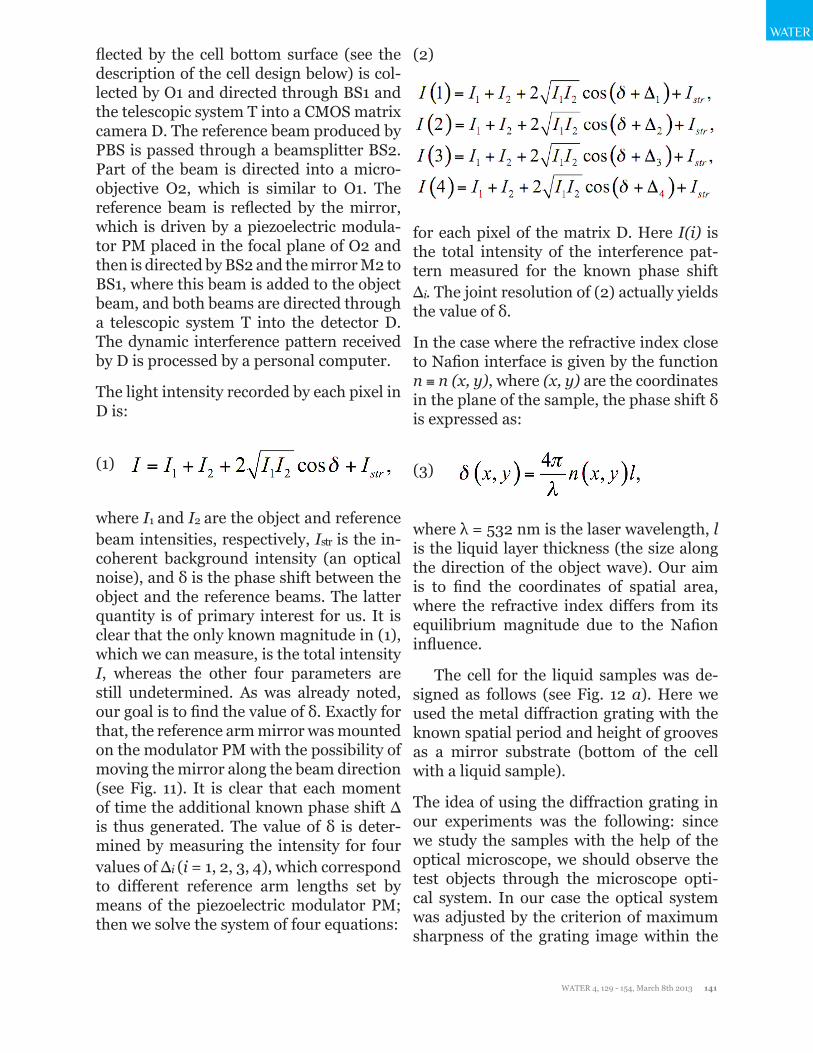
In researching the behavior of the refrac-tive index in water and aqueous solutions near to Nafion interface the technique of modulation interference microscopy (“AM-PHORA Laboratories LLC”™) was applied. This technique appeared to be very effective for the study of colloid systems; see our pre-vious works (Bunkin et al. 2009a; Bunkin et al. 2009b; Bunkin et al. 2010; Bunkin et al. 2011; Bunkin et al. 2012a; Bunkin et al. 2012b). The microscope is a two-chan-nel device. One channel is a conventional white light microscope and the other is a high-resolution interferometer operating at a wavelength of 532 nm, where the phase shift between the optical waves in the refer-ence arm and the object arm is measured; the schematic setup of the interferometer is given in Fig. 11. A collimated beam from the laser L is passed through the half-wave retardation plate (1/2)WP and is split by a polarizing beamsplitter PBS. Elements PM1 and PM2 are necessary for the correction of the beam polarization in both arms of the interferometer. Each of them is a combina-tion of λ/4 and λ/2 phase plates. The redis-tribution of the laser intensity between the
object and the reference beams is controlled by rotating the half-wave retardation plate to ensure the optimum interference con-trast regardless of the optical density of the object. After the object beam is reflected by a mirror M1 and split by a beamsplitter BS1, the portion illuminating the liquid sample is directed back into a micro-objective O1. The cell containing the liquid sample is placed on a stage S under the micro-objec-tive O1. The liquid sample was just a layer of the liquid being tested with the thickness l, and the equilibrium refractive index n0. Thus we can measure the distribution of the phase shift between the object and ref-erence beams over a plane, the position of which is set by adjusting O1. The light re-
Figure 10: Time dependence of EZ size H at room temperature immediately after ultrasonic irradiation (marked by the arrow) (а) and Time dependence of bulk concentration of HSO3- at Nafion interface at
room temperature immediately after ultrasonic irradiation (marked by the arrow) (b).
Figure 11: Schematic of interference channel of a microscope. Explanations are given in the text.
WATER
WATER 4, 129 - 154, March 8th 2013 141
WATER
flected by the cell bottom surface (see the description of the cell design below) is col-lected by O1 and directed through BS1 and the telescopic system T into a CMOS matrix camera D. The reference beam produced by PBS is passed through a beamsplitter BS2. Part of the beam is directed into a micro-objective O2, which is similar to O1. The reference beam is reflected by the mirror, which is driven by a piezoelectric modula-tor PM placed in the focal plane of O2 and then is directed by BS2 and the mirror M2 to BS1, where this beam is added to the object beam, and both beams are directed through a telescopic system T into the detector D. The dynamic interference pattern received by D is processed by a personal computer.
The light intensity recorded by each pixel in D is:
(1)
where I1 and I2 are the object and reference beam intensities, respectively, Istr is the in-coherent background intensity (an optical noise), and δ is the phase shift between the object and the reference beams. The latter quantity is of primary interest for us. It is clear that the only known magnitude in (1), which we can measure, is the total intensity I, whereas the other four parameters are still undetermined. As was already noted, our goal is to find the value of δ. Exactly for that, the reference arm mirror was mounted on the modulator РМ with the possibility of moving the mirror along the beam direction (see Fig. 11). It is clear that each moment of time the additional known phase shift Δ is thus generated. The value of δ is deter-mined by measuring the intensity for four values of Δi (i = 1, 2, 3, 4), which correspond to different reference arm lengths set by means of the piezoelectric modulator PM; then we solve the system of four equations:
(2)
for each pixel of the matrix D. Here I(i) is the total intensity of the interference pat-tern measured for the known phase shift Δi. The joint resolution of (2) actually yields the value of δ.
In the case where the refractive index close to Nafion interface is given by the function n ≡ n (x, y), where (x, y) are the coordinates in the plane of the sample, the phase shift δ is expressed as:
(3)
where λ = 532 nm is the laser wavelength, l is the liquid layer thickness (the size along the direction of the object wave). Our aim is to find the coordinates of spatial area, where the refractive index differs from its equilibrium magnitude due to the Nafion influence.
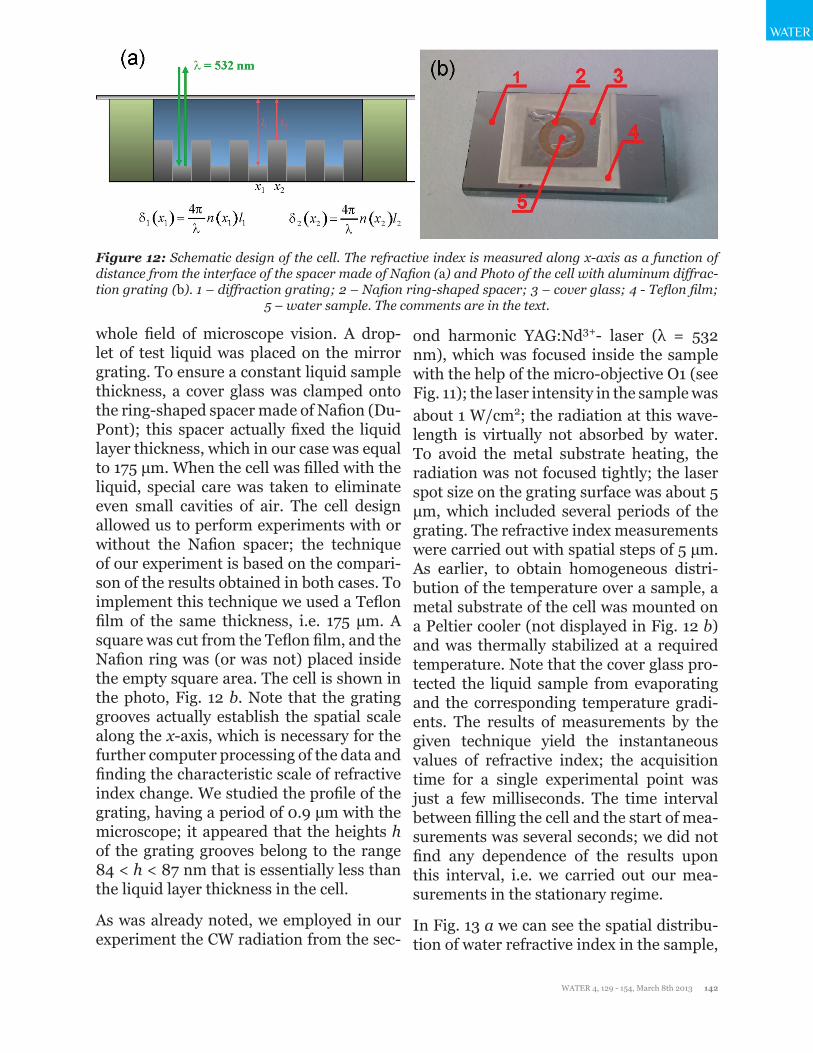
The cell for the liquid samples was de-signed as follows (see Fig. 12 a). Here we used the metal diffraction grating with the known spatial period and height of grooves as a mirror substrate (bottom of the cell with a liquid sample).
The idea of using the diffraction grating in our experiments was the following: since we study the samples with the help of the optical microscope, we should observe the test objects through the microscope opti-cal system. In our case the optical system was adjusted by the criterion of maximum sharpness of the grating image within the
WATER
WATER 4, 129 - 154, March 8th 2013 142
whole field of microscope vision. A drop-let of test liquid was placed on the mirror grating. To ensure a constant liquid sample thickness, a cover glass was clamped onto the ring-shaped spacer made of Nafion (Du-Pont); this spacer actually fixed the liquid layer thickness, which in our case was equal to 175 μm. When the cell was filled with the liquid, special care was taken to eliminate even small cavities of air. The cell design allowed us to perform experiments with or without the Nafion spacer; the technique of our experiment is based on the compari-son of the results obtained in both cases. To implement this technique we used a Teflon film of the same thickness, i.e. 175 μm. A square was cut from the Teflon film, and the Nafion ring was (or was not) placed inside the empty square area. The cell is shown in the photo, Fig. 12 b. Note that the grating grooves actually establish the spatial scale along the x-axis, which is necessary for the further computer processing of the data and finding the characteristic scale of refractive index change. We studied the profile of the grating, having a period of 0.9 μm with the microscope; it appeared that the heights h of the grating grooves belong to the range 84 < h < 87 nm that is essentially less than the liquid layer thickness in the cell.
As was already noted, we employed in our experiment the CW radiation from the sec-
ond harmonic YAG:Nd3+- laser (λ = 532 nm), which was focused inside the sample with the help of the micro-objective O1 (see Fig. 11); the laser intensity in the sample was about 1 W/cm2; the radiation at this wave-length is virtually not absorbed by water. To avoid the metal substrate heating, the radiation was not focused tightly; the laser spot size on the grating surface was about 5 μm, which included several periods of the grating. The refractive index measurements were carried out with spatial steps of 5 μm. As earlier, to obtain homogeneous distri-bution of the temperature over a sample, a metal substrate of the cell was mounted on a Peltier cooler (not displayed in Fig. 12 b) and was thermally stabilized at a required temperature. Note that the cover glass pro-tected the liquid sample from evaporating and the corresponding temperature gradi-ents. The results of measurements by the given technique yield the instantaneous values of refractive index; the acquisition time for a single experimental point was just a few milliseconds. The time interval between filling the cell and the start of mea-surements was several seconds; we did not find any dependence of the results upon this interval, i.e. we carried out our mea-surements in the stationary regime.
In Fig. 13 a we can see the spatial distribu-tion of water refractive index in the sample,
Figure 12: Schematic design of the cell. The refractive index is measured along x-axis as a function of distance from the interface of the spacer made of Nafion (а) and Photo of the cell with aluminum diffrac-tion grating (b). 1 – diffraction grating; 2 – Nafion ring-shaped spacer; 3 – cover glass; 4 - Teflon film;
5 – water sample. The comments are in the text.

WATER
WATER 4, 129 - 154, March 8th 2013 143
WATER
free of the Nafion spacer; the point of origin along the abscissa axis was chosen arbitrari-ly. The results given hereinafter are related to the aluminum grating. This graph does not exhibit any peculiarities; the refractive index is n0 = 1.33 within the whole spatial area. Slight deviations from this value are about 7⋅10-3 and associated with the scat-ter of heights of the grating grooves. It can be seen that in the absence of the Nafion spacer the refractive index of water on the average takes on the value corresponding to the reference data. Thus, our setup can be considered as calibrated very well. In Fig. 13 b the spatial distribution of water refractive index is shown, but now the Nafion spacer is inside the cell; the point of origin is re-lated to the Nafion border.
We should emphasize that now the concept of “interface” is of a conventional character; we could not approach that interface nearer than the size of laser spot on the substrate. As follows from the graph, at Nafion inter-face the refractive index is n⎮x=0 = 1.46 ≈ 1.1n0; at higher distances from the interface the refractive index decreases and takes on its equilibrium value n0 at the distance of ap-proximately X = 50 μm. We should remark that for good reproducibility of results it ap-
peared necessary to fix the substrate tem-perature and the pH value of liquid. For the given graph the temperature and pH were equal to 22° С and 6.7, respectively. We also performed the following experiment: the Nafion ring within 20 min was subjected to swelling in water, where we have observed the refractive index growth. Then the ring was taken out of this water and placed into the cell with new water, which initially had no contact with the Nafion ring. The effect was completely reproduced for that new water. Note that the growth of n cannot be associated with releasing sulfurous acid in water close to Nafion interface. Recall that the increase of n in that case would be very small. This is why we do not account for this mechanism as the possible one for growing n close to Nafion.
Study of Optical Anisotropy of EZ.
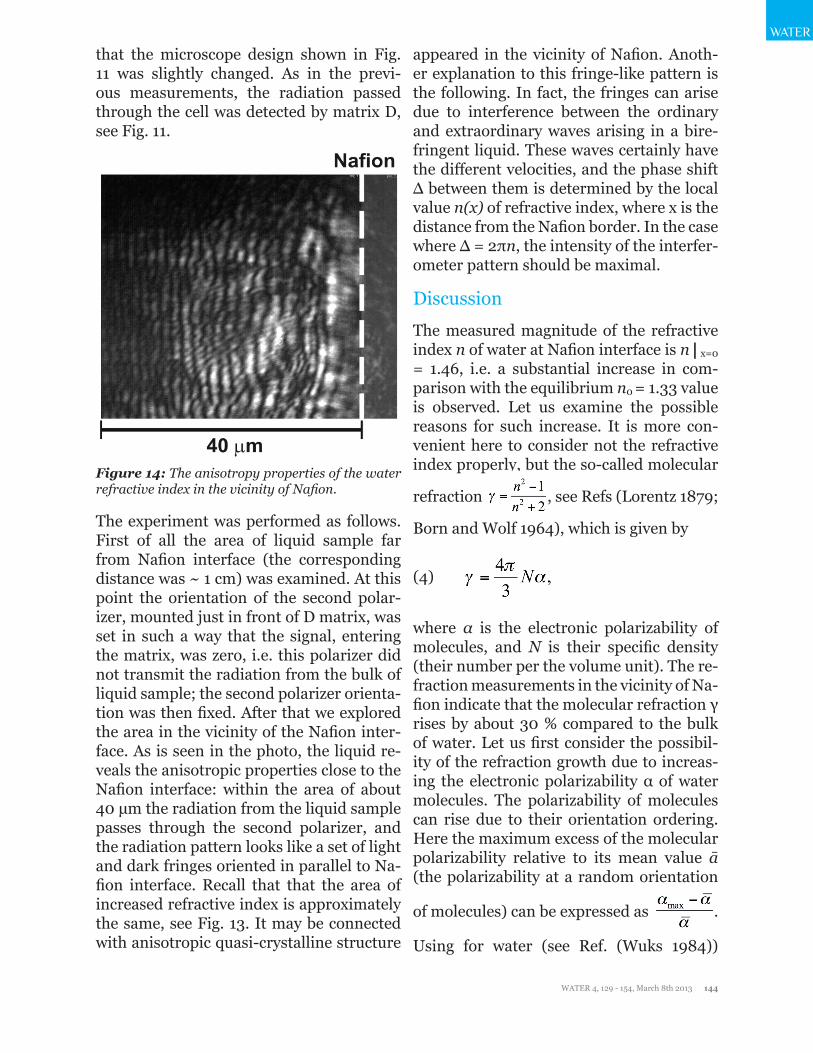
We also explored the anisotropic properties of the refractive index of water in the vicin-ity of Nafion; see photo in Fig. 14. In this experiment a cell with liquid was complete-ly transparent for an incident optical radia-tion. The ring of Nafion of 175 μm thickness, as earlier, was used as a spacer in the cell. The cell was placed between two crossed polarizers in the microscope scheme; for
Figure 13: Spatial distribution of the refractive index of water without the Nafion spacer (а) and Refrac-tive index of water as a function of distance from Nafion interface (b).
WATER
WATER 4, 129 - 154, March 8th 2013 144
that the microscope design shown in Fig. 11 was slightly changed. As in the previ-ous measurements, the radiation passed through the cell was detected by matrix D, see Fig. 11.
appeared in the vicinity of Nafion. Anoth-er explanation to this fringe-like pattern is the following. In fact, the fringes can arise due to interference between the ordinary and extraordinary waves arising in a bire-fringent liquid. These waves certainly have the different velocities, and the phase shift Δ between them is determined by the local value n(x) of refractive index, where x is the distance from the Nafion border. In the case where Δ = 2πn, the intensity of the interfer-ometer pattern should be maximal.
DiscussionThe measured magnitude of the refractive index n of water at Nafion interface is n⎮x=0
= 1.46, i.e. a substantial increase in com-parison with the equilibrium n0 = 1.33 value is observed. Let us examine the possible reasons for such increase. It is more con-venient here to consider not the refractive index properly, but the so-called molecular
refraction , see Refs (Lorentz 1879;
Born and Wolf 1964), which is given by
(4)
where α is the electronic polarizability of molecules, and N is their specific density (their number per the volume unit). The re-fraction measurements in the vicinity of Na-fion indicate that the molecular refraction γ rises by about 30 % compared to the bulk of water. Let us first consider the possibil-ity of the refraction growth due to increas-ing the electronic polarizability α of water molecules. The polarizability of molecules can rise due to their orientation ordering. Here the maximum excess of the molecular polarizability relative to its mean value ā (the polarizability at a random orientation
of molecules) can be expressed as .
Using for water (see Ref. (Wuks 1984))
Figure 14: The anisotropy properties of the water refractive index in the vicinity of Nafion.
The experiment was performed as follows. First of all the area of liquid sample far from Nafion interface (the corresponding distance was ~ 1 cm) was examined. At this point the orientation of the second polar-izer, mounted just in front of D matrix, was set in such a way that the signal, entering the matrix, was zero, i.e. this polarizer did not transmit the radiation from the bulk of liquid sample; the second polarizer orienta-tion was then fixed. After that we explored the area in the vicinity of the Nafion inter-face. As is seen in the photo, the liquid re-veals the anisotropic properties close to the Nafion interface: within the area of about 40 µm the radiation from the liquid sample passes through the second polarizer, and the radiation pattern looks like a set of light and dark fringes oriented in parallel to Na-fion interface. Recall that that the area of increased refractive index is approximately the same, see Fig. 13. It may be connected with anisotropic quasi-crystalline structure
WATER
WATER 4, 129 - 154, March 8th 2013 145
WATER
ā=1.47⋅10-24cm3 and amax=1.66⋅10-24cm3, we
arrive at ≈0.13 .
It should be remarked that this is an upper estimate, since such polarizability growth is possible only at the total orientation order-ing of all molecules, and the polarization of optical radiation is appropriate. This is why this mechanism is not capable of enhancing the molecular refraction by more than 13 % and hence cannot explain the 30 % increase observed by us. We should note however that the orientation mechanism is certainly revealed in our experiments; the data on the anisotropic properties of the refractive index close to Nafion interface (see Fig. 13) can be in part interpreted in favor of the orientation mechanism. The polarizability growth by tens per cent due to the change of intermolecular interaction in the vicinity of Nafion is apparently impossible as well. According to our estimations, the electronic polarizability α increases only slightly (of about 1 % or less) at the phase transitions from liquid water to a solid (for example, to the ice Ih), which is accompanied by a sig-nificant change of effective field of the in-termolecular interaction. Finally, the pos-sible reason for the polarizability increase is a change of structure of the substance, for example, due to essential ionization of the water in the layer adjacent to Nafion inter-face. The polarizability of ions strongly dif-fers from that of their parent molecules. For instance, the average polarizability of OH--ion is almost by 40 % higher than that of water molecule (Bazanov 1976). However the contribution of this mechanism plays a noticeable role only at high degrees of ionization within the near-interface layer of size ∆x≥10 μm, which is evidently unat-tainable in our conditions. Indeed, as was already mentioned, non-essential growth of the ionic content cannot be a reason for increasing n close to Nafion. Thus the only reason for the refractive index increase is the growth of density of molecules N close
to Nafion interface. The density of mole-cules can rise up due to possible dissolution of Nafion in water. However, as was shown in (Pantelic et al. 2005), within a spectral range of 500 – 600 nm the refractive index of dry (water-free) Nafion is approximately 1.36, i.e. less than 1.46, and in the process of swelling in water (with n = 1.332) this value should decrease. Thus the refractive index can grow only due to increasing the water molecules density. It is clear however, that such density cannot be increased in a sim-ple way, since water is practically incom-pressible. Indeed, as is known (Vedam and Limsuwan 1975), to increase the refractive index of water at the wavelength λ = 589 nm by the value Δn = 0.0821 (recall that in our case we have Δn = 0.13), it is necessary to apply a pressure of about 104 Atm. In addi-tion, such a huge pressure obviously could not appear in our experiment, since the cell with the liquid sample would be destroyed under that pressure.
A question arises of when the density of wa-ter molecules can be increased? As far as we know, the water density can be enhanced within the protein hydration shell, see Ref. (Svergun et al. 1998); note that protein is essentially hydrophilic. The results of this study point to the existence of first hydra-tion shell with an average density approxi-mately 10% larger than that of the bulk wa-ter. At the same time, the characteristic size of the first hydration shell is many orders of magnitude less than the area of chang-ing the refractive index. In this connection we would like to suggest the following inter-pretation of the experimental data reported here.
We can see that the system under study, on the one hand, should be characterized by growth of water molecules density, i.e. the system could consist of highly hydrated hy-drophilic particles. On the other hand, the system does not demonstrate high stability. Indeed, the regime of stochastic auto-oscil-
WATER
WATER 4, 129 - 154, March 8th 2013 146
lations in certain temperature range (Fig. 9), and the fact that the equilibrium of the system can be easily broken by the irradia-tion of moderate ultrasonic wave (Fig. 10) are explicit evidence for very low stability of the system. It is known that certain physi-cal systems are in fact characterized by very shallow potential well. Among these, for example, the so-termed colloidal crystals: negatively charged microspheres of mono-disperse Polystyrene latex can form such crystals in highly deionized water (see, e.g., (Aastuen et al. 1986; Murray et al. 1990a; Murray et al. 1990b; van Winkle and Mur-ray 1986; van Winkle and Murray 1988; van Winkle and Murray 1987)). The po-tential well depth for two neighboring like-charged microspheres was calculated in Ref. (Squires and Brenner 2000); as follows from this study, this depth is about kT, i.e. the colloidal crystal can be destroyed just by a slight heating. In our opinion, the struc-ture of the Exclusion zone, adjacent to the Nafion interface in water, is quite similar to colloidal crystal.
As is known (Gebel 2000), rod-like nega-tively charged colloidal particles are formed in Nafion, swollen in water. In our opinion, such rods can be packed with a certain or-der, similar to the colloidal crystal struc-ture, just because the like-charged particles can form spatially stable structure only pro-vided that they have a crystalline packing. Indirect evidence in favor of that hypoth-esis is the following. As was obtained in the study (Chai et al. 2008b), water inside the EZ absorbs radiation in the near UV range; the absorption band is centered at 270 nm, and the peak intensity grows with reducing the distance between the UV beam and the Nafion interface (the UV beam probes the EZ parallel to the interface). Additionally, in that work it was shown that the EZ, pumped by the radiation of this wavelength, emits the low-intensity light (normal to the inter-face), and the wavelength of this lumines-cence depends upon the distance between
the UV beam and the interface. At the same time, it is known that water basically does not absorb this wavelength, see, e.g., (Web ref.1). Furthermore, dry (water-free) Nafion does not absorb that radiation as well (Park et al. 2009). We assume the formation of the so-termed photonic crystals (Yablono-vitch 1987; John 1987; Joannopoulos et al. 2008) to be the only reason for the trans-mittance reduction in the EZ.
Indeed, let us imagine that in a one-dimen-sion case an incident optical wave ei(wt-kz)
propagating along a crystal in Z-direction, interacts with the crystalline lattice, whose refractive index can be represented as n(z)= no (1+μ sin(qz)) where q is the inverse lattice vector, q = 2π/a, a is the lattice parameter (in our case it is the distance between the crystalline planes), and μ < 1 is the depth of spatial modulation of the refractive index (n0 is the average value of the refractive in-dex). In the case where a=λ/2 i.e. q = 2k, the opposite optical wave ei(wt+kz) is effec-tively generated, and we actually deal with a standing optical wave inside the crystal; such crystal is termed as a photonic crystal. In fact, a=λ/2 is the basic condition for the generation of standing wave. The opposite wave ei(wt+kz) is induced at the expense of the depletion of the incident wave ei(wt-kz) thus the intensity of light, coming out of the pho-tonic crystal, is about zero. It is clear that such photonic crystal should not transmit the radiation at a wavelength of 270 nm if a = 135 nm; we assume it was the main reason of the effect observed in (Chai et al. 2008b). An additional ground for the assumption is that the luminescence wavelength depends on the distance between the Nafion interface and the UV beam, which can be a manifes-tation of certain interferometric phenom-ena. Bearing in mind the results of (Chai et al. 2008b), according to our estimates the depletion length (the length of the energy transformation from the wave ei(wt-kz) to the wave ei(wt+kz)) is ~ 103/μ nm. Being a sort of
WATER
WATER 4, 129 - 154, March 8th 2013 147
WATER
distributed mirror, the photonic crystal ef-fectively emits (reflects) the opposite wave ei(wt+kz). It is thus easy to verify the hypoth-esis of photonic crystal formation in the EZ by investigating the spectral density of the radiation reflected from the EZ. Currently, we are carrying out these experiments; the results will be published elsewhere.
It is very important that here we do not deal with a real process of the light absorption: appropriate energy levels for the absorption of the photons of incident light do not exist. In fact, the standing wave is characterized by infinite phase velocity and zero group ve-locity (the light energy is not transferred by the standing wave), and such photons are just “captured” by the photonic crystal. It is also important that the photonic crystal ef-fect is completely linear (and resonant): for capturing the incident photons, high inten-sity of the incident light is not required. In our opinion, the mechanism of the photonic crystal formation should be taken into ac-count in the study of light energy accumu-lation by living systems, bearing in mind that a biological tissue can be treated as an ordered array of cylinders (it is especially adequate for the epithelial tissue). We as-sume that the incident photons can indeed be accumulated by a tissue, and the density of photons grows inside the tissue (in accor-dance with the Bose – Einstein law) during the illumination. The next question is just how the photonic crystal is formed in the EZ?
As is known, the interface of Nafion in wa-ter is negatively charged by R⎯SO3- groups. The interface consists of the tangles of poly-meric chains; in fact, it is the chains that contain negative sites. At the same time, an important peculiarity of such polymeric chains is that the chains are strongly bound with the Nafion interface and cannot be completely torn off the negatively charged interface. Thus the chains are subjected to the repulsive Coulomb force from the in-
terface, and the chains disentangle from the interface towards the bulk of water nor-mally to the interface and in parallel to one another, thus forming negatively charged elongated rod-like particles in the liquid adjacent to the interface; we believe, the rod-like particles mentioned in Ref. (Gebel 2000) and the rods hypothesized here are basically the same entities, but in our case the rods are thought to be attached to the interface. An additional argument in favor of this hypothesis is that the GISAXS and AFM experiments with Nafion swollen in water show (Bass et al. 2011) that the bun-dles of such rod-like particles are oriented predominantly normal to the water – Na-fion interface (contrary to the case when Nafion contacts water vapor). The effective distance between these like-charged rods is, by our assumption, is ~ 130 nm (see above), and these rods should effectively repulse one another (similar to microspheres of a colloi-dal crystal). It is clear that the rods should be nearly straight and should not have any bends or loops; otherwise the gradient of repulsive Coulomb force would arise, re-sulting in disappearance of the bend. Thus we can say that we basically deal with the two-dimension photonic crystal, formed by like-charged rods (the degeneracy takes place along the rods, and therefore the crys-tal is two-dimension); the spatial period of that crystal is ~ 130 nm. The dipolar water molecules are attracted to the rods; the pos-itive pole of water molecule is attracted to the negative site of a rod. Thus the density of water molecules in these hydration lay-ers should be increased in comparison with the bulk water, which qualitatively explains the refractive index growth in this area (see Fig. 13 b). The HSO3- and Н3О+ ions emerg-ing as a result of local electrolytic dissocia-tion of H2SO3 ⇔ HSO3- + H+ and R⎯HSO3 ⇔ R⎯SO3- + H+ (see above) should be local-ized very close to the rods (we should keep in mind the deficiency of the free space be-tween the rods). Additionally, the densities
WATER
WATER 4, 129 - 154, March 8th 2013 148
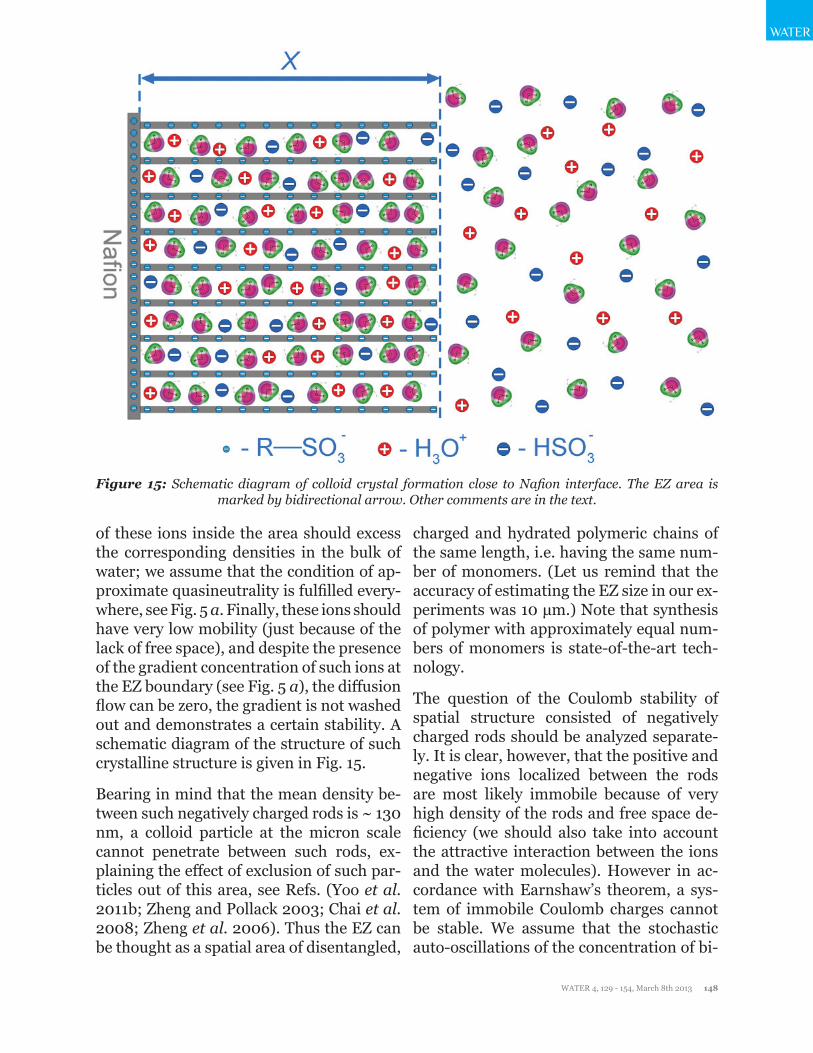
of these ions inside the area should excess the corresponding densities in the bulk of water; we assume that the condition of ap-proximate quasineutrality is fulfilled every-where, see Fig. 5 a. Finally, these ions should have very low mobility (just because of the lack of free space), and despite the presence of the gradient concentration of such ions at the EZ boundary (see Fig. 5 a), the diffusion flow can be zero, the gradient is not washed out and demonstrates a certain stability. A schematic diagram of the structure of such crystalline structure is given in Fig. 15.
Bearing in mind that the mean density be-tween such negatively charged rods is ~ 130 nm, a colloid particle at the micron scale cannot penetrate between such rods, ex-plaining the effect of exclusion of such par-ticles out of this area, see Refs. (Yoo et al. 2011b; Zheng and Pollack 2003; Chai et al. 2008; Zheng et al. 2006). Thus the EZ can be thought as a spatial area of disentangled,
charged and hydrated polymeric chains of the same length, i.e. having the same num-ber of monomers. (Let us remind that the accuracy of estimating the EZ size in our ex-periments was 10 μm.) Note that synthesis of polymer with approximately equal num-bers of monomers is state-of-the-art tech-nology.
The question of the Coulomb stability of spatial structure consisted of negatively charged rods should be analyzed separate-ly. It is clear, however, that the positive and negative ions localized between the rods are most likely immobile because of very high density of the rods and free space de-ficiency (we should also take into account the attractive interaction between the ions and the water molecules). However in ac-cordance with Earnshaw’s theorem, a sys-tem of immobile Coulomb charges cannot be stable. We assume that the stochastic auto-oscillations of the concentration of bi-
Figure 15: Schematic diagram of colloid crystal formation close to Nafion interface. The EZ area is marked by bidirectional arrow. Other comments are in the text.
WATER
WATER 4, 129 - 154, March 8th 2013 149
WATER
sulfite anions appeared with a low increase of temperature (Fig. 9) can be considered as a manifestation of such Coulomb instability (similar to the Langmuir auto-oscillations of the electron density in plasma). Further-more, very low-intensity ultrasonic irradia-tion can break the system stability as well (Fig. 10). It is clear that such faint ultrason-ic wave cannot result in the cavitation effect in water, but in our case ultrasonic wave can affect the mutual spatial arrangement of immobile (by our assumption) negative and positive charges suspended in the EZ, which can basically break the Coulomb sta-bility of the system. However, this question requires a special analysis. Currently, we are investigating the ultrasonic effects; here we vary frequency, intensity, temperature and the time of ultrasonic irradiation. The results of this study will be published else-where.
Let us note that the system in question is ob-viously anisotropic and should exhibit the birefringence properties; it is also known that dry Nafion films are birefringent (Van Der Heijden et al. 2004). Finally, it is clear that the disentangling effect is controlled by spatial characteristics of electrostatic field generated at the interface; if (as was in the ionometry experiments) we deal with elongated planar interface, the electrostatic field is completely homogeneous (at least far from the edges of a Nafion plate). At the same time, if Nafion contacts water within a narrow strip (as was in the refracrtometry experiments, where the thickness of Nafion spacer was only 175 μm), the electrostatic field cannot anymore be considered as a ho-mogeneous one. Probably this is the reason for difference in the spatial scales found out in those experiments: 150 μm in the first case, and 50 µm in the second case. In the framework of this model we can explain the experimental results, according to which the effects of changing the bulk concentration of bisulfite anions are revealed differently for the Nafion samples of the thicknesses
175 and 25 μm; see Fig. 3 a, b. Indeed, in the case where EZ formation is controlled only by the hydrophilic properties of Nafion interface, the sample thickness should not play a role. At the same time, if the regime of swelling is critical for the EZ formation, the bulk characteristics of Nafion sample (in particular, its thickness) become impor-tant.
Summarizing, in our opinion that the medi-um inside the EZ can be characterized as an ordered phase (by our assumption, it is very special type of photonic crystal, in which the rod-like charged particles are attached to the interface), whereas the liquid outside the EZ is a disordered phase. The inter-phase boundary is revealed as a steep jump of the concentration of anions and electro-static potential (Fig. 5). According to our estimates, the bisulfite concentration in the ordered phase is approximately six times higher than that in the disordered phase, see Fig. 5 a. Note that the temperature hys-teresis loop (Fig. 8), and the amplitude of stochastic auto-oscillations (Fig. 9) are also related to a sixfold change in the concentra-tion. Thus we can assume that the upper branch of the hysteresis loop can be asso-ciated with the ordered phase, whereas the low branch corresponds to the disordered phase, and the regime of stochastic auto-oscillations is just the process of spontane-ous break of the ordered phase followed by its restoration. Such behavior of the graphs indicates that the temperature has a very strong impact on the ordered phase stabil-ity. Thus the whole block of experimental data can be qualitatively interpreted within the framework of the two phase model.
Summary• Measurements of the bulk concentration of HSO3- anions and electrostatic potential close to Nafion interface confirmed the Ex-clusion Zone’s existence. The concentration of HSO3- anions is a parameter, which can
WATER
WATER 4, 129 - 154, March 8th 2013 150
be easily measured in a direct experiment. This provides a qualitatively new possibility of measuring the size of the Exclusion Zone. However the question of the Exclusion Zone origin is still open.
• As was obtained by measuring the temper-ature dependences of the EZ characteristics, the bulk concentration of HSO3- anions de-pends on the path of changing the tempera-ture: heating or cooling. The temperature hysteresis loops have been observed, which points to the existence of bi-stability in the system.
• The refractive index n of water drasti-cally rises at the Nafion – water interface. This cannot be connected with the increase of ionic density. Water itself is practically incompressible, and its refractive index can be changed only at very high pressure. It is important that the value of n is higher than that for dry Nafion, thus the effect cannot be explained by dissolving Nafion in water. Furthermore, the liquid area of increased refractive index demonstrates birefrin-gence.
Acknowledgements
We are grateful to Prof. G.H. Pollack for encouraging these experiments and fruit-ful discussions of the reported results, and Prof. D.F. Parsons, Dr. N.V. Suyazov, Dr. P.V. Slitikov, not forgetting M.Sc. A.V. Starosvetskiy, for very valuable advice on this work. This study was supported by the Russian Foundation for Basic Researches, Grant No. 10-2-00377-A.
References
Aastuen DJV, Clark NA, Cotter LK, Ackerson BJ. (1986). Phys Rev Lett, 57: 1733.
Bass M, Berman A, Singh A, Konovalov O, Freger V. (2011). Macromol, 44: 2893.
Bazanov SS (1976). Structural Refractometry - in Russian. Moscow, Vys’shaya shkola.
Bhalerao AS and Pollack GH(2011). J Biophotonics, 4 (3): 172.
Born H and Wolf E (1964). Principles of Optics. Pergamon Press, Oxford.
Bunkin NF, Suyazov NV, Shkirin AV, Ignatiev PS, Indukaev KV (2009a). J Chem Phys, 130: 134308.
Bunkin NF, Suyazov NV, Shkirin AV, Ignatiev PS, Indukaev KV (2009b). JETP, 108: 800.
Bunkin NF, Shkirin AV, Kozlov VA, Starosvetskij AV (2010). Proc SPIE, 7376: 73761D.
Bunkin NF, Ninham BW, Shkirin AV, Ignatiev PS, Kozlov VA, Starosvetskij AV (2011). J Biophotonics, 4: 150.
Bunkin NF, Shkirin AV, Ignatiev PS, Chaikov LL, Burkhanov IS, Starosvetskij AV (2012a). J Chem Phys, 137: 054706.
Bunkin NF, Shkirin AV, Kozlov AV (2012b). J Chem Eng Data, 57(10): 2823.
Chai B, Zheng J, Zhao Q, Pollack GH (2008a). J Phys Chem A, 112: 2242-2247.
Chai B, Zheng J, Zhao Q, Pollack GH (2008b). J Phys Chem A 112: 2242.
Chai B, Yoo H, Pollack GH (2009). J Phys Chem B, 113: 13953.
Chai B and Pollack GH (2010). J Phys Chem B, 114: 5371.
Crocker JC and Grier DG (1996). Phys Rev Lett, 77: 1897.
Elliot JA and Paddison SJ (2007). Phys Chem Chem Phys, 9: 2602–2618.
Gebel G (2000). Polymer, 41: 5829.
Heitner-Wirguin C (1996). J Membr Sci, 120: 21.
Joannopoulos J, Johnson S, Winn J, Meade R (2008). Photonic Crystals: Molding the Flow of Light, Princeton NJ, Princeton University Press.
John S (1987). Phys Rev Lett, 58: 2486.
Kepler GM and Fraden S (1994). Phys Rev Lett 73: 356.
WATER
WATER 4, 129 - 154, March 8th 2013 151
WATER
Kreuer KD (2001). J Membr Sci, 185: 29.
Lorentz H (1879). Verhl Akad Wetens Amsterdam 18: 60, 85.
Mauritz KA, Moore RB (2004). Chem Rev 104: 4535.
Murray CA, Sprenger WO, Wenk RA (1990a). Phys Rev B, 42: 688.
Murray CA, Sprenger WO, Wenk RA (1990b). J Phys: Condens Matt, 2: SA385.
Ninham BW and Lo Nostro P (2010). Intermolecular Forces and Self Assembly in Colloid, Nano Sciences and Biology. Cambridge University Press, New York.
Pantelic N, Wansapura CM, Heineman WR, Seliskar CJ (2005). J Phys Chem B, 109: 13971.
Park H, Park Y, Bae E, Choi W (2009). J Photochem, Photobiol A, 203: 112.
Squires TM and Brenner MP (2000). Phys Rev Lett, 85: 4976.
Svergun DI, Richard S, Koch MHJ, Sayers Z, Kuprin S, Zaccai G (1998). Proc Natl Acad Sci USA, Biophysics, 95: 2267. PubMed ID 9482874.
Van Der Heijden P, Bouzenad F, Diat O (2004). J Poly Sci Part B: Polymer Physics, 42: 2857.
van Winkle DH and Murray CA (1986). Phys Rev A, 34: 563.
van Winkle DH and Murray CA (1987). Phys Rev Lett, 58: 1200.
van Winkle DH and Murray CA (1988). J Chem Phys, 89: 3885.
Vedam K and Limsuwan P (1975). Phys Rev Lett, 35: 1014.
Wuks MF (1984). Electrical and Optical Properties of Molecules and Condensed Media - in Russian. Leningrad State University.
Xie T (2010). Nature, 464: 08863.
Xu XH and Yeung ES (1998). Science, 281: 1650.
Yablonovitch E (1987). Phys Rev Lett, 58: 2059.
Yoo H, Paranji R, Pollack GH (2011a). J Phys Chem Lett, 2: 532.
Yoo H, Baker DR, Pirie CM, Hovakeemian B, Pollack GH (2011b). In: Water: The Forgotten Biological Molecule, Ed. by D. Le Bihan and H. Fukuyama, Pan Stanford Publishing.
Zheng J and Pollack GH (2003). Phys Rev E, 68: 031408.
Zheng J, Chin WC, Khijniak E, Khijniak E Jr., Pollack GH (2006). Adv Col Int Sci, 127: 19.
Web References
1. www.lsbu.ac.uk/water/vibrat.html#comp
Discussion with ReviewersAnonymous Reviewer: Although it is stated that the studies are limited to Nafion, EZs of similar nature are found at aqueous interfaces adjacent to many hydrophilic substances, including gels, metals and monolayers. Since many of these substances contain no protruding polymers, would you speculate that the exclusion mechanism differs for those materials?
N. Bunkin, P. Ignatiev, V. Kozlov, A. Shkirin, S. Zakharov and A. Zinchenko: We in our work have examined the effect of the EZ formation only close to the Nafion interface. In our opinion, this effect is due to the charging of the Nafion surface in water and “disentangling” of like-charged polymer fibers in water to form structures of the colloidal crystal type. The hypothesis of the formation of a colloidal crystal, of course, requires further experiments, but only in the framework of this hypothesis we can explain the appearance of the absorption band, centered at a wavelength of 270 nm. Indeed, the water in this range has maximum transparency, and therefore the absorption at this wavelength in the water near the Nafion interface can only be associated with the formation of the photonic (in fact, the colloidal) crystal, which is characterized by the effect of trapping photons at a certain frequency. I of course do not know why
WATER
WATER 4, 129 - 154, March 8th 2013 152
the EZ appears near a metal interface, since such interface cannot be charged. It is known however that sometimes in the process of metal oxidation the dendritic thread-like crystals grow on the surface of a metal, which under certain conditions can lead to the formation of an area, having some specific properties. However, in each particular case the effect of the EZ formation should be studied separately: it is possible that for metals, monolayers, and the gel the different mechanisms of the EZ formation are involved.
Anonymous Reviewer: In alkaline solu-tions, the pH value next to Nafion decreases for approximately 15 minutes, and then (according to Figure 2) seems to level off. Why is the steady drop of pH over 15 minutes interpreted as irreversible dissolution of Nafion?
Bunkin, Ignatiev, Kozlov, Shkirin, Zakharov and Zinchenko: We assume that Nafion is not stable in concentrated alkaline solutions. We read the corresponding piece of the text once again, and now we understood that the phrase “It means that the structure of Nafion in such solutions is changed irreversibly; Nafion is actually dissolved” page 6, lines 176 and 177, should be removed from the text because it can confuse the reader. We just wanted to say that, as follows from Fig. 2, Nafion is stable in acids, while it releases some amount of acid (to our knowledge, this is sulfurous acid) in neutral and alkaline media; this acid is necessary for the Nafion stabilization. Since this work was not devoted to chemical reactions with Nafion, we did not study comprehensively the dynamics of pH in concentrated alkalis. However, the graphs in Fig. 2 show that this dynamic is essentially different for pH = 8 and pH = 9. It is thus possible that in concentrated alkaline solutions Nafion changes irreversibly.
Anonymous Reviewer: Regarding the temp-
erature dependence of EZ size (Figure 6), the red curve seems to fit your interpretation; however, the blue curve seems statistically no different from no change at all? Does the large scatter give clear evidence?
Bunkin, Ignatiev, Kozlov, Shkirin, Zakharov and Zinchenko: We show in this paper that the EZ size can be estimated with the help of the coordinate jump concentration of bisulfite anions. However, our opponents can ask: why, in principle, does a steep gradient in the ion concentration occur on the EZ border? It seems likely that the diffusion flow of ions should wash out the concentration gradient. In our opinion, the presence of a jump is due to the fact that bisulfite anions in the EZ are of very low mobility, so the diffusion coefficient of these ions is very small and the concentration gradient can survive. However, following the Earnshaw theorem, the system of immobile Coulomb charges cannot be stable. Therefore, the graph in Fig. 6 should be analyzed in view of such Coulomb instability that inevitably arises in the system. The manifestation of this instability is illustrated in Fig. 9: we see in these diagrams the regime of stochastic oscillations at two very close temperatures, the reproducibility obviously misses, and the graphs were obtained with intervals of about 2 months. In addition, very low ultrasound can destroy the EZ due to this instability, see Fig. 10. Perhaps, if we measure the EZ size by using, for instance, colloidal microspheres or pH meter (this is obviously integral measurement technique), this instability would not revealed. However in our case of essentially local measurements (by using the HSO3- meter) this instability leads to the scatter of the experimental data. In other words, the large scatter in Fig. 6 is associated with this instability. This figure illustrates the fact that the EZ size depends not only on temperature but also on just how this temperature has been reached:
WATER
WATER 4, 129 - 154, March 8th 2013 153
WATER
by heating or by cooling, because the EZ, apparently, has a thermal memory. We note that the effect of thermal memory is characteristic of the dry (water-free) Nafion and other thermoplastic polymers, see (Xie 2010).
Anonymous Reviewer: Regarding the bi-sulfate concentration (Figure 7), it seems that a huge change (5x, red curve) occurs over the same temperature range over which there is no change of EZ size. Do you still argue for a good correlation?
Bunkin, Ignatiev, Kozlov, Shkirin, Zakharov and Zinchenko: We do not at all insist on the presence of any correlations, as in a system where instabilities are revealed, the correlations should be analyzed in a special manner. We write in the text (see page 12, lines 327 and 328): “Qualitatively quite similar results were obtained in measurements of the bulk concentration of (Fig. 7 a) and the electrostatic potential (Fig. 7 b) at Nafion interface”. “Quite similar results” – here we mean that both for the EZ size and for the bisulfite anions concentration, measured at the Nafion interface, the thermal memory effects are observed. We certainly did not tell here about a correlation between the temperature behavior of the bisulfite anions concentration and the EZ size. This is why we would like to bring the following phrase in the text immediately after the phrase quoted above (the middle of the line 327): “Here, of course, it makes no sense to speak of a correlation between the temperature behavior of the EZ size and the bisulfite anions concentration.”
Anonymous Reviewer: The high refractive index (and birefringence) of the exclusion zone seems a central point in this paper. In arguing that the EZ’s high refractive index may correspond to an increase of density, you assert that this cannot result from compression of water alone because water is virtually incompressible. However,
Pollack’s group has been arguing that the EZ is an altered phase of water. If the ice-to-water phase change results in a large density difference, couldn’t the water-to-EZ phase change also result in a large density difference?
Bunkin, Ignatiev, Kozlov, Shkirin, Zakharov and Zinchenko: The most difficult question of all this study was the following: how can we explain the refractive index rise in the EZ? We have at our disposal only the known Lorentz - Lorenz formula (Eqn. (4) in the text; here we use the term “molecular refraction” denoted by γ). The molecular refraction in the optical frequency range is determined by the density of molecules and their electronic polarizability. As applied to water, the maximum contribution of the polarizability to the molecular refraction magnitude (the so-termed orientation mechanism, when all the dipoles have the same orientation) does not exceed 10 %, while in our case we deal with the refraction increase of about 30 % (see our comments on page 144). Naturally, we considered the possibility of a phase transition: the water in the EZ is a special water phase. Recall that the ice Ih (the ice, which is kept under the atmospheric pressure) has a refractive index n = 1.306 - 1.318 (for liquid water we have n = 1.33). It is reasonable to assume that the ice under very high pressure can have a relatively high refractive index. But then the question arises: how can high pressure appear in our system? In our view, the hydration of the disentangled polymeric chains in the water (obviously these chains are essentially hydrophilic, as they are electrically charged), and the increase in the density of water molecules in the hydration layers qualitatively explains the observed growth of the refractive index. Since in the framework of this hypothesis (EZ is colloidal or photonic crystal formed by the charged polymer rods) other experimental facts are also explained, we decided on this mechanism of the refractive index growth.
WATER
WATER 4, 129 - 154, March 8th 2013 154
Anonymous Reviewer: It is proposed that the birefringent properties of the exclusion zone arise from the disentangling of Nafion strands, which then project from the Nafion sheet (Figure 15). This raises a question. The Chai et al paper shows that light expands the EZ. Expansion was noted by up to ten times. Would you consider that light could somehow make the hypothesized polymer strands project farther out?
Bunkin, Ignatiev, Kozlov, Shkirin, Zak-harov and Zinchenko: Of course, we do not believe that the polymeric chains can stretch more than a millimeter due to the effect of optical wave. This is why we cannot explain the experimental results mentioned here (Chai et al.). We do not have carried
out experiments on the effects of light at different wavelengths on the EZ, although such experiments are planned. Apparently, the effect of light on the EZ (as well as on the properties of water) will be understood and described not very soon. In summary, this paper shows a lot of experimental data that can be consistently explained in the framework of the suggested model: the swelling of Nafion in water leads to the formation of a photonic crystal, and the surface of the swollen Nafion resembles brush. Note that this property of the swollen Nafion was mentioned in (Bass et al. 2011). Of course, our model (or any other model) is naturally limited and cannot explain all the experimental data.
![1. Ino self shrinkage. W. Kurdowski [8], A.M. Neville [9]. While keeping concrete in water or concrete curing in a humidity of about 99%, swelling phenomenon occurs. Swelling of concrete](https://static.fdocuments.in/doc/165x107/6118e207d1b3e076553c68fa/1-i-no-self-shrinkage-w-kurdowski-8-am-neville-9-while-keeping-concrete.jpg)