Water Resources Management Plan for the Red Bud-Catalpa ...
140
WRMP for Red Bud – Catalpa Creek Watershed 1 Water Resources Management Plan for the Red Bud-Catalpa Creek Watershed 1 1 FOREWORD This Water Resources Management Plan for the Red Bud - Catalpa Creek Watershed is the result of a highly collaborative, volunteer effort on the part of over 30 faculty and administrators at Mississippi State University (MSU) and over 10 staff with the Mississippi Department of Environmental Quality (MDEQ), U.S.D.A. Natural Resources Conservation Service (NRCS), Mississippi Soil & Water Conservation Commission (MSWCC), and the Oktibbeha County Soil & Water Conservation District (OCSWCD). To assist reviewers of this plan, the Appendix A contains a cross-reference for required EPA 319 watershed-based plan elements and Appendix B contains a proposed work plan with milestones. This is a working document with future editions likely through an adaptive management process. 2 INTRODUCTION A significant portion of MSU’s campus and property resides within the Catalpa Creek Watershed (referenced by USGS as the Red Bud-Catalpa Creek Watershed, HUC 12 #031601040601, and by MDEQ as MWS #8090). This includes important MSU education and research facilities, such as the Mississippi Agricultural and Forestry Experiment Station’s (MAFES) H.H. Leveck Animal Research Center (South Farm) and the Bearden Dairy Research Unit (Dairy Unit), which is used by numerous departments and programs. Unfortunately, some of MSU’s land uses in this watershed may be contributing to the pollution of Catalpa Creek. At present there is a Total Maximum Daily Load (TMDL) determination for sediment for Catalpa Creek. Monitoring studies showed that two other pollutants (nutrients and pathogens) were present in excessive amounts in Tibbee Creek, of which Catalpa Creek is a tributary; TMDLs have been completed for those pollutants as well. In April 2013, MSU, through the Mississippi Water Resources Research Institute (MWRRI), was designated a Center of Excellence for Watershed Management with the signing of a Memorandum of Understanding (MOU) between the MDEQ, Region 4 of the U.S. Environmental Protection Agency (EPA), and MSU. The MOU recognized that MWRRI had “demonstrated to the satisfaction of EPA and MDEQ that it has the capacity and capability to identify and address the needs of the local watershed stakeholders” and was charged to “work
Transcript of Water Resources Management Plan for the Red Bud-Catalpa ...

WRMP for Red Bud – Catalpa Creek Watershed 1
Water Resources Management Plan for the Red Bud-Catalpa Creek Watershed
11 FOREWORD This Water Resources Management Plan for the Red Bud - Catalpa Creek Watershed is the result of a highly collaborative, volunteer effort on the part of over 30 faculty and administrators at Mississippi State University (MSU) and over 10 staff with the Mississippi Department of Environmental Quality (MDEQ), U.S.D.A. Natural Resources Conservation Service (NRCS), Mississippi Soil & Water Conservation Commission (MSWCC), and the Oktibbeha County Soil & Water Conservation District (OCSWCD). To assist reviewers of this plan, the Appendix A contains a cross-reference for required EPA 319 watershed-based plan elements and Appendix B contains a proposed work plan with milestones. This is a working document with future editions likely through an adaptive management process.
2 INTRODUCTION A significant portion of MSU’s campus and property resides within the Catalpa Creek Watershed (referenced by USGS as the Red Bud-Catalpa Creek Watershed, HUC 12 #031601040601, and by MDEQ as MWS #8090). This includes important MSU education and research facilities, such as the Mississippi Agricultural and Forestry Experiment Station’s (MAFES) H.H. Leveck Animal Research Center (South Farm) and the Bearden Dairy Research Unit (Dairy Unit), which is used by numerous departments and programs. Unfortunately, some of MSU’s land uses in this watershed may be contributing to the pollution of Catalpa Creek. At present there is a Total Maximum Daily Load (TMDL) determination for sediment for Catalpa Creek. Monitoring studies showed that two other pollutants (nutrients and pathogens) were present in excessive amounts in Tibbee Creek, of which Catalpa Creek is a tributary; TMDLs have been completed for those pollutants as well.
In April 2013, MSU, through the Mississippi Water Resources Research Institute (MWRRI), was designated a Center of Excellence for Watershed Management with the signing of a Memorandum of Understanding (MOU) between the MDEQ, Region 4 of the U.S. Environmental Protection Agency (EPA), and MSU. The MOU recognized that MWRRI had “demonstrated to the satisfaction of EPA and MDEQ that it has the capacity and capability to identify and address the needs of the local watershed stakeholders” and was charged to “work

WRMP for Red Bud – Catalpa Creek Watershed 2
with colleges and universities in Mississippi to engage students (graduate and undergraduate), faculty, and staff from the full suite of disciplines needed to adequately address specific watershed issues” and to “draw upon other local, state, federal resources and expertise.”
MWRRI, in its role as a Center of Excellence for Watershed Management, is advantageously positioned to bring resources together from various MSU departments and programs, other statewide stakeholder organizations, and state and federal agencies to address the needs within the Catalpa Creek Watershed. This project will not only put appropriate structural practices on the ground in strategic locations in the watershed to restore water quality and habitat, but also establish a venue for watershed-based demonstrations, research, education, application and sustainable management.
33 EXECUTIVE SUMMARY The Catalpa Creek Watershed is located in Oktibbeha and Lowndes counties in the northeast region of Mississippi and is part of the larger Tombigbee River Basin. The 28,928 acre watershed contains 31 miles of mainstream perennial stream length. The stream network empties into Tibbee Creek which flows into Columbus Lake on the Tennessee-Tombigbee Waterway north of Columbus, MS. At the HUC-12 level, the watershed includes part of the Mississippi State University Campus, the MSU South Farm research facility and dairy farm, as well as a number of privately owned lands. Originally, the landLands in the watershed were wasoriginally - primarily prairie. Current land use includes 44% in hay production/pasture land, 10% in cultivated crops, 9% in developed land, and 8% in wetlands or open water.
Research activities of the university and continued development and construction of on university lands appear to be a primary driver of stream, ecosystem, and water quality degradation. Catalpa Creek is currently listed by the Mississippi Department of Environmental Quality (MDEQ) as impaired by sedimentation and a TMDL has been developed that sets challenging targets for sediment load reductions. Two MSU facilities on the South Farm are permitted point sources – the Poultry Science Research Center and the Ag Center and Horse Park. The agency has ranked the watershed as having a high stressor potential, which means compared to other watersheds in the area Catalpa Creek is a watershed in need of restoration. MDEQ supports four sites in the watershed to monitor its biological health.
A comprehensive suite of management practices has been selected to address the agricultural resource concerns identified for the watershed – sedimentation, grazing lands, sustainable forestry, and declining wildlife habitats. The management practices to mitigate sedimentation range from grade stabilization structures, sediment basins, and grassed waterways to critical area plantings, field borders, and terraces. Management practices to address protect grazing lands include fencing, pond construction, prescribed grazing, heavy use protection, livestock shelters, and watering facilities. Practices to foster sustainable forestry include land clearing, forest site preparation, and tree and shrub establishment. Practices to restore declining wildlife
WRMP for Red Bud – Catalpa Creek Watershed 3
include water control structures, forage and biomass planting, and forest stand improvement. Some of these practices address multiple resource concerns.
In addition to the agricultural resource concerns, urban storm water management is a key need for the watershed and a focus of this restoration and protection plan. MSU’s Master Plan (MSU, 2010) contains numerous urban storm water management techniques and approaches, and will be leveraged with this water resources management plan. These include: design and implementation of low impact development (LID) solutions in future campus planning and development; on-site storm water treatment (where feasible) on all newly constructed campus buildings and landscape projects; 100-foot buffers on all campus streams; protecting and re-vegetating landscape areas around existing creeks and drainage ways; directing storm water flow from existing creek beds to water receiving landscapes that are designed to allow for infiltration and slow discharge; enhancing landscapes around existing on-site water resources with vegetated filters and water absorbent plantings at storm water discharge points; and construction of storm water retention basins.
The project has a number of unique features. These include an education, experiential learning, and outreach approach that begins by better understanding the behaviors, perceptions, and beliefs of watershed stakeholders. This will be addressed by pre and post implementation surveys. Creation of experiential learning opportunities for students will also be a focus of the project. A comprehensive monitoring and assessment approach will be implemented for this project, including traditional physical/chemical water quality monitoring, macroinvertebrate habitat assessments, use of indicator species to evaluate ecosystem restoration progress, and social indicators to understand improvements in stakeholder behaviors and perceptions and the effectiveness of educational and outreach activities. Other unique features include analyses and designs to restore the structure and function of Catalpa Creek and for siting storm water retention basins to mitigate downstream storm water impacts. Also, incorporated into the project is a focus on watershed sustainability from several perspectives – habitat/ecosystem health, water quality and quantity, and the continuance of concerted, collaborative efforts to involve local watershed champions and businesses to foster “collective ownership” of the watershed. Such an approach supports MSU’s Vision 20/20 and will tie-in MSU’s Office of Sustainability.
Probably, the most ambitious component of the project is to leverage these restoration and protection activities into the establishment of a Watershed D.R.E.A.M.S. (Demonstration, Research, Education, Application, Management and Sustainability) Center. Supported by the highest administrative levels of the university and throughout its faculty, the Watershed D.R.E.A.M.S. Center is envisioned as an ongoing collaborative campus-wide project that links together and is supported by over 18 university departments, institutes, programs (i.e., units). Demonstrating innovative applied research, sustainable water resources management, and effective and quantifiable education and experiential learning is the overarching mission of the D.R.E.A.M.S. Center. It is also envisioned that the D.R.E.A.M.S. Center will provide effective

WRMP for Red Bud – Catalpa Creek Watershed 4
training opportunities for state and federal conservation agencies and organizations through demonstrations of best management practices, pollutant reduction strategies, water management applications, and more.
44 CONTENTS This comprehensive Water Resources Management Plan for the Catalpa Creek Watershed incorporates the elements prescribed in EPA’s Handbook for Developing Watershed Plans to Restore and Protect Our Waters (EPA, 2008). These elements are contained in the following sections:
1 Foreword ................................................................................................................................. 1
2 Introduction ............................................................................................................................. 1
3 Executive Summary ................................................................................................................. 2
5 Vision and Project Goals .......................................................................................................... 7
6 Approach ................................................................................................................................. 8
6.1 Focus on State Law ........................................................................................................... 8
6.2 Focus on Restoration ........................................................................................................ 9
6.3 Focus on Protection ......................................................................................................... 9
6.4 Focus on Education, Experiential Learning, and Outreach .............................................. 9
6.5 Focus on Integrated Urban Land Use Planning and Watershed-Scale Planning ........... 10
6.6 Use of Established Programs, Strategies, Tools, and Practices ...................................... 10
6.7 Development of Innovative Strategies, Tools, and Practices ........................................ 10
6.8 Focus on Documentation of Progress ............................................................................ 10
6.9 Focus on Sustainability ................................................................................................... 10
7 Partnerships and Teams ........................................................................................................ 11
7.1 Partnerships ................................................................................................................... 11
7.2 Steering Team ................................................................................................................ 13
7.3 Functional Teams ........................................................................................................... 14
7.4 Planning and Implementation Team .............................................................................. 14
7.5 Education, Experiential Learning and Outreach Team .................................................. 16
7.6 Funding and Incentives Team ........................................................................................ 16
8 Stakeholder Input .................................................................................................................. 17
9 Watershed Description and Characterization ....................................................................... 18

WRMP for Red Bud – Catalpa Creek Watershed 5
9.1 Geography & Geomorphology ....................................................................................... 18
9.2 Soils ................................................................................................................................ 27
9.3 Climate and Precipitation ............................................................................................... 31
9.4 Hydrology ....................................................................................................................... 37
9.5 Land Use ......................................................................................................................... 44
9.6 Plant and Animal Communities ...................................................................................... 46
9.7 Demographics................................................................................................................. 55
10 Watershed Status and Restoration and Protection Goals and Targets ............................. 58
10.1 Guiding Principles ........................................................................................................... 58
10.2 Surface Water Quality .................................................................................................... 59
10.3 Catalpa Creek Water Quality .......................................................................................... 64
10.4 Integration of Water Quality Targets, Goals, Restoration and Protection Activities, and Modeling and Monitoring ......................................................................................................... 66
10.5 Habitat ............................................................................................................................ 67
10.6 Integration of Habitat Quality/Ecosystem Function Targets, Goals, Restoration and Protection Activities, and Monitoring ....................................................................................... 68
10.7 Social Indicators ............................................................................................................. 70
11 Proposed Restoration and Protection Activities, and Costs .............................................. 72
11.1 Surface Water Quality and Habitat Restoration and Protection on Agricultural Lands 72
11.2 Stream Morphology and Function Restoration ............................................................. 85
11.3 Surface Water Quality and Habitat Restoration and Protection in the Urban Environment .............................................................................................................................. 87
12 Monitoring, Modeling, Research, and Assessment ......................................................... 100
12.1 Water Resources .......................................................................................................... 100
12.2 Habitat .......................................................................................................................... 105
12.3 Social Indicators ........................................................................................................... 109
12.4 Data Management and Distribution ............................................................................ 109
13 Education, Experiential Learning and Outreach .............................................................. 110
13.1 Goals and Objectives .................................................................................................... 110
13.2 Activities & Milestones ................................................................................................. 110
13.3 Participants & Affiliations ............................................................................................. 112
13.4 Resource Needs ............................................................................................................ 113
WRMP for Red Bud – Catalpa Creek Watershed 6
14 Sustainability .................................................................................................................... 113
14.1 Explanation of Sustainability and its Importance ........................................................ 113
14.2 Addressing Sustainability ............................................................................................. 114
15 Catalpa & Sand Creek Watershed D.R.E.A.M.S. (Demonstration, Research, Education, Application, Management and Sustainability) Center ................................................................ 117
15.1 Vision ............................................................................................................................ 117
15.2 Catalpa Creek Watershed: A Landscape Approach ...................................................... 118
15.3 H.H. Leveck Animal Research Center (South Farm) ..................................................... 121
15.4 R.R. Foil Plant Science Research Center ....................................................................... 122
15.5 Union Green Design ..................................................................................................... 123
16 Resource Needs, Procurement, and Leveraging .............................................................. 123
16.1 Resource Needs ............................................................................................................ 123
16.2 Resource Identification/Discovery, Solicitation, and Procurement ............................. 124
16.3 Resource Leveraging .................................................................................................... 127
17 Plan Revision .................................................................................................................... 131
18 References ....................................................................................................................... 131
19 Appendices ....................................................................................................................... 135
19.1 Appendix A: Cross-reference for Required EPA 319 Watershed-based Plan Elements 135
19.2 Appendix B: Work Plan (Participants, Roles and Milestones) ...................................... 136

WRMP for Red Bud – Catalpa Creek Watershed 7
55 VISION AND PROJECT GOALS An exercise held on January 13, 2015, by the Catalpa Creek Project Steering Team focused on developing a vision for the restoration and protection project as well as the watershed-based management demonstration center (discussed in Section 15).
Vision. The vision of the Catalpa Creek Watershed Restoration & Protection Project is to restore and protect the ecosystem health, ecosystem services and quality of life, and water resources within the watershed; develop an informed citizenry in the watershed and beyond; and create experiential learning activities for students, educators, and practitioners.
Goals. The desired outcomes of this vision are identified below:
Ecosystem Health – restoring and protecting the biological integrity and ecological functions of the watershed, and restoring stream hydrology and geomorphology;
Water Resources – reducing pathogen, nutrients and sediment loads in order to meet applicable water quality standards and protect the downstream beneficial/designated uses that are threatened by upstream land uses;
Quality of Life – maintaining the quality of life for stakeholders in the Catalpa Creek Watershed related to currently available water resources in the event of future land use changes;
Experiential Learning – creating and facilitating experiential learning opportunities for university students and faculty, secondary educators and students, and others through projects, workshops, camps, demonstrations, and other activities;
Collaboration – fostering collaborative activities among university departments and programs, state and federal agencies, stakeholder organizations and watershed stakeholders, and leveraging available resources; and
Sustainability – advancing sustainable watershed management applications for the agricultural and urban environments.

WRMP for Red Bud – Catalpa Creek Watershed 8
66 APPROACH EPA Handbook. The process followed to develop this comprehensive Water Resources Management Plan for the Catalpa Creek Watershed is prescribed in EPA’s Handbook for Developing Watershed Plans to Restore and Protect Our Waters (EPA, 2008). The six-step process includes:
1. Building partnerships; 2. Characterizing the watershed; 3. Finalizing goals and identifying solutions; 4. Designing an implementation program; 5. Implementing the watershed plan; and 6. Measuring progress and making adjustments.
Holistic Approach. A holistic, multi-disciplinary approach to achieve the goals stated in the preceding section is incorporated into this plan. The approach incorporates an array of disciplines from the sciences (e.g., hydrogeology, soils, biology, ecology, climatology), engineering (e.g., civil, environmental, agricultural), social science, education, administration, facilitation, and economics. The approach also focuses on an array of factors, including adherence to state law; restoration; protection; education, experiential learning, and outreach; integration of MSU’s Master Plan (Sections 6.5, 11.3); use of established programs, strategies, tools, and practices; development of innovative strategies, tools, and practices; documentation of implementation progress; and sustainability in several contexts.
6.1 FOCUS ON STATE LAW Mississippi’s Water Law (§ 51-3-1) states in part:
"It is hereby declared that the general welfare of the people of the State of Mississippi requires that the water resources of the state be put to beneficial use to the fullest extent of which they are capable, that the waste or unreasonable use, or unreasonable method of use, of water be prevented, that the conservation of such water be exercised with the view to the reasonable and beneficial use thereof in the interest of the people, and that the public and private funds for the promotion and expansion of the beneficial use of water resources shall be invested to the end that the best interests and welfare of the people are served.”
The approach to water resources management in the Water Resources Management Plan for Red Bud-Catalpa Creek Watershed follows this legislative guidance. The plan focuses on the end point, i.e., creating sustainable water resources and ecosystems for all. Both nonstructural and structural practices are recommended, as is a targeted education, experiential learning and outreach effort that incorporates social indicators to evaluate

WRMP for Red Bud – Catalpa Creek Watershed 9
progress made in stakeholder behaviors, perceptions and beliefs, and to inform the adaptive management process upon which the plan is constructed.
66.2 FOCUS ON RESTORATION Areas of Focus. Watershed restoration is the return of an ecosystem to as close an approximation of its state prior to a specific event or period of degradation. The approach to restoration contained in this plan focuses on:
Reducing nutrients, pathogens, and sediment in the watershed and implementing Catalpa Creek’s sediment TMDL by lowering the presence of sediment in the creek to within acceptable levels;
Restoring the geomorphology and function of Catalpa Creek that has been degraded by upstream conversion from natural conditions to urban land uses; and
Restoring the ecosystems and habitat of the watershed.
Mississippi’s Upland Nutrient Reduction Strategic Plan. Integral to this focus is the incorporation of Mississippi’s Upland Nutrient Reduction Strategic Plan. This plan (MDEQ, 2011) will guide the related planning and implementation activities within the Catalpa Creek Watershed.
6.3 FOCUS ON PROTECTION The watershed protection described in this plan focuses on:
Protecting surface water resources and maximum appropriate reuse of wastewater;
Protecting public and private drinking water supplies; Conserving ecosystem/habitat/water resources through sustainable management;
and Sustaining quality of life and human health within the watershed.
6.4 FOCUS ON EDUCATION, EXPERIENTIAL LEARNING, AND OUTREACH Key components to successfully changing stakeholder behaviors, perceptions and beliefs is first understanding what they are, then developing and implementing effective education and experiential learning activities. Incorporating incremental surveys and adaptive management as part of this effort fosters opportunities to learn the effectiveness of our educational activities and to make improvements moving forward. An Education, Experiential Learning, and Outreach Team has been established that will work collaboratively to develop and implement education plans to effect behavior change, create experiential learning activities, produce and disseminate educational materials, and develop tours (self, guided, and virtual) to demonstrate the principles and practices employed through this project.
WRMP for Red Bud – Catalpa Creek Watershed 10
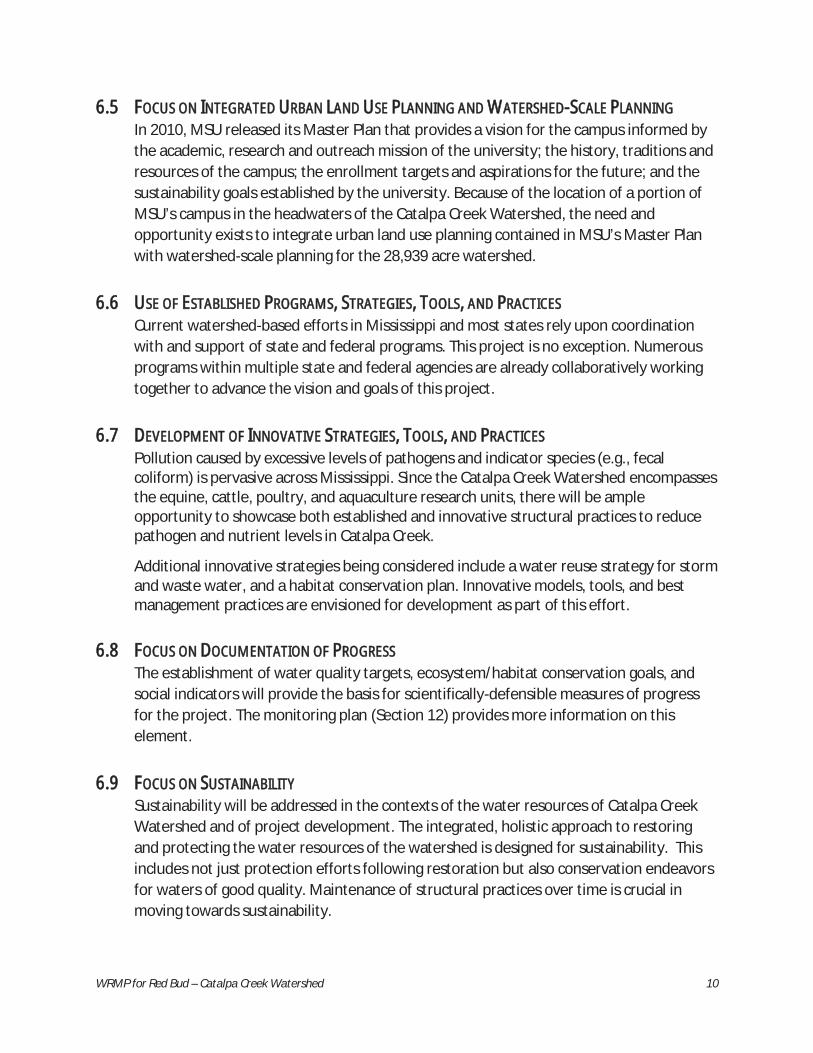
66.5 FOCUS ON INTEGRATED URBAN LAND USE PLANNING AND WATERSHED-SCALE PLANNING In 2010, MSU released its Master Plan that provides a vision for the campus informed by the academic, research and outreach mission of the university; the history, traditions and resources of the campus; the enrollment targets and aspirations for the future; and the sustainability goals established by the university. Because of the location of a portion of MSU’s campus in the headwaters of the Catalpa Creek Watershed, the need and opportunity exists to integrate urban land use planning contained in MSU’s Master Plan with watershed-scale planning for the 28,939 acre watershed.
6.6 USE OF ESTABLISHED PROGRAMS, STRATEGIES, TOOLS, AND PRACTICES Current watershed-based efforts in Mississippi and most states rely upon coordination with and support of state and federal programs. This project is no exception. Numerous programs within multiple state and federal agencies are already collaboratively working together to advance the vision and goals of this project.
6.7 DEVELOPMENT OF INNOVATIVE STRATEGIES, TOOLS, AND PRACTICES Pollution caused by excessive levels of pathogens and indicator species (e.g., fecal coliform) is pervasive across Mississippi. Since the Catalpa Creek Watershed encompasses the equine, cattle, poultry, and aquaculture research units, there will be ample opportunity to showcase both established and innovative structural practices to reduce pathogen and nutrient levels in Catalpa Creek.
Additional innovative strategies being considered include a water reuse strategy for storm and waste water, and a habitat conservation plan. Innovative models, tools, and best management practices are envisioned for development as part of this effort.
6.8 FOCUS ON DOCUMENTATION OF PROGRESS The establishment of water quality targets, ecosystem/habitat conservation goals, and social indicators will provide the basis for scientifically-defensible measures of progress for the project. The monitoring plan (Section 12) provides more information on this element.
6.9 FOCUS ON SUSTAINABILITY Sustainability will be addressed in the contexts of the water resources of Catalpa Creek Watershed and of project development. The integrated, holistic approach to restoring and protecting the water resources of the watershed is designed for sustainability. This includes not just protection efforts following restoration but also conservation endeavors for waters of good quality. Maintenance of structural practices over time is crucial in moving towards sustainability.

WRMP for Red Bud – Catalpa Creek Watershed 11
In order to reach these goals, critical human and fiscal resources must be secured. One of the components of the initial stakeholders survey will be to find local watershed champions – individuals and businesses that are motivated to become involved in the project. We will find the incentives that will attract support for the project on a long-term basis. To that end a Funding and Incentives Team has been established.
77 PARTNERSHIPS AND TEAMS To successfully conceptualize, develop, and implement these projects, significant effort has gone into building partnerships among MSU departments, centers and institutes as well as among state & federal resource agencies, stakeholder organizations and other forums. Likewise, significant effort has been directed toward organizing and facilitating a number of teams that work collaboratively to address the vision and objectives of the project.
The overall effort is led by MAFES, which directs the activities of the South Farm. Overall planning and facilitation activities are supported by MWRRI. To assist MWRRI with its planning and facilitation role, an informal core planning team routinely meets to advance planning for the projects. This core planning team consists of the leads or co-leads of three functional teams and a work group (identified later in this section) as well as several Steering Team members.
7.1 PARTNERSHIPS Collaborative partnerships built to support this project include multiple MSU units (departments, institutes, and centers) as well as multiple state and federal resource agencies and stakeholder organizations.
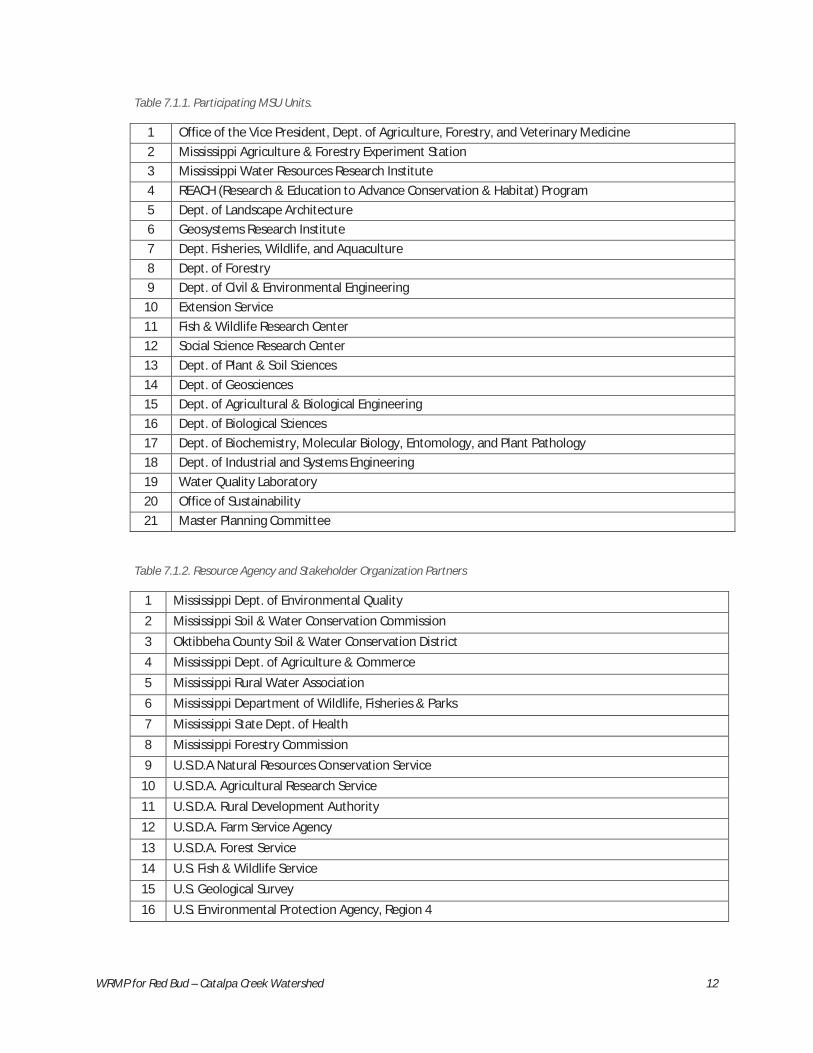
Participating MSU Units. The Catalpa Creek Watershed Restoration & Protection Project and its companion Catalpa & Sand Creek Watershed D.R.E.A.M.S. (Demonstration, Research, Education, Application, Management and Sustainability) Center (Section 15) create opportunities for involvement by a wide range of MSU departments and programs. Currently, 21 units at MSU are participating in these projects (Table 7.1.1). Many of these departments and programs already have ongoing research activities at the South Farm.
Resource Agencies and Stakeholder Organizations. A wide range of state and federal resource agency and stakeholder organization partners are participating with these projects (Table 7.1.2). These organizations have programs that range from providing technical and educational assistance to being potential sources of funding support. Most of these organizations also participate on MDEQ’s North Independent Streams/Tennessee River/Tombigbee River Basin Team.
WRMP for Red Bud – Catalpa Creek Watershed 12
Table 7.1.1. Participating MSU Units.
1 Office of the Vice President, Dept. of Agriculture, Forestry, and Veterinary Medicine 2 Mississippi Agriculture & Forestry Experiment Station 3 Mississippi Water Resources Research Institute 4 REACH (Research & Education to Advance Conservation & Habitat) Program 5 Dept. of Landscape Architecture 6 Geosystems Research Institute 7 Dept. Fisheries, Wildlife, and Aquaculture 8 Dept. of Forestry 9 Dept. of Civil & Environmental Engineering
10 Extension Service 11 Fish & Wildlife Research Center 12 Social Science Research Center 13 Dept. of Plant & Soil Sciences 14 Dept. of Geosciences 15 Dept. of Agricultural & Biological Engineering 16 Dept. of Biological Sciences 17 Dept. of Biochemistry, Molecular Biology, Entomology, and Plant Pathology 18 Dept. of Industrial and Systems Engineering 19 Water Quality Laboratory 20 Office of Sustainability 21 Master Planning Committee
Table 7.1.2. Resource Agency and Stakeholder Organization Partners
1 Mississippi Dept. of Environmental Quality 2 Mississippi Soil & Water Conservation Commission 3 Oktibbeha County Soil & Water Conservation District 4 Mississippi Dept. of Agriculture & Commerce 5 Mississippi Rural Water Association 6 Mississippi Department of Wildlife, Fisheries & Parks 7 Mississippi State Dept. of Health 8 Mississippi Forestry Commission 9 U.S.D.A Natural Resources Conservation Service
10 U.S.D.A. Agricultural Research Service 11 U.S.D.A. Rural Development Authority 12 U.S.D.A. Farm Service Agency 13 U.S.D.A. Forest Service 14 U.S. Fish & Wildlife Service 15 U.S. Geological Survey 16 U.S. Environmental Protection Agency, Region 4
WRMP for Red Bud – Catalpa Creek Watershed 13
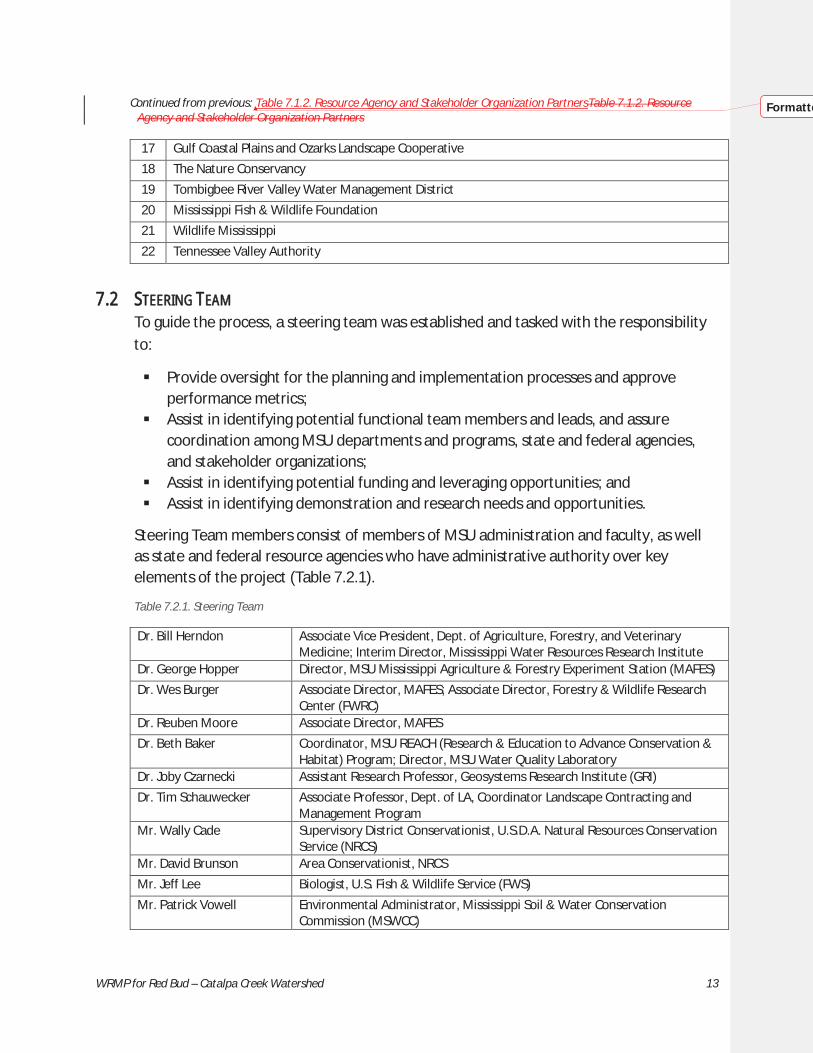
Continued from previous: Table 7.1.2. Resource Agency and Stakeholder Organization PartnersTable 7.1.2. Resource Agency and Stakeholder Organization Partners 17 Gulf Coastal Plains and Ozarks Landscape Cooperative 18 The Nature Conservancy 19 Tombigbee River Valley Water Management District 20 Mississippi Fish & Wildlife Foundation 21 Wildlife Mississippi 22 Tennessee Valley Authority
77.2 STEERING TEAM To guide the process, a steering team was established and tasked with the responsibility to:
Provide oversight for the planning and implementation processes and approve performance metrics;
Assist in identifying potential functional team members and leads, and assure coordination among MSU departments and programs, state and federal agencies, and stakeholder organizations;
Assist in identifying potential funding and leveraging opportunities; and Assist in identifying demonstration and research needs and opportunities.
Steering Team members consist of members of MSU administration and faculty, as well as state and federal resource agencies who have administrative authority over key elements of the project (Table 7.2.1).
Table 7.2.1. Steering Team
Dr. Bill Herndon Associate Vice President, Dept. of Agriculture, Forestry, and Veterinary Medicine; Interim Director, Mississippi Water Resources Research Institute
Dr. George Hopper Director, MSU Mississippi Agriculture & Forestry Experiment Station (MAFES) Dr. Wes Burger Associate Director, MAFES; Associate Director, Forestry & Wildlife Research
Center (FWRC) Dr. Reuben Moore Associate Director, MAFES Dr. Beth Baker Coordinator, MSU REACH (Research & Education to Advance Conservation &
Habitat) Program; Director, MSU Water Quality Laboratory Dr. Joby Czarnecki Assistant Research Professor, Geosystems Research Institute (GRI) Dr. Tim Schauwecker Associate Professor, Dept. of LA, Coordinator Landscape Contracting and
Management Program Mr. Wally Cade Supervisory District Conservationist, U.S.D.A. Natural Resources Conservation
Service (NRCS) Mr. David Brunson Area Conservationist, NRCS Mr. Jeff Lee Biologist, U.S. Fish & Wildlife Service (FWS) Mr. Patrick Vowell Environmental Administrator, Mississippi Soil & Water Conservation
Commission (MSWCC)
Formatte

WRMP for Red Bud – Catalpa Creek Watershed 14
Continued from previous: Table 7.2.1. Steering TeamTable 7.2.1. Steering Team Ms. Janet Chapman Tombigbee River, North Independent Streams and Tennessee River Basin
Coordinator, Mississippi Dept. of Environmental Quality (MDEQ) Mr. Mike Freiman Surface Water Division Chief, MDEQ Ms. Natalie Segrest Basin Management Branch Chief, MDEQ Mr. Richard Ingram Associate Director, MWRRI
77.3 FUNCTIONAL TEAMS In addition to the steering team, three functional teams were established. These teams consist of members of MSU faculty and administration as well as state and federal resource agencies and stakeholder organizations who have expertise and experience in the teams’ area of focus. A priority activity of each team is contributing to the development of this water resources management plan. The functional teams are:
Planning and Implementation; Education, Experiential Learning and Outreach; and Funding and Incentives.
It is anticipated that issue-specific work groups will be established during the planning process to address narrowly-focused issues (e.g., development of a pathogen mitigation strategy).
7.4 PLANNING AND IMPLEMENTATION TEAM
The primary role and responsibility of the Planning and Implementation Team is the facilitation and development of this Catalpa Creek Water Resource Management Plan. Team members will also be encouraged to participate in conceptualizing, developing, and implementing potential research projects associated with the Watershed D.R.E.A.M.S. Center (Section 15). Current team members and their department or affiliation are identified in Table 7.4.1.
An individual component of the Planning and Implementation Team is the Hydrology/Modeling Work Group. Members of this work group focus on the hydrological planning and modeling components of this water resource management plan. Current work group members and their department or affiliation are identified in Table 7.4.2.
Formatte
WRMP for Red Bud – Catalpa Creek Watershed 15
Table 7.4.1. Planning and Implementation Team
Dr. Tim Schauwecker (Co-lead) Dept. of Landscape Architecture Mr. Richard Ingram (Co-lead) Mississippi Water Resources Research Institute Dr. Beth Baker MSU REACH (Research & Education to Advance Conservation & Habitat)
Program; Director, MSU Water Quality Laboratory Dr. Brian Baldwin Dept. of Plant and Soil Sciences Dr. Jason Barrett MSU Extension - Center for Government & Community Development Mr. Robert Brzuszek Dept. of Landscape Architecture; MSU Extension Ms. Janet Chapman Mississippi Dept. of Environmental Quality Dr. Bill Cooke Dept. of Geosciences Dr. Joby Czarnecki Geosystems Research Institute Dr. Padmanava Dash Dept. of Geosciences Dr. Jamie Dyer Dept. of Geosciences Dr. Chris Fuhrmann Dept. of Geosciences Dr. Cory Gallo Dept. of Landscape Architecture & Landscape Contracting Dr. Toby Gray Geosciences Research Institute; Gulf Coastal Plains and Ozarks Landscape
Conservation Cooperative Dr. JoVonn Hill Dept. of Biochemistry, Molecular Biology, Entomology &Plant Pathology Dr. William Kingery Dept. of Plant and Soil Sciences Dr. James Martin Dept. of Civil and Environmental Engineering Dr. Jay McCurdy Dept. of Plant and Soil Sciences Dr. John Ramirez-Avila Dept. of Civil and Environmental Engineering Dr. Scott Rush Fish and Wildlife Research Center; Dept. of Wildlife, Fisheries, and
Aquaculture Ms. Jessie Schmidt Mississippi Water Resources Research Institute Dr. Courtney Siegert Fish and Wildlife Research Center - Forestry Dr. Mary Love Tagert Dept. of Agricultural & Biological Engineering Mr. Jason Walker Dept. of Landscape Architecture
Table 7.4.2. Hydrology/Modeling Work Group
Dr. Beth Baker (Co-lead) MSU REACH (Research & Education to Advance Conservation & Habitat) Program; MSU Water Quality Laboratory
Dr. John Ramirez-Avila (Co-lead)
Dept. of Civil & Environmental Engineering
Dr. James Martin Dept. of Civil and Environmental Engineering Dr. Courtney Siegert Fish and Wildlife Research Center - Forestry Dr. Mary Love Tagert Dept. of Agricultural & Biological Engineering
WRMP for Red Bud – Catalpa Creek Watershed 16
77.5 EDUCATION, EXPERIENTIAL LEARNING AND OUTREACH TEAM
The primary role and responsibility of the Education, Experiential Learning and Outreach Team is the development, facilitation and implementation of the Education, Experiential Learning & Outreach component of this Catalpa Creek Water Resource Management Plan. Additional responsibilities will focus on the development of educational signage, site displays, educational material development, and public relations for the Watershed D.R.E.A.M.S. Center. Current team members and their department or affiliation are identified in Table 7.5.1.
Table 7.5.1. Education, Experiential Learning, and Outreach Team
Dr. Leslie Burger (Lead) Wildlife, Fisheries and Aquaculture/Extension Service, MSU Dr. Beth Baker Wildlife, Fisheries and Aquaculture/Forest and Wildlife Research Center, MSU Mr. Wally Cade Natural Resources Conservation Service Ms. Janet Chapman Mississippi Department of Environmental Quality Dr. Ron Cossman Social Science Research Center, MSU Ms. Gaea Hock School of Human Sciences, MSU Mr. Richard Ingram Water Resources Research Institute Dr. John Linhoss Agricultural and Biological Engineering, MSU Dr. Mary Love Tagert Agricultural and Biological Engineering, MSU Ms. Deb Veeder MS Adopt-A-Stream, MS Wildlife Federation
7.6 FUNDING AND INCENTIVES TEAM Initially, the primary role and responsibility of the Funding and Incentives Team is the development, facilitation, and implementation of the Funding and Incentives component of this Water Resource Management Plan for Red Bud-Catalpa Creek. Additional responsibilities will focus on the continuing efforts to identify funding sources to implement this plan and assist with the facilitation and development of future research proposals. The team is co-led by Richard Ingram with MWRRI and Dr. Joby Czarnecki with GRI. Current team members and their department or affiliation are identified in Table 7.6.1.
Table 7.6.1. Funding and Incentives Team
Mr.Richard Ingram (Co-lead) Mississippi Water Resources Research Institute Dr. Joby Czarnecki (Co-lead) Geosystems Research Institute Ms. Jessie Schmidt Mississippi Water Resources Research Institute Mr. Jeff Little MSU Foundation

WRMP for Red Bud – Catalpa Creek Watershed 17
88 STAKEHOLDER INPUT For success to occur in watershed-based restoration and protection projects, it is essential that the interests and concerns of the stakeholders living in the watershed are identified and addressed. Because of this, a number of formal and informal meetings of stakeholders of the Catalpa Creek Watershed have been held. Recurring meetings of these stakeholders are planned for the future. This will include meetings of MSU administration to address issues related to the university and its landholdings as well as public meetings of watershed stakeholders that include MSU staff who live in the watershed.
As previously mentioned, on January 13, 2015, a visioning exercise was held with MSU, MDEQ, MSWCC, and NRCS administration, staff, and faculty to outline a vision for restoring and protecting the Catalpa Creek Watershed. The day-long exercise include presentations to provide an overview of the Catalpa Creek Watershed and MSU’s strategic position within it, relate information on the status of water quality and land use within the watershed, a facilitated session during which a number of questions were posed to the participants, and afterward a facilitated tour of the watershed ensued.
Questions asked and discussed during the facilitated session included: What is your vision of the Catalpa Creek Watershed in terms of ecosystem health, water resources, quality of life, engaging watershed stakeholders, providing opportunities for responsible economic growth, and providing experiential learning and research opportunities for students and teachers?
Other questions asked and discussed were: What are impacts and results you want to achieve for the watershed community, for MSU, for your organization/program, and for the region and state? What should be the project’s focus? What interests should be addressed? What challenges/barriers will we face? Why is the Catalpa Creek Watershed project important from your perspective? Who could benefit from its implementation? In what ways? How should progress be measures? Additional questions address staffing and resource support, next steps, and the D.R.E.A.M.S. Center.
After the exercise, a vision document was developed that incorporated input generated during the session. This document serves to guide MSU’s restoration and protection efforts, and narrative from this document is incorporated throughout this plan (e.g., sections on Vision and Project Goals, Approach, Partnerships and Teams, Sustainability, D.R.E.A.M.S. Center, et al).
On September 1, 2015 a meeting was held with the Oktibbeha County Soil & Water Conservation District (OCSWCD) Board of Commissioners to provide an overview of the watershed, status of water quality, present the vision, solicit input on OCSWCD’s water resource interests and concerns, and request it to partner in the project and co-host a meeting of watershed stakeholders. The Board unanimously approved the requests. OCSWCD’s water resource interests and concerns are incorporated into this plan.

WRMP for Red Bud – Catalpa Creek Watershed 18
On September 28, 2015 an evening, catered meeting of watershed stakeholders, City of Starkville representatives, and Oktibbeha County representatives will be co-hosted by MSU and OCSWCD for the purpose of greeting and getting to know watershed stakeholders, presenting and discussing the vision, requesting input from these parties regarding their interests and concerns, recruiting potential team members, and soliciting partners to participate in restoration and protection activities in the watershed. Informal meetings with watershed stakeholders have already revealed concerns related to downstream impacts of urban storm water and flooding, both of which are a focus of this plan. Any newly identified interests and concerns during this meeting and through subsequent contact with watershed stakeholders will be incorporated into a revised plan.
As mentioned previously, we will stress the importance of continued stakeholder involvement and participation as the project unfolds and recurring meetings are planned for the future. Additionally, a key feature of the project that is discussed later in this document is the implementation of pre- and post-implementation surveys to better understand stakeholder behaviors and beliefs to guide education and outreach efforts, as well as to identify potential watershed “champions” and business support to foster sustainability of this watershed-based effort.
99 WATERSHED DESCRIPTION AND CHARACTERIZATION
9.1 GEOGRAPHY & GEOMORPHOLOGY The Catalpa Creek watershed begins in Starkville, Mississippi and extends over areas of Oktibbeha and Lowndes counties. Catalpa Creek is part of the Red Bud Creek-Catalpa Creek (HUC 12 #031601040601) watershed which lies within the larger Catalpa Creek-Tibbee Creek (HUC 10), Tibbee Watershed (HUC 8) and part of the large Tombigbee River Basin. The Red Bud - Catalpa Creek Watershed covers an area of 45.2 square miles (28,939 acres).
Research activities of the university and continued development and construction of university lands appears to be a primary driver of stream degradation and water quality degradation. Impervious surfaces cause substantial runoff from the university at the headwater of the stream, resulting in marked increases in hydrologic flow during storm events, much above the regular capacity of the channel. Such runoff has been observed to cause major flooding and back flow issues, as well as contributing to severe erosion within the channel, incision of the main channel, and turbidity/sediment issues regarding water quality.
WRMP for Red Bud – Catalpa Creek Watershed 19
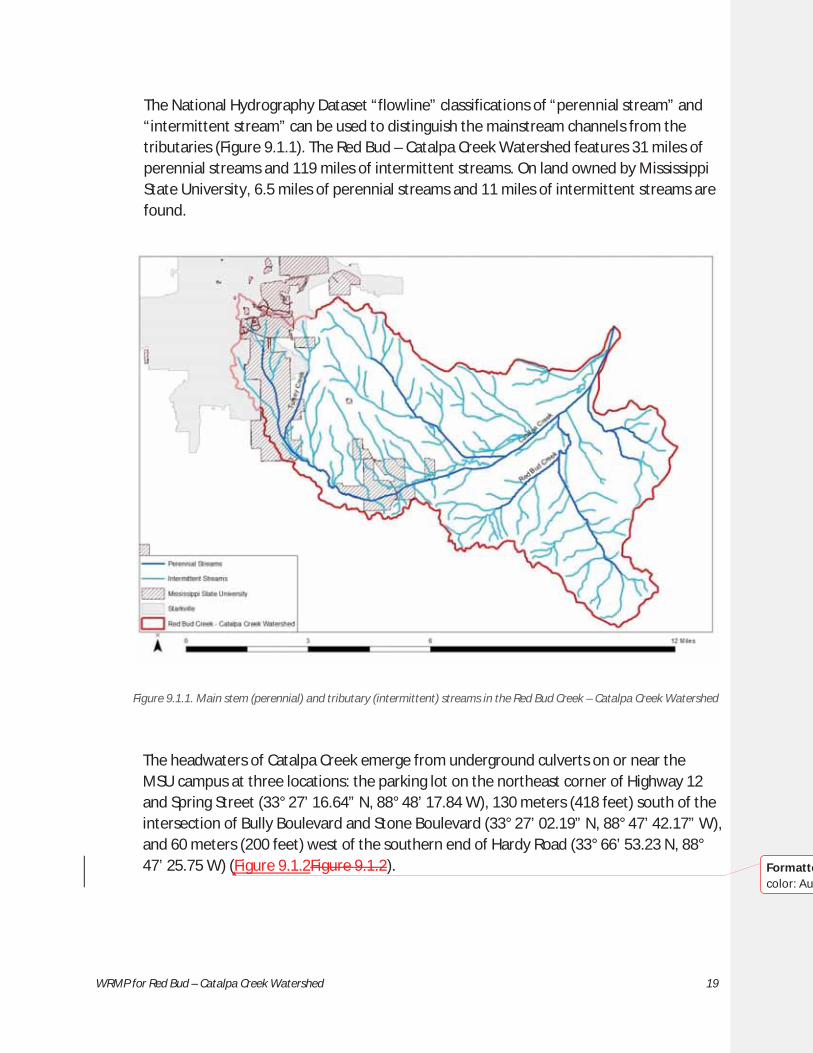
The National Hydrography Dataset “flowline” classifications of “perennial stream” and “intermittent stream” can be used to distinguish the mainstream channels from the tributaries (Figure 9.1.1). The Red Bud – Catalpa Creek Watershed features 31 miles of perennial streams and 119 miles of intermittent streams. On land owned by Mississippi State University, 6.5 miles of perennial streams and 11 miles of intermittent streams are found.
Figure 9.1.1. Main stem (perennial) and tributary (intermittent) streams in the Red Bud Creek – Catalpa Creek Watershed
The headwaters of Catalpa Creek emerge from underground culverts on or near the MSU campus at three locations: the parking lot on the northeast corner of Highway 12 and Spring Street (33° 27’ 16.64” N, 88° 48’ 17.84 W), 130 meters (418 feet) south of the intersection of Bully Boulevard and Stone Boulevard (33° 27’ 02.19” N, 88° 47’ 42.17” W), and 60 meters (200 feet) west of the southern end of Hardy Road (33° 66’ 53.23 N, 88° 47’ 25.75 W) (Figure 9.1.2Figure 9.1.2).
Formattecolor: Aut

WRMP for Red Bud – Catalpa Creek Watershed 20
Figure 9.1.2. Catalpa Creek origination points associated with the Mississippi State University campus and intermittent
stream flow lines from the National Hydrographic Database (NHD). NHD flow line endpoint vertices do not match actual locations of stream emergence from underground conveyance systems.
The Red Bud – Catalpa Creek Watershed lies completely within the Blackland Prairie (65a) Ecoregion (EPA Level IV, Figure 9.1.3Figure 9.1.3), a crescent-shaped belt that extends from the Mississippi-Tennessee border through Montgomery, Alabama. Blackland Prairie is described by Chapman et al. (2004) as a flat to undulating region underlain by distinctive Cretaceous-age chalk, marl, and calcareous clays of the Selma Group. These clays have smectitic or carbonatic mineralogy and tend to shrink and crack when dry and swell when wet. Streams have chalk, clay, sand, and silt substrates and flow is highly variable. Historically the natural vegetation of this ecoregion was dominated by sweetgum (Liquidamber styraciflua), post oak (Quercus stellate), blackjack oak (Q. marialndica), and red cedar (Juniperis virginiana), with patches of prairie dominated by warm-season grasses and forbs. The total amount of area historically covered by these has been the subject of debate, and although the region is often referred to or characterized as “prairie” most writers consider it to be a mosaic of vegetation types: open prairie, chalk outcrops, woodland, and forest. Barone (2005) concludes that, while never dominant, the prairie patches once formed an important and coherent ecosystem.
Formattecolor: Aut

WRMP for Red Bud – Catalpa Creek Watershed 21
Figure 9.1.3. Ecoregion Map of Northeast Mississippi (EPA).
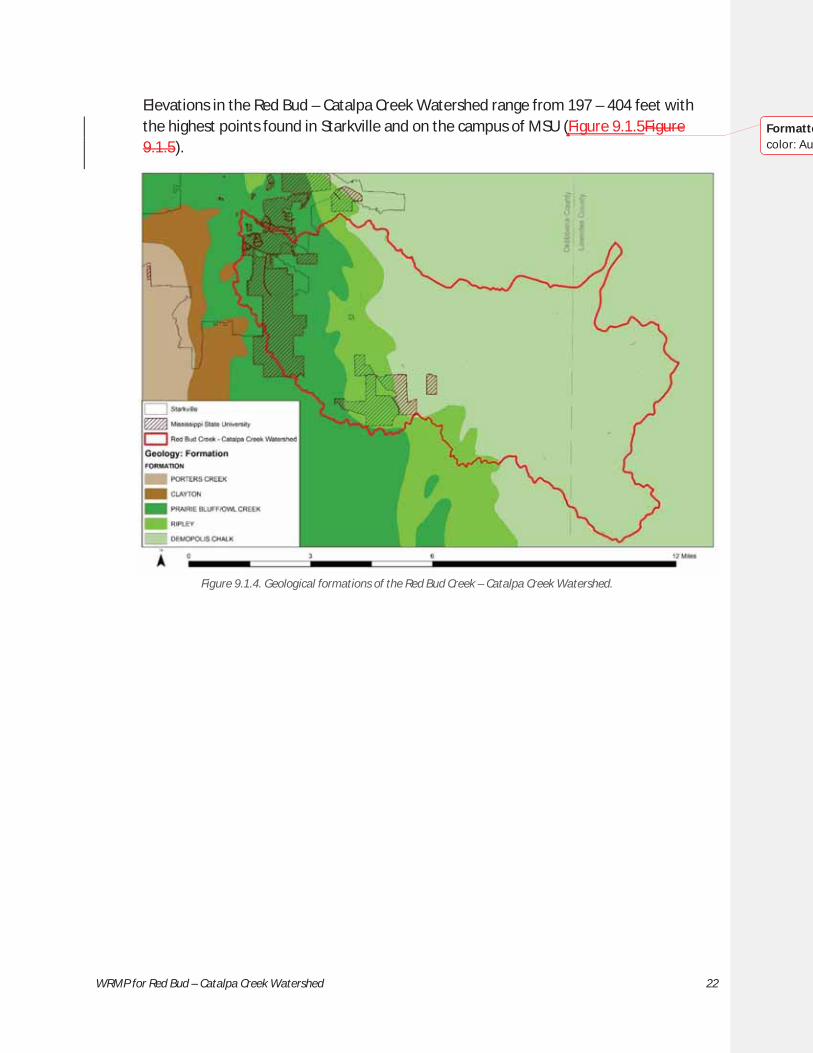
The dip of the Cretaceous strata is generally towards the Gulf of Mexico in Alabama and towards the Mississippi River in Mississippi, causing the geologic formations to be progressively older in a northeastward direction. The Selma group formations in the Red Bud Creek – Catalpa Creek watershed are (in an east-to-west/old-to-young progression) Demopolis Chalk, Ripley, and Prairie Bluff/Owl Creek (Figure 9.1.4Figure 9.1.4).
The Surface Geology Division at the MDEQ website hosts a list of geology unit descriptions for the state, from which these are described:
Demopolis chalk: Chalk and marly chalk containing fewer impurities than underlying and overlying formations.
Ripley: Grey to greenish-gray fine glauconitic sand, clay, and sandy limestone. Prairie Bluff and Owl Creek: Prairie Bluff chalk, compact brittle chalk, sandy chalk,
and calcareous clay; at base contains many phosphatic molds of fossils.
Formattecolor: Aut
WRMP for Red Bud – Catalpa Creek Watershed 22
Elevations in the Red Bud – Catalpa Creek Watershed range from 197 – 404 feet with the highest points found in Starkville and on the campus of MSU (Figure 9.1.5Figure 9.1.5).
Figure 9.1.4. Geological formations of the Red Bud Creek – Catalpa Creek Watershed.
Formattecolor: Aut

WRMP for Red Bud – Catalpa Creek Watershed 23
Figure 9.1.5. Elevations Map of the Red Bud – Catalpa Creek Watershed.
Small tributaries at the upper part of the watershed, including the main stream reach before Blackjack Road (Figure 9.1.6), are stable grassed channels that present some backwater flow and floodplain flooding during high stormflow events caused by the presence of downstream hydraulic structures (i.e. culverts and dam). However, these streams appear to present an early stage of incision probably due to their very low sinuosity and the increase in extension of developed areas on the MSU campus, which reduce the time of concentration and increase the magnitude of the peak flow discharges during stormflow events that usually occur during the winter and spring seasons, most commonly, when the groundcover of the streambanks is reduced.

WRMP for Red Bud – Catalpa Creek Watershed 24
Figure 9.1.6. Headwater tributaries of the Red Bud – Catalpa Creek Watershed.
The incised main channel of the Catalpa Creek experiences undercutting, streambed outcrop, and streambank instability along several segments of the approximated four miles this waterbody runs through the MSU South Farm (Figure 9.1.7). These channel degradation processes alternate with the presence of sand and gravel bars observed a few feet upstream of road crossings and stream junctions, and inside of bendway segments (Figure 9.1.8). The culvert on the main stream on Blackjack Road, at the boundary of the MSU campus, appears to be an initial knickpoint that has importantly affected the flow regime and sediment transport capacity of the fluvial system downstream. These conditions, in addition to the high flows coming from the campus during stormflow events, the very low sinuosity of the channel, the presence of a hydraulic structure (dam) in a tributary, additional road crossings along the main stream, and several point source flows (i.e. pipes) appear to be increasing the channel slope, and increasing undercutting, streambed erosion and incision, and streambank failure of the main stream and tributaries, including the Turkey Creek. Accessibility to the streams is very limited and unstable active streambanks are easily identified. Rates of streambank erosion are not reported for the Catalpa Creek or its tributaries, yet, but studies in the Ecoregion 65 in Mississippi have reported widening rates of up to 2.7 m per year (Ramirez-Avila, 2011, Simon et al., 2002). Right at the boundary of the university’s research farm, the stream maintains its incised conditions, but an increase in its sinuosity is evidenced by the most common presence of segments with sequential patterns of rills and pools, and a reduction in the channel slope and the streambank sides’ slopes (Figure 9.1.7). Undercutting and active unstable streambanks are observed, but their frequency along the watercourse towards the MSU beef unit facility and the watershed outlet is reduced.
Field Cod

WRMP for Red Bud – Catalpa Creek Watershed 25
Figure 9.1.7. Evidences of low sinuosity, active unstable streambanks, undercutting and streambed erosion/outcrop along the main stream and below a hydraulic structure in a tributary of the Red Bud –
Catalpa Creek Watershed.

WRMP for Red Bud – Catalpa Creek Watershed 26
Figure 9.1.8. Sand and gravel bars formation along internal sides of bendways, upstream of streams junction and stream segments with abundant vegetation along the main stream of the Red Bud – Catalpa Creek Watershed.

WRMP for Red Bud – Catalpa Creek Watershed 27
The proposed Total Maximum Daily Load (TMDL) for the Tibbee Creek (MDEQ, 2006) determined the main stream of the Catalpa Creek watershed was biologically impaired due to sediments, and recommended that streams within the entire Tibbee Creek watershed be considered a priority for streambank and riparian buffer zone restoration and sediment reduction Best Management Practices (BMPs), especially for the cultivated lands, road crossings and construction activities (MDEQ, 2006). The targeted sediment yield for the Tibbee Creek watershed ranges from 0.0004 to 0.0018 tons per acre per day at the effective discharge, also known as bankfull discharge (Q1.5). This range was reported by Simon et al. (2002) to determine acceptable sediment yields for stable streams within the entire Ecoregion 65. The estimated existing range for the Tibbee Creek waterbodies included in the TMDL is 0.002 to 0.054 tons per acre per day at the effective discharge. Using the area-sediment load relationship generated by Ramirez-Avila et al. (2015b) (Figure 9.1.10, Figure 9.1.11), the daily sediment load for the Red Bud – Catalpa Creek Watershed is 0.005 ton/acre per day, which falls into the range proposed by the TMDL report.
Figure 9.1.10. Regional annual sediment load at bankfull discharge (Qs1.5) – watershed area
relationship for the upper Tombigbee River Basin (source Ramirez-Avila et al. (2015b)).
y = 385.81xR2 = 0.87
0
2
4
6
8
10
12
14
16
18
20
0 10 20 30 40 50
Mill
ions
ThousandsWatershed Area (km2)
Ann
ual S
uspe
nded
Sed
imen
t Loa
d (M
g yr
-1)
Figure 9.1.9. Riffles and pool segment in a meandering section along the Red Bud – Catalpa Creek Watershed.

WRMP for Red Bud – Catalpa Creek Watershed 28
Figure 9.1.11. Regional annual total sediment load (Qs) at mean daily flow – watershed area
relationship for the upper Tombigbee River Basin (source Ramirez-Avila et al. (2015b)).
99.2 SOILS
The majority of the soils in the Red Bud-Catalpa Creek Watershed (Figure 9.2.1, Table 9.2.1) fall into one of two soil associations, namely those in:
1. Areas on flood plains dominated by nearly level soils; and those in 2. Areas on uplands dominated by unstable soils over chalk. The former is
comprised of the Leeper-Marietta-Catalpa association while the latter is made up of the Kipling-Savannah-Oktibbeha association. Together they occupy nearly 20,000 acres or 70% of the watershed.
The Leeper-Marietta-Catalpa association formed in recent alkaline, clayey alluvium derived from Prairie Bluff and Demopolis materials, and in mixed loamy and clayey, slightly acid to alkaline, recent prairie and Ripley coastal plain uplands. Both Leeper and Catalpa soils have significant shrink-swell properties and are somewhat poorly to moderately well-drained. The Marietta soils are moderately well drained. Flooding limits the use of some of the members of this association to some extent, but where there is drainage some of the largest farms in the watershed are in this association. The Kipling-Savannah-Oktibbeha association occurs on gently sloping ridgetops and moderately steep side slopes. It is composed of somewhat poorly to moderately well drained soils that developed from the chalk of the Prairie Bluff and Demopolis formations. Kipling soils are on ridgetops and sideslopes and have clayey subsoils, while Oktibbeha, also with clayey subsoils are on knoll-shaped ridgetops. Savannah soils occur on narrow ridgetops and have fragipans. The farms of this association are larger than the average for the watershed. Mississippi State University is located primarily in the Kipling-Savannah-Oktibbeha association. Erosion is a hazard on the ridgetops.
y = 105.35xR2 = 0.65
0
1
2
3
4
5
0 10 20 30 40 50
Mill
ions
ThousandsWatershed Area (km2)
Ann
ual T
otal
Sed
imen
t Loa
d (M
g yr
-1)

WRMP for Red Bud – Catalpa Creek Watershed 29
The distribution of land use capability ratings for members of both soil associations is shown in Figure 9.2.2Figure 9.2.2 and Table 9.2.2. Land capability class provides a general indicator of the suitability of soils for most kinds of field crops. There are eight classes and range from I, which has few limitations restricting use to VIII, which has limitations precluding their use for commercial plant production. Almost 50 percent of the major soils in the watershed are in class II and III, and require moderate to special conservation practices in order to avoid the risk of damage to them.
Available water capacity (AWC) ratings are shown in Figure 9.2.3 and Table 9.2.3. A soil depth of 12 inches (30.5 cm) with an AWC rating of 0.11 cm water/cm soil holds 3.4 cm of water available for plant use. As a comparison, 30.5 cm of a soil with an AWC of 0.2 cm water/cm soil can hold 6.1 cm of available water. For a daily evapotranspiration demand of 0.28 cm, the higher AWC can provide 22 days of moisture to plants as compared to 12 for the lower one. Drainage classes for the predominant soil associations are shown in Figure 9.2.4 and Table 9.2.4. Moderately well drained and somewhat poorly drained map units are roughly equal in terms of spatial extent. The Leeper unit, which falls into the highest land capability class in the watershed was formed under wet conditions, which can become drainage issues when under cultivation. Conversely, the moderately well drained Oktibbeha units on 8-17 per cent slopes have severe restrictions due to steepness.
Table 9.2.1. Map Legend and Distribution by Soil Taxonomy of Leeper-Marietta-Catalpa and Kipling-Savannah-Oktibbeha Associations.
SOIL SYMBOL AND TAXONOMY ACRES PERCENT OF WATERSHED
Leeper Fine, smectitic, nonacid, thermic Vertic Epiaquepts 3,618 13 Marietta Fine-loamy, siliceous, active, themic Fluvaquentic
eutrudepts 1,147 4
Catalpa Fine, smectitic, themic Fluvaquentic Hapludolls 3,055 11 Kipling Fine, smectitic, themic Vertic Paleudalfs 5,725 20
Savannah Fine-loamy, siliceous, semiactive, themic Typic Fragiudults
2,196 8
Oktibbeha Very fine, smectitic, themic Chromic Dystruderts 4,128 15
Table 9.2.2. Map Legend and Distribution by Non-Irrigated Capability Class of Members of Leeper-Marietta-Catalpa and Kipling-Savannah-Oktibbeha Associations.
SYMBOL AND CAPACITY CLASS
MAP UNIT NAMES
ACRES PERCENT OF WATERSHED
Class I Leeper (0-2 % slopes); Marietta; Catalpa; Savannah (2-5% slopes)
8,685 30
Class II Kipling (0-2% slopes); Kipling (2-5% slopes, eroded); Savannah (5-8% slopes); Oktibbeha (2-5% slopes)
5,265 18
Class IV Kipling (5-8% slopes); Savannah (8-12% slopes); Oktibbeha (5-8% slopes)
2,723 10
Class VI Oktibbeha (8-17% slopes) 2,745 10 Class VII Kipling (17-40% slopes) 540 2

WRMP for Red Bud – Catalpa Creek Watershed 30
Table 9.2.3. Map Legend and Distribution of Classes of Available Water Capacity (AWC) for Members of Leeper-Marietta-Catalpa and Kipling-Savannah-Oktibbeha Soil Associations.
SYMBOL AND AWC CLASS (CM WATER/CM SOIL)
MAP UNIT NAMES
ACRES PERCENT OF WATERSHED
<=0.11 Savannah 2,688 9 >0.11 and <=0.13 Oktibbeha 3,725 13 >0.13 and <=0.17 Marietta 1,147 4 >0.17 and <=0.19 Leeper; Catalpa 5,203 18 >0.19 and <=0.21 Kipling 5,725 20
Table 9.2.4. Map Legend and Distribution of Drainage Classes for the Members of Leeper-Marietta-Catalpa and Kipling-Savannah-Oktibbeha Soil Associations.
SYMBOL AND DRAINAGE CLASS
MAP UNIT NAMES
ACRES PERCENT OF WATERSHED
Moderately well drained Marietta; Catalpa; Savannah; Oktibbeha
10,616 37
Somewhat poorly drained Leeper; Kipling 9,344 32
Figure 9.2.1. Soil Taxonomy Classification for Red Bud-Catalpa Creek Watershed.

WRMP for Red Bud – Catalpa Creek Watershed 31
Figure 9.2.2. Non-Irrigated Land Use Capability Classes for Red Bud-Catalpa Creek Watershed.
Figure 9.2.3. Available Water Capacity Classes for Soils in the Red Bud-Catalpa Creek Watershed.

WRMP for Red Bud – Catalpa Creek Watershed 32
Figure 9.2.4. Available Water Capacity Classes for Soils in the Red Bud-Catalpa Creek Watershed.
99.3 CLIMATE AND PRECIPITATION Available Precipitation Datasets. There are several sources of viable real-time and historical precipitation data for the Catalpa Creek watershed, including both surface gauge observations and radar-based estimates. Available surface observations include: (1) a National Weather Service (NWS) cooperative observer (COOP) gauge, which has a period of record of Sep. 1, 1891 - present, and (2) a USDA Soil Climate Analysis Network (SCAN) site with a period of record of Apr. 21, 2002 – present. Radar-based precipitation estimates are from the NWS NEXRAD product, and have a period of record of Apr. 1, 1996 – present. Details and descriptions of the various precipitation data sources are included in Table 9.3.1.
An analysis of bias between the various data sources was conducted by Dyer (2009), with results showing that the surface gauge and radar-based precipitation estimates are comparable and can be used interchangeable with minimal statistical error. For analysis of precipitation patterns over the Catalpa Creek watershed, data from the NWS cooperative observer gauge were used since it provides the longest period of record.

WRMP for Red Bud – Catalpa Creek Watershed 33
However, due to missing data issues and to focus the analysis on recent historical patterns, the period of analysis was limited to Jan. 1, 1948 – Dec. 31, 2014.
Table 9.3.1. Overview of Available Precipitation Data Sources over the Catalpa Creek Watershed.
Annual Precipitation Patterns. Based on cumulative annual precipitation values derived from daily estimates from the NWS cooperative gauge, Catalpa Creek watershed receives an average of 1,378 mm of precipitation per year (standard deviation of 301 mm). Despite a considerable range in annual precipitation, the data show a relatively stable pattern with no significant trend. A frequency analysis of cumulative annual precipitation shows that the values are generally normally distributed, with no statistically significant outliers (Figure 9.3.1). As such, annual precipitation estimates using the mean/standard deviation values described above can be considered viable for further near-future hydrologic analysis and design.
Figure 9.3.1. Cumulative annual precipitation time series from the NWS COOP surface gauge. *
*Note that years with >30 missing data points were excluded.
DATA SOURCE OBSERVATION TYPE PERIOD OF RECORD DESCRIPTION NWS COOP Surface gauge 1891-09-01 to present Lat: 33.4692 N
Lon: -88.7822 W Time step: Daily Site ID: 228374 (COOP), USC00228374 (GHCN)
USDA COOP Surface gauge 2002-04-21 to present Lat: 33° 38’ N Lon: -88° 46’ W Time step: Hourly Site ID: 2064
NWS NEXRAD Radar-based / Multi-sensor
1996-4-1 to present Nominal 4-kmx4-km polar stereographic grid with hourly estimates

WRMP for Red Bud – Catalpa Creek Watershed 34
Seasonal Precipitation Patterns. Seasonal precipitation patterns were analyzed by accumulating precipitation records over four three-month seasons from 1948 - 2014: Winter (Jan.-Mar.), spring (Apr.-Jun.), summer (Jul.-Sep.), fall (Oct.-Dec.) (Table 9.3.2). In general, winter has the highest average precipitation (406 mm) and summer has the lowest (293 mm); however, summer has the highest variability (standard deviation of 129 mm), indicating that seasonal means are not indicative of near-future water availability. Seasonal time series (Figure 9.3.2) indicate that although some years show shared high/low precipitation in adjacent seasons, there is generally no visible consistency between seasons and precipitation depth. As such, cumulative precipitation from one season cannot be reliably used to predict precipitation for a subsequent season – in other words, a wet summer does not necessarily imply a wet winter. The high variability of convective rainfall makes seasonal prediction extremely difficult. As such, defining future seasonal rainfall values inherently includes a substantial degree of uncertainty.
Figure 9.3.2. Cumulative seasonal precipitation time series from the NWS COOP surface gauge.*
*Note that seasons with >10 missing data points were excluded.
Table 9.3.2. Statistical Descriptions of Cumulative Seasonal Precipitation (1948 – 2014).*
SEASON AVERAGE (MM) STANDARD DEVIATION (MM)
MAXIMUM (MM)
MINIMUM (MM)
Winter 406 127 690 149
Spring 350 126 752 97
Summer 293 129 671 58
Fall 324 114 708 110
*Note that seasons with >10 missing data points were excluded from the analysis.
WRMP for Red Bud – Catalpa Creek Watershed 35
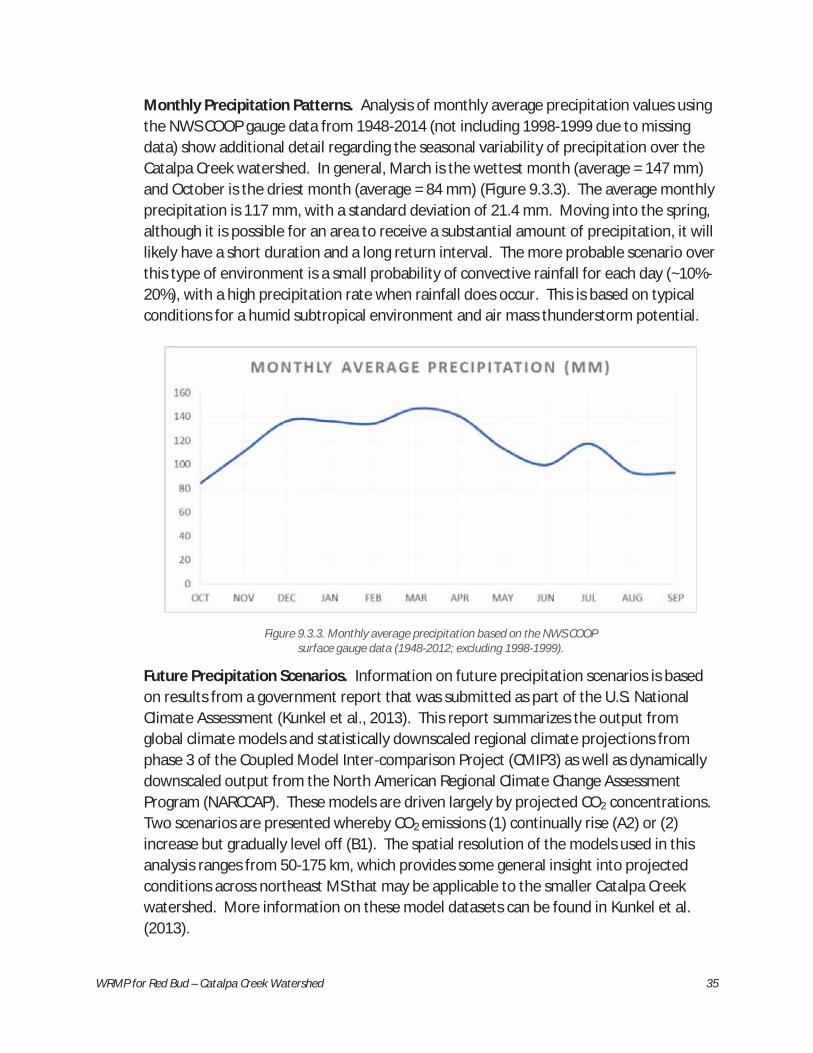
Monthly Precipitation Patterns. Analysis of monthly average precipitation values using the NWS COOP gauge data from 1948-2014 (not including 1998-1999 due to missing data) show additional detail regarding the seasonal variability of precipitation over the Catalpa Creek watershed. In general, March is the wettest month (average = 147 mm) and October is the driest month (average = 84 mm) (Figure 9.3.3). The average monthly precipitation is 117 mm, with a standard deviation of 21.4 mm. Moving into the spring, although it is possible for an area to receive a substantial amount of precipitation, it will likely have a short duration and a long return interval. The more probable scenario over this type of environment is a small probability of convective rainfall for each day (~10%-20%), with a high precipitation rate when rainfall does occur. This is based on typical conditions for a humid subtropical environment and air mass thunderstorm potential.
Figure 9.3.3. Monthly average precipitation based on the NWS COOP
surface gauge data (1948-2012; excluding 1998-1999).
Future Precipitation Scenarios. Information on future precipitation scenarios is based on results from a government report that was submitted as part of the U.S. National Climate Assessment (Kunkel et al., 2013). This report summarizes the output from global climate models and statistically downscaled regional climate projections from phase 3 of the Coupled Model Inter-comparison Project (CMIP3) as well as dynamically downscaled output from the North American Regional Climate Change Assessment Program (NARCCAP). These models are driven largely by projected CO2 concentrations. Two scenarios are presented whereby CO2 emissions (1) continually rise (A2) or (2) increase but gradually level off (B1). The spatial resolution of the models used in this analysis ranges from 50-175 km, which provides some general insight into projected conditions across northeast MS that may be applicable to the smaller Catalpa Creek watershed. More information on these model datasets can be found in Kunkel et al. (2013).

WRMP for Red Bud – Catalpa Creek Watershed 36
Figure 9.3.4 shows the percent change in annual precipitation (with respect to the base period 1971-1999) across the Southeast U.S. based on the mean output from all CMIP3 models for each of the future time periods mentioned above. The multi-model means for both the A2 and B1 scenarios suggest an overall decrease in annual precipitation across northeast MS of up to 3% throughout the first half of the 21st century. However, it should be noted these projections are smaller than typical year-to-year variations seen in the observed record. Moreover, there is disagreement among the emissions scenarios over the direction of the change in annual
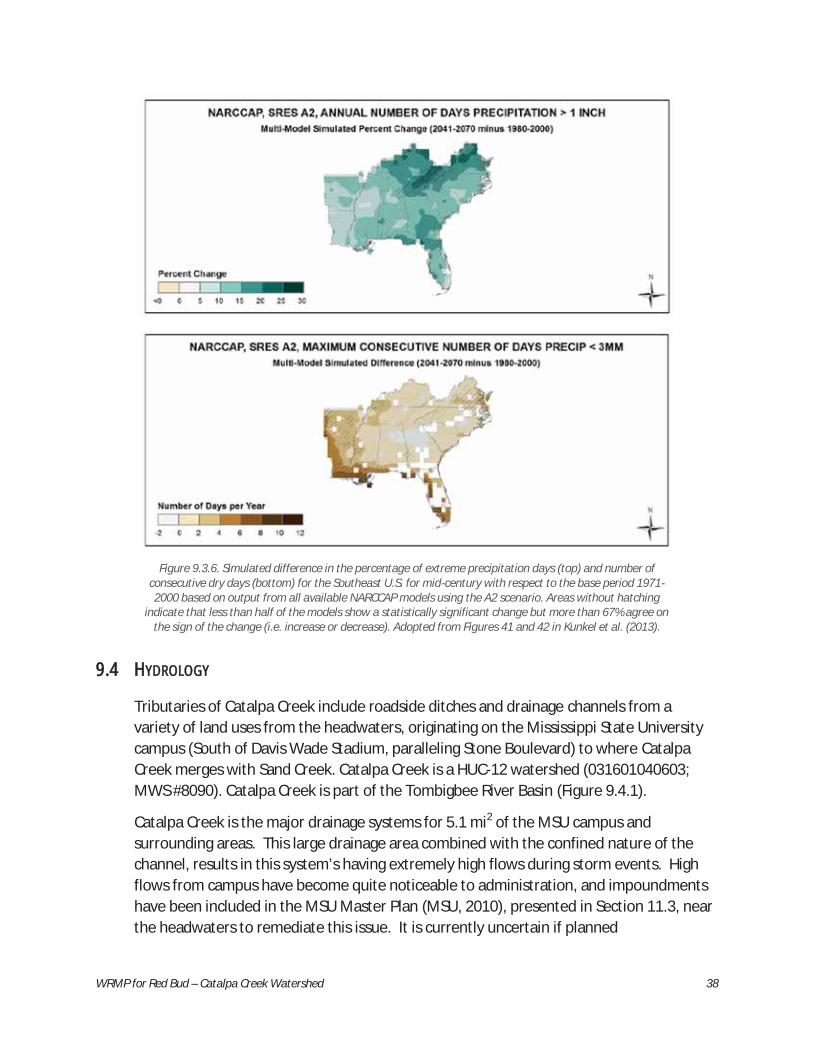
precipitation by the end of the 21st century; under the A2 scenario, most models project a statistically significant decrease in annual precipitation across the region encompassing the Catalpa Creek watershed, while an increase in precipitation is suggested under the B1 scenario. When examined by season, the greatest increases are expected during winter and spring, while summertime precipitation is expected to decrease by up to 5% (Figure 9.3.5). However, these changes are not statistically significant from the 1971-2000 base period. The annual number of days with extreme precipitation (>1 inch), as well as the number of consecutive dry days, are both expected to increase across northeast MS by mid-century,
Figure 9.3.4. Simulated difference in annual mean precipitation for the Southeast U.S. for each future time period with respect to the base period 1971-1999 based on output from all
available CMIP3 models using the A2 and B1 scenarios. Hatched areas indicate that more than half of the models show a statistically significant change in precipitation and more
than 67% agree on the sign of the change (i.e. increase or decrease). Adopted from Figure 37 in Kunkel et al. (2013).
WRMP for Red Bud – Catalpa Creek Watershed 37
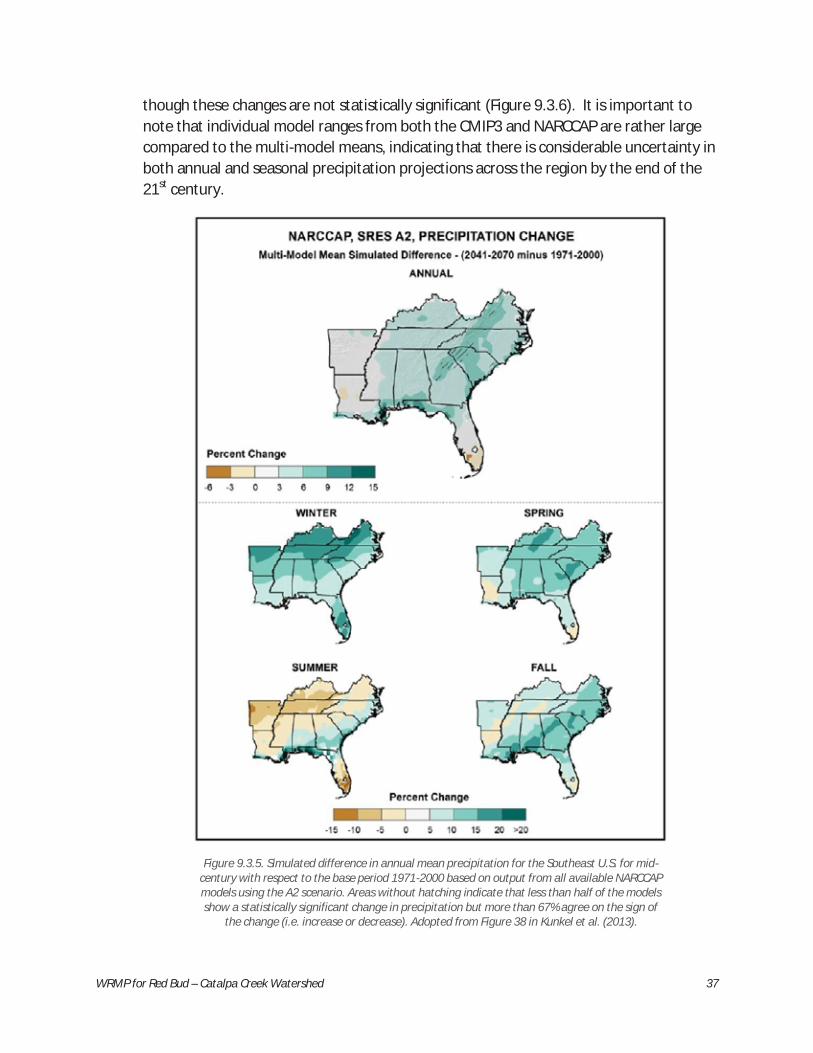
though these changes are not statistically significant (Figure 9.3.6). It is important to note that individual model ranges from both the CMIP3 and NARCCAP are rather large compared to the multi-model means, indicating that there is considerable uncertainty in both annual and seasonal precipitation projections across the region by the end of the 21st century.
Figure 9.3.5. Simulated difference in annual mean precipitation for the Southeast U.S. for mid-
century with respect to the base period 1971-2000 based on output from all available NARCCAP models using the A2 scenario. Areas without hatching indicate that less than half of the models show a statistically significant change in precipitation but more than 67% agree on the sign of
the change (i.e. increase or decrease). Adopted from Figure 38 in Kunkel et al. (2013).
WRMP for Red Bud – Catalpa Creek Watershed 38
Figure 9.3.6. Simulated difference in the percentage of extreme precipitation days (top) and number of
consecutive dry days (bottom) for the Southeast U.S. for mid-century with respect to the base period 1971-2000 based on output from all available NARCCAP models using the A2 scenario. Areas without hatching
indicate that less than half of the models show a statistically significant change but more than 67% agree on the sign of the change (i.e. increase or decrease). Adopted from Figures 41 and 42 in Kunkel et al. (2013).
99.4 HYDROLOGY
Tributaries of Catalpa Creek include roadside ditches and drainage channels from a variety of land uses from the headwaters, originating on the Mississippi State University campus (South of Davis Wade Stadium, paralleling Stone Boulevard) to where Catalpa Creek merges with Sand Creek. Catalpa Creek is a HUC-12 watershed (031601040603; MWS #8090). Catalpa Creek is part of the Tombigbee River Basin (Figure 9.4.1).
Catalpa Creek is the major drainage systems for 5.1 mi2 of the MSU campus and surrounding areas. This large drainage area combined with the confined nature of the channel, results in this system’s having extremely high flows during storm events. High flows from campus have become quite noticeable to administration, and impoundments have been included in the MSU Master Plan (MSU, 2010), presented in Section 11.3, near the headwaters to remediate this issue. It is currently uncertain if planned

WRMP for Red Bud – Catalpa Creek Watershed 39
impoundments are designed based on engineered surveys and will meet size requirements to capture runoff during extreme events. Also, no timeline for implementation has yet been indicated.
Figure 9.4.1. Hydrologic Features of the Red Bud – Catalpa Creek Watershed.
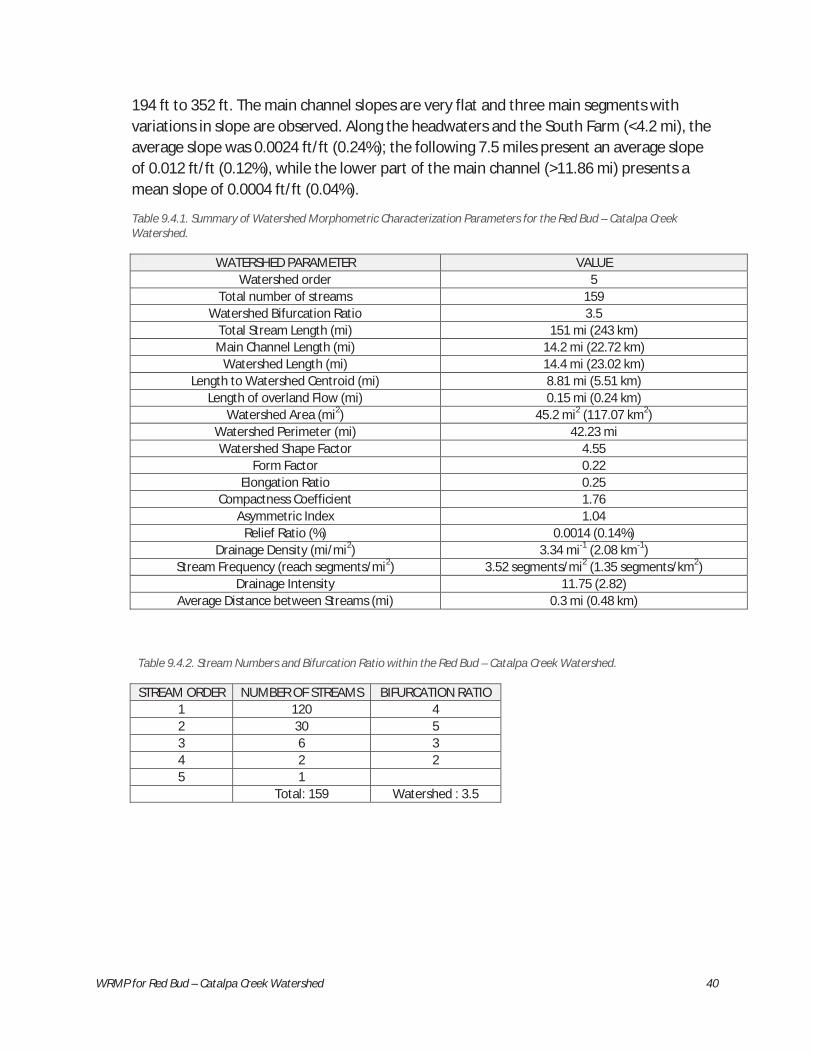
A morphometric characterization of the Red Bud – Catalpa Creek Watershed is presented in Table 9.4.1. The watershed is a fifth-order, with a low bifurcation ratio (3.5), which is an indication that the geological structures are less disturbing to the drainage pattern (Table 9.4.2). A moderate number of streams (159 streams) is observed within the watershed area, reflecting a stream frequency of about 1 stream segment per each 0.3 mi2. Along with the stream frequency, the drainage density (3.34 mi/mi2) and the stream intensity (11.75) are indicators of a moderately well drained watershed in terms of the spatial distribution of the stream’s network. The magnitude of the asymmetric index (1.02) is evidence that the hydrologic contribution from each one of the two areas created by dividing the watershed along the main channel is relatively homogeneous. However, the upper part of the watershed, right before the main stream joins to the biggest northern tributary, has significantly higher differences in the areal distribution, with the main stream lying along the southern area of the subwatershed. The magnitudes of the form factor (0.22) elongation ratio (0.25), and compactness ratio (1.76), correspond to an oblong rectangular watershed that will have flatter peaks of flow for longer duration. The main channel has a very gentle slope (0.14%). Table 9.4.1 presents the profile along the entire 14.2 miles of the main stream. Mean elevations along the main channel range from
WRMP for Red Bud – Catalpa Creek Watershed 40
194 ft to 352 ft. The main channel slopes are very flat and three main segments with variations in slope are observed. Along the headwaters and the South Farm (<4.2 mi), the average slope was 0.0024 ft/ft (0.24%); the following 7.5 miles present an average slope of 0.012 ft/ft (0.12%), while the lower part of the main channel (>11.86 mi) presents a mean slope of 0.0004 ft/ft (0.04%).
Table 9.4.1. Summary of Watershed Morphometric Characterization Parameters for the Red Bud – Catalpa Creek Watershed.
WATERSHED PARAMETER VALUE Watershed order 5
Total number of streams 159 Watershed Bifurcation Ratio 3.5
Total Stream Length (mi) 151 mi (243 km) Main Channel Length (mi) 14.2 mi (22.72 km)
Watershed Length (mi) 14.4 mi (23.02 km) Length to Watershed Centroid (mi) 8.81 mi (5.51 km)
Length of overland Flow (mi) 0.15 mi (0.24 km) Watershed Area (mi2) 45.2 mi2 (117.07 km2)
Watershed Perimeter (mi) 42.23 mi Watershed Shape Factor 4.55
Form Factor 0.22 Elongation Ratio 0.25
Compactness Coefficient 1.76 Asymmetric Index 1.04
Relief Ratio (%) 0.0014 (0.14%) Drainage Density (mi/mi2) 3.34 mi-1 (2.08 km-1)
Stream Frequency (reach segments/mi2) 3.52 segments/mi2 (1.35 segments/km2) Drainage Intensity 11.75 (2.82)
Average Distance between Streams (mi) 0.3 mi (0.48 km)
Table 9.4.2. Stream Numbers and Bifurcation Ratio within the Red Bud – Catalpa Creek Watershed.
STREAM ORDER NUMBER OF STREAMS BIFURCATION RATIO 1 120 4 2 30 5 3 6 3 4 2 2 5 1 Total: 159 Watershed : 3.5

WRMP for Red Bud – Catalpa Creek Watershed 41
Figure 9.4.2. Main stream longitudinal profile in the Red Bud – Catalpa Creek Watershed.
Figure 9.4.3. Relationship between stream order and stream number in the Red Bud –
Catalpa Creek Watershed.
Figure 9.4.4. Daily discharge (up) and stage (down) at the 02441300
USGS Station in Mayhew, MS located 5 km downstream from the outlet of Red Bud - Catalpa Creek Watershed.
150
200
250
300
350
400
0 1 2 3 4 5 6 7 8 9 10 11 12 13 14 15
Elev
atio
n (ft
am
sl)
Stream mile (mi)
1
10
100
1000
0 2 4 6
Num
ber o
f str
eam
s
Stream Order

WRMP for Red Bud – Catalpa Creek Watershed 42
Currently, there is no source of historical flow information for the Red Bud – Catalpa Creek Watershed. A USGS Station (02441300) is located along the Catalpa Creek at Mayhew, MS. However, it is located around 5 miles downstream of the outlet of the area of study, and its flow discharge represents the hydrologic response for an area of 98 mi2. At this site, the annual peak flow discharge and stage information dates from 1964, but the daily stage and flow time series exist only since September 2014 ( Figure 9.4.4). Using the USGS PeakFQ software, a bankfull discharge of 5,330 ft3/s was estimated from the frequency curve of the station (Figure 9.4.5).
Figure 9.4.5. Frequency Curve for the Catalpa Creek at the 02441300 USGS
Station in Mayhew, MS located 5 km downstream from the outlet of Red Bud - Catalpa Creek Watershed.
Due to the lack of streamflow information, studies completed by MSU researchers to develop a water and a sediment budget along the Tombigbee River Basin are used as a reference to approximate the hydrologic response for the Red Bud - Catalpa Creek Watershed. Considering the relationships between drainage area and mean daily discharge (Figure 9.4.6), and between drainage area and bankfull discharge (assumed as the streamflow at a recurrence interval of 1.5 years (Q1.5)) (Figure 9.4.7), generated by Ramirez-Avila et al. (2013) and Ramirez-Avila et al. (2015a) for tributary sub-basins within the Tombigbee River Basin, the mean daily discharge ( ) and the bankfull discharge at the outlet of the 45.2 mi2 are 75 ft3/s and 2010 ft3/s, respectively.

WRMP for Red Bud – Catalpa Creek Watershed 43
Figure 9.4.6. Relationship between basin area and mean daily streamflow for tributaries sub-basins (red) and locations along the Tombigbee River and the
Tenn-Tom Waterway (blue) (source Ramirez-Avila et al. (2013)).
Figure 9.4.7. Regional bankfull discharge (Q1.5) – watershed area relationship for the upper
Tombigbee River Basin (source Ramirez-Avila et al. (2015b)).
Q = 0.7602*A1.109
R2 = 0.9959
Q = 1.7068*A0.9922
R2 = 0.99760.0
1.0
2.0
3.0
4.0
5.0
6.0
7.0
8.0
9.0
10.0
11.0
12.0
13.0
14.0
15.0
0 500 1000 1500 2000 2500 3000 3500 4000 4500 5000 5500 6000 6500 7000 7500 8000
Thou
sand
s
Sub-Basin Area (mi2)
Mea
n D
aily
Dis
char
ge (c
fs)
Q1.5 = 142.78A0.6937 R² = 0.854
100
1000
10000
100000
1 10 100 1000 10000
Q1.
5
Watershed Area (mi2)

WRMP for Red Bud – Catalpa Creek Watershed 44
Ground Water. The Gordo aquifer is the primary groundwater source of in the Red Bud - Catalpa Creek Watershed and is used for public water supplies and for domestic and farm wells in the area. Generally, the Gordo aquifer is capable of yielding greater quantities of water than the overlying Eutaw-McShan aquifer.
The Gordo Formation is a part of the Tuscaloosa Group of Upper Cretaceous age and includes the Gordo and Coker Formations. The Gordo is overlapped by the McShan and Eutaw Formations and is underlain by Paleozoic rocks in the north and by the Coker Formation to the south (Boswell, 1978). The Gordo is composed of sediments ranging from an upper unit composed mostly of clay and fine sand to a lower unit in which coarse quartz sand and chert gravel predominate. This lower unit comprises the Gordo aquifer. The Gordo Formation is less than 30 feet thick in Prentiss County and thickens to about 400 feet in Oktibbeha and Kemper Counties (Boswell, 1963). Regionally, the Gordo Formation thins to the north and northwest.
Recharge to the Gordo aquifer is primarily by precipitation on the outcrop near the Mississippi – Alabama border. Water moves southwestward in the subsurface from the outcrop areas (Boswell, 1978).
Public Water Supplies. Figure 9.4.8 delineates the certificated areas of the community water systems within the watershed.
Figure 9.4.8. Public Water Supply Certificated Areas.

WRMP for Red Bud – Catalpa Creek Watershed 45
Within these areas, there are twelve (12) active public water supply wells in the watershed – three in Lowndes County and nine in Oktibbeha County (Table 9.4.3).
Table 9.4.3. Public Water Supply Wells in the Red Bud – Catalpa Creek Watershed.
WELL ID PWS WELL DEPTH (FT) WELL GPM
440097-1 South Lowndes W/A 889 230
440001-3 Town of Artesia 1,030 216
440001-4 Town of Artesia 1,050 210
530019-1 Sessums W/A 1,231 160
530019-2 Sessums W/A 1,406 200
530024-2 Turkey Creek W/A 1,395 250
530012-2 Miss State University 1,430 1,000
530012-3 Miss State University 1,431 931
530012-4 Miss State University 1,341 1,200
530012-5 Miss State University 1,405 1,242
530002-2 Black Jack W/A 1,240 205
530002-3 Black Jack W/A 1,401 150
The average well depth is 1,271 feet with a maximum well depth of 1,431 feet and a minimum well depth of 889 feet. The average gallons per minute (gpm) is 500 gpm with a maximum gpm of 1,242 and a minimum gpm of 150. The combined potential groundwater withdrawal is 5,994 gpm.
The majority of the Red Bud – Catalpa Creek Watershed is covered by public water supply certificated areas. Thus most residents living in the watershed are on a community water system and not on a private well. The watershed is approximately 73% in Oktibbeha County and 27% in Lowndes County. If there was an equal geographic distribution of private well owners in each county, the Oktibbeha County portion of the watershed would have between 213 and 700 private well residents and the Lowndes County portion of the watershed would have between 0 and 195 private well residents.
99.5 LAND USE
The majority (44%) of the land use in the watershed is in hay production/pasture land, 2% is forested, shrub, and herbaceous land, while 10% is in cultivated crops, 8% is wetlands or open water, and 9% is developed land (Figure 9.5.1). Since 2001 there has been a loss of 51 acres of pasture land/hay production, a loss of 49 acres in cultivated crops, an increase in developed land by 21 acres, no change in open water or wetlands, and increase in forested, shrub, and herbaceous land by 79 acres (Figure 9.5.2).
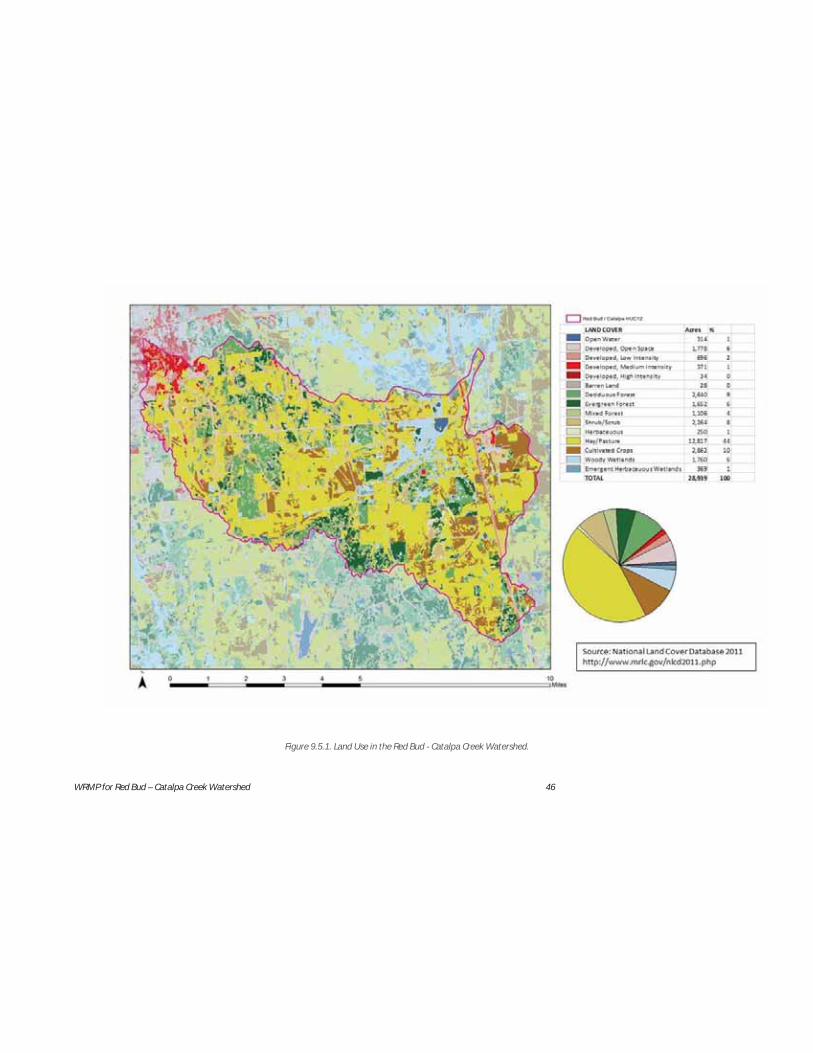
WRMP for Red Bud – Catalpa Creek Watershed 46
Figure 9.5.1. Land Use in the Red Bud - Catalpa Creek Watershed.
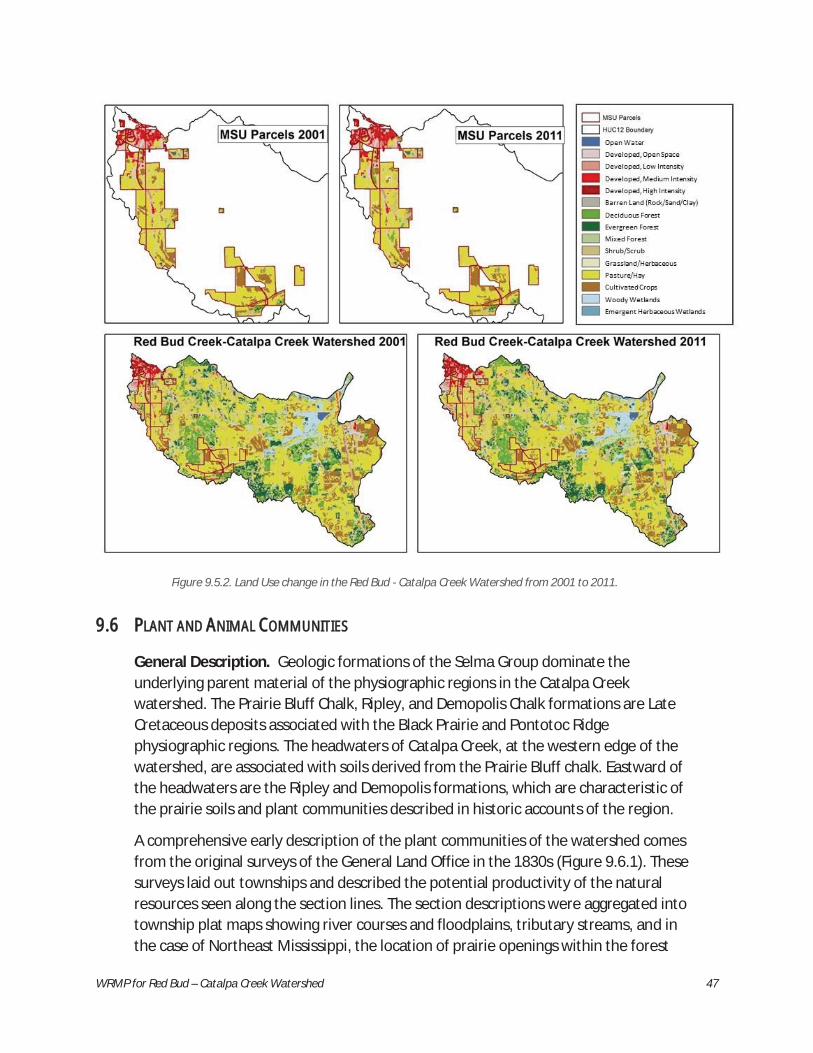
WRMP for Red Bud – Catalpa Creek Watershed 47
Figure 9.5.2. Land Use change in the Red Bud - Catalpa Creek Watershed from 2001 to 2011.
99.6 PLANT AND ANIMAL COMMUNITIES
General Description. Geologic formations of the Selma Group dominate the underlying parent material of the physiographic regions in the Catalpa Creek watershed. The Prairie Bluff Chalk, Ripley, and Demopolis Chalk formations are Late Cretaceous deposits associated with the Black Prairie and Pontotoc Ridge physiographic regions. The headwaters of Catalpa Creek, at the western edge of the watershed, are associated with soils derived from the Prairie Bluff chalk. Eastward of the headwaters are the Ripley and Demopolis formations, which are characteristic of the prairie soils and plant communities described in historic accounts of the region.
A comprehensive early description of the plant communities of the watershed comes from the original surveys of the General Land Office in the 1830s (Figure 9.6.1). These surveys laid out townships and described the potential productivity of the natural resources seen along the section lines. The section descriptions were aggregated into township plat maps showing river courses and floodplains, tributary streams, and in the case of Northeast Mississippi, the location of prairie openings within the forest
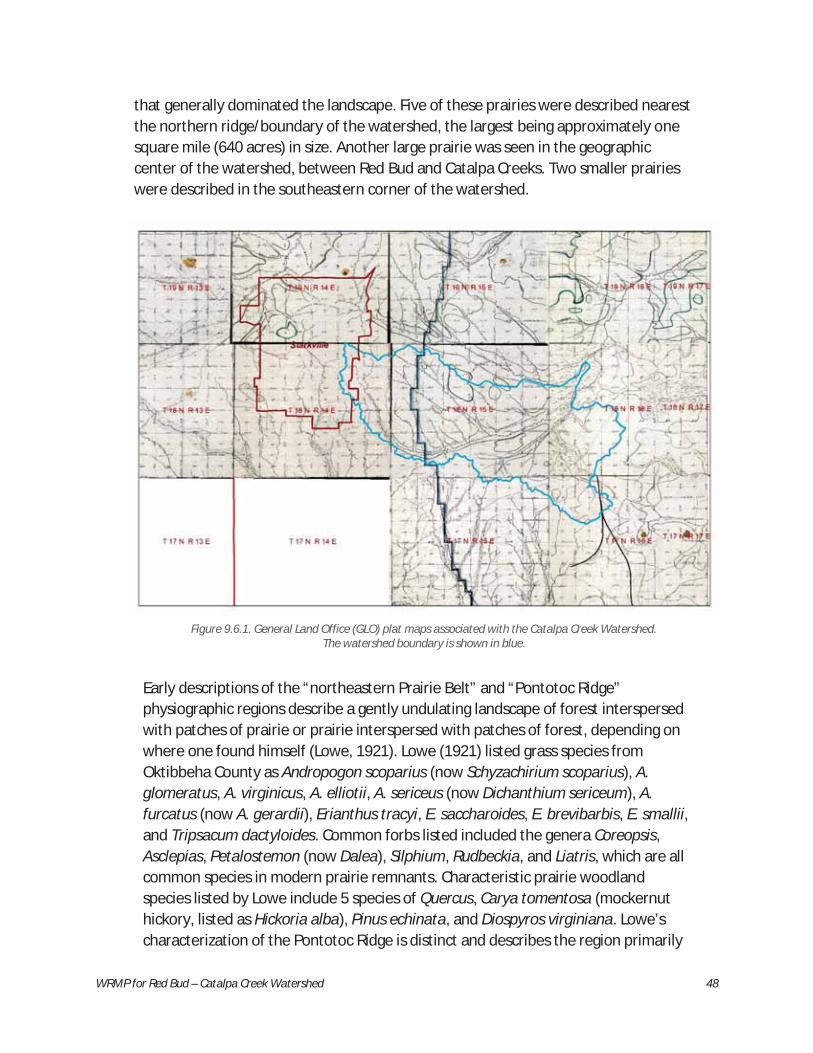
WRMP for Red Bud – Catalpa Creek Watershed 48
that generally dominated the landscape. Five of these prairies were described nearest the northern ridge/boundary of the watershed, the largest being approximately one square mile (640 acres) in size. Another large prairie was seen in the geographic center of the watershed, between Red Bud and Catalpa Creeks. Two smaller prairies were described in the southeastern corner of the watershed.
Early descriptions of the “northeastern Prairie Belt” and “Pontotoc Ridge” physiographic regions describe a gently undulating landscape of forest interspersed with patches of prairie or prairie interspersed with patches of forest, depending on where one found himself (Lowe, 1921). Lowe (1921) listed grass species from Oktibbeha County as Andropogon scoparius (now Schyzachirium scoparius), A. glomeratus, A. virginicus, A. elliotii, A. sericeus (now Dichanthium sericeum), A. furcatus (now A. gerardii), Erianthus tracyi, E. saccharoides, E. brevibarbis, E. smallii, and Tripsacum dactyloides. Common forbs listed included the genera Coreopsis, Asclepias, Petalostemon (now Dalea), Silphium, Rudbeckia, and Liatris, which are all common species in modern prairie remnants. Characteristic prairie woodland species listed by Lowe include 5 species of Quercus, Carya tomentosa (mockernut hickory, listed as Hickoria alba), Pinus echinata, and Diospyros virginiana. Lowe’s characterization of the Pontotoc Ridge is distinct and describes the region primarily
Figure 9.6.1. General Land Office (GLO) plat maps associated with the Catalpa Creek Watershed. The watershed boundary is shown in blue.

WRMP for Red Bud – Catalpa Creek Watershed 49
as seen to the north of the Red Bud - Catalpa Creek watershed. He describes a region that, south of Union County, is “less sandy, richer, and the hills less broken.” Dominant trees listed for the southern area of the region included 6 species of Quercus, Liquidambar styraciflua, Juglans nigra, Acer rubrum, Gleditsia triacanthos, and Liriodendron tulipifera.
More recent classification of the Prairie systems in NatureServe include Blackbelt Prairie Herbaceous Vegetation (an association of Schyzachirium scoparium-Sorghastrum nutans-Dalea candida-Liatris squarrosa), Blackbelt woodland (a Quercus stellata-Quercus muehlenbergii/Schyzachirium scoparium-Sorghastrum nutans association), and Cedar woodland (a Juniperus virginiana var. virginiana with Celtis laevigata-Prunus angustifolia-Sideroxylon lycioides association (NatureServe, 2015). Leidolf et al. (2002) described 16 plant communities from 5 broader categories, summarized in Table 9.6.1. The descriptions included are applicable in the Catalpa Creek watershed with the exception of the communities associated with the Flatwoods physiographic region, which is not represented in the watershed. NatureServe does not have any classification of the Pontotoc Ridge.
Table 9.6.1. Classification of Plant Communities by Leidolf et al. (2002).
HABITAT CATEGORY COMMUNITY TYPE Bottomland Forest Bottomland Hardwood Forest
Swamp Forest Upland Forest and Prairie Mesophytic Upland Hardwood Forest
Xeric Upland Hardwood Forest Pine Forest and Pine/Mixed Hardwood Forest Prairie Prairie Cedar Woodland Chalk Outcrops
Aquatic Communities Rivers/Creeks Canals/Drainage Ditches Lakes/Ponds/Impoundments
Seepage Areas Human-influenced Communities Cultivated Fields
Grass/Forb Meadows Roadsides Urban Areas
Disturbance patterns. Historic disturbance patterns in the Catalpa Creek watershed include row-crop and grazing agriculture, development, and fragmentation leading to the loss of the frequent fire regime that kept prairies clear of dominance by woody tree species. In the absence of fire, prairie habitat has an increased abundance of Juniperus virginiana and other calciphile woody species. There is very little evidence that prescribed burning or fire management is being used to manage the prairie resources of the watershed. The agricultural heritage of the watershed

WRMP for Red Bud – Catalpa Creek Watershed 50
includes a significant dairy industry that has decreased in recent years, mirroring a statewide decline of 65% from 1990-2006 (Philips, 2007), with only one commercial dairy in operation in Oktibbeha County, down from almost 1000 in the early 20th century (Brandon, 2011). Many of the former dairy operations have converted to beef cattle production, and 44% of the land area in the watershed is currently dedicated to pasture or hay systems (Figure 9.5.1). Another 10% of the land area in the watershed is under cultivation (Figure 9.5.1). Numerous NRCS programs are available to farmers in the area to mitigate the impacts of farming operations.
Quantification of remnant forest stands. Changes in land use have impacted the historic forest communities of the watershed, as evidenced by the legacy of the Giles Bur Oak Preserve on the South Farm adjacent to the campus of Mississippi State University. Established in May of 1968, the W.L. Giles Bur Oak Preserve consists of two small rectangular forest patches adjacent to Catalpa Creek that are surrounded by cattle pasture on Mississippi State University’s H.H. Leveck Animal Research Center (Figure 9.6.2). The southern unit is 3.39 acres, whereas the northern unit is 0.64 acres. The forest within the preserve is typical of alluvial forests in the Black Belt Prairie physiographic region, and contain several species of note, including bur oaks (Quercus macrocarpa), Ohio buckeye (Aesculus glabra) Durand oak (Quercus sinuata), and nutmeg hickory (Carya myristiciformis). The preserve was originally established to honor then-MSU president Dr. William Giles who is credited with discovering the trees in Mississippi, and to protect the population of bur oaks, which are ranked as S2 on the Mississippi Natural Heritage Program’s State Special Plants Tracking List, meaning that they are imperiled in the state due to rarity (6 to 20 occurrences or few remaining individuals or acres.
Initially, both sections of the preserve were fenced and identified by signs. In the years since, the signs have disappeared, the fence around the northern section has been removed, and the south unit has been overrun with Chinese privet (Ligustrum sinense). In 2013, efforts to revitalize interest in the preserve was initiated. The fencing was repaired around the southern section, new signage was established, and an inventory of the woody vegetation was conducted (Table 9.6.2 and Table 9.6.3), and a survey of the ant fauna of both sections of the preserve (Table 12.2.1) was initiated.
The inventory of the woody (not including privet) documented thirty-four tree species with hackberry (Celtis laevigata) being the most abundant species in both sections. Sixty-six bur oaks are currently protected within the preserve boundaries, which represents the largest protected population in the state.

WRMP for Red Bud – Catalpa Creek Watershed 51
Figure 9.6.2. Arial view of the two units of the W. L. Giles Bur Oak Preserve.
Table 9.6.2. Abundance and Sum Basal Area by Species and Percent Basal in m2 of the Southern Unit of the W.L. Giles Bur Oak Preserve (measurements in meters).
SPECIES ABUNDANCE BA SUM BY SP. BA PER HA % BA
Celtis laevigata 293 10.015 7.886 22.283 Fraxinus pennsylvanica 191 9.997 7.872 22.242 Liqidambar stryaciflua 144 0.808 0.636 1.797 Carya myristiciformis 84 1.252 0.986 2.785 Ulmus alata 69 0.814 0.641 1.811 Maclura pomifera 46 0.008 0.007 0.019 Quercus macrocarpa 45 2.296 1.808 5.109 Carya ovata 36 0.116 0.091 0.258 Acer negundo 28 0.764 0.601 1.699 Quercus nigra 24 3.692 2.907 8.214 Poncirus trifoliata 23 5.017 3.950 11.162 Quercus velutina 21 2.287 1.800 5.087 Aesculus glabra 18 0.094 0.074 0.210 Juniperus virginiana 12 0.300 0.236 0.668 Quercus pagoda 12 2.980 2.346 6.629

WRMP for Red Bud – Catalpa Creek Watershed 52
Continued from previous: Table 9.6.2. Abundance and Sum Basal Area by Species and Percent Basal in m2 of the Southern Unit of the W.L. Giles Bur Oak Preserve (measurements in meters).Table 9.6.2. Ab d d S B l A b S i d P t B l i 2 f th S th U it f th W LUlmus americana 11 0.047 0.037 0.104
Morus rubra 11 0.215 0.169 0.477 Aesculus pavia 6 0.774 0.610 1.722 Quercus rubra 6 0.300 0.236 0.667 Diospyros virginiana 5 1.466 1.154 3.262 Cercus canadensis 5 0.391 0.308 0.871 Quercus stellata 4 0.023 0.018 0.051 Sassafras albidum 4 0.172 0.136 0.383 Prunus carolina 3 0.015 0.011 0.032 Quercus falcata 3 0.005 0.004 0.011 Quercus michauxii 3 0.230 0.181 0.511 Prunus serotina 2 0.064 0.050 0.142 Cornus drummondii 2 0.074 0.058 0.164 Quercus coccinea 2 0.063 0.050 0.141 Cornus florida 1 0.001 0.001 0.002 Quercus alba 1 0.668 0.526 1.485 Totals 1115 44.947 35.391 100.000
Table 9.6.3. Abundance and Sum Basal Area by Species and Percent Basal in m2 of the Northern Unit of the W.L. Giles Bur Oak Preserve (measurements in meters).
SPECIES ABUNDANCE BA SUM BY SP.
BA PER HA % BA
Celtis laevigata 61 3.4666 15.0720 39.8396 Juniperus virginiana 25 1.2685 5.5151 14.5780 Quercus macrocarpa 21 1.2596 5.4764 14.4758 Carya ovata 9 0.3522 1.5313 4.0477 Ulmus alata 7 0.1899 0.8259 2.1831 Maclura pomifera 6 0.3194 1.3886 3.6705 Fraxinus pennsylvanica 5 0.3797 1.6511 4.3642 Aesculus glabra 4 0.0197 0.0857 0.2265 Quercus michauxii 4 0.5604 2.4365 6.4405 Juglans nigra 3 0.0798 0.3470 0.9171 Quercus pagoda 3 0.4356 1.8940 5.0065 Quercus sinuata 3 0.0685 0.2978 0.7872 Cercus canadensis 2 0.0334 0.1453 0.3841 Quercus velutina 1 0.0195 0.0847 0.2238 Quercus velutina 1 0.0189 0.0820 0.2167 Carya myristiciformis 1 0.0117 0.0508 0.1342 Pyrus sp. 1 0.0538 0.2337 0.6178 Quercus stellata 1 0.1642 0.7138 1.8868
Total 158 8.7013 37.8318 100
Formatted: F
Formatted: FSuperscript/ S
Formatted: F

WRMP for Red Bud – Catalpa Creek Watershed 53
Other plant community research conducted in the watershed (or nearby) include research on the botanical and ecological descriptions of Blackland Prairies by Leidolf and McDaniel (1998), Weiher et al. (2004), Schauwecker and MacDonald (2003), and Barone and Hill (2007). Schauwecker et al. (2007) considered the potential impacts of conservation planning on the MAFES Dairy Unit near Sessums.
Threatened and Endangered Species. Federally listed plant species from Oktibbeha County, and potentially in the Catalpa Creek watershed include Apios priceana (Price’s Potato Bean, McCook and Kartesz (2000), collected in 1990). The habitat requirements for Apios priceana are open mixed hardwood forest, of which forest associated with the Pontotoc Ridge would be possible. Leidolf et al. (2002) list 67 sensitive plant species for Oktibbeha County.
Species of Conservation Need. Species for which greatest conservation needs exist and are expected to be found with the watershed of interest are listed in Table 9.6.4.
Table 9.6.4. Mississippi Species of Greatest Conservation Need Known or Expected to Occur Within the Catalpa Creek Watershed (see table footer for explanation of State Rank and occurrence codes).
Family Scientific Name Common Name State Rank Occurrence
FRESHWATER MUSSELS
Unionidae
FISHES
Cottidae Cottus carolinae Banded Sculpin S1 P Cyprinidae Notropis edwardranyei Fluvial Shiner S1 P Cyprinidae Notropis candidus Siverside Shiner S2 P Cyprinidae Rhinichthys atratulus Blacknose Dace S1 P
INSECTS
Acrididae Pseudopomola brachyptera Short winged Toothpick Grasshopper S1 P Gryllotalpidae Gryllotalpa major Prairie Mole Cricket SH P
REPTILES
Anguidae Ophisaurus attenuatus Slender Glass Lizard S2 / S3 HR
Colubridae Lampropeltis calligaster calligaster Prairie Kingsnake S3 / S4 HR
Colubridae Lampropeltis calligaster rhombomaculata Mole Kingsnake S3 HR
Colubridae Lampropeltis triangulum syspila Red Milk Snake S3 HR
Colubridae Masticophis flagellum Eastern Coachwhip S3 / S4 HR
AMPHIBIANS
Ranidae Lithobates areolata Crawfish Frog S2 HR BIRDS
Accipitridae Aquila chrysaetos Golden Eagle S1 PT Rallidae Coturnicops noveboracensis Yellow Rail S2 HR

WRMP for Red Bud – Catalpa Creek Watershed 54
Continued from previous: Table 9.6.4. Mississippi Species of Greatest Conservation Need Known or Expected to Occur Within the Catalpa Creek Watershed (see table footer for explanation of State Rank and occurrence codes).Table 9.6.4. Mississippi Species of Greatest Conservation Need Known or Expected to Occur Within the Catalpa Creek Watershed (see table footer for explanation of State Rank and occurrence codes).
Tytonidae Tyto alba Barn Owl S3 PB Caniidae Lanius ludovicianus Loggerhead Shrike S4 KB Parulidae Geothlypis formosus Kentucky Warbler S5 KB Ardeidae Egretta thula Snowy Egret S4 / S1 PT Turdidae Hylocichla mustelina Wood Thrush S5 PB Parulidae Setophaga discolor Prairie Warbler S5 PB Emberizidae Ammodramus leconteii Le Conte’s Sparrow S3 PT Emberizidae Ammodramus savannarum Grasshopper Sparrow S3 / S3 KT Icteridae Euphagus carolinus Rusty Blackbird S2 KT
MAMMALS
Vespertilionidae Myotis lucifugus Little Brown Bat SH KR Mustelidae Mustela frenata Long-tailed Weasel S2 KR Sciuridae Sciuris niger bachmani Upland Fox Squirrel S3 / S4 KR Cricetidae Peromyscus polionotus Oldfield Mouse S2 / S3 KR
STATE RANK
S1 = Critically imperiled in Mississippi because of extreme rarity (5 or fewer occurrences or very few remaining
individuals or acres of habitat) or because of some factor(s) making it vulnerable to extirpation. S2 = Imperiled in Mississippi because of rarity (6 to 20 occurrences) or because of some factor(s) making it vulnerable
to extirpation. S3 = Rare or uncommon in Mississippi (21-100 occurrences). S4 = Widespread, abundant, and apparently secure in the state, but with cause for long-term concern.
S5 = Demonstrably widespread, abundant, and secure in the state. SH = Of historical occurrence in Mississippi, perhaps not verified in the past 20 years and suspected to be extant.
OCCURRENCE
P = Probably occur within watershed based on regional information.
HR = Historical Record, collected from this or adjacent watershed.
PT = Probably Transient, likely but only confirmed for adjacent watershed.
PB – Probably Breeder, evidence suggests breeding in watershed but not confirmed.
KB = Known Breeding, confirmed within watershed.
KT = Known Transient, confirmed through evidence collected within watershed.
KR = Known Resident, confirmed through evidence of breeding established within watershed.
Forage and Grazing Lands Management. Mississippi State University has more than 2,200 acres of crop and grazing lands adjacent to campus comprised of the North (R.R. Foil Research Center) and South (Leveck Animal Research Center) Farm. The largest contiguous acreage on campus is the 1,500 acres of the South Farm. Catalpa Creek and several of its tributaries carry drainage and significant amounts of stormwater south then east from campus. Part of the acreage of the South Farm is
Formatted: F

WRMP for Red Bud – Catalpa Creek Watershed 55
devoted to animal, forage breeding and forage/animal management research, however, more than half of the acreage of the South Farm is to devoted forage production and grazing. While the administration has worked to limit animal waste deposition near the creek, additional improvements could be made.
Research has shown planting and limited mowing of warm season (switchgrass, indiangrass, big bluestem, gamagrass and prairie cordgrass) and cool season (rivercane) native grasses and associated forbs in the riparian zone intercepts surface nutrients and organic detritus. Additionally, these grasses by virtue of their deep-rooted nature and rhizome network (in the case of rivercane and prairie cordgrass) reduce bank sloughing and erosion orders of magnitude better than the current bermudagrass/fescue planting. This mixed planting of these grasses encourages faunal populations. Nesting of migratory songbirds, habitat for pollinators and shelter for small mammals all benefit from planting mixed native grass populations.
Pursuit of management systems that limit tillage on hillier portions (2.5 and 5.0 acre research pastures) would significantly maintain soil fertility and reduce erosion. Additionally, minor changes in the course of road drainage ditches by diverting them into the pastures would capture silt and substantially reduce erosion of the road-side ditches.
Turf Health and Associated Best Management Practices. There are approximately 300 acres of mown turf on the Mississippi State University Campus – 50 acres of which are fertilized. Approximately 25 acres are frequently irrigated, predominantly “the Junction” and adjacent areas where game-day traffic requires supplemental fertility and irrigation in order to achieve recuperative capacity and the desired aesthetic qualities commissioned by University administration.
South of Blackjack Road, there are fewer than 20 acres of fertilized turf – mainly intramural fields and landscaping near the Vet School structure and parking lots.
Five acres are the football practice and intramural fields west of South Farm Road. 11 acres are softball/baseball intramural fields. Twenty-five acres are mixed use (parking and lawn) present on the Vet School campus abutting Blackjack. Five acres are utility right of way on the east side of Catalpa Creek nearest the entrance off Blackjack. Approximately 30 acres of unimproved road right-of-way exist on South Farm. This acreage is mown fewer than three times per year. Clippings are left remaining and not harvested for hay.
Best management of turf requires understanding the utilization of turf areas. For instance, turf areas used as game-day parking require increased inputs – predominantly supplemental fertility. Areas that are utility (e.g., gas, electric, sewer, water) and roadside right-of-way require only mowing and infrequent herbicide

WRMP for Red Bud – Catalpa Creek Watershed 56
application to reduce mowing frequency (also known as “chemical mowing”). Application of management practices for turf is further described in Section 11.
Invasive Species and Their Impact on Plant Community Development in the Watershed. The Early Detection and Distribution Mapping System (EDDMapS, ND) indicates that Oktibbeha County has the third highest number of reported invasive species in the state of Mississippi, with 217 reported invasive species.
Of the “10 Worst Invasive Weeds” listed by the Mississippi State University Extension Service, four upland invasive species are of particular concern: Triadica sebifera (Chinese Tallow tree), Lonicera japonica (Japanese honeysuckle), Ligustrum sinense (Chinese privet), and Sorghum halapense (johnsongrass). All of these are present on the MSU South Farm. Chinese privet and johnsongrass are abundant in the streams in the headwaters of Catalpa Creek (Chinese tallowtree and Japanese honeysuckle are also present, but not abundant). The impact of privet and johnsongrass is primarily that of replacement of native species in the riparian zone, but on a positive note they are of value to the managers of South Farm for erosion avoidance on the banks of the channelized reaches of the stream on South Farm and at the MSU Dairy Unit near Sessums. Care will have to be taken to manage the invasive species while at the same time not exposing the banks of the channel to further erosion.
The wetland invasive species are of primary concern in the lower reaches of the watershed as Catalpa Creek approaches its confluence with Tibbee Creek in Lowndes County. Lythrum salicaria (purple loosestrife), Alternanthera philoxeroides (Alligator weed), and Eichornia crassipes (water hyacinth) are all present in Lowndes and Oktibbeha counties (EDDMapS, ND).
99.7 DEMOGRAPHICS
The Catalpa – Red Bud Creek Watershed is located in Lowndes and Oktibbeha counties in Mississippi. According to the Annual Estimates of Residents Population Report generated by the US Census Bureau from the 2010 Census results (Table 9.7.1, Figure 9.7.1), the estimated population in the watershed area in April 2014 was 5,126 people, which represented around the 4.5% of the total population of both counties. The 72.5% of the watershed population is established in Oktibbeha County. Combining sources of information, the estimated population in the watershed in 2014 has increased almost 20% during the last 24 years, 9.5% since 2000, and 2.6% since 2010.

WRMP for Red Bud – Catalpa Creek Watershed 57
Table 9.7.1. Population in the Lowndes and Oktibbeha and Lowndes Counties and the Red Bud - Catalpa Creek Watershed in Mississippi.
COUNTY WATERSHED* CENSUS LOWNDES OKTIBBEHA TOTAL LOWNDES OKTIBBEHA TOTAL
1990 59,308 38,375 97,683 1,342 2773 4,115 2000 61,586 42,902 104,488 1,394 3,100 4,494 2010 59,779 47,671 107,450 1,554 3,447 4,798
2014** 59,730 49,414 109,144 1,553 3,573 4,923 *Estimates generated by EPA-BASINS for 1990 and 2000 from corresponding Census data and from the reports of the 2010 Census by the US Census Bureau. ** Estimated from the reports of the 2010 Census by the US Census Bureau
Figure 9.7.1. Populations in the Catalpa – Red Bud Creek Watershed in Mississippi. (*Estimates
generated by EPA-BASINS for 1990 and 2000 from corresponding Census data and from the reports of the 2010 Census by the US Census Bureau).
For an estimated total of 2150 housing units in the watershed area in 2014, 1,539 units (71.6%) are located within Oktibbeha County. Referencing the 1990 Census report results, the housing units available in 2014 have increased 41% compared to the units available in 1990, 18.1% compared to the units available in 2000, and 1.7% compared to the units available in 2010 (Table 9.7.2, Figure 9.7.2).
0
1000
2000
3000
4000
5000
6000
1990 2000 2010 2014*
Popu
latio
n
Census
Lowndes
Oktibbeeha
Total

WRMP for Red Bud – Catalpa Creek Watershed 58
Table 9.7.2. Housing Units in the Lowndes and Oktibbeha and Lowndes Counties and the Red Bud - Catalpa Creek Watershed in Mississippi.
COUNTY WATERSHED* CENSUS LOWNDES OKTIBBEHA TOTAL LOWNDES OKTIBBEHA TOTAL
1990 23,117 13,861 36,978 523 1,002 1525 2000 25,104 17,344 42,448 568 1,253 1821 2010 26,556 20,947 47,503 600 1,514 2115
2014** 27,014 21,292 48,306 611 1,539 2150 *Estimates generated by EPA-BASINS for 1990 and 2000 from corresponding Census data and from the reports of the 2010 Census by the US Census Bureau. ** Estimated from the reports of the 2010 Census by the US Census Bureau
Figure 9.7.2. Housing units in the Catalpa – Red Bud Creek Watershed in Mississippi. (*Estimates
generated by EPA-BASINS for 1990 and 2000 from corresponding Census data and from the reports of the 2010 Census by the US Census Bureau).
0
500
1,000
1,500
2,000
2,500
1990 2000 2010 2014*
Hous
ing
Uni
ts
Census
Lowndes
Oktibbeeha
Total
WRMP for Red Bud – Catalpa Creek Watershed 59
110 WATERSHED STATUS AND RESTORATION AND PROTECTION GOALS AND
TARGETS
10.1 GUIDING PRINCIPLES
The primary objective of this project is to develop, demonstrate and apply a holistic and integrated management approach for the restoration and protection of the ecosystem health, ecosystem services, quality of life, and water resources of the Catalpa Creek Watershed. Restoration and protection activities will also be useful for demonstration, education and research. All of these activities are consistent with the purpose and function of a research university such as Mississippi State University.
Watershed restoration and protection will be achieved while demonstrating and promoting compatibility with sustainable agricultural production, effectively addressing storm water management, and fostering the implementation of green infrastructure (GI) and low impact development (LID) principles. The Catalpa Creek Watershed and, specifically, the South Farm provides a unique opportunity to demonstrate and promote sustainable agriculture with its approximately 1,600 acres used for cattle, equine and poultry management research as well as the NRCS Grazing Lands Conservation Initiative demonstration site, 18 acres of aquaculture ponds, and various water quality research projects. Likewise, ample opportunities exist for effective storm water management and fostering GI and LID principles as called for and identified in MSU’s Master Plan (MSU, 2010).
One critical aspect of the plan is the design and implementation of specific management actions (Section 11). A second critical aspect is the identification of measureable targets or metrics that may be used to determine whether these management actions were successful (or not). The focus here will be on three specific indicators of success:
Water Quality; Habitat Quality/Ecosystem Function; and Social Indicators.
In 2000, EPA released its guiding principles for restoration and protection to provide a framework for effective management (Table 10.1.1).

WRMP for Red Bud – Catalpa Creek Watershed 60
Table 10.1.1. Restoration Guiding Principles (From: USEPA 2000).
RESTORATION GUIDING PRINCIPLES Preserve and protect aquatic resources Use reference sites Restore ecological integrity Anticipate future changes Restore natural structure Involve a multi-disciplinary team Restore natural function Design for self-sustainability Work within the watershed/landscape context Use passive restoration, when appropriate Understand the potential of the watershed Restore native species, avoid non-native species Address ongoing causes of degradation Use natural fixes and bioengineering Develop clear, achievable and measurable goals Monitor and adapt where changes are necessary Focus on feasibility
110.2 SURFACE WATER QUALITY
Water Quality Standards. In 1972, the Clean Water Act (CWA) established the national goal “to restore and maintain the chemical, physical, and biological integrity of the Nation’s waters.” The CWA then defined water quality in terms of chemical, physical and biologic integrity. In order to promulgate regulations to meet the objectives of the CWA, the challenge of developing well-defined and enforceable metrics and operational conditions had to be met. These metrics and conditions then could be used to both assess the condition of the nation’s waters and determine when the objectives of the CWA were accomplished. As such, a fundamental provision of the Clean Water Act (CWA, section 304(a)(1)), and amendments, was the requirement that states develop water quality standards for waterbodies. Water quality standards are the foundation of our nation’s water quality-based management programs. These standards will be used to determine the success of the restoration and protection efforts for the Catalpa Creek watershed project.
A water quality standard is applied to a specific waterbody (e.g., Catalpa Creek), not to a discharge, and contain three basic elements.
Classification system (in Mississippi, Fish & Wildlife, Shellfish Harvesting, Recreation, Public Water Supply, or Ephemeral Streams) that is associated with a similar US EPA designated use;
Numeric criteria protective of each water body classification and designated use; and
Anti-degradation policies.
Water Body Classification and Designated Uses. The water body use classification established by MDEQ for Catalpa Creek is Fish and Wildlife Use. These waters are intended for fishing and for propagation of fish, aquatic life, and wildlife. Waters that meet the Fish and Wildlife criteria shall also be suitable for secondary contact recreation. Secondary contact recreation is defined as incidental contact with the water during activities such as wading, fishing, and boating, that are not likely to result in full body immersion.

WRMP for Red Bud – Catalpa Creek Watershed 61
This classification specifies numeric criteria for bacteria (summer and winter values), specific conductance, dissolved solids, dissolved oxygen, pH, temperature, and toxic substances (Table 10.2.1). Presently narrative standards apply to other pollutants. (See State of Mississippi Water Quality Criteria For Intrastate, Interstate, and Coastal Waters (MDEQ, 2012).
The State of Mississippi classification of Fish and Wildlife Use has the associated US EPA designated uses of Aquatic Life Use, Fish Consumption and Secondary Contact Recreation.
Table 10.2.1. MDEQ Water Quality Standards Applicable to Catalpa Creek for Selected Parameters.
PARAMETER CRITERIA
Sediment/Siltation Narrative Standard: Waters shall be free from materials attributable to municipal, industrial, agricultural, or other dischargers producing color, odor, taste, total suspended or dissolved solids, sediment, turbidity, or other conditions in such degree as to create a nuisance, render the waters injurious to public health, recreation, or to aquatic life and wildlife, or adversely affect the palatability of fish, aesthetic quality, or impair the waters for any designated uses.
Nutrients Same as above
Fecal Coliform May - October: Fecal coliform colony counts not to exceed a geometric mean of 200 per 100ml based on a minimum of 5 samples taken over a 30-day period with no less than 12 hours between individual samples, nor shall the samples examined during a 30-day period exceed 400 per 100ml more than 10% of the time.
November – April: Fecal coliform colony counts shall not exceed a geometric mean of 2000 per 100 ml based on a minimum of 5 samples taken over a 30-day period with no less than 12 hours between individual samples, nor shall the samples examined during a 30-day period exceed 4000 per 100 ml more than 10% of the time.
WRMP for Red Bud – Catalpa Creek Watershed 62
Water Quality Monitoring. Water quality in Catalpa Creek is periodically sampled by the MDEQ at four Index of Biotic Integrity (IBI) locations (Figure 10.2.1):
Upstream of Oktoc Road on Catalpa Creek; Sessums Road on Catalpa Creek; At Artesia 200 M upstream of Hwy 45 (upstream of Artesia POTW outfall); and Upstream of Artesia Road (downstream of Artesia POTW outfall).
MDEQ uses an Index of Biotic Integrity (IBI) to assess the degree of human disturbance on streams and rivers, based on the original definition of biological integrity and multi-metric index developed by Karr (1981). The IBI used by MDEQ is based on a benthic index of invertebrate aquatic species and is referred to as M-BISQ, the Mississippi Benthic Index of Stream Quality. The M-BISQ is based on an aggregation of biometrics in order to establish scores that may be used to assess the overall ecological condition of sites, as well as contributing to evaluation of the effects of nutrient enrichment, sedimentation, habitat impairment, and land use conversions (MDEQ, 2003). It also may be used in establishing restoration and remediation goals, tracking the effectiveness of restoration and remediation activities, and developing watershed management strategies (MDEQ, 2003).
The data that have come from this monitoring show that Catalpa Creek has an impairment. The stressor identification process determined that the cause of the impairment is sediment.
Since Catalpa Creek does not meet water quality criteria, a Total Maximum Daily Load (TMDL) study was conducted for the sediment impairment. The State of Mississippi Water Quality Criteria for Intrastate, Interstate, and Coastal Waters regulation does not include a numerical water quality standard for aquatic life protection due to sediment (MDEQ, 2012); however, the narrative standard for the protection of aquatic life is sufficient for justification of TMDL development, although it does not provide a quantifiable TMDL target (numeric limit for sediment). Therefore, the target for this TMDL is based on reference sediment yields developed by the Channel and Watershed Processes Research Unit (CWPRU) at the USDA Agricultural Research Service’s National Sedimentation Laboratory (NSL).

WRMP for Red Bud – Catalpa Creek Watershed 63
Figure 10.2.1. Map of IBI Sites Related to the Catalpa Creek Watershed.
WRMP for Red Bud – Catalpa Creek Watershed 64
NPDES Permits. The CWA also established the National Pollutant Discharge Elimination System (NPDES) permit program that mitigates water pollution by regulating all point sources that discharge pollutants into waters of the United States. A point source is a discharge from a discrete conveyance such as a pipe or ditch. MDEQ implements the program by establishing Waste Load Allocations (WLA) based on an allowable load that will not result in impairments (not meeting water quality standards), and issuing NPDES discharge permits.
There are 7 sites in the watershed that have NPDES permits. These are facilities that have a permit that specifies the conditions under which they may discharge treated wastewater back into the environment—in this case into Catalpa Creek. There are no pending complaints and no enforcement actions in effect by MDEQ at the time of this writing.
Two sites on the South Farm with NPDES permits are the MSU Poultry Science Research Center and the MSU Ag Center and Horse Park.
Total Maximum Daily Loads. A Total Maximum Daily Load (TMDL) is the maximum amount of a pollutant that can exist within a body of water and the waterbody is still able to meet its water quality standards. Excess levels of a pollutant may come from waste water that is discharged into the waterbody, or from diverse sources picked up by stormwater as it flows over the landscape, or from the natural background amount that occurs in the landscape. Pollution from diverse sources is known as nonpoint source (NPS) pollution. A TMDL is essentially a “pollution budget” designed to restore the health of the polluted body of water by setting the maximum amount that is allowed from all sources.
For waterbodies, which after implementation of the waste load allocations for all the NPDES dischargers in the watershed, are still not meeting water quality standards (i. e., are impaired), a state must then determine the TMDL allowable, and implement plans to remove the impairment. In this sense, a TMDL is the total allowable maximum daily load that would attain and maintain water quality standards, stated in formula as,
,
where is the load capacity or waste assimilative capacity of the water body, is the sum of all waste load allocations for the point sources discharged into
the water body, is the sum of all load allocations for the nonpoint sources entering the water body, and is the margin of safety.

WRMP for Red Bud – Catalpa Creek Watershed 65
110.3 CATALPA CREEK WATER QUALITY
Where does the Red Bud – Catalpa Creek Watershed rank in terms of water quality within the Tibbee Creek Watershed and Tombigbee River Basin? MDEQ has developed a tool for characterizing and ranking watersheds against each other, within a watershed, or within a basin. This tool, known as the Mississippi Watershed Characterization and Ranking Tool (MWCRT) is used to help guide selection of watershed projects by the agency. The major data components used for ranking consist of resource value (environmental and human welfare) and potential stressors such as lack of riparian zone, erosion potential index, impervious surface, and others. MWCRT ranked the Red Bud—Catalpa Creek Watershed as follows:
Stressor Potential High Human Welfare Value Low Environmental Resource Value Medium
This means that when compared to other watersheds in the larger Tibbee Creek Watershed and in the Tombigbee River Basin, the Red Bud – Catalpa Creek Watershed ranked in the group with those most in need of restoration (those with a high potential stressors score). Red Bud – Catalpa is among those in the “low” group when the human welfare value is considered, meaning there is limited threat to human health. The watershed falls within the medium group as far as environmental resource value is concerned, meaning that there are not significant natural resource features (e.g., threatened/endangered species, wildlife protection areas, etc.) contained within the watershed.
TMDLs Studies show that the segment of Catalpa Creek which runs through Red Bud—Catalpa Creek Watershed has more sediment than the “pollution budget” allows—there is too much sediment in the creek for a healthy, balanced community of aquatic species. This impairment has led to TMDL development which addresses at length the sediment issues of Catalpa Creek and gives a load reduction amount to return sediment to an acceptable level.
Monitoring studies also showed that two other pollutants – nutrients and pathogens – were present in the larger HUC (Hydrologic Unit Code) watersheds that Red Bud—Catalpa Creek Watershed is a part of. TMDL studies have been completed for these. Current monitoring data, however, doesn’t address nutrients and pathogens levels in the Red Bud--Catalpa Creek Watershed itself, although it is known that nutrients and pathogens are present in some measure in its headwaters at the South Farm. Because of this, the restoration and protection plan will address them as well.
Mississippi has developed an Uplands Nutrient Reduction Strategic Plan and is working on developing numeric nutrient criteria as well. The South Farm will be an excellent

WRMP for Red Bud – Catalpa Creek Watershed 66
site to showcase a variety of nutrient reduction practices. Effective implementation of this water resources management plan should reduce the likelihood of a future determination of nutrient impairment for Catalpa Creek in the Red Bud—Catalpa Creek Watershed.
Fecal coliforms are indicator organisms, commonly found in human and animal feces. Although they are generally not harmful themselves, they indicate the possible presence of pathogenic (disease-causing) bacteria, viruses, and protozoans that also live in human and animal digestive systems. Sources of fecal coliforms in the Catalpa Creek watershed include wildlife, livestock, and urban development. Nonpoint sources such as failing septic systems may also be a problem.
For nutrients and sediments, there are presently no numeric criteria (numeric criteria are under development) and the applicable criteria are the narrative standard indicated in Mississippi’s water quality standards. Therefore, the target of the restoration and protection will be to make the habitat and water quality acceptable for aquatic life use support.
Water Quality Restoration and Protection Goals and Targets. The overarching goal of the restoration and protection efforts is to improve water quality through research, development, monitoring, modeling, and implementation activities. Specific water quality targets are given in Table 10.3.1 and load reduction goals to meet the targets in Table 10.3.2.
While not specifically developed for Catalpa Creek, the nutrient TMDL for the larger Tibbee Creek Watershed called for reductions of total nitrogen (TN) loads of from 0% to 43% and reductions in total phosphorus of from 26% to 36%. For sediments, the unstable yields are larger than the target yields, therefore, a reduction is recommended for HUC 03160104 (Tibbee Creek) of 77% to 97% (MDEQ, 2006). For Fecal Coliforms (MDEQ, 2007a), the TMDL called for reductions of loads of 46% in winter months and 92% in summer months.
Table 10.3.1. Catalpa Creek Water Quality Targets for Restoration and Protection.
PARAMETER WATER QUALITY TARGET Sediments Reduce sediment loads in order to remove aquatic life impairment as
indicated by IBI Fecal Coliforms Reduce concentrations to or below specified seasonal criteria for fecal
coliforms Nutrients Consider impact of numeric water quality standards for nutrients (coming
soon) using draft standards

WRMP for Red Bud – Catalpa Creek Watershed 67
Table 10.3.2. Reduction Goals as Established by TMDLs (MDEQ, 2006, MDEQ, 2007b, MDEQ, 2007a).
PARAMETER LOAD REDUCTION Sediments Assess and meet TMDL estimated reductions of sediment loadings (77-
97%) Fecal Coliforms Assess and meet TMDL estimated reductions of fecal coliform loadings
(46-92%) Nutrients Identify specific TMDL targets for the Catalpa Creek to remove
impairments and to meet draft (and then final) numeric criteria
Uncertainty exists whether these estimated TMDL load reductions are actually achievable in a natural system. This project is designed to reduce sediment loads as efficiently and cost-effectively as possible using available resources while promoting compatibility with sustainable agricultural production and urban development. Documenting the reductions gained and the costs expended will be helpful to understand this relationship and the achievability of the TMDL load reduction target.
110.4 INTEGRATION OF WATER QUALITY TARGETS, GOALS, RESTORATION AND PROTECTION
ACTIVITIES, AND MODELING AND MONITORING
To achieve and document success for the Catalpa Creek Watershed project, it is essential to integrate water quality targets, goals, restoration and protection activities, and modeling and monitoring. The interrelationships of these components are identified below.
Reduce Coliform Bacteria entering Catalpa Creek. – Identify and target sources of contamination; – Identify interim targets and milestones in comparison to the water
quality target; – Identify and implement applicable BMPs to reduce loadings, such as
improving riparian vegetation and limiting livestock access, as described elsewhere in this report; and
– Implement tracking and monitoring plans to aid in evaluation and design of BMPs.
Reduce erosion and sedimentation to improve water quality and meet aquatic life criteria.
– Identify and target sources of sediment loads (e.g. overland vs. stream bank erosion);
– Identify interim targets and milestones in comparison to the aquatic life criteria quality target;
– Identify BMPs to reduce sediment loadings, such as improving riparian vegetation and limiting livestock access, streambank rehabilitation and protection, etc.;

WRMP for Red Bud – Catalpa Creek Watershed 68
– Using monitoring, modeling, and site characteristics, identify and prioritize BMP placement and density in a staged approach to meet water quality targets;
– Restore areas that have experienced siltation; and – Implement tracking and monitoring plans to support assessments and
compliance determinations. Reduce nutrients entering Catalpa Creek.
– Identify and target sources of nutrient loads (e.g. overland vs. internal loads (e.g. bottom sediments, stream bank erosion);
– Identify interim targets and milestones in comparison to the aquatic life criteria target;
– Identify applicable BMPs to reduce nutrient loadings, such as improving riparian vegetation, improving turfgrass, etc.;
– Using monitoring, modeling, and site characteristics, identify and prioritize BMP placement and density in a staged approach to meet water quality targets; and
– Implement tracking and monitoring plans to support assessments and compliance determinations.
Restore aquatic habitat as measured by the IBI targets: – Through research and monitoring, determining the causes driving the
poor aquatic habitat (e.g. upland sediment erosion and delivery, streambank erosion, and near-stream land disturbance, etc.);
– By identifying and implement, using a staged approach, BMPs and restoration efforts targeted toward improving aquatic life support; and
– By tracking trends toward achieving aquatic life support targets, such as for nutrients and sediments.
Design and demonstrate the use of models and other methods in order to aid and optimize the identification and strategic placement of appropriate BMPs and estimate cumulative impacts relative to the restoration and protection targets
Design BMP and BMP monitoring efforts to both track their efficacy over time in achieving targeted flows and load reductions, determine the cumulative impact or costs (including construction and maintenance), and aid in the design of BMPs.
Develop BMPs (structural and non-structural) to function as sites for research, demonstration and education.
110.5 HABITAT
Habitat Targets. The targets for habitat include the specific additional targets of habitat indicative of ecosystem health, ecosystem services, quality of life, and water resources of the Catalpa Creek watershed. Specific targets will vary depending on the

WRMP for Red Bud – Catalpa Creek Watershed 69
habitat type within the watershed, including aquatic habitat, the habitat associated with the south farm and associated agricultural uses, and the urban areas of the watershed.
Aquatic Habitat. Aquatic habitat targets will be based in part on IBI as used by the MDEQ to determine stream impairment (non-attainment of water quality standards). In addition, aquatic habitat targets may include species of fish, crustaceans, amphibians listed in "Mississippi Species of Greatest Conservation Need" and known or expected to occur within the Catalpa Creek Watershed. Other target organisms and/or indicators of the health of aquatic systems (e.g., other species, bioassessments, diversity indices), may also be considered as targets for restoration and used to track and assess the success of those efforts.
Ag Lands Habitat. A large portion of the watershed is used for agriculture, including the 1,600 acre MSU South Farm used for cattle, equine and poultry management research as well as the NRCS Grazing Lands Conservation Initiative demonstration site. Targets for these areas will include BMPs to reduce stream loadings of fecal coliforms, control of erosion and sedimentation, and nutrient runoff. Additional targets will include specific species of birds, insects (e.g., pollinator species), and plant species indicative of ecosystem health.
Urban Habitat. Similarly, for urban portions of the watershed, specific targets are to reduce pollutant loadings while increasing habitat for desirable species indicative of ecosystem health.
110.6 INTEGRATION OF HABITAT QUALITY/ECOSYSTEM FUNCTION TARGETS, GOALS, RESTORATION
AND PROTECTION ACTIVITIES, AND MONITORING
Aquatic Habitat/Ecosystem Function. Restoration and protection of the aquatic habitat and ecosystem function in the Catalpa Creek Watershed has as its goal, in part, meeting the IBI criteria as discussed in the section on water quality. As Catalpa Creek is the major drainage systems for a large portion of the MSU campus and surrounding areas it receives very high flows during storm events. Backflow and flooding is also common in tributaries. The upper channel is deeply incised with steep banks, which also show signs of high erosion during storm events, with increases in width and decreased slopes in downstream areas. Other than storm water flows, the upper portion of the creek does receive some point source inflows, such as from the Poultry Science Research Center. However, maintaining aquatic habitat during low flow conditions is critical. Goals for the restoration and protection of the creek may include:

WRMP for Red Bud – Catalpa Creek Watershed 70
Restore, to the extent possible, the natural structure of the creek and major tributaries
Monitoring of biota and/or flow to assess progress Protection/reintroduction of native species Identification and maintenance of environmental flow requirements Creation of pools Reinstating/maintaining hydraulic connections Channel reshaping and stabilization Livestock exclusions and creation of passages
Agricultural Lands Habitat. A considerable portion of the watershed is utilized for agricultural production and research. Habitat goals for these areas include:
Reduction of pollutant loads (coliform bacteria, sediments, nutrients) – Identify and target sources of bacterial, nutrient and sediment loads – Identify structural and/or nonstructural best management practices
to reduce loads, such as Education; Conservation buffers; Livestock exclusions; Turf management; Erosion prevention; and Waste management and treatment.
– Using monitoring, modeling, and site characteristics, identify and prioritize BMP placement and density in a staged approach to meet water quality targets.
– Implement tracking and monitoring plans to support assessments and compliance determinations.
Improved Habitat – Identify potential targets for habitat construction or restoration for
target (indicator) species, such as water, feeding, nesting habitat, etc. consistent to the extent possible with nutrient practices for nutrient load reduction (e.g., conservation areas).
– Using monitoring, modeling, and site characteristics, identify and prioritize habitat placement and density in a staged approach
– Implement tracking and monitoring plans (e.g. banding, etc.) to support assessments and success of habitat creation/restoration for target species.
Urban Habitat. Urban habitat goals are similar to those for agricultural lands, although specific target species and best management practices may differ. The
WRMP for Red Bud – Catalpa Creek Watershed 71
overall goal is reduction of nutrient loads and habitat improvement. Specific goals include:
Reducing impervious surface and encouraging policies and practices aimed at minimizing the creation of new impervious surfaces.
Reduced storm water runoff and improve drainage to decrease risk of flooding.
Implementing designs and practices that increase on-site infiltration.
110.7 SOCIAL INDICATORS
Effective management of nonpoint source (NPS) water pollution requires addressing not only environmental conditions but the choices people make that impact the environment. A measure of those choices are social indicators that provide information about stakeholder awareness, attitudes, constraints, capacity, and behaviors that are expected to lead to water quality improvement and protection (Genskow & Prokopy, 2011).
Water quality problems that have accumulated over time often take a like amount of time to correct. The social dimension plays a key role in this scenario. Every individual, community and culture has a set of beliefs and attitudes that guide decision-making and influence behavior. Because watershed-scale restoration and protection success depends upon a large percentage of watershed stakeholders understanding both the water quality impacts of their land use activities and the importance of conservation, an important measure of progress should include confirming that awareness and attitudes are changing and behaviors are being adopted that serve to mitigate the problem. Social indicators provide consistent measures of social change and can be used by planners and managers at all scales to estimate the impacts of their efforts and resources even while a lag exists for monitored improvements in water and habitat quality.
Social Indicator Targets. Social indicator targeting involves first identifying audiences that may impact or be impacted by the watershed restoration and protection plan, and then developing metrics that may be used to estimate pre- and post- levels of awareness, attitude, constraints, and behaviors. Once these audiences are selected, stakeholder surveys will be conducted that will identify social metrics that may be measured and tracked over time to evaluate restoration and protection success from the social dimension.
Social Indicator Goals. Specific social indicator goals have not yet been identified. After implementation of a watershed-scale survey to better understand the levels of awareness, attitudes, constraints, and behaviors, social indicator goals will be

WRMP for Red Bud – Catalpa Creek Watershed 72
developed. However, goals could include (adapted from Genskow and Prokopy (2011)):
Increased Awareness Among the Target Audience
– Intended Outcome: Awareness gained regarding the relevant technical issues and/or recommended practices of the target audience in the critical area.
Indicator 1: Awareness of pollutants impairing waterways. Indicator 2: Awareness of consequences of pollutants to water
quality. Indicator 3: Awareness of appropriate practices to improve
water quality. Development of Awareness in the Target Audience Supportive of the
Catalpa Creek watershed Restoration and Protection. – Intended Outcome: Attitudes changed in a way that is expected to
facilitate desired behavior change of target audiences in critical areas. Indicator 1: General water quality-related attitudes. Indicator 2: Willingness to take action to improve water quality.
Reduction of Constraints for Using Appropriate Practices. – Intended Outcome: Constraints to behavior change will be reduced.
Indicator 1: Constraints to behavior change. Increased Capacity to Address Restoration and Protection issues in the
Project Area. – Intended Outcome 1: The project improved the recipient’s capacity
to leverage resources in the watershed. Indicator 1: Resources leveraged by grant recipient in the
watershed as a result of project funding (including cash and in-kind resources).
– Intended Outcome 2: Increased capacity to support appropriate practices by target audiences in critical areas.
– Intended Outcome 3: Development of funding to support NPS practices in critical areas.
Indicator 2: Technical support available for restoration and protection practices in critical areas.
Indicator 3: Ability to monitor practices in critical areas. Increased Adoption of Restoration and Protection Measures By Target
Audience. – Intended Outcome: This project resulted in changes in behavior
and/or adoption of practices to prevent new problems and improve or maintain water quality in the critical area by the target audience.
WRMP for Red Bud – Catalpa Creek Watershed 73
111 PROPOSED RESTORATION AND PROTECTION ACTIVITIES, AND COSTS In the preceding section, restoration and protection targets and goals were presented. Also in that section, integration of the water quality and habitat quality/ecosystem function targets, goals, restoration and protection activities, and modeling and monitoring were discussed. Section 11 will identify specific implementation practices and approaches needed to achieve the goals stated in Section 10. Additionally, the costs of implementing these practices are identified in this section.
11.1 SURFACE WATER QUALITY AND HABITAT RESTORATION AND PROTECTION ON AGRICULTURAL
LANDS
The USDA Natural Resources Conservation Service (NRCS) has established a widely-accepted suite of best management practices that are commonly used today by many organizations for restoration of water quality and habitat. These practices are organized by the resource concern(s) that is/are demonstrated in a watershed.
Resource Concerns and Associated Practices. Four resource concerns in the Catalpa Creek Watershed have been identified by experienced water quality and conservation professionals from state and federal agencies, the local Soil & Water Conservation District, and MSU researchers. These resource concerns will be addressed by the surface water quality and habitat restoration and protection practices identified in this section. These resource concerns are listed below.
Water quality – sedimentation; Grazing lands; Sustainable forestry; and Declining wildlife habitats.
Water Quality – Sedimentation. This concern addresses land where the current soil erosion rate is excessive (exceeds the soil loss tolerance rate) and critically eroding areas. Within the Catalpa Creek Watershed excessive soil erosion, classified as sheet and rill erosion, is common on sloping land and pronounced ephemeral and gully erosion is evident. Runoff containing sediment has led to Catalpa Creek’s listing as impaired for sediment and the development of a sediment TMDL.
Grazing Lands. Protection of soil health, reduction of runoff, prevention of the transport of excess nutrients and animal waste, and maintaining or improving the productivity of adaptable forages to ensure sustainability agriculture are needed in this watershed.
WRMP for Red Bud – Catalpa Creek Watershed 74
Sustainable Forestry. Emphasis on protecting state waters through implementing effective forestry conservation practices and establishing trees to promote a sustainable forestry resource is needed in this watershed.
Declining Wildlife Habitats. Habitats identified in this watershed that are declining include transition zones in cropland, pastureland and hayland fields; corridor habitat; declining native habitats; and infestations of invasive plants within wildlife habitats that have adverse impacts. Habitat protection for listed threatened and endangered species in the watershed will also be addressed.
Recommended NRCS Practices, Codes, and Associated Practices. The following practices have been recommended by NRCS staff for potential implementation in the Catalpa Creek Watershed, dependent upon site-specific conditions. These include structural and nonstructural practices.
Resource Concern: Water Quality – Sedimentation (Table 11.1.1Table 11.1.1)
(340) Cover and Green Manure Crop – A crop of close growing legumes and/or small grain/ryegrass grown primarily for seasonal protection and soil improvement. Cover crops are usually grown for one year or less. The purpose of this practice is to control erosion during periods when the major crops do not furnish adequate cover and to add organic matter back to the soil to improve water infiltration, aeration and tilth. Cover crops may also provide food and cover for selected wildlife species.
(342) Critical Area Planting – Establishing permanent vegetation on sites that have, or are expected to have, high erosion rates, and on sites that have physical, chemical or biological conditions that prevent the establishment of vegetation with normal practices. The purpose of this practice is to stabilize the soil, reduce erosion and damage from sediment and runoff to downstream areas, to improve water quality, to improve wildlife habitat, and to improve visual resources.
(350) Sediment Basin – A basin constructed with an engineered outlet, formed by an embankment or excavation or a combination of the two. The purpose of this practice is to capture and detain sediment laden runoff, or other debris for a sufficient length of time to allow it to settle out in the basin. Sediment basins are the last line of defense for capturing sediment that cannot be addressed by common erosion control measures; therefore, all initial efforts should be on stopping the erosion at the source. Associated practice to this practice is (342).
(362) Diversion – A channel constructed across the slope with a supporting ridge on the lower side to divert runoff. The purpose of this practice is to divert excess water from one area for use or safe disposal in other areas. Associated practices are (342), (412) and (620).
(386) Field Border – A strip of permanent vegetation established at the edge or around the perimeter of a field. The purpose of this practice is to establish food, cover (including nesting and brood cover) for wildlife, including pollinator habitat/corridors.
Formatted: U
WRMP for Red Bud – Catalpa Creek Watershed 75
(393) Filter Strip – A strip or area of herbaceous vegetation that removes contaminants from overland flow. The purpose of this practice may be applied as part of a conservation management system to accomplish one or more of the following purposes: to reduce suspended solids and associated contaminants in runoff, dissolve contaminant loadings in runoff, and to suspend solids and associated contaminants in irrigation tail water.
(410) Grade Stabilization Structure – A structure used to control the grade and head cutting in natural or artificial channels. The purpose of this practice is to stabilize the grade and control erosion in natural or artificial channels, to prevent the formation or advance of gullies, and to enhance environmental quality and reduce pollution hazards. Associated practices (460) and (342).
(412) Grassed Waterway – A shaped or graded channel that is established with suitable vegetation to carry surface water at a non-erosive velocity to a stable outlet. The purpose of this practice is to convey runoff from terraces, diversions, or other water concentrations without causing erosion or flooding; to reduce gully erosion; and to protect/improve water quality. Associated practices (342) and (620).
(460) Land Clearing – Removing trees, stumps, and other vegetation from wooded areas to achieve a conservation objective. The purpose of the practice is to facilitate needed land use adjustments and improvements to an existing site in the interest of natural resource conservation. This practice applies to wooded areas where the removal of trees, stumps, brush, and other vegetation is needed in order to implement a conservation objective. Associated practices, like plantings, other structures, or irrigation/drainage water management practices, would be contracted separately as needed.
(580) Streambank and Shoreline Protection – Treatment(s) used to stabilize and protect banks of streams or constructed channels, and shorelines of lakes, reservoirs, or estuaries. The purpose of this practice is to prevent the loss of land or damage to land uses, or other facilities adjacent to the banks of streams or constructed channels, shoreline of lakes, reservoirs, or estuaries including the protection of known historical, archeological, and traditional cultural properties; To maintain the flow capacity of streams or channels; To reduce the offsite or downstream effects of sediment resulting from bank erosion; and To improve or enhance the stream corridor for fish and wildlife habitat, aesthetics, recreation. Associated practice is (342).
(600) Terrace – An earth embankment, or a combination ridge and channel constructed across the field slope. The purpose of the practice is to reduce slope length, erosion, sediment content in runoff water, improve water quality, retain runoff for moisture conservation, prevent gully development, reform the land surface, improve farmability and flooding. Associated practices are (342) and (620).
(620) Underground Outlet – A conduit installed beneath the surface of the ground to collect surface water and convey it to a suitable outlet. The purpose of the practice is to dispose of excess water from terraces, diversions, subsurface drains, surface drains, trickle tubes or principle spillways from dams (outside the dam area only), or other
WRMP for Red Bud – Catalpa Creek Watershed 76
concentrations without causing damage by erosion or flooding. Associated practices are (342), (412), and (600).
Resource Concern: Grazing Lands (Table 11.1.2Table 11.1.2) (315) Herbaceous Weed Control – Removal or control of herbaceous weeds
including invasive, noxious, and prohibited plants. Herbaceous weed control and management to enhance or maintain native or desired plant species on pastureland. Associated Practices listed in this resource concern: (528).
(342) Critical Area Planting – Establishing permanent vegetation on sites that have, or are expected to have, high erosion rates, and on sites that have physical, chemical, or biological conditions that prevent the establishment of vegetation with normal practices. To stabilize the soil, reduce erosion and damage from sedimentation and runoff to downstream areas, to improve water quality, to improve wildlife habitat, and to improve visual resources.
(362) Diversion – A channel constructed across the slope with a supporting ridge on the lower side to divert runoff. To divert excess water from one area for use or safe disposal in other areas. Associated practices list in this resource concern: (342).
(378) Pond – A water impoundment made by constructing a dam or an embankment or by excavating a pit or dugout. To provide needed water for livestock in a planned grazing system. Associated practices in this resource concern: (342), (382), (516), & (614).
(382) Fence – Dividing or enclosing an area of land with a suitable structure that acts as a barrier to livestock. To subdivide grazing lands to create additional grazing cell that will allow the implementation of a prescribed grazing system. (NRCS has a practice payment cap of $7,500 - $9,000 per contract).
(410) Grade Stabilization Structure – A structure used to control the grade and head cutting in natural or artificial channels. To stabilize the grade and control erosion in these settings, to prevent the formation or advancement of gullies, and to enhance environmental quality and reduce pollution hazards. Associated practices in this resource concern: (342) & (460).
(460) Land Clearing – Removing trees, stumps, and other vegetation from wooded areas to achieve a conservation objective. Limited to the footprint of the conservation structure.
(512) Forage and Biomass Planting (Legumes interseeding) or (Cropland conversion) – Establishing and reestablishing native or introduced forage species. To establish adapted compatible species, varieties, or cultivars, improve or maintain livestock nutrition and/or health, extend the length of the grazing season, reduce soil erosion by wind and/or water. (A Pasture Score Rating will be used to determine eligibility. A current Soil Test is needed for ranking). Associated practices listed in this resource concern: (315) & (528).
Formatted: U

WRMP for Red Bud – Catalpa Creek Watershed 77
(516) Pipeline – A pipeline and appurtenances installed for conveying water for livestock or wildlife. This applies to the conveyance of water through a closed conduit from a source of supply to a watering facility for use by livestock or wildlife. Associated practices in this resource concern: (342) & (614).
(528) Prescribed Grazing – The controlled harvest of vegetation with grazing or browsing animals, manage with the intent to achieve a specified objective. Application of this practice will prescribe the rest period, intensity, frequency, duration, and season of grazing to promote ecologically and economically stable plant communities that meet client and resources objectives.
(561) Heavy Use Protection Area – The stabilization of areas frequently and intensively used by people, animals or vehicles by establishing vegetative cover, surfacing with suitable materials, and/or installing needed structures. To provide a stable, non-eroding surface for areas frequently used by animals, people or vehicles and to protect and improve water quality. Associated practices in this resource concern: (342), (516), & (614).
(576) Livestock Shelter Structure – A Portable framed structure with mesh fabric roof to provide shade for livestock. This practice applies to areas where animal productivity and well-being is adversely affected by heat generated from sunshine or where livestock are excluded from natural shad along stream banks of other water courses. This practice included as a part of a Resource Management System provides shaded areas for livestock, helps protect surface waters from pollution, and assist the livestock from excessive heat. Associated practices in this resource concern: (382), (528), & (614).
(578) Stream Crossing – A stabilized area or structure constructed across a stream to provide a travel way for livestock. Practice will provide access to another land unit; to improve water quality by reducing sediment, nutrient, organic, and inorganic loading of the stream; and to reduce stream bank and streambed erosion. (This practice requires fencing off both sides of the stream in which the stream crossing is installed). Associated practices in this resource concern: (342) & (382).
(614) Watering Facility – A permanent or portable device to provide an adequate amount and quality of drinking water for livestock and/or wildlife. This practices applies where there is a need for a new or improved watering places to permit the desired level of grassland management, to reduce health hazards for livestock, and to reduce livestock waste in streams. Associated practices listed in this resource concern: (342), (516), & (561).
Resource Concern: Sustainable Forestry (Table 11.1.3Table 11.1.3) (NRCS has a $10,000-$12,000 limitation for practice Code (612) & (490) per ownership per county for this resource concern.)
Formatted: U

WRMP for Red Bud – Catalpa Creek Watershed 78
(315) Herbaceous Weed Control – Removal or control of herbaceous weeds including invasive, noxious, and prohibited plants; Kudzu and Cogongrass. Associated Practices listed in this resource concern: (666).
(338) Prescribed Burning – Silvacultural Burning and Site Prep Burning to improve wildlife habitat, control undesirable vegetation, prepare sites for planting or seeding, control plant diseases, reduce fire hazards. Associated Practices listed in this resource concern: (666).
(342) Critical Area Planting – Establishing permanent vegetation on sites that have, or are expected to have, high erosion rates, and on sites that have physical, chemical, or biological conditions that prevent the establishment of vegetation with normal practices. To stabilize the soil, reduce erosion and damage from sedimentation and runoff to downstream areas, to improve water quality, to improve wildlife habitat, and to improve visual resources.
(394) Firebreaks – A strip of bare land (Non-Vegetated) or fire-retarding vegetation (Vegetated) to protect soil, water, and plant resources by reducing or preventing damage from fire. Associated practices list in this resource concern: (338) & (666).
(410) Grade Stabilization Structure – A structure used to control the grade and head cutting in natural or artificial channels. To stabilize the grade and control erosion in these settings, to prevent the formation or advancement of gullies, and to enhance environmental quality and reduce pollution hazards. Associated practices in this resource concern: (342) & (460).
(460) Land Clearing – Removing trees, stumps, and other vegetation from wooded areas to achieve a conservation objective. Limited to the footprint of the conservation structure.
(490) Forest Site Preparation – Treating areas to encourage natural seeding of desirable trees or to permit reforestation by planting or direct seeding. Preparing land from establishing a stand of trees to conserve soil and water, to improve watersheds, or to produce tree/shrub species for wildlife habitat. Associated practices listed in this resource concern: (338), (394), (612), & (666)
(612) Tree & Shrub Establishment – Establishing woody plants by planting seedlings or cuttings, direct seeding, or natural regeneration to conserve soil moisture, protect a watershed, or create/enhance wildlife and pollinator habitat. Associated practices listed in this resource concern: (338), (394), (490), & (666).
(666) Forest Stand Improvement – Manipulating species composition and stocking by cutting or killing selected trees and understory vegetation. To enhance and improve a stand of trees, to conserve soil and water, to improve wildlife habitat, or to produce wood crops for diverse wildlife habitat. Associated practices listed in this resource concern: (315), (338), & (394).

WRMP for Red Bud – Catalpa Creek Watershed 79
Resource Concern: Declining Wildlife Habitats (Table 11.1.4Table 11.1.4) (NRCS has a $10,000 payment cap for all contracts funded under this resource concern.) (314) Brush management – QVM for Restoration of Habitat in Open Fields.
Associated Practices listed in this resource concern: (647) and (666). (315) Herbaceous Weed Control – Removal or control of herbaceous weeds
including invasive, noxious, and prohibited plants; Kudzu and Cogongrass. Associated Practices listed in this resource concern: (647) and (666).
(338) Prescribed Burning – Silvacultural Burning and Site Prep Burning to improve wildlife habitat, control undesirable vegetation, prepare sites for planting or seeding, control plant diseases, reduce fire hazards. Associated Practices listed in this resource concern: (647) and (666).
(386) Field Border – Wildlife/Pollinator Habitat Buffers to establish food, cover (including nesting and brood cover) for wildlife, including pollinator habitat/corridors. Associated practice listed in this resource concern: (647).
(391) Riparian Forest Buffer – An area consisting predominantly of trees and/or shrubs located adjacent to and up-gradient from water sources or water bodies. Associated practices listed in this resource concern: (612) and (647).
(394) Firebreaks – A strip of bare land (Non-Vegetated) or fire-retarding vegetation (Vegetated) to protect soil, water, and plant resources by reducing or preventing damage from fire. Associated practices list in this resource concern: (338), (647), & (666).
(490) Forest Site Preparation – Treating areas to encourage natural seeding of desirable trees or to permit reforestation by planting or direct seeding. Preparing land from establishing a stand of trees to conserve soil and water, to improve watersheds, or to produce tree/shrub species for wildlife habitat. Associated practices listed in this resource concern: (338), (394), (612), & (666).
(512) Forage and Biomass Planting – Establishing and reestablishing native or forage species. Mixture of at three native warm season grasses required. Forbs and legumes allowed as part of the planting mixture. Associated practices listed in this resource concern: (315) & (647).
(587) Structure for Water Control – To control the stage, discharge, distribution, delivery, or direction of flow of water in open channels or water uses areas. Also used for water quality control, such as sedimentation reduction or temperature regulation. These structures are also used to protect fish, wildlife, and other natural resources.
(612) Tree & Shrub Establishment – Establishing woody plants by planting seedlings or cuttings, direct seeding, or natural regeneration to conserve soil moisture, protect a watershed, or create/enhance wildlife and pollinator habitat. Associated practices listed in this resource concern: (338), (394), (490), & (666).
Formatted: U

WRMP for Red Bud – Catalpa Creek Watershed 80
(647) Early Successional Habitat Development & Management – Manage plant succession to develop and maintain early successional habitat to benefit desired wildlife and/or natural communities such as nesting areas and transition zones by disking. Associated practices listed in this resource concern: (314), (315), (338), (394), (386), & (666).
(666) Forest Stand Improvement – Manipulating species composition and stocking by cutting or killing selected trees and understory vegetation. To enhance and improve a stand of trees, to conserve soil and water, to improve wildlife habitat, or to produce wood crops for diverse wildlife habitat. Associated practices listed in this resource concern: (315), (338), (394), & (647).
Selection and Siting of Management Practices. NRCS and Oktibbeha County Soil & Water Conservation District staff have developed an estimated annual budget for implementation of appropriate management practices to address the four resource concerns in the Catalpa Creek Watershed. Site selection will be based upon best professional judgment of NRCS and Oktibbeha County Soil & Water Conservation District staff, and MSU researchers with experience in the Catalpa Creek Watershed, monitored water quality analytical results, and observed conditions.
NRCS Estimated Average Annual Cost for Each Resource Concern. Resource Concern-specific tables (Table 11.1.1,Table 11.1.2,Table 11.1.3,Table 11.1.4)and average yearly estimates (Table 11.1.5) illustrate NRCS’ estimates for implementing best management practices in one year to address the resource concerns identified for the Catalpa Creek Watershed. Total costs for a three-year implementation are including in Table 11.1.6.
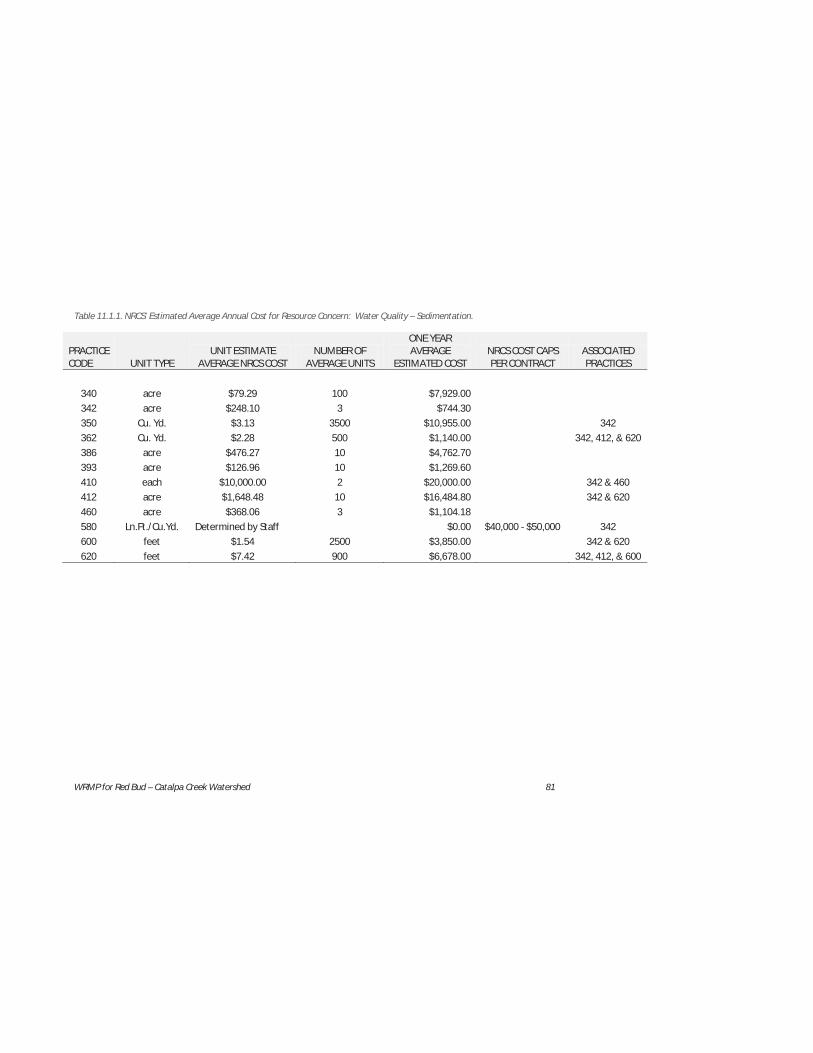
WRMP for Red Bud – Catalpa Creek Watershed 81
Table 11.1.1. NRCS’ Estimated Average Annual Cost for Resource Concern: Water Quality – Sedimentation.
PRACTICE CODE UNIT TYPE
UNIT ESTIMATE AVERAGE NRCS COST
NUMBER OF AVERAGE UNITS
ONE YEAR AVERAGE
ESTIMATED COST NRCS COST CAPS PER CONTRACT
ASSOCIATED PRACTICES
340 acre $79.29 100 $7,929.00 342 acre $248.10 3 $744.30 350 Cu. Yd. $3.13 3500 $10,955.00 342 362 Cu. Yd. $2.28 500 $1,140.00 342, 412, & 620 386 acre $476.27 10 $4,762.70 393 acre $126.96 10 $1,269.60 410 each $10,000.00 2 $20,000.00 342 & 460 412 acre $1,648.48 10 $16,484.80 342 & 620 460 acre $368.06 3 $1,104.18 580 Ln.Ft./Cu.Yd. Determined by Staff $0.00 $40,000 - $50,000 342 600 feet $1.54 2500 $3,850.00 342 & 620 620 feet $7.42 900 $6,678.00 342, 412, & 600

WRMP for Red Bud – Catalpa Creek Watershed 82
Table 11.1.2. NRCS’ Estimated Average Annual Cost for Resource Concern: Grazing Lands.
PRACTICE CODE UNIT TYPE
UNIT ESTIMATE AVERAGE NRCS COST
NUMBER OF AVERAGE UNITS
ONE YEAR AVERAGE
ESTIMATED COST NRCS COST CAPS PER CONTRACT
ASSOCIATED PRACTICES
315 acre $21.85 35 $764.75 528, 590, & 595 342 acre $248.10 5 $1,240.50 362 Cu. Yd. $2.28 300 $684.00 342
378 Cu. Yd. $4.00 2688 $10,752.00 $6,300 - $7,500 342, 382, 516,
& 614 382 feet $1.91 10000 $19,100.00 $7,500 - $9,000 410 each $10,000.00 2 $20,000.00 342 & 460 460 acre $368.06 2 $736.12 Limited to purpose 512 acre $180.26 15 $2,703.90 $7,300 - $ 8,800 315 & 528 516 feet $1.75 4000 $7,000.00 $1,380 - $1,660 342 & 614 528 acre $25.52 25 $638.00 $2,000 - $2,500 561 Sq Ft. $1.04 6300 $6,552.00 342, 516, & 614 576 Sq Ft. $2.83 2000 $5,660.00 $7,800 - $9,400 382, 528, & 614 578 Sq Ft. $3.55 800 $2,840.00 $10,000 - $12,000 342 & 382 614 Gallon $2.93 2100 $6,153.00 342, 516, & 561

WRMP for Red Bud – Catalpa Creek Watershed 83
Table 11.1.3. NRCS’ Estimated Average Annual Cost for Resource Concern: Sustainable Forestry.
PRACTICE CODE UNIT TYPE
UNIT ESTIMATE AVERAGE NRCS COST
NUMBER OF AVERAGE UNITS
ONE YEAR AVERAGE
ESTIMATED COST NRCS COST CAPS PER CONTRACT
ASSOCIATED PRACTICES
315 acre $50.49 5 $252.45 $3,200 - $3,800 666 338 acre $42.35 50 $2,117.50 666 342 acre $248.10 5 $1,240.50 394 feet $0.26 5800 $1,508.00 $2,400 - $4,300 338 & 666 410 each $10,000.00 2 $20,000.00 342 & 460 460 acre $368.06 4 $1,472.24
490 acre $186.00 50 $9,300.00 338, 394, 612,
& 666
612 each $0.46 31100 $14,306.00 338, 394, 490,
& 666 666 acre $135.66 50 $6,783.00 $5,200 - $6,200 315, 338, & 394
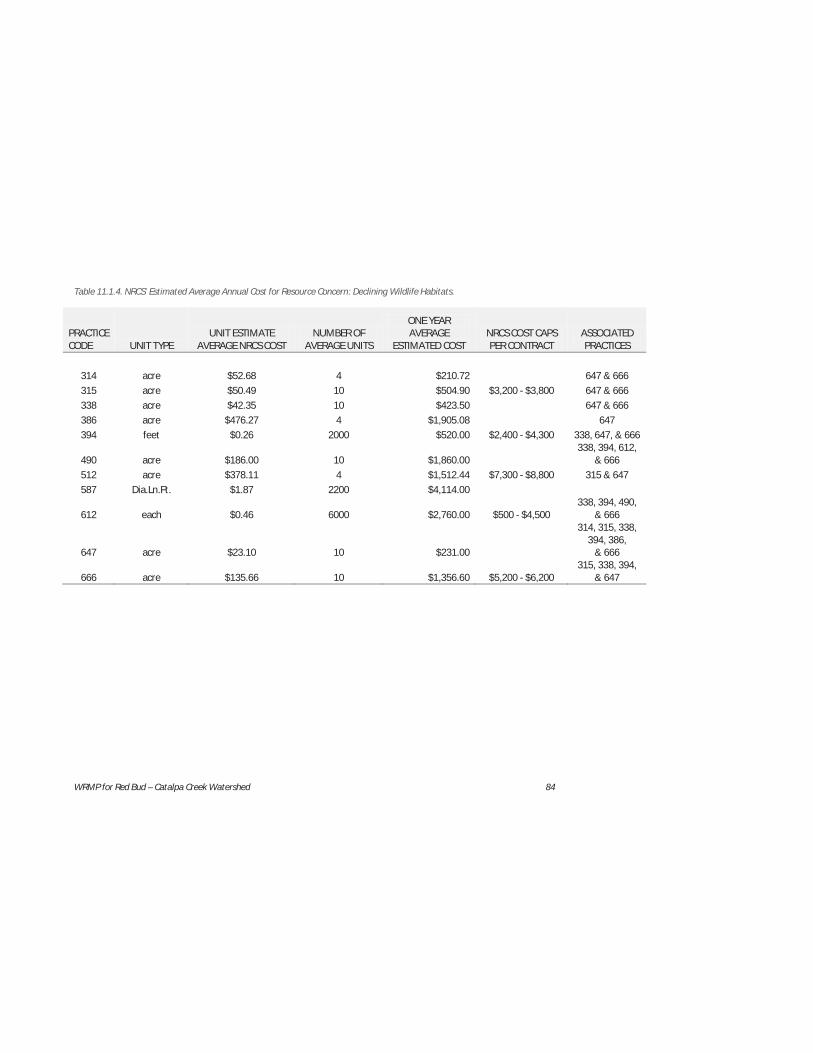
WRMP for Red Bud – Catalpa Creek Watershed 84
Table 11.1.4. NRCS’ Estimated Average Annual Cost for Resource Concern: Declining Wildlife Habitats.
PRACTICE CODE UNIT TYPE
UNIT ESTIMATE AVERAGE NRCS COST
NUMBER OF AVERAGE UNITS
ONE YEAR AVERAGE
ESTIMATED COST NRCS COST CAPS PER CONTRACT
ASSOCIATED PRACTICES
314 acre $52.68 4 $210.72 647 & 666 315 acre $50.49 10 $504.90 $3,200 - $3,800 647 & 666 338 acre $42.35 10 $423.50 647 & 666 386 acre $476.27 4 $1,905.08 647 394 feet $0.26 2000 $520.00 $2,400 - $4,300 338, 647, & 666
490 acre $186.00 10 $1,860.00 338, 394, 612,
& 666 512 acre $378.11 4 $1,512.44 $7,300 - $8,800 315 & 647 587 Dia.Ln.Ft. $1.87 2200 $4,114.00
612 each $0.46 6000 $2,760.00 $500 - $4,500 338, 394, 490,
& 666
647 acre $23.10 10 $231.00
314, 315, 338, 394, 386,
& 666
666 acre $135.66 10 $1,356.60 $5,200 - $6,200 315, 338, 394,
& 647

WRMP for Red Bud – Catalpa Creek Watershed 85
Table 11.1.5. NRCS Estimated Average Annual Cost for Four Resource Concerns.
RESOURCE CONCERN ESTIMATED ANNUAL COST Water Quality – Sedimentation $74,917.58 Grazing Lands $84,824.26 Sustainable Forestry $56,979.69 Declining Wildlife Habitats $14,398.24 Administrative Costs $5,000.00
Total $236,119.78
To determine restoration success, a comprehensive monitoring plan is being developed for Catalpa Creek Watershed that addresses water quality and habitat monitoring (Section 12). At the advent of the restoration component of this watershed-scale project, it is anticipated that implementation of management practices should occur at a consistent level over a three-year period. Post-implementation monitoring will then determine whether additional management practices should be implemented to achieve the desired goals and targets and/or the level of protection that will be needed to protect the restoration achievements.
Table 11.1.6. NRCS Estimated Cost for Four Resource Concerns for Three Years.
RESOURCE CONCERN ESTIMATED ANNUAL COST ESTIMATED THREE YEAR COST Water Quality – Sedimentation $74,917.58 $224,752.74 Grazing Lands $84,824.26 $254,472.78 Sustainable Forestry $56,979.69 $170,939.07 Declining Wildlife Habitats $14,398.24 $43,194.72 Administrative Costs $5,000.00 $15,000
Total $236,119.77 $708,359.31
Additional NRCS Practices Under Consideration. In addition to the practices recommended above, NRCS has identified additional common management practices used by agricultural producers in Catalpa Creek Watershed area. These practices are being considered for future protection activities in the watershed.
NRCS Practice Code: Conservation Practice Name:
(102) Comprehensive Nutrient Management Plan (104) Nutrient Management Plan (NMP) (106) Forest Management Plan (FMP) (110) Grazing Management Plan (GMP) (114) Integrated Pest Management Plan (IPM) (142) Fish and Wildlife Habitat Management Plan (201 & 202) Edge of Field Water Quality Monitoring (327) Conservation Cover (328) Conservation Crop Rotation

WRMP for Red Bud – Catalpa Creek Watershed 86
(329) Residue Mgt./Conservation Tillage (391) Riparian Forest Buffer (449) Irrigation Water Management (472) Use Exclusion/Access Control (516) Pipeline (livestock) (558) Roof Run Off Structures (Not a cost shared practice in
Mississippi yet. Is listed as a NRCS conservation practice.) (590) Nutrient Management (595) Integrated Pest Management (641) Watering Facility
111.2 STREAM MORPHOLOGY AND FUNCTION RESTORATION
Activities to improve the function of Catalpa Creek will follow the framework outlined in “A Function-based Framework for Stream Assessment and Restoration Projects” (Harman et al., 2012). The framework is based on hierarchical relationships between hydrology (Level 1), hydraulics (Level 2), geomorphology (Level 3), physicochemistry (Level 4), and biology (Level 5) in a conceptual pyramid with hydrology at the base moving upward to biology.
The application of this framework will entail the evaluation of the hydrological and hydraulic changes that have occurred in the past and contribute to their current condition, as well as geomorphological and biological attributes in the present. The evaluation will apply knowledge from existing stable reference reaches in the headwater tributaries and upper reaches of Catalpa Creek (where available); the integrated modeling of existing watershed hydrology, stream hydraulics and sediment transport, and channel morphology conditions; and the modeling of changes associated with proposed typical stream restoration design scenarios.
Typical design scenarios would address hydrodynamic processes, sediment transport processes, stream stability and riparian buffer restoration, which according to Fischenich (2006), are the most fundamental stream functions and processes that create and maintain the diverse biological communities, chemical and nutrient processes, diverse habitats, and water and soil quality improvement in a stream, being the more dependent functions that typically require time to be established in a fluvial system.
Based on the physical and economic constraints identified from the entailed evaluation, the restoration design scenarios of existing incised streams would search for establishing a connection between the bankfull stage of the channels and its floodplain, or stabilizing degraded streams, while addressing the underlying processes that create and maintain stream biological functions. In other words, the priority levels for the restoration of incised streams developed by Rosgen (1997) is the chosen approach to replace the incised

WRMP for Red Bud – Catalpa Creek Watershed 87
channel with a new, stable stream at a higher elevation (Priority 1), or to widen or create a new stable stream and floodplain at the existing channel bed elevation (Priorities 2, and 3). Channel stabilization techniques using in-stream structures and bioengineering to decrease streambed and streambank erosion (Priority 4) would be used only along highly constrained environments.
A monitoring and management plan will be prepared and implemented to evaluate not only the criteria used, but how well the criteria met the objectives; direct any necessary modifications or improvements for future work; and validate the models used for assessment leading to the design to ensure that predictions are correct in relation to observations.
Implementation monitoring would determine if the design variables, structures and riparian plantings were constructed or established correctly. The natural variability of stream-type morphological data should be used to help evaluate if the channel dimension, pattern and profile were implemented within a range that matches the natural variability of the reference reach data.
Effectiveness monitoring would evaluate if the intended objectives of the restoration were met. It will also determine if post-runoff channel adjustments following restoration fall within the range of natural variability for dimension, pattern and profile data.
Validation monitoring would evaluate if the predictions match the post-restoration response. This monitoring is directed at the response of post runoff, such as streambank erosion reduction and bed stability vs. the predicted response generated from hydrology, hydraulic, sediment transport and channel evolution modeling.
Physical monitoring would involve cross-sections and longitudinal profiles resurveys to check post-restoration construction (implementation) vs. post-runoff response (effectiveness). The biological monitoring should include pre- and post-restoration population estimates and macro-invertebrate inventories. Vegetative mortality and survival plots will establish post-restoration success response.
A management plan for the Catalpa Creek Watershed will be developed to ensure that the implemented design is successful. The plan would include replanting or seeding reestablished riparian vegetation; post-runoff inspections of structures for grade control, streambank stabilization, cross roads, or fish habitat enhancement; post-runoff inspections for the dimension, pattern, and profile of the design to verify restored reaches stay within the natural variability of stable reference channels within each typical design scenario.

WRMP for Red Bud – Catalpa Creek Watershed 88
111.3 SURFACE WATER QUALITY AND HABITAT RESTORATION AND PROTECTION IN THE URBAN
ENVIRONMENT
Restoration and protection activities in the urbanized area of the Catalpa Creek Watershed will focus largely on MSU’s campus. Fortuitously, MSU’s Master Plan comprehensively addresses this issue.
MSU Master Plan. In 2010, MSU released its Master Plan that provides a vision for the future and serves as a living document that establishes a framework that conceptualizes a long-term strategic view for future campus development (MSU, 2010). The Master Plan promotes sustainable and responsible development with the aim of enriching the natural environment, local community and campus life. It concentrates academic, research and support facilities in the central campus area, limits impacts on surrounding farm land and wooded areas, aims to utilize existing infrastructure efficiently and promotes a collegiate, pedestrian—scale environment.
The sustainable design strategies of the Master Plan address the relationship between the quality of life, the local climate and resource consumption patterns, and addresses environmental sustainability in four key areas – land use, water resources, climate response (energy and atmosphere), and mobility. Because of the location of a portion of MSU’s campus in the headwaters of the Catalpa Creek Watershed, the need and opportunity exists to integrate urban land use planning contained in MSU’s Master Plan with watershed-scale planning for the 28,939 acre watershed.
The following portions of the Mississippi State University 2010 Master Plan were originally produced by consultant LPK Architects, P.A. and provided by the MSU Master Plan Development Advisory Committee (MSU, 2010). Parts of the following information are excerpted and/or paraphrased from various sections of MSU’s Master Plan.
Master Plan Principles. MSU’s Master Plan embraces the concept of sustainability and is informed by a comprehensive range of social, environmental and economic principles. The environmental principles are identified below.
Natural Environment Climate – sustainable building and landscape design requires an understanding of the local climate conditions and the impact these conditions have on human comfort, energy use, and rainwater management. In response, the Master Plan provides specific guidance for building orientation and the use of landscape to address shading and rainwater (storm water) management objectives.
Habitat – as a land grant institution, the way in which MSU protects the land resources, forests and the habitats of the campus is a reflection of the sustainability values of the

WRMP for Red Bud – Catalpa Creek Watershed 89
institution. The Master Plan provides policies, planning and design guidance to ensure that sustainable land management practices are incorporated.
Hydrology – with the focus on sustainability, storm water management concepts are incorporated in the landscape and infrastructure design recommendations for the campus and the surrounding context. Storm water is noted to be a community-wide concern given the way in which off campus development affects the hydrological conditions on the campus and vice versa. The Master Plan recommends a comprehensive storm water management strategy for the campus utilizing low-impact design techniques combining engineering with landscape elements. The intended outcome is a storm water strategy featuring ponds, bioswales, and rain gardens that manage water above ground in association with landscape solutions that improve the aesthetic qualities of the campus environment.
Built Environment
Land use – MSU’s legacy as a land grant University is evident in the 4,400 acre main campus and extensive land holdings across the state. To ensure that land resources are provided to support the existing and future mission of MSU, the Master Plan includes policies and planning guidance to protect and preserve land for mission-related purposes.
Landscape – sustainable landscape practices are proposed in the Master Plan to assist the University in developing a “working landscape”. A working landscape strategically positions trees and other landscape elements to provide shade, mitigate the heat island effect and contribute to a comprehensive storm water management strategy. A working landscape contributes to energy efficiency goals by shading buildings and horizontal surfaces, thereby, reducing the air conditioning loads on buildings. The landscape can also be viewed as a location for geothermal energy.
Space – providing appropriate and adequate space to support the academic, research and outreach mission of MSU is a key goal of the Master Plan. The space needs recommendations are based on an understanding of the building conditions assessments and the space needs analysis. Building renovation and demolition recommendations are provided along with potential new development to meet projected space needs. Detailed information for the building conditions and space needs is provided in the technical appendix. The Master Plan provides a flexible approach for accommodating the current and future academic and research space requirements of MSU. Based on the projected needs for a headcount of 22,000 students, additional space is required for offices, study and library functions, assembly and exhibition, dining, student union and lounge and recreation (details are provided in the space needs report of the technical appendix). Interdisciplinary research is noted to be an emerging focus area requiring new facilities to encourage collaboration among faculty members. The Master Plan, through a combination of renovation and new construction, illustrates adequate capacity to accommodate the emerging academic and research needs of MSU.
WRMP for Red Bud – Catalpa Creek Watershed 90
Infrastructure – the efficiency of the campus generation and distribution systems is a key consideration for the sustainable future MSU is targeting. The Master Plan concentrates future development in the academic core in order to better utilize existing infrastructure and to facilitate an efficient expansion of the systems. Detailed recommendations for infrastructure improvements are provided in the technical appendix.
Mobility – MSU’s recent focus on the pedestrianization of the campus combined with an emphasis on bicycle use supports MSU’s sustainability objectives, notably the desired increase in sustainable transportation options and the associated reduction in transportation-related greenhouse gas emissions. The recommendations of the Master Plan provide a comprehensive, integrated approach to transportation embracing the concept of mobility; recommendations that provide a number of transportation options to serve the campus community with the goal of decreasing single occupancy vehicle use on the campus and reducing the associated impacts including congestion and emissions. To that end, improvements to infrastructure, land use coordination and scheduling/operational strategies are proposed in the Master Plan.
Resource Flows
Potable water – the University consumes an average of one million gallons of water per day. In line with the sustainability objectives of MSU, strategies are required to reduce consumption and patterns of use. The Master Plan supports this objective, in part, by proposing the use of indigenous plant materials (plants that require less irrigation) and other infrastructure improvements. Details for the potable water infrastructure and strategies for reduction consumption are provided in the technical appendix.
Energy – MSU has made good progress toward its sustainability goals by reducing energy consumption by 20+ percent since 2006 (the base line year). This progress is of particular importance given the Mississippi Institutions of Higher Learning’s mandate to reduce energy consumption by 30 percent and MSU’s decision to sign the American College and University President’s Climate Commitment (ACUPCC) and the ultimate goal of working toward climate neutrality. The Master Plan incorporates planning and landscape strategies to reduce energy consumption on both existing and proposed buildings. A shade strategy, based on the strategic placement of shade trees, is incorporated in the plan to reduce the cooling load on buildings and diminish the size and impact of heat islands adjacent to buildings. Future buildings are oriented on the east-west axis to minimize excessive heat gain in the warmer months and to enhance the passive solar qualities during the winter months. Details for reducing energy consumption of the campus buildings and infrastructure are provided in the technical appendix.
Emissions – as a signatory of the ACUPCC, MSU has committed to the goal of climate neutrality. The ACUPCC not only signals the beginning of a focused effort to reduce carbon emissions, but also a commitment to sustainability in the broadest sense – a commitment not only to transform the MSU campus, but to continue with the
WRMP for Red Bud – Catalpa Creek Watershed 91
transformation of the mission, curriculum, research and operations of the University. This commitment is in synch with the original land grant values of stewardship, education, research and outreach. Achieving climate neutrality will necessitate significant changes to University operations and is detailed in MSU’s Climate Action Plan.
Materials/wastes – in support of this goal, MSU will need to complete an analysis of the waste streams and volumes associated with campus activities, expand the recycling programs and continue to enhance and potentially expand the composting program.
Master Plan Frameworks. The Master Plan consists of physical design, programmatic and functional frameworks which collectively form a comprehensive and coordinated vision for guiding incremental change. Several key components of these frameworks related to the Catalpa Creek Watershed Restoration & Protection Project is the Master Plan’s Land Use and Landscape Frameworks.
Land Use Framework
MSU’s legacy as a land grant University is evident in the extensive land holdings of the 4,400 acre main campus. The South and North Farms serve as open laboratories for a number of programs in agriculture, forestry, veterinary medicine and MAFES. The Master Plan promotes the stewardship of this land to meet the need of current programs as well as future generations, a key objective of sustainability. In response, policies are provided to protect campus farm land the encroachment of from continued sprawl.
The H.H. Leveck Animal Research Center (South Farm) is defined by the low lying areas of campus and the associated floodplain conditions of Catalpa Creek. A 100-foot wide buffer centered on the alignment of the creek is provided to ensure protection of water quality and to control erosion. To protect the South Farm lands, development is prohibited unless it is directly relation to academic or research activity. Development along the proposed south entry road is also prohibited for any purpose other than agricultural or forestry facilities.
The R.R. Foil Plant Science Research Center (North Farm) encompasses some of the best farmland in Oktibbeha County, a factor that can be attributed to the extensive floodplain associated with Sand Creek. To protect this land, no development is permitted on North Farm in the floodplain areas. Development outside the floodplain is limited to uses that are directly related to and support agricultural activities.
Expansion for the Research Park is reserved to the east of the current development. A new access roadway is proposed to connect Research Boulevard with the expansion site.
The framework for core campus land use focuses on five components – topography, hydrology, land use patterns, circulation patterns, and development sites (Figure 11.3.1). The influence of the topography on the campus development is apparent in the placement of buildings. A majority of the buildings are sited on the higher ground or

WRMP for Red Bud – Catalpa Creek Watershed 92
“plateau” of the campus; the land above elevation 360’. The edges of the plateau, in several areas, are characterized by steep slopes which complicate pedestrian circulation and building placement. The most valuable land for the academic mission is defined by the 10 minute walking radius surrounding the drill field. Because of this, the land within the 10 minute walking radius is prioritized for academic and key campus life facilities.
Regarding hydrology, the stream corridors and drainage patterns are evident in the land use pattern of the campus. Catalpa Creek and its eastern and western branches define the low lying areas along Stone Boulevard and Hardy Road. The open spaces, landscapes and woods associated with these areas are reinforced in the Master Plan as defining features of the campus. On the north side of campus, the low lying area extending from Barr Avenue to Coliseum Drive, and ultimately to Chadwick Lake, is reimaged as a landscape and water management corridor providing strong links between the academic core of the campus and the athletics district.
Land use patterns reflect the iconic landscapes and open spaces that contribute to a memorable campus character. Building upon the organizational structure established by these spaces, new landscape linkages are proposed in the Master Plan to provide better connectivity and to extend the positive qualities of the landscape to other areas of the campus.
The circulation patterns of the campus are improved and extended to provide a comprehensive network of pedestrian, bicycle, transit and vehicular circulation routes across the campus.
Within the framework of topography, hydrology, land use and circulation patterns of the campus, several development sites are identified. In some cases, the proposed sites include the redevelopment of existing buildings while in other cases, the sites are readily available for development.

WRMP for Red Bud – Catalpa Creek Watershed 93
Figure 11.3.1. Land use framework with flood plain.
North Farm
Research
Main Campus
South Farm
Equestrian Park
WRMP for Red Bud – Catalpa Creek Watershed 94
Landscape Framework – Storm Water Management. Storm water management is a key component of the Landscape Framework contained in MSU’s Master Plan because of the flooding problems that exist along the east and west branches of Catalpa Creek, which are especially problematic on the South Farm.
A storm water impact analysis was performed during the planning process on the existing campus conditions to inform the Master Plan and identify existing problem areas. The analysis was based on site topography and surface cover. Land within the campus boundaries was broken into 12 different catchments, six of which drain into Catalpa Creek (Figure 11.3.2). The remaining five drain to various points along the north and east perimeter. Soils on campus are hydraulic, with slow infiltration rates and high runoff potential.
In the developed campus core the percent of impervious surface ranges from 24 percent to 53 percent. The chief concern in the core campus is water quality control, peak run off volume and total runoff volume. Since most of the area discharges directly to Catalpa Creek, addressing water quality is an important issue. The initial inch of rain and subsequent storm water runoff is known to contain the majority of storm water pollutants, thus, addressing the initial run off can greatly improve water quality.
The sustainable storm water management strategies for the MSU campus address three interrelated variables/metrics – water quality, water volume, and peak rate of flow.
Water quality—impervious pavement and development prevents natural percolation of storm water into the soils. Run-off from developed areas is contaminated by chemical pollution such as motor oil and salt resulting in water quality concerns. Proposed water treatment strategies include “green” alternatives that mimic the functions of the natural landscape and allow for treatment in the form of green roofs and rain gardens integrated into the campus landscape.
Water volume—on the MSU campus storm water is collected and flows to Catalpa Creek and other stream corridors
Peak flow rate—is a concern due to the surcharging during high intensity, short duration rainfall events. The recommended strategies for mitigating the peak flow rate include detention and retention facilities incorporated with the landscape features of a site.

WRMP for Red Bud – Catalpa Creek Watershed 95
The landscape strategy for storm water management and mitigation offers great potential to improve water quality and ecosystem function in the watershed. The use of landscape as a means of reducing peak rate of storm water runoff, limiting the total volume of runoff to pre-developed hydrologic conditions and providing water quality treatment can also avoid the expense of subsurface infrastructure systems and deep (fenced-off) detention basins. Landscape recommendations associated with storm water are identified below.
Provide a 100-foot stream buffer on all campus streams;
Incorporate low impact development (LID) landscape solutions as vital component of future campus planning and development;
Sub-watersheds should be studied in relation to future campus projects that impact pervious surfaces (i.e., existing lawn or planted areas) so that landscape mitigation proposals (on-site or off-site) can be incorporated as part of the project;
Where feasible, on-site storm water treatment should be provided for all newly constructed campus buildings and landscape projects;
Protect and re-vegetate landscape areas along existing creeks and drainage ways (within the 100-foot buffer);
Direct storm water flow from existing creek beds to water receiving landscapes that are designed to allow for infiltration and slow discharge (i.e., bio-retention cells); and
Enhance landscapes around existing on-site water resources (Chadwick Lake) with vegetated filters and water absorbing plantings at storm water discharge points to improve water quality.
____ Catchment Boundary ▬▬ Retention Pond Flood Plain ▬▬ Potential Retention Basins ▬▬ Stream Protection Buffers
Figure 11.3.2. Campus flow patterns and catchments with proposed retention basins and stream buffers.
WRMP for Red Bud – Catalpa Creek Watershed 96
Recommended best management practices for existing campus buildings and infrastructure as well as new facilities are storm water retention basins and stream protection buffers.
Storm Water Retention Basins. The Master Plan minimizes the impact of future expansion by concentrating development in the established core of the campus and by incorporating several retention basins to address water quality and rate of runoff. The retention basins, which are proposed as part of the landscape strategy for the campus, are proposed along the central, eastern and western branches of Catalpa Creek to intercept runoff associated with campus development as well as runoff associated with development off campus. The following retention facilities are proposed:
South Entry—a major new retention pond reminiscent of Chadwick lake is proposed on the south end of campus in conjunction with the new south entry road improvements. This new facility is envisioned as part of the gateway experience and is intended to intercept water flowing from the central and western branches of Catalpa Creek. The pond is one of a series extending along the northwest branch of Catalpa Creek.
Stone Boulevard recreation fields—a retention pond is proposed at the south end of the recreation fields to intercept water from the adjacent parking necessary to support south campus development.
Hardy Road—two retention facilities are proposed along the eastern branch of Catalpa Creek to intercept water flowing south and west from Eckies Pond. A second pond, directly west of Hardy Road, is proposed to intercept runoff from development in the south campus district.
Stream Protection Buffers. A 100-foot wide stream protection buffer is proposed along all major stream corridors throughout the campus. The buffers are envisioned to incorporate appropriate riparian planting to minimize erosion and control runoff. The proposed buffers are indicated in the water resources framework.
The proposed storm water recommendations focus on horizontal surfaces and the rainwater capturing potential of those surfaces. The goal is to leave the water as diffusely scattered across these surfaces as possible.
Recommended strategies for future facilities and sites include:
Green Roofs. MSU should consider installing green roofs on roof replacement projects and on new buildings. Green roofs retain storm water and return a portion directly to the atmosphere through evapotranspiration. Features include:
– A layer of vegetation installed on flat or low sloped roofs; – “Extensive” green roofs feature a thin layer of soil and are usually
composed of sedum;

WRMP for Red Bud – Catalpa Creek Watershed 97
– “intensive” green roofs have a thicker soil layer and contain shrubs, trees and other vegetation;
– green roofs can retain 15-90% of rainfall; – green roofs are most effective in reducing run-off volume and rate; and – green roofs can reduce air pollution, provide habitat for wildlife and
sound insulation. Rain Gardens. MSU should drain roofs into rain gardens wherever possible. Rain
gardens are landscape features designed to retain and infiltrate storm water. They are typically 6 to 18 inches deep and include plants tolerant to periodic submersion. It is recommended that all future quadrangles and landscape areas be designed as rain gardens or water receiving landscapes, conditions permitting. These rain gardens should feature:
Small, vegetated depressions used to capture and infiltrate storm water runoff; Plants with appropriate soil mixture and planted with native shrubs, grasses and
flowering plants; and Detention times of no more than 24 hours. Pedestrian Hardscape. MSU should consider pervious paving for pedestrian
hardscapes. Permeable concrete, paving stone or crushed stone allowing water to drain directly into the ground. In the clay soil conditions, such as those on the MSU campus, the excavation and creation of a drainage layer approximately 24 inches deep is required. Pervious paving is recommended where there is no option for creating a water receiving landscape. Other hardscape design strategies should include:
Plan for a reduction in impervious area; and Utilization of french drains and dry wells in appropriate locations (soil conditions
permitting). Bio-retention Swales. Bio-retention swales are recommended in all future
surface parking areas with adequate land area (suggested area: equivalent to 5% of the surface area drained) and suitable soil conditions. The bio- retention swales are landscapes where water is diverted and detained to treat and slow down peak flow rates. Pervious paving should be considered but only where water receiving landscapes are not possible.
Infrastructure Framework. The Master Plan also provides recommendations for establishing a “green” approach to infrastructure. The plan provides comprehensive storm water management concepts and recommendations with the intent of improving water quality, decreasing runoff and preventing erosion and flooding. It also focuses on efficiency in the traditional infrastructure.
Plantings. The vegetative elements of the landscape including trees, shrubs, ground cover and lawns are an essential and defining part of the MSU campus. Trees and shrubs help define campus open spaces, help define the quality of the campus environment and

WRMP for Red Bud – Catalpa Creek Watershed 98
also support the long-term goals of campus sustainability. Plantings can also facilitate the performance of natural systems (i.e. waterways and drainage patterns) and improve overall campus storm water management and performance. Protecting existing vegetation, removing invasive plants, and supplementing with new plantings will ensure that natural systems continue to function and improve over time. Appropriate selection and location of trees can provide shade and mitigate heat islands of pavement and west facing building facades. In all cases, plantings should be implemented to emphasize these larger formative landscape characteristics.
Irrigation. Currently MSU’s entire irrigation water supply comes from potable sources (campus wells). It is recommended that all MSU plantings be designed to thrive without irrigation after an initial growth establishment period. Recommendations relating to irrigation include:
Limit irrigation to campus lawn areas that receive heavy pedestrian and tailgating use (i.e., the Junction);
Consider non-potable water sources for the irrigation water supply (Chadwick lake and Eckies Pond);
Limit irrigation operations to periods of time associated with heavy use (i.e. tailgating, recreation activities);
Implement weather station(s) for monitoring and managing irrigation zones and programming irrigation time periods;
Update mapping of all existing campus irrigation zones and plan for improved maintenance planning and operations;
Conduct periodic inspections of irrigation heads to repair and reduce over-spray onto non-irrigated surfaces;
All newly implemented planted areas should be supplied with amended planting soils designed with moisture retention capacity to reduce irrigation dependency;
Provide a supplemental watering program (in-house maintenance operations or landscape installation contract) associated with new plant growth establishment and limit to a two-year period; and
Native and adaptive hardy plant selection criteria should consider watering demands as part of the plant selection process.
MSU Estimated Average Annual Cost for Urban Storm Water Protection. MSU’s average annual cost for urban storm water protection is not known at this time. However, efforts will be made to identify and quantify/estimate these costs. This will include costs for existing activities as well as for future construction and operations.
In addition to the above referenced items from the MSU Master Plan, the following restoration and management activities are also proposed.
Best Turfgrass Management Practices. Highly maintained turfgrass, such as that surrounding Davis Wade Stadium, is frequently overseeded with perennial ryegrass in the fall of the year, which increases nutrient demand. Overseeding yields a turf that is

WRMP for Red Bud – Catalpa Creek Watershed 99
green year round, thus fertilized nearly twice as much as it would be if it were not overseeded (approximately 4 to 8 lb N / 1000 ft2).
Moderately maintained turf areas, like that surrounding campus buildings or adjacent to sidewalks, require approximately 3 to 5 lb N / 1000 ft2, but are infrequently irrigated. However, these areas are often proximal to impervious surfaces where runoff is more apt to be channeled toward open sewers and storm water confluence features, ultimately resulting in offsite movement of nutrients.
The loss mechanisms of turf applied nutrients, especially nitrogen, are well understood. However, loss is highly variable due to abundant factors – nitrogen source, rainfall intensity, surface slope, turf health, erosion potential, soil water status during application and immediately after, turf species and variety, light levels, soil and air temperature, soil organic matter, cation exchange capacity, and soil type.
Nitrogen use efficiency (NUE) is a term commonly used to indicate relative balance of applied nitrogen versus that used by turf. Reported NUE for warm-season grasses range from 63 to 84% (Bowman et al., 2002). Nitrogen loss may be due to leaching, volatilization, direct run-off, or immobilization.
Leaching - Precipitation and irrigation beyond evapotransporational demands of turf increases NO3 leaching from Kentucky bluegrass (Morton et al., 1988) and hybrid bermudagrass (Snyder et al., 1984). Implications are that Mississippi’s heavy rainfall and the level of irrigation required to maintain turf aesthetics and wear tolerance may contribute to excessive nutrient leaching.
Volatilization – Soils harbor bacteria that thrive in saturated (anaerobic) conditions. These microbes convert NO3 nitrogen to oxygen and nitrogen gases. Volatilization of NH4 occurs when urea nitrogen sources are applied in the presence of water and urease.
Objectives for turfgrass management. The following objectives, if implemented both on the central campus and the surrounding research farms, could decrease nitrogen species loading into Catalpa Creek and sustain a healthy Catalpa Creek Watershed:
1. reduce nutrient input; 2. reduce storm water runoff intensity; 3. correct turf species selection (and in some instances reducing turf acreage
altogether); 4. improve nutrient management; and 5. increase stakeholder awareness of the proper turfgrass best management
practices.
Major Considerations for turfgrass management. The headwaters of Catalpa Creek originate on the ridge line where Davis Wade Stadium is situated. Within this basin, approximately 25 acres of maintained turfgrass lawn flow directly onto an impervious surface or into a storm-water sewer. This direct runoff may be considered a point source
WRMP for Red Bud – Catalpa Creek Watershed 100
for downstream pollution. The sports field itself, does not drain south but north, piped directly into Chadwick Lake.
Tracing the creek further south, the water is day-lighted into a deeply downcut and channelized creek which courses under black jack to reemerge and become the principle confluence feature of the entirety of South Farm.
Beginning at faculty housing nearest the creek, there exists low maintenance lawn and intramural fields which are allowed to directly flow into the creek. The campus master plan depicts the remaining daylighted creek north of Blackjack being covered, which is sure to increase already evident flooding potential further north of the already deteriorated natural flood plain. This too will increase downstream flooding and will further downcut the channel, possibly leading to road instability and infrastructure failure at the Blackjack creek crossing and other crossings or paralleling roads downstream.
Fertility budgets for the University grounds exist but are not readily available at this time; however, it could be surmised that turf cover on the MSU campus comprises a moderate risk to stream and ecosystem health within the Catalpa Creek watershed. Specifically, storm water runoff exceeds the creeks capacity without bolstered or reestablished flood mitigation. Ideally, these mitigation techniques would include returning some, if not all, of the currently daylighted Catalpa Creek to a natural flood plain. Similarly, retention and water recharge areas should be mandated on newly constructed parking lots, and remediation techniques, such as bio swells and raingardens, should be added to high impact areas of existing impervious areas, as well as maintained turf.
Reducing impervious surfaces and mitigating storm water run-off should be a guiding principle for all future master planning of the University campus. Regular street sweeping and a comprehensive recycling and waste management program are needed to reduce pollution flow through current gutters, which directly enter Catalpa Creek.
Replacing Turf with Pollinator Habitat. Sites designed to attract numerous types of insect pollinators - non-native European honeybee (Apis mellifera) and native bumblebees (Bombus spp.) - should be implemented in replacement of maintained turf and hardscapes. Potential plant material may include those detailed in Table 11.3.1. Milkweeds (Asclepias spp.) are especially attractive for the monarch butterfly (Danaus plexippus). Both annuals that reseed themselves and perennials that persist several years are included.
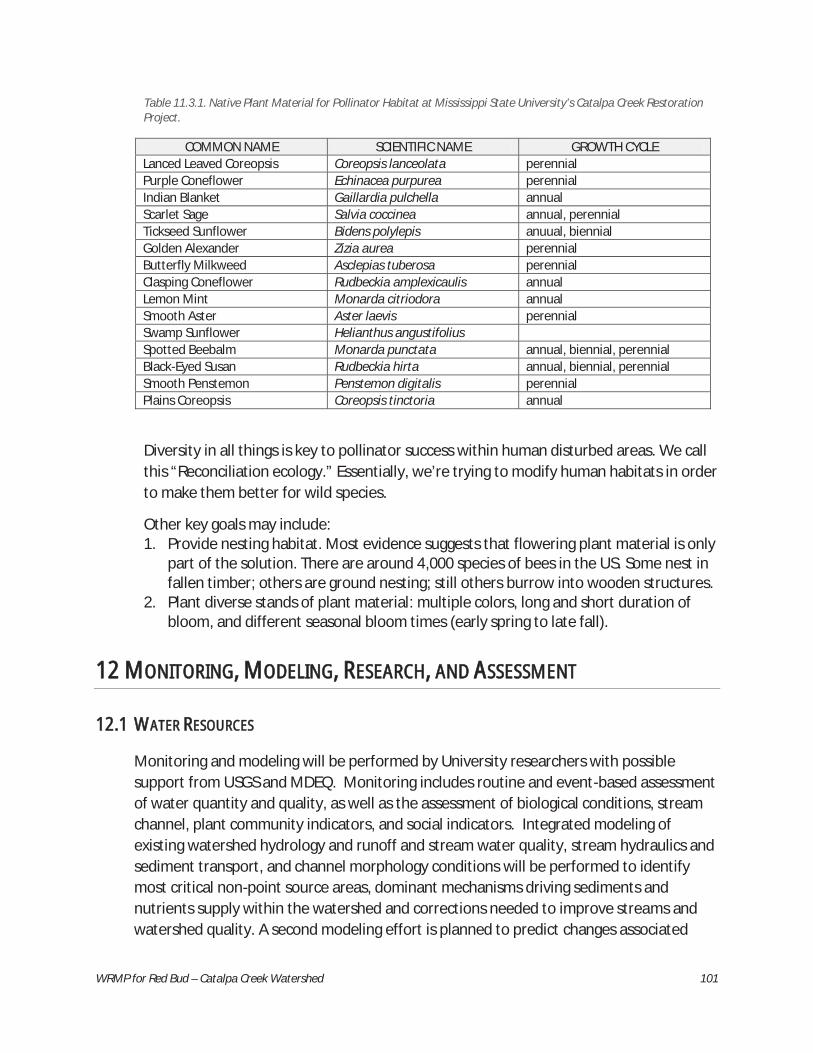
WRMP for Red Bud – Catalpa Creek Watershed 101
Table 11.3.1. Native Plant Material for Pollinator Habitat at Mississippi State University’s Catalpa Creek Restoration Project.
COMMON NAME SCIENTIFIC NAME GROWTH CYCLE Lanced Leaved Coreopsis Coreopsis lanceolata perennial Purple Coneflower Echinacea purpurea perennial Indian Blanket Gaillardia pulchella annual Scarlet Sage Salvia coccinea annual, perennial Tickseed Sunflower Bidens polylepis anuual, biennial Golden Alexander Zizia aurea perennial Butterfly Milkweed Asclepias tuberosa perennial Clasping Coneflower Rudbeckia amplexicaulis annual Lemon Mint Monarda citriodora annual Smooth Aster Aster laevis perennial Swamp Sunflower Helianthus angustifolius Spotted Beebalm Monarda punctata annual, biennial, perennial Black-Eyed Susan Rudbeckia hirta annual, biennial, perennial Smooth Penstemon Penstemon digitalis perennial Plains Coreopsis Coreopsis tinctoria annual
Diversity in all things is key to pollinator success within human disturbed areas. We call this “Reconciliation ecology.” Essentially, we’re trying to modify human habitats in order to make them better for wild species.
Other key goals may include: 1. Provide nesting habitat. Most evidence suggests that flowering plant material is only
part of the solution. There are around 4,000 species of bees in the US. Some nest in fallen timber; others are ground nesting; still others burrow into wooden structures.
2. Plant diverse stands of plant material: multiple colors, long and short duration of bloom, and different seasonal bloom times (early spring to late fall).
112 MONITORING, MODELING, RESEARCH, AND ASSESSMENT
12.1 WATER RESOURCES
Monitoring and modeling will be performed by University researchers with possible support from USGS and MDEQ. Monitoring includes routine and event-based assessment of water quantity and quality, as well as the assessment of biological conditions, stream channel, plant community indicators, and social indicators. Integrated modeling of existing watershed hydrology and runoff and stream water quality, stream hydraulics and sediment transport, and channel morphology conditions will be performed to identify most critical non-point source areas, dominant mechanisms driving sediments and nutrients supply within the watershed and corrections needed to improve streams and watershed quality. A second modeling effort is planned to predict changes associated

WRMP for Red Bud – Catalpa Creek Watershed 102
with typical stream restoration design scenarios and proposed implementation of BMPs at channel and watershed level.
Water Quality/Quantity. The approach for evaluating outcomes, including plans for monitoring and modeling, and for reporting on progress to achieve the objectives of this application leverage several complimentary approaches and strategies, including EPA’s Handbook for Developing Watershed Plans and Mississippi's State-level Strategies to Reduce Nutrients and Associated Pollutants (identified below):
1. Determine appropriate spatial and temporal scales; 2. Determine appropriate reference period (assess system dynamics in determining
the reference frame; evaluate hydrologic period of record; incorporate existing monitoring information);
3. Identify management practices to be implemented (identify the management practices to be monitored and consider the attributes of these management practices);
4. Establish monitoring site locations (consider multiple options; leverage funding of site locations with other agencies/organizations and partner on selecting monitoring parameters and reporting);
5. Select what will be monitored (match the monitoring parameters with the project objectives and the management practices; include biological as well as physicochemical parameters so relationships can be established between the biological or stream response and implemented practices);
6. Establish sampling frequency (integrate watershed, site, and hydrologic characteristics with desired outcomes from the implemented practices; ensure monitoring occurs over the annual hydrograph);
7. Provide analysis and assessment of results (establish an information management system to store information; consider the analyses to be performed as part of the monitoring program design such as watershed/stream modeling, geomorphic analyses, land use/nutrient loading, biotic/nutrient or other statistical relationships, status & trends analyses, etc.; assess the monitoring network periodically for effectiveness and relevancy);
8. Establish and document data QA/QC (ensure that all data quality objectives and quality assurance project plans are prepared and approved prior to initiating monitoring; conduct quality assurance and quality control protocols as part of field, laboratory, analysis, and modeling activities); and
9. Design the monitoring program to be sustainable and adaptable (refine and improve the monitoring approach and network as additional information becomes available).
Monitoring water quality and quantity will occur at various locations throughout the watershed, determined based on tributary delineations and land use maps, to identify

WRMP for Red Bud – Catalpa Creek Watershed 103
priority areas, which are likely to overlap priority areas for BMP implementation; and offer an opportunity for pre and post-BMP assessment. This approach will provide measureable outcomes following priorities of the EPA 9 elements objectives (Figure 12.1.1, Figure 12.1.2, Figure 12.1.3). Water quality/quantity monitoring and assessment activities will include:
Determination of nutrient inputs based on existing management policies (R. Moore);
Assessment and variability of streams hydrology and hydraulic characteristics (B. Baker, J. Ramirez-Avila, J. Martin, C. Siegert);
Identification of transport paths and trends, and mechanisms driving sediments and nutrient supply and exportation within and from the watershed (J. Ramirez-Avila; B. Baker);
Assessment and variability of sediment and nutrient concentrations and other water quality parameters in runoff, stream water, and streambed sediment (Water Quality Lab, Kelly Gene Cook Environmental Engineering Lab);
Testing incubation methods for sediment oxygen demand and nutrient release from streambed sediment (J. Martin, J. Ramirez-Avila, Kelly Gene Cook Environmental Engineering Lab)
Assessment of Pathogens levels in stream water (USDA Microbiology Lab- J. Brooks);
Monitoring precipitation on the MSU campus (located on the South Farm Facility) to include in modeling efforts towards calculating surface runoff, hydrologic characteristics, and nutrient, sediment, and pathogen loads (Chris Fuhrman & Jamie Dyer); and
Land use characterization at the time pre-monitoring begins, and during post-implementation monitoring will be critical to determine land use changes/ changes in impervious surfaces contributing to runoff, especially as major construction projects on the MSU campus adjacent to the headwaters is expected to continue throughout the Catalpa Creek Watershed Project.
A two tier integrated watershed and channel modeling effort is considered to support watershed management and stream restoration activities and watershed responses to restoration and BMPs implementation. Modeling efforts will consider:
Watershed modeling will be performed to simulate and predict runoff and stream flow, and sediment and nutrient transport conditions for the existing baseline scenario; identify critical areas of non-point source pollution and priority areas for BMPs implementation; and evaluate the watershed response post-implementation of BMPs and typical stream restoration design scenarios within the Catalpa Creek watershed. The modeling approach will combine the computational programs Agricultural Policy/Environmental eXtender (APEX) and the Soil and Water Assessment Tool (SWAT).
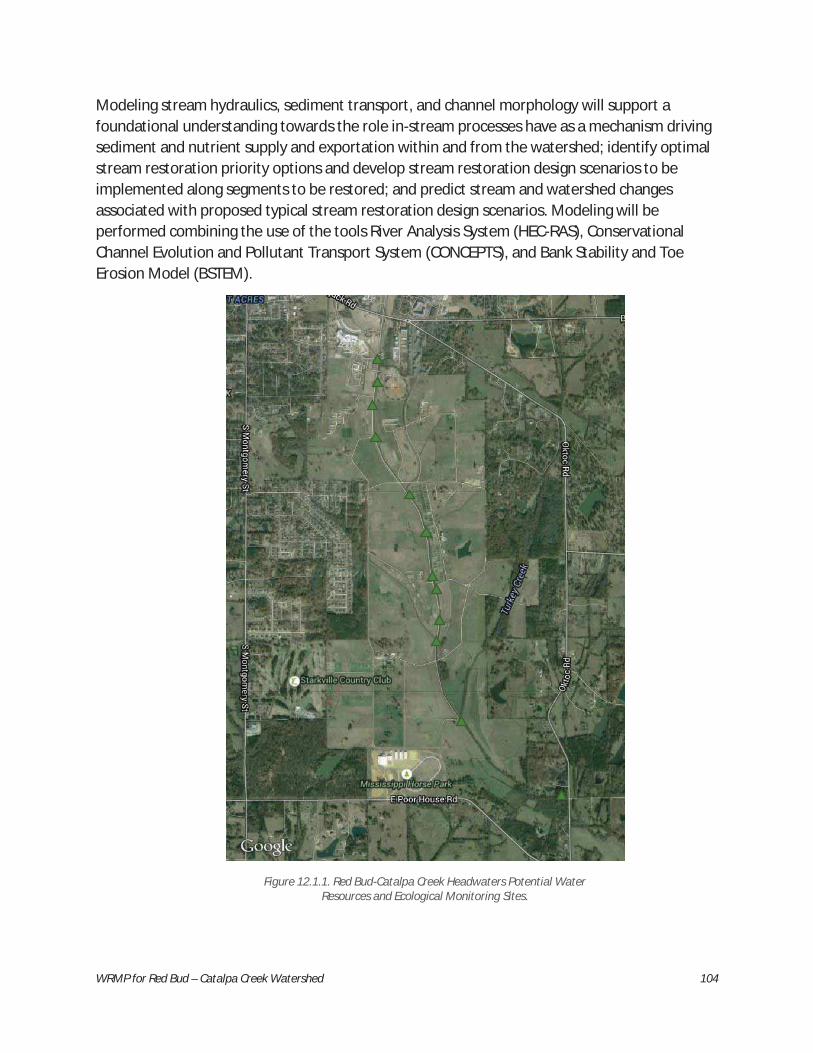
WRMP for Red Bud – Catalpa Creek Watershed 104
Modeling stream hydraulics, sediment transport, and channel morphology will support a foundational understanding towards the role in-stream processes have as a mechanism driving sediment and nutrient supply and exportation within and from the watershed; identify optimal stream restoration priority options and develop stream restoration design scenarios to be implemented along segments to be restored; and predict stream and watershed changes associated with proposed typical stream restoration design scenarios. Modeling will be performed combining the use of the tools River Analysis System (HEC-RAS), Conservational Channel Evolution and Pollutant Transport System (CONCEPTS), and Bank Stability and Toe Erosion Model (BSTEM).
Figure 12.1.1. Red Bud-Catalpa Creek Headwaters Potential Water
Resources and Ecological Monitoring Sites.
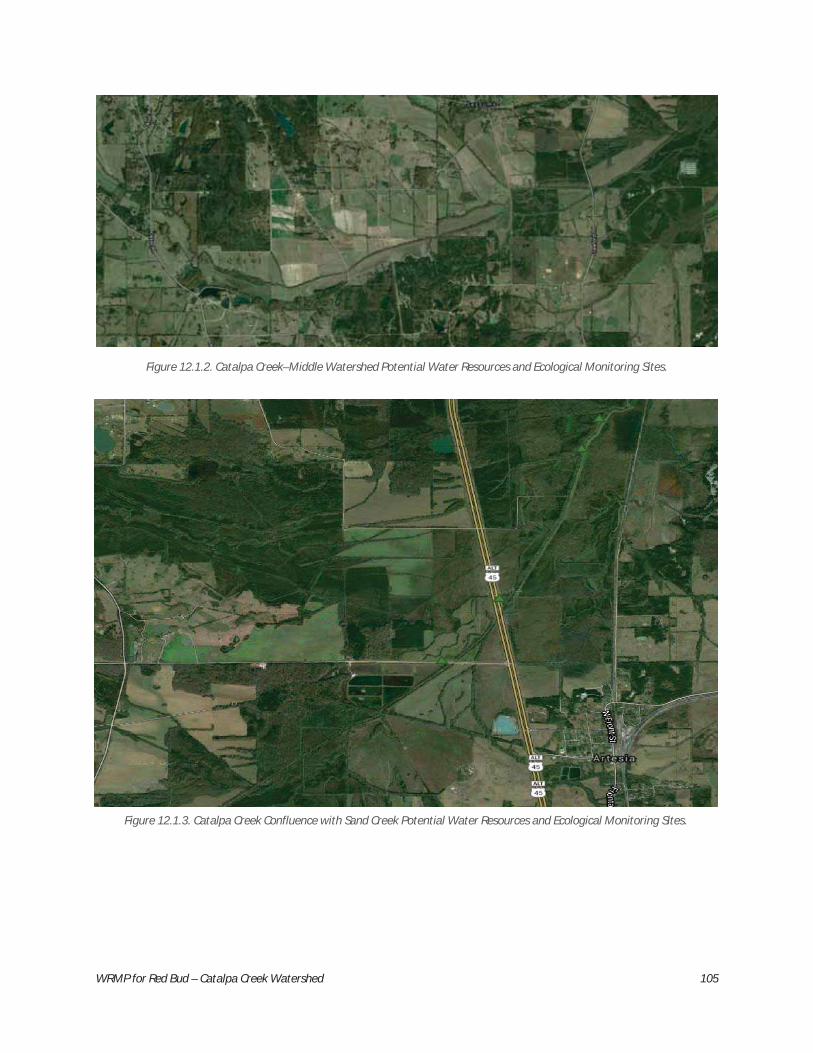
WRMP for Red Bud – Catalpa Creek Watershed 105
Figure 12.1.2. Catalpa Creek–Middle Watershed Potential Water Resources and Ecological Monitoring Sites.
Figure 12.1.3. Catalpa Creek Confluence with Sand Creek Potential Water Resources and Ecological Monitoring Sites.

WRMP for Red Bud – Catalpa Creek Watershed 106
112.2 HABITAT
The approach to monitor habitat conditions in the Catalpa Creek Watershed will leverage a variety of monitoring activities already in place by various MSU programs, as well as the creation of additional habitat monitoring activities. Current monitoring efforts include avian demographic research, watersnake ecology and water quality monitoring, breeding amphibian research, and pond turtle ecology. In addition to these activities, monitoring approaches will be developed to evaluate invasive species in the watershed as well as the habitat/ecosystem restoration projects facilitated as a result of this plan.
Management Indicator Species and Their Value in Determining Positive Outcomes. The presence, location, and quality of stream buffer habitat directly impacts the restoration of stream physical properties (Shields et al., 2006). In-stream monitoring programs described in this plan address water quality and water quantity concerns. The inclusion of habitat assessment and the role of habitat restoration on in-stream processes will also be explored. The planning and management of plant communities and the associated responses of avian, herpetofaunal, and insect indicator species will be monitored and used to adaptively manage the riparian communities in the watershed. For example, habitat provided by the Red Bud – Catalpa Creek watershed is ideally suited for species that are indicators for positive impacts of restoration efforts in the watershed. A variety of bird species, yellow-bellied watersnakes, breeding amphibians, pond turtle, and ant research programs on the MSU South Farm will contribute vital information regarding the success of restoration efforts and provide information for the adaptive management of upland and riparian projects throughout the watershed.
Avian Indicators. Collecting information on survival and recruitment for Eastern Bluebirds (Sialia sialis), E. Meadowlarks (Sturnella magna), E. Kingbirds (Tyrannus tyrannus), grassland Sparrows (Ammodramus spp.), Chickadees (Poecile spp.), Titmice (Baeolophus spp.), Loggerhead Shrike (Lanius ludovicianus), and American Kestrel (Falco tinnunculus) in the watershed provides information critical for determining causes of population changes and for identifying management actions and conservation strategies to reverse population declines for birds that make use of similar habitats. Several large-scale, long-term monitoring programs provide annual information on landbird populations. Although established programs such as the Breeding Bird Survey and Christmas Bird count provide information on species population trends, these programs fail to provide information on demographic parameters or vital rates of landbirds. Valuable information on demographic process and vital rates are missing for bird species within our geographic area.
A secondary benefit of establishing a banding and monitoring program for birds in close proximity to MSU is that it provides an educational opportunity for students. An integral part of the learning process for ecology and field studies is the ability to see and learn about ecological communities and community members. Access to these opportunities is

WRMP for Red Bud – Catalpa Creek Watershed 107
greatly facilitated by the use of non-harmful sampling employed at natural locations. Herein, students will be trained in proper banding techniques and the skills required in re-sighting color-banded birds.
Since 2014, students at Mississippi State University enrolled in the Department of Wildlife, Fisheries, & Aquaculture, as well as those involved in student organizations such as the Wildlife Society, have been involved in the development of a bluebird trail of nest boxes located within Mississippi State University’s South Farm property. Each spring students monitor bird activity at these boxes, noting productivity, survivorship and recruitment within the population. Through bird-banding, students can also track the survival and movements of birds among years and across the landscape. Morphological information collected from nestling birds and adults can also be tied to habitat change and resource availability. This data will provide a long-term monitoring platform by which to gauge landscape change, enhanced educational opportunities, and training for students through MSU classwork and individual-based projects.
Reptilian Indicator. Significant wetland area is lost in the United States each year (Dahl, 1990). Wetland loss can occur through direct conversion, or alteration of supporting processes. Wetlands where natural processes have been altered include many small streams that run through agricultural fields. Loss of hydrologic function and connectivity of emergent and/or adjacent habitats is commonplace within these agricultural lands. Many species endemic to these wetland systems are affected by these changes. The South Farm is a home for the yellow-belled watersnake (Nerodia erythrogaster flavigaster), a species which can help us to understand wetland ecosystems and management for many related species. Although common within southeastern stream systems, this species can be used as a model organism by which we can understand the impacts of wetland habitat connectivity and landscape configuration on other wetland endemic species. In this study, since 2014, students within the herpetology class offered through Mississippi State University’s Department of Wildlife, Fisheries, and Aquaculture have applied radio-telemetry to the yellow-bellied watersnake, tracking them through multiple seasons, corresponding with periods of flood and low water as a means of understanding this species' use of wetland boundary habitats.
Understanding habitat use is essential to conservation planning. Using surrogate species, or those whose presence reflects qualities of a larger taxonomic group, can provide information relevant to a spectrum of species without conducting similar research on each; yellow-bellied watersnake can be treated as this surrogate species. Yellow-bellied watersnake, although common in many southeastern stream habitats, are difficult to census and nearly impossible to follow over large distances. Advances in radio-telemetry have furthered our understanding of snake ecology, enabling us to gain observations of animal behavior during discrete time periods and relative to certain environmental events.

WRMP for Red Bud – Catalpa Creek Watershed 108
Since 2014, coupled with radio-telemetry, blood samples have been collected from snakes captured at Mississippi State University’s South Farm location, and elsewhere. Blood samples have been screened for parasites, providing a correlative link between trophic breadth, parasite burden, habitat structure and water quality. Information collected provides information on habitat management and efficacy towards wetland enhancement. Linking water quality to snake diet and parasite burden will afford time-integrated information by which to monitor linkages to habitat remediation, restoration and conservation.
Amphibian Indicators. Determining the presence of various frogs and toads as it relates to habitat remediation and restoration within the watershed provides another avenue to gauge ecosystem health. Anuran vocalization surveys are a common method for monitoring the occurrence of populations of amphibians (Nelson & Graves, 2004, Weir et al., 2005). Data collectors must be trained to properly identify the calls of various taxa and understand data collection techniques as well as species-habitat interactions. Such training can provide an exceptional pedagogical tool for teaching students about anuran ecology, while also collecting valuable information about what species exist within a particular landscape.
Since 2014, students enrolled in the Herpetology class offered through Mississippi State University’s Department of Wildlife, Fisheries, & Aquaculture have been conducting season amphibian call surveys within the Catalpa Creek Watershed. These surveys, conducted through three repeated visits each spring provide a means for monitoring change in species assemblage and calling phenology within the watershed. These studies provide a platform for monitoring changes in anuran assemblage and calling phenology relative to habitat remediation and restoration within the watershed. This program will also afford an educational tool by which to teach students proper survey techniques, experimental design and an appreciation of anuran and conservation ecology.
Pond Turtle Landscape and Trophic Indicators. Ponds afford a unique opportunity to explore ecosystem and population processes. Functional traits, such as diet and population attributes can mediate ecosystem processes within ponds (Polis et al., 1997). Aquatic ecosystems can also be linked to surrounding ecosystems by the movements of animals (Polis et al., 1997, Roe et al., 2009). Determining the degree to which organisms interact between different wetlands and the drivers of these interactions is fundamental to the assessment of ecological patterns, wetland conservation and ecosystem management (Roe & Georges, 2007).
In the ponds and lakes of the southeastern United States, the biomass, density and annual productivity of turtles can equal or exceed that of other vertebrates (Iverson, 1982, Congdon et al., 1986). Although turtles such as the slider (Trachemys scripta: hereafter, sliders) are considered omnivorous they can also switch to an herbivory or carnivory depending on the quality and quantity of resources available (Clark & Gibbons, 1969,

WRMP for Red Bud – Catalpa Creek Watershed 109
Aresco & James, 2005, Bouchard & Bjorndal, 2006); selecting specific habitats and diet to optimize physiological and reproductive gains (Parmenter, 1980, Hart, 1983). By selecting for specific habitats sliders can influence pond ecosystem function and the productivity of respective foodwebs (Lindsay, 2011).
The purpose of the pond turtle monitoring effort is to determine the differences in pond sliders in an aquaculture setting versus a natural system. Using mark-recapture, stable isotope analysis and immune response measures we can determine what pond sliders are eating in aquaculture ponds, how this may differ from more natural settings and whether ambient conditions are linked to immune response. We will also photograph each turtle for use in identifying individuals and addressing color pattern intensity relative to immune response.
This research will help elucidate patterns in landscape ecology and wetland connectivity. Collectively, this information will help extend our understanding of species physiologic and trophic relationships within aquaculture systems versus natural systems. Enhanced educational opportunity will also be provided to students through research opportunity and datasets that can be used by future classes at Mississippi State University (including Herpetology and Biometrics). Exemplary future projects can use established methods to explore slider movements and diet relative to season and the breeding status of individual turtles.
Insect Indicators. The survey of ants in the preserve is ongoing, and thus far has only been conducted in the southern unit of the Preserve. However, 30 species of ants have been documented in this small patch of forest so far (Table 12.2.1). The ant species inhabiting the preserve are typical of forested habitats in the region, but the level of species diversity present in a relatively small area demonstrates that even small patches of forest are capable of supporting a relatively diverse ant community. The ant community of the northern unit is expected to be more depauperate due to its smaller size, soil conditions, and the effects of cattle grazing on the understory.
Table 12.2.1. Ants (Hymenoptera: Formicidae) of the W.L. Giles Bur Oak Preserve (southern unit only).
Aphaenogaster carolinensis (Wheeler) Ponera pennsylvanica Buckley Aphaenogaster fulva Roger Prenolepis imparis (Say) Aphaenogaster lamellidens Mayr Proceratium pergandei (Emery) Camponotus chromaiodes Bolton Solenopsis invicta X richteri Camponotus decipiens Emery Solenopsis sp. cf. molesta (Say) Camponotus pennsylvanicus (DeGeer) Strumigenys clypeata Roger Camponotus snellingi Bolton Strumigenys louisianae Roger Crematogaster ashmeadi Mayr Strumigenys ohioensis Kennedy & Schramm Crematogaster lineolata (Say) Strumigenys ornata Mayr
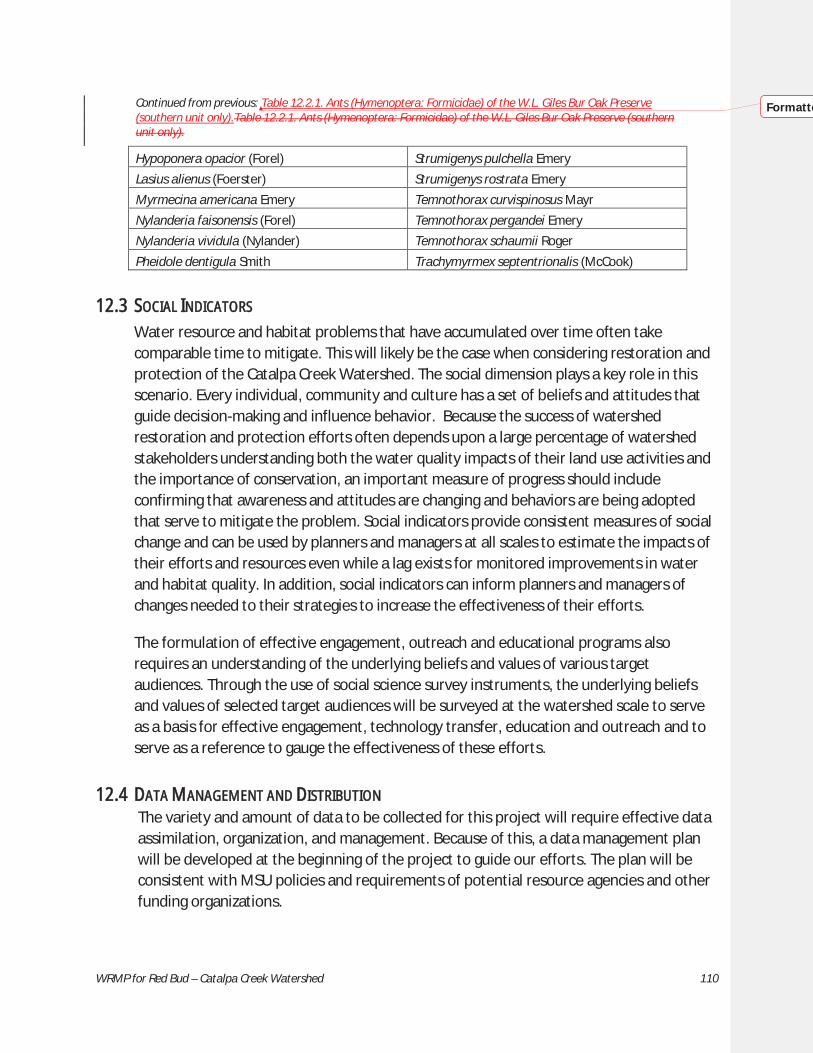
WRMP for Red Bud – Catalpa Creek Watershed 110
Continued from previous: Table 12.2.1. Ants (Hymenoptera: Formicidae) of the W.L. Giles Bur Oak Preserve (southern unit only).Table 12.2.1. Ants (Hymenoptera: Formicidae) of the W.L. Giles Bur Oak Preserve (southern unit only).
Hypoponera opacior (Forel) Strumigenys pulchella Emery Lasius alienus (Foerster) Strumigenys rostrata Emery Myrmecina americana Emery Temnothorax curvispinosus Mayr Nylanderia faisonensis (Forel) Temnothorax pergandei Emery Nylanderia vividula (Nylander) Temnothorax schaumii Roger Pheidole dentigula Smith Trachymyrmex septentrionalis (McCook)
112.3 SOCIAL INDICATORS
Water resource and habitat problems that have accumulated over time often take comparable time to mitigate. This will likely be the case when considering restoration and protection of the Catalpa Creek Watershed. The social dimension plays a key role in this scenario. Every individual, community and culture has a set of beliefs and attitudes that guide decision-making and influence behavior. Because the success of watershed restoration and protection efforts often depends upon a large percentage of watershed stakeholders understanding both the water quality impacts of their land use activities and the importance of conservation, an important measure of progress should include confirming that awareness and attitudes are changing and behaviors are being adopted that serve to mitigate the problem. Social indicators provide consistent measures of social change and can be used by planners and managers at all scales to estimate the impacts of their efforts and resources even while a lag exists for monitored improvements in water and habitat quality. In addition, social indicators can inform planners and managers of changes needed to their strategies to increase the effectiveness of their efforts.
The formulation of effective engagement, outreach and educational programs also requires an understanding of the underlying beliefs and values of various target audiences. Through the use of social science survey instruments, the underlying beliefs and values of selected target audiences will be surveyed at the watershed scale to serve as a basis for effective engagement, technology transfer, education and outreach and to serve as a reference to gauge the effectiveness of these efforts.
12.4 DATA MANAGEMENT AND DISTRIBUTION The variety and amount of data to be collected for this project will require effective data assimilation, organization, and management. Because of this, a data management plan will be developed at the beginning of the project to guide our efforts. The plan will be consistent with MSU policies and requirements of potential resource agencies and other funding organizations.
Formatte
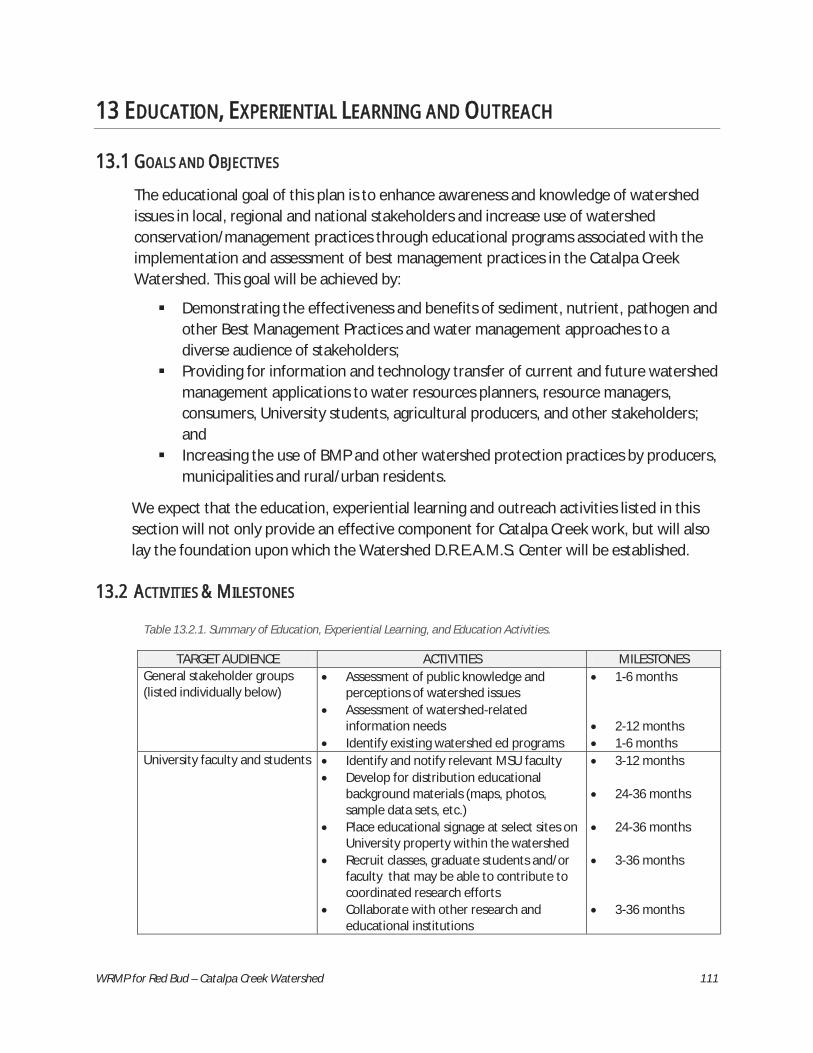
WRMP for Red Bud – Catalpa Creek Watershed 111
113 EDUCATION, EXPERIENTIAL LEARNING AND OUTREACH
13.1 GOALS AND OBJECTIVES
The educational goal of this plan is to enhance awareness and knowledge of watershed issues in local, regional and national stakeholders and increase use of watershed conservation/management practices through educational programs associated with the implementation and assessment of best management practices in the Catalpa Creek Watershed. This goal will be achieved by:
Demonstrating the effectiveness and benefits of sediment, nutrient, pathogen and other Best Management Practices and water management approaches to a diverse audience of stakeholders;
Providing for information and technology transfer of current and future watershed management applications to water resources planners, resource managers, consumers, University students, agricultural producers, and other stakeholders; and
Increasing the use of BMP and other watershed protection practices by producers, municipalities and rural/urban residents.
We expect that the education, experiential learning and outreach activities listed in this section will not only provide an effective component for Catalpa Creek work, but will also lay the foundation upon which the Watershed D.R.E.A.M.S. Center will be established.
13.2 ACTIVITIES & MILESTONES
Table 13.2.1. Summary of Education, Experiential Learning, and Education Activities.
TARGET AUDIENCE ACTIVITIES MILESTONES General stakeholder groups (listed individually below)
Assessment of public knowledge and perceptions of watershed issues
Assessment of watershed-related information needs
Identify existing watershed ed programs
1-6 months
2-12 months 1-6 months
University faculty and students Identify and notify relevant MSU faculty Develop for distribution educational
background materials (maps, photos, sample data sets, etc.)
Place educational signage at select sites on University property within the watershed
Recruit classes, graduate students and/or faculty that may be able to contribute to coordinated research efforts
Collaborate with other research and educational institutions
3-12 months
24-36 months 24-36 months
3-36 months
3-36 months
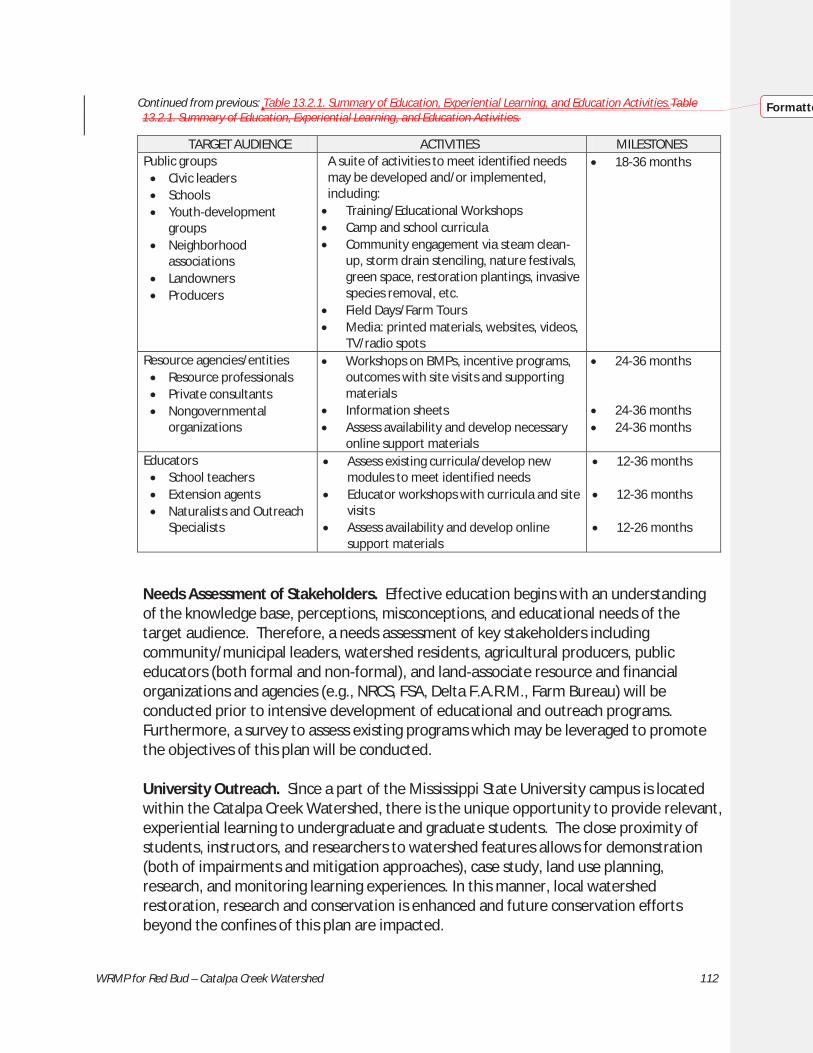
WRMP for Red Bud – Catalpa Creek Watershed 112
Continued from previous: Table 13.2.1. Summary of Education, Experiential Learning, and Education Activities.Table 13.2.1. Summary of Education, Experiential Learning, and Education Activities.
TARGET AUDIENCE ACTIVITIES MILESTONES Public groups
Civic leaders Schools Youth-development
groups Neighborhood
associations Landowners Producers
A suite of activities to meet identified needs may be developed and/or implemented, including: Training/Educational Workshops Camp and school curricula Community engagement via steam clean-
up, storm drain stenciling, nature festivals, green space, restoration plantings, invasive species removal, etc.
Field Days/Farm Tours Media: printed materials, websites, videos,
TV/radio spots
18-36 months
Resource agencies/entities Resource professionals Private consultants Nongovernmental
organizations
Workshops on BMPs, incentive programs, outcomes with site visits and supporting materials
Information sheets Assess availability and develop necessary
online support materials
24-36 months 24-36 months 24-36 months
Educators School teachers Extension agents Naturalists and Outreach
Specialists
Assess existing curricula/develop new modules to meet identified needs
Educator workshops with curricula and site visits
Assess availability and develop online support materials
12-36 months 12-36 months
12-26 months
Needs Assessment of Stakeholders. Effective education begins with an understanding of the knowledge base, perceptions, misconceptions, and educational needs of the target audience. Therefore, a needs assessment of key stakeholders including community/municipal leaders, watershed residents, agricultural producers, public educators (both formal and non-formal), and land-associate resource and financial organizations and agencies (e.g., NRCS, FSA, Delta F.A.R.M., Farm Bureau) will be conducted prior to intensive development of educational and outreach programs. Furthermore, a survey to assess existing programs which may be leveraged to promote the objectives of this plan will be conducted. University Outreach. Since a part of the Mississippi State University campus is located within the Catalpa Creek Watershed, there is the unique opportunity to provide relevant, experiential learning to undergraduate and graduate students. The close proximity of students, instructors, and researchers to watershed features allows for demonstration (both of impairments and mitigation approaches), case study, land use planning, research, and monitoring learning experiences. In this manner, local watershed restoration, research and conservation is enhanced and future conservation efforts beyond the confines of this plan are impacted.
Formatte

WRMP for Red Bud – Catalpa Creek Watershed 113
As a land grant university with Carnegie Foundation Designations of both Very High Research Activity and Community Engagement, Mississippi State University has a long history of collaboration with other educational institutions from across the U.S. and world. Implementation of plan activities will result in development of a model site highlighting the benefits of watershed research and protection, community engagement and environmental stewardship. Outreach to institutions may promote collaborative partnerships and replication at other locations, resulting in further watershed protection, citizen engagement, and research benefits.
Public Outreach. The public stakeholder group is a large and diverse target audience comprised of civic leaders, neighborhood associations, youth groups, community organizations, landowners, and producers. Consequently, a diverse portfolio of education and outreach approaches will be incorporated and developed to meet their needs, as informed by the stakeholder survey. Selected activities will be designed to increase awareness and knowledge of watershed and water quality issues, mitigation approaches, socioeconomic and environmental benefits, and sustainability practices.
Outreach to Educators. Although there are positive gains to be made through outreach to individuals and small groups, employing a “train the trainer” model is decidedly more efficient. Therefore, outreach to those with education responsibilities will be a key component of implementation of the outreach and education efforts associated with the Catalpa Creek Watershed Plan. Teachers in public and private schools, youth development (e.g., 4-H and FFA) leaders, and natural resources educators are tasked with improving learner knowledge; this is often best accomplished by showing real-world relevance of the content to the learner. Curricula and educational activities centered on watershed stewardship provide an excellent opportunity to satisfy multi-faceted, educational objectives. Outreach to Conservation Organizations and Land Managers. Natural resources agencies and entities such as the Natural Resources Conservation Service, Soil and Water Conservation Districts, Farm Service Agency, Farm Bureau, and Department of Environmental Quality interface with public and private land owners on a variety of topics related to natural resource use. Providing current, research-based information on best management practices, incentive programs, and benefits of sound environmental stewardship improves and enhances adoption and implementation.
113.3 PARTICIPANTS & AFFILIATIONS Table 13.3.1. Education, Experiential Learning, and Outreach Participants and Affiliations.
NAME DEPARTMENT/AFFILIATION Dr. Leslie Burger (Lead) Wildlife, Fisheries and Aquaculture/Extension Service, MSU Dr. Beth Baker Wildlife, Fisheries and Aquaculture/Forest and Wildlife Research Center, MSU
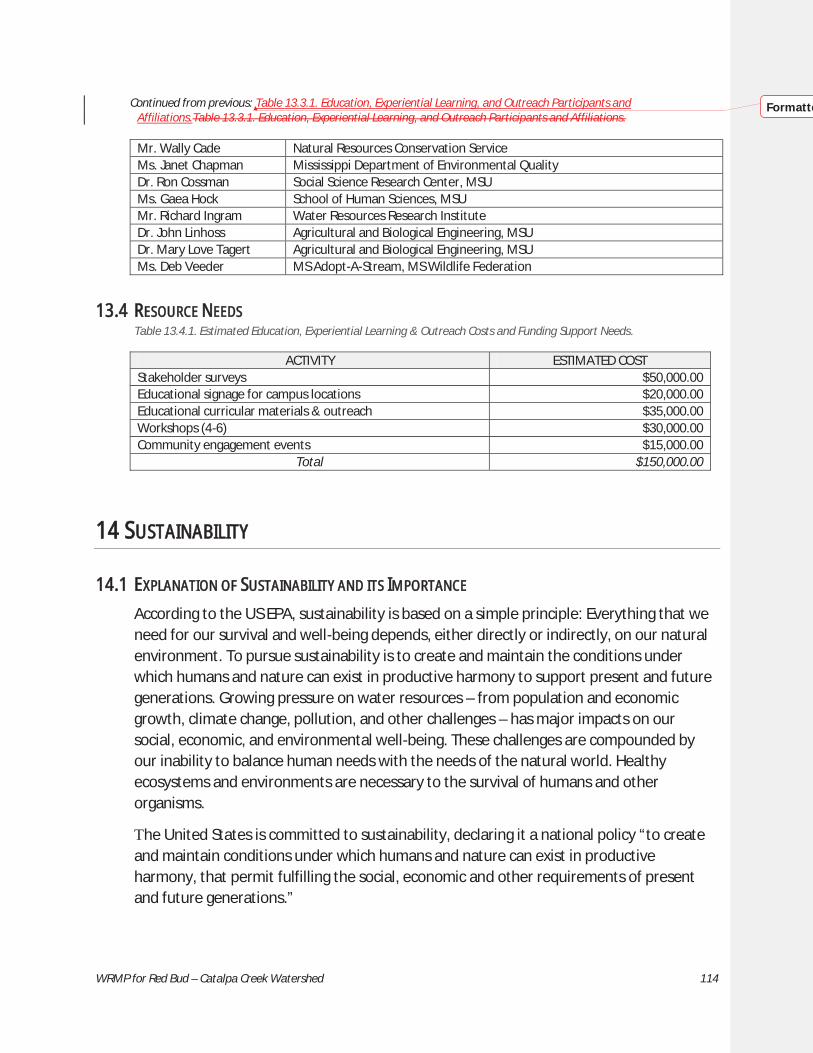
WRMP for Red Bud – Catalpa Creek Watershed 114
Continued from previous: Table 13.3.1. Education, Experiential Learning, and Outreach Participants and Affiliations.Table 13.3.1. Education, Experiential Learning, and Outreach Participants and Affiliations. Mr. Wally Cade Natural Resources Conservation Service Ms. Janet Chapman Mississippi Department of Environmental Quality Dr. Ron Cossman Social Science Research Center, MSU Ms. Gaea Hock School of Human Sciences, MSU Mr. Richard Ingram Water Resources Research Institute Dr. John Linhoss Agricultural and Biological Engineering, MSU Dr. Mary Love Tagert Agricultural and Biological Engineering, MSU Ms. Deb Veeder MS Adopt-A-Stream, MS Wildlife Federation
113.4 RESOURCE NEEDS Table 13.4.1. Estimated Education, Experiential Learning & Outreach Costs and Funding Support Needs.
ACTIVITY ESTIMATED COST Stakeholder surveys $50,000.00 Educational signage for campus locations $20,000.00 Educational curricular materials & outreach $35,000.00 Workshops (4-6) $30,000.00 Community engagement events $15,000.00
Total $150,000.00
14 SUSTAINABILITY
14.1 EXPLANATION OF SUSTAINABILITY AND ITS IMPORTANCE
According to the US EPA, sustainability is based on a simple principle: Everything that we need for our survival and well-being depends, either directly or indirectly, on our natural environment. To pursue sustainability is to create and maintain the conditions under which humans and nature can exist in productive harmony to support present and future generations. Growing pressure on water resources – from population and economic growth, climate change, pollution, and other challenges – has major impacts on our social, economic, and environmental well-being. These challenges are compounded by our inability to balance human needs with the needs of the natural world. Healthy ecosystems and environments are necessary to the survival of humans and other organisms.
The United States is committed to sustainability, declaring it a national policy “to create and maintain conditions under which humans and nature can exist in productive harmony, that permit fulfilling the social, economic and other requirements of present and future generations.”
Formatte

WRMP for Red Bud – Catalpa Creek Watershed 115
114.2 ADDRESSING SUSTAINABILITY
Sustainable watershed management integrates ecologic, economic, and social applications that restore and protect habitat/ecosystem health, water quality, and water quantity through effective land management. This is most often accomplished through the development and implementation of watershed-scale plans and projects designed to sustain and enhance watershed functions that affect the plant, animal, and human communities within a watershed.
This Catalpa Creek Watershed Restoration and Protection Project is designed to achieve sustainability – in terms of habitat/ecosystem health, water quality, water quantity, and the continuance of concerted, collaborative efforts to involve watershed stakeholders in the restoration and protection activities as well as to attain the resources necessary for the sustenance of the project. This will be addressed in various ways that are discussed below.
Sustainability Index Concept. What happens when the money runs out? In Mississippi, as in other states whose watershed management programs are dependent upon 319 NPS funding, this is a challenging and perplexing issue. In its infancy, Mississippi’s Basin Management Approach conceptualized using 319 NPS funding as “seed money” to attract other investment. This has been successful in some respects, such as the significant amount of leveraging with NRCS programs and other resources to implement Mississippi’s Nutrient Reduction Strategies. However, because of the need for 319 funding support across the state, the limits on the length of its use for specific projects, and reliance on it as a leveraging tool, most often when 319-funded components of watershed-based projects are completed, the projects largely fade away if the funding is not renewed. Also, because 319 NPS funding has been used primarily for restoration, once the water quality of a watershed is restored, funding to support follow-up protection efforts as well as for protection of watersheds exhibiting good quality presents a dilemma that has not yet been solved.
The Mississippi Water Resources Research Institute (MWRRI) and the Social Sciences Research Center (SSRC), both housed at MSU, have developed a concept to develop a Sustainability Index (SI) that would have local and statewide utility in supporting watershed-based restoration and protection projects. Through scientifically-developed survey methods, scalable surveys could be collaboratively developed with MDEQ and implemented by SSRC to address key sustainability issues and identify and rank potential local support for implementation of a watershed-based restoration and/or protection effort. Additionally, mining of available information sources (e.g., enHance) will yield beneficial information. Some of the key components/issues regarding sustainability at the local watershed level could be addressed through responses to the following survey questions that would be integrated into the survey to understand stakeholder behaviors, perceptions, and beliefs (previously discussed).

WRMP for Red Bud – Catalpa Creek Watershed 116

WRMP for Red Bud – Catalpa Creek Watershed 117
Who are the potential local champions? Who are the influencers? Who can provide local support? What type of support? What businesses and local
organizations could benefit from providing support? What types of benefits? Who is already engaged in supporting environmental protection activities? What
type of support are they providing? What incentives exist for local stakeholder and business support? What incentives
could be developed to foster local stakeholder and business support for a watershed-based project?
How can you keep local champions and business support “fresh” and engaged? What is the best way to inform and engage potential partners? How do they get
their information?
These and other questions will require analysis as well as development of a recruitment strategy. In some cases, follow-up interviews could be arranged and conducted.
At the state level, this approach could be used to identify and rank watersheds through development of a sustainability index which could be integrated into a statewide prioritization framework. The index could be scalable, from ranking sustainability at the state wide, basin wide, or watershed wide scale. Also, the index would help with determining the likelihood of business support and incentives for sustained support at a local watershed level. Social indicators can assess the effectiveness of the index and show where modifications may be necessary.
Neighborhood Water Watch/Watershed Sentinels. Under consideration for this project is the establishment of a neighborhood water watch/watershed sentinel program built upon the concept of the Chattahoochee Riverkeeper (GA) Neighborhood Water Watch. It is designed to engage and educate the watershed community while working to eliminate bacteria pollution in the Chattahoochee River, a public health concern. The effort focuses on inexpensive volunteer bacteria monitoring by local watershed stakeholders. The program has five goals.
1. Increase public awareness of water quality issues and local waterway conditions.
2. Provide citizen groups with tools and training to protect their local waterways. 3. Collect quality baseline data. 4. Form new partnerships between citizen groups, non-profit organizations and
government agencies. 5. Address and resolve poor water quality detected during monitoring.
The Catalpa Creek Watershed also has bacteria/pathogens concerns and monitoring needs. Such a program could enhance stakeholder participation and create experiential learning activities.
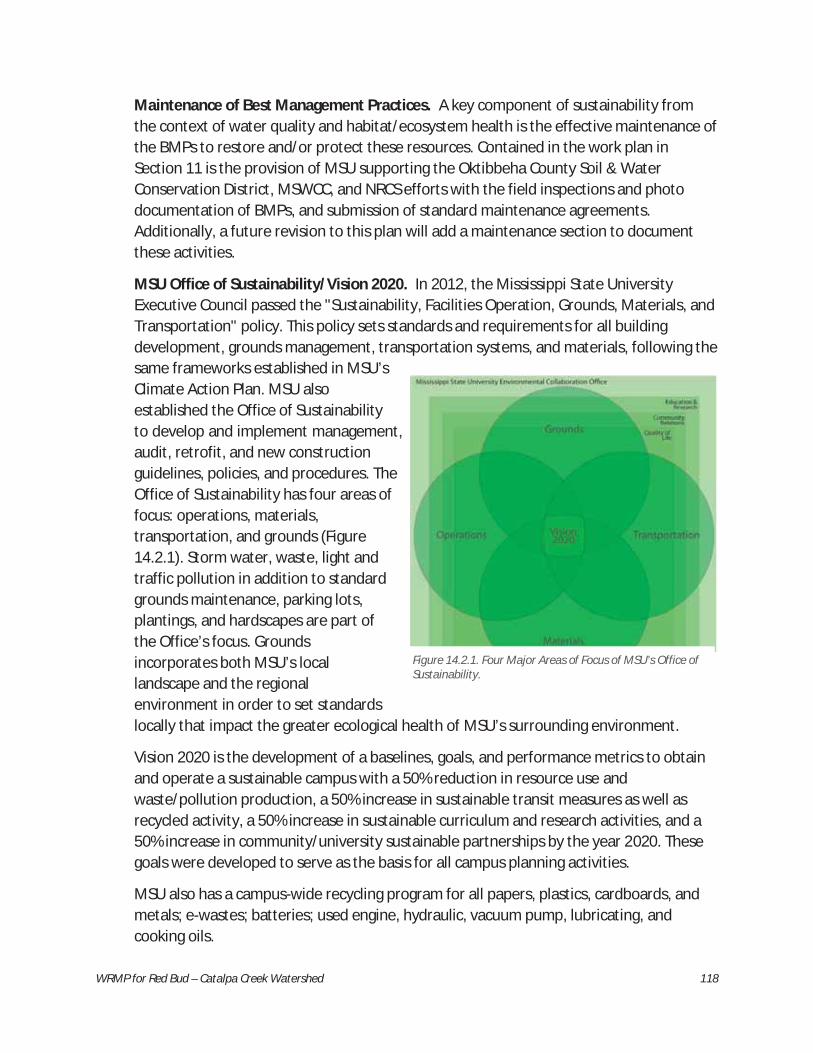
WRMP for Red Bud – Catalpa Creek Watershed 118
Maintenance of Best Management Practices. A key component of sustainability from the context of water quality and habitat/ecosystem health is the effective maintenance of the BMPs to restore and/or protect these resources. Contained in the work plan in Section 11 is the provision of MSU supporting the Oktibbeha County Soil & Water Conservation District, MSWCC, and NRCS efforts with the field inspections and photo documentation of BMPs, and submission of standard maintenance agreements. Additionally, a future revision to this plan will add a maintenance section to document these activities.
MSU Office of Sustainability/Vision 2020. In 2012, the Mississippi State University Executive Council passed the "Sustainability, Facilities Operation, Grounds, Materials, and Transportation" policy. This policy sets standards and requirements for all building development, grounds management, transportation systems, and materials, following the same frameworks established in MSU’s Climate Action Plan. MSU also established the Office of Sustainability to develop and implement management, audit, retrofit, and new construction guidelines, policies, and procedures. The Office of Sustainability has four areas of focus: operations, materials, transportation, and grounds (Figure 14.2.1). Storm water, waste, light and traffic pollution in addition to standard grounds maintenance, parking lots, plantings, and hardscapes are part of the Office’s focus. Grounds incorporates both MSU’s local landscape and the regional environment in order to set standards locally that impact the greater ecological health of MSU’s surrounding environment.
Vision 2020 is the development of a baselines, goals, and performance metrics to obtain and operate a sustainable campus with a 50% reduction in resource use and waste/pollution production, a 50% increase in sustainable transit measures as well as recycled activity, a 50% increase in sustainable curriculum and research activities, and a 50% increase in community/university sustainable partnerships by the year 2020. These goals were developed to serve as the basis for all campus planning activities.
MSU also has a campus-wide recycling program for all papers, plastics, cardboards, and metals; e-wastes; batteries; used engine, hydraulic, vacuum pump, lubricating, and cooking oils.
gure 14.3 Four Major Areas of Focus of MSU’s Office of Sustainability
Figure 14.2.1. Four Major Areas of Focus of MSU’s Office of Sustainability.

WRMP for Red Bud – Catalpa Creek Watershed 119
Watershed D.R.E.A.M.S. Center. Perhaps the greatest opportunities to foster sustainable watershed management within the Catalpa Creek Watershed as well as the state and regional levels is the establishment of the Catalpa & Sand Creek Watershed D.R.E.A.M.S. (Demonstration, Research, Education, Application, Management and Sustainability) Center. This project is described in Section 15.
115 CATALPA & SAND CREEK WATERSHED D.R.E.A.M.S. (DEMONSTRATION, RESEARCH, EDUCATION, APPLICATION, MANAGEMENT AND
SUSTAINABILITY) CENTER
15.1 VISION During the January 13, 2015, exercise by the Catalpa Creek Project Steering Team not only developed a vision for the restoration and protection project, but also a vision for a watershed-based management demonstration learning center. This center, now referred by its acronym D.R.E.A.M.S. (for Demonstration, Research, Education, Application, Management and Sustainability) Center will serve as a showcase for watershed management in the State and Southeast through the watershed-based best management practices in the Catalpa Creek Watershed. This facility will be useful to state and federal agencies, water management districts, stakeholder and community service organizations, university departments and programs, secondary education teachers and students, local governments, and others. Beyond complementing the Catalpa Creek Watershed Restoration & Protection Project, the Center will focus generally on water resources, watersheds, and the ecosystem services they provide in a hands-on interactive way. The goals of the center are to:
Demonstrate a landscape approach to watershed management; Demonstrate the implementation of Mississippi’s Uplands Nutrient Reduction
Strategic Plan; Demonstrate the implementation of a watershed-based pathogen reduction strategy; Demonstrate the effectiveness of innovative and established sediment, nutrient,
pathogen and other Best Management Practices (BMPs); Advance research of innovative concepts and applications that address water
resources and watershed management; Provide for technology transfer of applications developed by MSU researchers to
water resources planners, managers, water users, and other stakeholders; Educate water resource and watershed planners, managers, policy-makers, and other
stakeholders about important watershed concepts; and Demonstrate MSU’s capacity to effectively address a wide range of water resources
and watershed issues occurring throughout the state and region.

WRMP for Red Bud – Catalpa Creek Watershed 120
After completion of this Water Resources Management Plan for the Catalpa Creek Watershed and the beginning of implementation activities, a companion effort will be initiated to develop a Water Resources Management Plan for the adjacent Sand Creek Watershed which hosts MSU’s North Farm. Both watersheds and watershed restoration and protection plans will be leveraged with existing and planned MSU assets, such as Project W.E.T., the H.H. Leveck Animal Research Center, R.R. Foil Plant Science Research Center, and Union Green to establish MSU’s Watershed D.R.E.A.M.S. Center.
115.2 CATALPA CREEK WATERSHED: A LANDSCAPE APPROACH Watersheds are rarely managed for just one purpose, such as erosion control or TMDL implementation. Instead, research increasingly shows that watersheds serve many important functions and should be managed in a holistic fashion, including environmental, social and economic terms (Turner & Daily, 2008). Watersheds provide, free of charge, many ecosystem services that would cost a community considerably if engineered separately: cleaning drinking water, filtering pollutants, cleaning air, serving as habitat for fisheries and other wildlife, cycling nutrients, mitigating temperatures, and recreation. Healthy watersheds are also a cost-effective system for managing storm water by preventing flooding, depositing sediments, treating runoff, and buffering nutrients (Dlugolecki, 2012).
Because of increasing development at Mississippi State University and in the greater Starkville community, it is important that efforts are made now to restore and protect the watersheds, by using smart growth practices and implementing low impact development practices that reduce watershed stress in the face of economic development. Numerous benefits result from sound ecological design—using natural systems patterns and processes. Creating healthy watersheds in this way has been demonstrated to improve hydrology, water chemistry, hydromorphology, plant and animal biota, and overall ecosystem services (Buijse, 2014).
A Case Study: PROJECT W.E.T., Dept. of Landscape Architecture, Mississippi State University. There is already an approved project on the Mississippi State University campus for using ecological design for the establishment and management of a watershed system. PROJECT W.E.T. (Wetland Education Theater) will be located at the intersection of Bully and Stone Boulevards (Figure 15.2.1). This 3-acre wetland education area designed will teach the public and the Mississippi State University community the values of wetland systems.
Project W.E.T. is a collaborative effort between the College of Forest Resources and the Department of Landscape Architecture at Mississippi State University. Over 20 faculty and staff from 10 different departments contributed their expertise to the plan. Located on open land east of Landscape Architecture and north of Thompson Hall, this effort endeavors to develop functional wetland ecosystems and associated upland

WRMP for Red Bud – Catalpa Creek Watershed 121
communities in the heart of MSU's campus. Connected by a flowing, serpentine walk and bridge network, numerous covered structures will dot the site, providing highly-visible, interpretive displays for visitors. It is anticipated that Project W.E.T. will break ground in 2016.
Figure 15.2.1. Project W.E.T. Location on the MSU Campus.
Figure 15.2.2. Habitat Plan for Project W.E.T., Mississippi State University campus.

WRMP for Red Bud – Catalpa Creek Watershed 122
The main designer and landscape architect for Project W.E.T., Robert Poore, PLA, of Native Habitats, Inc. in Flora, Mississippi used an ecological design process to inform the design and management for the new exhibit (Figure 15.2.2, Figure 15.2.3, Figure 15.2.4). His visits to small, local wetland systems at the Sam Hamilton Noxubee National Wildlife Refuge and Tombigbee National Forest provided the precedence for the exhibit’s habitats, hydrology, and interpretive elements. Researchers analyzed the exhibit site’s elevation, soils, aspect, and drainage. Analogues in the natural wetland communities were then selected for exhibit inspiration and wetland function. With this approach, it is anticipated that visitors will develop a deeper understanding of wetlands by seeing their structure and function and learning the components necessary for a healthy wetland.
Figure 15.2.3. Project W.E.T. master plan.

WRMP for Red Bud – Catalpa Creek Watershed 123
Figure 15.2.4. Site Perspective of Project W.E.T.
Using a similar ecological design process, planners can efficiently design and implement the Catalpa Creek Watershed Plan. Analogues found in area wetlands can help us understand hydrological, ecological, and environmental attributes needed the mitigation areas. By analyzing the soils, hydrology, plant communities, and physical attributes of local, natural sites, planners can provide ecological modules to guide the design/redevelopment of Catalpa Creek’s critical management zones.
115.3 H.H. LEVECK ANIMAL RESEARCH CENTER (SOUTH FARM) The eastern portion of MSU’s campus and its Leveck Animal Research Center are located in the headwaters of the Catalpa Creek Watershed. This presents numerous leveraging opportunities for the watershed project and the Watershed D.R.E.A.M.S. Center. The 1,110+ acre H. H. Leveck Animal Research Center, commonly referred to as “South Farm,” provides a very important land resource which supports departmental teaching and various research activities associated with Animal Science curriculum (Figure 15.3.1). The center is dedicated to livestock and forage production research, and is also used for research on innovative best management practices designed to mitigate pollution from livestock operations. It provides the students of Animal and Dairy Sciences contact with modern techniques in animal agriculture as well as the opportunity for practical work experience. These experiments give the students insight into many technical challenges associated with the animal production industry.
The largest percentage of acres on the center are dedicated to beef research and support of the base beef cattle herds. The second largest area on the center is the horse unit. The research and breeding program continues to grow along with the equine industry in the state. The South Farm aquaculture research facility, is an 18-acre on-campus aquaculture facility that provides opportunities to faculty, graduate students and undergraduates to conduct aquaculture related research. South Farm has close collaborative ties with the

WRMP for Red Bud – Catalpa Creek Watershed 124
USDA-APHIS wildlife services unit as well as the Hill County Initiative through the USDA-ARS. The South Farm also hosts NRCS’ Grazing Lands Conservation Initiative demonstration area, the Poultry Science Research Unit, a bird facility, and an observatory maintained and used by the Physics Department.
The Research Support Staff on the South Farm is responsible for land, labor, and equipment to aid research scientists in implementing their research projects. They are also responsible for forage production grounds, water lines, perimeter fences and exteriors of buildings.
Figure 15.3.1. MSU South Farm.
115.4 R.R. FOIL PLANT SCIENCE RESEARCH CENTER The R. R. Foil Plant Science Research Center, known by many as North Farm, is comprised of approximately 750 acres. This facility includes 550 acres of tillable land for a variety of research projects in a diverse agricultural community. Some examples include: cotton, soybeans, corn, sweet potatoes, grain sorghum, peanuts and many others. Along with tillable acreage, research is performed with turf, ornamentals and aquatic weeds/plants.
This facility furnishes the research scientists with necessary greenhouse environments, laboratory needs and a variety of storage areas. The research support staff on this station is responsible for land assignments, labor, and equipment to aid researchers in implementing their various protocols along with maintaining overall aesthetics of the entire facility.

WRMP for Red Bud – Catalpa Creek Watershed 125
115.5 UNION GREEN DESIGN Union Green is an award-winning site design to be used as a model for current green infrastructure practices, displaying bio-retention cells, cisterns, pervious pavement, and a unique water conveyance system to efficiently and effectively manage storm water runoff. The initial design plan centered on the 1.3 acre Union Green in the heart of campus, however, the project is now planned for a site near Project W.E.T. To create a multi-functional space, the team proposed a three-phase design. The first phase adds a 1,000 gallon above-ground cistern, an aqueduct, and bioretention to the west side of the site. The elevated aqueduct would provide visual water conveyance and irrigation, and educate passersby about storm water management. The design would manage the 95th percentile storm, and would reduce peak flows for the 2-year 24-hour storm below the pre-development condition. This would reduce excessive flows downstream for all but the most severe storm events.
16 RESOURCE NEEDS, PROCUREMENT, AND LEVERAGING Ultimately, the availability of resources will be the biggest factor in determining the success and sustainability of this project. Hence, a concerted effort is being made to identify and solicit funding sources, recruit watershed stakeholder “champions,” and encourage local business support.
16.1 RESOURCE NEEDS Previously in this management plan, restoration, protection, education, monitoring, and other activities have been identified and the resource needs to implement these activities have been estimated. These estimates represent an early “best guess” approach, based upon the best professional judgment of local conservationists. Using this approach, it is anticipated that at a minimum three-to-four years of implementation activities are needed to restore the water quality and habitat/ecosystem health of the watershed. This will be confirmed by monitoring activities. It is reasonable to assume that additional restoration activities will be needed. Near-term activities will be to conduct baseline monitoring, and prioritize sites in the headwaters and broad watershed for restoration. Modeling may be used to inform BMP placement and guide expectations. Following restoration, implementation of protection activities will be needed to sustain the progress made in restoring the water quality and habitat/ecosystem health of the watershed. These resource needs previously specified are compiled in Table 16.2.1.

WRMP for Red Bud – Catalpa Creek Watershed 126
Table 16.1 Estimated Current Resource Needs
A. Water Quality and Habitat/Ecosystem Restoration Annual Resource Needs for 2016-2018 – Headwaters and Broad Watershed
Resource Concern Estimated Annual Cost Estimated Three Year Cost Water Quality – Sedimentation $74,917.58 $224,752.74 Grazing Lands $84,824.26 $254,472.78 Sustainable Forestry $56,979.69 $170,939.07 Declining Wildlife Habitats $14,398.24 $43,194.72 Administrative Costs $5,000.00 $15,000
Total $236,119.77 $708,359.31 B. Current Education, Experiential Learning, and Outreach Needs
Activity Estimated Cost Stakeholder surveys $50,000.00 Educational signage for campus locations $20,000.00 Educational curricular materials & outreach $35,000.00 Workshops (4-6) $30,000.00 Community engagement events $15,000.00
Total $150,000.00 C. Current Monitoring and Assessment Needs
Activity Estimated Cost Development of geospatial dataset covering the watershed; collection of data at the catchment level for baseline physical parameters and monitoring of surface water runoff quality and quantity
$25,000.00
BMP monitoring (post-implementation) $25,000.00 Total $50,000.00
D. Modeling Needs Activity Estimated Cost
Integrated watershed and channel modeling of Catalpa Creek and tributaries $40,000.00 Forecasting the Effectiveness of BMPs $25,000.00
Total $65,000.00 E. Current Other Needs
Activity Estimated Cost Project Facilitation and Management $30,000.00
Total $30,000.00 Total Resource Needs $1,003,359.00
Subsequent revisions to this plan will add new activities and the resource needs associated with each.
116.2 RESOURCE IDENTIFICATION/DISCOVERY, SOLICITATION, AND PROCUREMENT
A concerted, ongoing effort will address the plan’s resource needs. The effort will involve members of the Steering Team and the Funding and Incentives Team. Traditional and nontraditional resources will be identified and pursued. The general process to be followed is listed below.
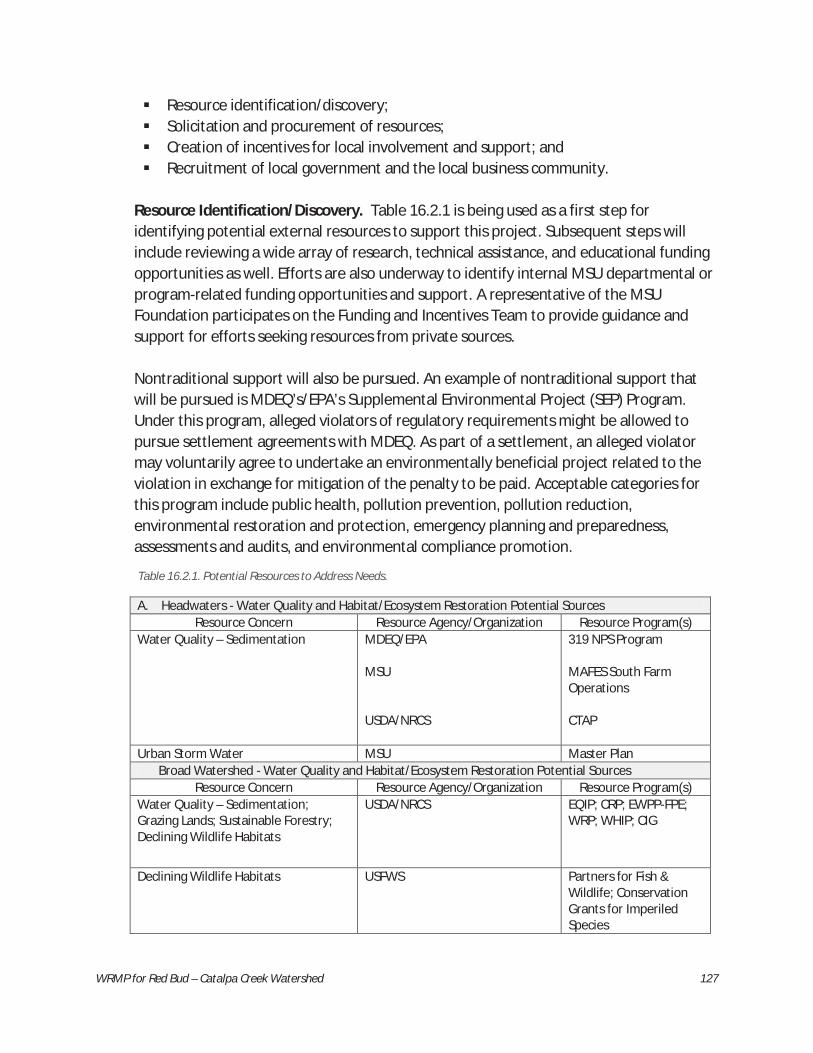
WRMP for Red Bud – Catalpa Creek Watershed 127
Resource identification/discovery; Solicitation and procurement of resources; Creation of incentives for local involvement and support; and Recruitment of local government and the local business community.
Resource Identification/Discovery. Table 16.2.1 is being used as a first step for identifying potential external resources to support this project. Subsequent steps will include reviewing a wide array of research, technical assistance, and educational funding opportunities as well. Efforts are also underway to identify internal MSU departmental or program-related funding opportunities and support. A representative of the MSU Foundation participates on the Funding and Incentives Team to provide guidance and support for efforts seeking resources from private sources. Nontraditional support will also be pursued. An example of nontraditional support that will be pursued is MDEQ’s/EPA’s Supplemental Environmental Project (SEP) Program. Under this program, alleged violators of regulatory requirements might be allowed to pursue settlement agreements with MDEQ. As part of a settlement, an alleged violator may voluntarily agree to undertake an environmentally beneficial project related to the violation in exchange for mitigation of the penalty to be paid. Acceptable categories for this program include public health, pollution prevention, pollution reduction, environmental restoration and protection, emergency planning and preparedness, assessments and audits, and environmental compliance promotion.
Table 16.2.1. Potential Resources to Address Needs.
A. Headwaters - Water Quality and Habitat/Ecosystem Restoration Potential Sources Resource Concern Resource Agency/Organization Resource Program(s)
Water Quality – Sedimentation MDEQ/EPA MSU USDA/NRCS
319 NPS Program MAFES South Farm Operations CTAP
Urban Storm Water MSU Master Plan Broad Watershed - Water Quality and Habitat/Ecosystem Restoration Potential Sources
Resource Concern Resource Agency/Organization Resource Program(s) Water Quality – Sedimentation; Grazing Lands; Sustainable Forestry; Declining Wildlife Habitats
USDA/NRCS EQIP; CRP; EWPP-FPE; WRP; WHIP; CIG
Declining Wildlife Habitats USFWS Partners for Fish & Wildlife; Conservation Grants for Imperiled Species
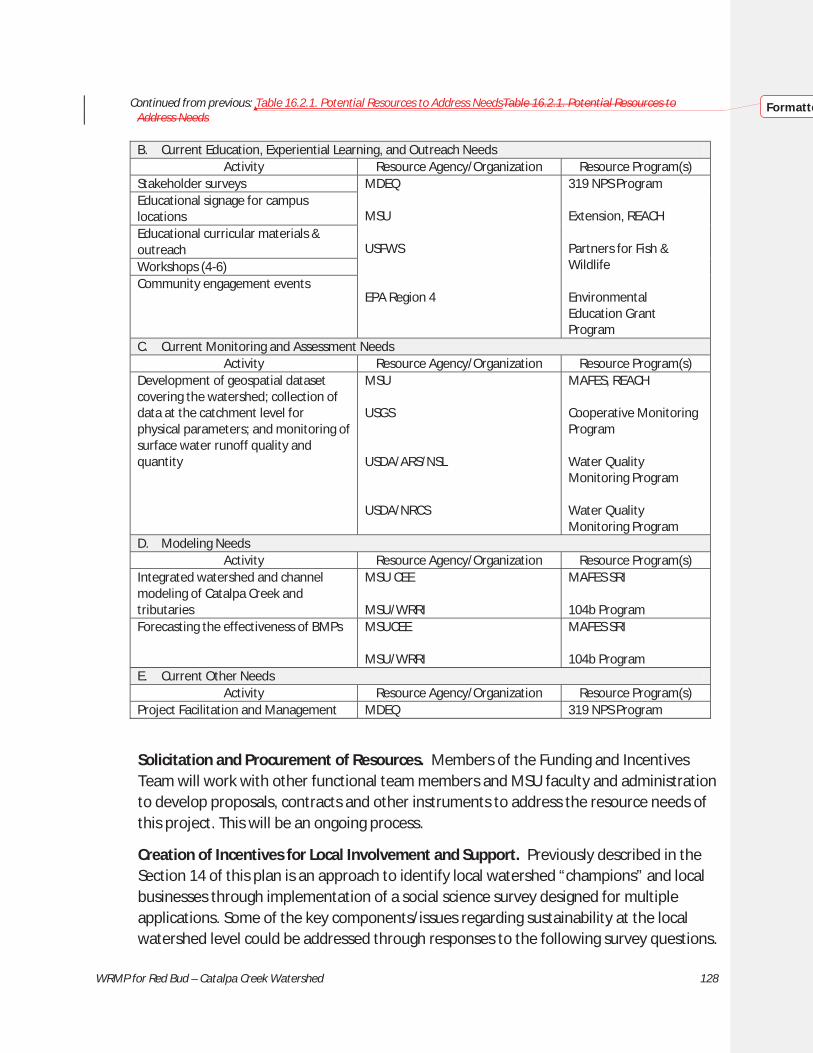
WRMP for Red Bud – Catalpa Creek Watershed 128
Continued from previous: Table 16.2.1. Potential Resources to Address NeedsTable 16.2.1. Potential Resources to Address Needs B. Current Education, Experiential Learning, and Outreach Needs
Activity Resource Agency/Organization Resource Program(s) Stakeholder surveys MDEQ
MSU
USFWS
EPA Region 4
319 NPS Program
Extension, REACH
Partners for Fish & Wildlife
Environmental Education Grant Program
Educational signage for campus locations Educational curricular materials & outreach Workshops (4-6) Community engagement events
C. Current Monitoring and Assessment Needs Activity Resource Agency/Organization Resource Program(s)
Development of geospatial dataset covering the watershed; collection of data at the catchment level for physical parameters; and monitoring of surface water runoff quality and quantity
MSU
USGS
USDA/ARS/NSL
USDA/NRCS
MAFES, REACH
Cooperative Monitoring Program
Water Quality Monitoring Program
Water Quality Monitoring Program
D. Modeling Needs Activity Resource Agency/Organization Resource Program(s)
Integrated watershed and channel modeling of Catalpa Creek and tributaries
MSU CEE
MSU/WRRI
MAFES SRI
104b Program Forecasting the effectiveness of BMPs MSUCEE
MSU/WRRI
MAFES SRI
104b Program E. Current Other Needs
Activity Resource Agency/Organization Resource Program(s) Project Facilitation and Management MDEQ 319 NPS Program
Solicitation and Procurement of Resources. Members of the Funding and Incentives Team will work with other functional team members and MSU faculty and administration to develop proposals, contracts and other instruments to address the resource needs of this project. This will be an ongoing process.
Creation of Incentives for Local Involvement and Support. Previously described in the Section 14 of this plan is an approach to identify local watershed “champions” and local businesses through implementation of a social science survey designed for multiple applications. Some of the key components/issues regarding sustainability at the local watershed level could be addressed through responses to the following survey questions.
Formatte
WRMP for Red Bud – Catalpa Creek Watershed 129
Who are the potential local champions? Who are the influencers? Who can provide local support? What type of support? What businesses and local
organizations could benefit from providing support? What types of benefits? Who is already engaged in supporting environmental protection activities? What
type of support are they providing? What incentives exist for local stakeholder and business support? What incentives
could be developed to foster local stakeholder and business support for a watershed-based project?
How can you keep local champions and business support “fresh” and engaged?
These and other questions will require analysis as well as development of an incentives package and a recruitment strategy. This will be developed by the Funding and Incentives Team and presented to the Steering Team.
Recruitment of the Local Business Community and Local Government. Where positive survey responses are received, follow-up interviews could be arranged and conducted to discuss incentives (e.g., recognition, designations, awards, et al) and solicit support from the local business community. Mining of available information sources that can yield beneficial information (e.g., MDEQ’s enHance Program, Chamber of Commerce, et al) will also be pursued to identify potential local support.
A concerted effort will also be made to involve local county and municipal government support. MSU has excellent relations with these local entities. In fact, several current or former City of Starkville Alderman are already working on this project.
116.3 RESOURCE LEVERAGING
As a matter of practice, we will pursue as many avenues as possible to leverage all resources. There are numerous resources that may be available to support this project. This includes substantial MSU activities, programs, and assets as well as external educational programs, media, monitoring programs, and BMP cost-share programs from other sources.
MSU Activities, Programs, and Assets to Be Leveraged. Table 16.3.1 lists some of the MSU activities, programs, assets, and services that will be leveraged with the Catalpa Creek Watershed Restoration and Protection Project and the Watershed D.R.E.A.M.S. Center. Near-term plans are to estimate and track the costs of these activities and services.

WRMP for Red Bud – Catalpa Creek Watershed 130
Table 16.3.1. MSU Activities, Programs, Assets, and Services to Be Leveraged.
A. Headwaters -Water Quality and Habitat/Ecosystem Restoration Resource Concern Program/Operation/Asset Services
Water Quality – Sedimentation MWRRI, LALC, REACH, CEE, GRI, MAFES, et al
Development of Water Resources Management Plan
MWRRI, LALC, REACH, CEE, GRI, MAFES Planning for BMP implementation
MAFES South Farm Operations Equipment and Staff for BMP installation
REACH, LALC, CEE Monitoring and assessment
Urban Storm Water MSU Operations (Master Plan) Urban storm water management
MSU (Master Plan) Design and implementation of storm water management framework – LID solutions in future campus planning and development; on-site storm water treatment (where feasible) on all newly constructed campus buildings and landscape projects; 100-foot buffers on all campus streams; protect and re-vegetate landscape areas around existing creeks and drainage ways; direct storm water flow from existing creek beds to water receiving landscapes that are designed to allow for infiltration and slow discharge; enhance landscapes around existing on-site water resources with vegetated filters and water absorbent plantings at storm water discharge points; construction of storm water retention basins south of Blackjack Road and west of Eckie’s Pond; and other storm water mitigation activities
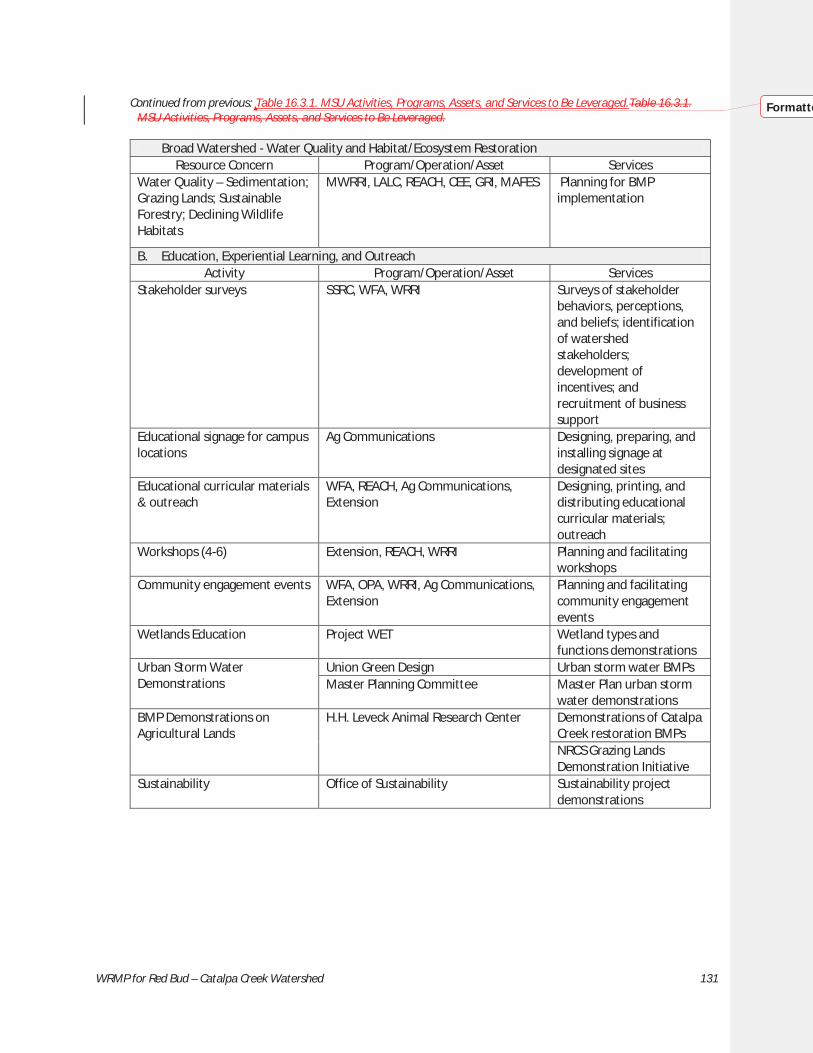
WRMP for Red Bud – Catalpa Creek Watershed 131
Continued from previous: Table 16.3.1. MSU Activities, Programs, Assets, and Services to Be Leveraged.Table 16.3.1. MSU Activities, Programs, Assets, and Services to Be Leveraged. Broad Watershed - Water Quality and Habitat/Ecosystem Restoration
Resource Concern Program/Operation/Asset Services Water Quality – Sedimentation; Grazing Lands; Sustainable Forestry; Declining Wildlife Habitats
MWRRI, LALC, REACH, CEE, GRI, MAFES Planning for BMP implementation
B. Education, Experiential Learning, and Outreach Activity Program/Operation/Asset Services
Stakeholder surveys SSRC, WFA, WRRI Surveys of stakeholder behaviors, perceptions, and beliefs; identification of watershed stakeholders; development of incentives; and recruitment of business support
Educational signage for campus locations
Ag Communications Designing, preparing, and installing signage at designated sites
Educational curricular materials & outreach
WFA, REACH, Ag Communications, Extension
Designing, printing, and distributing educational curricular materials; outreach
Workshops (4-6) Extension, REACH, WRRI Planning and facilitating workshops
Community engagement events WFA, OPA, WRRI, Ag Communications, Extension
Planning and facilitating community engagement events
Wetlands Education Project WET Wetland types and functions demonstrations
Urban Storm Water Demonstrations
Union Green Design Urban storm water BMPs Master Planning Committee Master Plan urban storm
water demonstrations BMP Demonstrations on Agricultural Lands
H.H. Leveck Animal Research Center Demonstrations of Catalpa Creek restoration BMPs NRCS Grazing Lands Demonstration Initiative
Sustainability Office of Sustainability Sustainability project demonstrations
Formatte

WRMP for Red Bud – Catalpa Creek Watershed 132
Continued from previous: Table 16.3.1. MSU Activities, Programs, Assets, and Services to Be Leveraged.Table 16.3.1.
MSU Activities, Programs, Assets, and Services to Be Leveraged.
C. Monitoring and Assessment Type Program/Operation/Asset Services
Water Quality – Headwaters MAFES SRI (Special Research Initiative) Development of geospatial dataset covering the watershed; collection of data at the catchment level for physical parameters; monitoring and assessment of surface water runoff quality and quantity
Water Quality – Broad Watershed
TBD Monitoring and assessment
Habitat – Endangered Species WFA Endangered species data collection and assessment
Habitat – Avian Indicators WFA Indicator species data collection and assessment
Habitat – Reptilian Indicators WFA Indicator species data collection and assessment
Habitat – Amphibian Indicators WFA Indicator species data collection and assessment
Habitat – Pond Turtle Landscape and Trophic Indicators
WFA Indicator species data collection and assessment
Habitat – Insect Indicators WFA Indicator species data collection and assessment
Habitat – Invasive Species WFA Invasive species data collection and assessment
Habitat – Turf Health LALC Turf data collection and assessment
Social Science – Social Indicators
SSRC Development, evaluation, and tracking of social indicators
D. Modeling Activity Program/Operation/Asset Services
Hydrologic Modeling CEE Model development Forecasting the Effectiveness of BMPs
CEE Model development
E. Other Activity Program/Operation/Asset Services
Project Facilitation and Management
WRRI, MAFES Provide overall project facilitation and management
Formatte
WRMP for Red Bud – Catalpa Creek Watershed 133
117 PLAN REVISION
Development and implementation of this water resources management plan is based upon an adaptive management process. Many factors are at play: resource availability’s impact on project scale, knowledge gained as the plan is implemented, recognition of new needs and opportunities as the plan unfolds, and monitoring results filling gaps. Because of this, it is likely that this plan will be revised and updated periodically. In fact, it is anticipated that the first plan revision could occur sooner rather than later as more details are developed and resources become available for the establishment of the Watershed D.R.E.A.M.S. Center. For the first five years this plan will be reviewed and revised, if necessary, annually.
18 REFERENCES Aresco, M. J. and F. C. James, 2005: Ecological relationships and abundance of turtles in north
Florida lakes: A study of omnivory and an analysis of the trophic structure of a whole lake food web. Florida Fish and Wildlife Conservation Commission. Contract NG01-011.
Barone, J. A., 2005: Historical presence and distribution of prairies in the Black Belt of Mississippi and Alabama. Castanea, 70, 170-183.
Barone, J. A. and J. G. Hill, 2007: Herbaceous flora of blackland prairie remnants in Mississippi and Western Alabama. Castanea, 72, 226-234.
Boswell, E. H., 1963: Cretaceous Aquifers of Northeastern Mississippi. Mississippi Board of Water Commissioners. Bulletin 63-10.
Boswell, E. H., 1978: The Tuscaloosa Aquifer System in Mississippi. U.S. Geological Survey. Water-Resources Investigations 78-98.
Bouchard, S. S. and K. A. Bjorndal, 2006: Non-additive Interactions between animal and plant diet items in an omnivorous freshwater turtle Trachemys scripta. Comparative Biochemistry and Physiology, 144, 77-85.
Bowman, D. C., C. T. Cherney and T. W. Rufty, 2002: Fate and transport of nitrogen applied to six warm-season turfgrasses. Turf Science, 42, 833-841.
Brandon, H., 2011: And then there was one: John McReynolds, dairyman. Delta Farm Press. Buijse, T., 2014: Inventory of river restoration measures: effects, costs and benefits. REFORM
(Restoring rivers for effective catchment management) http://www.reformrivers.eu/inventory-river-restoration-measures-effects-costs-and-benefits, Last accessed: August 11, 2015.
Chapman, S. S., G. E. Griffith, J. M. Omernik, J. A. Comstock, M. C. Beiser and D. Johnson, 2004: Ecoregions of Mississippi. In: U. S. G. Survey (ed.). U.S. Geological Survey, Reston, VA.
Clark, D. B. and J. W. Gibbons, 1969: Dietary and habitat shift with size of red-eared turtles (Pseudemys scripta) in a southern Louisiana population. Herpetolgica, 39, 285-290.
Congdon, J. L., L. Greene and J. W. Gibbons, 1986: Biomass of freshwater turtles: a geographic comparison. American Midland Naturalist, 115, 165-173.

WRMP for Red Bud – Catalpa Creek Watershed 134
Dahl, T. E., 1990: Wetlands losses in the United States, 1780's to 1980's. National Wetlands Inventory. No. PB-91-169284/XAB.
Dlugolecki, L., 2012: Economic benefits of protecting healthy watersheds: A literature review. US Environmental Protection Agency.
Dyer, J., 2009: Evaluation of surface and radar-estimated precipitation data sources over the Lower Mississippi River Alluvial Plain. Physical Geography, 30, 430-452.
EDDMapS, ND: The Early Detection and Distribution Mapping System. The University of Georgia - Center for Invasive Species and Ecosystem Health. https://www.eddmaps.org/, Last accessed: September 23, 2015.
EPA, 2008: Handbook for Developing Watershed Plans to Restore and Protect Our Waters. US Environmental Protection Agency. EPA 841-B-08-002. http://water.epa.gov/polwaste/nps/upload/2008_04_18_NPS_watershed_handbook_handbook-2.pdf, Last accessed: September 22, 2015.
Fischenich, J. C., 2006: Functional Objectives for Stream Restoration. USACE Engineering Research and Development Center. ERDC TN-EMRRP SR-52. http://oai.dtic.mil/oai/oai?verb=getRecord&metadataPrefix=html&identifier=ADA456784, Last accessed: September 23, 2015.
Genskow, K. and L. Prokopy, 2011: The Social Indicator Planning and Evaluation System (SIPES) for Nonpoint Source Management: A Handbook for Watershed Projects. Great Lakes Regional Water Program.
Harman, W., R. Starr, M. Carter, K. Tweedy, M. Clemmons, K. Suggs and C. Miller, 2012: A Function-Based Framework for Stream Assessment and Restoration Projects. US Environmental Protection Agency. EPA 843-K-12-006. http://water.epa.gov/lawsregs/guidance/wetlands/upload/A_Function-Based_Framework-2.pdf, Last accessed: September 23, 2015.
Hart, D. R., 1983: Dietary and habitat shift with size of red-eared turtles (Pseudemys scripta) in a southern Louisiana population. Herpetolgica, 39, 285-290.
Iverson, J. B., 1982: Biomass in turtle populations: a neglected subject. Oecologia, 55, 69-76. Karr, J. R., 1981: Assessment of biotic integrity using fish communities. Fisheries, 6, 21-27. Kunkel, K. E., L. E. Stevens, S. E. Stevens, L. Sun, E. Janssen, D. Weubbles, C. E. Konrad, C. M.
Fuhrmann, B. D. Keim, M. C. Kruk, A. Billot, H. Needham, M. Shafer and J. G. Dobson, 2013: Regional Climate Trends and Scenarios for the U.S. National Climate Assessment. Part 2: Climate of the Southeast United States. NOAA. Technical Report NESDIS 142-2.
Leidolf, A. and S. McDaniel, 1998: Floristic Study of Black Prairie Plant Communities at Sixteen Section Prairie, Oktibbeha County, Mississippi. Castanea, 63, 51-62.
Leidolf, A., S. McDaniel and T. Nuttle, 2002: The flora of Oktibbeha County. SIDA, 20, 691-765. Lindsay, M. K., 2011: Effects of a freshwater turtle (Trachemys scripta elegans) on ecosystem
functioning in experimental ponds. Texas State University - San Marcos, M.S. Dissertation.
Lowe, E. N., 1921: Plants of Mississippi: a list of flowering plants and ferns. MS State Geological Survey. Bulletin 17.
McCook, L. M. and J. Kartesz, 2000: A preliminary checklist of the plants of Mississippi. Thomas M. Pullen Herbarium. http://herbarium.olemiss.edu/checklist.html, Last accessed: September 23, 2015.
WRMP for Red Bud – Catalpa Creek Watershed 135
MDEQ, 2003: Development and Application of the Mississippi Benthic Index of Stream Quality (M-BISQ). Tetra Tech, Inc. http://www.deq.state.ms.us/mdeq.nsf/pdf/WMB_fullM_BISQReport/$File/303dIBI_FINAL_Report_070903_Report_and_Append.PDF?OpenElement, Last accessed: September 22, 2015.
MDEQ, 2006: Total Maximum Daily Load Tombigbee River Basin Designated Streams in HUC 03160104 (Tibbee Creek) for Impairment Due to Sediment. MS Department of Environmental Quality.
MDEQ, 2007a: Fecal Coliform TMDL for Tibbee Creek. MS Department of Environmental Quality. MDEQ, 2007b: Total Maximum Daily Load Nutrients for Tibbee and Chuquatonchee Creeks. MS
Department of Environmental Quality. MDEQ, 2011: Mississippi Upland Nutrient Reduction Strategic Plan. FTN Associates, Ltd. FTN No.
3120-720. http://www.deq.state.ms.us/MDEQ.nsf/pdf/WMB_MSUplandNutrientReductionStrategies03302011/$File/Mississippi_Upland_Nutrient_Reduction_Strategies_03_30_2011.pdf?OpenElement, Last accessed: September 22, 2015.
MDEQ, 2012: State of Mississippi Water Quality Criteria for Intrastate, Interstate, and Coastal Waters (WPC-2). MDEQ Office of Pollution Control. http://www.deq.state.ms.us/mdeq.nsf/0/15BBA9C950AE40C186257A38006EBA2C/$file/WQ_Standards_Blackline_Adopted+by+Commission_June_28_2012.pdf?OpenElement, Last accessed: September 22, 2015.
Morton, T. G., A. J. Gold and W. M. Sullivan, 1988: Influence of over-watering and fertilization on nitrogen losses from home lawns. Journal of Environmental Quality, 17, 124-129.
MSU, 2010: Mississippi State University 2010 Master Plan. LPK architects. http://www.planning.msstate.edu/plan/MississippiState_2010MasterPlan.pdf, Last accessed: September, 22, 2015.
NatureServe, 2015: NatureServe Explorer: An online encyclopedia of life. NatureServe. http://explorer.natureserve.org, Last accessed: August 12, 2015.
Nelson, G. L. and B. M. Graves, 2004: Anuran population monitoring: Comparison of the North American Amphibian Monitoring Program’s calling index with mark-recapture estimates for Rana clamitans. Journal of Herpetology, 38, 355-359.
Parmenter, R. R., 1980: Effects of food availability and water temperature on the feeding ecology of pond sliders (Chrysems s. scripta). Copeia, 1980, 503-514.
Philips, G., 2007: State dairy numbers continue to decline. Mississippi Farm Country 83, 12. Polis, G. A., W. B. Anderson and R. D. Holt, 1997: Toward an integration of landscape and food
web ecology: the dynamics of spatially subsidized food webs. Annual Review of Ecology and Systematics, 28, 289-316.
Ramirez-Avila, J. J., 2011: Assessment and prediction of streambank erosion rates in a Sotheastern Plains Ecoregion watershed in Mississippi. Mississippi State University, Civil and Environmental Engineering, Ph.D. Dissertation.
Ramirez-Avila, J. J., E. J. Langendoen, W. H. McAnally, J. L. Martin and S. L. Ortega-Achury, Quantifying and Modeling Sediment Loads from Streambank Erosion along the Headwaters of Town Creek in Mississippi. in Proceedings of the Federal Interagency Sedimentation Conference, Reno, NV, 2015a.
WRMP for Red Bud – Catalpa Creek Watershed 136
Ramirez-Avila, J. J., W. H. McAnally and S. L. Ortega-Achury, An Approximation of the Sediment Budget for the Tombigbee River and the Mobile River Basins. in Proceedings of the Federal Interagency Sedimentation Conference, Reno, NV, 2015b.
Ramirez-Avila, J. J., W. H. McAnally and M. L. Tagert, 2013: Support for a northeast MS regional water management plan: Updating the water budget for the Tombigbee River Basin. Mississippi State University. GRI Technical Report #4013.
Roe, J. H., A. C. Brinton and A. Georges, 2009: Temporal and spatial variation in landscape connectivity for a freshwater turtle in a temporally dynamic wetland system. Ecological Applications, 19, 1288-1299.
Roe, J. H. and A. Georges, 2007: Heterogeneous wetland complexes, buffer zones, and travel corridors: landscape management for freshwater reptiles. Biological Conservation, 135, 67-76.
Rosgen, D. L., A Geomorphological Approach to Restoration of Incised Rivers. in S. S. Y. Wang, E. J. Langendoen and F. D. Shields (eds.) Proceedings of the Proceedings of the Conference on Management of Landscapes Disturbed by Channel Incision, Oxford, MS, 1997.
Schauwecker, T., J. Murdock and K. Collins, Conservation Planning integrating site assessment and hydrologic modeling at the Mississippi State University in Proceedings of the Mississippi Water Resources Conference, Jackson, MS, 2007.
Schauwecker, T. J. and J. MacDonald, 2003: Blackland prairie plant communities of northeast Mississippi: Composition, threatened species and assemblage response to disturbance. In: E. Peacock and T. Schauwecker (eds.), Prairies of the Gulf Coastal Plain: Culture, Nature, and Sustainability. University of Alabama Press.
Shields, F. D., E. J. Langendoen and M. W. Doyle, 2006: Adapting existing models to examine effects of agricultural conservation programs on stream habitat quality. Journal of the American Water Resources Association, 42, 25-33.
Simon, A., R. L. Bingner and E. J. Langendoen, 2002: Actual and reference sediment yields for the James Creek watershed, MS. National Sedimentation Laboratory. Report 31.
Snyder, G. H., B. J. Augustin and J. M. Davidson, 1984: Moisture sensor-controlled irrigation for reducing N leaching in bermudagrass turf. Agronomy Journal, 76, 964-969.
Turner, R. K. and G. C. Daily, 2008: The ecosystem services framework and natural capital conservation. Environmental Resource Economics, 39, 25-35.
Weiher, E., S. Forbes, T. Schauwecker and J. B. Grace, 2004: Multivariate control of plant species richness and community biomass in blackland prairie. Oikos, 106, 151-159.
Weir, L. A., J. A. Royle, P. Nanjappa and R. E. Jung, 2005: Modeling anuran detection and site occupancy on North American Amphibian Monitoring Program (NAAMP) routes in Maryland. Journal of Herpetology, 39, 627-639.

WRMP for Red Bud – Catalpa Creek Watershed 137
119 APPENDICES
19.1 APPENDIX A: CROSS-REFERENCE FOR REQUIRED EPA 319 WATERSHED-BASED PLAN ELEMENTS The U. S. Environmental Protection Agency generally requires watershed –based plans seeking funding under Section 319 of the Clean Water Act to contain nine key elements that serve as the building blocks to develop watershed plans. These nine elements are the components of the watershed planning process that EPA believes are the most critical to preparing effective watershed plans. This appendix lists the nine key elements and the corresponding sections that address each element. The applicable section(s) is given in bold-faced type followed by the section(s) or table within the section.
Table 19.1.1. EPA Nine Key Elements Cross-Referenced to Watershed Plan.
Required EPA Key Element Watershed-Based Plan
Location in the Red Bud – Catalpa Creek Watershed Water Resources Management Plan
1 Identification of Causes and Sources of Impairments
Section 10: Watershed Status and Restoration and Protection Goals and Targets--Section 10.3: Catalpa Creek Water Quality
2 Expected Load Reduction Section 10: Watershed Status and Restoration and Protection Goals and Targets --Section 10.3: Catalpa Creek Water Quality, Table 10.3.1: Catalpa Creek Water Quality Targets for Restoration and Protection
3 Proposed Management Measures Section 10: Watershed Status and Restoration and Protection Goals and Targets Section 11: Proposed Restoration and Protection Activities, and Costs
4 Technical and Financial Needs Section 16: Resource Needs, Procurement, and Leveraging 5 Information and Education Section 13: Education, Experiential Learning and Outreach
Section 15: Catalpa & Sand Creek Watershed D.R.E.A.M.S. (Demonstration, Research, Education, Application, Management and Sustainability) Center
6 Implementation Schedule Appendix B: Work Plan (Participants, Roles, and Milestones) Section 13: Education, Experiential Learning and Outreach-- Section 13.2: Activities & Milestones
7 Measureable Milestones and Project Outcomes
Section 10: Watershed Status and Restoration and Protection Goals and Targets Section 13: Education, Experiential Learning and Outreach --Section 13.2: Activities and Milestones Appendix B: Work Plan (Participants, Roles, and Milestones)
8 Load Reduction Evaluation Section 12: Monitoring, Modeling, Research, and Assessment 9 Monitoring Section 10: Watershed Status and Restoration and Protection Goals and Targets--
Section 10.2 Surface Water Quality Section 12: Monitoring, Modeling, Research, and Assessment

WRMP for Red Bud – Catalpa Creek Watershed 138
119.2 APPENDIX B: WORK PLAN (PARTICIPANTS, ROLES AND MILESTONES)
The following work plan describes the approaches and tasks that MSU shall collaboratively perform with project partners to advance and implement this water resources restoration and protection plan. During this effort, MSU will work with the Tennessee River/North Independent Streams/Tombigbee River Basin Team and will put forth its best effort to perform the tasks identified below within the given timetable.
1. In the event of a 319 NPS funding award from MDEQ to support implementation of this Water Resources Management Plan for the Catalpa Creek Watershed, MSU shall work with MDEQ to develop, execute, and implement a Sub-grant Agreement that specifies the roles, tasks, requirements, and milestones of MSU. (Month 1)
2. MSU, in coordination with MDEQ and other partners, shall facilitate meetings and coordinate activities of the functional teams and work groups created as a part of this project to fully implement this plan. MSU shall in a timely manner notify MDEQ project officer(s) of all project site locations, inspections, and/or public meetings so that MDEQ project representatives may have the opportunity to attend. (Months 1 – 42)
3. MSU shall work through its functional teams with the Oktibbeha County Soil & Water Conservation District, MSWCC, NRCS and MDEQ to inform landowners and operators within the watershed about the project and shall work to secure commitments from priority area landowners and operators who are willing to participate in the project. Special emphasis will be given to small farms, limited resource farmers, and beginning farmers. (Months 1 – 24)
4. MSU, in coordination with MDEQ and other partners, shall develop and conduct a pre-project survey designed to understand the behaviors, perceptions and beliefs of watershed stakeholders as a basis for developing social indicators that could be used to help evaluate the success of the project, implementing effective education and outreach, identifying local watershed champions that could provide local leadership, and determine potential local economic and governmental interests and incentives that could foster sustainable management of the watershed. (Months 1 – 3)
5. MSU shall work through its functional teams with the Oktibbeha County Soil & Water Conservation District, MSWCC, NRCS and MDEQ to determine through GIS applications and intensive site surveys the priority areas or sub-watersheds within the watershed that are contributing significant pollutant loads for the purpose of selecting, siting, and planning for the implementation of appropriate best
WRMP for Red Bud – Catalpa Creek Watershed 139
management practices (BMPs) identified in this plan to mitigate pollution in the watershed. All BMPs shall be installed in accordance with the guidelines developed in the latest edition of the NRCS Technical Field Manual, or other approved guidelines. (Months 1 – 24)
6. MSU, in cooperation with MDEQ and other monitoring partners, shall facilitate the completion and implementation of an effective and efficient plan to monitor baseline water quality conditions in the watershed and track changes in water quality over time resulting from the BMPS implemented through this project. (Completion: Months 1 – 2; Implementation: Months 3 – 42)
7. MSU shall hold a regional workshop on watershed management in conjunction with other collaborating universities, especially historically black land grant universities, and other educational institutions and stakeholder groups. Publish Proceedings of the workshop within 12 months after the workshop is held. (Workshop: Months 1-12; Proceedings: Months 13-24)
8. MSU shall coordinate with and support the Oktibbeha County Soil & Water Conservation District, MSWCC, and NRCS with submission of blank copies of standard maintenance agreements to MDEQ. (Months 13 – 36)
9. MSU shall assist MDEQ’s project officer(s) in conducting inspections during construction. (Months 6 – 36)
10. MSU shall coordinate with and support the Oktibbeha County Soil & Water Conservation District, MSWCC, and NRCS in the collection of relevant GPS coordinates of all installed BMPs and incorporate this information into a GIS format. All geospatial data shall be collected in a manner consistent with the Federal Geographic Data Committee-endorsed standards. (Months 9 – 36)
11. MSU shall submit biannual reports not later than September 25th and March 25th of each year showing status of tasks and start/completion dates of each task. (Months 1 – 42)
12. MSU shall assure that adequate photo documentation is taken before, during, and after installation of the approved BMPs. (Months 1 – 42)
13. MSU, in coordination with MDEQ and other partners, shall develop and conduct a post-project survey designed to understand potential changes in the behaviors, perceptions and beliefs of watershed stakeholders resulting from implementation of this plan evaluate the social indicators developed for the project. (Months 36 – 42)
14. MSU shall make project presentations as requested by MDEQ (Months 1 – 42)

WRMP for Red Bud – Catalpa Creek Watershed 140
15. MSU through its functional teams shall submit a final report to MDEQ to include measured, or estimated, nonpoint source pollutant load reduction or water quality improvements, acreage affected, pre and post site conditions, GIS data, and social indicators developed and evaluated to determine project success. MSU shall make revisions, if necessary, upon the request of MDEQ (Month 42).