Water-Resources Investigations Report 85-4063
28
FEASIBILITY OF ARTIFICIAL RECHARGE TO THE 800-FOOT SAND OF THE KIRKWOOD FORMATION IN THE COASTAL PLAIN NEAR ATLANTIC CITY, NEW JERSEY By Jayne E. May U.S. GEOLOGICAL SURVEY Water-Resources Investigations Report 85-4063 Prepared in cooperation with the NEW JERSEY DEPARTMENT OF ENVIRONMENTAL PROTECTION, DIVISION OF WATER RESOURCES Trenton, New Jersey 1985
Transcript of Water-Resources Investigations Report 85-4063
FEASIBILITY OF ARTIFICIAL RECHARGE TO THE 800-FOOT SAND
OF THE KIRKWOOD FORMATION IN THE COASTAL PLAIN NEAR
ATLANTIC CITY, NEW JERSEY
By Jayne E. May
U.S. GEOLOGICAL SURVEY
Water-Resources Investigations Report 85-4063
Prepared in cooperation with the
NEW JERSEY DEPARTMENT OF ENVIRONMENTAL PROTECTION,
DIVISION OF WATER RESOURCES
Trenton, New Jersey
1985
UNITED STATES DEPARTMENT OF THE INTERIOR
DONALD PAUL HODEL, Secretary
GEOLOGICAL SURVEY
Dallas L. Peck, Director
For additional information Copies of this report canwrite to: be purchased from:
District Chief Open-File Services SectionU.S. Geological Survey Western Distribution BranchRoom M09, Federal Building Box 25M25, Federal CenterM02 East State Street Denver, Colorado 80225Trenton, New Jersey 08608 Telephone: [3031 236-7^76
CONTENTS
Page
Abstract..................................................... 1Introduction................................................. 2
Purpose and scope....................................... 2Methods of investigation................................ 2Previous studies........................................ 5Description of study area............................... 5Well-numbering system................................... 5Acknowledgments......................................... 5
Hydrogeology of the Atlantic City area....................... 6Ground-water levels.......................................... 8
Regional cone of depression at Atlantic City............ 8Seasonal fluctuations................................... 8
Alternative sources of water................................. 11Feasibility of artificial recharge........................... 12
Evaluation of artificial-recharge procedures............ 12Connector wells.................................... 12Pressure recharge wells............................ 14
System design considerations............................ 15Water-quality considerations............................ 16
Summary and conclusions...................................... 18References cited............................................. 20Glossary..................................................... 23
ILLUSTRATIONS
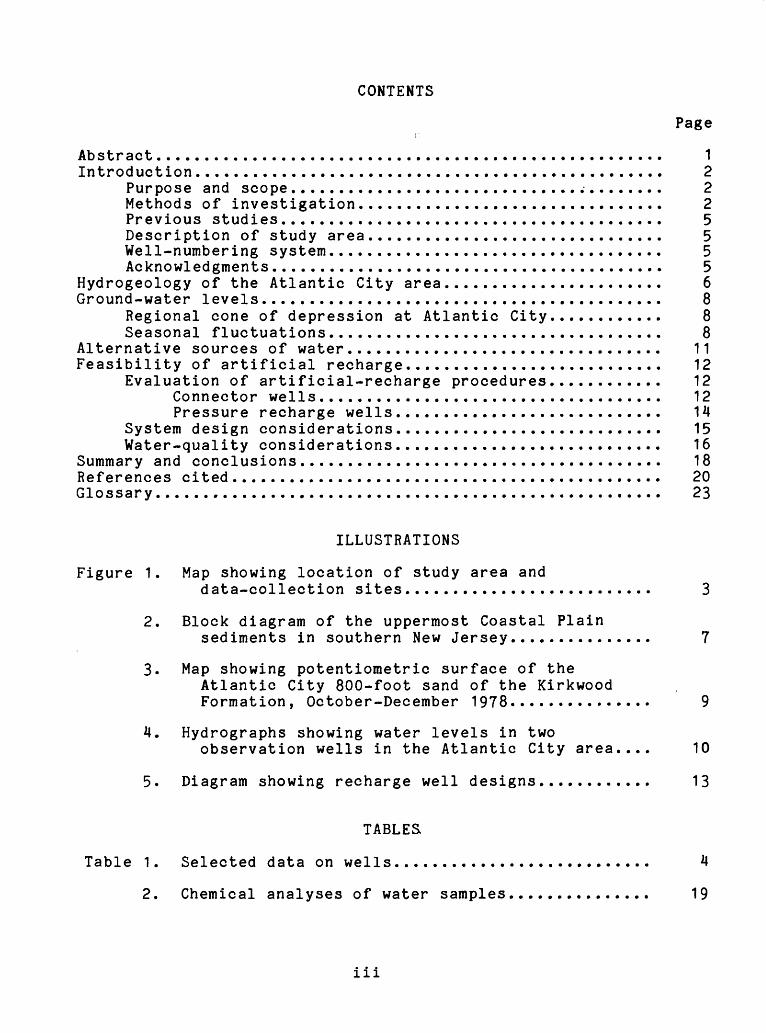
Figure 1. Map showing location of study area anddata-collection sites.......................... 3
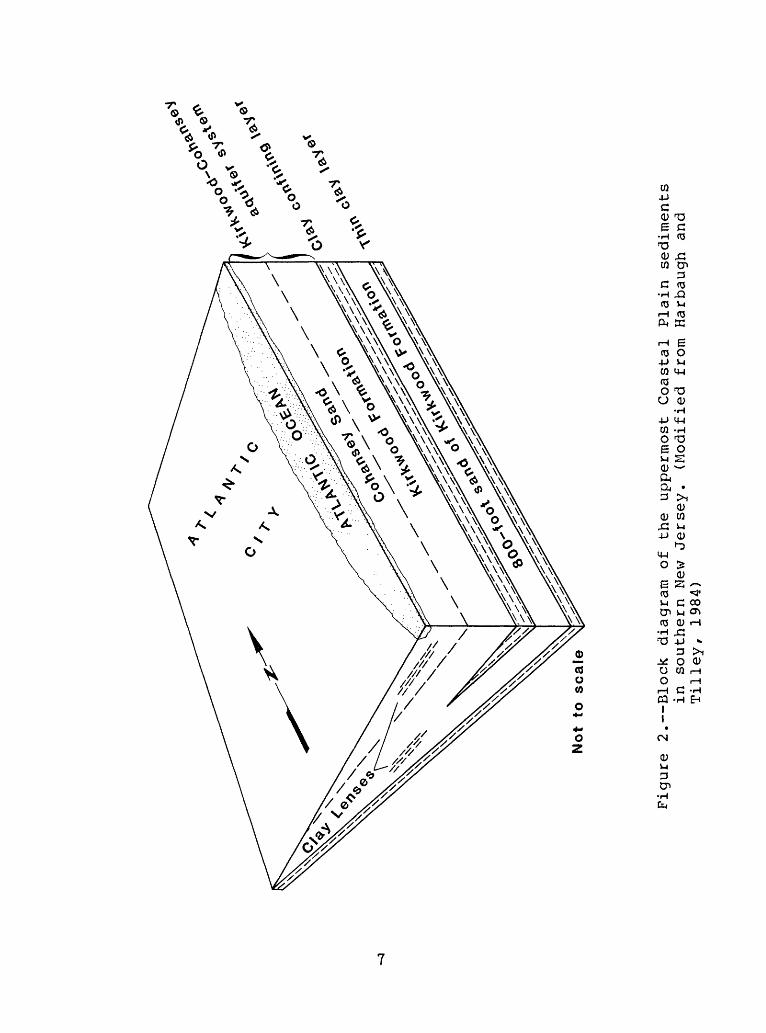
2. Block diagram of the uppermost Coastal Plainsediments in southern New Jersey............... 7
3. Map showing potentiometric surface of theAtlantic City 800-foot sand of the Kirkwood Formation, October-December 1978............... 9
4. Hydrographs showing water levels in twoobservation wells in the Atlantic City area.... 10
5. Diagram showing recharge well designs............ 13
TABLES
Table 1. Selected data on wells........................... 4
2. Chemical analyses of water samples............... 19
iii
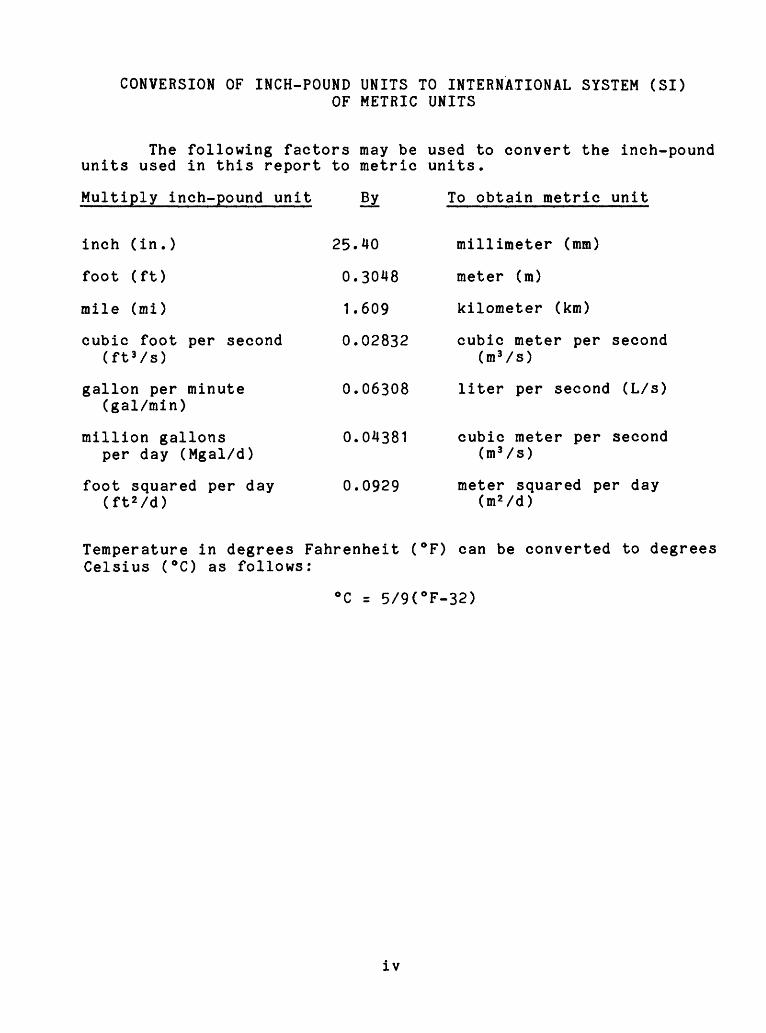
CONVERSION OF INCH-POUND UNITS TO INTERNATIONAL SYSTEM (SI)OF METRIC UNITS
The following factors may be used to convert the inch-pound units used in this report to metric units.
Multiply inch-pound unit To obtain metric unit
inch (in.) 25.40
foot (ft) 0.3048
mile (mi) 1.609
cubic foot per second 0.02832 (ftVs)
gallon per minute 0.06308 (gal/min)
million gallons 0.04381 per day (Mgal/d)
foot squared per day 0.0929 (ft 2 /d)
millimeter (mm)
meter (m)
kilometer (km)
cubic meter per second (mVs)
liter per second (L/s)
cubic meter per second (mVs)
meter squared per day (mVd)
Temperature in degrees Fahrenheit (°F) can be converted to degrees Celsius (°C) as follows:
°C = 5/9(°F-32)
iv
FEASIBILITY OF ARTIFICIAL RECHARGE TO THE 800-FOOT SAND TO THE
KIRKWOOD FORMATION IN THE COASTAL PLAIN NEAR
ATLANTIC CITY, NEW JERSEY
ABSTRACT
Renewed economic development of the Atlantic City area, New Jersey, since the mid-1970's has increased the demand for water. The resulting increase in pumpage from the 800-foot sand of the Kirkwood Formation has reversed an antecedent water-level recovery in that aquifer, thereby reducing the quantity of water in storage and increasing the potential for saltwater intrusion.
Practicable approaches to providing a dependable water supply for the area while properly managing withdrawals from the 800-foot sand include (1) development of surface-water supplies; (2) development of ground-water supplies; and (3) artifically recharging the 800-foot sand. The last approach is the principal alternative discussed in this report. The report includes a review of methods of artificial recharge with emphasis on attendant operational problems, investigation of local hydrogeologic condi tions, and collection and interpretation of limited water-quality data.
System design and quality of the water injected are important components of a successful artificial recharge well system. Mixtures of water in various proportions from the 800-foot sand and from a representative local public-supply system may become supersaturated with oxygen. Oxygen, being highly reactive, would in all liklihood quickly react with the constituent minerals of the receiving aquifer, resulting in mineral oxidation and precipitation. Significant temperature differences between two such waters would likely exacerbate those conditions. Limited chemical analyses suggest that suspended solids concentrations in water from local public supplies may at times be high enough to cause clogging of recharge well screens. These problems are solvable by appropriate conditioning of recharge water. Such conditioning needs to be based on detailed investigation, however.
INTRODUCTION
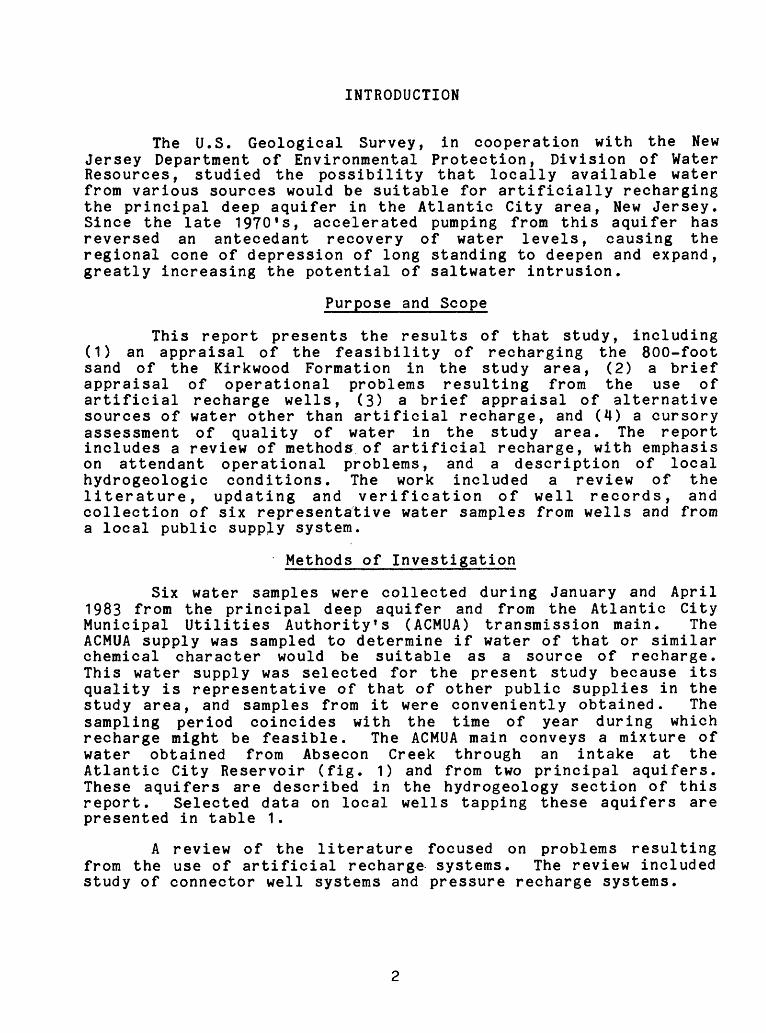
The U.S. Geological Survey, in cooperation with the New Jersey Department of Environmental Protection, Division of Water Resources, studied the possibility that locally available water from various sources would be suitable for artificially recharging the principal deep aquifer in the Atlantic City area, New Jersey. Since the late 1970's, accelerated pumping from this aquifer has reversed an antecedent recovery of water levels, causing the regional cone of depression of long standing to deepen and expand, greatly increasing the potential of saltwater intrusion.
Purpose and Scope
This report presents the results of that study, including (1) an appraisal of the feasibility of recharging the 800-foot sand of the Kirkwood Formation in the study area, (2) a brief appraisal of operational problems resulting from the use of artificial recharge wells, (3) a brief appraisal of alternative sources of water other than artificial recharge, and (M) a cursory assessment of quality of water in the study area. The report includes a review of methods of artificial recharge, with emphasis on attendant operational problems, and a description of local hydrogeologic conditions. The work included a review of the literature, updating and verification of well records, and collection of six representative water samples from wells and from a local public supply system.
Methods of Investigation
Six water samples were collected during January and April 1983 from the principal deep aquifer and from the Atlantic City Municipal Utilities Authority's (ACMUA) transmission main. The ACMUA supply was sampled to determine if water of that or similar chemical character would be suitable as a source of recharge. This water supply was selected for the present study because its quality is representative of that of other public supplies in the study area, and samples from it were conveniently obtained. The sampling period coincides with the time of year during which recharge might be feasible. The ACMUA main conveys a mixture of water obtained from Absecon Creek through an intake at the Atlantic City Reservoir (fig. 1) and from two principal aquifers. These aquifers are described in the hydrogeology section of this report. Selected data on local wells tapping these aquifers are presented in table 1.
A review of the literature focused on problems resulting from the use of artificial recharge systems. The review included study of connector well systems and pressure recharge systems.

AtlanticCity
reservoir
Price Landfill
/ACMUA Water
/ Treatment
/ Plant
Atlantic CityCentral JuniorHigh School
EXPLANATION
1 ~3«7 Well listed in table 1
KILOMETERS
Figure 1. Location of study area and data-collection sites
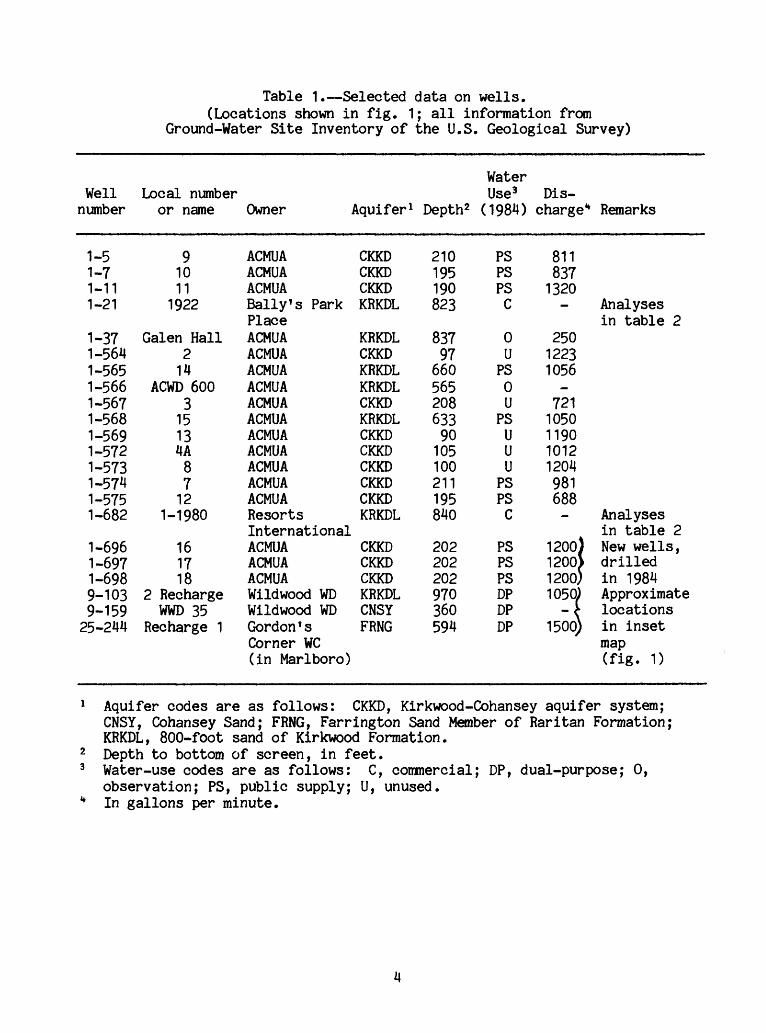
Table 1. Selected data on wells. (Locations shown in fig. 1; all information from
Ground-Water Site Inventory of the U.S. Geological Survey)
Well number
1-51-71-111-21
1-371-5641-5651-5661-5671-5681-5691-5721-5731-5741-5751-682
1-6961-6971-6989-1039-15925-244
Local number or name Owner Aquifer 1
91011
1922
Galen Hall214
ACWD 6003
15134A8712
1-1980
161718
2 RechargeWWD 35
Recharge 1
ACMUAACMUAACMUABally f s ParkPlaceACMUAACMUAACMUAACMUAACMUAACMUAACMUAACMUAACMUAACMUAACMUAResortsInternationalACMUAACMUAACMUAWildwood WDWild wood WDGordon f sCorner WC(in Marlboro)
CKKDCKKDCKKDKRKDL
KRKDLCKKDKRKDLKRKDLCKKDKRKDLCKKDCKKDCKKDCKKDCKKDKRKDL
CKKDCKKDCKKDKRKDLCNSYFRNG
Depth2
210195190823
83797
66056520863390105100211195840
202202202970360594
Water Use3 (1984)
PSPSPSC
0UPS0U
PSUUU
PSPSC
PSPSPSDPDPDP
Dis charge1*
8118371320
-
25012231056
_7211050119010121204981688-
1200)1200)1200)1050)
- £1500)
Remarks
Analysesin table 2
Analysesin table 2New wells,drilledin 1984Approximatelocationsin insetmap(fig. 1)
Aquifer codes are as follows: CKKD, Kirkwood-Cohansey aquifer system;CNSY, Cohansey Sand; FRNG, Farrington Sand Member of Raritan Formation;KRKDL, 800-foot sand of Kirkwood Formation.Depth to bottom of screen, in feet.Water-use codes are as follows: C, commercial; DP, dual-purpose; 0,observation; PS, public supply; U, unused.In gallons per minute.

Previous Studies
The concept of artificial recharge of ground water is not new. Todd (1959) cited recharge projects in southern California dating back to about 1895. Signor and others (1970) listed more than 500 references on artifical recharge dating from 1955-67. Several different methods of artifical recharge have been tried in shallow aquifers. However, only two methods have proven feasible in deep confined aquifers: (1) the connector well system (Bush, 1983)i and (2) the pressure recharge system (Brown and Silvey, 1977; Fleming and Speitel, 1980; Koch and others, 1973; Sniegocki, 1963a; and Sniegocki and others, 1965).
Decription of Study Area
The approximate extent of the study area is shown in figure 1. This area is bounded by the Garden State Parkway on the west, Atlantic City's boundaries on the north, the Atlantic Ocean on the southeast, and Longport's boundaries on the southwest (fig. 1). The study centered around Absecon Island. Coastal communities such as Atlantic City, Ventnor City, Margate City, and Longport (fig. 1) have been summer resorts for generations. More residents are now remaining in these communities throughout the year. Although summer is still the principal tourist season, the development of the casino and attendant industries since 1978 has brought more than 25 million daily visitors per year into the area (Thomas Flynn, New Jersey Casino Control Commission, oral commun., 1984).
Visitors were initially attracted to the area by the mild summer climate and proximity to the ocean. The average annual temperature from 1951 to 1980 is 54°F; average monthly temperature ranges from about 34°F in January to 74°F in July and August. Annual precipitation for the same period averages 40 to 45 inches (Ludlum, 1983).
Well-Numbering System
The well-numbering system used in this report is that used since 1978 in New Jersey by the U.S. Geological Survey. The well number consists of a county code number and a sequential number assigned at the time the well was originally inventoried. County codes used in this report include Atlantic (1), Burlington (5), Cape'May (9), Cumberland (11), and Ocean (29). For example, well number 1-137 is the 137th well inventoried in Atlantic County.
Acknowledgments
Special thanks are extended to Gary Ziegler of A. C. Schultes and Sons, Inc., and William H. Fleming of Gerald E. Speitel Associates, who contributed information on artificial recharge projects in New Jersey; to Otto S. Zapecza and LeRoy L. Knobel of the U.S. Geological Survey, who contributed information on the hydrogeology of the study area and assisted with
water-quality interpretations, respectively; and to those who permitted sampling of their water supply.
HYDROGEOLOGY OF THE ATLANTIC CITY AREA
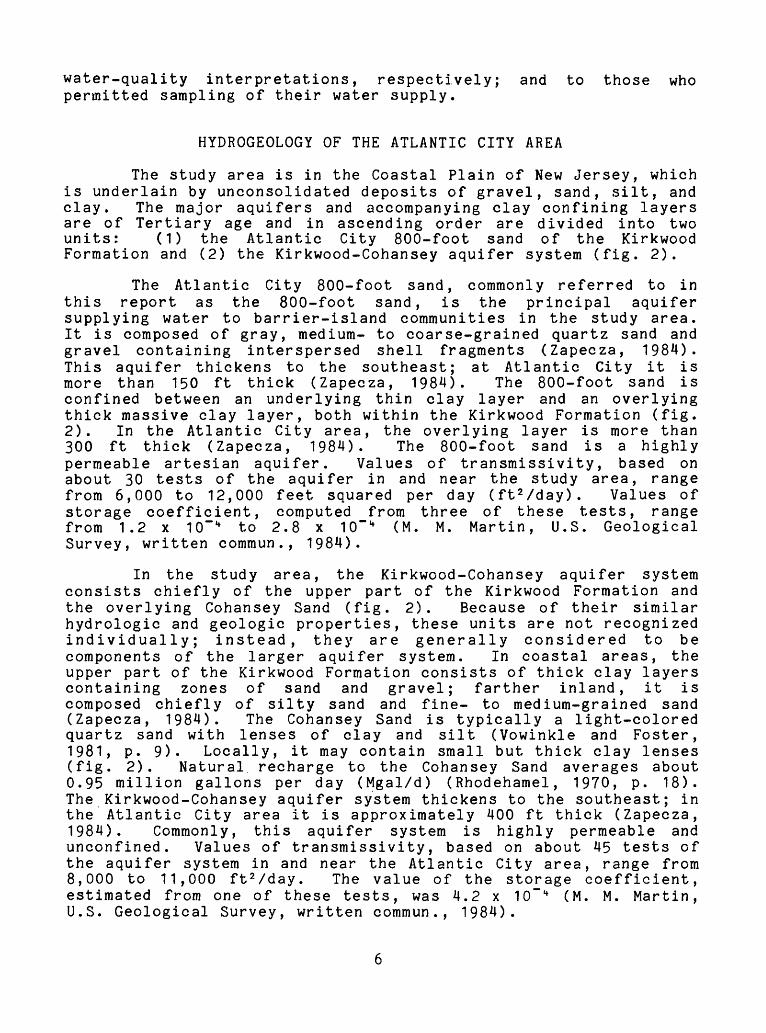
The study area is in the Coastal Plain of New Jersey, which is underlain by unconsolidated deposits of gravel, sand, silt, and clay. The major aquifers and accompanying clay confining layers are of Tertiary age and in ascending order are divided into two units: (1) the Atlantic City 800-foot sand of the Kirkwood Formation and (2) the Kirkwood-Cohansey aquifer system (fig. 2).
The Atlantic City 800-foot sand, commonly referred to in this report as the 800-foot sand, is the principal aquifer supplying water to barrier-island communities in the study area. It is composed of gray, medium- to coarse-grained quartz sand and gravel containing interspersed shell fragments (Zapecza, 1984). This aquifer thickens to the southeast; at Atlantic City it is more than 150 ft thick (Zapecza, 1984). The 800-foot sand is confined between an underlying thin clay layer and an overlying thick massive clay layer, both within the Kirkwood Formation (fig. 2). In the Atlantic City area, the overlying layer is more than 300 ft thick (Zapecza, 1984). The 800-foot sand is a highly permeable artesian aquifer. Values of transmissivity, based on about 30 tests of the aquifer in and near the study area, range from 6,000 to 12,000 feet squared per day (ftVday). Values of storage coefficient, computed from three of these tests, range from 1.2 x 10"" 1* to 2.8 x 10" 1* (M. M. Martin, U.S. Geological Survey, written commun., 1984).
In the study area, the Kirkwood-Cohansey aquifer system consists chiefly of the upper part of the Kirkwood Formation and the overlying Cohansey Sand (fig. 2). Because of their similar hydrologic and geologic properties, these units are not recognized individually; instead, they are generally considered to be components of the larger aquifer system. In coastal areas, the upper part of the Kirkwood Formation consists of thick clay layers containing zones of sand and gravel; farther inland, it is composed chiefly of silty sand and fine- to medium-grained sand (Zapecza, 1984). The Cohansey Sand is typically a light-colored quartz sand with lenses of clay and silt (Vowinkle and Foster, 1981, p. 9). Locally, it may contain small but thick clay lenses (fig. 2). Natural recharge to the Cohansey Sand averages about 0.95 million gallons per day (Mgal/d) (Rhodehamel, 1970, p. 18). The Kirkwood-Cohansey aquifer system thickens to the southeast; in the Atlantic City area it is approximately 400 ft thick (Zapecza, 1984). Commonly, this aquifer system is highly permeable and unconfined. Values of transmissivity, based on about 45 tests of the aquifer system in and near the Atlantic City area, range from 8,000 to 11,000 ft 2 /day. The value of the storage coefficient, estimated from one of these tests, was 4.2 x 10~ 4 (M. M. Martin, U.S. Geological Survey, written commun., 1984).
Not to
sc
ale
Figu
re 2. Block di
agra
m of th
e uppermost
Coastal
Plain
sediments
in southern Ne
w Jersey.
(Modified
from
Ha
rbau
gh an
d Ti
lley
, 1984)
Zapecza (1984) presents additional information on the hydrogeology of the Atlantic City area including maps and geologic sections showing the extent and thickness of the 800-foot sand and the Kirkwood-Cohansey aquifer system.
GROUND-WATER LEVELS
Regional Cone of Depression at Atlantic City
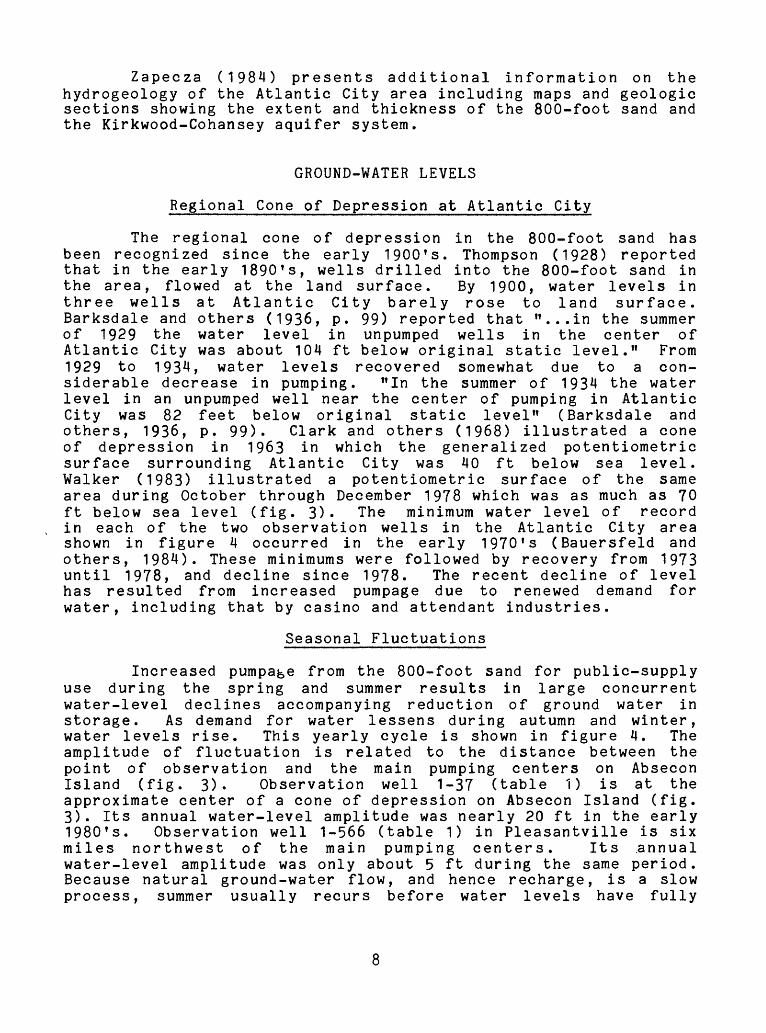
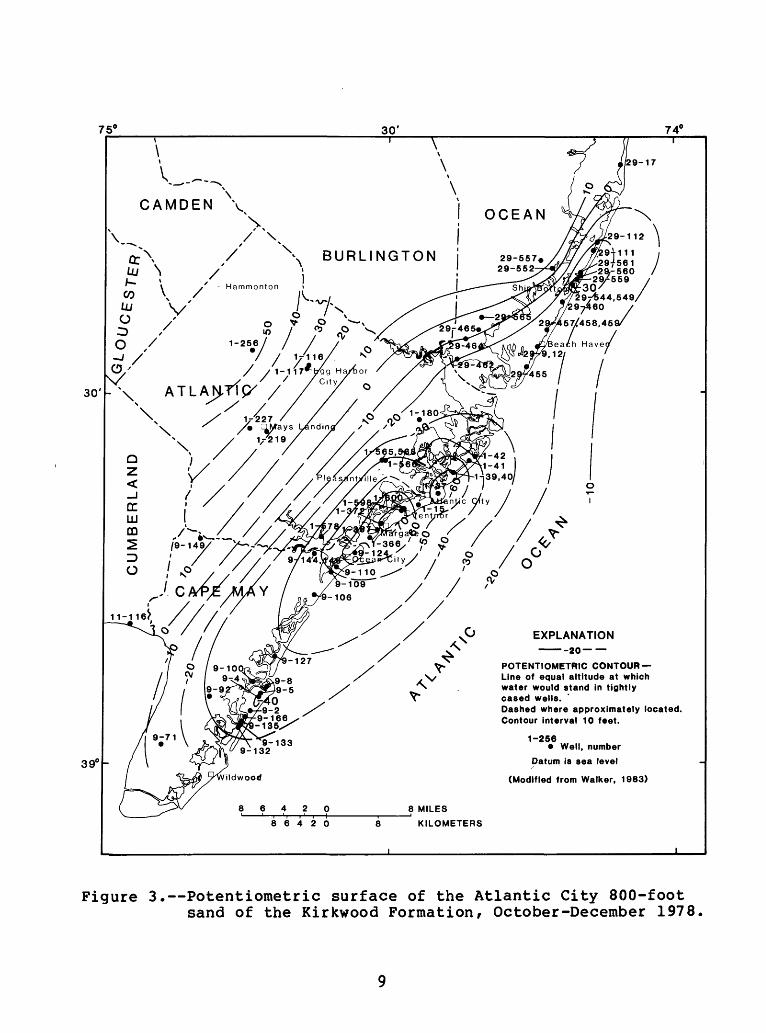
The regional cone of depression in the 800-foot sand has been recognized since the early 1900's. Thompson (1928) reported that in the early 1890's, wells drilled into the 800-foot sand in the area, flowed at the land surface. By 1900, water levels in three wells at Atlantic City barely rose to land surface. Barksdale and others (1936, p. 99) reported that "...in the summer of 1929 the water level in unpumped wells in the center of Atlantic City was about 104 ft below original static level." From 1929 to 1934, water levels recovered somewhat due to a con siderable decrease in pumping. "In the summer of 1934 the water level in an unpumped well near the center of pumping in Atlantic City was 82 feet below original static level" (Barksdale and others, 1936, p. 99). Clark and others (1968) illustrated a cone of depression in 1963 in which the generalized potentiometric surface surrounding Atlantic City was 40 ft below sea level. Walker (1983) illustrated a potentiometric surface of the same area during October through December 1978 which was as much as 70 ft below sea level (fig. 3). The minimum water level of record in each of the two observation wells in the Atlantic City area shown in figure 4 occurred in the early 1970 f s (Bauersfeld and others, 1984). These minimums were followed by recovery from 1973 until 1978, and decline since 1978. The recent decline of level has resulted from increased pumpage due to renewed demand for water, including that by casino and attendant industries.
Seasonal Fluctuations
Increased pumpa^e from the 800-foot sand for public-supply use during the spring and summer results in large concurrent water-level declines accompanying reduction of ground water in storage. As demand for water lessens during autumn and winter, water levels rise. This yearly cycle is shown in figure 4. The amplitude of fluctuation is related to the distance between the point of observation and the main pumping centers on Absecon Island (fig. 3). Observation well 1-37 (table 1) is at the approximate center of a cone of depression on Absecon Island (fig. 3). Its annual water-level amplitude was nearly 20 ft in the early 1980's. Observation well 1-566 (table 1) in Pleasantville is six miles northwest of the main pumping centers. Its .annual water-level amplitude was only about 5 ft during the same period. Because natural ground-water flow, and hence recharge, is a slow process, summer usually recurs before water levels have fully
75
C A M D E N
BURLINGTON
w / *> «° '-256/ / / / f
V / 1/16/ ^
EXPLANATION -20
POTENTIOMETRIC CONTOUR Line of equal altitude at which water would stand in tightly cased wells.Dashed where approximately located. Contour interval 10 feet.
Datum is sea level
(Modified from Walker, 1983)
Figure 3. Potentiometric surface of the Atlantic City 800-foot sand of the Kirkwood Formation, October-December 1978
01
ALTITUDE OF WATER LEVEL. IN FEET
H-
uaGn(D
i i
> ffi
M a Oi n3 O
O 0> t3
n tr H- £0n- < eo£3* £U O* aS ,D H-
O rf O 0) Q> M ft H- h-»o a>D <
a> o H> M» eo
a> 3 H»H» ft CO <
O COsro 2 o* < co3 (D
HH. <3 0>
ftM» H- H-O 03 3
CO
H-
3
ft
fc
WATER LEVEL. IN FEET BELOW LAND SURFACE
recovered. This accounts for the resumption of the long-term decline beginning in 1978 in observation well 1-37 and, in 1979, in the more distant well 1-566.
ALTERNATIVE SOURCES OF WATER
A significant increase in pumpage from the 800-foot sand will exacerbate water-level declines and could result in saltwater intrusion into the aquifer. A regional approach to water management is necessary to minimize such problems. Several options have been studied: (1) development of surface-water supplies, (2) development of ground-water supplies, (3) recharge to the 800-foot sand during low-demand periods to offset the seasonal pumping stress on the aquifer.
Thompson (1928) proposed a surface-water reservoir for storage of excess flow of Absecon Creek (fig. 1) to augment summer supplies. The Atlantic City Reservoir is not of sufficient capacity to supply the entire water needs of the ACMUA service area, although as much as 8 Mgal/d of water are withdrawn from the reservoir by that utility authority (John Snidenbach, ACMUA, oral commun., 1983) The water is finished at the filtration plant in Pleasantville and distributed through the ACMUA system. In the study area, additional fresh surface water is sparse. All streams are small, tidal, and help maintain the ecological balance of nearby marshes. The other reservoirs and lakes in Atlantic County are far from the coast and any prior rights to their water would restrict their use as an alternative supply.
Additional supplies of ground water for the study area are restricted to a few localities. Four ACMUA wells (see table 1 and fig. 1) are not 'in use because of the U.S. Environmental Protection Agency's concerns about Price's Landfill (fig. 1) (John Snidenbach, ACMUA. oral commun., 1984). Gray and Hoffman (1983, p. 9) report that these wells "are threatened by the landfill con tamination." The landfill was used for disposing of large quantities of uncontained toxic liquid chemicals between May 1971 and November 1972 (Gray and Hoffman, 1983)- The Cohansey Sand (Kirkwood-Cohansey aquifer system of this report) at Atlantic City contains brackish water (Thompson, 1928; Barksdale and others, 1936; Clark and others, 1968; Schaefer, 1983). Current (1984) data indicate that this aquifer is brackish throughout much or all of Absecon Island (F. L. Schaefer, U.S. Geological Survey, oral commun., 1984). Provisions of the National Parks and Recreation Act of 1978 and the New Jersey Pinelands Protection Act of 1979 creating the Pinelands Preservation Area (New Jersey Pinelands Commission, 1980) have limited the availability of sites for developing additional ground-water supplies to a narrow area along the coast.
The ACMUA has developed a new well field in the Kirkwood- Cohansey aquifer system (table 1) on the north side of the Atlantic City Reservoir, west of the Garden State Parkway
11
(fig. 1). Because the Kirkwood-Cohansey is a shallow aquifer system, it is much more vulnerable to contamination from toxic chemicals and leachate from landfills than is a deep confined aquifer such as the 800-foot sand. Additional study is needed to determine if other inland sites in the Kirkwood-Cohansey could be developed for alternative water supplies and safeguarded from contamination.
Another option for supplementing the water supply on Absecon Island is to artificially recharge the 800-foot sand during low-demand periods. This approach is discussed in detail in the next section of this report.
FEASIBILITY OF ARTIFICIAL RECHARGE
Artificial recharge to a ground-water system is a means of supplementing natural recharge. During low-demand periods excess water from the Atlantic City Reservoir that is otherwise discharged finally to the ocean, or water from the Kirkwood- Cohansey aquifer system could be recharged into the 800-foot sand. Augmented water in aquifer storage would then be available for withdrawal during high-demand periods.
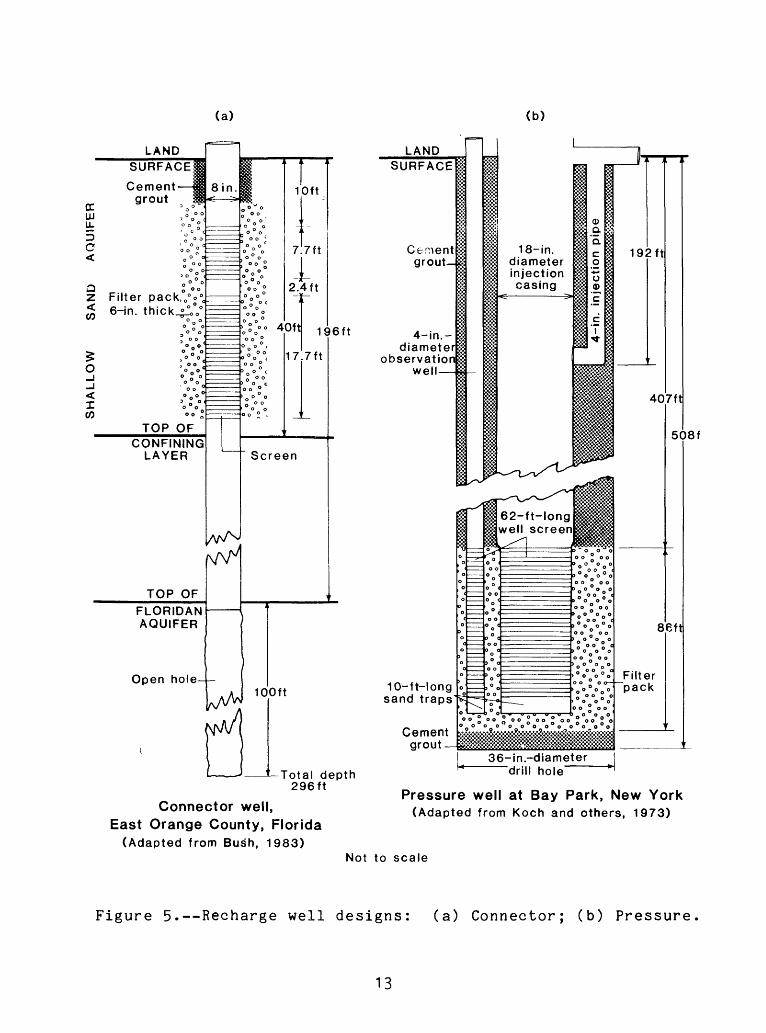
Confined aquifers can be artificially recharged using either a connector well system or a pressure recharge well system (fig. 5). The connector well (see following section) is generally smaller in diameter because it does not require a pump to force water into the receiving aquifer (Bush, 1983). The pressure recharge well (see section following connector-wells) is larger in diameter to accommodate a pump and injection pipes. Three possible ways of artificially recharging the 800-foot sand would be by (1) connector wells on the mainland, (2Y pressure recharge wells on the mainland, and (3) pressure recharge wells on Absecon Island .
Evaluation of Artificial-Recharge Procedures
Connector Wells
A connector recharge well is screened in two aquifers, allowing water to flow from one aquifer into the other using head differences between them as the driving force. For example, in Florida, Bush (1983) established an experimental 8-inch-diameter well screened in a shallow sand aquifer, cased through a confining layer, and finished as an open hole in cavernous limestone of the Floridan aquifer. The bottom of the shallow sand aquifer is MO feet (ft) below land surface, and the top of the Floridan aquifer is 196 ft below land surface. Total well depth was 296 ft. The head of water in the shallow aquifer was about 45 ft higher than that in the Floridan aquifer. Although the rate of recharge from the shallow sand aquifer to the Floridan aquifer varied as a result of seasonal head differences, it averaged about 50 gallons per minute (gal/min). Biological clogging of the screen by iron
12
(a) (b)
CO
LANDSURFACE!
Cement M
°°°°Vc' °~ o '
1Filter pack, 0°o° 6 in. thick_i_o 0°
0 0
3 °
> ° ° f' 0° °0 <
°n o °00°°
00°
TOP OFCONFINING
LAYER
TOP OF
FLORIDAN AQUIFER
Open hole-
8 in.
%
\|W
io °0Uo° ,
0° 0 °0
0°0
° ° 0
0 ° °0 c
> °°oo 4
0 ° 0° °<
o o o ° c
0° °
1
Scre<
1
1
100f1
1 1
I '10ft
7 7ft
12.4ft
/
Oft 1{
17 7ft
an
>6ft
'
t
fotal depth 296ft
Connector well, East Orange County, Florida
(Adapted from Bush, 1983)
LAND SURFACE
Cement grout si
Idiameter^ observation^
well M
18-in. diameter injectioncasing
~^3
192ft
508f
10-ft-long sand traps
Cement grout
36-in.-diameter drill hole
Pressure well at Bay Park, New York(Adapted from Koch and others, 1973)
Not to scale
Figure 5. Recharge well designs: (a) Connector; (b) Pressure.
13
bacteria progressively diminished the efficiency of this well; nevertheless, it performed satisfactorily until it was abandoned at the conclusion of the experiment.
In the study area, the connector-well design is unlikely to be effective. Many such wells would be needed to recharge at rates high enough to arrest or reverse the regional water-level decline. In addition, the amount of water of suitable quality available from the Kirkwood-Cohansey aquifer system in the area is limited. On the mainland, leachate from Price's Landfill has locally contaminated the aquifer system (Gray and Hoffman, 1983), and in much or all of Absecon Island, water in the Kirkwood-Cohansey system is brackish (Schaefer, 1983); thus, suitable sites for multiple connector recharge wells are limited. Maintenance of well screens would likely be difficult if pumps to backflush them were unavailable. Moreover, bacterial clogging would probably be difficult to control.
Pressure Recharge Wells
A pressure recharge system uses a pump to force water into the receiving aquifer. Experiments with irrigation water in Arkansas were designed to investigate problems encountered in such a system (Sniegocki 1963a, 1963b; Sniegocki and others, 1965). They showed that clogging of the well screen or filter pack re sulted from air entrainment, suspended material and microorganisms in the recharge water, and precipitates caused by chemical reac tions. Recharge operations were conducted only during the winter. Injection of water colder than the native ground water caused clogging and nonmixing with the native water due to the release of dissolved gases and differences in viscosity. Observation wells screened at various depths v/ere installed in the filter pack of the recharge well and at various other locations near that well. The observation-well layout enabled quick determination of clogging problems within and flow patterns near the recharge well.
Several recharge projects in the Atlantic Coastal Plain have been successful. In Norfolk, Virginia, Brown and Silvey (1977) found that physical clogging of the well screen resulted from dispersion of interstitial clay but they suppressed it by pretreating the aquifer with a chemical stabilizer. They concluded that storage of freshwater in a brackish-water aquifer and its subsequent retrieval are feasible in that area.
Probably the most widely known artificial recharge project in the Atlantic Coastal Plain is the "Long Island Project" at Bay Park, New York, which was conducted during the early 1970 T s. Tertiary-treated sewage was injected through a 480-foot-deep well into the lower part of the Magothy aquifer. The recharge facility was designed to pump water into and from the aquifer and to pump and surge the well for redevelopment. Various water-quality characteristics, constituents, and flow rates were monitored continuously. Eighteen observation wells were used to monitor the effects of injection on the geochemistry and other properties of
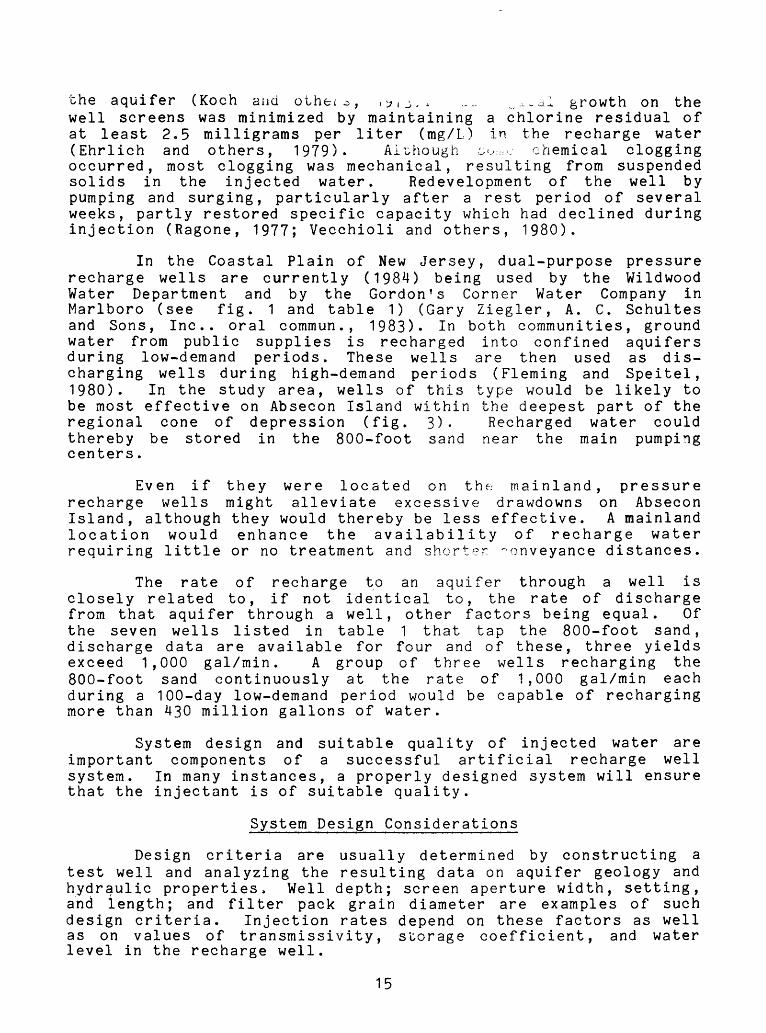
the aquifer (Koch and othei^, .*,_>,, .-.. ,.-^- growth on the well screens was minimized by maintaining a chlorine residual of at least 2.5 milligrams per liter (mg/L) in the recharge water (Ehrlich and others, 1979). Although su c chemical clogging occurred, most clogging was mechanical, resulting from suspended solids in the injected water. Redevelopment of the well by pumping and surging, particularly after a rest period of several weeks, partly restored specific capacity which had declined during injection (Ragone, 1977; Vecchioli and others, 1980).
In the Coastal Plain of New Jersey, dual-purpose pressure recharge wells are currently (1984) being used by the Wildwood Water Department and by the Gordon's Corner Water Company in Marlboro (see fig. 1 and table 1) (Gary Ziegler, A. C. Schultes and Sons, Inc.. oral commun., 1983). In both communities, ground water from public supplies is recharged into confined aquifers during low-demand periods. These wells are then used as dis charging wells during high-demand periods (Fleming and Speitel, 1980). In the study area, wells of this type would be likely to be most effective on Absecon Island within the deepest part of the regional cone of depression (fig. 3). Recharged water could thereby be stored in the 800-foot sand near the main pumping centers.
Even if they were located on the mainland, pressure recharge wells might alleviate excessive drawdowns on Absecon Island, although they would thereby be less effective. A mainland location would enhance the availability of recharge water requiring little or no treatment and shorter ^onveyance distances.
The rate of recharge to an aquifer through a well is closely related to, if not identical to, the rate of discharge from that aquifer through a well, other factors being equal. Of the seven wells listed in table 1 that tap the 800-foot sand, discharge data are available for four and of these, three yields exceed 1,000 gal/min. A group of three wells recharging the 800-foot sand continuously at the rate of 1,000 gal/min each during a 100-day low-demand period would be capable of recharging more than 430 million gallons of water.
System design and suitable quality of injected water are important components of a successful artificial recharge well system. In many instances, a properly designed system will ensure that the injectant is of suitable quality.
System Design Considerations
Design criteria are usually determined by constructing a test well and analyzing the resulting data on aquifer geology and hydraulic properties, Well depth; screen aperture width, setting, and length; and filter pack grain diameter are examples of such design criteria. Injection rates depend on these factors as well as on values of transmissivity, storage coefficient, and water level in the recharge well.
15
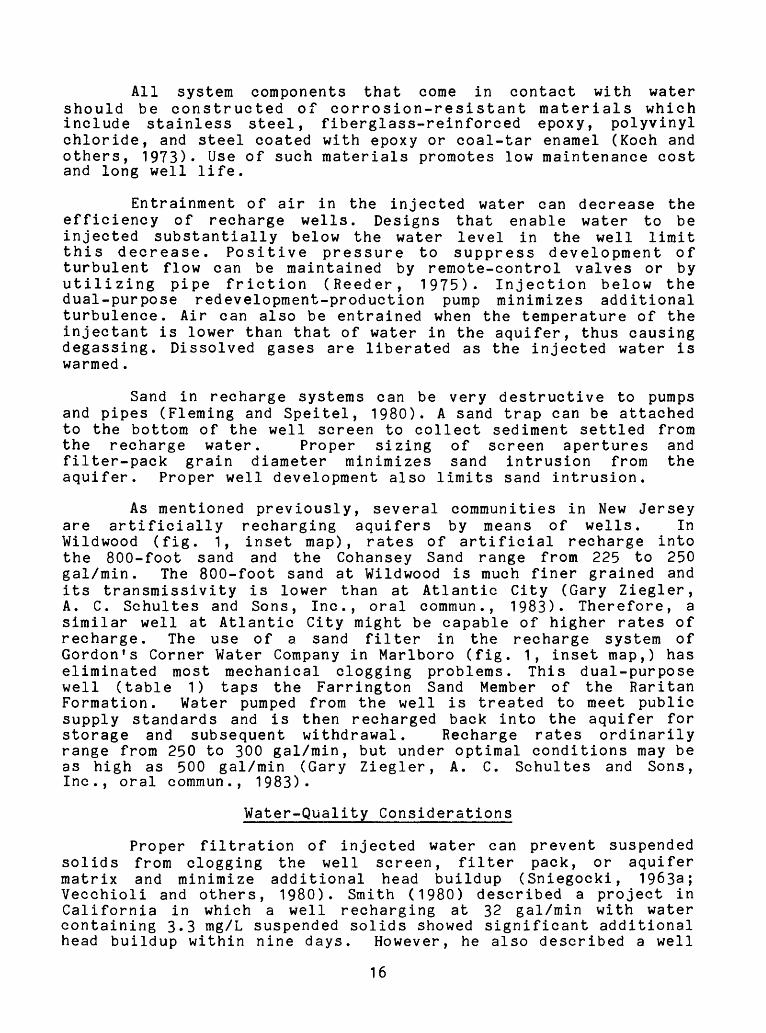
All system components that come in contact with water should be constructed of corrosion-resistant materials which include stainless steel, fiberglass-reinforced epoxy, polyvinyl chloride, and steel coated with epoxy or coal-tar enamel (Koch and others, 1973)* Use of such materials promotes low maintenance cost and long well life.
Entrainment of air in the injected water can decrease the efficiency of recharge wells. Designs that enable water to be injected substantially below the water level in the well limit this decrease. Positive pressure to suppress development of turbulent flow can be maintained by remote-control valves or by utilizing pipe friction (Reeder, 1975). Injection below the dual-purpose redevelopment-production pump minimizes additional turbulence. Air can also be entrained when the temperature of the injectant is lower than that of water in the aquifer, thus causing degassing. Dissolved gases are liberated as the injected water is warmed.
Sand in recharge systems can be very destructive to pumps and pipes (Fleming and Speitel, 1980). A sand trap can be attached to the bottom of the well screen to collect sediment settled from the recharge water. Proper sizing of screen apertures and filter-pack grain diameter minimizes sand intrusion from the aquifer. Proper well development also limits sand intrusion.
As mentioned previously, several communities in New Jersey are artificially recharging aquifers by means of wells. In Wildwood (fig. 1, inset map), rates of artificial recharge into the 800-foot sand and the Cohansey Sand range from 225 to 250 gal/min. The 800-foot sand at Wildwood is much finer grained and its transmissivity is lower than at Atlantic City (Gary Ziegler, A. C. Schultes and Sons, Inc., oral commun., 1983). Therefore, a similar well at Atlantic City might be capable of higher rates of recharge. The use of a sand filter in the recharge system of Gordon's Corner Water Company in Marlboro (fig. 1, inset map,) has eliminated most mechanical clogging problems. This dual-purpose well (table 1) taps the Farrington Sand Member of the Raritan Formation. Water pumped from the well is treated to meet public supply standards and is then recharged back into the aquifer for storage and subsequent withdrawal. Recharge rates ordinarily range from 250 to 300 gal/min, but under optimal conditions may be as high as 500 gal/min (Gary Ziegler, A. C. Schultes and Sons, Inc., oral commun., 1983).
Water-Quality Considerations
Proper filtration of injected water can prevent suspended solids from clogging the well screen, filter pack, or aquifer matrix and minimize additional head buildup (Sniegocki, 1963a; Vecchioli and others, 1980). Smith (1980) described a project in California in which a well recharging at 32 gal/min with water containing 3.3 mg/L suspended solids showed significant additional head buildup within nine days. However, he also described a well
16

in Nebraska recharging at 750 gal/min for six months with water containing 0.004 mg/L suspended solids which had only minimal additional head buildup.
Potential problems of artificially recharging aquifers in the study area may be minimized by controlling the quality of injected water. Such water should be free of or very low in constituents and characteristics that could harm the recharge system or degrade the quality of water in the receiving aquifer. Reduction of air entrainment, sand, and other suspended solids through proper system design have been discussed previously. Another factor to be considered is biological growth, which is a potential well-screen clogging problem, particularly when surface supplies are the source of recharge water. Such clogging may be minimized by maintaining in the recharge water a chlorine residual of at least 2.5 mg/L (Ehrlich and others, 1979). Recharge operations would likely take place mostly during the winter, and viscosity differences resulting from the difference in temperature between injectant and native ground water may hinder flow into the aquifer (Sniegocki, 1963b; Ragone, 1977). Cold water is more viscous than warm water and does not flow as readily.
The limited chemical analyses in table 2 suggest that at least some of the water distributed to Atlantic City may have been unsuitable for recharge without treatment. Water samples were collected in January and April 1983 at two and four sites, respectively (see fig. 1 for site locations). The samples ranged in pH from 7.1 to 9.2. The difference in pH of 0.9 unit between water at the treatment plant and at the Atlantic City Central Junior High School on the same date suggests that water quality may vary within the ACMUA transmission main. Suspended solids concentrations ranged from 0.5 to 1.0 mg/L. Vecchioli and others (1980) reported that the severity of clogging of the well screen at the Bay Park, New York, recharge site increased significantly whenever the suspended solids concentration in the recharge water exceeded 1.0 mg/L. Therefore, water from the representative municipal system described In this report, as well as that from other local systems may at times require treatment if they are to be used for recharge.
Mixtures of water in various proportions from the 800-foot sand and the ACMUA distribution system as sampled at the Atlantic City Central Junior High School may become supersaturated with oxygen (L. L. Knobel, U.S. Geological Survey, oral commun., 1983). Oxygen is highly reactive and would probably react immediately with various minerals in the receiving aquifer, resulting in mineral oxidation arid precipitation. Temperature differences of 10-15°C between the two waters during winter may cause degassing of oxygen and other gases as the injectant warms, likely reducing injection efficiency.
Detailed analyses of the chemical quality of the intendedinjectant and native ground water at the recharge site would beneeded to determine if the two will mix favorably. These analyses
17
would also indicate any changes in the quality of native ground water since samples were collected in 1983 (table 2). Detailed study of the mineralogy of the 800-foot sand would also be needed to predict likely effects of introducing oxygenated water of mixed origin into that aquifer.
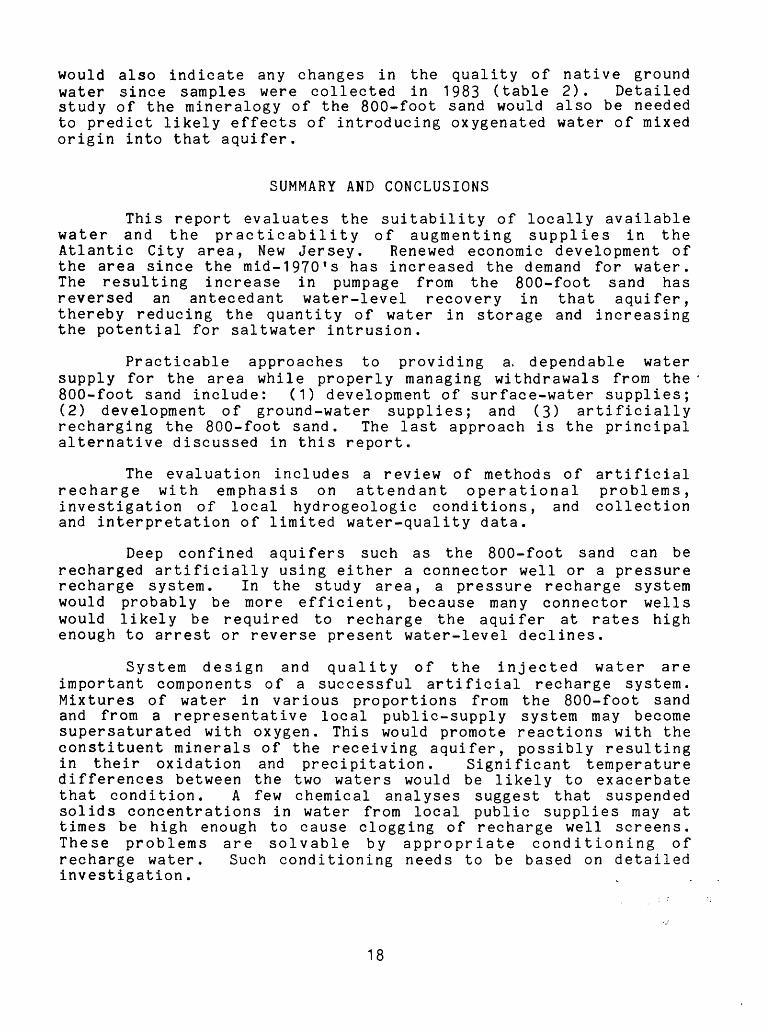
SUMMARY AND CONCLUSIONS
This report evaluates the suitability of locally available water and the practicability of augmenting supplies in the Atlantic City area, New Jersey. Renewed economic development of the area since the mid-1970 f s has increased the demand for water. The resulting increase in pumpage from the 800-foot sand has reversed an antecedant water-level recovery in that aquifer, thereby reducing the quantity of water in storage and increasing the potential for saltwater intrusion.
Practicable approaches to providing a, dependable water supply for the area while properly managing withdrawals from the 800-foot sand include: (1) development of surface-water supplies; (2) development of ground-water supplies; and (3) artificially recharging the 800-foot sand. The last approach is the principal alternative discussed in this report.
The evaluation includes a review of methods of artificial recharge with emphasis on attendant operational problems, investigation of local hydrogeologic conditions, and collection and interpretation of limited water-quality data.
Deep confined aquifers such as the 800-foot sand can be recharged artificially using either a connector well or a pressure recharge system. In the study area, a pressure recharge system would probably be more efficient, because many connector wells would likely be required to recharge the aquifer at rates high enough to arrest or reverse present water-level declines.
System design and quality of the injected water are important components of a successful artificial recharge system. Mixtures of water in various proportions from the 800-foot sand and from a representative local public-supply system may become supersaturated with oxygen. This would promote reactions with the constituent minerals of the receiving aquifer, possibly resulting in their oxidation and precipitation. Significant temperature differences between the two waters would be likely to exacerbate that condition. A few chemical analyses suggest that suspended solids concentrations in water from local public supplies may at times be high enough to cause clogging of recharge well screens. These problems are solvable by appropriate conditioning of recharge water. Such conditioning needs to be based on detailed investigation.
18
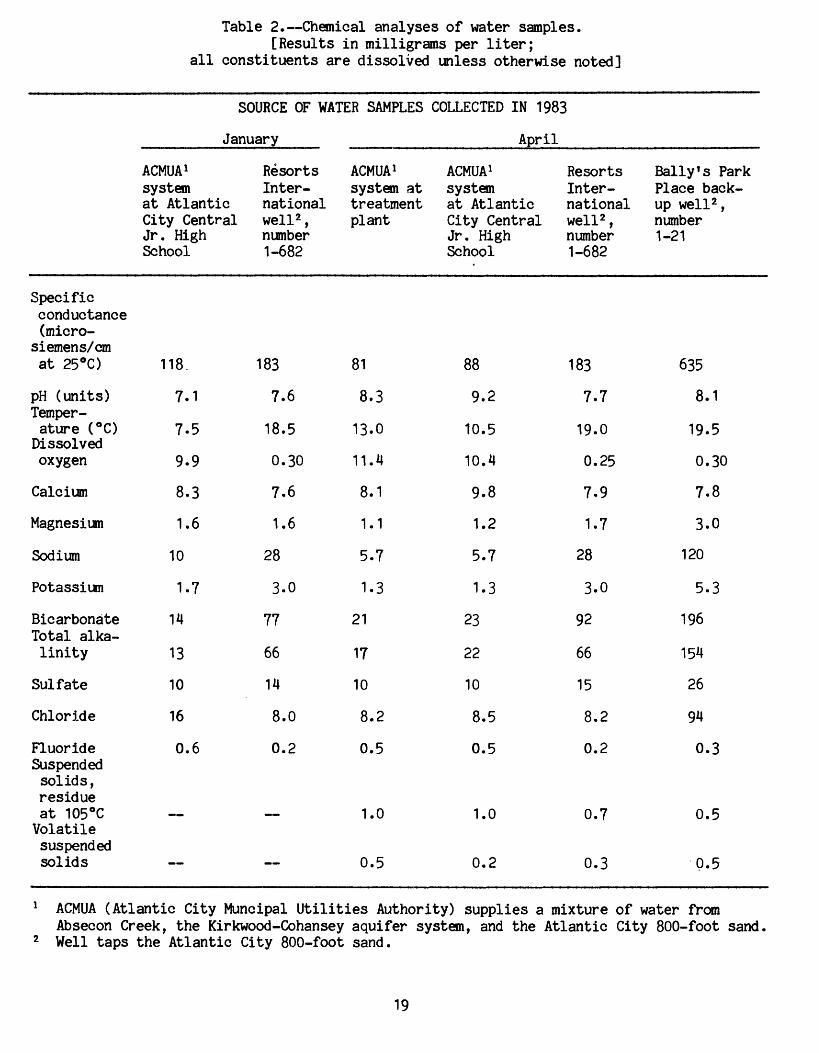
Table 2. Chemical analyses of water samples.[Results in milligrams per liter;
all constituents are dissolved unless otherwise noted]
SOURCE OF WATER SAMPLES COLLECTED IN 1983
January April
Specificconductance(micro-
siemens/cmat 25°C)
pH (units)Temperature (°C)
Dissolvedoxygen
Calcium
Magnesium
Sodium
Potassium
BicarbonateTotal alkalinity
Sulfate
Chloride
FluorideSuspendedsolids,residueat 105°C
Volatilesuspendedsolids
ACMUA 1systemat AtlanticCity CentralJr. HighSchool
118
7.1
7.5
9.9
8.3
1.6
10
1.7
14
13
10
16
0.6
ResortsInternationalwell 2 ,number1-682
183
7.6
18.5
0.30
7.6
1.6
28
3.0
77
66
14
8.0
0.2
ACMUA 1system attreatmentplant
81
8.3
13.0
11.4
8.1
1.1
5.7
1.3
21
17
10
8.2
0.5
1.0
0.5
ACMUA1systemat AtlanticCity CentralJr. HighSchool
88
9.2
10.5
10.4
9.8
1.2
5.7
1.3
23
22
10
8.5
0.5
1.0
0.2
ResortsInternationalwell 2 ,number1-682
183
7.7
19.0
0.25
7.9
1.7
28
3.0
92
66
15
8.2
0.2
0.7
0.3
Bally f s ParkPlace backup well 2 ,number1-21
635
8.1
19.5
0.30
7.8
3.0
120
5.3
196
154
26
94
0.3
0.5
0.5
1 ACMUA (Atlantic City Muncipal Utilities Authority) supplies a mixture of water fromAbsecon Creek, the Kirkwood-Cohansey aquifer system, and the Atlantic City 800-foot sand.
2 Well taps the Atlantic City 800-foot sand.
19
REFERENCES CITED
Barksdale, H. C., Sundstrom, R. W., and Brunstein, M. S. , 1936, Supplementary report on -the ground-water supplies of the Atlantic City region: New Jersey Department of Conservation and Economic Development Special Report 6, 139 p.
Bauersfeld, W. R., Moshinsky, E. W., Pustay, E. A., and Schaefer, F. L., 1984, Water resources data for New Jersey, water year 1983, volume 1; Atlantic Slope Basins, Hudson River to Cape May: U.S. Geological Survey Water-Data Report NJ-83-1, 328 p.
Brown, D. L., and Silvey, W. D., 1977, Artificial recharge to a freshwater-sensitive brackish-water sand aquifer, Norfolk, Virginia: U.S. Geological Survey Professional Paper 939, 53 p.
Bush, P. W., 1983, Connector well experiment to recharge the Floridan Aquifer, East Orange County, Florida: U.S. Geological Survey Water-Supply Paper 2210, 26 p.
Clark, G. A., Meisler, Harold, Rhodehamel, E. C., and Gill, H. E., 1968, Summary of ground-water resources of Atlantic County, New Jersey, with special reference to public water supplies: New Jersey Department of Conservation and Economic Development Water Resources Circular 18, 53 p.
Ehrlich, G, G., Ku, H. F. H., Vecchioli, John, and Ehlke, T. A., 1979, Microbiological effects of recharging the Magothy aquifer at Bay Park, New York, with tertiary-treated sewage: U.S. Geological Surey Professional Paper 751-E, 18 p.
Fleming, W. H., Jr., and Speitel, G. E., 1980, Dual recharge well for water supply stabilization, in National Conference on Environmental Engineering, New York, July 1980, Proceedings: American Society of Civil Engineers, p. 257-266.
Gray, W. G., and Hoffman, J. L., 1983, A numerical model study of ground-water contamination from Price's Landfill, New Jersey - I. Data base and flow simulation, Ground Water, v. 21, no. 1, p. 7-14.
Harbaugh, A. W. , and Tilley, C. L., 1984, Steady-state computer model of the water-table aquifer in the Mullica River Basin, the Pine Barrens, New Jersey: U.S. Geological Survey Water- Resources Investigations Report 84-4295, 38 p.
Koch, Ellis, Giaimo, A. A., and Sulam, D. J., 1973, Design and operation of the artificial-recharge plant at Bay Park, New York: U.S. Geological Survey Professional Paper 751-B, 14 p.
Ludlum, D. M., 1983, The New Jersey weather book, Rutgers University Press, New Brunswick, New Jersey, 252 p.
20
REFERENCES CITED Continued
New Jersey Pinelands Commission, 1980, Comprehensive management plan for the Pinelands National Reserve and Pinelands Area: New Jersey Pinelands Commission, New Lisbon, N.J., 446 p.
Ragone, S. E., 1977, Geochemical effects of recharging the Magothy aquifer, Bay Park, New York, with tertiary-treated sewage: U.S. Geological Survey Professional -Paper 751-D, 22 p.
Reeder, H. 0., 1975, In jection-^pipe system recharge: U.S. Geological Survey Journal of no. 4, p. 501-503.
for artificial Research, v. 3,
Rhodehamel, E. C., 1970, A hydrologic analysis of the New Jersey Pine Barrens region: New Jersey Department of Environmental Protection Water Resources Circular 22, 35 p.
Schaefer, F. L., 1983, Distribution of chloride concentrations in the principle aquifers of the New Jersey Coastal Plain, 1977- 81: U.S. Geological Survey Water-Resources Investigations Report 83-4061 , 56 p.
Signor, D. C., Growitz, D. J., and Kam, William, 1970, Annotated bibliography on artificial recharge of ground water, 1955-67: U.S. Geological Survey Water-Supply Paper 1990, 141 p.
Smith, A. J., 1980, Design is the key to a good recharge well: The Johnson Drillers Journal, March-April 1980, p. 8-11.
Sniegocki, R. T., 1963a, Problems in artificial recharge through wells in the Grand Prairie region, Arkansas: U.S. Geological Survey Water-Supply Paper 1615-F, 25 p.
________, 1963b, Geochemical aspects of artificial recharge in the Grand Prairie region, Arkansas: U.S. Geological Survey Water-Supply Paper 1615-E, 41 p.
Sniegocki, R. T., Bayley, J. W., 1965, Testing artificial recharge: Paper 1615-G, 56 p.
F. H., Ill, Englic, Kyle, and Stephens,procedures and results of studies ofU.S. Geological Survey Water-Supply
Thompson, D. G., 1928, Ground water supplies of the Atlantic City region: New Jersey Department of Conservation and Development Bulletin 30, 138 p.
Todd, D. K., 1959, Annotated bibliography on artificial recharge of ground water through 1954: U.S. Geological Survey Water-Supply Paper 1477, 115 p.
21
REFERENCES CITED Continued
Vecchioli, John, Ku, H. F. H., and Sulam, D. J., 1980, Hydraulic effects of recharging the Magothy aquifer, Bay Park, New York, with tertiary-treated sewage: U.S. Geological Survey Professional Paper 751-F, 21 p.
Vowinkel, E. F., and Foster, W. K., 1981, Hydrogeologic conditions in the Coastal Plain of New Jersey: U.S. Geological Survey Open-File Report 81-405, 39 p.
Walker, R. L., 1983, Evaluation of water levels in major aquifers of the New Jersey Coastal Plain, 1978: U.S. Geological Survey Water-Resources Investigations Report 82-4077, 56 p.
Zapecza, 0. S., 1984, Hydrogeologic framework of the New Jersey Coastal Plain: U.S. Geological Survey Open-File Report 84-730, [in press].
22
GLOSSARY
Aquifer. A formation, group of formations, or part of a formation that contains sufficient saturated permeable material to yield significant quantities of water to wells and springs.
Brackish water. Water intermediate in salinity between freshwater and saltwater.
Cone of depression. An indentation produced in the potentiometric surface or wa~ter table by the withdrawal of water from an aquifer; it has the general shape of an inverted cone with its apex at the area of greatest pumping.
Confining layer. A body of relatively impermeable material overlying or underlying one or more aquifers. The hydraulic conductivity of the confining layer may range from nearly zero to some value distinctly lower than that of the aquifer.
Dissolved. As used in this report refers to that material in a representative water sample that passes through a 0.45-micrometer membrane filter.
Evapotranspiration. Water discharged from land areas by evapora tion from water surfaces and moist soil plus transpiration by plants.
Filter pack. An envelope of coarse sand or gravel emplaced around a well screen. It increases the effective diameter of the well and helps prevent clogging of the screen.
Head, static. The height above a standard datum of the surface of a column of water (or other liquid) that can be supported by the static pressure at a given point. The term head, as used in this report, means static head.
Hydraulic conductivity. The volume of water at the prevailing kinematic viscosity that will move in unit time under a unit hydraulic gradient through a unit area measured at right angles to the direction of flow. Formerly called field coefficient of permeability.
Hydraulic gradient. The change in static head per unit of distance in a given direction. If not specified, the direction is customarily that of the maximum rate of decrease in head.
Milligrams per liter (mg/L). A unit expressing the concentration of chemical constituents in solution as the mass (milligram) of solute per unit volume (liter) of water. One mg/L is approximately equal to 1 part per million (ppm) in aqueous solutions of low dissolved-solids concentration.
23

GLOSSARY Continued
National Geodetic Vertical Datum of 1929 (NGVD of 1929). A geodetic datum derived from a general adjustment of the first order level nets of both the United States and Canada, formerly called mean sea level. NGVD of 1929 is referred to as sea level in this report.
Potentiometric surface. A surface which represents the static head in an aquifer. It is defined by the levels to which water will rise in tightly cased wells. See also "head, static".
Saltwater. Water containing appproximately 35,000 mg/L of dissolved solids, including about 19,000 mg/L of chloride.
Saltwater intrusion. The movement of brackish water or saltwater into a freshwater aquifer due to the lowering of the freshwater head below sea level by pumping.
Specific capacity. Of a well is the rate of discharge (gal/min) of water from the well divided by the drawdown (foot) of water level in the well. Specific capacity usually decreases slowly as the duration of pumping increases.
Specific conductance. A measure of the ability of a water to conduct an electrical current and is expressed in microsiemens per centimeter at 25°C. Because specific conductance is related to the number and specific chemical types of ions in solution, it may be used for approximating the dissolved- solids concentration in water. Commonly, the concentration of dissolved solids in milligrams per liter is about 65 percent of the specific conductance in microsiemens per centimeter at 25°C. However, this relation may vary with source and composition of the water.
Storage coefficient. The volume of water an aquifer releases from or takes into storage per unit surface area of the aquifer per unit change in head.
Tertiary. The geologic period dating from 65 to 1.8 million years before present.
Transmissivity. The rate at which water of the prevailing kinematic viscosity moves through a unit width of aquifer under a unit hydraulic gradient. Transmissivity equals the hydraulic conductivity of an aquifer multiplied by its saturated thickness.
Water year. The twelve-month period, October 1 through September 30, designated by the calendar year in which it ends.
A U.S. Government Printing Office: 1985 517-331