%&7&-01.&/5 0' $*5*;&/ 4$*&/$& 85&3 3&4063$& .0/*503 ...
167
Transcript of %&7&-01.&/5 0' $*5*;&/ 4$*&/$& 85&3 3&4063$& .0/*503 ...


Development of Citizen Science Water Resource Monitoring Tools and
Communities of Practice for South Africa, Africa and the World
Mark Graham & Jim Taylor
WRC Report No. TT 763/18
September

ii
Obtainable from Water Research Commission Private Bag X03 GEZINA, 0031 [email protected] or download from www.wrc.org.za The publication of this report emanates from a project titled Development of Citizen Science Water Resource Monitoring Tools and Communities of Practice for South Africa, Africa and the World (WRC Project No. K5/2350). This report is supplemented with an inserted USB at the back containing 19 Appendices related to the report.
DISCLAIMER This report has been reviewed by the Water Research Commission (WRC) and approved for
publication. Approval does not signify that the contents necessarily reflect the views and policies of the WRC nor does mention of trade names or commercial product constitute
endorsement or recommendation for use.
ISBN 978-0-6392-0030-9 Printed in the Republic of South Africa © Water Research Commission

iii

iv
This page was deliberately left blank

v
EXECUTIVE SUMMARY ‘Environmental pollution, from filthy air to contaminated water, is killing more people every year than all the war and violence in the world. One out of every six premature deaths in the world in 2015 (about 9 million) can be attributed to disease from toxic exposure’ – The Lancet Medical Journal.
Water is the life-blood of every nation. In South Africa freshwater and estuarine ecosystems are highly threatened. Concerted efforts to ‘turn the situation around’ are simply not working and water quality, quantity and indeed social equity issues remain a top priority for South Africa’s future well-being. Human-created problems require human-centred solutions and these require different ways of thinking to those that created the problems. Africa is a continent with rich biodiversity, ecological infrastructure and strong traditional social connections, yet it is often cast as a continent with an obscure future. Whilst one cannot argue against the immense challenges facing Africa there are definite grounds to assume a more positive outlook and draw on the good-will and ground-breaking research opportunities that are starting to turn this situation around. The democratisation of science, through citizen science processes, supported by practical and accessible ‘tools of science’, is one area of work that is showing encouraging results. The essence of this research project was in finding and developing appropriate citizen science tools, interventions and social processes so as to better respond to the challenges around water resources within our region. An exciting social movement is developing in partnership with this research project. An example of this is how miniSASS (one of the leading tools), has supported people around the world to engage in an experience of investigating and taking action around local streams and rivers. miniSASS has also been the basis of the fieldwork component of the Leadership Seminars, which are offered by WESSA in partnership with CoGTA. These seminars support Councillors and Traditional Leaders to understand and engage with local catchment and water supply issues. As noted by the former deputy minister of Water and Sanitation (Pam Tshwete) after she had undertaken a miniSASS experiment: “with miniSASS, I became a scientist for the day!” The focus of this project is reflected in the challenges and disconnection between civil society and water resource management in southern Africa. Pollution from industry and domestic households, increased infestation of alien/invasive plant species and the increased enrichment of nutrients within fresh water systems are just a few of the many examples reducing catchment health and resilience. Complexities increase when transboundary catchment management is required to manage the pressures and demands placed on water resources as observed in many of South Africa’s catchments. While the challenges persist, and indeed become more complex, the authorities generally do not have sufficient capacity to monitor, manage and overcome the issues. In addition, a significant divide between the various stakeholder groups exists, e.g. between scientists, government, NGOs, private organizations, civil society and nation states sharing river basins. This typically dampens integrative solutions and catchment management on a broad scale.
This project researched the potential for citizen science to effect meaningful change in water resource management and thus work towards improved catchment conditions. The vision is one of citizens who are able to go beyond awareness-raising, to more tangible, action-taking processes of co-managing their water resources. Most encouraging about the research is the manner in which it has achieved an encouraging impact at a global, regional and local level. These impacts are outlined later on in this executive summary. In order to harness the rising enthusiasm from a wide range of groups, to better understand the health of their catchments and to meet societal needs where they are most required, this research project focused on exploring different social change models of learning and educational change, as well as a suite of possible tools. Such tools can then be used to engage with the various aspects of water resources in the southern African context. These emerging orientations included public mobilisation and the democratisation of science (citizen science) and water-related understanding as an emerging response to the water crisis.

vi
Citizen science (CS) is described as a form of public participation in scientific investigations – seeking answers, collecting data or analysing results (Miller-Rushing et al., 2012; Tweddle et al., 2012). Wikipedia defines it as:
“Citizen Science (also known as crowd science, crowd-sourced science, civic science, or networked science) is scientific research conducted, in whole or in part, by amateur or nonprofessional scientists, often by crowd sourcing and crowd funding. Formally, citizen science has been defined as "the systematic collection and analysis of data; development of technology; testing of natural phenomena; and the dissemination of these activities by researchers on primarily a vocational basis". Citizen science is sometimes called "public participation in scientific research."
In many instances, it is a concept growing in popularity and interest in many scientific and social circles across the globe. What is relevant to this project is the concept of engaging with citizen scientists to improve catchment management within southern Africa, particularly with respect to their ability to improve understanding, both from the bottom-up (citizens understanding of catchment issues and societies impacts on water resources), but also from the top-down (authorities understanding where there are key resource issues and problems). This project seeks to understand the underlying socio-ecological processes driving both management and mismanagement within catchments. For the purpose of producing a socially applicable and sound ideological foundation for the project, a range of social change theories have been assessed and accordingly modified or adapted to address the above research question.
Study aims
This project researched the potential for citizen science to effect meaningful change in water resource management. The premise is that if citizens' knowledge of water resources (and associated impacts) is improved, the greater understanding and insight as to the state of their resources empowers them to interact with authorities and co-manage their resources in a more meaningful way. The research shows that where the learning included an action component, such as investigating and addressing issues at a local level/stream, the outcome of more informed action-taking was much more likely, than if it was merely an awareness raising exercise. This engaged action-taking will, in turn, effect greater change and better management of resources. The specific project outcomes include the following:
1. In collaboration with partners in South Africa and involving neighbouring trans-boundary countries, existing and new rapid tools for citizen and school-learner monitoring of water resource and catchment health indicators were identified and developed.
2. Citizen science in relation to wetlands, estuaries and springs was researched and a framework was produced for the development of citizen science monitoring tools covering wetlands, estuaries and springs in southern Africa.
3. The developed tools were packaged into an integrated water resource & catchment monitoring toolkit, known as ‘Capacity for Catchments’ for roll-out within South Africa and neighbouring countries. Web-based monitoring tools, including the use of mobile phone functionality to facilitate wider access to the developed citizen science monitoring tools, were explored with some success.
4. School lesson plans were developed as a component of the tool-kit and these materials were integrated into the school curriculum.
5. The developed toolkit to promote citizen and school level education was disseminated and awareness of catchment and river health issues were engaged with.
6. Through dissemination and application of the toolkit, the growth of trans-boundary citizen science covering water resource health within South Africa, neighbouring countries and beyond was initiated.
7. Through the collaboration with specialists and the dissemination of the toolkit, research was fostered around trans-boundary water resource management at a citizen level.
8. The successes and barriers to the application of the citizen science tools in effecting meaningful change in the challenges of trans-boundary water resource management was assessed and engaged

vii
with. 9. Capacity building and research was applied to MSc students and a PhD student through this research
project. This was done to research the development of a “Community of Practice” within the citizen science water resources sector, and to facilitate the implementation and use of citizen science tools developed through the project.
10. A “Capacity for Catchments” portal as an access point for broader society to engage with and use citizen science water resource monitoring tools was developed to support Citizen Science monitoring programmes around the country.
Although the project was specified as a transboundary project within southern Africa, which includes South Africa, Namibia, Botswana, Zimbabwe, Lesotho, Swaziland and Mozambique, the project has encompassed work in the greater Southern African Development Community (SADC) region.
The development of social learning models and Citizen Science tools
Social learning orientations The project explored different social change orientations. It also developed a suite of possible tools to engage with the various aspects of water resources in the southern African context. More specifically the project responded to the research question “can we improve the management of water resources through the use of innovative citizen science tools and interventions to engage with, measure and better understand the health of catchments?” Closely linked to this research question is an assessment of successes and barriers to the application of the citizen science tools in effecting meaningful change in the challenges of trans-boundary water resource management. Where possible, case studies were interrogated to ensure that our findings are corroborated with situated research experience. The notion of ‘giving away the tools of science’ within a citizen science context is a particular development that this project illustrates. A key goal was the development of citizen science tools and processes to develop a public-spirited understanding of water related issues and risks and how society may best respond to them. An open process framework was used to support an engagement of participants in fieldwork activities. This initial framework or model has, at its core, the idea of a “nexus or matter of concern” which is the focus or issue which is being addressed. Supporting the “matter of concern” are the 5 T’s, which include “Tuning In, Talk, Touch, Think & Take action”. This open process and Action Learning model was used and developed as the underpinning philosophical orientation to the engagements and training around the use of the citizen science tools. Indeed, UNESCO have adopted this concept and are applying it in a forthcoming publication entitled Education on the Move (UNESCO, 2018). As the risks to water resources increase, so more effective learning and teaching is required. This project found that approaches to social change that are more inclusive and action-orientated are more likely to be successful than the more passive awareness raising exercises. Various members of this project team have been invited or have presented the citizen science tools in countries such as Tanzania and six other SADC member states, in Finland, India, Mexico, Brazil, Germany, Korea, Italy and Canada. To a greater or lesser extent, the uptake of some or other of the tools has occurred in all these countries. It is perhaps significant to note that the travel and accommodation by project staff to share the tools in the SADC region, and indeed world-wide, were all covered by the organisations that extended the invitations to share the concepts. The world-wide impact thus occurred at no direct cost to the WRC project itself.

viii
The Citizen Science tools The key objective of this research project was to develop a suite of tools for use in community-based water resource monitoring. The development, and in some cases the adaptation, of the tools was based on the review and assessment of key water resource types, these included; rivers/streams, wetlands, estuaries, springs and rainfall. The following tools were developed by the project: � Aquatic Biomonitoring tools – including the further refinement of the miniSASS tool and associated
phone Apps � The Riparian Health Audit � The Water Clarity Tube � The Transparent Velocity Head Rod – Commonly referred to as a Velocity Plank � The Wetland assessment tool � The Estuary tool � The Spring tool � Weather monitoring tools, including Citizen Science Rain Gauges � School lesson plans � The Enviro Picture Building game to investigate catchment issues.
Aquatic biomonitoring – miniSASS Within this project cycle the miniSASS method was further tested, developed and refined, various cell phone applications (apps) developed and tested, and in particular significant additional functionality added to the miniSASS website. The miniSASS tool was also translated into isiZulu, Afrikaans, French and Swahili, and has been actively used in many other countries outside South Africa. An Android cell phone App was developed for miniSASS. The target audience were citizens who typically do not have access to a computer with internet connection but would have access to a mobile smart-phone. The project team partnered with the Department of Science and Technology (DST), who funded mLab, through their incubator programme, to develop the miniSASS app. Various challenges still exist with the App, however, and these need to be addressed. Other App options were also investigated, with the GeoODK application (downloadable from the Google Play store), most promising. The GeoODK miniSASS App was further adapted to be used for other Citizen Science tools developed in the project (e.g. the RHA). Both these Apps need further work and rationalising.
The Riparian Health Audit (RHA) tool This tool enables the citizen scientist to investigate conditions alongside the river including the riverine vegetation. The RHA has identified eight principle impacts that form the basis of the assessment – including: exotic plants, rubbish dumping, bank erosion, inundation, flow modifications, physico-chemical modifications, vegetation removal, channel modifications.
The Wetland Assessment tool This tool is used for assessing wetland ecological condition based on land-cover type. It is able to provide a “Present Ecological Status” for the assessed wetland.
The Estuary Assessment tool The tool caters for once-off engagements, as may be used at environmental education centres/school groups, whilst still fulfilling the needs of a formal estuary monitoring programme.

ix
Development of school lesson plans in support of Citizen Science activities A suite of “Lesson Plans” developed around the Water Resource Tools and the Curriculum and Assessment Policy Statement (CAPS) for the National Curriculum Statement have also been developed from this project.
Building a community of practice around citizen science tools
There has been major growth in the Citizen Science field in the past few years. As the field grows, so the need to facilitate the development of a Community of Practice (CoP) to encourage the uptake of citizen science tools is becoming necessary. This project worked extensively to host seminars, workshops and training days to promote the citizen science tools developed by this project, but also to offer training and build the capacity of the participants. There have been numerous stand-out events which have promoted this work and some examples are described below. These range from Mandela Day celebrations around the country (and internationally!), to working with and training delegates from the eThekwini Municipality WWTW, to a presentation for UNESCO in Paris in 2016 and Ottawa in 2017! Such events help extend a CoP around CS and water resource management. Numerous presentations have been made on the Citizen Science tools and toolkit activities associated with this project at conferences, symposia, seminar series, dissemination workshops, as well as more informal settings such as talks to and physical activities associated with Mandela Day Celebrations, Conservancies, “Friends of….”, environmental days/celebrations (Water Week, World Wetlands Day, etc.) and local schools, etc. Additionally, there have been both formal and informal training sessions provided at many venues on the various tools. At most of these opportunities the tools were highlighted, both physically, as well as in case studies where these tools and interventions have been successfully applied. These occurred both in South Africa and also in several overseas countries and within the SADC region. In the hosting of these training workshops to demonstrate water resource citizen science tools to various organisations, there has been a strong focus on organisations that have not previously engaged with water resource citizen science tools. One notable such example has been the Leadership Seminars in association with CoGTA. Training also included how tools are used to collect data with an emphasis on data quality. The information from these workshops was used to further refine and improve the tools.
Capacity for Catchments – Citizen Science Virtual Toolbox for Water Resources
The project has developed a wide range of CS tools and documented many approaches and interventions which can be used to improve water resource management within the region. The project has also developed a new, electronic, “virtual” tool-box on the internet and this can be added to, as and when new tools emerge, or current tools are further refined or developed. This organic and virtual tool-box is complimentary to pre-existing tools and websites (e.g. miniSASS) and is designed to give life to this project beyond the current funding cycle. This new portal – the Capacity for Catchments portal (see https://www.capacityforcatchments.org/), will also provide a space for the growing communities of practise within this field. It is thus designed to share ideas and inspire future growth. The portal includes a stylised, “typical” catchment (see example illustration below) where various resources and issues can be imagined. The portal has a home page, with relevant introductory background information, a tools page, with relevant tools organised according to the relevant areas of interest, and then other tabs to cover the community of practise, rules (regulating water resources in SA and how CS may be used/applied), and then project partners for further information. The hosting and maintenance of the portal is still to be resolved.

x
Impacts and outcomes of this research project
This research led to a number of significant impacts and outcomes. These have gone beyond simply addressing the initial aims and deliverables of the research project. They are summarised below, under the headings Global, Regional and Local impacts.
Global Impacts This project has had exposure to, and influence over, a number of global platforms. These include the Global Participatory Water Management Network (GPWMN). Tools developed in this project were demonstrated in Foz de Iguazu in Brazil in 2016. The Project Team later co-hosted the GPWMN General Assembly, in Durban, South Africa. This conference included papers by the project team and included input from the WRC. This was the first time the GPWMN had met in Africa. The project team also developed and shared inputs at UNESCO (responsible for implementing the Sustainable Development Goals for all nations of the world) in Paris and Ottawa. Various interactions with other professionals and colleagues working in this CS space have also occurred at various international destinations outside South Africa. These include Canada, Mexico, India, Germany and Tanzania. A paper on this work was also presented at the inaugural international conference: Citizen Observatories for Water Management – COWM 2016, in Italy.
Regional impacts It is probably at the regional and local level that most substantial impact of this work has occurred. At the invitation of the SADC Water Sector, which is responsible for integrated water management in all 15 SADC member states, citizen science tools from this project were presented at a SADC summit meeting from 20-25 May 2017 in Johannesburg. This conference, which included all SADC member states, was organised to profile the SADC Water, Energy and Food Nexus as well as the SADC Regional Strategic Action Plan on Integrated Water Resources Development and Management (RSAP Phase IV). The RSAP IV will be the premier regional SADC Water policy framework for 2016 to 2020. It is encouraging that, as a direct result of this citizen science tools project participating in the regional SADC water consultations, the RSAP IV has a short, dedicated section, on citizen science (RSAP IV page 18 – see extract and text box below). It was suggested at the SADC summit that the SADC region is possibly the only region in the world that has a water policy with a specific reference to citizen science!
From RSAP IV, page 18. There is a need to promote citizens’ science application on water. The use of citizens to monitor water status is an important contribution to water science. Activities include training of citizens on the monitoring and communicating of river water status and undertaking demonstration projects on the use of citizen’s science on selected river reaches where they can monitor river water status.
As part of a SADC Climate Change project which was conducted in 6 SADC member states (Namibia, Botswana, South Africa, Lesotho, Swaziland and Zambia) the project team were able to share the tools from citizen science project. This was done as part of the establishment of a ‘Sustainability Commons’ in each country. It is encouraging to see the enthusiasm for the tools in South Africa and the five neighbouring countries.
South African and Local Developments
A key strategic policy document around future water resource management for South Africa has recently been published. This is the DWS – Integrated Water Quality Management (IWQM) Strategy (DWS, 2017). This key document has identified a number of very specific strategic issues, objectives and actions which have a clear alignment to tools and processes developed by this WRC research initiative:

xi
These include: � Governance frameworks for active citizenry � Development of citizen-based monitoring � Expanding capacity building initiatives � Online tools for water quality and water quality management information.
Locally, the development of the Enviro-Champs model has seen significant parallel growth along with this CS project. Initiated by a number of local KZN Midlands NGOs including DUCT (https://www.duct.org.za/) and WESSA (http://wessa.org.za). WESSA is one of the key research partners in this project. The Enviro-Champs have grown from a group of unemployed Mpophomeni township community members to an integrated and systematic team who now monitor and report on surcharging sewer manholes and solve freshwater leaks and solid waste dumping. The Enviro-Champs have helped prevent raw sewerage from entering the strategically important Midmar Dam! The original group of Enviro-Champs, although initially constituted around the monitoring of spilling manholes have grown in capacity and have been trained in the wide suite of CS tools that have been developed within this WRC project. This is an encouraging example of a growing Community of Practise in this field. This increased capacity of the Enviro-Champs has led them to, amongst other things, developing street theatre productions around sanitation, undertaking basic leak detection and undertaking plumbing repairs. They are also engaged in important door-to-door surveys within the community to identify environmental issues as well as educating community members about the impacts of these issues. The use of CS tools has been a key component of this education and awareness raising process. One of the Enviro-Champs, Ayanda Lipheyana, of his own volition and for no pay, hosted regular weekend river walks with township children and taught them about miniSASS and the impacts of litter on aquatic ecosystems, etc. These groups now routinely use citizen science tools to monitor their local streams and rivers (see http://www.minisass.org/en/). The Enviro-Champs project in Mpophomeni was one case study where the sharing of, and access to, citizen science tools became a major enabling factor. The Enviro-Champs themselves and other role players have found the citizen science tools extremely empowering for themselves as well as for the local community (Ward, 2016). This was evident in the data collected by the Enviro-Champs on spilling manholes in Mpophomeni. The detailed information that was recorded and shared, including the GPS coordinates. This enabled the response times of plumbers to be significantly reduced. It also addressed the causes of the blockages and is an indication of the change in perceptions of people and their surroundings. Similarly, the miniSASS results obtained by the Enviro-Champs enabled them to identify problem areas and pollution sources, and to act on the problems identified. Such has been the interest and effectiveness of the Enviro-Champs concept that it has been taken up, often with different localised names in places such as Pongola, Amanzimtoti, Ceres and the Berg River catchment.
Information dissemination
The key objective of this research project was to develop a suite of tools for use in community-based water resource monitoring. This process included the dissemination of the developed toolkit to promote citizen science and school level education & awareness of catchment and river health. Part of the aim of this dissemination was to initiate the growth of trans-boundary citizen science, which highlights water resource health in South Africa, neighbouring countries and beyond. Dissemination workshops within this project have involved organisations and groups of people in a variety of interest areas including National, Provincial and Local Government, Conservancies, Schools, Universities, NGO groups, diplomatic groups (including cross-boundary entities), thereby achieving the goal to promote citizen science, education and awareness.

xii
Capacity development
The project has allowed for extensive capacity development in that there are a number of students whose studies have been funded specifically by the project. There have also been a wider number of students, interns and community groups involved in the development and testing of the citizen science tools. This has created learning, experience and empowerment for a wide range of people. Through WESSA, a project partner and accredited SETA training service provider, hundreds of young, and not so young, participants have been exposed to and trained in the use and application of citizen science tools. Such courses are offered at an NQF Level 2 and 5. Details of the twelve masters and PhD students, who either studied directly within, or were linked to this project, for their post-graduate studies within the field of Citizen Science, are given Appendix G, followed by the abstract for each student’s project.
Conclusion and Recommendations
The scope and power of CS is becoming more evident especially when it is used to advocate for change and better management of natural resources. This mainstreaming of CS is also seen in the policy shifts at an international level, both through UNESCO’s work on the Sustainable Development Goals (SDGs) and the Global Action Programme (GAP). In South Africa the Water, Energy and Food nexus is increasingly within a more narrowly buffered focal area. It is thus increasingly important that civil society plays an integral role in the management and protection of these resources. To this end, the WRC has funded this project to develop easy-to-use, reliable tools to assess water quality and quantity issues, and to go beyond mere awareness raising, to taking local action. Based on this research project, as well as on other anecdotal, empirical and historical evidence from other work conducted by the research team, this report synthesises and outlines the range of enablers and inhibitors to the implementation of CS tools. A key objective has been to move beyond simple awareness raising to taking local action. A review of the key enablers and limiters to the adoption of these tools shows that they may be broadly grouped according to either: Social, Technical, Financial or Geographic factors (see Chapter 6). Within these, with appropriate training, facilitation and support, most of the inhibiting factors can be overcome and, in fact, may even become enabling factors in support of sustainable actions! It is recommended that inhibitors or barriers are converted into enablers that foster meaningful learning and change wherever possible. By developing capabilities (Sen, 1999), people grow in confidence and competence and are able to apply learnings in a widening range of contexts. Sen continues to clarify how ‘freedoms’ (the inner potential all people have) can be realised and be mobilised as confidence grows in sharing contexts where mutual respect and dignity is emphasized. As people use the citizen science tools, they grow in confidence and clarity of purpose since such actions go beyond simply receiving communicated messages, in a top-down manner, as to what they should do. Further training, capacity building and strengthening of the communities of practise with the tools and approaches developed in this project are imperative if the risks to fresh-water management are to be addressed and turned around. A scaling-up process, through which the tools and learning processes can be more widely accessed and applied, is also imperative for the well-being of South Africa, and indeed the SADC regions, fresh-water resources.

xiii
ACKNOWLEDGEMENTS
The financing of the project by the Water Research Commission and contributions by the research manager and members of the reference group are gratefully acknowledged.
Numerous professional colleagues, NGOs, Conservancies, students, interns, academics and of course Citizen Scientists across the wide spectrum that this project team have had the pleasure of working within have ALL immeasurably contributed to the realisation and pleasure of working within this project.
Of special note are the following: Mike Ward – ex WESSA and now with C-S-V – Creating Sustainable Value Prof Rob O’Donoghue – Rhodes University Prof Heila Lotz-Sisitka – Rhodes University Louine Boothway – MSc Student Rhodes University The various interns and staff at DUCT The various interns and teaching staff at WESSA Lemson Betha – WESSA Jenna Watson – GroundTruth

xiv
This page was deliberately left blank

xv
TABLE OF CONTENTS EXECUTIVE SUMMARY ..................................................................................................................... v
ACKNOWLEDGEMENTS .................................................................................................................... xiii
TABLE OF CONTENTS ....................................................................................................................... xv
LIST OF FIGURES ............................................................................................................................... xviii
LIST OF TABLES ................................................................................................................................. xxi
ACRONYMS ........................................................................................................................................ xxii
CHAPTER ONE: INTRODUCTION .......................................................................................................1
CHAPTER TWO: LITERATURE REVIEW AND THE CONTEXT FOR CITIZEN SCIENCE IN WATER RESOURCE MANAGEMENT ............................................................................................3
The Context of the literature review: Mobilising Citizen Science to bring about social change for enhanced catchment management ...................................................................................................4
Environmental challenges and Citizen Science ............................................................................4 The Global Context .......................................................................................................................5 Public participation: A national imperative ....................................................................................6 Going beyond awareness raising with Citizen Science practices .................................................7 The social value of Citizen Science ..............................................................................................7
Citizen Science typography (roots and ideas) ..................................................................................9 Citizen Science tools, interventions and resources for water resource management ......................12
Water quality .................................................................................................................................13 Citizen Science tools, interventions and resources for wetlands ..................................................23
Towards a framework (conclusion) ...................................................................................................28 Conclusion.........................................................................................................................................28
CHAPTER THREE: THE DEVELOPMENT OF CITIZEN SCIENCE TOOLS .......................................29 Overview of general development of tools ........................................................................................29 Aquatic biomonitoring tool – miniSASS – mini Stream Assessment Scoring System ......................29 Riparian Health Audit (RHA) .............................................................................................................40 The Water Clarity Tube .....................................................................................................................43
Clarity tube operator variability ......................................................................................................44 Modelling Clarity, Turbidity and Total Suspended Solids ..............................................................46 Application and modelling of clarity readings to monitor Wastewater Treatment Works (WWTW) ........................................................................................................................................49
The Transparent Velocity Head Rod .................................................................................................54 Wetland assessment tool ..................................................................................................................55 Estuary tool .......................................................................................................................................57 Spring tool .........................................................................................................................................58 Citizen Science Rain Gauge .............................................................................................................60 Weather monitoring tools ..................................................................................................................63 School lesson plans ..........................................................................................................................64 In-field testing ................................................................................................................................... 65 Citizen Science and technology: issues and applications – the miniSASS App .............................. 65

xvi
CHAPTER FOUR: ACTION LEARNING: THE CO-ENGAGED APPLICATION OF CITIZEN SCIENCE TOOLS IN SUPPORTING IMRPOVEMENTS IN TRANSBOUNDARY WATER RESOURCE MANAGEMENT ............................................................ 70
The Context for the Development and field-testing of the Tools .................................................... 70 Does learning lead to meaningful change? ................................................................................ 71
Action learning & Citizen Science tools .......................................................................................... 72 Action Learning: An open-process framework ........................................................................... 72 Details of the 5T’s Model ............................................................................................................ 73 Case Studies where “Action Learning” had led to meaningful change ...................................... 78
CHAPTER FIVE: CAPACITY FOR CATCHMENTS – DEVELOPMENT OF A CITIZEN SCIENCE VIRTUAL TOOLBOX FOR WATER RESOURCE MANAGEMENT ................................................... 81
The development of a Citizen Science toolbox .............................................................................. 81 The virtual toolbox and other resources ......................................................................................... 81 The capacity for catchments portal ................................................................................................ 82 Water Resource Citizen Science Tools.......................................................................................... 86
Clarity Tube ................................................................................................................................ 86 E.coli Swabs ............................................................................................................................... 86 Estuary tool ................................................................................................................................ 86 Riparian Health Audit ................................................................................................................. 86 Spring tool .................................................................................................................................. 86 Velocity Plank ............................................................................................................................. 86 Weather monitoring tools ........................................................................................................... 87 Wetlands assessment tool ......................................................................................................... 87 School lesson plans ................................................................................................................... 87
Rules .............................................................................................................................................. 87 Community of Practise (CoP) ......................................................................................................... 91
CHAPTER SIX: INHIBITORS AND ENABLERS TO THE UPTAKE OF CITIZEN SCIENCE TOOLS WITHIN THE WATER COMMUNITY ................................................................................................. 92
Key enablers or principles for supporting meaningful learning with Citizen Science ..................... 95
CHAPTER SEVEN: BUILDING A COMMUNITY OF PRACTISE ...................................................... 97 Global Impact ................................................................................................................................. 98 Regional Impact ............................................................................................................................. 99 Local ............................................................................................................................................... 99
The development and strengthening of the EnviroChamps models .......................................... 99 River Walks ................................................................................................................................ 100 Summary .................................................................................................................................... 101
CHAPTER EIGHT: IMPACTS AND OUTCOMES OF THIS RESEARCH ......................................... 102 Global Impact ................................................................................................................................. 102
World-wide ................................................................................................................................. 102 UNESCO Global Action Programme (France) ........................................................................... 102 Canada ....................................................................................................................................... 102 Mexico ........................................................................................................................................ 103 Tanzania: Tropical Biology Association, Amani Nature Reserve, Tanzania. ............................. 103
Regional Impact ............................................................................................................................. 103 South Africa / local ......................................................................................................................... 104
DUCT/WESSA/WWF EnviroChamps models ............................................................................ 104 River Walks ................................................................................................................................ 107
The strengthening of Communities of Practise .............................................................................. 109 Summary ........................................................................................................................................ 110

xvii
CHAPTER NINE: INFORMATION DISSEMINATION......................................................................... 111 Conferences .................................................................................................................................... 112 Workshops ...................................................................................................................................... 116 Publications ..................................................................................................................................... 123 Data archiving ................................................................................................................................. 125
CHAPTER TEN: CAPACITY DEVELOPMENT .................................................................................. 126 Students .......................................................................................................................................... 116 Interns ............................................................................................................................................. 129
CHAPTER ELEVEN: CONCLUSIONS AND RECOMMENDATIONS ................................................ 130
REFERENCES .................................................................................................................................... 131
LIST OF APPENDICES......................................................................................................................141

xviii
LIST OF FIGURES
Figure 1. Individual, programmatic and Community Level learning outcomes through Citizen Science. http://www.esajournals.org/doi/full/10.1890/110280 ............................................................................. 9
Figure 2: Types of Citizen Science Projects by level of citizen engagement (modified and after Shirk et al. and Jordan et al., 2015) ................................................................................................................... 11
Figure 3: Division of catchment into each water system ....................................................................... 13
Figure 4: Measurable stream and river characteristics ......................................................................... 13
Figure 5. Various water quality parameters identified for measuring in streams and rivers ................. 14
Figure 6. Water temperature affects nearly every other water quality parameter ................................. 17
Figure 7: Measurable geomorphological characteristics of streams and rivers .................................... 20
Figure 8: Tools utilised to measure stream and river velocity ............................................................... 21
Figure 9: Tools or methods identified for measuring stream and river discharge ................................. 21
Figure 10: Key characteristics that can be measured for assessing wetland health. ........................... 24
Figure 11: Key characteristics that can be measured for assessing estuary health. ............................ 25
Figure 12: Key characteristics that can be measured for assessing spring health. .............................. 26
Figure 13: miniSASS dichotomous key ................................................................................................. 31
Figure 14: miniSASS ecological categories .......................................................................................... 31
Figure 15: screenshot of miniSASS website map ................................................................................. 32
Figure 16: miniSASS website home page, a useful aspect of the miniSASS website is that it allows for citizen scientists to use it (for free) as a monitoring and management tool.................................... 33
Figure 17: Screenshot of miniSASS observation details ...................................................................... 34
Figure 18: miniSASS site monitored over a period of time................................................................... 34
Figure 19: Temporal trends in miniSASS site data for a particular site................................................. 35
Figure 20: Poster in support of “how to do a miniSASS” study ............................................................. 36
Figure 21: Global distribution of registered miniSASS users uploading data to the miniSASS website ..............................................................................................................................................................37
Figure 22: The DUCT uMngeni River Walk route 2012 ....................................................................... 38
Figure 23: A graph showing the river health data gathered from the uMngeni River walk – as indicated by the miniSASS tool............................................................................................................................. 38
Figure 24: Cover page of the miniSASS newsletter for March 2016 .................................................... 39
Figure 25: A summary of the eight principle impacts that are used in the Riparian Health Audit......... 40
Figure 26: Example data sheet from the Karkloof River walk – applying CS tools ............................... 42
Figure 27: Components of a water clarity tube. A: The full length of the tube, with the protective cover; B: Clear base for viewing the disk; C: Magnets for moving disk; D: Black stopper-cap for sealing the tube ....................................................................................................................................................... 44
Figure 28: Samples sites to determine clarity tube operator variability................................................. 45
Figure 29: Bar graph of average clarity recorded per clarity tube operator and the total average per sample site. Vertical bars indicate standard error of the mean. ............................................................ 47
Figure 30: Scatterplot to illustrate the linear relationship between log-transformed values of clarity and log-transformed values of turbidity for in situ and ex situ samples ....................................................... 48
Figure 31: Scatterplot to illustrate the linear relationship between turbidity and Total Suspended Solids (TSS) ..................................................................................................................................................... 48

xix
Figure 32: The location of the Howick Wastewater Treatment Works (HWWTW) in KwaZulu-Natal, South Africa. .......................................................................................................................................... 50
Figure 33: Scatterplot illustrating the relationship between Log10Clarity (LOG CLARITY) and Log10Total Suspended Solids (LOG TSS). The solid line represents the trend in the data set.......... 51
Figure 34: Summary data for Howick WWTW compliance with various DWS limits, using a calibrated water clarity tube ................................................................................................................................... 52
Figure 35: The case study of the Siyabazali community, increasing their knowledge and understanding of water pollution and their role in the management of water resources .............................................. 53
Figure 36: The TVHR is use .................................................................................................................. 54
Figure 37: Local Karkloof farmer learning the correct use of the TVHR ............................................... 55
Figure 38: A completed data sheet using the spring index health tool of a site showing that the spring was in fair ecological condition .............................................................................................................. 60
Figure 39: A map representing all schools in South Africa. Schools could be a target group to collect much needed weather data ................................................................................................................... 61
Figure 40: Recycled Coca-Cola bottle CS rain gauge .......................................................................... 62
Figure 41: Graph showing the data collected from a CS rain gauge, a standard/scientific rain gauge and a Davis Vintage Pro 2 Weather Station over one month ...................................................................... 62
Figure 42: A homemade CS anemometer (wind pressure plate), made from recycled materials....... 63
Figure 43: Overview of the process of recording data in the Geo-ODK app........................................ 68
Figure 44: Map showing river health data recorded using CS tools and the Geo-ODK app along the Karkloof River walk (2017). ................................................................................................................. 69
Figure 45: Anne Wals, Liz Taylor and Arjen Wals doing miniSASS fieldwork (real-life or ‘touch’ encounters) in the KZN Drakensberg. Arjen Wals is a Professor of Transformative Learning for Socio-Ecological Sustainability at Wageningen University in the Netherlands ............................................. 70
Figure 46: The Action Learning 5T’s model adapted from the Open Process Framework of Rob O'Donoghue (United Nations Environment Programme, 2004) .......................................................... 72
Figure 47: EnviroChamps explore water quality using the miniSASS tool with local councillors near Mpophomeni. Here engaged learning in real life fieldwork settings proved powerful in support of meaningful dialogue (talk) related to environmental issues and risks ................................................. 74
Figure 48: WWWC teams attended a two-day Intro to Aquatic Ecology course and engaged with the CS tools (working with miniSASS on the left and the velocity plank on the right). These teams have subsequently developed a full river monitoring programme for the rivers they work in. ..................... 76
Figure 49: Members of the Women’s Leadership and Training Programme (WLTP) using the “Windows on the World: Catchments to Coast” Enviro-Picture building resource to understand and contextualize CS activities. Each participant placed a coloured crab icon from the miniSASS activity at the place they considered the most appropriate to the colour code of the crab ......................................................... 77
Figure 50: Few people realise that nutrient loading is a massive risk to most rivers and streams in South Africa. Here Zongile Ngubane measures the water clarity of the Wastewater treatment Works (WWTW) outflow pipe in Shiyabazali informal settlement. Clarity measurements are converted to represent total suspended solids, which include nutrients (photo courtesy of Andrea Kolbe). ................................... 79
Figure 51: Images showing the damage to the infrastructure in Ezimbokodweni, as well as one of the Wise Wayz Water Care volunteers measuring the outflow from the leaking pipe (right). The images below left show the damaged pipe ...................................................................................................... 80
Figure 52: The Action Learning 5T’s model adapted from the Open Process Framework of Rob O'Donoghue (United Nations Environment Programme, 2004) .......................................................... 83
Figure 53: Screen capture illustration of the Capacity for Catchments webpage/portal and stylised catchment to “explore” for resources ................................................................................................... 84

xx
Figure 54: Screen capture illustration of the detail of one of the tools within the Capacity for Catchments webpage/portal (note User Guide, Summary Sheet, Poster and PowerPoint resources associated with the tool) ............................................................................................................................................... 85
Figure 55: Key water relationships between various legally responsible entities, policies, and strategic perspectives influencing the “rules” of water resource management in South Africa (modified after GreenCape, Market Intelligence Report, 2017), and how CS could interact with these “rules”.......... 88
Figure 56: The cloth river, with two different habitats on the left, the “cloth sample” being identified, top right, and the live sample being identified on the bottom right. This method of interacting with the tools is not ideal, but works very well for schools that are not near streams or very large groups where time is a constraint. ..................................................................................................................................... 95
Figure 57: Map of Mpophomeni showing sewer lines and illegal solid waste disposal sites monitored by EnviroChamps along the main branches of the Mthinzima Stream draining into Midmar Dam (just north of the map) .......................................................................................................................................... 104
Figure 58: Images from a river walk group led by Ayanda Lipheyana (dark blue shirt with net) assessing one of the regularly monitored sites on the Mthinzima Stream, above Mpophomeni Township ......... 105
Figure 59: Sewer line monitoring data from Mpophomeni showing the number of days per month sewer lines surcharged (as monitored by EnviroChamp Jabulani Dladla) and results after the sewer line was replaced............................................................................................................................................... 106
Figure 60: Map of the uMngeni catchment and river, and sites sampled and condition of the river using miniSASS as part of the DUCT river walk ........................................................................................... 107
Figure 61: A graph showing the river health data gathered from the uMngeni River walk – as indicated by the miniSASS tool........................................................................................................................... 108
Figure 62: Map showing river health data recorded using citizen science tools and the GeoODK App along the Karkloof River. ..................................................................................................................... 109

xxi
LIST OF TABLES
Table 1: An excerpt of Appendix A, on how Citizen Science tools can be used to achieve the SDGs. (C/S refers to CS tools) ......................................................................................................................... 5
Table 2: Benefits of Citizen Science (modified and after EPA, 2017) ................................................... 8
Table 3: A guideline to rating impacts in terms of the percentage of change caused by the impact or coverage of the impact to the riparian zone .......................................................................................... 41
Table 4: Summary of scores and percentage of change and their respective Ecological Condition for the Riparian Health Audit ...................................................................................................................... 41
Table 5: Information pertaining to sample sites visited to determine clarity operator variability ........... 46
Table 6: Simple linear regression statistics for water quality parameter modelling – Clarity versus TSS – Total Suspended Solids ..................................................................................................................... 51
Table 7: Special and General Limit Values for TSS and clarity ............................................................ 52
Table 8: Statistics for the quantity of non-compliant recordings of the HWWTW ................................. 53
Table 9: Overall impact score categories and corresponding Present Ecological State (PES) categories (modified from MacFarlane, 2009) ...................................................................................... 54
Table 10: A guideline to rating the impacts identified in the Spring Health Index ................................. 59
Table 11: Scores as a percentage of change from the spring’s natural condition ................................ 59
Table 12: Extract and summary of the IWQM strategic issues objectives and actions (DWS, 2017) that the WRC Citizen Science project could align with or engage in .................................................. ..90
Table 13: Inhibitors and Enablers that have emerged from the research conducted through this WRC project. ....................................................................................................................................... ..92
Table 14: a summary of all the dissemination opportunities that were recorded. ............................... 111
Table 15: Conference presentations summary table .......................................................................... 112
Table 16: Workshop summary table ................................................................................................... 116
Table 17: Publications table ................................................................................................................ 123
Table 18: Table of students with research funded by or directly relating to the project ...................... 126
Table 19: Interns on the project .......................................................................................................... 124

xxii
ACRONYMS
ARC Agricultural Research Council AWS Automatic Weather Stations BRNCA Black Rock National Conservation Area CAPS Curriculum and Assessment Policy Statement CBP Chesapeake Bay Program CBT Compartment Bag Test CEDT Community Education and Development Trust CHAT Cultural-historical Activity Theory CMAs Catchment Management Agencies CoCoRaHS Community Collaborative Rain, Hail & Snow Network CoP Community of Practice CS Citizen Science CSIR Council for Scientific and Industrial Research CWAC Co-ordinated Waterbird Annual Count DBI Dragonfly Biotic Index DO Dissolved oxygen DST Department of Science and Technology DUCT Duzi-Umgeni Conservation Trust DWS Department of Water and Sanitation EC Ecological Condition EE Environmental Education EI Ecological Importance EIAs Environmental Impact Assessments EPA Environmental Protection Agency ES Ecological Sensitivity ESD Education for Sustainable Development FQAI Floristic Quality Assessment Index FRAI Fish Response Assessment Index GAP Global Action Programme GIS Geographical Information Systems GPS Geographic Positioning System HCD Human capacity Development HWWTW Howick Wastewater Treatment Works ICTs Information and Communications Technology IHAS Invertebrate Habitat Assessment System IHI Index of Habitat Integrity KZN KwaZulu-Natal MDEP Maine Department of Environmental Protection MDGs Millennium Development Goals MESA Mainstreaming Environment and Sustainability in Africa miniSASS mini Stream Assessment Scoring System MIRAI Macro-invertebrate Response Assessment Index MSEP Mpophomeni Sanitation and Education Project NACEPT National Advisory Council for Environmental Policy and Technology NDP National Development Plan NEMA National Environmental Management Act NEPAD New Partnership for Africa’s Development NGOs Non-governmental organisation NQF National Qualifications Framework

xxiii
NTU Nephelometric Turbidity Units NWA National Water Act ORASECOM Orange-Senqu River Commission PCQ’s Point Centred Quarters PEP-UP Participatory Evaluation Programme – Umgeni Valley PES Present Ecological State PPSR Public Participation in Scientific Research RCE Regional Centres of Expertise REEP Regional Environmental Educational Programme RHA Riparian Health Audit RHS River Habitat Survey RSAP IV Regional Strategic Action Plan SA Southern Africa SADC South African Development Community SADC-REEP Southern African Development Community – Regional Environmental Education
Programme SAIAB The South African Institute for Aquatic Biodiversity SAV Submerged aquatic vegetation SAWS South African Weather Service SDGs Sustainable Development Goals SEPA Scottish Environment Protection Agency SOP standard operating procedure SST’s Sea-surface temperatures Susfarms Sustainable Sugarcane Farm Management System TDS Total dissolved solids TFCA Trans Frontier Conservation Areas TSS total suspended solids TVHR Transparent Velocity Head Rod UAE University of Albert Einstein UEIP uMngeni Ecological Infrastructure Partnership UMDM uMgungundlovu District Municipality UNDESD United Nations Decade of Education for Sustainable Development UNDP/GEF United Nations Development Programme Global Environment Facility UNEP United Nations Environment Programme UNESCO United Nations Educational, Scientific and Cultural Organization UNU-IAS United Nations University Institute of Advanced Studies USGS United States the US Geological Survey VCM Visual Comparison Method VEGRAI Riparian Vegetation Response Assessment Index WESSA Wildlife & Environment Society of South Africa WISA Water Institute of Southern Africa WIV Wetland Index Value WLTP Women’s Leadership and Training Programme WOW Weather Observations Website WRC Water Research Commission WWF World Wildlife Fund WWMC World Water Monitoring Challenge WWTW Wastewater treatment Works

xxiv
This page was deliberately left blank

1
CHAPTER ONE: INTRODUCTION Water is the life-blood of every nation. In South Africa over 80 percent of our rivers are in such a bad state they have been classified as "threatened". Of these, 44 percent are critically threatened. Concerted efforts to ‘turn the situation around’ are simply not working and water quality, quantity and indeed social equity issues remain a top priority for South Africa’s future well-being. Human created problems require human-centred solutions and these require different ways of thinking to those that created the problems.
The essence of this WRC research project was in finding and developing appropriate CS tools, interventions and social processes, understanding, and ways of co-creating better responses to the challenges around water resources within our region. The focus of this project is reflected in the challenges and disconnection between civil society and water resource management in Southern Africa. Pollution from industry and domestic households, increased infestation of alien/invasive plant species and the increased enrichment of nutrients within fresh-water systems are just a few of the many examples reducing catchment health and resilience. Complexities increase when transboundary catchment management is required to manage the pressures and demands placed on water resources as observed in many of South Africa’s catchments.
While the challenges persist, and if anything become more complex, authorities generally do not have sufficient capacity to monitor, manage and overcome many of these challenges. In addition, a significant divide between the various stakeholder groups exists, e.g. between scientists, government, NGOs, private organizations, civil society and nation states sharing river basins. This typically dampens integrative solutions and catchment management on a broad scale.
To overcome many of these challenges, researchers are currently seeking to devise a mechanism to bridge this stakeholder divide. A key mechanism with which to address this issue is the integration of civil society into the routine management and monitoring of water resources. This project aims to research the potential for CS to effect meaningful change in water resource management and thus work towards improved catchment conditions. The vision is one of citizens who are able to go beyond awareness-raising, to a more tangible action-taking process of co-managing their water resources. Risks that are exacerbated by the way people live on Earth require a response that is people-centred in orientation.
This awakening is also supported through the increasing global popularity of CS (Wiggins and Crowston, 2011), and public participation in the monitoring and management of the natural environment. South African policies and even official strategic visioning coming from the Department of Water and Sanitation, are increasingly recognising the important roles and responsibilities citizens play in monitoring, managing and engaging with environmental issues, which are closely related to basic human rights and service delivery. In order to harness the rising enthusiasm from a wide range of groups, to better understand the health of their catchments and to meet societal needs where they are most required, this research project focuses on exploring different social change models of learning and educational change, as well as a suite of possible tools to engage with the various aspects of water resources in the southern African context. These orientations include public mobilisation and the

2
democratisation of science (CS) and water related understanding as an emerging response to the water crisis
Within the framework of this research project, there are undoubtedly many ways to investigate this key research question:
Whether we can improve the management of water resources through the use of innovative CS tools and interventions to engage with, measure and better understand the health of catchments?
This project seeks to understand the underlying socio-ecological processes driving both management and mismanagement within catchments. For the purpose of producing a socially applicable and sound ideological foundation for the project, a range of social change theories have been assessed and accordingly modified for this research project.

3
CHAPTER TWO: LITERATURE REVIEW AND THE CONTEXT FOR CITIZEN SCIENCE IN WATER RESOURCE
MANAGEMENT
Water is the life-blood of every nation. In South Africa over 80 percent of our rivers are in such a bad state they have been classified as "threatened". Of these, 44 percent are critically threatened. Concerted efforts to ‘turn the situation around’ are simply not working and water quality, quantity and indeed social equity issues remain a top priority for South Africa’s future well-being.
Risks that are exacerbated by the way people live on Earth require a response that is people-centred in orientation. Human created problems require human-centred solutions and these require different ways of thinking to those that created the problems. This literature review explores different social change models of learning and educational change, as well as a suite of possible tools to engage with the various aspects of water resources in the southern African context. These orientations include public mobilisation and the democratisation of science (CS) and water related understanding as an emerging response to the water crisis.
More specifically the literature review responds to the research question: “can we improve the management of water resources through the use of innovative CS tools and interventions to engage with, measure and better understand the health of catchments?” Closely linked to this research question is an assessment of successes and barriers to the application of the CS tools in effecting meaningful change in the challenges of trans-boundary water resource management.
The notion of ‘giving away the tools of science’ within a CS context is a particular response that this literature review focuses on. The review develops these concepts and connects them to global literature. A key goal of this literature review is to inform the development of CS tools, with the support of the Water Research Commission, so as to develop a public-spirited understanding of water related issues and risks.
The literature review develops a typology of CS activities from those that may be described as Contributory projects (where citizens contribute to the work of scientists), to those that are more Collaborative in nature (where citizens and scientists work together) and finally those that may be described as Co-created projects (here citizens are supported to even take the lead where appropriate and possible).
The case for CS, supported by social learning is developed through a careful literature analysis. This work is then further linked to natural resource management and trans-boundary activities. The value of CS to society is a further theme of the research. Reviews of existing CS tools, in support of water management, are also presented and comprehensive lists are included in the appendices of this report.
Finally, the literature review clarifies a future research direction, which includes the frameworks of Social and expansive learning supported by an Action Learning framework which was developed through the implementation of the project. The research also develops the concept of communities of practice that are well placed to support the development and implementation of CS tools in support of more sustainable water resource management.

4
The Context of the literature review: Mobilising Citizen Science to bring about social change for enhanced catchment management
“Natural resources management in general, and water resources management in particular, are currently undergoing a major paradigm shift. Management practices have largely been developed and implemented by experts using technical means based on designing systems that can be predicted and controlled. In recent years, stakeholder involvement has gained increasing importance. Collaborative governance is considered to be more appropriate for integrated and adaptive management regimes needed to cope with the complexity of social-ecological systems.” (Pahl-Wostl et al., 2007).
In this context there is a need to find learning and change processes that enable broader participation of stakeholders in monitoring, representing and responding to water resource management issues. This literature review maps out CS as a component of broader social learning as a response to the challenges associated with water resource management.
Environmental challenges and Citizen Science
Unwittingly, society continues to contribute to the environmental risks that it must face. These include human-induced climate change, the rapid depletion and impact on of natural resources; most notably water resources, the increased frequency of natural disasters, the loss of biodiversity, increased poverty and economic systems that depend on the continuous growth of consumerism. Risks that are exacerbated by the way people live on Earth require a response that is people-centred in orientation. In other words, human created problems require human-centred solutions, often with different ways of thinking to those that created the problems, and different models of training and educational objectives (Orr, 1994). Social learning and CS are emerging as strategic vehicles which are able to better address such issues and re-orientate learning for a more sustainable world.
CS has been defined as the "partnerships between scientists and non-scientists where data are collected, shared and analysed" (Wals, 2007; Jordan et al., 2012). It also addresses the desire to create or grow temporal and spatial data sets (Dickenson et al., 2012), and the desire to educate the public (Bonney et al., 2009b)
The objective of this aspect of the project was to review literature that will support the development of tools for CS and the use of Information and Communications Technology (ICT) to educate and empower citizens, and government, to better manage water catchments. Central to this initiative is an understanding of dimensions of social change, including tools, rules and divisions of labour or responsibility (Engeström, 2001) and the communities of practice (Lave and Wenger, 1991), that form within and for processes of social change. Anderies, Janssen, and Ostrom (2004) develop these relationships further through an exploration of what makes socio-ecological systems robust. They further develop a conceptual model of a social-ecological system which maps out these relationships and seeks to include the social impacts, such as population growth or mobility as well as biophysical disruptions. These meta-frameworks provide a broader context in which CS activities can be located and within which the tools and processes investigated during this research project will be framed. Insights from the work of Richard Thaler (Thaler and Sunstein, 2008) included ‘nudge’ psychology and ‘change-choice-practices.’ It is noteworthy that Thaler has recently been awarded the Nobel Prize for Economics for 2017 which lends further emphasis to such social change orientations.
The current increased interest in CS, which is responding to the global challenges, is fuelled by a developing Information and Communications Technology (ICTs) revolution that is making communication rapid, inexpensive and locally relevant (Wals et al., 2014). Wals and colleagues

5
continue to point out that CS and concerns about sustainability can catalyse much-needed synergy between environmental education and science education.
The Global Context
The Sustainable Development Goals (SDGs) and Citizen Science Tools
The unanimous approval of the Sustainable Development Goals1 by 193 countries in September 2015 represents one of the most significant policy shifts in recent history. Officially, at least, the environment movement and actions towards sustainability including the management of water (Goal 6) are now at the forefront of global policy. This development has much significance for the future management of water resources and is particularly significant from a CS perspective. A brief review of the 17 SDGs revealed that the achievement of all 17 SDGs would be enhanced with the application of CS tools developed by this project. The table below, highlights two examples of how the CS tools developed by this project could assist to achieve SDG 11 and 17.
Table 1: An excerpt of Appendix A, on how Citizen Science tools can be used to achieve the SDGs. (C/S refers to CS tools)
Sustainable Development Goals SDG Number and Detail Citizen Science relevance Example C/S
Goal 11 Make cities and human settlements
inclusive, safe, resilient and sustainable
11.1 Access to basic services Ensure affordability by protecting ecological infrastructure Understanding water resources
11.4 Safeguard cultural and natural heritage Projects that protect natural heritage EcoSchools
11.5 Reduce water related disasters Capacity development for risk reduction; Water quality and flow monitoring
Env Practices courses; citizen science, e.g. miniSASS
11.7 Green spaces Community involvement in green spaces Urban Conservancies
11.a Environmental links (linking urban life to natural resources) Awareness raising EcoSchools; Water Explorers Programme
Goal 17 Strengthen the means of
implementation and revitalize the global partnership for sustainable
development
17.17
Promote civil society partnerships
Promote civil society partnerships
Friends Groups; River Watch Groups, miniSASS & other citizen science tools; Ecoschools; NRM;
17.18
Capacity building to increase availability of high quality data
Capacity building based on citizen science (giving away the tools of science)
e.g. miniSASS; Google platform; Water Explorer; WESSA Elephant Initiative; etc.
At first glance, these two SDGs (11 and 17) appear to have no connection to water, however, as the detail in the table illustrates, a deeper analysis of the SDGs in question shows the potential connection with the CS tools.
UNESCO (The United Nations Educational Scientific and Cultural Organisation) has recognised that the Sustainable Development Goals (SDGs) are unlikely to be achieved without a strong education component underpinning the 17 goals. Unless people are learning as part of addressing the SDGs there is little chance that the SDGs will be achieved in the longer term. For this reason, UNESCO has launched the Global Action Programme (GAP) which seeks to provide capacity building support to the SDGs (Taylor, 2014). Over 80 institutions, world-wide, are now active GAP partners and all are seeking to inform the education component for the various SDGs. In this regard WESSA has been appointed, by UNESCO, as a GAP partner for Partner Network 2 “Transforming learning and training environments.” Dr Jim Taylor, a co-researcher in this WRC project has been elected to co-chair this Partner Network 2. To this end regular telecommunications meetings are held with the partners from around the world and an annual conference, to document progress and plan ahead is held, usually at the UNESCO head-quarters in Paris although in 2017 the meeting was hosted by the Canadian government in Ottawa. Networks such as this have helped enormously in sharing the CS tools developed as part of this project across wider catchments and continents.
1 The process to develop the 17 Sustainable Development Goals was apparently the largest, most wide-spread and inclusive public participation process in human history.

6
This move by UNESCO to a strong education focus reiterates the policy shift around environmental programmes and the need to include civil society in the co-management of natural resources. As a further indication of the relevance and application of CS into policy and environmental protection, in December 2016, the National Advisory Council for Environmental Policy and Technology (NACEPT) communicated a report to the EPA highlighting the transformational potential of CS for environmental protection. NACEPT is a council made up of 28 members, representing academia; business and industry; nongovernmental organizations; and state, local and tribal governments of the United States of America. NACEPT “. . . have identified CS as an invaluable opportunity for EPA to strengthen public support for EPA’s mission and the best approach for the Agency to connect with the public”.
NACEPT, after assessing the EPA’s approach to CS, has recommended that the EPA “proactively and fully integrate CS into the work of EPA”. The NACEPT also recommended that the EPA “embrace CS as a core tenet of environmental protection, invest in CS for communities, partners, and the Agency, enable the use of CS data at the Agency, and integrate CS into the full range of work at EPA” (Howard, 2016).
Public participation: A national imperative
The South African ex Minister of Water and Sanitation, the Honourable Nomvula Mokonyane, in her address to the Water Summit in August 2014 emphasized that “the participation of our people in the water sector is key.” While this is no doubt true, the central question is how people participate? For many government and non-government organisations participation has taken the form of awareness-raising activities. While these awareness-raising activities may be helpful, they often lack an engagement with key issues and risks. Awareness raising also tends to be top-down and fails to take the perspectives of the people mobilised into the awareness raising situations into account.
Massive water awareness campaigns such as 20/20 Vision, Baswa le Meetse and The National Water Week are examples of efforts being made to create much needed understanding of how scarce and vulnerable our water supply really is. These campaigns include massive street processions where cities like Boksburg host street marches and thousands of people demonstrate their commitment to a cleaner, water-wise future. These powerful campaign mechanisms re-iterate the value of water, the need for sustainable management of this scarce resource and the role water plays in eradicating poverty and under-development in South Africa.
This awareness creation is coupled with the responsibility that every citizen must take in ensuring the integrity of our water resources and its efficient use. Particularly, the linkages between water services, supply, resource management, poverty eradication, social and economic development are emphasised in a number of innovative ways. (DWS, 2015 https://www.gov.za/national-water-week-2015)
Such campaigns have done a great deal to raise awareness but on their own cannot enable the much-needed change practices that will bring about greater care of our water resources. It is thus becoming clear that awareness raising campaigns can only play a small part in solving our water issues. To enable South African society, as a whole, to manage water resources more wisely, water conservation and well-informed demand side management is crucial. To achieve this, more creative and engaging human capacity development programmes are vital. For substantial change in the way in which people use, and learn not to abuse water supplies, a framework, or scaffolding, is needed that provides a coherent pathway from current, unsustainable practices, to more sustainable and wise ways of managing and using our water resources. In essence these are the goals that CS is seeking to achieve. Put differently, CS seeks to mobilise people to better understand and address water issues as well as to democratise science.

7
Going beyond awareness raising with Citizen Science practices
“Today we all became important scientists, working with WESSA and GroundTruth to explore our streams through the Stream Assessment Scoring System” (Pam Tshwete, Deputy Minister, DWS, 1 July 2014).
The key question in these debates is how to enable society to move in a sustainable development direction? This literature review explores how Education for Sustainable Development (ESD), of which CS activities do play a part, may be viewed on a continuum from ‘causal’ approaches, seeking to cause change in others, or ‘enabling’ orientations where efforts are made to enable people to implement the principles of ESD and respond to the environmental challenges they face from their own context (Taylor, 2014).
One of the most effective ways of going beyond awareness raising is to use CS to mobilise people to find out about water issues and to take action to solve them. Pierre Spierer, Vice Rector for Research of the University of Geneva, describes CS as “....... a grass-roots movement which challenges the assumption that only professionals can do science. Given the right tools and incentives, and some online training, millions of enthusiastic volunteers can make a real difference, contributing to significant scientific discoveries.”
This review revealed the wide range of approaches to CS within the international literature. Based on this a typology or classification of approaches to CS, according to their structural and/or organisational features, is possible. This typology is not unique and has been used by various authors (e.g. Bonney et al., 2009a; Tweddle et al., 2012 and most recently and usefully, Jordan et al., 2015). In the context of this project Jordan et al. provides a useful framework within which to review the relevant literature. This typology ranges from CS projects that contribute to wider research initiatives, to collaborative projects and finally to co-created projects (Table 2). This CS typology is further explored later in this chapter.
The social value of Citizen Science
In an exploration of the contribution that CS is able to make Jordan et al. (2012) explore key issues and new approaches for evaluating citizen-science learning outcomes. They conclude that three perspectives may be used to clarify such outcomes. These include Individual, Programmatic and Community-level outcomes (Appendix A: Tabulated SDGs). The authors of this research paper cite case studies that support these three perspectives in CS research and activities.
CS benefitting society: workshops and giving away the tools of science
Knowing what you do not know, admitting you do not know it, and finding ways to know, are the keys to meaningful learning. We are all learners and educators. Mandikonza et al. (2011).
As early as the 1990s a critique of awareness raising approaches revealed how little is achieved, in terms of meaningful change, with top-down ‘awareness raising’ activities alone (Taylor, 1997). Equipping people with the resources and ideas that they could use to ‘find out more about’ and engage with the issues and risks became known as a process of ‘giving away the tools of science’ (Taylor, 1992). This orientation to supporting change aimed to place the tools of the learning in the hands of the participants rather than simply telling participants what the presenters felt they needed to know (Taylor, 1993). This shift in thinking has paved the way for the sharing of CS tools and marks a transition in the power relations of the work. The facilitator of the workshop is no longer forced to play the role of a ‘presenter’ impressing the audience with entertaining and informative awareness raising examples.

8
Instead the workshop develops a more collaborative orientation in which specific needs can be addressed and the use of the tools of science, for genuine localised finding out and building understanding, becomes possible.
The benefits of CS may be usefully summarised in the table below:
Table 2: Benefits of Citizen Science (modified and after EPA, 2017)
Engaged Communities An educated and engaged public that can support solving environmental and health problems.
Collaborative Governance
Energized and improved environmental governance created through generating deep public involvement in priorities and monitoring practices.
Common Vision
A public connected to and invested in the missions of government and municipal agencies by promotion of open government, civic participation and volunteerism.
Actionable Information
Contributions to environmental and health research that would otherwise be impossible, including data and information to fill current gaps, early warning of environmental issues and problems, and information on problems not adequately covered by monitoring networks.
Shared Knowledge
The advancement and acceleration of scientific research through collaborative practices bounded in group discovery, learning and the co-creation of knowledge.
Accessible Technology Technology that is open sourced to promote rapid iterations and advancements in support of environmental priorities.
Environmental Literacy
The advancement of national priorities around science, technology, engineering, arts and mathematics (commonly known as STEAM) education through CS activities.
More locally and within an African context Jonsson and Klasander (2014) from the University of Jonkoping in Sweden undertook an external evaluation of the Mpophomeni Sanitation and Education Project (MSEP). Their qualitative review clarified how CS work supported efforts to achieve better management of water issues in a South African township. This review described how the outcomes of this project not only contributed to individual level outcomes but also programmatic and community-level effects (Jordan et al., 2012).
Whether the outcomes are individual, programmatic or community-level each have implications for the so-called ‘green’ economy.

9
Figure 1. Individual, programmatic and Community Level learning outcomes through Citizen Science. http://www.esajournals.org/doi/full/10.1890/110280
Citizen Science typography (roots and ideas)
In a ground-breaking book entitled “CS: A study of People, Expertise and Sustainable Development” the social scientist Alan Irwin (1995) explored two key relationships between citizens and science through the term CS. The first was a description of science that addresses the needs and concerns of citizens. The second was a form of science developed and enacted by citizens themselves. Closely linked to this second meaning of CS is the ‘contextual knowledge’s’ which are generated outside of formal scientific institutions’ (ibid p xi).
Working independently of Irwin, and apparently unaware of his use of the term, Rick Bonney used the term in 1995 to refer to Cornell Lab of Ornithology’s growing number of scientist-driven public research projects (Bonney, 1996; Bonney et al., 2009a). Bonney defined CS as a research technique that enlists the help of members of the public to gather scientific data (Bonney et al., 2009b).
The Cornell Lab of Ornithology and Bonney have been very influential in shaping the field of CS (Scientific Communication Unit, 2013) with the result that much of the literature and CS initiatives reported on in this literature focus on citizen involvement in the gathering of samples or recording data.
This definition of CS, and the limited forms of participation that it enables, have been more recently critiqued (Mueller et al., 2012; Cooper, 2012). These authors note that “the participants primarily serve to collect data for scientists rather than to collaborate with scientists, democratise protocols and equipment, assess ideas and work in relation to each other” (Mueller et al., 2012). These authors link this approach to positivism which asserts that scientific knowledge is best derived through standardised protocols (the scientific method) and that science serves as the only true source of knowledge. They go on to classify those forms of CS that are shaped by positivism as top-down CS and argue for a democratisation or deepening of participation within CS.

10
CS has been explored in different ways in the public domain for over a century (Bonney et al., 2009) but has garnered heightened interest due to the proliferation of mobile technologies that allow for rapid contribution of data points of interest by scientists and citizens alike (e.g. crowdsourcing). Bird surveys, which have occurred in Europe and America for over 100 years, provide an example of typical CS projects. These types of projects have created some of the longest continuous ecological data sets that help understand global environmental change (Shirk et al., 2012).
In recent literature a number of typologies have been suggested that seek to differentiate between the various steps or activities within a scientific process and the levels of participation by citizens in these scientific processes. The most commonly cited example of this kind of typology is entitled “Models for Public Participation in Scientific Research (PPSR)” (Bonney et al., 2009a). This model divides public participation in scientific research into three major categories:
1) Contributory projects, which are generally designed by scientists and for which members of the
public primarily contribute data
2) Collaborative projects which are generally designed by scientists and for which members of the public contribute data but also may help to refine project design, analyse data, or disseminate findings
3) Co-created projects, which are designed by scientists and members of the public working together and for which at least some of the public participants are actively involved in most or all steps of the scientific process. (Bonney et al., 2009a).
Most projects labelled CS fall into the contributory project category (Bonney, 1996; Krasny & Bonney, 2005; Bonney et al., 2009a; Jordan et al., 2015). Many volunteer monitoring projects including the more complex water quality monitoring projects fall under the collaborative project category (Whitelaw et al., 2003). Other projects which may be labelled “community science” or “participatory action research” (Wilderman et al., 2004; Fernandez-Gimenez et al., 2008) may be classified as co-created projects.
The above categorisation is strongly influenced by research into levels of participation (Pretty, 1995). Other typologies of CS rely on different or additional characteristics. Wiggins and Crowston (2011), for example, focus on the primary project goals as well as the importance of the physical environment to participation. By examining a number of projects that would be defined as CS, they developed a typology based on – Action, Conservation, Investigation, Virtual, and Education.
1) Action-orientated CS project encourage participant intervention in local concerns, using
scientific research as a tool to support civic agendas. 2) Conservation projects support stewardship and natural resource management goals, primarily
in the area of ecology. They engage citizens as a matter of practicality and outreach. 3) Investigation projects are focused on scientific research goals requiring data collection from the
physical environment. 4) In Virtual projects, all project activities are ICT-mediated with no physical elements whatsoever. 5) Education projects make education and outreach the primary goal of the project.
In a paper entitled “Public Participation in Scientific Research (PPSR): A Framework for Deliberate Design” Shirk et al. (2012) bring together all of the typologies mentioned above and use them to inform the development of a framework for public participation in scientific research projects. This framework highlights the fact that the inputs and activities associated with the development of CS projects will have a significant impact on the levels of participation as well as the realisation of goals captured under the outcomes of the project. It must also be noted that the intended outcomes will have a substantial impact on the design and therefore inputs and activities.

11
Shirk et al. (2012) synthesise the outcomes described in a number of reports on public participation in scientific research. This synthesis brings together the use of the typology based on participation (contributory, collaborative, co-created) (Bonney, 2009a) with the typology based on goals and outcomes (Wiggins & Crowston, 2011). Based on an analysis across a number of case examples of CS Shirk et al. (2012) concludes that “outcomes do tend to relate to the degree to which members of the public are engaged in the research process.” They also note that “each model has strengths and limitations in terms of expected outcomes. In general, contributory projects are associated with robust scientific research outcomes and content knowledge gains, whereas co-created projects have demonstrated success in affecting timely policy decisions and enhanced resource management capacity of communities.”
More recently Jordan et al., 2015 present an expansion of the framework of Shirk and colleagues (2012) participation model and which adds texture to the levels of engagement / participation and clarifying the extent of identity, context for learning and systems-based thinking to do with the functioning of social ecological systems.
Figure 2: Types of Citizen Science Projects by level of citizen engagement (modified and after Shirk et al. and Jordan et al., 2015)
This framework is congruent with the insights and approaches developed within this research project and underpins much of the approach and insights gained during the research.
In terms of the literature related to CS there is an evident tension between definitions and practices that are focused on scientists enlisting the help of members of the public to gather scientific data, and broader definitions and practices that reflect deepening levels of participation by citizens in scientific research. In many instances these broader definitions of CS are being captured in terms such as “the future of CS” (Mueller et al., 2012) or in the catch-all phrase of “public participation in scientific research” (Shirk et al., 2012). There does however seem to be a significant convergence in the more recent

12
literature that acknowledges that “it is the inherent mix of likely outcomes (for science, for individual participation, and for social-ecological systems) that makes Public Participation in Scientific Research (PPSR) a powerful concept, particularly in fields of conservation and natural resource management where actions must respond to integrated social-ecological needs with diverse understandings and knowledges.”(Shirk et al., 2012)
According to the US EPA, CS covers a suite of innovative tools to engage with the public to apply their curiosity and contribute their talents to science and technology. Citizen scientists can provide information that would not otherwise be available due to time, geographic, or resource constraints. (US EPA, 2017).
Citizen Science tools, interventions and resources for water resource management
In order for citizens to effectively contribute to monitoring the health and condition of water resources in Southern Africa, it is imperative that an accessible and relevant toolkit for measuring and better understanding the catchment is provided. The challenge, however, is to integrate the wide spectrum of scientific tools and resources into a format for members of society to easily apply, whilst also attempting to retain an appropriate level of scientific integrity of the data. The proposed development process of the toolkit initially involved a review of existing international and local CS tools, and which then lead to the development of an inventory of the most relevant tools identified. The inventory allowed the team to identify gaps, where no suitable tools were readily available for use by citizen scientists in monitoring and assessing the different water resource types within the Southern African context. This would also inform whether the requirement is the adaption of an existing scientific tool or the development of an entirely new tool for citizens. A detailed inventory of existing available tools can be found within the https://capacityforcatchments.org/. The identification of gaps and development needs were further investigated during this project and the development of the final toolkit.
For the context of this project a tool is any method or approach or physical instrument that is used for viewing, measuring, recording and interpreting the characteristics of certain natural resources (e.g. a stream flow meter, which will measure the velocity of the water) (Lyman et al., 2007). The tools focused on for this project, are generally those which can be easily utilised by citizens, without involving lengthy procedures or complicated and expensive scientific equipment. The objective was to review existing tools which are easy to utilize and understand by possible citizen scientists who usually have no or limited experience in using scientific instruments. Some tools may even be assembled at home, using reused/recycled material (e.g. a rain gauge may be made from a plastic coke bottle). However other tools which are also more expensive or require advanced scientific skills were reviewed and included within the inventory (https://capacityforcatchments.org/).
Resources developed for this project are user manuals or write-ups that provide background information or a level of context to the water resource/ characteristic being measured. These documents will provide a level of support and guidance to the citizens using various scientific tools for assessing their water resources. The project reviewed existing resources, particularly available on a local scale, and drew on existing international resources if a gap in knowledge was identified.
An intervention, in the context of this project, is viewed as a social initiative or activity of engagement around an environmental issue or risk. These often involve meaningful social partnerships or structures with the objective of improving the management and monitoring of natural resources (e.g. River Care Teams under the administration of the Dusi-Umgeni Conservation Trust have intervened by clearing away alien invasive plant species along the banks of rivers and streams). Interventions are designed in such as way so as to engage with people and to build a better understanding of the critical and relevant environmental issues and challenges, while at the same time introducing them through situated learning

13
to the various options towards achieving meaningful change. When implemented effectively and drawing on the dynamic nature and capacity of members of society, the potential for interventions to improve catchment management and human practices is greatly enhanced.
The final toolkit (Capacity for Catchments website) consists of a comprehensive support structure of tools, interventions and resources specifically designed for citizens. The research and review process drew on many established networks and initiatives within Southern Africa which have made great strides in water resource monitoring and education at the level of communities and citizens. In this way, the research and development of the methods and tools in this project were channelled along existing networks of trans-boundary collaboration and experience.
The initial step towards assessing available tools for the toolkit involved a comprehensive review within each component of the catchment: namely rivers and streams, wetlands, estuaries, springs and rainfall (Figure 4). Within each of the water resource types, key features to be engaged with by citizen scientists were reviewed and from there further developed and/or incorporated into the project “toolkit”.
Figure 3: Division of catchment into each water system.
Figure 4: Measurable stream and river characteristics.
Water quality
Water quality refers to the chemical, biological and physical characteristics of water (Diersing, 2009). These typically relate to the suitability of water for supporting life and whether the system as a whole is healthy or not (Diersing, 2009). During the review process, measurable characteristics pertaining to water quality were reviewed. These characteristics included various physical attributes and chemical constituents related to water in aquatic ecosystems (Dallas and Day, 2004). Physical attributes reviewed included temperature and turbidity/clarity/suspended solids, while chemical constituents included the following: pH, salinity, dissolved oxygen, nutrient enrichment and microbiological activity.

14
Figure 5. Various water quality parameters identified for measuring in streams and rivers.
Nutrient enrichment
In order for aquatic plants to grow and reproduce, certain nutrients or elements are required. These include carbon, nitrogen, phosphorous, potassium, calcium, magnesium, sulphate and silica. Some nutrients are only required in smaller quantities and are termed “micro-nutrients”. Out of the list of major nutrients, nitrogen and phosphorous are the most commonly related with excessive plant growth resulting from nutrient enrichment (i.e. eutrophication) (Dallas and Day, 2004). In southern Africa, a large proportion of freshwater resources have indicated a significant increase in nutrient loads. Numerous freshwater systems have been classified as highly eutrophic or considerably transformed (CSIR, 2010). Citizen scientists can contribute to the monitoring of the nutrient levels and other trophic state indicators within the catchment and therefore improve eutrophication management.
In the United States the US Geological Survey (USGS), working in partnership with volunteers from the Chesapeake Bay Program (CBP), measure the overall nitrogen and phosphorous loads in relation to the average river inflows (see: http://www.chesapeakebay.net/issues/issue/nutrients#inline). By regularly monitoring these changes, volunteers have indirectly initiated a national remediation programme for curbing these excessive nutrient loads (http://www2.epa.gov/nutrientpollution/map-epa- nutrient-pollution-reduction-efforts. Volunteers submit water samples to the lab for further analysis or follow a set of laboratory guidelines or procedures within their own time. These procedures typically involve laboratory equipment and require out-of-field time and resources.
A more readily available and simple tool for measuring nitrate and phosphate levels is identified in the free Freshwater Watch kit (Freshwater Watch). This toolkit consists of testing tubes and colour charts for determining nitrate and phosphate levels, as well as a secchi tube for recording the level of clarity or turbidity within a stream or river. Ordered online, this water kit has grown in stature and popularity to support a global CS initiative surrounding stream and river monitoring (Freshwater Watch).
More locally, the clarity tube or transparency tube may prove to be a useful tool for measuring nutrient levels within streams and rivers (Dahlgren et al., 2004). The South African River health program has been utilising the clarity tube as an inexpensive low technology solution to managing water clarity in the absence of an expensive turbidity meter (see: http://www.groundtruth.co.za/our-products/). Research and investigation is also still underway to determine whether the tool could potentially measure nutrient loads along a defined ‘index of nutrient enrichment.

15
Algal growth can also be sampled as an indicator of nutrient enrichment. Various tools and methods can be employed, ranging from complex scientific instruments such as the BenthoTorch® to more simplified methods or indicators which could be employed by citizen scientists. The BenthoTorch®
measures algal biomass of periphyton communities (benthic bacteria, fungi and algae) present on river substrate by stimulating chlorophyll pigments by emitting various wavelengths of light (BBE Moldaenke, 2011). In various monitoring programs across the United States citizens contribute to the monitoring of algal growth and eutrophication by sampling water clarity, algal density and phosphorous concentrations (EPA, 2014). However, in these cases citizens typically use scientific instruments or collect samples for laboratory analysis, with no methods apparent for the measuring of algal growth by using inexpensive tools.
However, there is a tool AlgaeTorch® which measures chlorophyll a content of cyanobacteria, the total chlorophyll content of microalgae and the turbidity in water instantaneously. No sampling or preparation is necessary. The AlgaeTorch determines algal content in the water via measurement of the fluorescence intensity, which is proportional to the chlorophyll content of the microalgae and blue-green algae. Unfortunately, as with this BenthoTorch® the AlgaeTorch® is an expensive piece of equipment and unlikely to get much traction in a CS resource poor Southern African context.
Once the data is collected, the question is – how can it play a role towards curbing the excessive nutrient levels within freshwater systems? Potentially, nutrient data can be ‘pooled’ into a central database which ultimately assesses and represents the various spatial trends or outputs on a map or graph. Nutrient loads can then be reflected across space and time, and potentially fed into the monitoring programmes and initiatives of relevant authorities and stakeholder groups.
An additional locally developed tool includes the Stream Assessment Scoring System (miniSASS; see www.minisass.org) – a method for determining the health of a stream or river based on the presence or absence of certain aquatic macroinvertebrate groups (Graham et al., 2004). These macroinvertebrates are regarded as key biological indicators of stream and river health, based on their level of sensitivity or ability to tolerate environmental variables (such as an increase in pollutants or in invasive alien plants) (Graham et al., 2004). By recording the certain groups identified and correlating these findings with the condition of the designated stream or river, citizens are actively measuring and improving their understanding of the quality and condition of freshwater systems in Southern Africa. Recent developments have shown this tool is also relevant in other parts of the world, such as India, Australia Canada Tanzania, Mexico, Italy, etc. with the potential to spread further across the globe.
Microbiology
Microbiological water quality can cover a range of microorganisms such as bacteria, pathogens, viruses and protozoa. Knowing the microbiological water quality of a water resource is important as many human and animal diseases and illnesses can be caused by microorganisms that live in water. Given the range of microbial water quality determinants, analysis can typically involve expensive scientific equipment and laboratory procedures (EPA, 1996). As such, indicator microorganisms are typically used to indicate possible presence of other microbiological water contaminants, including diseases and viruses. The presence of Escherichia coli (E. coli) bacteria in a sample is the most widely used microbiological indicator (EPA, 1996), and which is used in particular as an indicator of faecal pollution. While being fairly harmless themselves, if a large number of E.coli bacteria are present, it indicates a high likelihood that harmful microbiological contaminants are present, such as pathogens, viruses and other illness-causing microbes.
Volunteers from the Huron River in the southeast state of Michigan are an example of how CS initiatives have proved successful towards capturing E. coli levels within the catchment (Lawson, 2012). Volunteers

16
would attend a workshop over a day and receive practical training within a specific aspect (e.g. how to measure certain water quality parameters). For bacterial levels, volunteers would regularly collect water samples at designated sites along a stream and then submit them to the local lab for testing and culturing (Lawson, 2012). While this method allows for an increase in the volume of data collected, citizens are still needed to move beyond the ‘awareness’ or passive approach, to a more hands-on, analytical approach whilst within the field. With this in mind, onsite and rapid analyses for measuring bacterial levels are required – particularly in developing a rapid dipstick method for capturing the level of E.coli within a stream or river. A number of these solutions have been explored and tested during this project.
A number of locally available tools for testing the presence of bacteria are available. As an example, this can be purchased locally and ordered online from Experilab, which includes two tubes/ droppers of methylene blue and a colour wheel. Additionally, Experilab offer a bacteria-growing kit that includes a set of laboratory equipment, such as petri dishes and agar powder (see: http://www.experilab.co.za/catalog/).
Moreover, York U’s university has developed a hydrogel based rapid E. coli detection system that will turn red when E. coli is present (Sushanta Mitra, 2016). The new technology has cut down the time taken to detect E. coli from a few days to just a couple of hours. It is also an inexpensive way to test drinking water (and estimated $3 per test), which is a boon for many developing countries. This new testing device uses the porous hydrogel matrix, developed by Mitra’s team at his Micro & Nano-scale Transport Laboratory that cages specific enzymatic substrates that release certain enzymes in E. coli cells. These enzymes then chemically react with the substrates to change colour. If there is no E. coli, the colour of the hydrogel won’t change, as there is no chemical reaction. The results of the water test can be instantly broadcast using a mobile app already developed by the team. (See: http://yfile.news.yorku.ca/2016/05/17/york-u-invention-a-breakthrough-in-rapid-detection-of-e-coli/)
E. coli Swabs
The E. coli swab was developed by Micro Food Labs as a rapid assessment to detect the presence or absence of E. coli bacteria. The swab provides an indication for the user to determine if further testing is required, based on the outcome of the test. The swab works on the principal that a sample is collected, and incubated for a period of between 18-24 hours, to allow any E. coli present to reproduce to determine if there is E. coli present or not.
Temperature
While water temperature may seem fairly innocuous, it is a parameter that can shift from natural ranges quite rapidly as a result of human impacts. Temperature changes can have a direct impact on stream biota, as well as an indirect impact on downstream biological communities. Temperature controls and affects aquatic organisms in various ways, such as influencing respiration, metabolic processes, reproductive activities and rates of development (Dallas & Day, 2004). Natural variations in temperature occur with seasonal changes and daily cycles, which act as various life cycle cues for organisms, such as emergence, migration and breeding (DWAF, 1996). As such, temperature determines which species can survive in a particular water ecosystem, with temperature changes potentially exposing organisms to lethal conditions. In addition, temperature is an important measure to pair with the sampling of other water quality determinants and indicators, to aid the interpretation of results. Temperature also affects water chemistry, most notably oxygen solubility (availability) and the toxicity of certain chemicals in water (Dallas & Day, 2004).

17
Water temperature can be affected by many ambient conditions. These elements include sunlight/solar radiation, heat transfer from the atmosphere, stream confluence and turbidity. Shallow and surface waters are more easily influenced by these factors than deep water.
Figure 6. Water temperature affects nearly every other water quality parameter
Temperature can be recorded in a number of ways, ranging from sophisticated water quality meters and automated temperature loggers, through to the use of temperature strips and simple household thermometers. Ideally, to fully capture the daily variation in temperature at a site, it should be recorded over a 24-hour period. However, if single measurements are taken over subsequent visits, they should be taken at the same time of day to be comparable (DWAF, 1996).
Conductivity, Total Dissolved Solids (TDS) and salinity.
Another important variable related to water quality, is a measure of the total amount of dissolved material within a freshwater system. This can be measured in one of three ways: as total dissolved solids (TDS), as conductivity, or as salinity. TDS is a measure of the total amount of dissolved material, while conductivity measures the ability of a water sample to conduct an electrical current. Salinity is an indicator of the total amount of dissolved salts and is derived from a conductivity measurement (Dallas and Day, 2004).
In the context of this CS project, a hydrometer has been identified as a possible CS tool for measuring total dissolved salts. This instrument measures the specific gravity of a liquid and consists of a cylindrical stem and bulb filled with mercury or lead, allowing it to float. While this describes the more complex scientific representation of the tool, methods and apparatus have been identified for making simple hydrometers from home (http://www.wikihow.com/Make-a-Hydrometer) and in the estuary tools report for this project.
Additional tools for measuring the above parameters include salinity meters and electrical conductivity meters. While these instruments usually entail a rapid, onsite measurement and can be purchased from local laboratory suppliers, these do tend to be more costly.
Water odour & water appearance
Water odour can be regarded as another parameter for assessing stream and river quality. The Environmental Protection Agency (EPA, 1996) has developed a simple index for volunteers for

18
monitoring and categorizing the odour of water. This index is simple to use and simply requires that a manual or guide be on hand when conducting the assessment. Notably the index currently exists as an assessment component of the Stream Habitat Walk conducted by volunteers under the Environmental Protection Agency (EPA, 1996). See: http://water.epa.gov/type/rsl/monitoring/vms41.cfm.
An additional index assessment utilised by volunteers of the Stream Habitat Walk, includes a visual assessment of a designated portion of a stream (EPA, 1996). While walking along a stream or river section, volunteers are required to capture the general aesthetic appeal of these systems. Characteristics measured include: instream, stream bank, channel, and biological characteristics (EPA, 1996). When conducted on an annual basis, such data captured by citizens can play a key role towards identifying issues and finding solutions for improving the visual aesthetics of the catchment (EPA, 1996). The RHA tools developed within this CS project has adopted a locally developed tool (IHI) to do a similar thing and incorporates visual aspects of the health of a stream into a broader assessment of the health of the stream/river.
Clarity/turbidity
Clarity or turbidity is a measure of cloudiness or haziness of water, based on the amount of dissolved and/or suspended particles within a stream or river (EPA, 1996). In the United States, various LakeWatch volunteers have successfully monitored the water clarity of lakes over an extensive period (EPA, 1996). Resources are available for citizens online and can be accessed as required (see: http://www.ecy.wa.gov/programs/wq/plants/management/joysmanual/secchi.html).
The clarity tube has emerged as a viable tool for measuring water clarity (Dahlgren et al., 2004). This tool has the additional potential for measuring suspended particles, as well as nutrient levels within a column of water. In addition, the secchi tube and secchi disk are additional tools for measuring water clarity or turbidity. Internationally the secchi disk has been consistently utilised for measuring water clarity in lakes (see: http://www.secchidipin.org/secchi.htm). However, streams and rivers have also been assessed using a secchi disk (http://www.chesapeakebay.net/discover/bayecosystem/waterclarity). The secchi tube is also a popular tool (Minnesota citizen stream monitoring program, 2011 or Illinois Volunteer Lake Monitoring Program, 2014). Each of these tools could potentially be made from home using simple materials, such as a plastic tube, string or wire and a laminated cardboard with the secchi disk pattern.
Water quality monitoring tools
Basic test kits for monitoring and measuring a variety of water quality parameters and indicators were also reviewed. On a local level, a ShareNet booklet is available, which describes the way in which each of the various parameters are measured. This is entitled: “GREEN, Water Quality Monitoring in Southern Africa”. Characteristics include: water life, oxygen as well as chemical and physical factors.
A comprehensive water quality testing kit is available under the World Water Monitoring Challenge (WWMC, 2013) for measuring a set of basic water quality parameters. Emerging as an international education and outreach program from the World Water Monitoring Day in 2012, the WWMC has grown in popularity and prominence across a wide range of citizen groups and stakeholders (see blogs: http://www.monitorwater.org/blogs.aspx).
Key stream and river parameters measured by the basic test kit include pH, turbidity, temperature and dissolved oxygen (DO) (WWMC, 2013). The basic testing kit consists of one set of hardware equipment and a sufficient supply of reagents to conduct 50 assessments for each of the parameters. Educational

19
resources, guides and lesson plans are available for download on the main website (see: http://www.monitorwater.org/Guides_Lesson_Plans.aspx). A classroom kit is also available with the same set of hardware and reagents, similarly allowing for 50 assessment cycles (WWMC, 2013).
Local interventions that have surfaced as meaningful platforms for encouraging citizen participation have been provided within the inventory (https://capacityforcatchments.org/). Locally based interventions have particularly emerged as a strong growing field within recent years (e.g. EnviroChamps) (Taylor, 2013). However, a noticeable inclusion from the Environmental Protection Agency included the “Stream Habitat Walk” (EPA, 1996) as a popular social volunteer initiative – this included a physical walk performed by the volunteers, while utilising an array of scientific material and tools.
An ultra-low-cost approach for large-scale monitoring of water quality has also more recently been developed (see Sicard et al., 2015). It combines the use of paper-based sensors, a smart-phone with camera and a webpage. An app performs image analysis of the paper sensor and geo-tags the sample location. The phone then sends the data to a central website where the results are directly displayed on a map (see: http://www.sciencedirect.com/science/article/pii/S0043135414008379).
Other ICT and smart phone technologies are also emerging and have emerged over the duration of this project. For example, the first water quality handheld designed to integrate with a mobile is: The smarTROLL Multiparameter Handheld system. It allows data collection on 14 water quality parameters, all from an Android™ or iOS™ mobile device (In-Situ Inc., 2017). The water quality sensors record conductivity, pH, ORP, dissolved oxygen, water level/pressure, salinity, total dissolved solids, resistivity, density, air and water temperature, and barometric pressure, sending data wirelessly to the smartphone or tablet. However this tool is still likely to be too expensive to be affordable for most CS projects in Southern Africa.
Geomorphological characteristics
The assessment of the geomorphology of rivers (fluvial geomorphology) aims to understand how the form and flow patterns of streams and rivers are driven through interaction with the landforms around them, be they steep or flat, rocky or sandy. Various assessments can be undertaken to investigate the geomorphological drivers of the stream biophysical habitat. Substrate analysis looking at particle size and grain size distribution gives clues to the fluid dynamics of the river, dominant sediment transport mechanisms, and geochemistry.
For citizen scientists, the sketching of the different biophysical and geomorphological characteristics of a river, such as different biotopes, areas of deposition/erosion, bank features, etc. also form a simple and useful tool for the assessment of geomorphology and change over time. Combined with cross-sectional and longitudinal profiles, erosion pin monitoring, fixed point photography and sketches of features, can be used to investigate the hydrological and geomorphological drivers of the stream biophysical habitat, and to monitor changes over time (https://capacityforcatchments.org/). The various geomorphological attributes of rivers, such as bed substrate, hydraulic biotopes present and channel biophysical structure all influence the kind of fauna and flora which inhabit the in-stream, fringe and riparian habitats.
The Pebble Count Method (Wolman, 1954) is one such method for measuring stream substrate. The Wolman Pebble Count Method requires the observer to measure the sizes of random particles using a steel gravelometer, a technique which can be adapted for application by citizen scientists through the development of a cardboard or laminated sheet gravelometer, and simplified method.

20
Rowntree and Wadeson (1999) introduce the concept of a hydraulic biotope for use in the classification of South African Rivers. A hydraulic biotope may be defined as a spatially distinct in-stream flow environment characterised by specific hydraulic and substrate attributes. Rowntree and Wadeson (1999) describe nine ecologically significant hydraulic biotopes common within South African rivers, which include pools, riffles, runs and rapids. The different hydraulic biotopes provide different habitat niches for various in-stream fauna and flora species, with preferences for specific hydraulic and substrates for habitation, feeding, breeding, etc. Certain measurements and tools can also be utilised to measure the level of bank erosion along a stream or river. Cross-sectional and longitudinal profiles, including bank measurements and the use of erosion pins are useful measures for characterising the geomorphology of the river and monitoring change in stream morphology over time. Longitudinal profiles, combined with sketches and additional measurements, can map out the locations of riffles, runs, and pools, and calculate longitudinal slope and how these may change over time. Similarly, erosion pins are steel bars driven in to the ground, which when monitored can indicate changes in channel and bank form, as well as deposition and erosion changes over time.
The River Habitat Survey (RHS) is a standard method for assessing the overall physical character and habitat quality of rivers, developed by the National Rivers Authority and the Environment Agency of the United Kingdom through extensive use and testing in the United Kingdom since 1994.The user must be able to recognise vegetation types and have an understanding of basic geomorphological principles and processes, such that specialist geomorphological or botanical expertise is not required to perform the survey (Environment Agency, 2003). The GeoRHS is a development of the RHS, with a refined geomorphological and floodplain component, but with added complexity which may not be suitable for CS applications. In the United States, the Maine Department of Environmental Protection have a Stream Survey Manual which includes the assessment of fluvial geomorphology (MDEP, 2010).
Figure 7: Measurable geomorphological characteristics of streams and rivers.
Stream velocity & discharge
Stream discharge can be defined as the volume of water that travels down a stream or river per unit time; while velocity captures the speed at which water flows (EPA, 1996). Stream discharge can be calculated by multiplying the area of water within a cross-section of the channel, by the average velocity of the water within that cross-section (i.e. velocity X cross sectional area) (EPA, 1996). Numerous methods can be utilised to measure velocity and the cross-sectional area, however a common method includes the current meter or flow meter (EPA, 1996; also see: http://water.usgs.gov/edu/streamflow2.html;. Equipment that is typically required to accompany the current meter during measurement includes: a steel tape and wading rod, which ultimately assists in the measurement of the cross sectional area of a river or stream. The use of such equipment along with the flow meter, does require a level of pre-training and knowledge of the scientific formula and processes at play and therefore may require a CS workshop to support the uptake of this tool
An additional well-known method recognized both internationally and locally for measuring stream velocity, includes the ‘floating object’ method (EPA, 1996). This method simply involves a tape measure

21
and stop watch. Additional components of the method include: an orange or plastic ball (equivalent in size to an orange) as the floating object; wooden stakes; heave duty string; and a calculator (EPA, 1996). This method is easy to apply and comprehend.
Another method to measure the discharge in a stream is the Bucket Method. It requires a stopwatch, a large bucket, and preferably two to three people. The volume of the bucket or container needs to be measured. Then a location along the stream that has a waterfall is needed to take the measurements. If none can be found, a waterfall can be constructed using a weir. Finally, with a stopwatch, this method consists in timing how long it takes the waterfall to fill the bucket with water.
A locally available tool for measuring stream velocity includes the Transparent Velocity Head Rod (TVHR) (Fonstad et al., 2005) for simplifying stream velocity measurements and ultimately supports stream flow monitoring by citizens. This is a simply constructed tool consisting of a transparent plastic rod or plank and hard wood meter sticks (Fonstad et al., 2005). The equipment utilised is less expensive in comparison to high quality current meters and is therefore more affordable for citizen use. Due to its lightweight and ease of use, people are able to perform onsite rapid velocity measurements. The advantage of using this tool is that it can similarly capture stream depth and correlate these measurements to stream velocity and discharge.
Figure 8: Tools utilised to measure stream and river velocity.
Figure 9: Tools or methods identified for measuring stream and river discharge
Stream stage – visual assessment
A simple visual assessment-based index for estimating stream stage was utilised by volunteers under the Minnesota Pollution Control Agency (Minnesota Citizen Stream Monitoring Program, 2011). Involving a manual that visually depicts a set of basic stream levels (e.g. L=Low where the water covers 1/3 or less of the distance from the stream bottom to the top of the bank; H=High where the water covers 2/3 or more of the distance from the stream bottom to the tops of the bank; and d=dry where the stream channel is completely dry, etc.). By providing graphics of the various stream and river levels, as well as a brief explanation as to what each level indicates, this index provides a simple method for raising citizens’ awareness to the amount or volume of water within streams and rivers. Other visual assessment methods exist, such as The Stream Visual Assessment Protocol (SVAP), developed by the Aquatic Assessment Workgroup of the Natural Resources Conservation Service (NRCS), 1998.

22
Recreational suitability
In terms of recreational suitability, a useful assessment titled the “User Perception Assessment” was identified from the Minnesota citizen stream monitoring program, regularly conducted by stream and river volunteers within the State (see https://www.pca.state.mn.us/water/water-monitoring-and-assessment for details). This volunteer stream monitoring program was developed under the Minnesota Pollution Control Agency as a means to engage with and educate citizens about water quality and other issues surround streams and rivers. Volunteers are initially provided with a manual that takes them step by step through the various stream or river assessments, providing an explanation as to why each of the parameters is measured (such as water clarity for example) and what tools are required for measuring (for example the secchi or water clarity tube).
The “User Perception Assessment” includes two visual assessments that are conducted by the volunteers: namely the Appearance; and the Recreational Suitability assessment (Minnesota Citizen Stream Monitoring Program, 2011). Both assessments are conducted using an index provided within the volunteer manual and can therefore be easily applied by citizens. These indices may present as an adaptable and/or useful addition to the CS toolkit.
Surrounding land uses
An additional useful index for stream volunteers was identified within the EPA Stream Volunteer Monitoring Manual (1996) – namely an index that allows citizens to record and document the various land use types within the catchment. Land use types that are documented as either being a “1” for present or a “2” for carrying a definite impact, can be categorised into the following: “Residential,” “Roads,” “Construction under way,” “Agricultural,” “Recreation” and “Other.” This method of assessing key land use types, as well as the level of impact these have within a catchment, can be viewed as a practical and workable inclusion within the toolkit.
Further review of stream and rivers tools from an international perspective, brought various surveys to the surface. One such survey that may include some useful additions to the toolkit is the EPA’s Watershed Survey (EPA, 1996). This survey is a component of the EPA’s volunteer stream monitoring manual and aims to measure the health of a catchment using citizen scientists (EPA, 1996).
The Watershed Survey is conducted on an annual basis, where the purpose is for each community to monitor a designated portion of a stream or river, thereby capturing the nature and extent of the various transformation processes occurring within the catchment.
The Water Survey consists of a once off background investigation of the catchment and selected stream. This involves reading up about the history of the area; identifying the previously recorded change in land uses; assessing photos, historical records as well as oral histories; and then mapping the stream on a topographic map (EPA, 1996). The second component of the Watershed Survey entails a periodic visual assessment of the stream, whereby volunteers walk along the stream and drive through the catchment, where they observe and record the key issues and features identified (EPA, 1996). Pre-defined aspects are recorded on a field sheet while conducting the drive and walk. A detailed sketch of the stream within the catchment is also captured, whereby the land uses, key concerns, and health of the stream are reflected. The field sheet is then submitted to the necessary local authorities for review and then integrated and modified into an annual catchment health report. This survey is useful in that citizens are encouraged to become more conscious and actively engaged with the key driving forces within the catchment.

23
During this project this “River Catchment” walk survey was further developed and tested and refined – whereby volunteers from various local NGOs were able to undertake a source to sea catchment walk and using a number of other CS tools developed or refined within this project, establish and report on the health and condition of this river and riparian zones along the walked river reaches.
Citizen Science tools, interventions and resources for wetlands
When reviewing the available tools, resources and interventions for citizens to monitor the health and condition of wetlands, certain parameters were identified and researched, such as ecosystem goods and services, hydrology, and vegetation, etc. A wide range of monitoring programs and interventions emerged for measuring these individual parameters, typically accompanied with citizen-based monitoring manuals; basic biological survey materials of key fauna and flora as well as supportive information or educational resources.
Internationally, many CS programs have been initiated around the monitoring of wetlands, such as the University of Wisconsin’s ‘Monitoring your Wetland’ resource page (www.wetlandmonitoring.uwex.edu), the Milwaukee County Parks Citizen Science Wetland Monitoring Program (http://county.milwaukee.gov/CitizenScienceOpportunities), the Watsonville Wetlands Watch (www.watsonvillewetlandswatch.org) and the Adirondack Wetland Monitoring Program (www.adirondackvic.org). While the University of Wisconsin and Watsonville Wetlands Watch include citizen monitoring of water quality and aquatic invertebrates, the majority of these programs focus around citizens’ gathering data covering sightings and distributions of flora and fauna, particularly avifauna and other charismatic or endangered species.
Within the South African context various environmental education resources are available covering wetlands, and a few CS monitoring programs have been initiated, mostly focused around fauna and flora sightings, distributions and censuses (i.e. the Zandvlei Trust Co-ordinated Waterbird Annual Count (CWAC, 2014)).
WESSA Share-Net has available several environmental education resources covering wetlands, with titles including Wetlands and People, How Wet is a Wetland, Peatlands of South Africa and a Wetlands Pack. The WESSA Share-Net Enviro Picture Building is an innovative intervention and tool used in training programmes to encourage participants to visually picture and interpret the impacts that various land use types and processes have on water resources.
In terms of web-based databases and resources the Virtual Museum of the Animal Demography Unit (vmus.adu.org.za) provides functionality for citizens to upload and contribute sightings and observations of various species groups, including mammals, frogs, reptiles, birds, trees, etc. iSpot (www.ispot.org.za) has also provided amateur nature enthusiasts through to professional scientists the facility to upload and share sightings of virtually any species encountered.
In April 2014 MLab were local hosts to the International Space Apps Challenge, where a local team solving the ‘track that wetland’ challenge was judged worthy of advancing to the global judging round. The mobile phone application developed allowed citizen scientists to observe plant communities associated with wetlands, enabling them to delineate the wetland boundaries. The application guides citizens to locate the edge of a wetland, where coordinates can then be uploaded, as well as photographs or other additional information. This data can then be used to validate or calibrate high-resolution remote sensing products for wetlands (MLab, 2014).

24
While some tools touch on wetland vegetation (mostly from a census perspective), no tools are available in the South African context allowing citizens to monitor and assess the health of wetlands in terms of their hydrological or geomorphological integrity (i.e. maintenance of seasonal or permanent hydromorphic soil conditions). WET-Health is a South African developed technique for the rapid assessment of wetland health (i.e. for the measurement of ecosystem goods and services), but which is aimed at competent scientists with appropriate background, training and experience (Macfarlane et al., 2007). WET-Health is comprised of hydrology, geomorphology and vegetation modules (water quality is dealt with superficially), where the practitioner undertakes an assessment of impacts and present state, as well as trajectory of change to determine an overall health category. Similarly, WET-EcoServices is a South African developed technique for rapidly assessing ecosystem services supplied by wetlands, aimed at scientists (Kotze et al., 2007). The tool scores the importance of a particular wetland in delivering each of 15 different ecosystem services. Prior to this project no technique were yet developed in South Africa for citizen scientists to formally assess the health or level of ecosystem services provided by a wetland. However, this project has developed and tested a protocol for CS assessment of wetland health and which will be reported on in subsequent chapters.
Figure 10: Key characteristics that can be measured for assessing wetland health.
Estuaries are quite distinct in comparison to rivers, having unique characteristics which need to be considered when developing CS tools and resources. While one can sample aquatic health at a single site on a river, and determine the health of the reach, estuaries are discrete entities, which must be assessed as a whole in order to assess health and functioning. As part of the review, the key characteristics as per Figure 10 were assessed. It must be kept in mind, that each of the some 280 estuaries in South Africa are unique, and have a unique suite of biophysical features driving their functioning and ecology. Estuaries are also dynamic, with habitats and species driven and maintained by dynamic process, which can shift rapidly over time.
In reviewing available resources, tools and interventions surrounding estuaries, the U.S. Environmental Protection Agency methods manual for estuaries, stands as a sound, well developed volunteer estuary monitoring platform for review and insight into the South African context (EPA, 2006). This is a comprehensive document covering all aspects of planning and covers aspects such as how to collect data, how to survey for fauna and flora, training, quality assurance and funding through to data management, interpretation and presentation. Measurable characteristics (such as water quality conditions) and recommended interventions (such as initiating a local “marine debris” clean-up day around an estuary) are covered extensively within the manual.
From the literature it appears that South Africa has no published programme for CS monitoring of estuaries. Various educational tools and resources covering estuaries have been developed by various parties, but no citizen-level rapid assessment or monitoring tools have yet been developed. WESSA

25
Share-Net has available a field guide for estuaries, developed in collaboration with multiple partners. Titled ‘Hands-on; East Coast Estuaries and Mangroves’, the field guide doubles as an environmental education resource providing an introduction to estuaries, notes on key species and habitat components, as well as various interesting facts. However, the hands-on guide does not cover monitoring aspects and the gathering of CS data within estuaries.
The role that CS tools and resources can play with regards to the monitoring and management of estuaries in Southern Africa includes the following:
� At a national scale, promoting education and awareness about the ecology and dynamics of estuaries, and the important roles estuaries play in ecological services provision.
� At a local scale, gathering knowledge and data covering a particular estuary, in order that a greater understanding of the estuary, its’ drivers and impacts can be gained.
� At a local scale, promoting and supporting the community ‘ownership’ of each estuary, and hence engender a sense of responsibility to care for the estuary, monitor impacts and changes, and contribute toward mitigation and management.
At a national scale, promoting education and awareness of estuaries can be covered by generic environmental education resources covering all estuary types present in Southern Africa. An individual estuary is a complex, dynamic and unique ecosystem. Thus, at a local scale, in order for CS to effectively contribute toward the assessment and monitoring of a particular estuary, some initial degree of understanding or assessment of the estuary needs to be undertaken in order to identify which monitoring components are appropriate or applicable.
In consultation with the EPA methods manual and the estuarine specialist in the project team (R Taylor pers. comm., Sep 2014) it is apparent that there are various biophysical characteristics of estuaries that can be sampled and monitored at different levels of complexity. Each subsequent level requires an increased degree of background knowledge and access to resources, tools and instruments. A Day at an Estuary, is the development of an educational resource and CS monitoring tools for estuaries and explore all of these elements – a product of this research project.
Figure 11: Key characteristics that can be measured for assessing estuary health.
In the pre-colonial history of South Africa, fountains and springs were an important water resource, with South Africa having a variety of natural springs, including karst and thermal springs. Springs still play an important role in rural water supply, as well as for serving religious and/or medicinal purposes. This is particularly the case with thermal springs, which often form centres of culture, health and tourism (Olivier and Jonker, 2013). As a rural water supply, springs play an important role in the supply of water which is less likely to be contaminated than river water, and which may also flow for longer periods and more regularly through the year. However, water quality records gathered from some springs of cultural and water supply importance have shown that water quality from these springs often does not meet

26
South African drinking water and/or domestic use standards (Faniran et al., 2001, and Olivier and Jonker, 2013). While in some cases this may be related to contamination, spring water quality is also naturally driven by the chemical composition of the underlying rock and soil and is a factor of how long the water has been trapped underground (Faniran et al., 2001). In the case of thermal springs in particular, unacceptably high concentrations of potentially hazardous minerals introduce health risks for human consumption and contact (Kotze, 2013).
The collection of data covering the location, condition and use of springs across South Africa can play an important role in education and awareness, while also gathering important information to facilitate the protection, sustainable management and optimal use of springs in South Africa. Very limited data has been collected in South Africa covering the location, physical and chemical characteristics, as well as well as the social aspects of South Africa’s springs. In a recent study on thermal springs in South Africa (Olivier and Jonker, 2013), a huge amount of knowledge was gathered with new thermal springs even being discovered (Kotze, 2013). Local communities proved helpful in providing directions to springs, as well as stories of springs illustrating the cultural significance. The type of information that could be gathered by citizen scientists includes location, type of spring (i.e. karst, thermal), typical use and ecoservices provided (water supply, religious, cultural, medicinal), current health/integrity and risks/impacts, basic water chemistry, seasonal flow characteristics as well as details covering the management and protection of the spring by the local communities or land owners. Measurable characteristics that could be potentially measured by citizens can include: a record of the type of spring; the GPS location of the spring: various water quality parameters; a visual observation of the spring; and a record of the land use types within the catchment, etc.
In the United States, the Black Rock National Conservation Area supports a Spring Monitoring Project (http://blackrocksprings.blogspot.com) within the Black Rock Desert-High Rock Canyon Emigrant Trails National Conservation Area. Volunteers collect data covering the location, characteristics and health of the springs, as well as water quality for the Bureau of Land Management.
Within South Africa no CS monitoring projects relating to springs could be found, and it appears that limited research has been undertaken covering the physical and chemical characteristics, ecosystem services and use, as well as protection and management of springs by communities.
A tool to assess springs was modified from a similar tool used to assess rivers and developed and tested as part of this project.
Figure 12: Key characteristics that can be measured for assessing spring health.
Beyond the formal recording stations of the South African Weather Service (SAWS) and other government or parastatal organisations, rainfall records collected by private individuals have long been a valuable source of rainfall data in Southern Africa. In the development of a Raster Database of Rainfall

27
for Southern Africa (Lynch, 2003), 9% of the South African gauges used where recorded by private individuals (over 1000 in number).
The number of active rainfall stations in South Africa began to decline in 1938, with the decline becoming ever sharper since 1980 (Lynch, 2003). The sharp decline in the monitoring network is expected to continue given the current challenges faced by government and parastatal organisations. As such the gathering of rainfall data through CS is of increasing importance, particularly given the growing pressures on our water resources, linked to population increases, development expansion and climate change.
Citizen-gathered rainfall data can range from the use of a home-made rain gauge measured at daily or monthly intervals, through to privately owned Automatic Weather Stations (AWS) collecting detailed data covering a range of parameters. The Water Research Commission and other organisations involved in environmental education around water resources have produced resources detailing the construction of simple home-made rain gauges from common household items.
With decreasing cost, the increased use of Automatic Weather Stations by commercial and private individuals provides a significant opportunity to contribute to a national database of weather data gathered from alternative sources (beyond the SAWS). The great advantage of receiving data from AWS via live data feeds, is that it provides valuable extra data for meteorologists in forecasting, particularly the onset and movement of severe weather events (Tweddle et al., 2012). International weather websites such as Weather Underground (2014) can draw on ‘personal weather stations’.
In 2011 the Met Office of the United Kingdom launched the Weather Observations Website (WOW, 2014), which allowed non-government weather enthusiasts to submit and share their own weather data, whether collected manually or by automated means. In the first 12 months more than 38 million observations were submitted from over 2000 monitoring sites (Tweddle et al., 2012).
In the United States the Community Collaborative Rain, Hail & Snow Network (CoCoRaHS) is a non-profit, community-based network of citizens who measure and map precipitation (rain, hail and snow). CoCoRaHS has an interactive website (www.cocorahs.org) where data can be uploaded and viewed, and which contains various resources to train and educate volunteers in correct precipitation measurement. The website includes guidelines and instructions covering rain gauge purchase and installation, snow measurement as well as how to make your own hail pad instrument for recording the location, time, size, quantity and hardness of hailstones. The real-time precipitation data gathered is then open for public use by a wide range of users from the national weather service to commercial entities, farmers and outdoor recreation enthusiasts. The Arizona Rainfall Roundup (http://rainlog.org) forms a similar resource and website, but only covering Arizona State.
One common concern with the inclusion of citizen-collected data is quality assurance. Firstly, such databases are either maintained separate from formally gathered data, or alternatively, if included in formal databases, then the source of the record is labelled appropriately. Secondly, within the database of citizen-collected data a rating can be applied to each ‘station’, based on the quality of the equipment or training level of the personnel collecting the data (Tweddle et al., 2012).
The key challenge identified is this WRC project was in finding a suitable long term institutional home for the collection and curation of rainfall and weather data that CS may produce using tools developed by this project.

28
Towards a framework (conclusion)
In working towards a framework for building better catchment management processes through CS it is important to consider a number of insights that have emerged within this literature review. These include the importance of stakeholder engagement, the forms that this engagement takes, the outcomes that we have in mind and ultimately the relationship between learning, knowledge and change. Socio-ecological systems are by their very nature complex, contested, changing over time and highly contextual. A number of authors have noted that collaborative governance in which citizens, government and the scientific community work together is a more appropriate approach to the integrated and adaptive management required within socio-ecological systems. Irwin (1995) in particular has noted that CS offers the possibility to increase “environmental democracy, scientific literacy, social capital, citizen inclusion in local issues, [and] benefits to government”.
In developing a framework there is a need to find learning and change processes that enable broader participation of stakeholders in monitoring, representing and responding to water management issues. A number of typologies of CS point to a growing democratisation of both the scientific engagement with local levels and more specifically the deepening of participation of citizens in all aspects of the scientific process.
An important part of the process of engaging stakeholders is the development of shared or at least explicit understanding of the outcomes that various interest groups bring to the collective endeavours aimed at building better management practices. The relative balance between scientific rigour, broad participation and engagement of stakeholders and the development of individual skills and knowledge will be influenced by the design of the CS project.
Social learning provides a number of insights into the kinds of design considerations that need to be taken into learning and change processes associated with complex, contested, emergent and contextual issues. A key amongst these is a commitment to reflexivity or the ability to question deeply held assumptions in the company of others who may hold very different views.
Conclusion
The literature shows a strong interplay between CS, social learning and change in water-catchment and resource management activities. A learning platform is needed for effective quality learning and change to take place. Without such a social learning platform, CS activities may generate little sense-making among participants whose role may be limited to just data collection for someone else to use, thus losing the opportunity for learning and agency. Jordan et al. (2015) emphasize the increased value of recovery in systems-based thinking with increasing levels of participation and greater transfer of scientific skills. CS facilitators will thus have more success and make a better contribution to society if their efforts are geared towards user engagement rather than data extraction. By facilitating the cultivation of new or strengthening of existing social learning platforms of forums, CS will provide both the expert water scientists and the novice or experienced citizen with the opportunity to contribute knowledge, learn and act in informed ways that can result in lasting change. The challenge for improved transboundary and local water resources management falls on four major stakeholder groups to consider engaging social learning in CS for solution seeking and improved water governance. These are:
� local authorities who distribute water � catchment management authorities who supply water � scientific researchers of water quality

29
� concerned citizens.
For a more comprehensive literature review on social learning and CS the reader is referred to Deliverable 4: Literature Review. Report to the Water Research Commission By: Mark Graham, Jim Taylor, Mike Ward, Tichaona Pesanayi, Louine Boothway, Simon Bruton & Sarah-Lynn Williams. GroundTruth and WESSA (Wildlife & Environment Society of South Africa) Project No. K5/2350

30
CHAPTER THREE: THE DEVELOPMENT OF CITIZEN SCIENCE TOOLS
Overview of general development of Citizen Science tools
The literature review found that the scope of CS is broad and there are numerous opportunities in terms of development areas and CS tools. However, this project did not have the scope to delve into all of the identified areas, therefore a set of CS tools were chosen for development under the project. These tools make up a toolkit that focuses on catchment scale, CS monitoring and management. This chapter focuses on the broader scale development of each tool, the detailed user guides, field sheets and other tool-specific information is available on the Capacity for Catchments website. The CS toolkit that has been developed and refined include the following CS tools:
� Aquatic biomonitoring tool – miniSASS � The Riparian Health Audit � The Water Clarity Tube � The Transparent Velocity Head Rod � The Wetland assessment tool � The Estuary tool � The Spring tool � CS Rain Gauge � Weather monitoring tools � School lesson plans
Aquatic biomonitoring tool – miniSASS – mini Stream Assessment Scoring System
miniSASS is a low technology, scientifically reliable and inexpensive participatory tool which can be used by anyone to monitor the health of a river. miniSASS is a CS version of the SASS5 method, the difference being that miniSASS includes thirteen family groups of macroinvertebrates whereas as SASS5 involves the identification of over 90 species. The user should collect a sample of macroinvertebrates from a range of habitats and flows within the river (if possible). The user can then use the miniSASS dichotomous key (Figure 13) to identify the groups. Each family group of macroinvertebrates is allocated a score based on the species’ sensitivity and tolerance to pollution, etc. Depending on which groups are found, a total score relating to the present ecological state of the river is identified, the present ecological state falls into a health class category ranging from natural to very poor (Figure 14).

31
Figure 13: miniSASS dichotomous key
Figure 14: miniSASS ecological categories
Six years after its original development, the miniSASS tool was further refined (version 2) following an audit of users’ needs, expectations and the perceived limitations of miniSASS with the updated version subjected to field testing (WRC Report KV 240, K8/733). The upgrade of miniSASS identified the need for miniSASS generated results to be submitted to a central database where results could be gathered, checked, stored and shared by national and international communities, with the most viable option being

32
submission of data into an online map-based data portal with geospatial mapping (Graham, 2009). This project was thus initiated to further develop the miniSASS package as a CS river health monitoring tool through the development of a dedicated website and tailored database for the universal capture, exploration and sharing of miniSASS data by citizens. An active, user-friendly central internet data portal for miniSASS data submission would empower citizen scientists to become part of an international network of river health monitors. The online map-based data portal is in the form of a website (http://www.minisass.org/en/) which provides a dedicated home for miniSASS data.
miniSASS scores can be uploaded onto the miniSASS website where an interactive map is used as an ever-growing database of miniSASS results not only in South Africa, but globally. A key limitation to effective water resource management is the lack of data covering the quality of water resources as a result of the shortage of facilities and skilled people to collect and analyse the data (UNEP, 2008). Furthermore, the need for capacity building, public awareness and participatory approaches are crucial to the sustainable management and monitoring of African water resources, particularly those which are trans-boundary in nature (African Water Vision, 2000; UNEP, 2008).
The miniSASS website supports the database and is based on a Content Management System (CMS) such that basic website content can be edited and updated by an administrator with basic training or experience in desktop publishing. The home page (figure 16) includes an introduction to the website and a brief overview of the miniSASS method as well as a ‘latest news and events’ scroll bar where announcements, etc. are displayed. The website is aimed at all miniSASS users which covers a wide public spectrum, such communities, schools, government departments, conservancies and enviro-groups. Users that are interested in water quality are able to browse and search for rivers and obtain miniSASS data.
Figure 15: screenshot of miniSASS website map

33
Figure 16: miniSASS website home page, a useful aspect of the miniSASS website is that it allows for citizen scientists to use it (for free) as a monitoring and management tool. Figure 15 above illustrates the extent of miniSASS monitoring taking place in the Umgeni catchment area, a testament to the abilities and contributions of the miniSASS website to the broader Citizen Science community.
Additionally, users of the miniSASS website users have the option to include additional data and results not limited to their miniSASS scores. On uploading a miniSASS score there is option to include other water quality and temporal data, this option allows the user to monitor the water quality of their river on one platform as well as contribute to a greater picture of a CS database.

34
Figure 17: Screenshot of miniSASS observation details
Furthermore, the miniSASS website allows for temporal data to be recorded. A site can be routinely monitored and each sampling event can be recorded under the same ‘crab’ or sampling site on a website for ease of long term monitoring and comparisons, see Figure 18 below. This access to temporal data by viewing at the tabs on a particular site is useful for analysing trends and changes over time at a particular site. Results can be searched through a filtered system so that the user can find a specific site/observation.
Figure 18: miniSASS site monitored over a period of time

35
Figure 19: Temporal trends in miniSASS site data for a particular site
Within this project cycle the method was also further tested, developed and refined, various cell phone applications (Apps) developed and tested, and in particular significant additional functionality added to the miniSASS website. Key aspects of improved functionality include:
� Ability to capture and display multiple records from a single monitoring site (temporal data) � Filtering and display of data – by different sites, users, organisations, rivers, date ranges, and
even aquatic invertebrate types � Display of schools on the same map to locate sample sites in relation to local schools � etc.
Perhaps most significantly the miniSASS tool was translated into isiZulu, Afrikaans, French and Swahili, and has been actively used in many other countries outside of just South Africa. It has also formed the backbone of many training courses which have allowed for wider CS engagement around water resource management across multiple continents. With the increased pressures on our water resources, and while citizens are increasingly questioning service delivery and their basic rights to water, sanitation and a healthy living environment the understanding, management, monitoring and reticulation of water resources and services is of growing importance within the public sphere. Given all of these factors, miniSASS is becoming an increasingly important tool, empowering citizens to monitor, understand and tell the story of the state of their local natural water resources. The tool has also been supported with additional resource materials to make the use and application of the tool easier and more accessible to all user groups, for example, the poster developed within this project and presented below.

36
Figure 20: Poster in support of “how to do a miniSASS” study.
There has been continual growth in the number of contributions to the miniSASS website, both in terms of geographical coverage (provincially and internationally), number of users/contributors, number of sites added, and numbers of different organisations contributing. A summary map and table of users follows.

37
Figure 21: Global distribution of registered miniSASS users uploading data to the miniSASS website
There are a number of schools, universities, NGOs, student and companies who are using the miniSASS method on a regular basis. The continuous and expanding use of the miniSASS method is contributing to a comprehensive CS database, tackling the primary issues of:
� data availability around river health within the region � expanded and engaged understanding of river health issues by citizens � co-engaged development of better management of water resources within the region.
Numerous examples exist of miniSASS’s uptake and application by citizen scientists to measure and report on river health, with perhaps the earliest version being some of the River Walks conducted around the Midlands of KZN by the NGO group DUCT. An example of the type of product and output from this CS tool is presented in the following figure.

38
Figure 22: The DUCT uMngeni River Walk route 2012.
Figure 23: A graph showing the river health data gathered from the uMngeni River walk – as indicated by the miniSASS tool.

39
A periodic miniSASS newsletter is produced and distributed to an ever-growing national and international audience of miniSASS users and other interested parties. This features stories and photographs that are provided by miniSASS users, conservancies, schools, etc. Citizen scientists are encouraged to send their stories to the miniSASS email address along with photographs and miniSASS results for a chance to be featured. There have also been ‘special addition’ miniSASS newsletters whereby the entire edition has been dedicated to a specific event such as National Water Week or Mandela Day. Furthermore, the extensive distribution database allows for the miniSASS newsletter to be a platform for advertising CS, books, conferences and upcoming events, as well as just generally building on a growing community of practise within this CS space.
Figure 24: Cover page of the miniSASS newsletter for March 2016

40
Riparian Health Audit (RHA)
The Riparian Health Audit (RHA) is based on the scientific “Index for Habitat Integrity” (IHI) Method. In the RHA method, users assess a riparian reach by determining its natural condition, identifying the extent of impacts in the reach and then rating the principle impacts, if any, that alter the ecological health of the riparian reach being assessed.
The Riparian Health Audit has identified eight principle impacts (Figure 25) that form the basis of the assessment. These include:
1. Exotic plants: for this impact alien plants, alien invasive plants, commercial crops, gardens and hedgerows are included as exotic
2. Rubbish dumping: presence of solid waste within riparian ecosystems
3. Bank erosion: referring to anthropogenic causes of bank erosion (this includes erosion due to over stocking and trampling)
4. Inundation: flooding caused by human activities (e.g. impoundments)
5. Flow modifications: changes in the natural flow regime of the river (either increase or decrease in flow)
6. Physico-chemical modifications: changes in the riparian zone due to changes in water quality
7. Vegetation removal: excessive removal of indigenous vegetation through various causes
8. Channel modifications: alternation of the natural physical shape of the banks of the riparian area
Figure 25: A summary of the eight principle impacts that are used in the Riparian Health Audit.
Each of the eight impacts is then rated either as percentage change or percentage cover, depending on the type of impact observed. These range from “No impact” to “Critical impact”. The full list of impact ratings is given in Table 3. Once the assessment is done a mathematical model is used to calculate the Ecological Condition, which describes the ecological health of the riparian reach being assessed (Table 3). The Ecological Condition is based on the percentage change in the riparian system from the natural (or pre-anthropogenic) system.
The model used to calculate Ecological Condition is provided in an Excel workbook. The manual explains of how to calculate Ecological Condition without a computer.

41
Table 3: A guideline to rating impacts in terms of the percentage of change caused by the impact or coverage of the impact to the riparian zone
Rating Percentage Change or Coverage Description
0 0 No Impact
0.5 1-10 Minor Impact
1 11-20
1.5 21-30 Moderate Impact
2 31-40
2.5 41-50 Large Impact
3 51-60
3.5 61-70 Serious Impact
4 71-80
4.5 81-90 Critical Impact
5 91-100
Table 4: Summary of scores and percentage of change and their respective Ecological Condition for the Riparian Health Audit
Score Percentage Change Ecological Condition
0-4.5 0-10 Natural
5-11.5 11-29 Good
12-19.5 30-49 Fair
20-27.5 50-69 Poor
28-35.5 70-89 Very Poor
36-40 90-100 Critical
The testing and development of this tool has been ongoing. It was tested extensively by a group of GroundTruth interns in 2015/2016 as they worked with the tool in the field on a weekly basis. The tool was also presented at a number of workshops which lead to developments in terms of making the tool more user friendly and further within the scope of CS.

42
RHA data collected by citizen scientists can be accumulated using the spreadsheet that has been developed as a base. The RHA tool is being used extensively in various river walks, community projects and other routine monitoring projects. The long-term data from the RHA can be very useful in the management of a system. The data collected from river walks has been very useful in assisting local communities to understand their river and the impacts that are present in the area, this way the appropriate mitigating measures can be put in place to address the necessary impacts.
The RHA was recently used in conjunction with other scientific and CS tools in the Karkloof river walk. This involved a team walking approximately 70 kilometres along the Karkloof River using CS tools at sites along the way in order to obtain an understanding of the general health of the river. Figure 26 below shows one of the completed data sheets from the walk, this illustrates how the RHA can be used with other tools such as the YSI, clarity tube and miniSASS in order to obtain an overall understand of the ecological health of a specific site/area.
Figure 26: Example data sheet from the Karkloof River walk – applying CS tools

43
The Water Clarity Tube
Suspended solids can be defined as the matter suspended in water and comprises several types of material including soil particles, planktonic organisms and organic matter (Dahlgren et al., 2004). Suspended solids occur naturally in aquatic ecosystems but anthropogenic activities significantly increase their concentration and are a common source of water quality degradation in these ecosystems (Dahlgren et al., 2004). There are various point and diffuse sources of suspended solids including erosion, vegetation degradation, waste discharge, urban runoff, excessive algal growth (Onstad et al., 2000; Dahlgren et al., 2004; Walling, 2005). Suspended solids are known to affect the physico-chemical characteristics and subsequently the biological communities of aquatic ecosystems (Cordone and Kelly, 1961).
Excessive suspended loads may influence primary production biomass (Henley et al., 2000), as well as physically abrading and affecting aquatic biota and modifying habitats within aquatic ecosystems. Chemical aspects of the aquatic environment may also be modified so that the increase in suspended solid load not only indirectly impact aquatic fauna through habitat modification but additionally impacts them directly (e.g. Cordone and Kelly, 1961).
The negative impacts of excessive suspended solids caused by anthropogenic activities on aquatic ecosystem dictates that its measurement has become an essential part of monitoring programmes (Dahlgren et al., 2004). The three methods used to determine the quantity of suspended matter are total suspended solids (TSS), turbidity and clarity. Analysis of the first two of these are generally time consuming and requires a highly accurate analytical balance, and or requires expensive and sensitive equipment. Clarity measures the visual transparency of water with units in centimetres (cm). There are two techniques that are used to determine clarity of water, namely the Secchi-Disk and the Transparency or Clarity tube. The Secchi-Disk method is useful in lentic habitats (still water habitats) but is not practical for lotic habitats (flowing water) particularly if it is shallow and/or with a dense growth of algae or macrophytes. The clarity tube is an easy-to-use, quick, low-cost method that is practical for use in lotic habitats and can be operated by one person (Kilroy and Biggs, 2002). An important advantage that the clarity tube possesses compared to the afore-mentioned techniques is that it requires minimal equipment and as such may be used by citizen scientists for monitoring river health.
This project then aimed to develop and test the feasibility of the clarity tube as a CS tool to measure general river health by using water clarity as a proxy for water quality determinants. The first objective is to determine if there is any variance of the clarity tube when utilised by different operators and to determine the precision that the clarity tube provides when recording water clarity. The relationship between clarity, turbidity and total suspended solids has been determined by overseas researchers (Dahlgren et al., 2004) but it needs to be defined for a South African context.
The clarity tube is used to determine water clarity as an indication of Total Suspended Solids (TSS). The clarity tube can be used in rivers, streams, dams and wetlands. During this project, the manual for the clarity tube was revised to include additional photos and instructions as well as a section on how to implement a monitoring protocol for larger or longer-term projects. The clarity tube itself has also undergone some minor design changes to make it more ergonomic for users.

44
The clarity tube is a 1 m long, 50 mm external diameter tube constructed of 3 mm thick clear polymethyl methacrylate (acrylic) (Kilroy and Biggs, 2002). A clear acrylic disk closing one end of the tube serves as a viewing window. The viewing target is a matt black disk mounted on a modified aquarium magnet which is then moved up and down inside the tube using the matching magnet. The other end is closed by a black rubber cap against which the target is viewed. The outside is marked in centimetres (cm) starting from the viewing window. To take a reading the tube is filled with the water to be measured and the end cap in place. The tube is held horizontally and positioned perpendicular to the sun. The viewer’s eye is held close to the viewing window and the target is shifted away until it disappears and brought forward until it reappears. The clarity is recorded as the average between the disappearance and reappearance distances.
The water clarity tube has proven to be one of the more popular CS tools in that it is used very often by a number of different personnel and entities for many different projects. It has been tested extensively and as a result it has become an extremely useful and reliable tool.
To compare clarity and turbidity (NTU) a number of experiments were conducted with turbidity measured using a HACH Model 2100P Portable Turbidimeter. The unit is able to measure turbidity from 0.01 to 1000 NTU. All samples were treated as recommended in the manual. If a reading was beyond the upper detection limits of the turbidimeter, the sample was diluted with water and the resultant turbidity multiplied by the dilution factor to achieve the actual turbidity.
Clarity tube operator variability
Clarity data to determine if there was a significant difference between operators using a clarity tube was recorded from lotic habitats within the uMngeni catchment. Sites were selected to provide a variety of water clarity operating conditions. Each operator had to record clarity in the exactly the same manner and as prescribed in Kilroy and Biggs (2002). All samples collected and tested were discarded downstream to not disturb the sediment and causing erroneous results for the next reading or operator. All recordings were undertaken in five replicates. To avoid environmental interference in recording
Figure 27: Components of a water clarity tube. A: The full length of the tube, with the protective cover; B: Clear base for viewing the disk; C: Magnets for moving disk; D: Black stopper-cap for sealing the tube

45
clarity a largely cloudless day was selected to accomplish the field work and all operators sampled at the exact same point to avoid habitat variability. If cloud cover had reduced sunlight the operators had to wait until it passed over.
Sample sites were labelled with a unique identity containing an abbreviation of the river and the site number sampled.
Figure 28: Samples sites to determine clarity tube operator variability.

46
Table 5: Information pertaining to sample sites visited to determine clarity operator variability Site Code
River Name Description Month Sampled
SR1 Shelter River Located within Umgeni Valley Nature Reserve. February
TBS1 Town Bush Stream
Located adjacent to recreational area. July
UR1 uMngeni River Located at Petrusstroom bridge upstream of Midmar Dam.
February
UR2 uMngeni River Located within suburban conservancy downstream of Midmar Dam.
February
Modelling Clarity, Turbidity and Total Suspended Solids
Clarity and turbidity data to determine their relationship was sampled from lotic habitats within the uMngeni catchment as mentioned above. The criterion for site selection was primarily to encompass an area that represented a variety of land cover within the catchment. All operators recorded clarity and turbidity from different points at a sampling site to take into account spatial variability of the sample site. To determine the relationship for a comprehensive range of clarity readings, ex situ analysis had to be undertaken as none of the sample sites possessed clarity below 29 cm. Soil was added to tap water to simulate low turbidity water and achieve clarity readings of between 1 to 12 cm. At each sampling site the individual operator recorded clarity using the clarity tube and subsequently measured turbidity with the turbidimeter. Each operator recorded 5 replicates and additional data to determine the relationship between turbidity and TSS was collated from previous monitoring exercises and this relationship used to infer the relationship between clarity and TSS.
The Kruskal-Wallis test was performed to determine if there was significant inter operator differences. To determine intra operator variability a coefficient of variation was determined for each operator.
To determine the significance and relationship between turbidity (NTU) and clarity, correlation and a simple linear regression relationship investigated. Where appropriate various data transformations were also undertaken.
The results indicate that there were no significant differences between clarity tube operators for each site (p> 0.05) indicating there was no significant inter operator differences, and that different users were likely to get very similar results for water of different clarity. Additionally, clarity tube operators had low standard errors around mean values calculated, with clarity variability (CV) of less than 5%, indicating minimal intra operator variability.

47
100
90
80
70
60 Operator 1
50 Operator 2
40 Operator 3
30 Site Average
20
10
0 SR1 TBS1 UR1 UR2
Site
Figure 29: Bar graph of average clarity recorded per clarity tube operator and the total average per sample site. Vertical bars indicate standard error of the mean.
Modelling Clarity, Turbidity and Total Suspended Solids Clarity was demonstrated to be inversely correlated (p < 0.05, r² = 0.91) to turbidity with the relationship exhibiting a power decay function (higher turbidity resulting in lower clarity of the water). Both variables were log-transformed to achieve linearity. The coefficient of determination indicates that clarity accounts for approximately 91% of the variability in turbidity. The equation for the relationship is as follows:
��� ������ = −1.613(log � ����) + 3.76
Conversely TSS was demonstrated to be directly correlated (p < 0.05, r² = 0.92) with turbidity with the relationship exhibiting a linear growth, with increasing total suspended solids resulting in higher turbidities. The coefficient of determination indicates that TSS accounts for approximately 91% of the variability in turbidity. The equation for the relationship is as follows:
������ = 1.42(� ����) − 6.23.
By making turbidity the subject of the equation, clarity and TSS can be linked using the following equation:
��� =
10−1.61(log � ����)+3.76
+ 6.23
1.42
Clar
ity (c
m)

48
4.0
3.5
3.0
2.5
2.0
1.5
1.0
0.5
0.0 0.0 0.5 1.0 1.5 2.0 2.5
Log Clarity
Figure 30: Scatterplot to illustrate the linear relationship between log-transformed values of clarity and log-transformed values of turbidity for in situ and ex situ samples.
1000
900
800
700
600
500
400
300
200
100
0
0 100 200 300 400 500 600
TSS (mg/l)
Figure 31: Scatterplot to illustrate the linear relationship between turbidity and Total Suspended Solids (TSS).
Log
Turb
idity
Tu
rbid
ity (N
TU)

49
Additional research is being carried out using the clarity tube to determine eutrophication levels in dams, to determine if the clarity tube can be used to measure sediment trapping by wetlands, and sediment loads in estuaries. A study on eutrophication has been done by an honours student in 2016, there are also a number of Masters students and papers that have included clarity tube research with regards to its’ use in aquatic ecosystem health – see for example Bannatyne et al., 20172. There have been indications that the clarity tube could be used to determine the amount of sediment that a wetland is trapping – one of the key reasons indicated as to why wetlands are so important within the landscape. The theory suggests that if the wetland is functioning well, sediment will be trapped by the wetland. This theory is being tested by measuring water clarity at the inflow and the outflow of a wetland and comparing the readings to see if the clarity is better at the outflow of the wetland. Additionally, a team from the University of KwaZulu-Natal is investigating the use of the clarity tube in profiling sediment loads in estuaries.
Application and modelling of clarity readings to monitor Wastewater Treatment Works (WWTW)
Wastewater effluent typically emanates from domestic, industrial, commercial, agricultural, horticultural and aquacultural activities (Corcoran et al., 2010), and if not adequately treated has the potential to have major negative impacts on aquatic ecosystems and surface water resources. This is particularly relevant with the increase in urbanisation where the rate of population growth in urban areas is expected to be 1.8% higher than that predicted for the total population over the next 25 years. Additionally, the rate of urbanization often exceeds infrastructure development and expansion, including wastewater management facilities (Corcoran et al., 2010). Furthermore, various Green Drop reports highlight the failing infrastructure, maintenance, and management of many wastewater treatment works (WWTW) in South Africa – for example, the Green Drop Report of 2013 indicated that only 60 out of 824 wastewater systems received green drop status (http://www.dwa.gov.za/Dir_WS/GDS/Docs/DocsDefault.aspx).
Within developing countries, an estimated 90% of wastewater is discharged into natural receiving bodies untreated (UN Water, 2008). Due to its constituents and physico-chemical properties, untreated wastewater potentially alters ecosystem structure and functioning (Dyer et al., 2003; Dallas and Day, 2004; Corcoran et al., 2010; Fouche and Vlok, 2010). Total Suspended Solids (TSS) or Suspended Solids (SS), and its associated contaminant contents, are one of the principal pollutants associated with partially or untreated WWTW effluent and hence a key concern in water resource management. As such it is the principal reason that the Department of Water and Sanitation have established a limit on this determinant for WWTW effluent discharge (see Government Notice 36820, 2013 http://extwprlegs1.fao.org/docs/pdf/saf126916.pdf, and DWA, 1999). Amongst a wide range of determinants that are regulated, for suspended solids, general and special limit values, are defined at 25 and 10 mg/L respectively, and applicable to discharge of wastewater into a water resource.
The National Water Act (Act 36, of 1998, and various amendments thereof, e.g. Government Notice 36820, 2013), require that adequate record-keeping and disclosure of information is provided, and that the water user must ensure the establishment of monitoring programmes to monitor the quantity and quality of the discharge prior to the commencement of the discharge. Additionally, the quantity of the discharge must be metered and the quality of domestic wastewater discharges must be regularly monitored and analysed for specific substances and parameters as required by the responsible authority. A "monitoring programme" (as defined by Government Notice 36820, 2013) means a
2 Design and implementation of a citizen technician-based suspended sediment monitoring network: Lessons from the Tsitsa River catchment, South Africa – LJ Bannatyne, KM Rowntree, BW van der Waal and N Nyamela, 2017 Water SA

50
programme for taking regular measurements of the quantity and quality of a water resource, waste or wastewater discharge at specified intervals and at specific locations to determine the chemical, physical and biological nature of the water resource, waste or wastewater discharge. In terms of this CS project, and for the SS of concern, this applies to any discharge of over 100 cubic metres per day (Government Notice 36820, 2013).
A UKZN Honours study by Haworth (2012) demonstrated that the Howick Wastewater Treatment Works (HWWTW) capacity had been exceeded several times and that the final effluent from the works possessed substantial quantities of particulate matter that ultimately entered the uMngeni River. The monitoring of the effluent from the HWWTW is critical as the discharge site is located upstream of Albert Falls Dam, a key water supply to the city of Durban. Accordingly, the Duzi-uMngeni Conservation Trust (DUCT), an NGO based in the catchment, and in conjunction with this projects research team at WESSA, initiated a CS project to monitor the quality of the HWWTW final effluent. Zongile Ngubane, a resident of the informal settlement of Shiyabazali, monitors the clarity of the final effluent using a water clarity tube (developed in this project) which, although at the time a useful metric for measuring water quality, possesses no established DWS discharge limits, particularly for SS as indicated above.
The project team then set about research to determine if a suitable proxy for SS could be derived and consequently develop a discharge limit for clarity. In addition, the research aimed to determine if the clarity tube, as a cost-effective CS tool, has the potential to be utilised in national monitoring programmes.
The HWWTW is located in the town of Howick in KwaZulu-Natal, South Africa along the uMngeni River, approximately 12 km upstream of Albert Falls Dam (see figure below). The treatment facility receives wastewater loads from Howick and the nearby township of Mpophomeni, and is currently treating just over 5 ML/day (Umgeni Water, 2017).
Figure 32: The location of the Howick Wastewater Treatment Works (HWWTW) in KwaZulu-Natal, South Africa.

51
Clarity and SS were measured for samples of final effluent collected from the HWWTW and covered a range of final effluent quality. Clarity was recorded using a clarity tube and with paired samples then also sent to a SANAS accredited laboratory for SS analysis. Total suspended solids (TSS) is a gravimetric procedure where the solids from the wastewater sample were filtered through a 47 mm glass fibre filter, dried and weighed to determine the total non-filterable residue (TNR) of the sample.
Statistical analyses of these data were then undertaken. A simple linear regression was utilised to determine the presence and significance of the relationship between log-transformed clarity and TSS data. A Shapiro-Wilks test was used to test for normality on raw residuals from the model. A frequency analysis was also undertaken subsequent to model development in order to determine how much compliance there was by the HWWTW final effluent to the established DWS discharge limits – based on CS monitoring of the discharged effluent.
The linear regression model indicated that log-transformed clarity was significantly (p < 0.001) correlated to log-transformed TSS, with the relationship exhibiting a linear decay. The model indicates that log-TSS accounts for approximately 89% of the variability in log-clarity.
Table 6: Simple linear regression statistics for water quality parameter modelling – Clarity versus TSS – Total Suspended Solids
Statistic Log-Clarity and Log-TSS Degrees of Freedom 23 F 183.92 p 0.0005
R2 0.89
Figure 33: Scatterplot illustrating the relationship between Log10Clarity (LOG CLARITY) and Log10Total Suspended Solids (LOG TSS). The solid line represents the trend in the data set.
The relationship between the clarity and TSS are defined in Equation1 ������� = ��−�. (��� ���)+!.!� Equation 1
LOG
CLA
RIT
Y
2.5 2.0 1.5 LOG TSS
1.0 0.5 0.0
0.5
1.0
1.5
2.0

52
Subsequently, Equation 1 was utilised to develop clarity discharge limits, from the established TSS discharge limits. The two categories of DWS discharge limits are: a) Special Limit Values and b) General Limit Values, with the latter designated for wastewater released into listed (sensitive) water resources in South Africa (DWS, 1999). The special and general discharge limit values for TSS are 10 and 25 mg/L respectively. Applying the above derived modelled relationships of clarity and TSS, the equivalent special and general discharge limit values for clarity are 52 and 33 cm respectively.
Table 7: Special and General Limit Values for TSS and clarity Water Quality Determinant Special Limit Value General Limit Value TSS (mg/L) 10 25
Clarity (cm) 52 33
The development of Equation 1, and which enabled the development of discharge limits for clarity, subsequently allowed the compliance of the HWWTW to be determined through the routine monitoring by DUCT. An example of the type of compliance monitoring possible with this sort of tool is illustrated in the following figure, developed from this project.
Figure 34: Summary data for Howick WWTW compliance with various DWS limits, using a calibrated water clarity tube.
Based on an analysis of nearly two and a half thousand CS records, covering almost 3 years (Table 8), the HWWTW was determined to be compliant approximately 30% of the total number of days monitored according to the General Limit Value (Table 8). In other words, the discharged effluent was non-compliant with DWS discharge limits almost 70% of the time! The highest and lowest recorded number of non-compliant observations occurred during the afternoon and evening sampling events, respectively (Table 8). Furthermore, although the least number of monitoring events occurred in 2012, the year possessed the highest proportion of non-compliant recordings (Table 8). Conversely, 2014 exhibited the lowest proportion of non-compliant recordings.

53
Table 8: Statistics for the quantity of non-compliant recordings of the HWWTW. Non-compliant Recordings
Year Total Number of Recordings Morning Afternoon Evening Total Proportion of Total
Recordings (%) 2012 276 67 79 69 215 77 2013 1095 275 280 262 817 75 2014 1095 234 239 225 698 63 2012-2014 2466 576 598 556 1730 70
The negative impacts of excessive suspended solids caused by anthropogenic activities on aquatic ecosystem are well documented and dictates that its measurement has become an essential part of monitoring programmes (Dahlgren et al., 2004). However, with the limited resources that are available it is not possible for authorities to consistently monitor the quality of wastewater discharged. This tool developed within this project highlighted the use and role that CS can play role in expanding current monitoring and could possibly provide accurate and consistent results to inform on the management of wastewater. It also has the ability to enhance the “strength” and value of citizen scientists and community groups (NGOs, etc.) in engaging with the relevant authorities in a Community of Practise around improved water resource management.
Figure 35 provides a summary of the case study where the Shiyabazali community used the clarity tube to monitor the HWWTW, providing evidence-based concerns regarding the quality of the discharge from the HWWTW.
Figure 35: The case study of the Siyabazali community, increasing their knowledge and understanding of water pollution and their role in the management of water resources.

54
Much progress has been made with the clarity tube, which is proving to be a highly efficient and versatile CS tool for measuring water clarity.
The Transparent Velocity Head Rod
The Transparent Velocity Head Rod (TVHR) is a very simple tool to measure the velocity and discharge of a stream or river. The original TVHR was created in the 1940s by two Americans, Wilm and Storey (1944), and more recently refined by Fonstad (2005). Originally, this tool was made out of wood but it has evolved over the years to become transparent and lighter. It works by blocking streamflow on the upstream side of the rod, allowing measurement of the difference in displaced water levels on both the upstream and downstream sides of the rod (i.e. velocity-head), which in turn may be used to predict the flow velocity. Multiple measurements may be taken across the stream width and then used to calculate stream velocity and ultimately discharge.
In a field environment, the TVHR is solid, lightweight, and simple enough to allow velocity measurements to be made effectively on site. This project has developed a TVHR using Perspex and made it locally available to a wide range of citizen scientist groups working in water resource management in southern Africa. A traditional flow meter is extremely expensive (upwards of R70 000), which makes it generally inaccessible for many users, especially for citizen scientists. The TVHR is therefore a relatively inexpensive tool, enabling many citizen scientists access to this information.
Figure 36: The TVHR is use
The TVHR was calibrated in the uMngeni River and a conversion table was developed to convert the change in height in the water when the rod was placed in the current, in cm (∆#) to velocity given in m/s. A manual on how to use the tool and the conversion tables to calculate both velocity and discharge was developed. Although a few issues were raised during initial testing, these have now been resolved in a revised manual.
Two test calibrations at two different sites were done. To accurately measure the stream flow velocity, a digital flow meter was used. To obtain a depth-averaged velocity, the measures were taken at the

55
recommended 60% of the stream depth because the depths were mostly equals or below 60 cm. Initially and before being transparent, the TVHR was used in two steps: firstly, measuring the depth, positioning the plank parallel to the flow and secondly measuring the jump by positioning it perpendicularly. During this first calibration, only this method was used, both methods were used during the second calibration. The second calibration was also realised at a site on the Umgeni River, but further upstream than the first. 35 different measurements points were done, between 0.2 m/s and 1.7 m/s using a slightly different protocol in order to improve the results.
Although the two methods of calibration were almost equivalent, the first method was slightly more precise (3%) in comparison to the second method (5%) if the user took an average of several results. However, the user would need to rotate the TVHR in the first method, to measure the depth which resulted in an additional step in the method making this option slightly more risky. Of the two methods of calibrations established, the second method was chosen due to it being the more appropriate method in terms of CS and regarding its accuracy and its ease of use.
The TVHR manual uses a number of formula and mathematical equations, this may provide a platform for further CS engagement in a mathematical space in the future.
The TVHR has recently been used in a year-long flow monitoring project of the Karkloof River. Weekly field work was conducted using a traditional flow meter as well as the TVHR. A farmers training day was held at the inception of the project, the outcome of this was aimed at enabling local farmers to monitoring the flow of the river on their own.
Wetland assessment tool
During the Specialist Workshop (reported on in “Deliverable 6: Specialist Workshop Evaluation Report”) it was determined that there are a number of tools available for assessing wetlands in South Africa, including WET-Health (MacFarlane et al., 2009) and Wetland IHI (DWAF, 2007). However, both of these tools require substantial training and expertise to implement. The project identified Dr Donovan Kotze, a leading wetland specialist, as a key role-player in the process of tool development.
Dr Kotze led the development of the CS tool: “A method for assessing wetland ecological condition based on land-cover type”. This tool is broken down into two components, the first being the “Technical document” which gives a scientific basis to the method. The second is the “User Guide”, providing users
Figure 37: Local Karkloof farmer learning the correct use of the TVHR

56
of the tool to select either a broad, straightforward tool to map the anthropogenic impacts on the wetland, or a more detailed tool, which ranks impacts according to their severity & impact on wetland functioning, providing a “Present Ecological Status” once complete. The tool also includes an Excel workbook that automatically calculates Present Ecological Status, based on the input from the ranking system.
Table 9: Overall impact score categories and corresponding Present Ecological State (PES) categories (modified from MacFarlane, 2009)
Overall impact score rating
Impact category
Description PES category
0.0-0.9 None No discernible modification is such that it has no impact on wetland integrity.
A
1.0-1.9 Small Although identifiable, the impact if this modification on wetland integrity is small.
B
2.0-3.9 Moderate The impact of this modification on wetland integrity is clearly identifiable, but limited.
C
4.0-5.9 Large The modification has a clearly detrimental impact on wetland integrity. Approximately 50% of wetland integrity has been lost.
D
6.0-7.9 Serious The modification has a clearly adverse effect on this component of habitat integrity. Well in excess of 50% of the wetland has been lost.
E
8.0-10 Critical The modification is present in such a way that the ecosystem processes of this component of wetland health are totally / almost destroyed.
F
Users of the method should have reasonable field experience of the area that they are assessing. However, they are not required to be a wetland specialist in order to apply the method. Specific users of the method might include: � Field technicians � Citizen scientists � General environmental practitioners � Wetland practitioners � Landowners
The method is especially useful for situations where many wetlands need to be assessed across a broad landscape, particularly where good land-cover data are available. Some of the specific applications in this regard include:
� Broad-scale catchment assessment and monitoring programmes � State of Environment Reporting � Prioritizing at a landscape/sub-catchment level, e.g. for wetland rehabilitation � Strategic Environmental Assessments
The method also has application as a learning tool for users whose primary purpose is to build their understanding of how land-use activities potentially affect wetlands. In this respect it has potentially very useful application by municipal authorities and also DWS staff who may not be technically involved in wetland related matters but who are required to have a broader appreciation of the importance of these aspects of the landscape.

57
The “Technical Document”, the “User Guide” and the accompanying Excel spreadsheets will be available for download on the Capacity for Catchments website. These documents are now ready to disseminate to various community groups, students, researchers and other interested parties for testing. A number of students have, with the support of this project undertaken post graduate studies, using this tool (more details under the Capacity Development chapter of this report).
This method builds on the approach of the WET-Health (Macfarlane et al., 2009) level 1 vegetation component, where default scores have been assigned to each of a wide range of disturbance (land-cover) types. In the new method, this approach is extended to the hydrology, geomorphology and water quality components to align them more closely with the vegetation component.
The method presents the user with a list of land-cover/disturbance types commonly occurring in wetlands, to which typical impact scores have been assigned based on expert judgement. These scores were peer-reviewed in an attempt to make them as defensible as possible. Each land-cover type is also represented in photos to make it as easily identifiable as possible. This is similar in approach to the user-friendly photo guide developed by Graham and Louw (2009) for rivers (including riparian areas). The primary task of the operator who is applying the land-cover based method is to identify the different disturbance types present in a wetland and then to identify the extent of these land-covers, for which two options are provided.
� The semi-quantitative map-based option, which is applicable if an overall ecological
condition/health score is required and/or the condition of the wetland is being monitored and users of the tool have access to Google Earth Pro or other means of generating a land-cover map. Specific guidelines for mapping are given in Job et al. (in prep).
� The qualitative sketch-map option, which is applicable if a brief introduction of the various factors
impacting upon the wetland is required but an overall score is not required, the information collected is not being used for monitoring or the users of the tool do not have access to Google Earth Pro or any other means of generating a land-cover map
Part 2 provides a detailed, step-by-step description of the two options, including steps to carry out in the office and in the field. In both options, there is provision for considering impacts not accounted for with land-cover such as the point source release of wastewater into the wetland.
Estuary tool
During the Specialist Workshop (reported on in “Deliverable 6: Specialist Workshop Evaluation Report”) much time was spent discussing the requirements of the Estuary Tool. There were many reasons for this, related to the scale of potential involvement by citizen scientists, as well as the complexity and diversity of different estuary systems.
In terms of scale of involvement, there may be CS groups who are interested in the monitoring and management of an estuary on a routine and structured basis, while at the other end of the scale, there may be individuals who are interested in only certain components of the estuary or interested in limited engagement for a limited time.
For this reason, it has been important to develop an estuary CS tool that attempts to meet some of these diverse needs. The tool would then be able to cater for once-off engagements, such as at environmental education centres, while still fulfilling the needs of a formal estuary monitoring programme.

58
The Estuary Tool: “Explore an Estuary: Guidelines for a one-day study of an estuary” is currently in a final draft stage of development. The written work has been completed, and the project team has worked on the development of the necessary excel data collection sheets.
The Estuary Tool has been broken down into a theoretical and a practical component. The theoretical section highlights some of the key characteristics that make an estuary an estuary, as well as some of the ecology within an estuary. Topics covered include tides, salinity river flow and estuary mouth dynamics.
The practical section begins by engaging citizen scientists with preparation to go into the field. Covering basic concepts related to accessibility, including a simple table highlighting which components of the assessment can be done, depending if the estuary mouth is open or closed. Additional guidance is given on making a map of the estuary that the citizen scientist is working on, how to prepare data sheets, and the logistics of the site visit.
The practical activities include the following:
� Observing tidal patterns
� Monitoring water flows
� Measuring and mapping salinity and temperature
� Observing mouth and beach dynamics
� Learning about estuarine plants, animals and their habitats
� Consolidation: reviewing the day spent at the estuary
Each practical activity has a number of sections associated with it. These include additional background about why the citizen scientist would want to do the activity, where to find more information on the activity, a section of the necessary datasheets, processing that might need to be done back in the classroom or at home, and the expected findings, including why one would expect to observe these findings.
The Estuary Tool is, at this stage, reasonably basic to accommodate the challenges faced, while providing the opportunity and scope to expand the tool to incorporate more complex concepts and activities at a later stage. However, this expansion would involve a vast amount of work, which falls outside of the scope of this project.
Spring tool
Both Deliverable 5 (“Framework for the river and catchment monitoring toolkit”) and Deliverable 6 (“Specialist workshop evaluation report”) highlighted that South Africa has no formal and standardised methods or tools for monitoring springs. There also appears to be a shortage of information about the springs of South Africa.
With this in mind, the project team researched relevant spring monitoring programmes already in practice in other parts of the world, and identified key characteristics and parameters used in these programmes and their relevance to be used in South Africa. Parameters included physical characteristics, current and future management and anthropomorphic impacts.
The Spring Tool begins with an introduction and background to the tool. These sections cover the issues of water scarcity in South Africa and the objectives of the spring tool. The objective of the Spring Health Index Tool is to determine to ecological condition of the spring, based on the extent to which the current

59
conditions differs from the natural or original condition of the spring.
The Spring Health Index Tool has identified 10 potential impacts that could influence spring health. These are:
� Livestock grazing � Pollution near the spring � Physico-chemical changes � Surface water diversion & flow modification (change in the flow of water) � Spring structure modification � Vegetation removal � Groundwater withdrawal � Development and pathways � Invasive Alien Species � Soil erosion
The Spring Health Index tool leads the citizen scientists through a number of steps to determine the current ecological condition of the spring, starting with determining the location and type of spring, investigating the surrounding land cover and use and the geomorphology of the area.
Once these basic steps have been completed, the tool takes the citizen scientist through the process of rating the intensity of the various anthropomorphic impacts listed above. Table 10 provides a description of the rating system. A datasheet has been developed that the citizen scientist will complete to calculate the ecological condition of the spring. Once the datasheet is filled in the Ecological Condition of the spring can be determined.
The ecological condition is calculated as the percentage of change that has occurred to the spring system, compared to its natural (original) condition, giving a description of the current conditions of the spring.
Table 10: A guideline to rating the impacts identified in the Spring Health Index
Rating Description 0 No impact 1-5 Minor impact 6-10 Moderate impact 11-15 Large impact 16-20 Serious impact 21-25 Critical impact
Table 11: Scores as a percentage of change from the spring’s natural condition
Calculated percentage change Ecological condition 0-20 Natural 21-40 Good 41-60 Fair 61-80 Poor 81-100 Very Poor (Critical)
The Spring Tool includes a photographic guide to the various impacts that are rated to calculate the Ecological Condition. This is one of the areas where the Spring Tool still requires work to be done, as the photographic guide is not yet complete. It is anticipated that more photos will be collected over the next reporting period to be included in the Spring Tool.

60
In 2017 GroundTruth were approached by the Women's Leadership and Training Programme (WLTP) to provide support in the development of protection and management measures covering water resources and related biophysical habitat within two communities. The sites are located within the Centocow and Hlokozi areas of KwaZulu-Natal where communities rely on natural resources for their water supply and livelihoods. The spring tool was used in conjunction with other CS tools in this project to assist in determining the ecological condition of the 8 springs in the area. Interestingly this project revealed that the water clarity of the springs was greater than that of the local rivers. Where the spring water emerges from the ground it is likely to have had limited exposure to soil erosion, pollution or trampling which decreases the water clarity in the downstream rivers.
Figure 38: A completed data sheet using the spring index health tool of a site showing that the spring was in fair ecological condition
The spring tool has the potential to be extremely useful in rural communities where springs are the only or very important water source. Collecting routine data on springs using the spring tool could assist with the management of water sources which is critical in these rural areas.
Citizen Science Rain Gauge
There is currently very limited capturing of climate data for South Africa. Additionally, southern Africa has highly variable rainfall and water resources, which are distributed unevenly across the region. Global climate change is also expected to exacerbate this variability in rainfall and other climatic factors, increasing the urgency and need to better understand the weather and its patterns. As such there is a

61
need to gather good quality climate data, specifically rainfall information, across the region. As noted by Hachileka (2015) climate data is the lifeblood of early warning systems and the cornerstone for resilience building efforts. Climate data is used in climate and weather models that are developed to investigate climate change. Citizens, especially schools, could play an important role in gathering this much-needed data. The potential for this network to “infill” with appropriate climate data is illustrated in the figure below, illustrating the extent of schools across SA, in relation to SAWS weather stations. KZN is extracted and magnified to better illustrate the disparity in the SAWS and schools spatial distribution – and the potential.
Figure 39: A map representing all schools in South Africa. Schools could be a target group to collect much needed weather data
The most commonly used design to create a CS rain gauge uses a standard 2 L plastic bottle which in South Africa, is the Coca-Cola bottle. The Coca-Cola bottle has an irregularly shaped base, similar to that of the bottles used in the studies of Wrage et al. (1994) and Micheal et al. (2014). In their studies, they overcame this disadvantage by filling the bottom of the bottle with liquids that do not mix with water, such as cooking or motor oil or jelly. Alternatively, a slightly different design can be used that uses the bottle upside-down, with the spout at the bottom and the base at the top, which is similar to the shape of a standard rain gauge – see figure below. This helps eliminates the problem of calibrating the amount of rainfall with an irregular shape.

62
Figure 40: Recycled Coca-Cola bottle CS rain gauge
The testing and development of the CS rain gauge has been on-going. Monitoring data and records were collected over monthly periods from a CS rain gauge, a standard/scientific rain gauge and a Davis Vintage Pro 2 Weather Station. These data were then compared and showed very little variation between the three methods, verifying the calibration and accuracy of the CS rain gauge (see Figure 41 above). Details on how to construct, calibrate and record rainfall data for the CS rainfall gauge are available on the Capacity for Catchments website (https://www.capacityforcatchments.org/).
Figure 41: Graph showing the data collected from a CS rain gauge, a standard/scientific rain gauge and a Davis Vintage Pro 2 Weather Station over one month

63
Weather monitoring tools
In addition to the rain gauge tool, other weather monitoring tools to measure wind speed and direction, as well as temperature were investigated.
The concept of a wind pressure plate to measure wind speed, built from recycled cardboard has been tested. This pressure plate concept would be used as an anemometer. Research was also carried out to test if down-lighting fittings can be used to make a Stevenson Screen to be used in measuring temperature, using a simple maximum and minimum thermometer. During 2015, the South African Environmental Observation Network (SAEON) donated a full Davis Weather Station to the project to use as a standard against which the various homemade gauges were tested, measured and calibrated.
Figure 42: A homemade CS anemometer (wind pressure plate), made from recycled materials
The homemade CS anemometer design is based on a pressure plate design, which is calibrated to measure wind speed, and direction. Recycled plastic corrugated board forms the basis for the construction, along with PVC electrical piping to construct a frame, which is mounted on a steel pin. A vane aligns the plate into the wind and also indicates the prevailing or instantaneous wind direction. A protractor was printed and attached to the pressure plate such that the angles on the plate could be read between 0° and 90° and calibrated to wind speed. A toothpick or similar may be attached to the plate if more precise measurements on the protractor are desired.
For the calibration of the wind pressure plate, wind velocity measurements from the Davis weather station were recorded in real time along with the corresponding angles on the wind pressure plate. This was repeated several times and covering a range of wind speeds until sufficient data needed to create

64
a calibration curve was obtained, with the curve representing the angles recorded in relation to the actual velocity of the wind.
It should be noted that this wind pressure plate design is currently limited to use in relatively low wind speeds (between 0 and 5 km/h). However, in order to obtain a wind pressure plate adapted to higher velocities of wind, it is necessary to increase the weight on the trailing edge of the pressure plate and conduct a further calibration in order to acquire an updated curve. A number of such CS anemometers may be necessary (and constructed accordingly), depending on the typical conditions at any one site.
A manual and guide has been developed on how to make the various weather tools and containing the necessary calibrations.
School lesson plans
Before the start of this WRC project there were a number of lesson plans around water resources, but due to the changes in curriculum, these had become outdated and were no longer aligned with the Curriculum Assessment Policy Statements (CAPS). CAPS is a revision of the current National Curriculum Statement (NCS). This component of the project aimed to update school lesson plans to form a component of the tool kit, with materials developed such that they facilitate integration into the CAPS school curriculum. The aim was to create fieldwork toolkits (templates and exemplar fieldwork activities) that would be CAPS compliant and which will enable teachers to plan, produce and conduct effective field-work experiences focused on rivers, wetlands, and catchments. The materials are available and form part of the Fundisa for Change Project that will encourage and enable transformative environmental learning through effective fieldwork – for teachers, learners, and researchers working in the education field.
The objectives of the Fundisa for Change Project (http://fundisaforchange.co.za/feature/objectives/) include:
� Capacity building: This objective is focused primarily on the development of teacher education capacity, which in turn will be oriented towards teacher capacity development for transformative environmental learning in the schooling system, as guided by the national curriculum and its requirements.
� Policy and advocacy (Influence): This objective seeks to enhance national take-up of environmental learning within the national system of teacher education.
� Build national system of engagement: This objective seeks to expand the network of providers and the community of practice engaged with transformative environmental learning through teacher education.
� Strengthen and review curriculum and learning and teaching support materials, especially textbooks: This objective seeks to strengthen the quality, progression and validity of existing curriculum knowledge and its representation in the national curriculum system.
� Provide co-ordination support to establish the Fundisa for Change partnership programme: This objective seeks to provide the ‘underlabouring’ structural co-ordination, monitoring and evaluation, and systemic implementation support necessary for the four objectives above.

65
The lesson plans are focused on three phases of education namely Intermediate Phase; Senior Phase; and Grade 10 of the Further Education and Training phase (FET). The following were developing to make up the lessons plans aligned with the CAPS curriculum:
� Section A – Introduction and templates � Section B – Intermediate phase (Grade 4-6) lessons plans for science and technology � Section C – Senior phase (Grade 7-9) lesson plans � Section D – Further Education and Training (FET) (Grade 10) lesson plans for Geography
learners � Section E – Explanations, references and useful information � Appendix One – Water plants as wetland indicator species � Appendix Two – Water animals, identification guides � Appendix Three – Larger animals of wetland systems
In-field testing
All of the CS tools developed in this project have been tested in the field by a number of students (as part of undergrad courses, but also within various post grad studies and theses – see Chapter 10 on capacity development), interns, community groups, schools, NGOs, conservancies and other entities. In addition, there have been numerous Community of Practise, and National Training Workshops where the various tools have been demonstrated and participants trained on their use – See Chapter 9 on information dissemination for details. Besides these more formal training workshops on the various tools there were various informal workshops and training opportunities that have presented themselves during this research project. This has allowed for useful feedback and constructive criticism which has resulted in a well-rounded development process of this CS toolkit.
Citizen Science and technology: issues and applications – the miniSASS App
An Android cell phone App was developed for miniSASS as part of this project in an attempt to make miniSASS available to a wider audience in southern Africa. The target audience were citizens who typically do not have access to a computer with internet connection, but who would have access to a mobile smart-phone. The miniSASS phone App was not meant to act as a stand-alone feature, but a support for the miniSASS website. The project team partnered with the Department of Science and Technology (DST), who funded mLab, through their incubator programme, to develop the miniSASS App.
mLab Southern Africa (SA) is a mobile solutions laboratory and start-up accelerator that provides entrepreneurs and mobile developers with the support they need to develop innovative mobile applications and services (https://www.mlab.co.za/about-us/). Their goal is to help build sustainable technology businesses by helping their founders mobilize their services and products to take advantage of the rapid growing base of mobile consumers in Africa and around the world. They support the development of mobile solutions in the consumer, design, enterprise, public and gaming sectors. mLab SA is based at The Innovation Hub in Tshwane, South Africa, with virtual programs throughout southern Africa.
At a BETA version stage, the first version of the miniSASS App was fast-tracked for launch at the Water Research Commission Symposium (Water-tech Summit) hosted in Johannesburg on 18 September 2015 with the App currently available for download from the Google Play Store. However, further development was necessary before a fully-developed version could be released. A number of issues were raised during the testing and use of the BETA version of the App, namely:

66
� A longer term institutional home was needed for the miniSASS App (which had not been envisaged during the development of the App)
o mLab were hosting the App until 2016, after which an alternative option for hosting the App needed to be found. Options proposed include:
▪ DST public cloud, ▪ CSIR public cloud, ▪ SAIAB, which is currently hosting the miniSASS website.
o The hosting institution would also need to adopt the responsibility of the maintenance and updates of the App (more on this below).
� Integration and data synchronisation of the miniSASS App and website. Following further testing of the App, the following requirements were identified as being
essential to ensure the long-term success of the App:
o Data integration – necessary for proper data management including data verification. o Users being able to use their miniSASS website login details to log onto the App. o Users being able to view the same results on the website and on the App. o The GIS layers for rivers for the rest of the world would need to be added onto the app,
in its current form (the website version allows a sample to be added in any location within and beyond South Africa).
� The App being restricted to only Android devices, and not iOS (Apple) or tablets. � The miniSASS App workflow and operationally was in some areas a bit cumbersome and made
data entry within the field problematic. Through review of the App, the workflow was found to have limitations which did not allow effective capturing of the sample data collected by users. The following key limitations were identified:
o The App is currently using the “River Finder” technology which is driving the workflow of the App. Although this technology is novel and quite unique to the App, it has proved cumbersome as some formal rivers, and many un-named watercourses could not be found using this technology. To counter this, it was suggested that the App opens with a map indicating the person’s current location and the miniSASS observations near to that site. The first page will have various keys:
▪ Navigate to closest observation. ▪ Find a river. ▪ Upload “my” current site.
o This will then lead to the next stage/step of uploading an observation � The future of the App given some of the above issues as well as longer term funding needed
to maintain it into the future.
Most recently (October 2017) mLab, have indicated that they have done a full re-development of the App with new students within their incubator programme, and that they have also written it for compatibility with iOS (Apple) (Kotze, pers comm. 2017). This is indeed promising, but many of the longer term sustainability issues around support, etc. for the App remain.
The miniSASS App has proved to be a very successful development on some levels, especially in terms of the innovative “river finder” technology, and the training and development of the interns through the Incubator programme at mLab. This latter element though is primarily a DST/MLab initiative, and not necessarily within the delivery requirements of this WRC research programme.

67
A number of concerns remain within the project regarding the maintenance of the App in the long term, estimated commercially at approximately R100 000 per year. The concern of who will host the miniSASS App and the integration of the miniSASS App database and the website database remain.
A key limitation remains that the foundation of the current App is not able to integrate with the miniSASS website and database which has been well-received and widely adopted by miniSASS users over the last three to four years. Through investigation of alternatives, it appears that a good option would be to develop the current website and database into a format that is compatible with mobile phones and tablets. However, funding would be needed to develop the current miniSASS website such that it is “Mobile compatible”.
Developing the current website to a mobile compatible format would require updating and some restructuring/rewriting of the current website software, followed by testing on mobile devices to ensure that all the map functions work properly. The proliferation of mobile devices is a recent phenomenon and there have been a lot of improvements in web mapping software since the initial development of the miniSASS website four years ago. An update to the website would ensure that the miniSASS website uses the latest, mobile-friendly software. This would probably need to be regularly undertaken into the future and for this project.
Given some of these structural (limited longer term institutional support) and funding limitations (R100 000 needed per year on maintenance alone), etc., the project team investigated other App options. Based on a review of currently available options, the GeoODK application (Geographical Open Data Kit) (downloadable from the Google Play store, and from the website http://geoodk.com/index.html), was selected.
GeoODK was created by a team of researchers and developers now based at the University of Maryland and International Institute of Applied System Analysis (IIASA), with development contributions from the Global Agricultural Monitoring (GEOGLAM) (http://geoodk.com/partners.html). GeoODK provides a way to collect and store geo-referenced information, along with a suite of tools to visualise, analyse and manipulate ground data for specific needs. Importantly, as a multi-dimensional application, GeoODK’s goal is to provide an open source platform that can be expanded to address current and future needs of data collection, (http://geoodk.com/about.html), relevant to this field of CS.
The GeoODK environment provides a platform for: � Designing questionnaires/or field based surveys, largely in excel, including text or numerical
input, multi-select, single-select, as well as special data types like, GPS points, polygons, and geotracing
� Mobile data collection (GeoODK Collect) – this is a mobile application that runs on Android smartphones but which has been extended with offline/online mapping functionalities, the ability to have custom map layers, for collecting point, polygon and GPS tracing functionality.
� Data aggregation – which is a web system that allows people/groups to aggregate and transfer data between the mobile data collection app and a web environment. The software allows for people to author surveys quickly and easily in Excel and have instant access on their Android phone. The forms can be easily distributed on an Android device or on the web, so no data connection is needed. Ultimately it is possible to visualize the data as it is collected, and gain understanding of it using various tools;
� ODK Aggregate – which provides a ready-to-deploy server and data repository to: o provide blank forms to ODK Collect, o accept finalized forms (submissions) from ODK Collect and manage collected data o visualize the collected data using maps and simple graphs o export data (e.g. as CSV files for spreadsheets, or as KML files for Google Earth)

68
o publish data to external systems (e.g. Google Spreadsheets or Google Fusion Tables). And finally
� Geospatial data display which is a web interface for converting data collected with GeoODK Collect/ODK Collect to a geographical format (shapefile), as either of:
o (point) o geoshape (polygon) o geotrace (polyline) (http://geoodk.com/getting_started.html#)
Ultimately then, it is custom built to precisely meet the data capture needs of the citizen scientist. The only costs involved are the time required to build the App, and with minimal hardware requirements. Any Android smartphone or tablet with a camera and GPS is capable of running the App. Geo-referencing and date-stamping of data captured allows for detailed and accurate reporting. Spatial capability in terms of points, lines and areas (polygons) can be captured and all data is geo-referenced ensuring that data is easily viewed in GoogleEarth or GIS software such as ArcView. The inclusion of photographs in the data capture process is invaluable for monitoring purposes as well as for the creation of an audit trail, should any queries arise, as all captured data and photographs are readily accessible. There is no in-field data requirement, information can be uploaded when WiFi is available, and real-time data capture is possible, with data uploaded instantly (data dependent) and immediately accessed by a supervisor or interested party in order to closely monitor work carried out. Furthermore, the App negates the risk of data from paper forms being captured incorrectly as everything may be captured electronically, and may be customised to capture any additional information in the field. Once back from the fieldwork exercise data can be downloaded off the web for analysis and processing.
Having developed the App for the miniSASS application, it was further adapted to be used for other CS tools developed in the project (e.g. the RHA). After testing it was also then used extensively throughout the Karkloof River Walk project and was used to capture miniSASS, water quality and clarity, and RHA data at 37 sites along the Karkloof River (as discussed in greater detail later in this report).
However, some of the original issues identified with the first App development still remain, mainly the lack of integration of the 2 miniSASS databases developed – one on the miniSASS website and the other within the GeoODK environment. This challenge remains for this project, but is likely to be resolvable with sufficient enquiry into the technology.
Figure 43: Overview of the process of recording data in the Geo-ODK app

69
Illustrated output from a CS initiative undertaken on the Karkloof River in KZN in 2017 to “walk the river”, and using tools developed within this project, including the Geo-ODK applications mentioned above are shown in the figure below.
Figure 44: Map showing river health data recorded using CS tools and the Geo-ODK app along the Karkloof River walk (2017)

70
CHAPTER FOUR: ACTION LEARNING: THE CO-ENGAGED APPLICATION OF CITIZEN SCIENCE TOOLS IN
SUPPORTING IMPROVEMENTS IN TRANSBOUNDARY WATER RESOURCE MANAGEMENT
CS tools6 are used to a greater or lesser extent in various contexts. At times, tools will be taken up with alacrity whilst at others there appear to be ‘limiters’ or ‘barriers’ to their adoption and use in different contexts. These factors (successes and enablers, as well as the limiters or barriers) have been researched and addressed since the commencement of this WRC supported project. This research has been conducted to ensure that the best possible design for new tools is followed and that the most appropriate and relevant dissemination, uptake and learning methodology, is engaged with. This report engages with the context in which the CS tools were developed and used before exploring Action Learning as an appropriate theoretical framework for supporting the wider use and application of the CS tools.
Figure 45: Anne Wals, Liz Taylor and Arjen Wals doing miniSASS fieldwork (real-life or ‘touch’ encounters) in the KZN Drakensberg. Arjen Wals is a Professor of Transformative Learning for Socio-Ecological Sustainability at Wageningen University in the Netherlands
The Context for the Development and field-testing of the Tools
Since the 1970s WESSA (the Wildlife and Environment Society of South Africa), a key partner to GroundTruth in this WRC project, has had an active commitment to environmental education (EE) as the key long-term driver of change for a more sustainable future. Projects such as the Twinstreams Environmental Education Centre at Mtunzini are reputed to be the first established EE centre in Africa and one of the first world-wide. The Twinstreams Centre is particularly relevant to this project since a mono-culture orientated farm which was largely commercial timber (pines and eucalypts) and sugar-cane has been rehabilitated into a coastal forest. A key outcome of this rehabilitation process included the planting of over 55 000 trees, removing many others and the fact that the two streams that flow past the centre, and from which it gets its name, are now flowing. The streams had dried up during the mono-

71
culture period. This EE centre, established by Ian Garland and his family, has offered practical and applied training courses for hundreds of school pupils, teachers and many leaders in society. By the 1990s over 70% of all traditional leaders, Chiefs or AmaKhosi, in KwaZulu-Natal had attended courses at the Centre and each course included studies of sustainable agriculture, ecology, conservation as well as land and coastal management (Taylor, 1997).
The establishment of Twinstreams was followed closely by the establishment of Umngeni Valley where, by 1995, 15 000 participants were attending organized courses each year. Bushpigs, (north of Johannesburg), and Treasure Beach (Durban), are two other EE centres, managed by WESSA. The EE centres described above have proved useful in field-testing the use and application of the CS tools. The enabling and inhibiting insights described below are drawn from these and other empirical experiences. These include the work done by Duzi-Umgeni Conservation Trust (DUCT) and the Mpophomeni EnviroChamps as well as the upscaling of the EnviroChamps programme to Ceres, Stellenbosch and Pongola; and the Wise Wayz Water Care Project, based in Ezimbokodweni and Folweni in KZN.
Does learning lead to meaningful change?
WESSA is an accredited training service provider with the Education, Training and Development Sector Education and Training Authority and although thousands of school-children and adults are attending and successfully completing the WESSA courses the question is often asked as to whether the courses, which use CS tools extensively during fieldwork activities, really do lead to change for a more sustainable future? Or are they simply entertaining and fun-filled experiences in nature?
Evaluating the present approach to EE & application of CS Tools to shape the future uptake & most efficient use of the tools
Questions of quality and effectiveness have thus often been asked about environmental education and field-work processes. As early as the 1980s Tim Wright and Rob O’Donoghue worked with staff at Umngeni Valley to develop the Participatory Evaluation Programme – Umgeni Valley (PEP-UP) evaluation (Wright, 1988). This work extended over a number of years and staff members sought feedback from teachers and learners and articulated the staff’s approach to learning. The study showed that if learning is to bring about action and change, then the learning processes themselves must include action and change. This may seem like an obvious fact, but in those times, many felt that change could come about simply by communicating well-organized messages, and resources, including CS techniques, to people. Many examples have been cited about how well-intentioned litter campaigns certainly get the message across, but teachers are left perplexed when the very participants who have just agreed that littering is an inappropriate behaviour, and even passed knowledge tests that confirm they have received the message, continue to litter as if there was no connection with the learning at all! Action-based learning, which engages learners in practical and applied field activities supported by CS tools of learning, is a much more effective and reliable approach to bringing about change.
The PEP-UP evaluation thus held a key insight. If the learning is a passive process where participants simply receive messages, no matter how compelling or well-intentioned these may be, one can’t expect longer term change in behaviour to occur (Taylor, 1997). Clearly awareness raising activities need to be complemented with engaged processes where participants can research, experiment, find out and address local environmental issues using CS tools. CS tools, carefully structured through action learning processes, hold a key to the much sought-after change for a more sustainable future.
The following chapter builds on this insight and provides a conceptual model for future use and application of the CS tools developed through this WRC project.

72
Action learning & Citizen Science tools
Based on the literature review (Chapter 2) and the learnings and insights which have emerged during this research project, a model is proposed which best encapsulates the key elements around the successes and barriers to the uptake of these CS tools. This orientation to learning is known as “Action Learning” and the model is not unique in that it builds on an adaptation from other work in this field, most notably O’Donoghue (2001) and UNEP (2004).
Action competence and other methodologies that foreground democratic learning processes are also an important dimension of Action Learning. Such processes engage the participants in decision making processes, rather than assuming that they should simply implement externally derived solutions. Such pedagogical models are therefore potentially powerful ways of enhancing ‘agency’ which may be described as the ability of people to develop their capacities (Graham et al., 2014).
Action Learning: An open-process framework
An open process framework (O’Donoghue, 2001) was developed for the engagement of participants in fieldwork activities. This framework was then refined (United Nations Environment Programme (2004) into the 4T’s model for “Action Learning”. This project has further refined this model into the “5T Model”, incorporating “Tuning In” as a key component of the process. The refined model is presented in Figure 46, below. Central in the model is the “Nexus or Matter of Concern” which is the focus or issue which is being addressed. Supporting the matter of concern are the 5T’s which do not have to be undertaken in any particular order. These are “Tuning In, Talk, Touch, Think & Take action”.
Figure 46: The Action Learning 5T’s model adapted from the Open Process Framework of Rob O'Donoghue (United Nations Environment Programme, 2004)

73
This model allows for an engaged process, where participants can research, experiment, find out about and address local environmental issues using CS tools. In this way, it is not just awareness that is created, but a rich experiential opportunity. Through the research and interactions of the project it has been noted that these experiential opportunities are often most successful when lead by a facilitator who can contextualise the experience and the knowledge of the learners and is enthusiastic about the ‘finding out’ or ‘experimentation’ process.
Once the “Matter of concern” or issue is clarified for the learning (the central, grey circle in Figure 46) the “planning and tuning in” phase can commence. Careful planning and tuning in will strengthen the learning opportunities in CS interactions. The 5T’s can then be applied and have proved to be a useful orientating framework for an action learning approach. In this regard the interlinking activities of “Talk” (or dialogue), “Touch” (or real-life encounters such as field-work), “Think” (or reflection) and “Take action” are helpful in orientating the learning. These 5T’s may intersect with each other and may be done in any order depending on the need, mood and context of the group. Such an approach to learning opens up spaces where participants can engage in issues that are relevant and appropriate to their context. Each of the 5T’s is further outlined below.
Details of the 5T’s Model
Establishing the Matter of Concern Together
A key point is to situate the matter of concern in a shared context so as to establish the focus for learning. This could include CS in support of a curriculum topic, a local concern, a conservation issue or risk, or a practice as a nexus7 issue that needs to be resolved (See the central circle of Figure 46). The Tuning-In environment for learning provides a foundation for deliberative learning at the nexus of shared concerns where participants can ‘use what they know to make sense of what they see and are experiencing.’ The co-engagement here allows learners to work things out together as they engage with an issue in their catchment. A good teacher or facilitator will always seek to ‘bring-forward’ or ‘mobilise’ the prior knowledge and understanding that the learners have so that they can connect their understanding to the learning experience. This is an especially important enabling factor when engaging in CS activities.
Talking and dialogue: “What do we already know and what are we finding out?”
Talking and sharing amongst learners and communities as they seek to clarify what they already know and what other information they need to find out is a helpful activity in building an enabling approach to CS informed action. Where the teacher or facilitator does all the telling, and learners simply listen and try and remember, is not as powerful a way of learning as where learners explain to each other what they already know, and are finding out and what the implications are.

74
Figure 47: EnviroChamps explore water quality using the miniSASS tool with local councillors near Mpophomeni. Here engaged learning in real life fieldwork settings proved powerful in support of meaningful dialogue (talk) related to environmental issues and risks
Touch – real-life encounters: “What are we finding out together?”
A learning experience that includes a real-life encounter or field-work experience is usually more meaningful than learning experiences where facts are simply communicated to learners or where a ‘rote’ style of learning takes place. Rote learning is useful for learning facts and content but more active-based learning is needed if significant changes are to result from the learning experience. Real-life encounters where learners study, for example, a local stream and record data about what they are discovering can enhance the learning experience a great deal. For example, using miniSASS (Dambuza and Taylor, 2015), the clarity tube and velocity plank has strengthened the learning processes in that participants can explore and measure water related phenomena and come to a deeper understanding of the issues.
The EnviroChamps project in Mpophomeni was one case study where the sharing of, and access to, CS tools became a major enabling factor. The EnviroChamps themselves and other role players found the CS tools extremely empowering for themselves as well as for the local community (Ward, 2016). This was evident in the data collected by the EnviroChamps on spilling manholes in Mpophomeni. The detailed information that was recorded and shared, including the GPS coordinates, the response times of plumbers and causes of blockages, are an indication of the change in perceptions of their surroundings. Similarly, the miniSASS results obtained by the EnviroChamps enabled them to identify problem areas and pollution sources, and to act on the problems identified.
The EnviroChamps concept has proved so successful that the project model has been adopted by the WWF Nedbank Green Fund to pilot it in 3 additional regions of South Africa. A further example of how action-based learning has changed behaviour is through the Wise Wayz Water Care (WWWC) project based in eThekwini Municipality. Teams in Folweni and Ezimbokodweni have been collecting solid waste out of rivers for a number of years, but the amount of waste has remained the same. Since the implementation of an educational door-to-door campaign was launched in mid-2016, the teams have noticed a reduction in the amount of waste they are collecting out of streams. The impact of this work

75
was visibly demonstrated during the most recent flooding (October 2017) in Durban. Much of the storm and flood damage was related to blocked stormwater channels, largely due to the effects of solid waste/litter. The riparian areas that had been adopted and cleared by the WWWC teams suffered very little stormwater damage or impacts due to their clearing efforts.
Two further case studies, which attest to this learning and change are presented towards the end of this chapter.
Thinking and reflection: “What is this issue here and what can be done about it?”
We live in challenging times and most environmental issues are complex and difficult to understand. A chance for learners to reflect on what they are learning and to consider questions about the learning helps deepen the understanding and learners can engage in questioning rather than simply be the recipients of knowledge as facts. CS approaches that enable learners to ask questions are more useful than those where answers or solutions are simply presented.
Often it is necessary to seek to understand the more systemic issues that are faced in a situation rather than just assuming that a simple solution can be found. A significant challenge when seeking to bring about social change is to ‘get to grips’ with the underlying mechanisms that both maintain and have the potential to change regularities, particular habits and ways of doing things, in particular contexts. This is challenging work and all too often projects or change initiatives revert to responding to the immediately visible elements and problems rather than working at the level of the invisible systemic structures and mechanisms that maintain them. Pawson and Tilley (1997) provide a useful metaphor for this process:
We can never understand how a clock works by examining only its face and the movement of its hands; rather we examine the clockworks, and so a proper understanding requires us to master the construction of the balanced spring or the oscillation of caesium atoms.
CS tools and activities can enable the discontinuities that are often present in a situation to become more evident and visible. This means that they can be engaged with in a thoughtful, informed manner, rather than having solutions imposed that are unlikely to last the systemic issues and risks that helped maintain the challenge or issue in the first place.
In the context of this research project, this has been evident in the Door-to-door programmes run by both the EnviroChamps and the Wise Wayz Water Care project. Both groups have uncovered interesting drivers or shaping and influencing factors of community behaviour in terms of water use, sanitation and waste disposal. It is only once these underlying and influencing factors are better understood that efforts to enable more sustainable, more informed choice options become possible. This concept is underpinned by the shift from narrow behaviour modification approaches, which are often referred to as causal processes to broader, more inclusive and socially enabling approaches, as described by Taylor (2014a).
Taking Action: “What should we do about the issue we are learning about?”
Taking action is an important part of an active learning approach to change. Interestingly, it need not be the final T in the learning, but could come near the beginning, where a chance to ‘get out,’ explore and ‘do something’ seems appropriate to the group. A good teacher or facilitator will be open and flexible as to when to encourage each of the five T’s in the learning experience. The five T’s are therefore not recommended in any particular order but can be used according to the group objectives and context at any given time.

76
Having a wide range of CS tools available for learners to consider and apply is a useful approach that can connect with any given context. This flexibility can enable learners to explore issues and risks that become apparent in the field-work context and allow action-taking to be informed by and through the field-work enquiry process. As mentioned above (Ward, 2016) the use of CS tools enabled a strategic response to water and sanitation issues in Mpophomeni township and supported successful interventions from the local authorities including Umgeni Water, the Department of Water and Sanitation and community members (Taylor and Taylor, 2016). This is an excellent example of CS tools supporting constructive local action for more sustainable water and sanitation management.
Additionally, the 5T’s model can prove useful to understand why some actions are not successful. For example, should an action not be successful, the participants can go back to the process that was followed, and reflect upon all the “T’s” that were implemented. If one of the T’s were omitted, or could be strengthened, the process can be followed again to better determine the actions that can be taken, or determine if a more favourable outcome is possible.
Training and facilitation: a vital component of the 5T Model
Through the research and learnings gained during this WRC project it has been noted that one of the more powerful enablers of CS use is when training and resources (or CS tools) are connected through coherent and professionally designed and supported training processes.
This means that the best uptake and adoption of the CS tools happens when citizen scientists are exposed to the tools during a training programme, or through a carefully facilitated process. These processes could include formal training programmes, such as NQF training, or through a hands-on workshop. What has become clear through the work being done with CS tools in this, and other projects, is that mentorship and continued learning also plays a vital role in the continued use of the tools. This mentorship and support builds confidence in the citizen scientists to further develop their own change projects8.
The Environmental Practices Skills Programme, (NQF Level 2 Module 8: “Monitoring Water Quality”) requires participants to undertake a miniSASS (Stream Assessment Scoring System) enquiry. Undertaking CS activities as part of a course supports a theoretical and practical engagement process that is mutually supportive of engagement, learning and social change. Courses that recommend CS activities and structure these into the training processes are enormously powerful in enabling productive CS action. Another example of this type of training course is the Introduction to Aquatic Ecology course which was developed around CS tools and is offered by GroundTruth (Figure 49). The two days of training cover the theory of aquatic ecology and also the practical activities of using miniSASS, the clarity tube, velocity plank and E. coli swab.
Figure 48: WWWC teams attended a two-day Intro to Aquatic Ecology course and engaged with the CS tools (working with miniSASS on the left and the velocity plank on the right). These teams have subsequently developed a full river monitoring programme for the rivers they work in.

77
Research and situated learning within the context of this WRC research project, as well as other fieldwork with CS tools, revealed how useful planning frameworks for learning such as the Enviro-Picture Building resources can be to orientate and support CS actions. Enviro-Picture Building resources portray the environmental issues in a pictorial format with information on the issue on the back of the card. This means that the learners can easily navigate from a pictorial representation to more detailed text. Facilitators can also use the pictures and refer to the information text on the back of the pictures, where these are appropriate. Enviro-Picture Building resources help participants understand a more holistic and connected view of the environment in which they are studying.
Figure 49: Members of the Women’s Leadership and Training Programme (WLTP) using the “Windows on the World: Catchments to Coast” Enviro-Picture building resource to understand and contextualize CS activities. Each participant placed a coloured crab icon from the miniSASS activity at the place they considered the most appropriate to the colour code of the crab.
An example of how the Enviro-Picture Building resource was used to stimulate dialogue around river health was applied during a training workshop that was conducted for the Women’s Leadership and Training Programme. Due to time-constraints participants were unable to go into the field for a practical session. A simulated field-session was therefore conducted. Each participant was given a miniSASS colour crab and asked to place their crab onto the Enviro-Picture Building map of southern Africa (Figure 50). Each participant then had to explain why he or she had placed their crab in a particular location. One delegate placed a blue crab (indicating good quality water) on a much polluted river. The other participants were surprised by his choice. When asked why he placed his blue crab on a polluted site, he stated that he was going to start a programme that would transform the site from an orange crab to a blue crab. This response then stimulated further dialogue on the use of miniSASS to assess river health and to help clarify responsible actions to solve problems.
Graphic representations of the tools, represented in an accessible format, also prove an enabling strategy for the sharing of CS tools. In this regard a poster presentation developed for the 2016 Water Institute of Southern Africa (WISA) Conference proved invaluable not only at the conference but in ongoing sharing of the tools (Appendix B).
Workshops with local authorities or Metros such as eThekwini have also proved fruitful in supporting the promotion and wise use of CS tools. In this regard a culture of supporting the authorities to achieve

78
their water and sanitation mandates with the help of CS tools has proved invaluable. A co-managed and co-constructed CS tools workshop is much more useful and effective than where CS tools are simply presented and workshopped with the participants. One such workshop was conducted with eThekwini Metro in Durban. The one-page format report on the workshop is a useful innovation for sharing what had taken place. By using ‘Power-point’ to construct the workshop report enables others to easily access the report and to interact with the material and edit and change it should they so wish to.
In her evaluation of the enablers and constraints of the uptake and use of the CS tools for the improvement of transboundary catchment/water resources management, Madiba (PhD student supported by this project – in press) clarifies how engagements with communities that have a moral compass, e.g. kindness and being considerate to others, are enabling of the uptake of CS tools. Madiba relates this way of working to the concept of the common-good and Ubuntu. The common-good and Ubuntu are powerful components and builders of an effective community of practice. This WRC project has supported the development of a large and vocal community of practice, which has been facilitated through the miniSASS website (www.miniSASS.org), as well as various workshops and training initiatives which have been supported through this WRC project.
Madiba (in press) further emphasizes that a community of practice (Wenger, 2002) is a very important enabling factor in the uptake and ongoing use of CS tools. A developing community of practice that builds relationships, applies CS tools and engages with communities, was also found to be an enabling factor in the various Mpophomeni case studies (Taylor and Taylor, 2016). The learning opportunities that developed in relation to the CS tools demonstrated the importance of a developing community of practice. The training opportunities were extremely diverse and included accredited and non-accredited training through organisations such as WESSA. These also included the application of miniSASS and other CS tools training courses which are offered by GroundTruth. Wider learning opportunities are also offered through a network of organisations and initiatives such as Eco-Schools, Water Explorers and the Midlands Meander Education Programme. These opportunities for learning have made a significant contribution to enabling the EnviroChamps and the local community to understand the local environmental issues and to develop appropriate action plans to address these issues (Ward, 2016).
As stated in the introduction, it has been recommended to the United States EPA that it is vital that CS is strengthened and mainstreamed into the work that they do. The National Advisory Council for Environmental Policy and Technology report (2016) strongly recommends the need to work together with the community of CS organisations to strengthen efforts for ensuring environmental protection.
Case Studies where “Action Learning” had led to meaningful change
Leadership Seminars, which support Councillors, Traditional Leaders and Municipal Managers to achieve their mandated responsibilities are making a significant positive impact in the KZN Midlands. Such seminars are usually informed by an “Action Learning” approach and include practical field-studies that are supported by CS activities. Additionally, projects such as the EnviroChamps (KwaZulu-Natal and Western Cape) and Wise Wayz Water Care (KwaZulu-Natal), where training has a strong focus on Action Learning supported with CS tools, are making a tangible impact on the lives of the communities that these projects reside in.
Further to this, community support networks, such as the EnviroChamps in the KwaZulu-Natal (KZN) Midlands, as well as the EnviroChamps in Stellenbosch, Ceres & Pongola and the Wise Wayz Water Care Project in eThekwini (Ward, 2016 (a); Ward, 2016 (b) and Dent and Taylor, 2016) with a ‘close and local’ orientation, also supported by CS tools, are proving significant in building understanding and commitment for a more sustainable future.

79
Case Study 1: Shiaybazali and the Howick Wastewater Treatment Works (HWWTW); Howick, KZN
The outflow of the Howick Wastewater Treatment Works is located at the Shiyabazali informal settlement, close to the Howick Falls, and represents a major health-risk to Shiaybazali residents. The outflow also compromises the water quality of the Umngeni River. Through training and the application of Action Learning, the EnviroChamps of Mpophomeni identified this issue as a major concern for the community. Supported by DUCT the EnviroChamps used a clarity tube (developed through this project) to monitor the water quality of the treated HWWTW effluent three times daily (Photo 5). Data collected revealed that outflow was outside of discharge limits. Using this data, the EnviroChamps, with support from DUCT and GroundTruth were able to approach Umgeni Water about the issue. Their concerns were now based on facts and sound data and were taken more seriously by Umgeni Water who are responsible for the water quality of the outflow. The use of a CS tool developed by this project, together with support from a broader community of practice such as DUCT, has enabled the EnviroChamps to take action to improve their environment in a positive way.
Figure 50: Few people realise that nutrient loading is a massive risk to most rivers and streams in South Africa. Here Zongile Ngubane measures the water clarity of the Wastewater treatment Works (WWTW) outflow pipe in Shiyabazali informal settlement. Clarity measurements are converted to represent total suspended solids, which include nutrients (photo courtesy of Andrea Kolbe).

80
Case study 2: Resolving water leaks in Ezimbokodweni, Ezimbokodweni, KZN
The Wise Wayz Water Care project has implemented a Door-to-Door education and communication campaign in Ezimbokodweni and Folweni in the eThekwini Municipality. This campaign involves volunteers who receive training on measuring water leaks and learn about what actions need to be taken when leaks are identified. During one of the community visits the team were made aware of a municipal potable water pipe that had been leaking for over a year. The leak had caused major erosion between houses (Photo 6). The community had already made numerous efforts to have the leak repaired, but with no success. The Wise Wayz Water Care team calculated that six litres of water were being lost per minute (equating to approximately three million litres lost in the year!). Through the reporting and calculation efforts of Wise Wayz Water Care, the leak was fixed within a week, and the community was able to start repairing the damage to their properties.
Figure 51: Images showing the damage to the infrastructure in Ezimbokodweni, as well as one of the Wise Wayz Water Care volunteers measuring the outflow from the leaking pipe (right). The images below left show the damaged pipe.

81
CHAPTER FIVE: CAPACITY FOR CATCHMENTS – DEVELOPMENT OF A CITIZEN SCIENCE VIRTUAL TOOLBOX FOR WATER RESOURCE MANAGEMENT
The development of a Citizen Science toolbox
This WRC funded project has refined a number of water related CS tools, such as miniSASS, as well as developed a range of new tools, such as the Wetland Tool, the Estuary Tool and the CS Rain Gauge. The development and application of these tools is reported on in a previous chapter of this report.
Currently, the tool that is most easily readily accessible to the public at large is the miniSASS tool, through the miniSASS website, which is hosted by the South African Institute for Aquatic Biodiversity and maintained by GroundTruth. The miniSASS newsletter, which provides a bimonthly update of miniSASS activities in South Africa (and internationally, on occasion) is a vital link to the CS user community.
The miniSASS website has proven particularly successful, as demonstrated in earlier chapters of this report. The website receives regular data uploads and new user registrations on a weekly basis, and the model for this website appears to be working well. The literature review and research conducted during this project, also highlighted that this was a highly dynamic and emerging field of practise, as new tools are developed, and as new communities of practise emerge across the landscape. To accommodate future expansion and growth within this field, the advances in smart phone technology, and the increase in data availability and internet access by most sectors of society, but most importantly not to have this work confined to a static research report within the WRC library, the project research team undertook to develop an electronic “virtual” toolbox, that could be continued to be added to as and when new tools emerged or current tools were further refined or developed. This organic and virtual toolbox would be complimentary to pre-existing tools and websites (e.g. miniSASS) where necessary and would give life to this project beyond the current funding cycle. Therefore, a new portal – the Capacity for Catchments portal (see https://www.capacityforcatchments.org/) has been developed to house the newly developed tools and other resources, as well as space for the growing communities of practise within this field to share ideas and inspire future growth in this field.
With the advent of the new tools; the advances in smart phone technology; and the increase in data availability, and use by most sectors of society, the development of a central portal for citizen scientists to access, investigate, download tools and upload data becomes a vital component of the CS network.
The virtual toolbox and other resources
The key objective of this research project was to develop a suite of tools for use in community-based water resource monitoring. As part of that development, previous chapters presented an outline and discussion of the key resource types (rivers/streams, wetlands, estuaries, springs and rainfall, etc.) and critical development needs of the various tools for the specific water resources. The tools developed, and some of their application and where appropriate, case studies, have been illustrated.
To continue with the life of this project, and to allow ongoing support and ready access to these and any new tools, the “Capacity for Catchment” portal is a central portal to download information, user guides, background, tools, posters, data sheets, and in some cases, where appropriate, a power point

82
presentation of the tool. It also provides links to other useful and relevant resources within this field of practise.
There has been major growth in the CS field in the past few years, and as the field grows there is often a need to facilitate the development of a Community of Practice (CoP) to facilitate the uptake of CS tools that are available to society. Key aspects and case studies of this CoP are also available on this portal.
In keeping with the objective of not producing just another technical research report, this chapter is kept brief, with the primary emphasis on the portal at https://www.capacityforcatchments.org/. However, key aspects of the content and highlights of the portal are reported below.
The capacity for catchments portal
The concept of the portal is to provide the public, both nationally and internationally, with a central hub to access the CS tools developed by this project. However, the idea is to take opportunities for collaboration one step further, and to link to other CS tools, again, both nationally and internationally, to provide the citizen scientist with a range of tools that they can access to better understand, engage with and collect data for the environment.
The portal confirms that the website and use of the website is for public, or common good, and the data collected and displayed on the website may be used by any interested party. However, emphasising that data users must reference the data source.
The portal will introduce the user to CS and CS tools. The next “step” in the process would be to introduce the user to the “5T’s model” (see Chapter 4 on action learning), and which this research project has refined and is using to facilitate the adoption of the CS tools developed by this project. This model will assist individuals and groups to select an issue that they face or are interested in, and then work to resolve the challenge or learn more about their issue or concern.
An open process framework (O’Donoghue, 2001) was developed for the engagement of participants in fieldwork activities. This framework was then refined (United Nations Environment Programme (2004) into the 4T’s model for “Action Learning”. This project has further refined this model into the “5T Model”, incorporating “Tuning In” as a key component of the process, i.e. tuning into what the matter of concern is. The refined model is presented in Figure 53, below. Central in the model is the “Nexus or Matter of Concern” which is the focus or issue which is being addressed. Supporting the matter of concern are the 5T’s which do not have to be undertaken in any particular order. These are “Tuning In, Talk, Touch, Think & Take action”.

83
Figure 52: The Action Learning 5T’s model adapted from the Open Process Framework of Rob O'Donoghue (United Nations Environment Programme, 2004)
The website will guide the user through a range of steps to choose the correct tools to use to address their challenge or area of interest. This will be done through a series of questions and answers to determine what component of the CS tools the user will be interested in, and is most relevant to their situation – asking what story are they interested in or wanting to tell. This will help the user to, for example, decide if they are close to an estuary or a spring, or if they are interested in wetlands or riparian areas. Through this guided process the user will determine which tool or tools to use for their particular investigation – linked to the TOUCH aspect on the above diagram.
To assist in this process, the portal is built around, a stylised “typical” catchment where various resources and issues could be imagined. The users are encouraged to either work their way around the catchment picture, where hot linked and relevant tools appear, or the user is able to simply use relevant tabs to go to a suite of tools and resources which they may be interested in. See relevant figures below. The portal has a home page, with relevant introductory background information, a tools page, with relevant tools organised according to the relevant areas of interest, and then other tabs to cover the community of practise, rules (regulating water resources in SA and how CS may be used/applied), and then project partners for further information. The portal is currently (this draft final report) being finalised, and will be updated with final tools and materials, etc. by the end of this project cycle.

84
Figure 53: Screen capture illustration of the Capacity for Catchments webpage/portal and stylised catchment to “explore” for resources

85
Figure 54: Screen capture illustration of the detail of one of the tools within the Capacity for Catchments webpage/portal (note User Guide, Summary Sheet, Poster and PowerPoint resources associated with the tool)

86
A brief summary of some of the tools and associated resources available on the site is as follows:
Water Resource Citizen Science Tools
Clarity Tube
A simple CS tool to monitor water clarity, an indicator of turbidity and total suspended solids. The finalised clarity tube manual is available for download as well as a field sheet and an informative poster that can be used for school/community groups, workshops, etc.
E. coli Swabs
The E. coli swab was developed by Micro Food Labs as a rapid assessment to detect the presence or absence of E. coli bacteria. The swab provides an indication for the user to determine if further testing is required, based on the outcome of the test. The swab works on the principal that a sample is collected, and incubated for a period of between 18 − 24 hours, to allow any E. coli present to reproduce to determine if there is E. coli present or not. The user guide is available for download.
Estuary tool
This tool provides number of activities that can be used to assess the ecological condition of an estuary. The available downloads include a technical background of the tool, one day toolbox for a field day at an estuary as well as a template spreadsheet where data can be recorded and analysed.
Riparian Health Audit
In order to manage riparian ecosystems it is important that their ecological condition can be assessed. The Riparian Health Audit (RHA) was developed to provide a simple and easy-to-use tool that will enable the assessment of riparian ecosystem condition by a wider range of users for various applications.
Spring tool
This tool describes a method for assessing the ecological condition of a spring based on a number of impacts. A photographic guide as well as field sheets are available for download from the website.
Velocity Plank
The Transparent Velocity Head Rod (TVHR), or Velocity Plank, is a very simple tool that allows citizen scientists to measure the velocity, and discharge of a stream. The velocity plank is a simple construction of transparent plastic allowing for simultaneous measurement of upstream super elevated water level and the depressed downstream water level created when the rod is placed into flowing water. The difference between these water height measurements can be used to predict the depth-averaged flow velocity. Available for download from the website is a comprehensive user guide, including instructions on how to fill out the field sheet, a document that summarizes the crucial steps in the user guide, an informative poster and a PowerPoint presentation based on the tool.

87
Weather monitoring tools
There are downloadable manuals for the CS rain gauges as well as the velocity or wind pressure plate tool, currently available on the website. Temperature and other CS weather tools are in the process of being calibrated and will be available on the website, as well as additional useful information on why weather data is important to citizen scientists.
Wetlands assessment tool
This tool describes a method for assessing the ecological condition of a wetland based on identifying land-cover types in a wetland and its catchment and inferring impacts from the particular land-cover types present. Available for download from the website is a technical background document, a user guide for the tools, table templates relating the detailed map option of the tool and a table of overall impact scores.
School lesson plans – CAPS Materials
CAPS stands for Curriculum Assessment Policy Statements and is a revision of the current National Curriculum Statement (NCS). With the introduction of CAPS, every subject in each grade will have a single, comprehensive and concise policy document that will provide details on what teachers need to teach and assess on a grade-by-grade and subject-by-subject basis. Resources developed for this project provide support to CAPS with a specific focus around water resources and their management.
A fieldwork toolkit has been developed for the following categories:
� Intermediate primary phase � Senior primary phase � Further education and training phase
There are a number of downloadable lesson plans for these different categories as well as other resources that can be used in conjunction with the lesson plans as additional, useful resources. These include:
� A list of references and useful information � Appendix One – Water plants as wetland indicator species � Appendix Two – Water animals, identification guides � Appendix Three – Larger animals of wetland systems
Rules
The “Rules” aspect of the project was derived from the current literature, and understanding how, besides the tools already discussed, rules and divisions of labour or responsibility (Engeström, 2001), and the communities of practice (Lave and Wenger, 1991), that form within and for processes of social change were identified as key aspects in the support of social change and better resource management. So, without a clearer understanding of the “rules” and how these “rules” govern or mediate how citizen scientists could and or should be engaging in water resource management within the country, there is likely to be reduced success with the application of tools developed in this project.
The ‘Rules’ page on the Capacity for Catchments website is aimed to provide a legal context and alignment with appropriate policies and strategic documents for CS and water resource management in a South African context. In other words, the rules, etc. that society should adhere to, or which govern, or provide policy or strategic direction to water management in South Africa. The management of water

88
resources involves stakeholder and potentially CS contributions at various levels, and which is illustrated in the figure below (modified after GreenCape, Market Intelligence Report, 2017).
Figure 55: Key water relationships between various legally responsible entities, policies, and strategic perspectives influencing the “rules” of water resource management in South Africa (modified after GreenCape, Market Intelligence Report, 2017), and how CS could interact with these “rules”.
At its highest level, the constitutional framework states that every person has ‘the right to an environment that is not harmful to their health or well-being; and the right to have the environment protected, for the benefit of the present and future generations’. Further legal, regulatory and policy frameworks which stem from the Constitution, with regards to water resources and CS include, but are not limited to, the following:
� National Water Act (NWA): Protection and management of water resources, inter alia to meet
basic human needs of the present and future generations. � Water Services Act (WSA): Various provisions including rights of access to basic water supply
and basic sanitation. � National Environmental Management Act (NEMA): Various provisions including
management, sustainable use, regulation & protection of ecosystems, biodiversity, etc., including provisions relating to cooperative governance and public participation thereof.
� Conservation of Agricultural Resources Act (CARA): Various provisions including management, sustainable use, regulation & protection of agricultural land and systems, etc.,
and various other key Acts and strategic planning documents, viz:
� Spatial Planning and Land Use Management Act (SPLUMA), Minerals and Petroleum
Resources Development Act (MPRDA), amongst others

89
� National Water Resources Strategy (NWRS 1&2): The NWA required the establishment of a NWRS and the establishment of CMAs (with the responsibility to develop and implement a CMS) that is consistent with the framework provided by the NWRS. The updated strategy, NWRS2, aims to “ensure that national water resources are managed towards achieving South Africa’s “growth, development and socio-economic priorities in an equitable and sustainable manner over the next five to 10 years.” Additionally, the NWRS talks to the fact that ‘Civil society is encouraged to play a watchdog role in supporting compliance by water users with water regulations at all levels’
� National Development Plan (NDP): The primary aim of the NDP up to the 2030 planning horizon (NPC, 2012) is to eliminate poverty and reduce inequality by “growing an inclusive economy, building capabilities, enhancing the capacity of the state and promoting partnerships throughout society.” The NDP’s approach to achieve this identifies active citizenry, together with effective government and strong leadership as key drivers of the country’s development and support towards social cohesion (DWS, 2017).
� Water Quality Management Policies and Strategies for SA: The latter (Strategies) document (DWS, 2017) is particularly strong on the role and importance of increased capacity of citizens to be engaged with the future management of water resources in SA. Of particular relevance are the following Strategic Actions identified in that document and which talk directly to this project and its orientation/outputs:
o Governance frameworks for active citizenry o Development of citizen-based monitoring o Expand capacity building initiatives o Online tools for water quality and water quality management information
� Various International Obligations: The Sustainable Development Goals (SDGs), Agenda 21, Agenda 2063, Africa Water Vision, the UN-Convention on the Law of the Non-Navigational Uses of International Watercourses, amongst others.
� Various Regional Protocols: SADC Protocol for Shared Watercourses, Regional Strategic Action Plan (RSAP), which in its most recent incarnation (version IV) has CS as a key component, amongst others.
And various: � Bilateral/Multilateral and Basin Wide Agreements: Limpopo Watercourse Commission
(LIMCOM), Orange-Senqu River Commission (ORASECOM), amongst others.
The most recent development around how water quality management should be integrating many of these frameworks above, within SA (Water Quality Management Policies and Strategies for South Africa – Integrated Water Quality Management (IWQM) Strategy, DWS 2017), acknowledges the role and highlights a number of key opportunities where CS could and should be translated into strategic actions in support of integrated water quality management. The opportunities are summarised in the table below and will be highlighted in tabular form on the portal.

90
Table 12: Extract and summary of the IWQM strategic issues objectives and actions (DWS, 2017) that the WRC Citizen Science project could align with or engage in
Strategic Issues Strategic
Objectives
Strategic Actions WRC CS tools project
alignments/ engagement opportunities
4: Formalise governance frameworks to support non-governmental engagements
SO4a: Partnerships/ stewardships established and maintained
SA12: DWS to develop a partnership framework that is fair and equitable
Various CS groups to join (or establish) existing stewardship programmes/ frameworks in support of partnerships
SA13: DWS to develop and foster strategic sector partnerships
Various CS groups to join (or establish) existing stewardship partnerships to strengthen strategic sector partnerships
SO4b: Governance framework for active citizenry formalized
SA14: DWS with DEA and CMAs to develop an engagement framework that enables more active participation of civil society at transboundary, national and catchment levels
Become active participant/ stakeholder in such an engagement framework and with tools in support of this initiative
SA15: DWS, DEA and CMAs to support and drive functional platforms for the engagement of civil society nationally and within catchments
Engage with civil society, consultants, NGOs to develop active CS projects within the catchment
10: Strengthen monitoring and information management
SO10a: An integrated and functioning WQ monitoring network
SA 45: DWS/CMAs to strengthen national and catchment WQ monitoring networks through spatial expansion and identification of priority constituents for catchment specific monitoring
Maintain / further develop the Capacity for Catchments and miniSASS websites as a central CS based WQ monitoring and support network
S010b: Information systems that are current and accessible to support adaptive WQM
SA 47: DWS, with the WRC and CMAs, to lead the development of a programme to create and support citizen-based monitoring programmes
Help to further develop, initiate or strengthen CS programmes – this WRC project has also strongly supported tools development in support of this SA 47
SA 49: DWS, CMAs, DEA, DAFF, DMR to develop systems to enable data and information access by stakeholders/public
Further promote CS initiatives around WQ such as the Capacity for Catchments and the miniSASS website

91
Strategic Issues Strategic
Objectives
Strategic Actions WRC CS tools project
alignments/ engagement opportunities
11: Build WQ and WQM Capacity through Education, Training and Communication
SO11b: WQM decisions are underpinned by best practice, research and innovation
SA 55: DWS, with the WRC, to investigate the options provided by recent innovative developments to improve water quality
Potential to fund further research projects and refine some tools
SA 56: WRC to lead the sector in innovation, research and development for IWQM
This WRC project has also strongly supported tools development in support of innovation and researched tools in support of CS and IWQM
SA 58: DWS/WRC to develop online tools for easy access to WQ and WQM related information
Continue to develop, improve and promote existing public information systems/CS initiatives around WQ (e.g. http://www.minisass.org/en/)
Similar to SA 49
Investigate options in terms of new developments and networks
SO11c: A well informed and actively engaged South Africa
SA 59: DWS/DEA/DAFF/DMR/CMAs to develop and maintain multi-sector stakeholder platforms for sharing information
Engage with various national departments & contribute to stakeholder platforms for sharing information. Ensure CS tools and reporting, etc. are on relevant CMF meetings
SA 60: DWS, with other Departments and sector institutions, to lead and roll-out awareness creation campaigns
Potential to conduct awareness campaigns throughout South Africa with NGOs, stakeholders, consultants. Especially using CS tools and approaches into and in support of initiatives such as Adopt-A-River, etc.
Community of Practise (CoP)
This section of the portal is aimed to provide a summary of various CoP activities within the space of water resource management, which may inspire and give guidance to others in terms of what has been and/or is currently being done at the global, regional and local scale in relation to various CS activities. Where appropriate, hyperlinks will be available to guide users to more detail should they wish to pursue further details about these initiatives.
In broad summary the following initiatives will be highlighted, although, as indicated, this is likely to be an organic process and will hopefully grow in time and with additional resources added as they become available and noted.
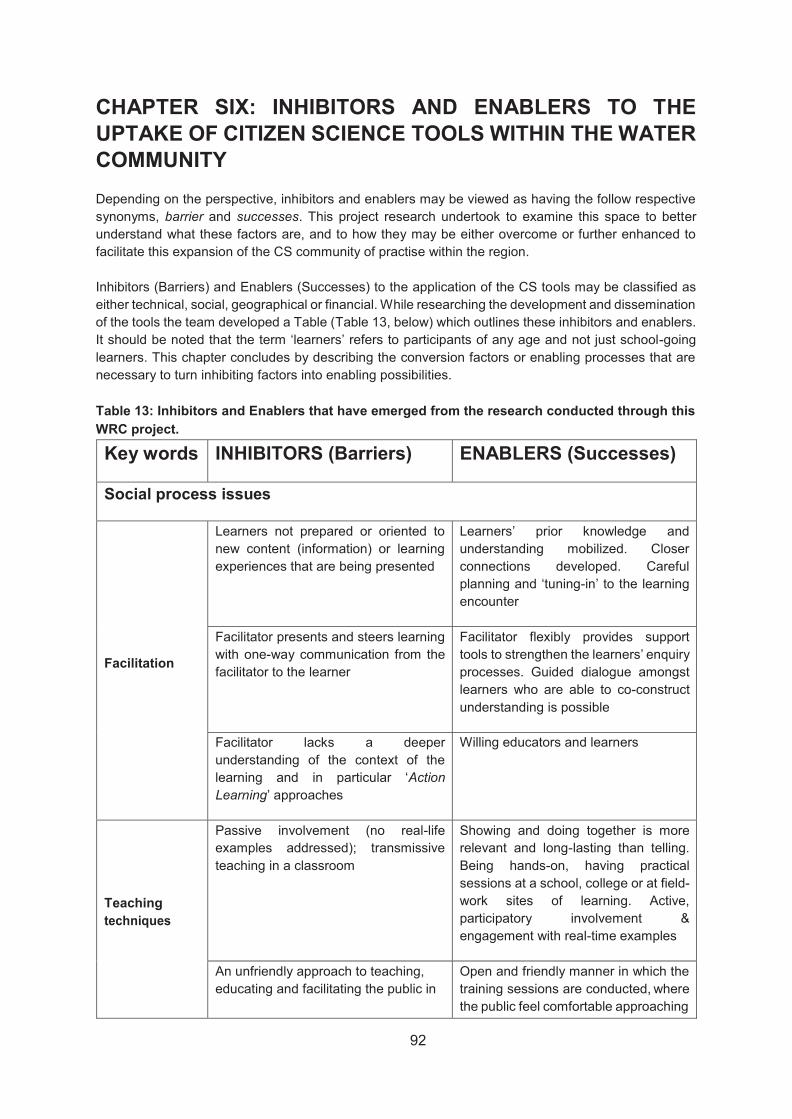
92
CHAPTER SIX: INHIBITORS AND ENABLERS TO THE UPTAKE OF CITIZEN SCIENCE TOOLS WITHIN THE WATER COMMUNITY Depending on the perspective, inhibitors and enablers may be viewed as having the follow respective synonyms, barrier and successes. This project research undertook to examine this space to better understand what these factors are, and to how they may be either overcome or further enhanced to facilitate this expansion of the CS community of practise within the region.
Inhibitors (Barriers) and Enablers (Successes) to the application of the CS tools may be classified as either technical, social, geographical or financial. While researching the development and dissemination of the tools the team developed a Table (Table 13, below) which outlines these inhibitors and enablers. It should be noted that the term ‘learners’ refers to participants of any age and not just school-going learners. This chapter concludes by describing the conversion factors or enabling processes that are necessary to turn inhibiting factors into enabling possibilities.
Table 13: Inhibitors and Enablers that have emerged from the research conducted through this WRC project.
Key words INHIBITORS (Barriers) ENABLERS (Successes)
Social process issues
Facilitation
Learners not prepared or oriented to new content (information) or learning experiences that are being presented
Learners’ prior knowledge and understanding mobilized. Closer connections developed. Careful planning and ‘tuning-in’ to the learning encounter
Facilitator presents and steers learning with one-way communication from the facilitator to the learner
Facilitator flexibly provides support tools to strengthen the learners’ enquiry processes. Guided dialogue amongst learners who are able to co-construct understanding is possible
Facilitator lacks a deeper understanding of the context of the learning and in particular ‘Action Learning’ approaches
Willing educators and learners
Teaching techniques
Passive involvement (no real-life examples addressed); transmissive teaching in a classroom
Showing and doing together is more relevant and long-lasting than telling. Being hands-on, having practical sessions at a school, college or at field-work sites of learning. Active, participatory involvement & engagement with real-time examples
An unfriendly approach to teaching, educating and facilitating the public in
Open and friendly manner in which the training sessions are conducted, where the public feel comfortable approaching

93
training sessions will not be conducive to optimal learning and understanding.
the facilitator with questions or comments (Madiba, in press)
Teachers and other CS users work in isolation
Participants work within a developing community of practice that becomes mutually self-supporting.
Hypothetical, presentation-centred learning via, for example, Power Point presentations are seldom as good as a real-life study
Real-life encounters (tangible field work) are usually more useful than hypothetical examples. Careful and structured questioning helps to open up and deepen the learning. Learning becomes more contextual and relevant
Change3 project imposed on learner by the facilitator
Change project emerges from the needs, challenges and discontinuities revealed through the CS fieldwork enquiry (Action Learning process)
Prior Knowledge
Participants who have not yet encountered or had the benefits of a new, cleaner and more sustainable environment
Those who are now benefitting from a cleaner and more sustainable environment
Exposure to tools
CS tools used in an isolated or independent context
CS tool used within the context of a training course or to address a relevant issue
Preconceived ideas
Critics (negative, no faith in amateur non-professional scientists), lack of co-operation
Enablers (positive, faith in amateur, non-professional scientists), full co-operation.
Technical Issues
Language
Language barriers (e.g. materials printed in English; facilitation in English only)
Facilitators fluent in the most relevant language. The translation of materials into other languages (more specifically the language of the learners)
Access to tools
The simple handing out of booklets to be taken home.
Handing out of booklets, using and making reference to them and working from them in the actual physical environment
3 A Change project is simply that – a project about change. It involves an individual or an organization using the knowledge gained through a learning encounter to change their actions and practices towards greater sustainability.

94
Access to tools (e.g. expensive, or difficult to use and understand)
Through this project every effort has been made to construct tools that are inexpensive, accessible, robust and user friendly. Examples are the calibrated rain gauge made from a recycled coke bottle and the miniSASS net made from a coat-hanger and a nylon stocking.
Financial Issues
Access to tools
Lack of tools, resources and books/info Development of low cost or no-cost resources (as per this WRC project). Provision of tools / books and field-guides by potential sponsors
Access to study sites
Lack of transport to sessions or study areas
Selection of tools to be used according to local resources and study sites. The use of simulated activities. The sponsorship of transport to sites
Data & Access to resources
Limited or no access to computers, the internet or Google Earth
Financial resources can be sourced to purchase appropriate equipment and internet time (data)
The cost of data and airtime to download resources or upload results
The Mpophomeni case study (Ward, 2016) revealed that air-time provided to the participants supported considerably more active and engaged participation. Alternative funding models could be considered.
Geographical Factors
Access to study sites
Lack of a local study site to implement “Active Learning” opportunities
Facilitator carefully uses local study sites making meaningful learning possible. Use of “artificial river” (simulation) as per example below. Simulated activities such as street theatre
Access to knowledge
Lack of environmental educators and volunteers. Lack of enthusiasm.
Availability of environmental educators and volunteers. Sharing or supply of resources such as learning packs becomes more important. Enthusiastic tutors and participants.

95
Through research associated with this project it was found that although inhibitors are often considered in a negative light, it is often these inhibitors that can be ‘turned around’ to create an enabling environment in which to deal with the barrier or constraint. These opportunities provide a space in which dialogue can generate new knowledge and understanding of the concepts being addressed. Examples of how these barriers can be overcome by novel and innovative mechanisms are given below. It is possible, therefore, that process enablers can be used to overcome inhibitors.
Various mechanisms can be used to overcome a number of the barriers outlined above. To overcome geographical obstacles in teaching miniSASS, for example, an “indoor river” made of cloth can be used (Photo 7). The facilitator could also collect a live sample from a stream and bring that with him or her to the training venue. The demonstration of how to collect a sample can be done using the “cloth river” and rocks or other materials found around the venue. Pictures of cut-out invertebrates are placed on the cloth and the participants “collect” the sample using nets. The participants then use the live sample as well as the cloth samples to investigate river health. If one is able to, the samples can be set up to reflect a healthy river and a polluted river. This can then lead to further discussion once the samples have been scored. This technique of training a group in miniSASS is also useful for large audiences, and where there is limited time for the training.
Figure 56: The cloth river, with two different habitats on the left, the “cloth sample” being identified, top right, and the live sample being identified on the bottom right. This method of interacting with the tools is not ideal, but works very well for schools that are not near streams or very large groups where time is a constraint.

96
Key enablers or principles for supporting meaningful learning with Citizen Science
The following principles have been developed in collaboration with Prof Heila Lotz-Sisitka (2005) and the Southern African Development Community – Regional Environmental Education Programme (SADC-REEP). The principles draw on international literature, as well as the experience of grounded learning programmes in a wide range of learning contexts. When considering learning processes that support the application of CS tools it is important to remember that it is not a passive state, but part of a continuously changing situation.
Enablers of meaningful learning approaches should: 1. Be relevant and appropriate to the situation and context of the participants.
2. Be aware of, and seek to connect with, the context in which the learning is situated and the topics under consideration.
3. Mobilise, wherever possible, the prior knowledge or understanding that people have so that it can be engaged with, and, where appropriate, challenged so as to un-learn and re-learn to support an enabling ‘learning for change’ environment.
4. Support, where appropriate, community, home or workplace-based learning. The learning needs to relate to the environment of the individual rather than be removed and hypothetical.
5. Offer participants the opportunity to engage in task or practice-based learning so as to strengthen the learning experience. Participants and institutions should undertake ‘learning’ tasks, sometimes called “change projects” that are related to their context.
6. Build on existing strengths and opportunities rather than emphasizing other, ‘from the outside’ ideas or project concepts.
7. Support part-distance learning where appropriate. This means establishing an appropriate mix of ‘work and learn together’ (at a workshop or training session) and then ‘work and learn away’ (in the community or work-place).
8. Support “Action Learning” (after O’Donoghue; UNEP, 2004 & SADC-REEP, 2012 pg. 24): Rich dialogue opportunities (discussion by, with and amongst participants), practical field-work experiences, reporting on experiences and sharing ideas as well as ‘action taking’ related to the learning. The appropriate interlinking of such processes will strengthen meaningful learning.
9. Encourage the sharing of the “tools of science” or “learning tools” so that participants become confident in using tools to find out about the world around them and use the tools to explore and solve problems. An example of this are simple water quality monitoring kits (e.g. miniSASS, the Clarity Tube and Velocity Plank) that can provide a meaningful research experience that enables people to investigate and deal with a water quality issue.
10. We live in a world where discontinuities are all around us – the degradation of our life support systems, such as fresh water, is one example. Often these are only evident to a select few who are part of the scientific or environmental movements. Learning processes that enable such discontinuities to surface and become apparent to a wider circle of participants, through well designed Human Capacity Development (HCD) programmes, are proving highly effective. Such dawning realisations, from within the participants frame of reference, are more effective than externally derived and communicated messages.
The principles reflected above are useful in that they help inform meaningful capacity building and can be applied as an evaluative lens when planning or evaluating efforts to enable more resilient societies and thus the efforts of the project to date.

97
CHAPTER SEVEN: BUILDING A COMMUNITY OF PRACTISE
There has been major growth in the CS field in the past few years, and as the field grows there is often a need to facilitate the development of a Community of Practice (CoP) to encourage the uptake of CS tools that are available to society. WESSA and GroundTruth have worked extensively to host workshops and training days, not only to promote the CS tools being developed by this project, but to train and build capacity to use and sustainably adopt the use of the tools in a more mainstream manner. There have been numerous events which have promoted this work, with details contained in the information dissemination chapter of this report. Events have ranged from dedicated training days for the various tools (both with national and international delegates), Mandela Day celebrations, to working with and training delegates from various local municipalities and working with CoGTA to develop “leadership seminars” for local councillors and iziNduna. Collectively these have combined with extending the CoP around CS and water resource management.
The CoP is built through a number of varied mechanisms, each mechanism having its own niche within the CoP. This is due to the wide range of users engaging with CS, and their preference to engage in different manners. Some users prefer to engage on social media, others prefer newsletters, while others prefer personal correspondence. The miniSASS website remains one of the key engagement mechanisms within the CS CoP, and to this end, the maintenance of accurate data is a vital component of the website. Publications are a mechanism for engaging with potential users who have not previously engaged with CS, as well as a vehicle to publicise the work citizen scientists are doing.
The National Community of Practice Workshop, hosted in Umbogintwini Community Centre was a national workshop to disseminate information on the latest developments and tools from within the project, and showcase some of these tools not yet presented at any other forums. The workshop also aimed at further developing the CS Community of Practice, through attracting a wide range of attendees to the workshop. The workshop provided further opportunities for further feedback on the uptake and use of the tools developed by and during this project
In summary, numerous presentations have been made on the CS tools and toolkit and activities associated with this project at appropriate conferences, symposia, seminar series, dissemination workshops, as well as more informal settings such as talks to and physical activities associated with Mandela Day Celebrations, Conservancies, “Friends of….”, etc. Additionally, there have been both formal and informal training sessions provided at many venues on the various tools. At most of these opportunities many of the tools were highlighted, both physically, as well as in case studies where these tools and interventions have been successfully applied.
These occurred both in South Africa but also in several overseas countries and within the SADC region. In the hosting of at least four of these training workshops to demonstrate water resource CS tools to various organisations, there has been a strong focus on organisations that have not previously engaged with water resource CS tools. Training also included how tools are used to collect data with some emphasis on data quality, with information from these workshops used to further improve tools.
Detailed reporting on the full list of activities in support of the CoP is presented in the Information Dissemination chapter of this report, as well as an appendix to this report. However, a number of key highlights to this aspect of the work are summarised below, to cover the global, regional and local reach of some of this CoP work and network.

98
Global Impact
1. World-wide: The Global Participatory Water Management Network (GPWMN) invited Dr Jim Taylor to present aspects of this WRC CS tools project at their general assembly in Foz de Iguazu in Brazil in 2016. A miniSASS study was conducted in Brazil at Foz de Iguazu and one can see the blue (unmodified condition) crab icon close to the main falls on the Brazil map (www.minisass.org). In a follow-up workshop the GPWMN held their 2017 global general assembly in South Africa (the first time the GPWMN has met in Africa). The conference took place from the 13-16 September 2017 in Durban. The title of the conference was “Sharing and Caring for Water.” The principal objective was to explore pathways of participative governance relating to water in and for Africa and the way this knowledge and experience can be shared with the world, particularly countries that share the African life experience, economically and developmentally. In this way, this conference plans to bring the voice of Africa to the World Water Forum, in Brazil in 2018. At the request of the CEO of the WRC, Dhesigen Naidoo, the WRC was represented at the conference by Dr Valerie Naidoo who presented a paper on the work of the WRC. This CS tools project was also represented at this conference, in two papers, one by Professor Rob O’Donoghue and one by Ayanda Lipheyana (Taylor, 2016).
2. UNESCO Global Action Programme (France) UNESCO is responsible for implementing the Sustainable Development Goals in all nations of the world. To achieve this, they have developed the Global Action Programme (GAP) which is an Education for Sustainable Development approach to achieving the Goals. Jim Taylor, a member of this project research team, is the Co-Chair of the GAP Partner Network 2 which has the objective of “Transforming Learning and Teaching Environments”. The GAP forum meets annually, usually in Paris, and at each meeting an update on CS tools is presented (Taylor, 2014).
3. Canada: In March 2017 Jim Taylor was invited to share the miniSASS biomonitoring approach at a series of meetings in Canada. These meetings included the full UNESCO Global Action Programme which met in Ottawa as well as further, field-centered, workshops in Thunder Bay on the northern banks of Lake Superior. Here a successful miniSASS study was conducted at minus 20 degrees centigrade and a crab ikon appears accordingly on the Google Earth enabled miniSASS platform. This work is now being pursued by the Canadian Biomonitoring Group as well as Lakehead University.
4. Mexico: CS for Sustainability: Water Monitoring & miniSASS at the University of Albert Einstein: Guadalupe Catchment – Mexico City by Jim Taylor (Dr) WESSA & Expert-Net 27
November 2015. This workshop included a practical miniSASS study in the Guadalupe catchment and is a further example of growing global interest in these CS tools developed by this project.
5. Tanzania: Tropical Biology Association, Amani Nature Reserve, Tanzania. In July 2017 Mark Graham taught for a month on the Tropical Biology Association month long intensive training course in the Amani Nature Reserve in Tanzania. The various CS tools developed under this WRC project were showcased and formed part of the training curriculum for 24 international students, 12 from around Africa, and 12 from mainly Europe. Several student groups subsequently chose various CS tools to be used in their research projects that they were required to undertake as part of this training.
6. COWM and UNESCO IHE: Mark Graham presented 2 papers related to this project at the international Citizen Observatories for Water Management conference in Venice, Italy in June 2016. He then also proceeded to present on this work as a guest lecturer to graduate students at UNESCO IHE in Delft, Netherlands. IHE Delft Institute for Water Education is the largest international graduate water education facility in the world.

99
Regional Impact
1. At the invitation of the SADC Water Sector, which is responsible for integrated water management in all 15 SADC member states, our CS tools project was presented at a SADC summit meeting from the 20-25 May 2017 in Johannesburg. This conference, which included all SADC member states, was organised to profile the SADC Water, Energy and Food Nexus as well as the SADC Regional Strategic Action Plan (RSAP IV). The RSAP IV will be the premier regional SADC Water policy from 2016 to 2020. It is encouraging that, as a direct result of our CS tools project participating in the regional SADC water consultations, the RSAP IV has a short, dedicated section, on CS (RSAP IV page 18). It was suggested at the SADC summit that the SADC region is possibly the only region in the world that has a water policy with a specific reference to CS!
2. The most recent development around how water quality management should be integrating many of the legal frameworks already defined for SA (e.g. the NWA, NWRS, CMSs, etc.), is the Water Quality Management Policies and Strategies for South Africa – Integrated Water Quality Management (IWQM) Strategy (DWS, 2017). Strategically this acknowledges the role and highlights a number of key opportunities where CS could and should be translated into strategic actions in support of integrated water quality management. The opportunities are summarised below:
� Governance frameworks for active citizenry � Development of citizen-based monitoring � Expand capacity building initiatives � Online tools for water quality and water quality management information
3. As part of a SADC Climate Change project which was conducted in 6 SADC member states (Namibia, Botswana, South Africa, Lesotho, Swaziland and Zambia) Tembeka Dambuza and Jim Taylor were able to share the CS tools project. This was done as part of the establishment of a ‘Sustainability Commons’ in each country. An overview of this project has been published in the African Wildlife and Environment journal (Taylor, 2017).
4. As the lead activity to celebrate Mandela Day in 2017, and in terms of the projects’ transboundary objective, over 70 school children near the Amani Nature Reserve, a remote part of Tanzania, along with 24 international students were able to undertake a day of fieldwork, training and testing of CS tools, from this project. A summary of this event is provided below.
Local
There have been numerous initiatives which this project has supported and which have strengthened a greater CoP within the field of CS and water resource management. Some of the highlights of these CoP are indicated below.
The development and strengthening of the EnviroChamps models
The Mpophomeni EnviroChamps began with a number of local KZN Midlands NGOs (DUCT https://www.duct.org.za/ and WESSA http://wessa.org.za/, one of the key research partners in this project), supporting a group of unemployed Mpophomeni township community members to monitor and report on surcharging sewer manholes, where raw sewerage was finding its way into the strategically important Midmar Dam! This original group of EnviroChamps, although initially constituted around monitor spilling manholes have grown and been trained in a wide suite of the CS tools that have been developed within this WRC project, and been supported as a growing centre of Community of Practise in this field.

100
This increased capacity has led them to amongst other things: developing street theatre productions around sanitation, undertaking basic leak detection, plumbing repairs, and critically door-to-door surveys within the community to identify environmental issues as well as educating community members about the impacts of these issues. The use of CS tools has been a key component of this education and awareness raising process. The growth and interest in these matters manifested most recently when some of the EnviroChamps manned “stations” during the Mandela Day celebrations (2016) and taught other community members about leaks and basic plumbing repairs that could be done to improve water resources at a local level.
A graphic example of this increased capacity and sense of CoP is well illustrated by the sewer line monitoring by EnviroChamp (Jabulani Dladla). He repeatedly engaged with the Municipal plumbing teams and reported surcharging manholes within his monitoring area, and through his efforts, the Municipality replaced the sewer line in June 2014. There was a significant reduction in water pollution from this area as a result of this intervention. From a community of practise perspective, possibly the most significant outcome of this interaction was the increased levels of trust, mutual recognition and “working together” on common problems which has emerged between the DUCT EnviroChamps teams and Municipal authorities.
This EnviroChamps project has since grown and received additional support from the uMgungundlovu District Municipality, and an expansion to the project and the model via Nedbank GreenTrust and WWF funding, along with major support to the Umbogintwini Area (with the Wise Wayz Water Care (WWWC) teams – via AECI and their Community Education and Development Trust (CEDT) funding and support). This has allowed the EnviroChamps model to be replicated and expanded over a geographically much wider area, with nodes now in several other provinces (Phongola, Ceres, Stellenbosch, Prince Albert (Western Cape), and Umbogontwini (KZN). A key feature of this expansion has been the significant sharing of training, ideas, experiences, approaches and general sense of “being in this thing together”, which is arguably at the core of what it means to have a CoP. As respective groups have grown and matured, they have variously also taken some of the models and approaches to CoP further and enhanced aspects of the work, adapting and modifying to their local and particular conditions. So, for example, the ‘door to door’ educational model being used now by the WWWC teams, have advanced and built on the work initially undertaken by the Mpophomeni EnviroChamps teams.
The most recent flooding and rains in Durban (October 2017) illustrated that the areas serviced by the WWWC teams had significantly less flood damage to infrastructure (due to their clearing of solid waste and aliens from urban drainage lines) compared to areas not serviced by these teams.
River Walks
Having developed many of the initial CS tools, during this project the project team were in a position to support a groundswell in interest and focus around rivers and river health, particularly in the KZN Midlands, and particularly by a range of NGOs who were keen to walk many of these rivers. Having the CS tools available, conducting training on their use and application (as part of the Community of Practise in this space, as well as more formal training courses that formed part of this WRC project), these fledgling river walk efforts have grown in stature and geographic extent, and have had meaningful impacts on many new initiatives and efforts focused on identifying sources of pollution, building a sense of ownership (Adopt-A-River?), community and improving river health in the region. The uMngeni River was the first to be walked, (from source to sea, almost 250 km) and then several others in the region, namely: the Aller, Dargle, Dorpspruit, Lions, Mpofana, Willowfountain. See also https://www.duct.org.za/duct-river-walks.html) for copies of reports from many of these walks. The most recently completed walk was the Karkloof River Walk. A video of this walk is available at:

101
http://www.groundtruth.co.za/community-projects/2017/6/20/karkloof-river-walk and https://endangeredwildlifetrust.wordpress.com/2017/07/12/karkloof-source-to-confluence-river-walk/).
GroundTruth, in conjunction with WWF, recently assisted in implementation, planning and reporting of the Karkloof River walk for the Karkloof Conservancy. All of the CS tools used in this development and engagement with farmers and water users emerged out of this WRC research project.
What has been most evident about this aspect of CoP has been the expanded network of influence that this initiative has had, so that instead of a singular NGO acting alone within this space, there is now a multi-layered and multi-agency team addressing some of these previously intractable water resource problems, from over abstraction, to alien weeds within the riparian zones, to pollution, etc. The various actors in the CoP have strengthened each other and given greater overall agency to the enterprise of starting to manage catchments and water resources in a more holistic manner. Much work still needs to be done, but interestingly central to this work has been a new ability to assess the current health of aquatic ecosystems (with various CS tools) and with this knowledge (and data) more meaningfully engage and “be heard around the table” when these issues are being discussed.
Summary
The WWWC initiative – a variant of the EnviroChamps model (which now supports over 130 individuals within the Umbogintwini area) was only made possible by a CoP which saw WESSA and GroundTruth supporting and training 3 individuals in CS tools and how to measure the health of a local river and who were inspired to paddle the length of the Vaal and Orange River to the mouth and tell the story of the health of this river. Their “adventure” was filmed and made it onto the TV show Carte Blanche, where AECI and their Community Education and Development Trust saw the potential to adopt a similar model of community mobilisation around water resources around some of their key industrial development areas and installations. The strength of these CoP are therefore never directly appreciated, or known, but have an ability to act and support often unseen, or unexpectedly useful work within the space of improved water resource management.
At the outset of this project the aim was the development of a suite of CS tools/interventions and a desire to improve and better understand the social context and models where these tools could be used to improve water resource management in the region. However, it was the unplanned and rich interactions with various individuals and organisations, along with a greater sense of CoP, which made the research work so rewarding and sustained. It is hoped that this work will continue beyond the life of this research project, through the nourishing of and by the current various CoP.

102
CHAPTER EIGHT: IMPACTS AND OUTCOMES OF THIS RESEARCH
This research has had a number of significant impacts and outcomes. Many of these have gone beyond simply addressing the initial aims and deliverables of this research project. Some of these more significant aspects are summarised below, as Global, Regional and Local Impacts. These extend from an ever-widening community of practise within this field, to impacting on and finding their way into significant water resource policy and strategy documentation for the region. This in turn has the ability to influence this field positively and strategically beyond the life of this research effort itself.
Global Impact
World-wide
The Global Participatory Water Management Network (GPWMN) invited Dr Jim Taylor to present citizen science tools from this project at their general assembly in Foz de Iguazu in Brazil in 2016. A miniSASS study was conducted in Brazil at Foz de Iguazu and one can see the blue (unmodified condition) crab icon close to the main falls on the Brazil map (www.minisass.org). In a follow-up workshop the GPWMN held their 2017 global general assembly in South Africa (the first time the GPWMN has met in Africa). The conference took place from the 13-16 September 2017 in Durban. The title of the conference was “Sharing and Caring for Water.” The principal objective was to explore pathways of participative governance relating to water in and for Africa and the way this knowledge and experience can be shared with the world, particularly countries that share the African life experience, economically and developmentally. In this way, this conference plans to bring the voice of Africa to the World Water Forum, in Brazil in 2018. This WRC research project was also represented at this conference, in two papers, one by Professor Rob O’Donoghue and one by Ayanda Lipheyana (Taylor, 2017).
UNESCO Global Action Programme (France)
UNESCO is responsible for implementing the Sustainable Development Goals in all nations of the world. To achieve this, they have developed the Global Action Programme (GAP) which is an Education for Sustainable Development approach to achieving the Goals. Jim Taylor, a member of this project research team, is the Co-Chair of the GAP Partner Network 2 which has the objective of “Transforming Learning and Teaching Environments”. The GAP forum meets annually, usually in Paris, and at each meeting an update on citizen science tools is presented (Taylor, 2014).
Canada
In March 2017 Jim Taylor was invited to share the miniSASS biomonitoring approach at a series of meeting in Canada. These meetings included the full UNESCO Global Action Programme which met in Ottawa as well as further, field-centred, workshops in Thunder Bay on the northern banks of Lake Superior. Here a successful miniSASS study was conducted at minus 20 degrees centigrade and a crab ikon appears accordingly on the Google Earth Plane. This work is now being pursued by the Canadian Biomonitoring Group as well as Lakehead University.

103
Mexico
Citizen Science for Sustainability: Water Monitoring & miniSASS at the University of Albert Einstein: Guadalupe Catchment – Mexico City. Dr Jim Taylor conducted this workshop, in 2015, at the request of the Albert Einstein University which has the mandate to research and conserve the Guadalupe catchment which supplies fresh water to Mexico City – possibly the largest city in the world. A practical miniSASS study was conducted on-site and is a further example of growing global interest in these citizen science tools.
COWM and UNESCO IHE: Mark Graham presented 2 papers related to this project at the international Citizen Observatories for Water Management conference in Venice, Italy in June 2016. He then also proceeded to present on this work as a guest lecturer to graduate students at UNESCO IHE in Delft, Netherlands. IHE Delft Institute for Water Education is the largest international graduate water education facility in the world.
Tanzania: Tropical Biology Association, Amani Nature Reserve, Tanzania.
In July 2017 Dr Mark Graham taught for a month on the Tropical Biology Association month long intensive training course in the Amani Nature Reserve in Tanzania. The various CS tools developed under this WRC project were showcased and formed part of the training curriculum for 24 international students, 12 from around Africa, and 12 from mainly Europe. Several student groups subsequently chose various CS tools to be used in their research projects that they were required to undertake as part of this training. As a Mandela Day celebration, the group was involved in a miniSASS training session led by Dr Graham. The miniSASS results were uploaded onto the miniSASS website and have contributed further international scope to the tool.
Regional Impact
At the invitation of the SADC Water Sector, which is responsible for integrated water management in all 15 SADC member states, citizen science tools from this project were presented at a SADC summit meeting from the 20-25 May 2017 in Johannesburg. This conference, which included all SADC member states, was organised to profile the SADC Water, Energy and Food Nexus as well as the SADC Regional Strategic Action Plan on Integrated Water Resources Development and Management (RSAP Phase IV). The RSAP IV will be the premier regional SADC Water policy from 2016 to 2020. It is encouraging that, as a direct result of our citizen science tools project participating in the regional SADC water consultations, the RSAP IV has a short, dedicated section, on citizen science (RSAP IV page 18 – see extract and text box below). It was suggested at the SADC summit that the SADC region is possibly the only region in the world that has a water policy with a specific reference to citizen science!
Given that South Africa regionally shares several river basins with its neighbours, another key strategic and policy document around future water resource management for South Africa, and hence the region (DWS – Integrated Water Quality Management (IWQM) Strategy document (DWS, 2017)) identified a number of very specific strategic issues, objectives and actions which have a clear alignment to tools and processes developed within this WRC research project, and which this project now ultimately supports and talks to. Namely:
� Governance frameworks for active citizenry
From RSAP IV, page 18. There is a need to promote citizens’ science application on water. The use of citizens to monitor water status is an important contribution to water science. Activities include training of citizens on the monitoring and communicating of river water status and undertaking demonstration projects on the use of citizen’s science on selected river reaches where they can monitor river water status.

104
� Development of citizen-based monitoring � Expand capacity building initiatives � Online tools for water quality and water quality management information
As part of a SADC Climate Change project which was conducted in 6 SADC member states (Namibia, Botswana, South Africa, Lesotho, Swaziland and Zambia) Tembeka Dambuza and Jim Taylor were able to share our citizen science tools project. This was done as part of the establishment of a ‘Sustainability Commons’ in each country. An overview of this project has been published in the African Wildlife and Environment journal (Taylor, 2017) (full references below).
South Africa / local
DUCT/WESSA/WWF EnviroChamps models
The Mpophomeni EnviroChamps began with a number of local KZN Midlands NGOs (DUCT https://www.duct.org.za/ and WESSA http://wessa.org.za/. Commencing with a group of unemployed Mpophomeni township community members who were monitoring and reporting on surcharging sewer manholes this project has grown exponentially. The original group of EnviroChamps, although initially constituted around monitor spilling manholes have grown and been trained in a wide suite of the CS tools that have been developed within this WRC project, and have been supported as a growing Community of Practise in this field. The figure below shows an example of some of the monitoring sites covered by this team.
Figure 57: Map of Mpophomeni showing sewer lines and illegal solid waste disposal sites monitored by EnviroChamps along the main branches of the Mthinzima Stream draining into Midmar Dam (just north of the map).

105
This increased capacity has led the EnviroChamps to, amongst other things, develop street-theatre productions around sanitation, undertaking basic leak detection, plumbing repairs, and critically door-to-door surveys within the community to identify environmental issues as well as educating community members about the impacts of these issues. The use of CS tools has been a key component of this education and awareness raising process. One of the EnviroChamps, Ayanda Lipheyana, of his own volition would take regular weekend river walks with township children and teach them about miniSASS, impacts of litter on aquatic ecosystems, etc. – see figure below. These groups now routinely use citizen science tools to monitor their local river (see http://www.minisass.org/en/).
Figure 58: Images from a river walk group led by Ayanda Lipheyana (dark blue shirt with net) assessing one of the regularly monitored sites on the Mthinzima Stream, above Mpophomeni Township
The growth and interest in these matters manifested most recently when some of the EnviroChamps manned “stations” during the Mandela Day celebrations (2016) and taught other community members about leaks and basic plumbing repairs that could be done to improve water resources at a local level.
The EnviroChamps project in Mpophomeni was one case study where the sharing of, and access to, citizen science tools became a major enabling factor. The EnviroChamps themselves and other role players found the citizen science tools extremely empowering for themselves as well as for the local community (Ward, 2016). This was evident in the data collected by the EnviroChamps on spilling manholes in Mpophomeni. The detailed information that was recorded and shared, including the GPS coordinates, the response times of plumbers and causes of blockages, are an indication of the change in perceptions of their surroundings. Similarly, the miniSASS results obtained by the EnviroChamps enabled them to identify problem areas and pollution sources, and to act on the problems identified.

106
Perhaps the most graphic example of this increased capacity and impact shown by these teams is illustrated in the following figure, which shows the sewer line monitoring by Enviro-Champ (Jabulani Dladla). He repeatedly engaged with the Municipal plumbing teams and reported surcharging manholes within his monitoring area, and through his efforts, the Municipality replaced the sewer line in June 2014. There was a significant reduction in water pollution from this area as a result of this intervention. From a community of practise perspective, possibly the most significant outcome of this interaction was the increased levels of trust, mutual recognition and working together on common problems which has emerged between the DUCT EnviroChamps teams and Municipal authorities.
As a further key intervention explored within this research, the Street-Theatre that the DUCT EnviroChamps have engaged with, along with the door-to-door educational programmes, have begun to sensitize users of these sewer facilities as to what is and is not acceptable to be disposed of down sewers. This is still a challenging area, but it is hoped that this work will eventually gain traction with a more informed community group. The long-term expectation is less blockages, no surcharging manholes, and a reduction in water pollution in the area.
Figure 59: Sewer line monitoring data from Mpophomeni showing the number of days per month sewer lines surcharged (as monitored by EnviroChamp Jabulani Dladla) and results after the sewer line was replaced.
This project has since grown and received additional support from the uMgungundlovu District Municipality. An expansion to the project and to the EnviroChamps concept has occurred via the Nedbank GreenTrust and WWF who are helping extend and fund this work. Support is also being provided to the Umbogontwini Area through the Wise Wayz Water Care (WWWC) teams. This support and funding is via AECI and their Community Education and Development Trust (CEDT). This support has enabled the EnviroChamps model to be replicated and expanded over a geographically much wider area, with nodes now in several other provinces. Sites of development include Phongola, Ceres, Stellenbosch, Prince Albert (Western Cape), and Umbogontwini (KZN). The most recent flooding and
Num
ber o
f day
s su
rcha
rgin
g
10
Sewer Line
Replaced
JD2 JD4 JD6 JD6
Apr-14
JD3 JD6 JD2 JD3 JD4 JD6
May-14 Month
Jun-14/Jan-15

107
rains in Durban (October 2017) illustrated that the areas serviced by the WWWC teams had significantly less flood damage to infrastructure (due to their clearing of solid waste and aliens from urban drainage lines) compared to areas not serviced by these teams.
River Walks
Having developed many of the initial CS tools, during this project, the project team were in a position to support a groundswell in interest and focus around rivers and river health, particularly in the KZN Midlands. This groundswell included a range of NGOs who were keen to walk many of these rivers. Having the CS tools available and conducting training on their use and application, as part of the Community of Practise as well as more formal training courses that formed part of this WRC project, these fledgling river walk efforts have grown in stature and geographic extent. Such is the enthusiasm that they have had meaningful impacts on many new initiatives and efforts focused on identifying sources of pollution, building a sense of ownership (Adopt-A-River?), and improving river health in the region. The uMngeni River was the first to be walked, (from source to sea; a distance of almost 250 km) and then several others in the region, namely: the Aller, Dargle, Dorpspruit, Lions, Mpofana and Willowfountain. The following figures illustrate the health of some of these rivers, both geographically, but also graphically, and how this health changes down the course of the river.
Figure 60: Map of the uMngeni catchment and river, and sites sampled and condition of the river using miniSASS as part of the DUCT river walk.

108
Figure 61: A graph showing the river health data gathered from the uMngeni River walk – as indicated by the miniSASS tool.
See also https://www.duct.org.za/duct-river-walks.html) for copies of reports from many of these walks.
The most recently completed walk was the Karkloof River Walk. A video of this walk is available at: http://www.groundtruth.co.za/community-projects/2017/6/20/karkloof-river-walk and https://endangeredwildlifetrust.wordpress.com/2017/07/12/karkloof-source-to-confluence-river-walk/).
GroundTruth, in conjunction with WWF, assisted in implementation, planning and reporting of the Karkloof River walk for the Karkloof Conservancy. Each site involved the use of the water clarity tube, the riparian health audit and miniSASS – tools developed within this WRC research project for the assessment of the health of rivers and associated systems. Aquatic and riparian sampling was conducted, and the appropriate selection of the various tools was informed by the available habitat on site, the flow conditions at the time of sampling and other biophysical limitations. Data was also captured in the field on the recently developed CS App tools. An example map of the application of these tools in the generation of a summary of the health of the Karkloof River is presented below, with each ‘reach-of-river’ colour coded according to its health status – as measured by CS tools.

109
Figure 62: Map showing river health data recorded using citizen science tools and the GeoODK App along the Karkloof River.
One of the other key aspects of the Karkloof project was focused around flow monitoring, specifically to inform the management and distribution of irrigation abstraction volumes on a weekly basis during key low flow periods of the year when it is critical that the limited water available is equitably distributed down the catchment to all users/irrigators. This project included an active stakeholder component with the primary objective to engage with farmers in the area together with the Karkloof Irrigation Board and the Karkloof Conservancy. Amongst other variables, water clarity and velocity were monitored weekly at six sites whilst an additional 5 sites were monitored on an ad-hoc basis to investigate water quality spikes that were observed in the routine sampling. miniSASS was conducted monthly at 3 suitable sites throughout the year long project. The E. coli swabs were used weekly for assessing the long term E. coli levels of the catchment. The data collected has been the base of an extensive database which will be used in the irrigation management of the Karkloof catchment area going forward. All of the CS tools used in this development and engagement with farmers and water users emerged out of this WRC research project.
The strengthening of Communities of Practise
There has been major growth in the Citizen Science field in the past few years, and as the field grows there is often a need to facilitate the development of a Community of Practice (CoP) to encourage the uptake of citizen science tools that are available to society. WESSA and GroundTruth have worked extensively to not only promote the citizen science tools being developed by this project, but to train

110
and build capacity to use and sustainably adopt the use of the tools in a more mainstream manner. There have been numerous events which have promoted this work, ranging from dedicated training days for the various tools (both with national and international delegates), Mandela Day celebrations, to working with and training delegates from various local municipalities and working with CoGTA to develop “leadership seminars” for local councillors and iziNduna. Collectively these have combined to extend the CoP around CS and water resource management.
Numerous presentations have been made on the Citizen Science tools and toolkit and activities associated with this project at appropriate conferences, symposia, seminar series, dissemination workshops, as well as more informal settings such as talks to and physical activities associated with Mandela Day Celebrations, Conservancies, “Friends of….”, etc. Additionally, there have been both formal and informal training sessions provided at many venues on the various tools. At most of these opportunities the tools were highlighted, both physically, as well as in case studies where these tools and interventions have been successfully applied.
Detailed reporting on the full list of activities in support of the CoP is presented in this report. However, a number of key highlights to this aspect of the work are summarised below, to cover the global, regional and local reach of some of this CoP work and network.
The WWWC initiative is a variant of the EnviroChamps model, which now supports over 130 individuals within the Umbogontwini area, was made possible by a wider CoP. Prior to the development of this project WESSA and GroundTruth agreed to support and train 3 individuals in CS tools and methods to measure the health of rivers. These three individuals were inspired to paddle the length of the Vaal and Orange River and continue all the way to the mouth. While on the trip they researched and documented the health of the river. Their “adventure” was filmed and broadcast as a documentary on the TV show, Carte Blanche. This TV documentary was seen by AECI and their Community Education and Development Trust who saw the potential to adopt a similar model of community mobilisation around water resources near their key industrial development areas and installations. The result was the extremely successful WWWC project! The strength of these CoP are therefore never directly appreciated, or fully understood, they have, however, an ability to act and support often unseen, or unexpectedly useful work, within the space of improved water resource management.
At the outset of this project the aim was the development of a suite of CS tools/interventions and a desire to improve and better understand the social context and models where these tools could be used to improve water resource management in the region. The unplanned and rich interactions with various individuals and organisations, along with a greater sense of a developing CoP, has, however, made the research work extremely rewarding and sustained. There is no doubt that this work will continue beyond the life of this research project and be nourished through the many complementary Communities of Practice that have developed.
Summary
At the outset of this project the aim was the development of a suite of CS tools/interventions and a desire to improve and better understand the social context and models where these tools could be used to improve water resource management in the region. However, it was the unplanned and rich interactions with various individuals and organisations which made the research work so rewarding. A number of significant impacts and outcomes of this project went beyond the simple tick box approach to undertaking typical research. These were significant at a global, regional and local level.

111
CHAPTER NINE: INFORMATION DISSEMINATION
The key objective of this research project was to develop a suite of tools for use in community-based water resource monitoring. This process included the dissemination of the developed toolkit to promote CS and school level education & awareness of catchment and river health. Part of the aim of this dissemination was to initiate growth of trans-boundary CS, which highlights water resource health in South Africa, neighbouring countries and beyond.
The objective of this chapter, is to provide an evaluation report covering workshops that were held where the developed tools were presented and discussed with research partners and partners from neighbouring countries.
A number of dissemination workshops were facilitated through a variety of channels. The table below gives a summary of all the workshops, indicating the month and year they took place, the name of the workshop, the person/organisation(s) that facilitated the workshop and what the focus of the workshop was.
The dissemination workshops have involved organisations and groups of people in a variety of interest areas including National, Provincial and Local Government, Conservancies, Schools, Universities, NGO groups, diplomatic groups (including cross-boundary entities) thereby achieving the goal to promote CS, education and awareness.
Table 14: a summary of all the dissemination opportunities that were recorded.
Type of dissemination event Number of events Conferences 41 Workshops 102 Radio Interviews 6 Study Support Group Meetings 9 TV Interviews 2 Training 11 Publications 13 TOTAL 171

112
Conferences
A total of 41 presentations were given at either symposia or formal conferences. The table below gives a summary of all the presentations given and indicates if the presentation was given at a symposium, a national conference or an international conference. The differentiation between national and international conferences is made based on the location of the hosting organisation, and if the conference is hosted in various countries each year (e.g. the Environmental Education Association of Southern Africa conference is hosted in a different country each year).
Table 15: Conference presentations summary table
Name of conference
Country
Name of presentation
Presented by
Date
eThekwini Municipality Biodiversity Forum
South Africa
Using CS to Evaluate the Ecological Integrity of South African Rivers: DUCT case study
Mark Graham
November 2013
WRC Review Meeting (inaugural)
South Africa
CS Catchment Toolkit
Mark Graham
April 2014
IASWS 2014 Conference
South Africa
Using CS to Evaluate the Ecological Integrity of South African Rivers: Various Case Studies and Current Research Initiatives
Mark Graham
July 2014
Environmental Education Association of Southern Africa Annual Conference
Namibia
Reflections on the current and emerging ESD issues and practices informing the post Decade of Education for Sustainable Development framework programme.
Jim Taylor
September 2014
River Health Programme Symposium
South Africa
Using CS & The Ecological Integrity of South African Rivers: Various case studies and current research initiatives
Mark Graham
November 2014
Symposium for Contemporary Conservation Practice
South Africa
Ecological Infrastructure – the value of healthy riparian zones for freshwater ecosystem conservation – theory, practise and application
Mark Graham
November 2014
WRC Water Currents Policy Series
South Africa miniSASS CS River
Health Monitoring
Mark Graham November
2014

113
SLUSH
Finland
Use of CS tools for potential investment opportunities into Africa
Mark Graham November
2014
Ecosystem Research & Innovation Symposium
South Africa
River Health Monitoring & CS UKZN: Case studies and current research initiatives
Mark Graham
February 2015
7th World Water Forum South Korea Citizens' Monitoring of
River Health Simon Bruton March 2015
Forum of Forums Workshop South Africa DUCT/GroundTruth/WRC
CS Research Project Mark Graham April 2015
WRC Review Meeting (Second)
South Africa
CS Catchment Toolkit
Mark Graham
May 2015
Youth Water Summit South Africa miniSASS and CS Jim Taylor June 2015
SASAqS 2015
South Africa
CS key note: South African CS in a water resource context
Mark Graham
July 2015
SASAqS 2015
South Africa
CS monitoring of river health: Latest developments to mainstream miniSASS and allow a broader spectrum of society to contribute to the growing national picture of river health
Mark Graham
July 2015
SASAqS 2015
South Africa
The water clarity tube: Development and application in CS water resource monitoring
Mahomed Desai
July 2015
Botswana Environmental Education Conference
Botswana
CS tools
Jim Taylor
August 2015
SA National Education on Sustainable Development Consultation
South Africa
SADC, EEASA and Social Change
Jim Taylor
August 2015
SADC Regional ESD Consultation
Zimbabwe Environmental Education
and Social Change
Jim Taylor September
2015
Forum for Forums: WAT-INDABA
South Africa
A forum of forums: Responding to proposals to revitalise catchment management forums
Mark Graham
October 2015
Wetland Indaba
South Africa
Can CS play a role in wetland assessment and management?
Kirsten Mahood
October 2015

114
Wetland Indaba
South Africa
A method for assessing wetland ecological condition based on land- cover type
Donovan Kotze
October 2015
UNESCO Workshop on Developing an Education Support Strategy for Southern Africa
South Africa
How we ensure that we deliver on the SDGs as a region
Jim Taylor & Moussa-Elkadhum
October 2015
Education for Sustainable Development Expert-Net Conference: Mexico
Mexico
CS for Sustainability: Water Monitoring & miniSASS
Jim Taylor
November 2015
IWA Winery Conference Stellenbosch
South Africa
The development, use and application of CS tools to monitor wastewater and effluent within the wine industry – from farm to factory
Mark Graham
November 2015
Stepping Up to Sustainability: A SADEC Partnership
Botswana The Sustainable Development Goals: CS for Sustainability
Jim Taylor
February 2016
WISA
South Africa
CS: Innovative tools for water resource monitoring and evaluation
Ntswaki Ditlhale
April 2016
Water Institute of Southern Africa Biannual Conference
South Africa
Paper: Mainstreaming miniSASS into a scalable CS tool to improve community involvement in water resource management in southern Africa and the world!
Mark Graham
May 2016
Water Institute of Southern Africa Biannual Conference
South Africa Poster: CS: innovative tools for water resource monitoring & evaluation
Ntswaki Ditlhale
May 2016
UNESCO IHE
South Africa
Development of CS tools in Southern Africa and their local application to water resource management
Mark Graham
June 2016
COWM Conference
Italy
Close and local water monitoring: CS tools to evaluate and monitor river health to support management processes
Mark Graham
June 2016

115
COWM Conference
Italy
Amazing Results When a Water Sector Corporate Partners with Local Communities to Care for Local Water Resources!
Mark Graham on behalf of Molebatši Letswalo
June 2016
Monash South Africa: Water Research Node Seminar
South Africa Drought and Water Risk: Action Learning & Citizen Science Tools
Jim Taylor
June 2016
International Eco-Schools Conference
South Africa
Eco-schools, the SDGs, CS and sustainable lifestyle choices
Jim Taylor October
2016
Mondi SCR
South Africa
Corporate social & Environmental responsibility
Ntswaki Ditlhale
November 2016
Education as a driver for the Sustainable Development Goals
India
CS for Sustainability: Water Monitoring & miniSASS
Jim Taylor
Fountain Hill Estate
South Africa
Upper uMngeni Integrated Catchment Management Plan: Investigation of WQ drivers and trends, identification of impacting land use activities and management and monitoring requirements
Mark Graham
October 2017
Fountain Hill Estate South Africa Capacity for Catchments Mark Graham
October 2017
WRC Symposium
South Africa
CS: The next wave in water resource management
Ntswaki Dithlale
September 2017
Global Participatory Water Management Network
South Africa
Caring and Sharing for Water: A Consultation Conference to develop the Voice of Africa report for the World Water forum in Brazil in 2018
Jim Taylor, Prof Rob O'Donoghue and Ayanda Lipheyana
13-16 September Durban
In summary, presentations were given at a variety of International Conferences, a number of National Conferences and Symposia. Furthermore, numerous presentations were made at various Water Research Commission events.

116
Workshops
A number of dissemination workshops were facilitated through a variety of channels. The table below gives a summary of all the workshops, indicating the year they took place, the name of the workshop and who the initiating organisation/person was. For full table and further detail please refer to the appendices. The dissemination workshops have involved organisations and groups of people in a variety of interest areas including National, Provincial and Local Government, Conservancies, Schools, Universities, NGO groups, diplomatic groups (including cross-boundary entities) thereby achieving the goal to promote CS, education and awareness.
Table 16: Workshop summary table
Year Title of event Organisation/s or person
2013 Palmiet River Watch Introduction to
miniSASS
Gary de Winnaar and Anelile Gibixego (GroundTruth); residents along the Palmiet River
2013 Pelham miniSASS Day GroundTruth and Pelham Grade 7 pupils
2013
Palmiet River Watch miniSASS Day
Anelile Gibixego and Mahommed Desai (GroundTruth); residents along the Palmiet River
2013 EnviroChamps Dissemination
Workshop DUCT / WESSA / EnviroChamps from PMB (Ashdown, Sobantu and Imbali)
2014 LHDA Ph II: Specialist feedback: Macroinvertebrates
GroundTruth
2014
Save Midmar: Water quality drivers and trends within tributaries feeding into Midmar Dam
Mark Graham
2014
International Dissemination Workshop on Education for Sustainable Development
Jim Taylor
2014 Greyton House Village School
River Day
Teachers from Greyton House Village School
2014
National Water Week – launch of the Adopt-a-River Campaign
This event involved the Department of Water Affairs, Water Research Commission, GroundTruth, Department of Science and Technology and WESSA’s Eco-schools.
2014 International Day of Action for
Rivers: miniSASS training The Alexandra High School EnviroClub attended the miniSASS training and practical.
2014 Groen Sebenza Provincial River
Health Day Groen Sebenza pioneers from 7 different organisations; WESSA; GroundTruth
2014
Aquatic Ecology Course
Included a group of people from “Environmental Rural Solutions” and municipal officials
2014 KZN Water Week DWA, WESSA

117
2014
miniSASS Meeting/Workshop
Bonani Madikizela (WRC), Mark Graham (GroundTruth), Derrick Kotze, Simon Bruton (GroundTruth), Shaan Nienaber (Dept. Sc. & Tech.)
2014 How to write a research proposal? Mr Mike Ward (WESSA)
2014
Healthy Rivers-Healthy people: CS for sustainable water management in a climate stressed society
Sponsored by the British High Commission and involving most of the project research team
2014
Centre for Environmental Rights (CER) Dissemination Workshop in Potchefstroom and the North West Province
Residents from Sannieshof and surrounds (North West Province); Dissemination Workshop programme facilitated by the Centre for Environmental Rights (CER), Lawyers for Human Rights (LHR) and with support from the Konrad-Adenauer-Stiftung Foundation. Mark Graham (GroundTruth) provided information and training on how to monitor the health of the Harts River.
2014 Water Research Commission Youth
Summit
Organised by WRC and facilitated by GroundTruth; attendees included students and delegates.
2014
Governance of water resources – an overview of Ostrom’s Social-Ecological Systems (SES) concept.
Mr Duncan Hay (UKZN)
2014
Introduction to the aims and objectives of the WRC project and how the research topics of the students might align with these.
Mrs Liz Taylor (DUCT)
2014 WESSA EcoSchools mini- conference GroundTruth
2014
Using CS to Evaluate the Ecological Integrity of South African Rivers: Various case studies and current research initiatives
Mark Graham
2014-Jul-11 An introduction and overview of Social Learning theory (Wals). Jim Taylor (WESSA)
2014 DUCT/Green Trust GIS Project for
the Umgeni-Msunduzi Catchment
GroundTruth and DUCT
2014
Student Learning Session: “How to find useful and relevant references?”
Prof Mathieu Rouget (UKZN)
2014
SADC CS Network Training Symposium
Facilitated and hosted by WESSA and GroundTruth. Supported by the Department of Water and Sanitation (DWS). Sponsored by the British High Commission (BHC).
2014
Youth Water Dissemination Workshop – Mpophomeni Sanitation Education Project (MSEP)
Louine Boothway facilitated the Dissemination Workshop under the MSEP project.

118
2014 Ecological Infrastructure
Dissemination Workshop
Traditional Leaders from the uMgungundlovu district municipality (Group 2); held at Amanyavu
2014 Ecological Infrastructure
Dissemination Workshop Traditional Leaders from the uMgungundlovu district municipality (Group 1); held at Mafunze
2014 Centre for Environmental Rights
(CER) Dissemination Workshop
CER staff; GroundTruth
2014
Cata Village Community Dissemination Workshop – miniSASS training and stream ecology Dissemination Workshop
Cata Cultural Village; Mark Graham (GroundTruth) and Jim Taylor (WESSA)
2014 SASS5 Training: CS Tools Mark Graham
2014
Cata Village Community workshop: miniSASS training & stream ecology Workshop
Mark Graham
2014 Introduction to Stream Ecology Mark Graham
2014
River Health Monitoring (miniSASS) & CS Workshop North West Province: case studies and current research initiatives
Mark Graham
2014 New Generations Plantations International foresters and members of NGOs (e.g. WWF); GroundTruth
2014 Workshop Representatives from different countries across the globe
2014 Umzimvubu Catchment Partnership Programme Forum T Dambuza
2014 CWRR Workshop: What's Your Purpose? GroundTruth
2014 Eco Rangers miniSASS Workshop T Dambuza/N Tsheyi/P Cingo 2014 CS Tools Mark Graham 2014 Grahamstown Mirroring Workshop DUCT 2015 WRC Dialogue Workshop DUCT
2015-Jan- 16
Social learning theory with Prof Arjen Wals – this was an informal CS discussion.
Jim Taylor (WESSA) and Prof Arjen Wals (Wageningen University, Holland)
2015 TriWaters Tour Adventure Kayakers (Franz Fuls; Brett Merchant
2015 Umsunduzi Officials T Dambuza/L Betha/N Mtshali/D Radebe 2015 Women in Water Workshop T Dambuza/L Betha/N Mtshali/D Radebe
2015
Ecological Infrastructure Dissemination Workshop
Hosted by WESSA, with training provided by GroundTruth (Mark Graham ) and involving most of the project research team; training was attended by local Msunduzi Municipality officials.
2015 Capacity for Catchments
“Leadership Seminars”
Numerous groups including traditional leaders, SALGA, CoGTA, Local Government Leadership and Councillors

119
2015 How to conduct a presentation? Prof Mathieu Rouget (UKZN) and Kholosa Magudu (DUCT)
2015 FET Water T Dambuza/L Betha/D Radebe 2015 Government Officials Workshop T Dambuza/L Betha/N Mtshali/D Radebe
2015
miniSASS demonstration
Simon Bruton representing GroundTruth, WESSA, the Water Research Commission and the South African Departments of Water and Sanitation, and Science and Technology
2015
Mpophomeni Sanitation Education Project (MSEP)-tools and interventions Dissemination Workshop
WESSA, DUCT, various EnviroClubs and GroundTruth. Ms Liz Taylor and Jim Taylor facilitated the Dissemination Workshop.
2015
International Day of Action for Rivers: miniSASS training
School group Enviroclubs attended the training. Schools represented included Epworth High School for Girls, Girls High School, Alexander High and Henryville Primary; including students from UKZN; and members from DUCT.
2015
miniSASS training
Toti Conservancy (Amanzimtoti); attendees included local residents; facilitated by Mahomed Desai (GroundTruth).
2015 ORASECOM miniSASS training Juan Tedder facilitated the training (GroundTruth)
2015 7th World Water Forum Simon Bruton (GroundTruth)
2015 Ecological Infrastructure Dissemination Workshop Planners and municipal officials
2015 Ecological Infrastructure Dissemination Workshop Traditional leaders (eThekwini municipality)
2015
miniSASS and WRC CS Tools Research Project Presentation
Simon Bruton representing GroundTruth, WESSA, the Water Research Commission and the South African Departments of Water and Sanitation, and Science and Technology
2015 Leadership Seminar T Dambuza/L Betha/N Mtshali/D Radebe
2015 SASS5 and miniSASS training in Grahamstown
DWS, DEARD, PVT Consultant, WRC, Rhodes University
2015 CS Catchment Toolkit Mark Graham 2015 ORASECOM Joint basin survey 2 ORASECOM 2015 ORASECOM Joint basin survey 2 ORASECOM 2015 UKZN Durban – CS Pa Jim Taylor, UKZN
2015
Copesville Speech to community members with the Deputy Minister of Environment Affairs, Barbra Thompson
WESSA, Jim Taylor
2015
CS Monitoring of River Health: Latest developments to mainstream miniSASS
Mark Graham
2015 TWLP Training N Ndebele/D Radebe
2015 miniSASS training for sugarcane small growers WWF, 4 x small growers associations
2015 Youth Water Summit Jim Taylor
2015 SADC RSAP IV Development Process Jim Taylor

120
2015 National Conservancies AGM Jim Taylor, Kirsten Mahood, Ntswaki Ditlhale
2015 SADC RSAP IV Development Process Jim Taylor
2015
Ecological Infrastructure/Catchment Partnership Learning Exchange
T Dambuza/L Betha/D Radebe
2015 Swedish Ministerial Field-Trip Jim Taylor 2015 RMB Tshikululu Funding and CS Jim Taylor, Mike Ward
2015 South African CS in a Water Resource Context Mark Graham
2015 Leadership Seminar T Dambuza/L Betha/D Radebe
2015 NGO Introduction to Aquatic Ecology Women in Leadership and Training
2015
WWF Karkloof Irrigation Board Workshop: River flow demonstration day
GroundTruth
2015
Adopt Moreletaspruit Workshop: Demonstration of miniSASS and other CS tools
GroundTruth
2015 CS Workshop GroundTruth 2016
International CS Workshop: The next wave in water resource assessment and monitoring
GroundTruth
2016 Karkloof Canopy Tours Workshop: miniSASS training day GroundTruth
2016
Mondi/GIZ Youth Leaders’ Workshop: Environmental Awareness & Safety in Plantations by GroundTruth and Mondi
N. Ditlhale & GroundTruth Interns
2016 CS tools learning workshop by
WESSA and GroundTruth
T. Dambuza, N. Ditlhale
2016
WESSA Workshop: Feedback and Dissemination of CS tools for Teaching and Learning
WESSA and GroundTruth
2016 EnviroChamps Training Day
2016
Introduction to Aquatic Ecology by GroundTruth, Acacia Operation Services, AECI
N. Ditlhale, K. Mahood, A. Lipheyana, J. Tedder
2016 Wetland Workshop: CS – Wetland tool workshop
2016 River Health Day at Etete Primary School by GroundTruth, Avon N. Ditlhale
2016
Water Research Commission and friends clean up Moreletaspruit in Pretoria by Water Research Commission, GroundTruth and Friends of Moreletaspruit
N. Ditlhale, B. Madikizela

121
2016
Global Participatory Water Management Network Global Participatory Water Management Network
J Taylor
2016
Mandela Day with River Care Teams on Townbush River, Pietermaritzburg by GroundTruth, DUCT, Cascades Mall, WESSA, WWF-SA
K. Mahood, L. Taylor & A. Lipheyana
2016 Mandela Day Workshop: Cascades
2016
Biodiversity Stewardship KZN Learning Exchange WWF-SA in collaboration with Emvelo KwaZulu- Natal Wildlife
L. Betha, T. Dambuza
2016 Wetlands CS Tool Testing Workshop, GroundTruth, EDTEA N. Dumakude
2016 SAEON Workshop: CS engagement
2016
North Darfur Government Exchange Programme, DUCT, WESSA
L. Taylor
2016
miniSASS Poster Session, Environmental Education Association of Southern Africa (EEASA)
T Dambuza, J Taylor
2016
CS in the SADC region: Cutting edge changes in social learning for wise water management, Environmental Education Association of Southern Africa (EEASA)
J Taylor
2016
eThekwini North WWTW Introduction to CS Tools, GroundTruth, WESSA
J. Taylor, N. Ditlhale
2016
WRC Workshop to discuss the strengthening of CS in Southern Africa
2016
Indian Ocean / WESSA workshop on Education for Sustainable Development GroundTruth, WESSA
A. Liphenyana, M. Levi
2017
International CS Workshop: CS in action – water resource assessment and monitoring
GroundTruth
2017 CoP Workshop WESSA / GroundTruth

122
Ongoing
River Health Monitoring (miniSASS) & CS UKZN Hydrology Honours Students: Case studies and current research initiatives
GroundTruth
Baynespruit River rehabilitation project, involving local schools for miniSASS monitoring
Msunduzi Municipality, the uMngeni Ecological Infrastructure Partnership (UIEP) and local schools
2013
Ecological Infrastructure: An innovative approach to water resource management in the Umgeni catchment, South Africa
Graham Jewitt on behalf of the Umgeni Ecological Infrastructure Partnership

123
Publications
The table below, gives an indication of the publications that have been produced throughout this project.
Table 17: Publications table
Author Year Title Publication Chapman, C.
2016
Citizen Scientists' guide to assessing the health of wetland and rivers
SA Forestry Magazine
Dambuza, T. and Taylor, J.
2015
African Citizens Monitor River Health: the Stream Assessment Scoring System.
USA National Water Monitoring News acwi.gov/monitoring Sprint 2015
Department of Environmental Affairs and Development Planning
2016
Caring for the Environment starts with the Youth: 22-23 September 2016
Green Ambassador
Dzerefos, C. 2016 Local rivers assessed Rustenburg Herald Edgcumbe, W. 2017 Precious Drops. Khuluma Galliers, C., De Lange, J., Qulu, A. and Dukhi, A.
2015 The Greater Umngeni Biosphere Initiative The Greater Umngeni Biosphere
Initiative
Graham, M. Taylor, J. Ross-Gillespie, V. Ditlhale, N. & Mahood, K.
2016
A Revised Adopt-A-River Programme: Stakeholder input on the Institutional and Financial Frameworks with a Focus on an Implementation Strategy
WRC Report no. KV354/16
Jonsson, A. and Klasander, K
2014
Mpophomeni EnviroChamps: A qualitative study about an Environmental Champions project’s attempt to manage water issues in a South African township
An evaluation study. University of Jonkoping, Sweden.
Kolbe, A.C.
2014
CS & water quality in the Umgeni Catchment area, KwaZulu-Natal, South Africa.
Unpublished Masters Thesis, Queens University, Ontario.
LJ Bannatyne, KM Rowntree, BW van der Waal and N Nyamela
2017
Design and implementation of a citizen technician-based suspended sediment monitoring network: Lessons from the Tsitsa River catchment, South Africa
1Geography Department, Rhodes University, PO Box 94, Grahamstown 6140, South Africa
Lushozi, N. 2016 Students participate in miniSASS Water Week Challenge Hadeda Vol. 8
Madiba, M
In press
Evaluation of the enablers and constraints of the uptake and use of the CS tools for the improvement of transboundary catchment/water resources management: The case study of
Interim draft report towards a PhD study. Rhodes University, Grahamstown.

124
South Africa, the Umngeni municipality and Emfuleni municipality.
On-line writer 2016 Rivers for Life #3 Awesome South Africans website Ringwood, F 2016 Encouraging CS Water & Sanitation
SADC 2016 Regional Strategic Action Plan (RSAP IV) 2016-2021.
SADC, Gaborone
Taylor, J.
2014
Shaping the GAP: Ideas for the UNESCO Post-2014 ESD Agenda.
SAGE Publications. Journal of Education for Sustainable Development (Los Angeles, London, New Delhi, Singapore and Washington DC) www.sagepublications.com Vol 8(2): 1-9 10.1177/0973408214548369
Taylor, J.
2016
miniSASS study at Foz du Iguassu – 29th July 2016: A short report by Jim Taylor (WESSA South Africa)
Unpublished report to the Global Participatory Water Network, Foz du Iguassu, Brazil.
Taylor, J.
2017
Sustainability commons and other innovations in southern Africa.
In African Wildlife & Environment, Vol: 65; pp 50-55. WESSA, Bryanston.
Taylor, J. and Dambuza, T.
2017
AWE # 66 – CONSERVATION Green Jobs for Blue Rivers: Working together in support of Ecological Infrastructure
In African Wildlife & Environment, Vol: 66. WESSA, Bryanston.
Taylor, J. and Taylor, E.
2016
EnviroChamps: Community mobilization, education and relationship building.
Resilience by Design: A selection of case studies
Taylor, J. and Taylor, E.
2016
EnviroChamps: Community mobilization, education and relationship building. In Resilience by Design: A selection of case studies.
International Water security Network and Monash University, Pretoria.
Taylor, J. and Venter, V.
2017
Towards a Sustainable Future: Action Learning and Change Practices. In African Wildlife & Environment,
Vol: 64; pp 37-40. WESSA, Bryanston.
Taylor, J., O’Donoghue, R and Venter, V.
In press
How are learning and training environments transforming with Education for Sustainable Development?
Education on the Move, UNESCO, Paris.
Ward, M. 2016 Review of the EnviroChamps in Mpophomeni. Review of the EnviroChamps
Water Research Commission 2016 Press Release Infrastructure news
WESSA 2016 A celebration of 90 years of people caring for the earth WESSA Website
WESSA 2016 Rivers for Life Swimmer to take on the Orange River Press release on WESSA website

125
WESSA 2016 Stepping Up to the Sustainable Development Goals.
Stepping Up to the Sustainable Development Goals
Wild, S. 2016 Citizens called on to monitor dams and Rivers.
MidGreen, a publication of the Midrand Environmental Forum
Wild, S. 2016 Take me to the River, drop me in the Water Mail & Guardian
In addition to the publications mentioned in the table above, GroundTruth puts together a miniSASS newsletter periodically that is distributed to all registered miniSASS users and other interested parties, this newsletter reaches stakeholders on a national and international level
Data archiving
All final tools, manuals and lesson plans will be freely available for download from the Capacity for Catchments website. All final reports will be available through the WRC.

126
CHAPTER TEN: CAPACITY DEVELOPMENT
The project has allowed for extensive capacity development in that there are a number of students whose studies have been funded specifically by the project. There have also been a number of students, interns and community groups involved in the development and testing of the CS tools. This has created learning, experience and empowerment for a wide scope of people.
Students
Table 18: Table of students with research funded by or directly relating to the project
Surname Name Institution Level of study Year Thesis Title
Boothway Louine Rhodes University
MSc (Education)
2014 Learning, knowledge and change through participation in a CS project: An evaluative case study of the Mpophomeni sanitation project
Cele Hlengiwe University of the Witwatersrand
MSc (Management, public and development management)
2015 CS for water quality monitoring and management in KwaZulu-Natal
Dlamini Luvuyo University of KwaZulu-Natal
BSc Hons (Hydrology)
2013 Assessing river heath under forests and natural vegetation using the miniSASS toolbox
Dumakude Nondumiso University of the Free State
MSc (Environmental Management)
2017 Assessing wetland health using a newly developed land-cover CS tool for people who are not wetland specialists
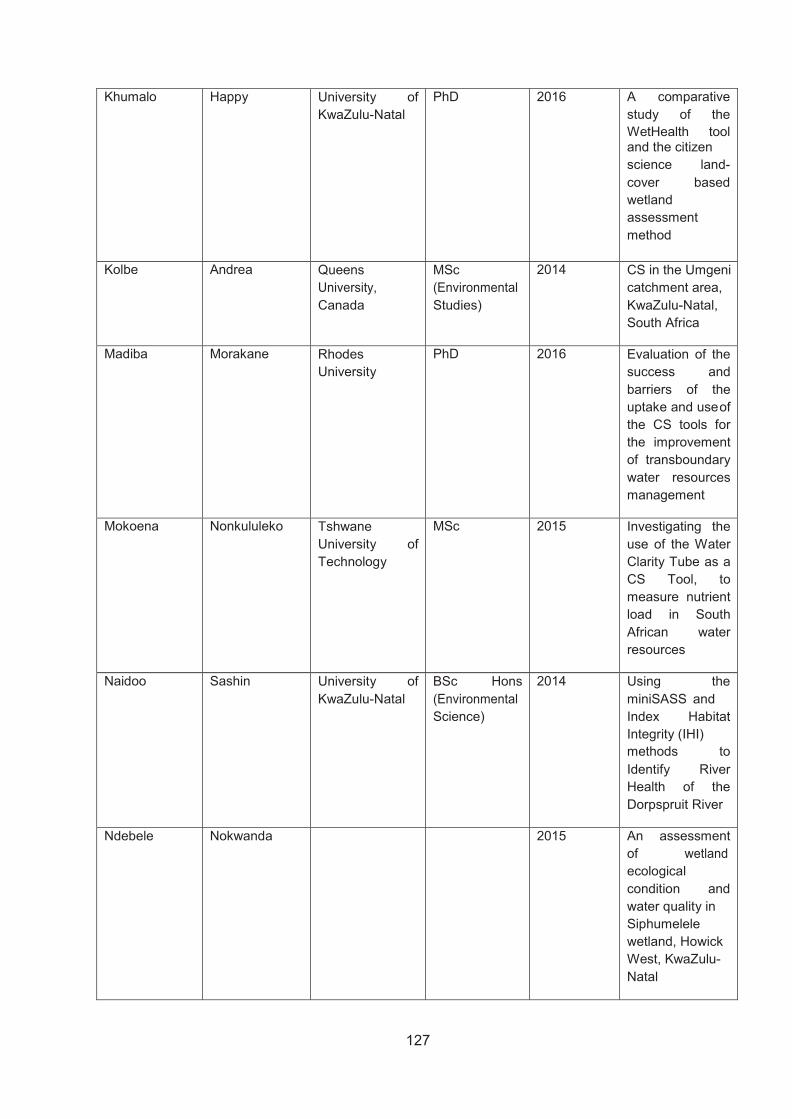
127
Khumalo Happy University of KwaZulu-Natal
PhD 2016 A comparative study of the WetHealth tool and the citizen science land- cover based wetland assessment method
Kolbe Andrea Queens University, Canada
MSc (Environmental Studies)
2014 CS in the Umgeni catchment area, KwaZulu-Natal, South Africa
Madiba Morakane Rhodes University
PhD 2016 Evaluation of the success and barriers of the uptake and use of the CS tools for the improvement of transboundary water resources management
Mokoena Nonkululeko Tshwane University of Technology
MSc 2015 Investigating the use of the Water Clarity Tube as a CS Tool, to measure nutrient load in South African water resources
Naidoo Sashin University of KwaZulu-Natal
BSc Hons (Environmental Science)
2014 Using the miniSASS and Index Habitat Integrity (IHI) methods to Identify River Health of the Dorpspruit River
Ndebele Nokwanda 2015 An assessment of wetland ecological condition and water quality in Siphumelele wetland, Howick West, KwaZulu-Natal

128
Ndou Richard Rhodes University
MSc (Environmental Education)
2015 Riparian Habitat Assessment CS tool within the WRC funded project
Nkomo Xolile University of MSc 2017 Using CS Tools KwaZulu-Natal (Hydrology) to Contribute to Collaborative Water Resource Management: The case of miniSASS
Singh Samiksha University of BSc Hons 2013 Investigating a KwaZulu-Natal (Environmental Grade 7 Science) Implementation of the miniSASS Method, Using a Social Learning Lens.
van Deventer Ross University of MSc 2012 Impact of land KwaZulu-Natal (Environmental use on water Science) quality and aquatic ecosystem health of stream networks in the upper uMngeni catchment feeding Midmar Dam, KwaZulu- Natal, South Africa

129
Interns
Table 19: Interns on the project Name Surname Institution Contribution to
the project
Mthandeni Ndlela SANBI – Groen Sabenza Intern
Clarity tube testing
Baptiste Lelong EPF University – France
Velocity plank research, calibration, testing and development
Manon Levy EPF University – France
Rain gauge data analysis and general tool testing
Elodie Fardoit EPF University – France
Weather monitoring tools calibration
Claire De Temmerman EPF University – France
Weather monitoring tools calibration
Cailyn Govindasamy Dept. of Tourism – Tourism World Academy Intern
General tool testing, primarily the clarity tube and velocity plank
Jenna Taylor University of KwaZulu-Natal: GroundTruth Intern
Riparian Health Audit, wetland tool, estuary tool, rain gauge, lesson plans development and testing
Nqobile Lushozi University of KwaZulu-Natal: GroundTruth Intern
Velocity plank development & rain gauge calibration
Allyson Mcallistar Nelson Mandela Metropolitan University: GroundTruth Intern
Weather monitoring tools development & clarity tube research
Nkanyiso Mzila University of KwaZulu-Natal: GroundTruth Intern
Weather monitoring tools development and testing

130
CHAPTER ELEVEN: CONCLUSIONS AND RECOMMENDATIONS
CS is moving into a new era. The scope and power of CS is becoming more evident especially when it is used to advocate for change and better management of natural resources. Most recently (Dec 2016) the National Advisory Council for Environmental Policy and Technology (NACEPT – from representatives of academia, business and industry, non-governmental organisations and state, local and tribal governments in the United States) to the Environmental Protection Agency (arguably the largest, most influential and best resourced environmental agency in the world, have identified “CS as an invaluable opportunity for EPA to strengthen public support for EPA’s mission and the best approach for the Agency to connect with the public” (NACEPT, 2016). This mainstreaming of CS is also seen in the policy shifts at an international level, both through UNESCO’s work on the SDGs and the Global Action Programme (GAP).
In South Africa water is a crucially important. Water, Energy and Food become a vital nexus for the survival of the country, including plants animals and people. It is becoming increasingly important that civil society play an integral role in the management and protection of these resources. To this end, the WRC has funded this project to develop easy-to-use, reliable tools to assess water quality and quantity issues, and to go beyond mere awareness-raising, to taking local action. Based on this research project, as well as other anecdotal, empirical and historical evidence from other work conducted by the research team, this report synthesises and outlines the range of enablers and inhibitors to the implementation of CS tools. A key objective has been to move beyond simple awareness raising to taking local action.
Based on the broad review of the enablers and inhibitors to the implementation of these tools, a model known as Action Learning proved a useful referent for undertaking and supporting co-engaged social learning at the nexus of issues. In this regard, Action Learning involves the 5T’s for supporting participants to ‘Tune-in’ and then expand into open deliberative activities of ‘Talk’ or dialogue, ‘Touch’ or real-life encounters such as field-work. The other T’s include ‘Thinking’ or reflection, and ‘Taking action’ for the common good. In deliberative, nexus learning environments, the 5T’s intersect and flow into each other and they are commonly mediated in a socio-cultural context. Through open-ended ways the 5T’s support co-engaged and experiential meaning-making.
The Action Learning model thus helps overcome the inhibiting factors, whilst providing an enabling environment to enhancing the uptake and adoption of the CS tools.
A review of the key enablers and limiters to the adoption of these tools shows that they may be broadly grouped according to either: Social, Technical, Financial or Geographic factors (see Chapter 6). Within these, with appropriate training, facilitation and support, most of the inhibiting factors are shown to be able to be overcome and in fact become enabling factors in support of sustainable actions.
It is recommended that inhibitors or barriers are converted into enablers that foster meaningful learning and change, wherever possible. By developing capabilities (Sen, 1999), people grow in confidence and competence and are able to apply learnings in a widening range of contexts. Sen continues to clarify how ‘freedoms’ (the inner potential all people have) can be realised and be mobilised as confidence grows in sharing contexts where mutual respect and dignity is emphasized.

131
REFERENCES AFRICA WATER VISION (2000) The Africa Water Vision for 2025: Equitable and Sustainable Use of Water for Socioeconomic Development, United Nations Economic Commission for Africa Website http://www.uneca.org/awich/african%20water%20vision%202025.pdf, accessed 17 May 2012.
AKKERMAN, S.F. and BAKKER, A. (2011) Boundary Crossing and Boundary Objects. Review of Educational Research.
AMERICAN PUBLIC HEALTH ASSOCIATION (APHA) (1992) Standard methods for the examination of water and wastewater. 18th ed. American Public Health Association, Washington, DC.
ANDERIES, J.M., JANSSEN, M.A. and OSTROM, E. (2004) A framework to analyze the robustness of social ecological systems from an institutional perspective. Ecology and Society, 9(1), 18.
ANDREAS, B.K., MACK, J.J. and MCCORMAC, J.S. (2004) Floristic Quality Assessment Index (FQAI) for vascular plants and mosses for the State of Ohio. Ohio, Environmental Protection Agency (EPA).
BBE (2011) Moldaenke, BenthoTorch. User Manual. Version, 1.3 E1.
BLACKMORE, C. (2007) What kinds of knowledge, knowing and learning are required for addressing resource dilemmas; a theoretical overview. Environmental Science & Policy, 10, 512-525.
BONNEY, R. (1996) Citizen Science: A Lab tradition. Living Bird, 15(4), 7-15.
BONNEY, R., BALLARD, H. and JORDAN, R. (2009) Public participation in scientific research: defining the field and assessing its potential for informal science education. Washington, DC: CAISE.
BONNEY, R., BALLARD, H., JORDAN, R., MCCALLIE, E., PHILLIPS, T., SHIRK, J. and WILDERMAN, C.C. (2009a) Public Participation in Scientific Research: Defining the Field and Assessing Its Potential for Informal Science Education. A CAISE Inquiry Group Report, Washington, D.C. Centre for Advancement of Informal Science Education (CAISE).
BONNEY, R., COOPER, C.B., DICKINSON, J., KELLING, S., PHILLIPS, T., ROSENBERG, K.V. and SHIRK, J. (2009b) Citizen Science: A Developing Tool for Expanding Science Knowledge and Scientific Literacy. BioScience, 59(11), 977-984.
BRANCH, W.R. Reptiles and amphibians Field Guide to Snakes and Other Reptiles of Southern Africa. ISBN 868720403
BROSSARD, D., LEWENSTEIN, B. and BONNEY, R. (2005) Scientific knowledge and attitude change: the impact of a citizen science project. International Journal of Science Education, 27, 1099-1121.
BROWNE, M., BRUTON, S., FLEMING, G., GRAHAM, M., SHAI, C., SOKOLIC, F., TAYLOR, J. & THIRION, C. (2013) miniSASS Data Management: Development of an online map-based data portal. Deliverable 2: Framework/plan of the online map-based miniSASS data portal. Water Research Commission Project No. K8/1010
CARTER, V., GARRETT, M.K. and GAMMON, P.T. (1988) Wetland boundary determination in the Great Dismal Swamp using weighted averages. Water Resources Bulletin 24 297-306.
CONRAD, C.C. and HILCHEY, K.G. (2011) A review of citizen science and community-based environmental monitoring: issues and opportunities. Environmental Monitoring & Assessment, 176, 273-291.
COOPER, C.B. (2012) Links and Distinctions among Citizenship, Science, and Citizen Science. Democracy & Education, Article 13, 20(2).

132
CORNELL, S. BERKHOUT, F., TUINSTRA, W., TABARA, J.D., JAGER, J. CHABAY, I., DE WIT, B., LANGLAIS, R., MILLS, D., MOLL, P., OTTO, I.M., PETERSEN, A., POHL, C. and VAN KERKHOFF, L. (2013) Opening up knowledge systems for better responses to global environmental change. Environmental Science & Policy, 28, 60-70.
COWDEN, C., KOTZE, D.C., ELLERY, W.N. and SIEBEN, E.J.J. (2014) Assessment of the long-term response to rehabilitation of two wetlands in KwaZulu-Natal, South Africa. African Journal of Aquatic Science 111.
CRAPS, M., VAN ROSSEN, E., PRINS, S., TAILLEU, T., BOUWEN, R. and DEWULF, A. (2003) Social learning and water management, lessons from a case study on the Dijle catchment. In Proceedings of the Connections Conference on Active Citizenship and Multiple Identities, Leuven, pp. 418-429.
CSIR (2010) A CSIR perspective on water in South Africa. CSIR Report No. CSIR/NRE/PW/IR/2011/0012/A ISBN: 978-0-7988-5595-2.
CWAC (2014) Co-ordinated Waterbird Annual Count, Zandvlei Trust. http://www.zandvleitrust.org.za/art-cwac%20index.html. (Accessed September 2014).
DAHLGREN, R., VAN NIEWENHUYSE, E. and LITTON, G. (2004) Transparency tube provides reliable water-quality measurements. California Agriculture, 58(3), 49-153.
DALLAS, H.F. and DAY, J.A. (2004) The effect of water quality variables on aquatic ecosystems, a review. Research report no. 224/04, Water Research Commission (WRC), South Africa.
DAMBUZA, T. and TAYLOR, J. (2015) African Citizens Monitor River Health: The Stream Assessment Scoring System. USA National Water Monitoring News acwi.gov/monitoring Sprint 2015
DENT, M. and TAYLOR, L. (in press) Strategic developments that will support and strengthen the participation of local communities in improving water and sanitation management in South Africa. Alliance for Water Stewardship, http://www.allianceforwaterstewardship.org
DESAI, M. and TAYLOR, L. (2014) GT 2146, DUCT Water Stewardship. March 2014 Progress Report, DUCT, Pietermaritzburg.
DICKINSON, J.L., ZUCKERBERG, B. and BONTER, D.N. (2010) Citizen science as an ecological research tool: Challenges and benefits. Annual Review of Ecology Evolution and Systematics, 41(1), 149-172. 10.1146/annurev-ecolsys-102209-144636
DIERSING, N. (2009) Water quality: frequently asked questions. Florida Brooks National Marine Sanctuary, Key West.
DUZI-UMNGENI CONSERVATION TRUST (DUCT) (2013) The DUCT Story, 2005-2013.
DWA (2013) National Water Resources Strategy, Water for an Equitable and Sustainable Future. Second Edition, Department of Water Affairs, Pretoria, South Africa.
DWAF (1996) South African Water Quality Guidelines. Volume 7, Aquatic Ecosystems, Department of Water Affairs and Forestry, South Africa.
EDWARDS, A. (2007) Relational Agency in Professional Practice: A CHAT Analysis. Action: An International Journal of Human Activity Theory, 1(2007), 1-17.
EDWARDS, A. (2011). Building common knowledge at the boundaries between professional practices: Relational agency and relational expertise in systems of distributed expertise. International Journal of Educational Research, (50), 33-39.
EMIRBAYER, M. (1997) Manifesto for a Relational Sociology. American Journal of Sociology, 103(2), 281-317.
133
ENGESTROM, Y. (1987) Learning by expanding: An activity-theoretical approach to developmental research. Helsinki: Orienta-Konsultit.
ENGESTRÖM, Y. (2000) Activity theory as a framework for analyzing and redesigning work. Ergonomics, 43(7), 960-974.
ENGESTRÖM, Y. (2001) Expansive Learning at Work: toward an activity theoretical reconceptualization. Journal of Education and Work, 14(1), 133-156.
ENVIRONMENT AGENCY (2003) A refined geomorphological and floodplain component River Habitat Survey (GeoRHS). R&D Technical Report SC020024/TR. Joint report by the Department for Environment Food and Rural Affairs and the Environment Agency. United Kingdom.
ENVIRONMENT AGENCY (2005) River Habitat Survey in Britain and Ireland: Field Survey Guidance Manual 2003 Version. Environment Agency. Bristol, United Kingdom.
ENVIRONMENTAL PROTECTION AGENCY (EPA) (1996) Volunteer Stream Monitoring, A Methods Manual. Document developed under cooperative agreement from the U.S. Environmental Protection Agency, Washington, District of Columbia, U.S.A.
ENVIRONMENTAL PROTECTION AGENCY (EPA) (2006) Volunteer Estuary Monitoring, A Methods Manual. Document developed under cooperative agreement from the U.S. Environmental Protection Agency to The Ocean Conservancy. Washington, District of Columbia, U.S.A.
ENVIRONMENTAL PROTECTION AGENCY (EPA) (2014) Volunteer Lake Monitoring, A Methods Manual. Document developed under cooperative agreement from the USEPA.
FANIRAN, J.A., NGCEBA, F.S., BHAT, R.B. and OCHE, C.Y. (2001) An Assessment of the Water Quality of the Isinuka Springs in the Transkei Region of the Eastern Cape, Republic of South Africa. Water SA. 27(2).
FERNANDEZ-GIMENEZ, M.E., BALLARD, H.L. and STURTEVANTVE (2008) Adaptive management and social learning in collaborative and community-based monitoring: A study of five community-based forestry organizations in the western USA. Ecology and Society, 13(2).
FONSTAD, M.A., VAN DE GRIFT, J.W. and REICHLING, J.P. (2005) The transparent velocity-head rod for inexpensive and accurate measurement of stream velocities. Journal of geoscience education, 53(1), 44-52.
FRANCOPHONIE INTERNATIONAL ORGANIZATION (2007) Francophonie in the world 2006-2007, FRESHWATERWATCH.https://freshwaterwatch.thewaterhub.org/collect/your-test-kit. (Accessed 19th September 2014).
GRAHAM, P.M. (2009) Reassessment of the miniSASS biomonitoring tool as a resource for environmental education in the river health programme and cross-linking to with the national curriculum statement, Water Research Commission Project K8/733, in press.
GRAHAM, P.M. (2012) Reassessment of the miniSASS biomonitoring tool as a resource for environmental education in the river health programme and cross-linking to with the national curriculum statement, Water Research Commission Project K8/733, WRC Report KV 240/12.
GRAHAM, P.M., BRUTON, S. and GIBIXEGO, A. (2013) miniSASS Data Management: Development of an online map-based data portal. Deliverable 3: Online map-based miniSASS data portal. Water Research Commission Project No. K8/1010.
GRAHAM, P.M., DICKENS, C.W.S. & TAYLOR, R.J. (2004) miniSASS – A novel technique for community participation in river health monitoring and management. African Journal of Aquatic Science. Vol 29 (1) 2004 pg 25-36. ISSN 1608-5914

134
GRAHAM, P.M., TAYLOR, R.J., WARD, M., BRUTON, S. & WILLIAMS, S. (2014) Deliverable 5: Framework of the Toolkit. Report to the Water Research Commission project number: K5/2350
GRIFFITHS, C. and DAY, J. Paris Freshwater life. Mike Picker ISBN 9781775841029
HACHILEKA, E. (2015) Why we need to save Africa’s historical climate data. UNDP Climate Innovations Network. http://undp-cirda.blogspot.ca/2015/11/why-we-need-to-save-africas-historical.html site visited 22 December 2015.
HARVEY, L.D. (2002) Agency and Community; A critical realist paradigm. Journal for the Theory of Social Behaviour, 32(2), 163-94.
HEWAT, C. and BANDA, B. (2010) Community-led sustainable development: the champion approach in Wilson. Environment, Development and Sustainability Perspectives and cases from around the world. Oxford: Oxford University Press.
HOWARD, M. (2016) Personal Communication. Email correspondence received 23 December 2016.
IRWIN, A. (1995) Citizen Science: A study of people, expertise and sustainable development. London: Routledge.
IRWIN, A. & HORST, M. (2015) Engaging in a decentred world. Remaking Participation: Science, Environment and Emergent Publics, 64
ISON, R., COLLINS, K., COLVIN, J., JIGGINS, J., ROGGERO, P.P., SEDDAIU, G., STEYAERT, P., TODERI, M. and ZANOLLA, C. (2010) Sustainable Catchment Managing in a Climate Changing World: New Integrative Modalities for Connecting Policy Makers, Scientists and Other Stakeholders. Water Resources Management, An International Journal, 23(4), 2009.
JAMES, C.S. and KING, J.M. (2010) Ecohydraulics for South African Rivers, A review and guide. Report No. TT 453/10, Water Research Commission (WRC), South Africa.
JENKINS, E.W. (2010) School science, citizenship and the public understanding of science. International Journal of Science Education, 21(7), 703-710.
JENNINGS, G.D. (1996) Protecting water supply springs. NT State University A&T State University, Cooperative.http://www.bae.ncsu.edu/extension/ext-publications/water/protecting/ag-473-15- springsjennings.pdf. (Accessed 30 November 2014).
JOHNSON, K.A., DANA, G., JORDAN, N.R., DRAEGER, K.J., KAPUSCINSKI, A., SCHMIT, T., OLABISI, L.K. and REICH, P.B. (2012) Using Participatory Scenarios to Stimulate Social Learning for Collaborative Sustainable Development. Ecology and Society, 17(2), 9.
JONSSON, A. and KLASANDER, K. (2014) Mpophomeni Enviro Champs: A qualitative study about an Environmental Champions project’s attempt to manage water issues in a South African township. An evaluation study. University of Jonkoping, Sweden.
JORDAN, R.C., BALLARD, H.L. and PHILLIPS, T.B. (2012) Key issues and new approaches for evaluating citizen-science learning outcomes. Frontiers in Ecology and the Environment, 10, 307-309.
KLEYNHANS, C.J., LOUW, M.D. and GRAHAM, M. (2008) Module G: EcoClassification and EcoStatus determination in River EcoClassification, Index of Habitat Integrity (Section 1, Technical manual). WRC Report No. TT 377-08, Joint Water Research Commission and Department of Water Affairs and Forestry report.
KOLBE, A.C. (2014) Citizen Science & water quality in the Umgeni Catchment area, KwaZulu-Natal, South Africa. Unpublished Masters Thesis, Queens University, Ontario.

135
KOTZE, D.C., MARNEWECK, G.C. BATCHELOR, A.L. LINDLEY, D.S. and COLLINS, N.B. (2007) WET- EcoServices: A technique for rapidly assessing ecosystem services supplied by wetlands. Research report no. 339/08, Water Research Commission, Pretoria, South Africa.
KOTZE, P. (2013) Thermal Springs Generate heated Interest. The Water Wheel, 12(5), Water Research Commission, Pretoria, South Africa.
KRASNY, M.E. and BONNEY, R. (2005) Environmental education through citizen science and participatory action research. Environmental education or advocacy: Perspectives of ecology & education in environmental education. Cambridge, UK: Cambridge University Press, 292-319.
KULLENBERG, C. and KASPEROWSKI, D. (2016). What Is Citizen Science? – A Scientometric Meta-Analysis. PLoS ONE, 11(1), e014712. 10.1371/journal.pone.014715226766577
LAVE, J. and WENGER, E. (1991) Situated Learning: Legitimate Peripheral Participation. Cambridge: Cambridge University Press.
LAWSON, R. (2012) Middle Huron Watershed, water quality monitoring program: summary of results: 20032012. Huron River Watershed Council. http://www.hrwc.org/the-watershed/threats/bacteria/. (Accessed 30th September 2014).
LEACH, M., SCOONES, I. and WYNNE, B. (2005) Science and citizens: Globalization and the challenge of engagement. New York: Palgrave Macmillan.
LEONT’EV, A.N. (1981) Problems of the development of the mind. Moscow: Progress
LOTZ-SISITKA, H. (2006) Review of the draft strategy for ESD in the southern and eastern African sub-region. Murray & Roberts Chair of Environmental Education & Sustainability, Rhodes University, South Africa.
LYNAM, T.D.E., JONG, W., SHEIL, D., KUSUMANTO, T. and EVANS, K. (2007) A review of tools for incorporating community knowledge, preferences, and values into decision making in natural resources management. Ecology and society, 12(1), 5.
LYNCH, S.D. (2003) Development of a Raster Database of Annual, Monthly and Daily Rainfall for Southern Africa. Research report no. 1156/1/03, Water Research Commission, Pretoria, South Africa.
MACFARLANE, D.M., KOTZE, D. WALTERS, D., KOOPMAN, V., GOODMAN, P., ELLERY, W. and GOGE, C (2007) WET-Health, A technique for assessing wetland health. Research report no. 340/08, Water Research Commission (WRC), Pretoria, South Africa.
MADIBA, M. (in press) Evaluation of the enablers and constraints of the uptake and use of the citizen science tools for the improvement of transboundary catchment/water resources management: The case study of South Africa, the Umngeni municipality and Emfuleni municipality. Interim draft report towards a PhD study. Rhodes University, Grahamstown.
MALAN, H. and DAY, J. (2004) Water quality aspects of the ecological reserve for wetlands. In: Proceedings of the 2004 Water Institute of Southern Africa (WISA) Biennial Conference, 2-6 May 2004, Cape Town, South Africa.
MANDIKONZA, C.B., MUSINDO and TAYLOR, J. (2011) Cholera in Zimbabwe developing an educational response to a health crisis. Journal of Education for Sustainable Development, 5(1), 17-25.
MATLOCK, M. (2008) Governance of water resources in Africa, United Nations Environment Programme. http://www.eoearth.org/article/Governance_of_water_resources_in_Africa , accessed 17 May 2012.

136
MATTEN, D. (2004) The impact of the risk society thesis on environmental politics and management in a globalizing economy – principles, proficiency, perspectives. Journal of Risk Research, 7(4), 377-398.
MCCRACKEN, K.E., SCOTT, A., REYNOLDS, K. and YOON, J.Y. (2016) Scientific Reports 6, Article number: 27529
MDEP (2010) Stream Survey Manual: a citizen’s primer on Stream Ecology, Water Quality, Hydrology, and Fluvial Geomorphology – Volume II. Report prepared by the Maine Stream Team Program of the Maine Department of Environmental Protection, USA.
MERRIAM-WEBSTER DICTIONARY. http://www.merriam-webster.com/dictionary/intervene. (Accessed 3rd December 2014).
MILBRATH, W. (1994) Stumbling blocks to a sustainable society: Incoherence’s in key premises about the way the world works. Futures, 26(2), 117-124.
MILLER-RUSHING, A., PRIMACK, R. and BONNEY, R. (2012) The history of public participation in ecological research, Frontiers in Ecology and the Environment, (10), 285-290.
MINNESOTA CITIZEN STREAM MONITORING PROGRAM (2011) Instruction manual. Minnesota Pollution Control Agency.
MLAB (2014) The International Space Apps Challenge 2014. http://www.mlab.co.za/international- spaceapps-challenge-2014-2/. (Accessed September 2014).
MORANT, P. and QUINN, N. (1999) Influence of man and management of South African estuaries. In: Estuaries of South Africa, Cambridge University Press.
MUELLER, D.K, and HELSEL, D.R. (1996) Nutrients in the Nation's Waters – Too Much of a Good Thing? U.S. Geological Survey Circular, 1136.
MUELLER, M.P., TIPPINS, D. and BRYAN, L.A. (2012) The Future of Citizen Science. Democracy& Education, 20(1). Article 2.
MUKUTE, M. (2010) Exploring and expanding learning processes in sustainable agriculture workplace contexts. Unpublished PhD thesis, Rhodes University, South Africa.
NATIONAL ADVISORY COUNCIL FOR ENVIRONMENTAL POLICY AND TECHNOLOGY (2016) Environmental protection belongs to the public: A vision for Citizen Science at the EPA. Report number: EPA219-R-16-001
NEL, J.L. and DRIVER, A. (2012) National Biodiversity Assessment 2011, technical report, freshwater component. CSIR Report CSIR/ECO/IR/2012/0022/A, Stellenbosch, Council for Scientific and Industrial Research, 2.
NEWMAN, K. Newmans Birds of southern Africa ISBN 0869541366
NICHOLSON, S.E. (2000) The nature of rainfall variability over Africa on time scales of decades to millennia. Global and planetary change 26(1) 137-158.
NPC (2011) National Development Plan (2030) Our future makes it work, Executive Summary. National Planning Commission, Department of the Presidency, Pretoria, South Africa.
O'DONOGHUE, R. (2001) Environment and active learning in OBE: NEEP guidelines for facilitating and assessing active learning. Share-Net, Howick.
O’DONOGHUE, R. (2009) The Buzz on Honey Bee Economics. A Handprint, Action towards sustainability resource, Share-Net, Howick.

137
OLIVIER, O. and JONKER, N. (2013) Optimal Utilisation of Thermal Springs in South Africa. Research report no. 577/13, Water Research Commission, Pretoria, South Africa.
ORR, D.W. (1994) Earth in Mind: On Education, Environment, and the Human Prospect. Island Press Washington, DC.
OVERDEVEST, C., ORR, C.H. and STEPENUCK, K. (2004) Volunteer stream monitoring and local participation in natural resource issues. Human Ecology Review, 11, 177-85.
PAHL-WOSTL, C.M., CRAPS, A., DEWULF, E., MOSTERT, D., TABARA & TAILLIEU, T. (2007) Social learning and water resources management. Ecology and Society 12(2), 5.
PATTENGILL-SEMMENS, C.V. and SEMMENS, B.X. (2003) Conservation and management applications of the reef volunteer fish monitoring program. Environmental Monitoring Assessment, 81, 43-50.
PAWSON, R. & TILLEY, N. (1997). Realistic evaluation. Thousand Oaks, California: Sage.
POCOCK, M.J.O., CHAPMAN, D.S., SHEPPARD, L.J. and ROY, H.E. (2014) Choosing and Using Citizen Science: a guide to when and how to use citizen science to monitor biodiversity and the environment. Centre for Ecology & Hydrology, Natural Environment Research Council, Scottish Environment Protection Agency.
POPKEWITZ, T.S. (1988) Educational reform: Rhetoric, ritual, and social interest. Educational Theory, (38), 77-93.
PRETTY, J. (1995) Participatory learning for sustainable agriculture. World Development, 23 (8) 1247- 1263.
PRINGLE, J.A. (1982) The Conservationists and the Killers: The Story of Game Protection and the Wildlife Society of Southern Africa. T.V. Bulpin, Cape Town.
REED, M.S., EVELY, A.C., CUNDILL, G., FAZEY, I., GLASS, J., LAING, A., NEWIG, J., PARRISH, B., PRELL, C., RAYMOND, C. and STRINGER, L.C. (2010) Ecology and Society: What is Social Learning?
REVENGA, C., CAMPBELL, I., ABELL, R., DE VILLIERS, P. and BRYER, M. (2005) Prospects for monitoring freshwater ecosystems towards the 2010 targets, Philosophical Transactions of the Royal Society, pp. 397-413.
ROBBINS, D. (1991) The Work of Pierre Bourdieu. Milton Keynes: Open University Press.
ROWLANDS, K., TAYLOR, J. and BARNES, G. (2013) Securing ecological infrastructure in the uMngeni catchment: a socio-ecological contextual profile. A report by the Wildlife and Environmental Society of South Africa (WESSA) and the WorldWide Fund for Nature (WWF).
ROWNTREE, K.M. and WADESON, R.A. (1999) A hierarchical geomorphological model for the classification of selected South African rivers. WRC Report No.TT 497/1/99, Water Research Commission, Pretoria, South Africa.
Science Communication Unit, University of the West of England, Bristol (2013)
Science for Environment Policy In-depth Report: Environmental Citizen Science. Report produced for the European Commission DG Environment.
SEN, A. (1999) Development as Freedom. New York: Knopf.
SHARE-NET (2013) Stepping up to Sustainability ‘Change Choice’ Hand-outs. WESSA: Share-Net, Howick.

138
SHIRK, J.L., BALLARD, H.L., WILDERMAN, C.C., PHILLIPS, T., WIGGINS, A., JORDAN, R., MCCALLIE, M., MINARCHEK, M., LEWENSTEIN, M., KRASNY, M.E. and BONNEY, R. (2012) Public participation in scientific research: a framework for deliberate design. Ecology and Society, 17(2), 29.
SIMAIKA, J.P. and SAMWAYS, M.J. (2009) An easy-to-use index of ecological integrity for prioritizing freshwater sites and for assessing habitat quality. Biodiversity and Conservation 18(5) 1171-1185.
STERLING, S. (2011) Transformative Learning and Sustainability: sketching the conceptual ground. Learning and Teaching in Higher Education, 5, 17-33.
STUART, C. and STUART, M. Field Guide to Mammals of Southern Africa. ISBN 9781770074040
TABARA, J.D. and CHABAY, I. (2013) Coupling Human Information and Knowledge Systems with social-ecological systems change: Reframing research, education, and policy for sustainability. Environmental Science & Policy, 28, 71-81.
TÀBARA J.D. and PAHL-WOSTL, C. (2007) Sustainability learning in natural resource use and management. Ecology and Society12 (2) 3.
TAYLOR, A. (2012) Fostering environmental champions: A process to build their capacity to drive change” in Gill, A.L (ed.). Journal of Environmental Management, Amsterdam: Elsevier Ltd (98).
TAYLOR, J. (1992) Giving away the tools of science, Our Living World. South African Nature Foundation, Stellenbosch, 4-5.
TAYLOR, J. (1993) Giving the tools of science away. In Nature Herald, Commission on Education and Communication. IUCN Newsletter 4, 11.
TAYLOR, J. (1997) Share-net: A case study of environmental education resource material development in a risk society. Doctoral Thesis, Rhodes University.
TAYLOR, J. (2014) Shaping the GAP: Ideas for the UNESCO Post-2014 ESD Agenda. SAGE Publications. Journal of Education for Sustainable Development (Los Angeles, London, New Delhi, Singapore and Washington DC) www.sagepublications.com Vol 8(2): 1-9 10.1177/0973408214548369
TAYLOR, J., MSOMI, L. and TAYLOR, L. (2012) RCE KwaZulu-Natal: Shiyabazali Settlement: Water Quality Monitoring and Community Involvement in Fadeeva, Zinaida, Innovation in Local and Global Learning Systems for Sustainability: Towards More Sustainable Consumption and Production Systems and Sustainable Livelihoods – Learning Contributions of the Regional Centers of Expertise on Education for Sustainable Development. UNU-IAS, Yokohama, Japan.
TAYLOR, J. and TAYLOR, E. (2016) EnviroChamps: Community mobilization, education and relationship building. In Resilience by Design: A selection of case studies. International Water Security Network and Monash University, Pretoria.
TAYLOR, J. and WESTERMAN, L. (2013) Stepping up to sustainability through ‘change choice practices’ and social media. Environment, Future Publishing, Johannesburg, 15, 26-31.
TAYLOR, L. (2013) Mpophomeni Sanitation Education Project November 2011 to January 2013 Interim Report. Unpublished material.
THALER, R.H. and SUNSTEIN, C.R. (2008) “Nudge: the gentle power of choice architecture. “Capital ideas: selected papers on decision research. The University of Chicago Booth School of Business.11 March 2013 <http://www.chicagobooth.edu/capideas/may08/5.aspx>.
TWEDDLE, J.C., ROBINSON, L.D. POCOCK, M.J.O. and ROY, H.E. (2012) Guide to citizen science: developing, implementing and evaluating citizen science to study biodiversity and the environment in the UK. Natural History Museum and NERC Centre for Ecology & Hydrology for UK-EOF.

139
UNESCO (2004) UNESCO UN decade for education for sustainable development. UNESCO, Paris. UNESCO (2013) http://www.unesco.org/new/en/unesco-world-conference-on-esd-2014/esd- after2014/global-action-programme. (Accessed May 2014).
UNITED NATIONS ENVIRONMENT PROGRAMME (2004) Environmental Action Learning in Eastern and Southern Africa. UNEP, Nairobi.
UNITED NATIONS ENVIRONMENT PROGRAMME (UNEP) 2008. Freshwater Under Threat: Vulnerability Assessment of Freshwater Resources to Environmental Change – A Joint Africa-Asia Report. Joint United Nations Environment Programme and Water Research Commission Report. http://www.unep.org/dewa/Portals/67/pdf/Freshwater_under_Threat_SDM_Pub_72dpi.pdf.
VAN DER LINDE, M. (Ed) (2006) Compendium of South African Environmental Legislation. Pretoria University Law Press, Pretoria, South Africa. WENGER E (2004) Knowledge management as a doughnut, shaping your knowledge strategy through communities of practice. Ivey Business Journal, 1-8.
VAN WYK, B. and VAN WYK, P. Trees – How to identify trees in southern Africa. ISBN 9781770072404
VYGOTSKY, L.S. (1978) Mind in society: the development of higher psychological processes. Cambridge: Harvard University Press.
WALS, A. (2007) Social Learning towards a sustainable world. Wageningen, Wageningen Academic Publishers.
WALS, A. (2009) United Nations Decade of Education for Sustainable Development (DESD, 2005-2014). Review of Contexts and Structures for Education for Sustainable Development Learning for a sustainable world. UNESCO, Paris.
WALS, A. (2011) Learning our Way to Sustainability. Journal of Education for Sustainable Development, 5(2), 177-186.
WALS, A.E.J., BRODY, M., DILLON, J. and STEVENSON, R.B. (2014) Convergence between Science and Environmental Education. Science Education, 344(2014), 583-584.
WARD, M. (2016) Review of Emvelo-Wise, Qondimvelo and Rural Community Upliftment Community Initiatives. Community Education and Development Trust, AECI, Johannesburg.
WARD, M. (2016) Review of the Enviro Champs in Mpophomeni. WWF Nedbank Green Trust project no. GT5416, Stellenbosch.
WATER RESEARCH COMMISSION (2008) Joint Water Research Commission and Department of Water Affairs and Forestry report. Report No. TT 377/08.
WATER RESEARCH COMMISSION (2014) Deliverable 5: Framework of the Toolkit. Report to the Water Research Commission for project K5/2350. Hilton, KwaZulu-Natal
Weather Observations Website (WOW) (2014) http://wow.metoffice.gov.uk/. (Accessed 25 September 2014).
Weather Underground (2014).http://www.wunderground.com/. (Accessed 25 September 2014).
WEAVING, A., GRIFFITHS and PICKER, M. Insects Field Guide to Insects of South Africa ISBN 9781770074040
WENGER, E. (2004) Knowledge management as a doughnut; Shaping your knowledge strategy through communities of practice. Ivey Business Journal, 1-8.

140
WENGER, E. (2004) Communities of Practice: learning meaning and identity. Cambridge University Press, United Kingdom.
WENGER, E., MCDERMOTT, R. & SNYDER, W. (2002) Cultivating Communities of Practice: a guide to managing knowledge. Boston: Harvard Business School Press.
WENGER, E. and SNYDER, W. (2000) Communities of Practice: The Organizational Frontier. Harvard Business Review, 78(1), 139-145.
WENTWORTH, T.R. and JOHNSON, G.P. (1986) Use of vegetation in the designation of wetlands. Final Report for the US Fish and Wildlife Service, National Wetlands Inventory, St Petersburg, Florida.
WESSA (2013) Mpophomeni Sanitation Education Project. Howick, DUCT/WESSA/ Eco-school.
WESSA (2016) Stepping Up to the Sustainable Development Goals. WESSA Bryanston, Johannesburg.
WHITELAW, G.S., VAUGHAN, H., CRAIG, B. and ATKINSON, D. (2003) Establishing the Canadian Community Monitoring Network. Environmental Monitoring and Assessment, 88(1-3), 409-418.
WIGGINS, A. and CROWSTON, K. (2011) From conservation to crowdsourcing: a typology of citizen science. Proceedings of the 44th Annual Hawaii International Conference on Systems Sciences, Koloa, Hawaii, 4-7, 1-10.
WILDERMAN, C.C., BARRON, A. and IMGRUND, L. (2004) From the field: A service provider’s experience with two operational models for community science. Community-Based Collaborative Research Consortium Journal Spring.
WILM, H.G. and STOREY, H.C. (1944) Velocity-head rod calibrated for measuring streamflow. Civil Engineering 14:475-476
WOLMAN, M.G. (1954) A method of sampling coarse river-bed material. American Geophysical Union.
World Water Monitoring Challenge (WWMC) (2013) http://www.monitorwater.org/TestKits.aspx. (Accessed 17th September 2014).
WRIGHT, T. (1988) Pep-up: A review of the Umgeni Valley Project evaluation process. Southern African Journal of Environmental Education, 7, 15-18.
ZOONIVERSE (2014) Real Science Online. Citizen Science Alliance. https://www.zooniverse.org. (Accessed September 18th 2014).

141
APPENDICES Nineteen Appendices related to this report appear on the enclosed CD.
The appendices are: APPENDIX A: Tabulated Sustainable Development Goals APPENDIX B: WISA Poster on Citizen Science Tools APPENDIX C: Workshop Report Template APPENDIX D: List of Workshops APPENDIX E: List of Conference Presentations APPENDIX F: List of Publications APPENDIX G: List of Students and Interns APPENDIX H: miniSASS APPENDIX I : The Riparian Health Audit (RHA) APPENDIX J: The Clarity Tube APPENDIX K: The Transparent Velocity Head Rod (TVHR) APPENDIX L: The Wetland Assessment Tool APPENDIX M: The Estuary Tool APPENDIX N: The Spring Tool APPENDIX O: Home Made Rain Gauge APPENDIX P: Home Made Wind Pressure Plate APPENDIX Q: Home Made Anemometer APPENDIX R: The Expose E. coli Swab APPENDIX S: School Lesson Plans