Water Quality Report - 1991 - environmentdata.org... · 3.1 Monitoring 3.2 Cl ossification of...
138
------- ----- : -------- -------------------j i m i ..... . .------- n- INR.A watG<" Qaatity Fs NRA Water Quality Report - 1991 E nvironment Agency NATIONAL LIBI INFORMATION, or& .VICE ANGLIAIrf REGION Kingfisher Ilouse. Goldhay Way, rton Goldhay, rborough PE2 5ZR National Rivers Authority Anglian Region
Transcript of Water Quality Report - 1991 - environmentdata.org... · 3.1 Monitoring 3.2 Cl ossification of...

------- ----- :-------- ------------------- j i m i . . . . . . .-------n -
INR.A watG<" Q a a t i t y F s
NRA
Water Quality Report - 1991
E n v i r o n m e n t Ag e n c y
NATIONAL LIBI INFORMATION,
or &.VICE
ANGLIAIrf REGION
Kingfisher Ilouse. Goldhay Way, rton Goldhay,
rborough PE2 5ZR
Nationa l Rivers Authori ty Anglian Region

ANGLIAN REGION CATALOGUE
accessioi jgOde _h i£ ? T _ _
CLASSNo-------------------------
Water Quality Report - 1991
1

BACKGROUND
The National Rivers Authority (NRA) is charged with the duty of improving the qualitylof the Water Environment. The Authority is a public body which-came into being in September, 1989. *Die NRA operates through a Board and National Head Office. The Anglian Region is one of ten Regional Units. : - -
* r 311C. E- ■ *j - v-This report describes trends in water quality and the key events which happened in .1991-in :.the Anglian-Region. *This year we have -continued to build on .the organisation of the Region within the context of our ,new:national identity and objectives. At the same time, we have maintained continuity with past activities and helped to develop and implement policies which will address our future tasks.

EXECUTIVE SUMMARY
Vfe report trends in the quality of rivers over the past eight years. About 5% less of river lengths complied with River Quality Objectives
- . - than in 1990. The nain causes are .dry weather and a switch in the emphasis of monitoring. The change appears not:.to have been caused by discharges of sewage effluent.We discuss the 12-year trend„in .the biological quality of rivers. The underlying trend is one of improvement.
~ ' f- *. ; Vi c*. 'The trend in pollution incidents since 1974 is reported. The total number in 1991 was 2,14i, an increase of 14% on 1990. More effective monitoring on . our part and growing public .awareness resulted in this in-
cc „ ;_crease. The number,,of incidents caused by. oil pollution saw the greatest hx- increase.^ * ^
. — — . . . -r_!~1.' ~ r _ .*A few sites failed criteria for the Dangerous Substances Directive.In canaan with 1990, water-based recreation was disrupted at sane lakes and reservoirs by Blue-green Algae.We report trends in the quality of Bathing Waters since 1987. In 1991 the number of failed waters was 4 out of a total of 33 identified under the Bathing Waters Directive.We provide trends in the performance of discharges since 1982. The proportion of sewage treatment works operated by Anglian Water Services, which oanplied with their Consents in 1991 is 94% - an improvement of over 2% since 1990.The number of enquiries of the Water Act Register has increased steadily since it opened in 1985. There were over 480 in 1991, an increase of 30% since 1990.In 1991, we took over 36,000 samples for chemical analysis for routine audit purposes. Most of these were taken from rivers and effluents. We used River Quality Indices and the Laboratory Information Management System to ensure efficient use of this resource.In preparation for calculating the measures needed for achieving Water Qiality Objectives we have completed further mathematical models of rivers, estuaries and coastal waters.
£ 3

Contents...
Part 1: INTRODUCTION
Part 2:
Part 3;
Part 4:
1.1 National Aims1.2 Duties1.3 The Environmental Protection1.4 Water Quality 20001.5 Tasks
RIVERS & GRCUNEWATERS2.1 Chemical Monitoring2.2 River Quality Classification2.3 River Quality Objectives2.4 The 1990 Survey2.5 Statutory Quality Objectives2.6 River Quality Indices2.7 Biological Monitoring2.8 EC Directives2.9 Pollution Incidents2.10 Prosecutions2.11 Groundwater2.12 Nitrate2.13 Blue-Green Algae2.14 The Norfolk Broads2.15 Pesticides2.16 Catchment Management Plans2.17 Mathenatical Modelling
ESTUARIES & COASTAL WATERS3.1 Monitoring3.2 Cl ossification of Estuaries3.3 EC Directives3.4 Red List/Annex 1A3.5 North Sea3.6 JoNuS Progranme3.7 Paris Ccmnission3.8 Coastal Survey Vessel3.9 Mathenatical Modelling
DISCHARGES4.1 Utility Discharges4.2 Non-Utility Discharges
4

I
I
4.3 Priority Lists and the Index of Discharge Inpact
4.4 Targeting and Tripartite Sampling4.5 Progress an Consent Conditions4.6 Charging for Discharges4.7 Integrated Pollution Control
Part 5: WATER ACT REGISTERPart 6: CAPITAL DEVELOPMENT PROGRAMMEPart 7: RESEARCH AND DEVELOPMENTPart 8: CHEMICAL LABORATORY SERVICESPart 9: INK3EWATIGN STRATEGYAPPENDIX 1: BIOLOGICAL SAMPLING IN 1991APPENDIX II: . PROSECUTIONS BROUGHT TO COURTAPPENDIX III:-r. .. FORMAL CAUTIONS ISSUED
- Glossary t .ci .c.' "' ■
r*A
5

Part 1. INTRODUCTION
1.1 National AlmsThe Authority's responsibility for the quality of the water environment extends to all Controlled Waters. Controlled Waters include rivers, lakes, groundwaters, estuaries and coasted waters.The Authority has stated that it will protect and improve the Water Environment. The NRA aims to:
■ achieve a continuing improvement in the quality of Controlled Waters, through the control of pollution;
■ maintain and improve the quality of environmental waters for all those who use them;
■ ensure that dischargers pay the costs of the consequences of their discharges and, as far as possible, to recover the costs of improving the water environment frcm those who benefit;
■ assess perfanrance towards achieving Environmental Quality Objectives and identify overall trends in water quality.
1.2 DutiesLegislation concerning the NRA was consolidated into the Water Resources Act in December 1991. Under this Act the NRA has statutory duties and responsibilities relating to the quality of the aquatic environment.The prime duties of the NRA include:
■ to achieve Water Quality Objectives in all Controlled Waters;■ to monitor the extent of pollution in Controlled Waters;■ to conserve and enhance the amenity of inland and coastal waters,
and of land associated with such waters;■ to determine and issue Consents for discharge of wastes into Con
trolled Waters;■ to maintain Public Registers of Water Quality Objectives, Applica
tions for Consents, Certificates and sampling data;■ to keep maps of Controlled Waters for public inspection;■ to advise and assist the Department of the Environment on matters
6

of water pollution;■ to exchange information with water undertakers on pollution mat
ters.The NRA has declared that it will operate openly in discharging its duties and balance the Interests of all who benefit frcm and rake use of Controlled Waters.
1.3 The Environmental Protection ActThe Environmental Protection Act 1990. introduced the concept of Integrated Pollution Control for processes which manufacture or use the most dangerous substances. (See Part 4.7) These will be authorised by Her Majesty's Inspectorate of Pollution. The NRA is a statutory consultee, and has considerable influence on authorisations where water quality is affected.Under the Environmental Protection Act 1990, the maximum fine allowed for a pollution offence was increased frcm £2,000 to £20,000 for cases heard in a Magistrates Court. This took effect from 1 January 1991. An unlimited fine could be inposed in the Crown Court.
1.4 Water Quality 2000An NRA national strategy for the water quality function, Water Quality 2000, has been introduced. The strategy addresses the goals we must achieve to bring about a continuing improvement in the waters under our control. Key issues include
the introduction of Statutory Water Quality Objectives for all waters for which we have responsibility;the set up and implementation of a system of catchment planning, to assist in the achievement of water quality standards;to determine the relative impact of all causes of poor water quality in each cat eluent;to set up systems for controlling thesecauses; and to develop economic incentives as a basis for pollution control.
TasksTo achieve its aims for water quality, the NRA must excel in four areas:
■ manage the resources available for monitoring;
1.5
7

■ ensure that dischargers invest enough in the disposal of their wastes;
■ ensure that changes in land use and other developments cause no damage to the water environment; and,
■ minimise the risk of damage from accidents and pollution incidents.
During 1991, we have developed further our systems for the management of our monitoring programme. All information on routine sampling points and sampling obligations are held cn computer. In the computer, this information is displayed as a menu and linked autaratically to maps. The computer display allows us, or the public, to see all the monitoring done at any location, at a glance. The computer will extract results of chemical analyses into a special database. An example of this database is given in Figure 1.1. These sample results can then be displayed as graphs an the map. (See Figure 9.2)The system covers all the chemical and biological analyses provided by cur Laboratory Services. More than 115 sets of chemical analyses are needed to cover the requirements of the legislation and other duties. An example is given in Figure 1.2.Three developments have helped us to manage the sampling programne. The first, the Laboratory Information Management System (LIMS), ensures efficient use of laboratory resources, minimises the risk of errors, and helps to ensure that all ccnmitments for sampling and analysis are met (Part 8).The second is the Sampling Information Management System (SIMS). This combines the monitoring requirements at each sampling site and then checks that UM5 is analysing for the requirements (Part 9).The third development involves River Quality Indices. This is a system which checks the water quality information in our computer databanks to confirm that all data are logged correctly (Part 2.6).We have continued the development of tools for assessingmeasures needed to improve water quality. The introduction of water quality models is giving us consistent and authoritative methods of setting Consents for discharges to Controlled Waters.We have also developed further our systems for the audit of performance against water quality standards and extended their use to set priorities for action, using "Hit-lists" of the worst discharges derived from an Index of Discharge Impact (Part 4.3).
8

FIGURE 1.1
PTCODE DETCODE DATE TIME SAMPNO REASONS INDICATOR METHOD710 06/08/92 L:S0002958.SPLR01BFBR****** 01/01/91 91000001 CM:Type:** 31/12/91 91999999 Area:**Sub2:** DC:** PC:***Dept:** Lab:** Who:*** Mth: *
* * * * *
R01BFBR01 00613 10/01/91 10:31 91000634 CM ED SR01BFBR01 00613 07/02/91 09:35 91004004 CM ED SR01BFBR01 00613 07/03/91 11:10 91007046 CM ED sR01BFBR01 00613 11/04/91 08:30 91011132 CM ED sR01BFBR01 00613 09/05/91 08:50 91014969 CM ED sR01BFBR01 00613 06/06/91 08:30 91019436 CM ED sR01BFBR01 00613 04/07/91 08:50 91023796 CM ED sR01BFBR01 00613 01/08/91 08:30 91028327 CM ED sR01BFBR01 00613 29/08/91 08:50 91032562 CM ED sR01BFBR01 00613 03/10/91 08:40 91037426 CM ED sR01BFBR01 00613 31/10/91 08:50 91042059 CM ED sR01BFBR01 00613 28/11/91 08:30 91046484 CM ED sR01BFBR01 00683 10/01/91 10:31 91000634 CM ED sR01BFBR01 00683 07/02/91 09:35 91004004 CM ED sR01BFBR01 00683 07/03/91 11:10 91007046 CM ED sR01BFBR01 00683 11/04/91 08:30 91011132 CM ED sR01BFBR01 00683 09/05/91 08:50 91014969 CM ED sR01BFBR01 00683 06/06/91 08:30 91019436 CM ED sR01BFBR01 00683 04/07/91 08:50 91023796 CM ED sR01BFBR01 00683 01/08/91 08:30 91028327 CM ED sR01BFBR01 00683 29/08/91 08:50 91032562 CM ED sR01BFBR01 00683 03/10/91 08:40 91037426 CM ED sR01BFBR01 00683 31/10/91 08:50 91042059 CM ED sR01BFBR01 00683 28/11/91 08:30 91046484 CM ED s
Subl:** Zne:**** Ind:**7.927.997.94 8.16 8.027.857.95 7.71 8.05 7.88 7.74 7.9119.0 4.0410.0 5.12 6.45 8.48 4.43 11.7 6.27 2.878.85 8.37

CODE
FIGURE 1.2ANALYSIS SUITES
RJ - SURFACE WATER DIRECTIVE ANNUALLY DETERMINAND NAME UNITS« ~ ^ ^
00613 PH PH UNITS00683 TURBIDITY (FTU) FTU00721 COLOUR FILTERED(0.45UM MEMBRANE)HAZEN HAZEN00761 TEMPERATURE C (FIELD TEST) CEL00772 CONDUCTIVITY AT 25 DEG C USIE/CM00812 OXYGEN DISSOLVED % SATN % SATN00822 OXYGEN DISSOLVED MG/L AS O MG/L O00851 BOD 5 ATU TOTAL MG/L O00994 CARBON ORGANIC TOTAL (ACID SPARGED) MG/L C01113 AMMONIA AS NITROGEN MG/L N01165 NITROGEN TOTAL OXIDISED AS NITROGEN MG/L N01351 SOLIDS PARTICULATE (105 C) (SUSPENDED) MG/L01581 HARDNESS TOTAL AS CAC03 MG/L CAC0301592 CARBON DIOXIDE - FREE MG/L C0201622 ALKALINITY TOTAL AS CAC03 MG/L CAC0301724 CHLORIDE MG/L CL01751 CYANIDE TOTAL MG/L CN01771 FLUORIDE MG/L F01806 PHOSPHATE ORTHO AS PHOSPHOROUS MG/L P01823 SILICATE REACTIVE DISSOLVED AS SI02 MG/L SI0201833 SULFATE MG/L S0402073 SODIUM MG/L NA02113 POTASSIUM MG/L K02830 BORON TOTAL MG/L B04035 MANGANESE TOTAL MG/L MN04197 IRON 0.4SUM MEMBRANE FILTERED MG/L FE04611 DETERGENTS ANIONIC AS MANOXOL OT MG/L M. OT05032 CHLORFENVINPHOS UG/L05072 DICHLORVOS UG/L05352 MALATHION UG/L05432 PARATHION UG/L UG/L07142 BENZO (GHI) PERYLENE TOTAL UG/L07182 BENZO (A) PYRENE TOTAL UG/L07232 DIAZINON UG/L07291 CHLOROPHYLL A UG/L UG/L07312 BENZO (B) FLUORANTHENE TOTAL UG/L07332 BENZO (K) FLUORANTHENE UG/L07362 FLUORANTHENE TOTAL UG/L07421 POLYNUCLEAR AROMATIC HYDROCARBONS-SUM 6 UG/L07462 INDENO (1,2,3-CD) PYRENE TOTAL UG/L07494 PHENOLS DISTILLED (MONOHYDRIC) AS PHENO MG/L23460 STREPTOCOCCI FAECAL PRES. (MICROBIO TEST NO/IOOML25490 E COLI PRESUMPTIVE (MICROBIOLOGY TEST) N0/100ML70422 CHLORPYRIPHOS-METHYL UG/L UG/L70741 MEVINPHOS (UG/L) UG/L70771 TRIETAZINE (UG/L) UG/L73261 VANADIUM TOTAL UG/L
Continued.

ANALYSIS SUITES
RJ - SURFACE WATER DIRECTIVE ANNUALLY contd.CODE DETERMINAND_NAME UNITS73602 PROPAZINE UG/L74252 COBALT TOTAL UG/L UG/L CO74401 AZINPHOS-ETHYL UG/L74411 FENTHION UG/L74421 P ARATHI ON - METHYL UG/L75051 DESMETRYN UG/L ug/l75061 PROMETRYN UG/L UG/L75091 CLOPYRALID UG/L75101 TRICLOPYR UG/L90381 PHOSPHORUS TOTAL (ORTH + COND + ORG) MG/L P90675 CHLOROFORM UG/L90685 BROMODICHLOROMETHANE ug/l90695 DIBROMOCHLOROMETHANE ug/l90705 BROMOFORM UG/L91135 DICHLOROMETHANE UG/L91155 CARBON TETRACHLORIDE UG/L91195 TRICHLOROETHYLENE UG/L91215 TETRACHLOROETHYLENE ug/l91234 CHLOROBENZENE UG/L91265 1,1,2, 2-TETRACHLOROETHANE UG/L91275 1,1,1,2-TETRACHLOROETHANE UG/L91295 PENTACHLOROETHANE UG/L91930 COLIFORMS TOTAL PRES. (MICROBIOLOGY TEST) N0/100ML91983 SILVER TOTAL UG/L UG/L91992 BERYLLIUM TOTAL UG/L UG/L92004 ANTIMONY TOTAL UG/L UG/L SB92017 BARIUM TOTAL UG/L UG/L92521 IOXYNIL UG/L UG/L92581 BROMOXYNIL UG/L92611 ARSENIC TOTAL UG/L UG/L AS92655 CADMIUM TOTAL UG/L UG/L CD92692 MERCURY TOTAL UG/L UG/L HG97031 TERBUTRYN UG/L97251 SELENIUM UG/L SE97271 HYDROCARBONS DISSOLVED AND EMULSIFIED UG/L97326 1 ,1 -DICHLOROETHYLENE UG/L97336 1 ,2-DICHLOROETHANE UG/L97345 1,1,1-TRICHLOROETHANE UG/L97355 1,1,2-TRICHLOROETHANE UG/L97364 1 , 2-DICHLOROBENZENE UG/L97374 1 , 3-DICHLOROBENZENE UG/L97384 1 , 4 - DICHLOROBEN Z ENE UG/L97462 CHLORPYRIPHOS UG/L97472 DIMETHOATE UG/L97482 PYRIMIPHOS-METHYL UG/L97492 CARBOPHENOTHION UG/L97502 FENITROTHION UG/L
Continued.

ANALYSIS SUITES
RJ - SURFACE WATER DIRECTIVE ANNUALLY contd.CODE DETERMINAND NAME UNITS97512 AZINPHOS-METHYL UG/L98641 ATRAZINE UG/L UG/L98651 SIMAZINE UG/L UG/L98800 SALMONELLAE CONF.PRES/ABS (MICROBIO .TEST LITRE98874 CHROMIUM TOTAL UG/L UG/L CR98894 COPPER TOTAL UG/L UG/L CU98914 LEAD TOTAL UG/L UG/L PB98934 NICKEL TOTAL UG/L UG/L NI98954 ZINC TOTAL UG/L UG/L ZN
Part 2: RIVERS & GROUNDWATERS
2.1 Chemical Monitoring2.1.1 Routine sampling
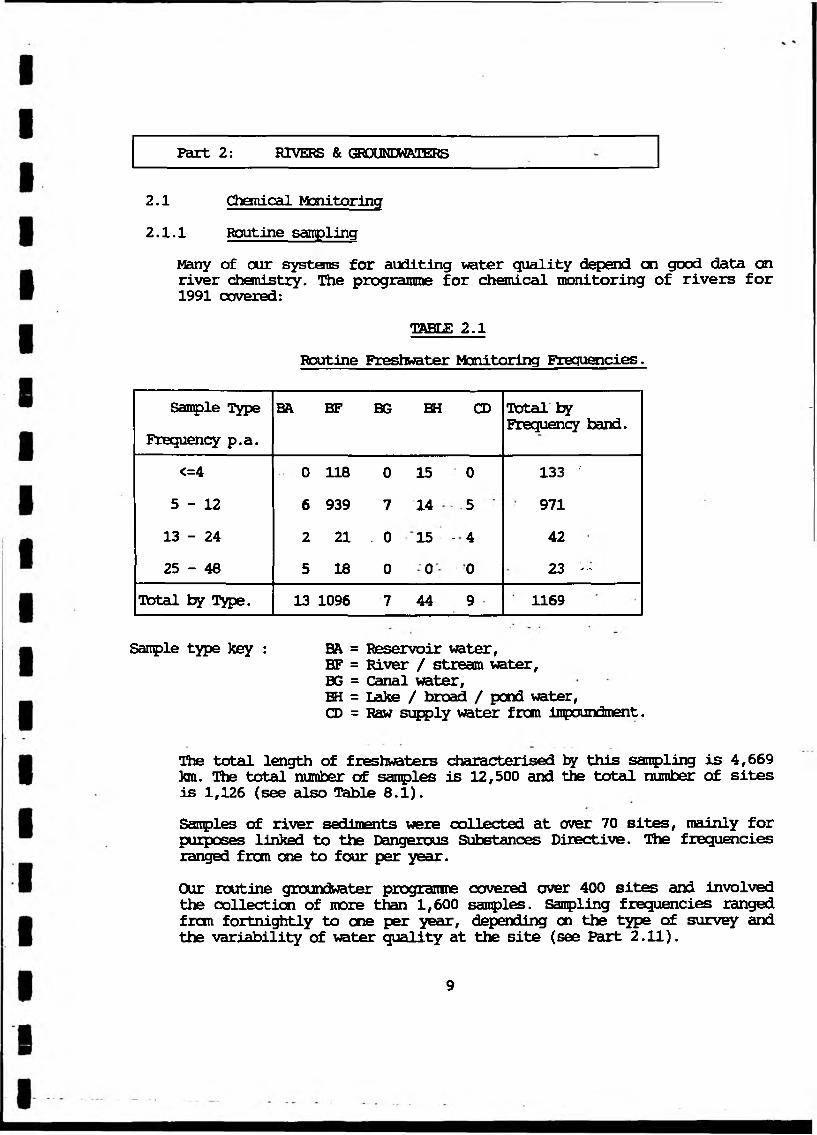
Many of our systems for auditing water quality depend an good data an river chemistry. The programme for chemical monitoring of rivers for 1991 covered:
TAHLE 2.1Routine Freshwater Monitoring Frequencies.
Sample Type Frequency p.a.
BA BF BG BH CD Total by Frequency band.
<=4 0 118 0 15 0 133 '5-12 6 939 7 14 5 97113 - 24 2 21 . 0 15 - 4 4225-48 5 18 0 0 0 23 —
Total by Type. 13 1096 7 44 9 1169
Sample type key : BA = Reservoir water,BF = River / stream water,BG = Canal water,BH = Lake / broad / pond water,CD = Raw supply water fran impoundment.
The total length of freshwaters characterised by this sampling is 4,669 km. The total number of samples is 12,500 and the total number of sites is 1,126 (see also Table 8.1).Samples of river sediments were collected at over 70 sites, mainly for purposes linked to the Dangerous Substances Directive. The frequencies ranged fran one to four per year.Our routine groundwater programme covered over 400 sites and involved the collection of more than 1,600 samples. Sampling frequencies ranged from fortnightly to one per year, depending cn the type of survey and the variability of water quality at the site (see Part 2.11).
9

National guidelines have been drawn up for monitoring freshwaters. They should not impose a requirement for a great of extra resource, on our Region.
2.1.2 Continuous MonitoringWe maintain a network of Automatic Water Quality Monitoring Stations, which provide continuous measurements of water quality. Most are placed on rivers directly above intakes for potable supply or at other strategic river locations.It is part of NRA policy to extend the network to include other sensitive waters, as well as requiring than an more of the important sewage and industrial effluents, for example:-
■ at or above potable supply abstractions;■ at water transfer scheme abstractions or outfalls;■ downstream of large effluent discharges;■ on the lower reaches of a major watercourse;■ downstream of major conurbations;■ at subcatchment confluences;■ at estuarine or coastal sites affected by discharges.
In the last two years, many have been refurbished and the number of new stations in the region is increasing. About 25 are now linked by telemetry networks in the region.Most monitor and record results for a range of parameters fran temperature, pH, dissolved oxygen, conductivity, and amnonia. Generally, instrumentation is housed in a secure structure an the river bank, and water is pumped frcm the stream, passed probes, then returned to the stream. Results are logged on a small local microcomputer outstation and then telemetred periodically to processors in the Areas and at Regional Head Office at Peterborough. If any of the parameters exceed pre- detemined levels the stations automatically notify Regional Control Centre staff who will instigate an investigation into the cause of the exceedence.
2.2 River Qiaiity ClassificationThe reporting of river water quality has been based on the River Classes introduced by the National Water Council (NWC).
10

River stretches are placed in cne of the following classes:Class la - Good QualityClass lb - Good QualityClass 2 - Fair QualityClass 3 - Poor QualityClass 4 - Bad Quality
The Class for a particular stretch is determined mainly by the concentrations of Dissolved Oxygen, Biochemical Oxygen Denand (BCD) and Ammonia found frcm routine monitoring. The following table gives the river quality standards for these determinands and the associated Classes. The concentrations are 95-percentiles - they must be met for 95 percent of the time.
T»BLE1 2.2
River Quality CriteriaDissolvedOxygen
BiochemicalOxygenDemand
Amnonia
(% saturation) (mg/1) (mg/1)1A 60 3 0.3iIB 60 5 0.712 40 9 - ■3 10 17 -.4 Inferior tn Class 3, anaernbie at times
■ The water must be non-toxic to fish in European Inland Fisheries Advisory Ccranission (EIFAC) terms.
The chemical classification of rivers for 1991 is shewn in one of the maps enclosed with this report. There is some change fran 1990. About 9% of river lengths were downgraded, while 4% were upgraded. Overall, 91 % of rivers fall into the Classes defined as Good to Efeir quality.These statistics represent shifts in Class of around 570 1cm since the last report. Shifts occurred across all classes although most were between classes lb and 2, and classes 2 and 3. There was a net downgrade of 226 km since the last report.In 1991, it is believed that over 80% of river length downgraded was because of drought-related causes. Despite greatly-improved effluent qualities frcm many sewage treatment works, reduced flows in certain
11
catchments, provided less dilution for ammonia and BOD in effluents, and several stretches were also affected by heavy algal growth (see also Part 2.3 an RQO's).Among the reductions, about thirteen km of the River Granta and nine km of the Strings ide Stream dropped fran Class 1A to 2 due to drought related causes. Downgradings fran Class 1A to IB included lengths of the rivers Wissey, Babingley, Heacham, Bucklesham Mill River, and about twenty-five Ion of the River Nar. Several lengths wsre re-classified fran IB to 2, notably parts of the Great Eau, Wendling Beck, Claydon Brook, Clipston Brook, Broughton Brook, Aloonbury Brook and Ellington Brook. Downgradings fran Class IB to Class 3 included lengths of the River Kym, Watton Brook and Stowlangtoft Stream. About seven km of the Bourn Brook deteriorated from Class 2 to Class 3. Most of these changes ware due to drought-related causes.During 1991, 26% of the river length which was upgraded improved because of better effluent fran Utility sewage treatment works (STWs). This included a 10 km stretch of the River Bure re-classified fran Class IB to 1A. Around nine km of the River Ouse and 5 km of the River Ore improved fran Class 2 to IB, and about five km of the Spiketts Brook improved fran Class 4 to 3.Notable improvements due to reductions in urban run-off or agricultural pollution lead to a change fran Class IB to 1A for a 10 km length of the Culford stream, while about 13 km of a tributary of the River Blyth was re-classified from 2 to IB.There were no changes in the classification of canals.
2.3 River Quality ObjectivesRiver Classes provide an absolute measure of river water. A river in a good Class will generally be a good fishery and suitable for other uses like the supply of drinking water, but this cannot be guaranteed because a use can be affected by pollutants which are not in the classification system.River Quality Objectives (FQOs) are used to ensure that river quality is checked more directly against all the quality standards needed to support those uses. Improvements to river quality, for example by expenditure on effluent treatment, would then be targeted so as to ensure that River Quality Objectives were met and maintained.The River Quality Objectives defined for the purposes of water quality management are:
■ Abstraction for Public Water Supply;■ Salmonid Fishery (supporting a breeding population
of trout or grayling);12
■ Cyprinid Fishery (supporting a breeding population of coarse fish);
■ Amenity and Conservation (subdivided into three categories - high, moderate and low);
a Abstraction for Industrial Water Supply;■ Spray Irrigation of Field Crops;■ Livestock Watering;
Each of these requires that a set of water quality standards is met. We have assigned River Quality Objectives to 1,350 individual stretches of river, totalling 7,843 km.Each river stretch has a group of uses which were assigned to it after full public consultation. The amalgamation of the standards for all these uses gives a canplete set of standards for that part of the river. Water quality is then managed to achieve this set of standards.In seme rivers where the current river quality is very good the achievement of River Quality Objectives could, in theory, permit a deterioration in river water quality. To prevent this, a policy of No Deterioration is superimposed on the River Quality Objectives (see Part 2.5).
2.3.1 ComplianceThe determinands most often involved in decision-making are Dissolved Oxygen, Biochemical Oxygen Demand, and Armenia. The impact of other substances, for example metals and pesticides, is also assessed against the standards set down in the River Quality Objectives. These substances feature also in the Directives issued by the European Ccnrnunity.River quality is highly variable and the use of sampling means that there is always a risk that we report wrongly that water quality has changed, or failed to meet with a standard, or canplied with a standard. This risk," which "is largest at low "rates of'sampling, “is controlled by using statistically sound methods of assessing canpliance and change.River quality is also affected by whether the year is wet, dry, hot or cold. In order to smooth out these effects, and to increase our ability to detect snail changes in quality, we use three years' data to report performance.Every three months, we audit and report the chemical quality of over 4,500 km of our rivers against the River Quality Objectives, using results fran around 880 sarnpling points. (In 1991, most of the remaining 3,300 km were monitored biologically - see Fart 2.7). The trend in performance against the standards for Dissolved Oxygen, Biochemical Oxygen
13

Demand and Armenia is shown in Figure 2.1. This shows results for the average percent of time for which rivers canplied and the percent of total river length which met standards. These statistics, particularly the former, are stable and efficient measures which can be used to suggest trend.For the three-year period ending in December 1991, the percent of time spent within the required limits was 86.7%, compared to 87.6% for the three-years ending in December, 1990.For the three years ending in December 1991, 65.9% (2,990 km) of river lengths were of the required quality. This compares with the 70.7% (3,200 km) for the three years ending in December, 1990. This suggests that river quality in 1991 was worse than in 1988. Figure 2.1 shows that changes of this magnitude have been seen before, for example fran 1983 to 1984 and fran 1989 to 1990.In Anglian Region, the growth of algae is encouraged by the nutrient- rich, slow moving nature of many of the rivers. This leads to algal activity in the laboratory test for BOD, and to spurious, elevated results. Consequently, the performance figures for river quality are pessimistic because they are distorted by the effect of algae on the measurement of this test..If the effects of algae on the measurement of the BOD are ignored, the total length meeting standards in 1989/91 would Increase fran 65.9 to78.1 percent. This supports the case for much of the poorer quality being drought-related.
Wby did this reported in quality occor?
Vfe can investigate this by looking at median values of water quality. Median values are those which fall exactly in the middle of the range of values. They will not be affected by extreme outlying results. Any shifts in median values can be expected to reflect real overall shifts in qualities. Thus, for assessing trends, the use of median values has several advantages: -
■ it offers a stable estimate of trend;■ it is relatively insensitive to changes in sampling rate; and
thus, - ~ • r . .■ it is a good way of comparing water qualities between sites,
rivers and years.Results from analyses of median values for the parameters most often used decision making, are shown in Table 2.3.
14

FIGURE 2.1PERFORMANCE OF RIVERS RGRINST RIVER QUALITY STANDARDS
DE R C E N T _________ _______________ __ _____________□ 7. COMPLIANT LENGTH (TARGET 95) 0 7. TIME WITHIN LIMITS (TARGET 95)
v7 1
A
iz
DEC'83 DEC'84 DEC'85 DEC'86 DEC'87 DEC'88 DEC'89 DEC90DATA FOR 3 YEARS ENDING
DEC91

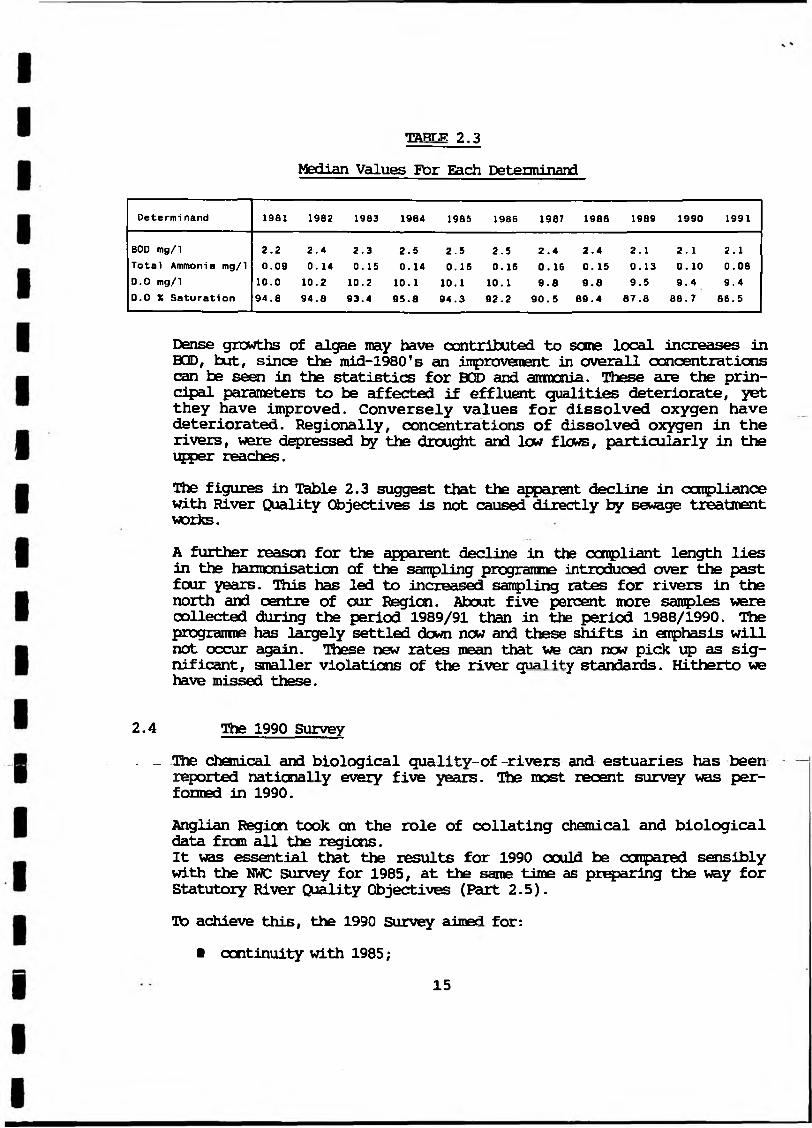
TART.F 2.3 Median Values For Each Deteuninand
Oetermi nand 1981 1982 1983 1984 1985 1986 1987 1988 1989 1990 1991
BOD mg/1 2.2 2.4 2.3 2.5 2.5 2.5 2.4 2.4 2.1 2. 1 2.1Total Ammonia mg/1 0.09 0. 14 0.15 0.14 0.16 0.16 0.16 0. 15 0.13 0. 10 0.080.0 mg/1 10.0 10.2 10.2 10.1 10.1 10.1 9.8 9.8 9.5 9.4 9.4D.O X Saturation 94.8 94.8 93.4 95.8 94.3 92.2 90.5 89.4 87.8 88.7 86.5
Dense growths of algae may have contributed to some local increases in BOD, but, since the mid-1980's an improvement in overall concentrations can be seen in the statistics for BOD and ammonia. These are the principal parameters to be affected if effluent qualities deteriorate, yet they have improved. Conversely values for dissolved oxygen have deteriorated. Regionally, concentrations of dissolved oxygen in the rivers, were depressed by the drought and low flows, particularly in the upper reaches.Die figures in Table 2.3 suggest that the apparent decline in compliance with River Quality Objectives is not caused directly by sewage treatment works.A further reason for the apparent decline in the compliant length lies in the harmonisation of the sampling programme introduced over the past four years. This has led to increased sampling rates for rivers in the north and centre of our Region. About five percent more samples were collected during the period 1989/91 than in the period 1988/1990. The prograirme has largely settled down now and these shifts in emphasis will not occur again. These new rates mean that we can now pick up as significant, smaller violations of the river quality standards. Hitherto we have missed these.
2.4 The 1990 Survey- - The chemical and biological quality-of -rivers and estuaries has been
reported nationally every five years. The most recent survey vras performed in 1990.Anglian Region took an the role of collating chemical and biological data fran all the regions.It was essential that the results for 1990 could be canpared sensibly with the NWC Survey for 1985, at the same time as preparing the way for Statutory River Quality Objectives (Part 2.5).To achieve this, the 1990 Survey a-impd for:
■ continuity with 1985 ;15

at the same time as achieving:■ full objectivity and national consistency.
These are conflicting requirements which were only achievable by reporting two sets of results:
[a] those obtained from a Survey based on similar procedures to t those used for 1985;[b] a Survey based on the universal use of a fixed set of proce
dures, the NRA Survey.The subjectivity of past Surveys is unacceptable for quality standards which are to have statutory force. But the removal of this judgement will give a high risk of error in classification. The NRA plans three developments to reduce this risk:.
■ the assessnent will be based on three years' data;■ biological data will be used to improve precision;■ the 1990 NRA Survey will establish a baseline - a sound statement
of river quality in 1990. After 1990, using this baseline, we. . shall look for statistically significant changes in Class.Die high level of audit and reporting that have been developed in this Region allow us to adapt readily to such requirements.The Report of the 1990 NWC Survey entitled "The Quality of Rivers, Canals and Estuaries in England and Wales" was published in December1991. Die NRA survey report will be published in due course.
2.5 Statutory Quality Objectives.Following the 1990 NRA Survey, the Government will introduce Water
. Quality Objectives which will be statutory. Die results fran the 1990 NRA Survey will be used as a basis for these.The group has produced a report entitled "Proposals for Statutory Water
_ Qiality Objectives", which includes a series of recommendations and provides a basis for consultation on the implementation of Statutory Quality Objectives, for all controlled waters.Basic reccnmendations are:- \-
16

The Statutory Qiality Objective for a stretch of Controlled Water should be in three parts:
* a Target Class, based on a classification system which is expected to remain unchanged in the future;
m a set of Use-related Objectives which can he allowed to develop as new standards and new Uses are introduced; and,
* a requirement to ccnply with the Directives issued by the European Conmission.
* in addition to the achievement of Statutory Quality Objectives, the NRA should plan for No Deterioration from the existing quality of Controlled Waters.
The Statutory Water Quality Objectives will be used to plan the measures needed to secure the aims of the NRA.
2.6 River Quality IndicesAt many sites we need to assess canplianoe with the standards for over 40 different determinands. The management of this large and complex workload is aided by a system of River Quality Indices.The Indices are scores which sumnarise water quality and measure performance in managing resources for environmental monitoring (see Part 1.5).
Data are compressed into a simple number which discriminates between good and bad quality, thus reducing the effort needed to:
■ maintain an awareness of water quality;■ set targets;■ identify areas of poor quality;■ direct resources to areas of poor quality; and,■ audit sampling and analytical resources
The Indices are used to summarise information at a site, within a District or an Area, or over the whole Region. They are used by managers to direct resources to areas of concern and to ensure that the Sampling Programme covers all our obligations.Figure 2.2 shows changes in the Regional River Quality Index over the four years since December 1988. A perfect result is a score of 100 for each river, District, Area and the Region. Die target for the Region is tc See the Index riss progressively towards ICC.
17

I

80-
70-
60-
50-
40-
30-
20
10H
0
FIGURE 22REGIONAL RIVER QUALITY INDEX
SCORE
DEC'88
□ QURLITY INDEX (TRRGET 95)□ RNRLYTICRL DEFICIENCY (TRRGET 0)
z :DEC'89 DEC'90
YERR ENDINGDEC'91


The figure also shows improvements in our ability to achieve our sampling prograitme (in the reducing scores for the Analytical Deficiency).
2.7 Biological MonitoringThe role of the biology function is to understand and measure aquatic life in order to help the NRA protect and manage Controlled Waters.The number of biological samples taken f ran rivers and lakes throughout the region has increased steadily since 1988 as illustrated in table 2.4 below. These surveys examine the plants and animals found in both flowing and still-waters.
TABLE 2.4THE NUMBER OF BIOLOGICAL SAMPLES TAKEN
Year No. of Samples1988 1,6841989 3,4001990 7,4741991 8,899
2.7.1 Monitoring River QualityAnimals collected from the rivers are identified and the biological quality of that site assessed on the invertebrates detected. Seme invertebrates are indicators of high biological quality as they are sensitive to a deterioration in the quality of their habitat. These invertebrates would score highly in the MdP (Biological Monitoring Working Party) scoring system. This system is used to surma rise biological data and ranges from 0 to >150 as illustrated in table 2.5. _
TRBLE 2.5THE EMWP SCORE SYSTEM
EMtfP Score Quality> 150 Excellent
101 - 150 Very Good51 - 100 Good26 - 50 Moderate0 - 2 5 Poor
18

Changes in variety of invertebrates found throughout the year indicate not only the natural variation and life cycles of the animals, but also changes in the water quality of a river.Chemical analysis by the NRA includes the major environmental parameters that indicate changes in water quality. However there are many potential pollutants that are not assessed. Various invertebrates are sensitive to these pollutants and are therefore important indicators of specific pollution problems. Without biological monitoring sane pollution incidents or long tem changes in water quality could go undetected.
2.7.2 National Reporting SitesFor the past 12 years comparisons have been made of the biological quality of 240 sites original sampled in the 1980 National River Qiality Survey. These are referred to as National Reporting Sites. The results are shewn in Figure 2.3. The 1991 data shows a similar quality to that in 1990, and the underlying trend is one of improvement since 1982.
2.7.3 The 1991 Biological Quality SurveyIn 1991 a comprehensive study of biological river quality was undertaken. Apart frcm seme stretches that were assigned Low Amenity River Qiality Objectives (Part 2.3), all lengths were sampled in three seasons- spring (defined as March to the end of May), Sunxner (JUne to the end of August) and Autumn (September to the end of November). A total of approximately 3,300 biological sarrples was taken.A standard, nationally-agreed sampling technique was used to maximise comparability, replicability and the number of invertebrate taxa collected from each site. The regions were assisted in Analytical Quality Control by the Institute of Freshwater Ecology (IEE). A random selection of samples were re-examined by IEE and the results sent back to each Senior Biologist in the Region. From this independent audit of the results the errors associated with each sorter were quantified and problem areas identified and then resolved.The results of the 1991 Biological Survey using the National Classification system (See section 2.7.6.) are shown in table 2.6. Die survey suggested that over 52% (3212 km) of the river length in the Anglian Region is of Class A quality. The total length of river sampled biologically has increased since 1990 and the percentage of river length in each Class in 1991 is similar to that in 1990.
19

140-
FIGURE 2.3BIOLOGICAL QUALITY OF RIVERS (BMWP SCORE)
DERCENTRGE OF SITES
120-
□ 0-50□ 51-100□ >101
100—
80-
60-
40-
2 0 -
V
81/82 82/83 83/84 1984 1985 1986 1987 1988 1989 1990 YERR
1991


TABLE 2.5 THE 1991 BIOLOGICAL SURVEY
1990 survey km %
1991 survey km %
Class A 2983 51.7 3212 52.8Class B 1917 33.2 1954 32.1Class C 696 12.1 782 12.8Class D 178 3.1 139 2.3Total 5774 6087
In order to classify the rivers using the data fran the 1991 Biological Survey a computer model called Rivpacs has been used.The biological classification of rivers in Anglian Region is shewn in one of the maps enclosed with this report.
2.7.4 RIVPACSRIVPACS (River Invertebrate Prediction and Classification System) is a computer package, developed by the Institute of Freshwater Ecology. It has two main aims:-
■ classification of the rivers in Great Britain, according to the invertebrates found; and,
■ the prediction of the invertebrates that should be found given a set of environmental variables.
Within RIVPACS is an existing river classification system based an 438 unpolluted reference sites using biological and erwiranraental data. The environmental data includesfor example, the "depth" and width of each river. Data can then be compared with this classification system enabling the rivers throughout Britain to be classified.When the environmental variables of a site are fed into RIVPACS, it is able to predict the variety of invertebrates that should be found and the EMWP score. These predictions assume the site of sampling is unpolluted. If the BMWP predicted by RIVPACS is lower than the observed value, the results suggest that scare form of pollution may have occurred.The range of applications of RIVPACS includes:-
■ Invertebrate predictions for sites which are polluted can be used20
as a baseline against which an assessment of inproveroents in water quality m y be made.
■ If a previously unsampled site suffers fran a pollution incident, RIVPACS can predict the taxa which nay have been eliminated.
■ RIVPACS can be used in the formulation of conservation strategies by cataloguing site invertebrates.
■ The interpretation of national and local river quality survey results can be enhanced by using RIVPACS to predict BMWP statistics in the absence of pollution.
■ Invertebrate predictions for sites that may have been affected by, for example, land drainage operations or water transfer schemes, will enable an ecological assessment of the affected rivers to be made.
7.5 National Biological Classification Systemr
RIVPACS has been used to develop a banding or classification system of the rivers of Great Britain, based on the results fran the 1990 Biological Survey.For each site a BMWP score, ASFT and number of BMWP taxa rere determined. These observed values were then canpared to the predicted values produced f ran RIVPACS. The ratio of the observed and predicted values produced an Ecological Quality Index (EQI) for each of the three variables.
Observed valueEQI = --------------- — ---
Predicted value fran RIVPACSTherefore, for each site sampled, three EQI values were determined.EQI (EM«P Score) . )EQI (ASFT) ) EQI variablesEQI (No- Taxa) .)An EQI value of 1 for each determinand would indicate that the site was not polluted or suffering fran stress of any kind. An EQI value of 0 indicates that the site is grossly polluted and sustains little or no aquatic life. The EQI variables provide a useful management tool. Given a set of environmental variables, the environmental stress of a particular site can be quantified.The EQI's determined for each site enabled a banding system to be established to classify Britain’s rivers..The biological classes, or bands, A to D, are based on all three of the
21

EQI variables. The statistical 10-percentile is used for EQI (BMWP Score) and EQI (No. Taxa) and 5-percentile for EQI (ASFT). This statistical bias was incorporated because of the greater statistical con- fidence in the ASFT score. The ASFT is independent of both an increase in diversity of the nacroinvertebrates found at a site and sample size.The banding criteria are described below:-
Biological Class EQI(ASFT) EQI (TAXA) EQI(a**P)A >0.89 >0.79 >0.75B 0.77-0.88 0.58-0.78 0.50-0.74C 0.66-0.76 0.37-0.57 0.25-0.49D <0.65 <0.36 <0.24
A class is determined for each variable and the overall class of the site is the median of the 3 results. For example, B, B, C, results in class B; B, A, C, results in class B. However, if the lowest EQI is that for ASFT, then this will be the final class, eg. C (ASFT), B (TAXA), B (BMWP), then the overall class will be C.Each site will represent a stretch of river, so that the class of the site sampled truly reflects that of the allocated stretch. In this vray the river lengths of the Region can be classified according to their biological quality.
2.7.5 Other Biological SamplesThe work carried out in 1991 is sunnarised in Appendix I. This indicates the wide range of sample types collected.
2.8 EC DirectivesThe nanaganoent of river water quality is affected directly by several of the European Cannunity Directives. The Directives contain-a- variety of requirements with- respect to monitoring, reporting, consenting and other water quality control measures. They have a major Impact on the planning of our monitoring progranme. Their role as a basis for justification of inprovsnents, e.g. through the regulation of discharges, is becoming increasingly prominent.Sane Directives have been in force for many years, the most important being those relating to:
■ Dangerous Substances in Surface Waters;■ Dangerous Substances in Groundwater;
22

■ Surface Water Abstracted for Drinking Water;■ Freshwater Fisheries.
During 1990 and 1991, new Directives of significance to water quality matters were adopted and their requirements will come into force progressively over the next few years. These were directives relating to:
■ Urban Waste Water Treatment;■ Pollution of waters by nitrates fran agriculture;■ Harmonisation of reporting an environmental Directives;■ Freedom of access to information an the environment.
These new Directives are relevant to estuarine /coastal waters as well as rivers/groundwaters but are described in detail here.
2.8.1 Dangerous Substances in Surface WatersThe Dangerous Substances Directive contains two lists of pollutants and outlines the approach to be adopted in controlling discharges containing the substances in each. List I Includes materials which are particularly toxic, persistent, and which accumulate in the environment. List II covers pollutants with less serious potential effects. The objective is to eliminate pollution from List I substances and to reduce pollution from List II substances.
2.8.1.1 List 1 SubstancesEnvironmental standards have currently been set for lindane, cadmium, mercury, the drins (dieldirin, aldrin, endrin, isodrin), pen- tachlorophenol, DDT, carbon tetrachloride, chloroform, hexachlorbben- zene, hexachlorobutadiene, trichloroethylene, trichlorobenzene, tetrachloroethylene, and 1,2 dichloroethane.The Directive applies to discharges to both fresh and saline surface waters. Vfe have to provide lists of significant discharges, monitor the receiving waters, and report annually to the Government (DbE) (which then reports to the Ccnmissicn). We also have to control, through' issuing and reviewing consents, all significant discharges of listed substances.In addition to monitoring for List I substances at discharge-related sites, background monitoring known as National Network monitoring was carried out as required by the DoE. This is undertaken nainly at the tidal limits of major rivers. In mid-1990, the DoE extended the National Network monitoring to cover all List I substances (although the Direc-
23

tive specifies only cadmium and lindane). Our sampling regime was extended to acncnroodate this change.With regard to the discharge-related receiving water sites:[a] There were no failures to meet the Directive quality criteria in
any of the 5 freshwater sites designated under the Mercury Directive, nor the 22 sites for the Cadmium Directive.
[b] Of the four freshwater sites designated under the Lindane Directive, two failed the quality standard. Both sampling sites are in small dykes affected by drainage fran the premises of Calders and Grandidge near Boston which suffers fran historic contamination by timber treatment chemicals. We are maintaining close contact with the company who are to commit major capital investment to tackling the problem. One boundary of the site has now been sealed. A treatment plant is being considered to treat the collected site drainage and greatly reduce concentrations entering the small dyke. There have been no problems detected in the Witham Haven downstream.
[c] The single freshwater site designated under the Carbon Tetrachloride Directive passed the standard.
[d] There are no freshwater sites in this region designated under the Bentachlorcphenol and DDT Directive.
[e] Under the Drins Directive, four freshwater discharge-related sites were monitored against the water quality standards. Twd of these sites exceeded the criteria, these being in the tw small dykes related to the Calders and Grandidge premises where problems are being addressed as described in [b] above. There were no problems at sampling sites further downstream.
The remaining substanoes in the Drins Directive are Hexachlorobenzene (HCB), Hexachlorbbutadiene (HCBD) and Chloroform. For these, 1991 was the last of two years extra background monitoring agreed with DoE. This monitoring was undertaken at our Harmonised Monitoring sites._ No. in- - dustrial discharges, either-direct to river"or~to sewer have been identified as containing HCB or HCBD. For chloroform, two consents were issued In late 1991 and the receiving waters will be monitored during1992.The environmental standards for the chlorinated solvents (trichloroethylene, trichlorobenzene, tetrachloroethylene, and 1,2 dichloroethane) are not yet in force. The Carmission will require the first monitoring data in 1994. We will be undertaking investigational monitoring during 1992 to identify whether there are any discharges of these substances in our Region.
24

2.8.1.2 List II SubstancesDuring 1991 there were around 70 discharges to freshwaters which contained List II substances. Monitoring of the receiving waters was undertaken as required and the following sites exceeded (or nearly exceeded) their national quality standards:[a] The Willow Brook at Corby failed for zinc. A work programme has
been agreed with the industrialist responsible for the discharge. A new consent will be issued upon completion of the control measures.
[b] The Hog Dyke was a borderline pass for copper. This receives the discharge f ran Raunds StfW and a review of the consent is being undertaken.
No failures of the national freshwater quality standards were detected with respect to any other List II substances.
2.8.2 Groundwater DirectiveThis Directive relates to the protection of groundbrater against pollution caused by certain dangerous substances. It effectively prohibits the discharge of List I (the most dangerous) substances to groundwaters and limits the discharge of List II (less dangerous) substances. The lists of substances differ sanewhat fran those for discharges to surface waters. No annual reports have yet been requested by DoE for this Directive (but see 2.8.7).In October 1990, the DoE issued two documents relating to the Directive, these being:[a] DoE Circular 20/90 which gave guidance and information on the
classification of listed substances for the purposes of the Directive. A stricter approach to the oontrol of substances emanating fran waste disposal sites was prescribed.
[b] A DoE consultation paper on Government proposals for a national classification scheme for listed substances with respect to the Directive. Ibis contained more specific rules than circular 20/90. and it was proposed that the NRA should carry out the classification of substances.
A seminar on groundwater protection, involving the Cannunity Environment Ministers, was held at The Hague in November 1991. A Declaration was issued after the conference. The Ministers recognised the vital importance of groundwater as a resource. They noted the wide range of threats to those resources and that Community legislation was inadequate for providing the necessary protection. They agreed that an action progranme was required to prevent deterioration of groundwater quality, restore quality where appropriate, prevent over-exploitation, and replenish the
25

system where necessary. The need for an Integrated approach was stressed, requiring management of surface and groundwater quality as a whole. Further to the seminar, the Council issued a Resolution asking the Canmission to draw up an action programme by mid-1993, and to progress amendment of the Groundwater Directive to incorporate it within a general freshwater ranagesnent/protectian policy.Groundwater protection is apparently moving up the agenda of the Can- munity environmental progranroe. The proposals will considerably extend Caimunity legislation in this field.
2.8.3 Surface Water DirectiveUnder this Directive, surface water abstracted for public water supply has to carply with water quality standards which depend upon the type of water treatment provided. So far, the DoE has not asked us to report an this Directive, but this will change when the new Harmonisation of Reporting Directive (see 2.8.7) comes into force. We run audits throughout the year to check an aanplianae with the water quality and sampling requirements, and periodic internal reports are produced.IXiring 1991, we contributed to an ongoing national exercise to provide DOE with information on abstraction points. The DoE will use this information in deciding which points to designate for the purposes of Statutory Water Quality Objectives in relation to this Directive (see 2.5).
2.8.4 Freshwater FisheriesThis Directive specifies water quality standards for the protection of game and coarse fisheries. In Anglian Region, 400 km of game fishery and 950 km coarse fishery have been designated under the Directive.We did not have to report to Doe an this Directive in 1991, but periodic internal audits were carried out. There were a few exceedences of the
__ standards, with dissolved oxygen levels causing most failures. - - -
2.8.5 Urban Waste Water TreatmentThis Directive, adopted in May 1991, requires the construction of sewerage systems and sewage treatment facilities, and the achievement of minimum effluent standards. The stringency of the requirements for specific discharges relates to the size of the population served by a given treatment works, and also to the type and sensitivity of the receiving waters. Nutrient removal treatment will be required in cases where discharges are considered to contribute to eutrophication of the receiving waters, or to elevated levels of nitrates in waters abstracted for drinking. Implications for the Water Services corpanies and the NRA are considerable. This Directive will affect discharges to all surface
26

I
waters (fresh and saline). A considerable degree of interpretation and ongoing development is needed for aspects of this Directive. Anglian Region has node a significant contribution to this development wrk.
2.8.6 Pollution of waters by nitrates fran agricultureiThis Directive concerns the protection of surface and groundwaters fran
pollution by nitrates from agricultural sources. It was adopted in December 1991. The requirements come into force over the next few years. IThe Directive requires Member States to identify (by December 1993) waters affected by nitrogen pollution. These are surface waters with elevated nitrate levels which are abstracted for drinking water, groundwaters with elevated nitrate, and waters which are eutrophic due to high nitrate levels. The NRA is undertaking the monitoring required ^ for this procedure in accordance with a Direction fran the Secretary of m State. Ongoing monitoring will be required to allow a review of affected waters every four years.
i
27
I
I
Once the "polluted" waters have been identified, vulnerable Zones will be designated (also by December 1993). These are areas of land draining to the affected waters. Action programmes must then be established and implemented within vulnerable Zones within six years of zone designation. This will comprise measures to reduce water pollution by restricting agricultural activities. Such restrictions will be irandatory. In ad- _ diticn, a voluntary code of good agricultural practice must be intro- I duced. This will apply to all farmland, not just land within zones, and will be aimed at achieving a general level of protection for all waters.Reports must be submitted to the Camdssion every four years, on implementation of this Directive, including a summary of the water quality monitoring results.
2.8.7 Hanncnisation of Reporting on Bivironmental Directives
i
I
i
i
This Directive was adopted in December 1991. It will standardise the format of reports, and the timescales for reporting on the environmental Directives. TSie full details and implications are not yet clear as the Caimissicn is still negotiating with Member States over the precise requirements for each Directive. It seems certain, however, that reports will be needed more frequently than in the past, and that the required (« content of seme reports will be considerably more onerous than under the I current arrangements. The implementation of this Directive will result in a higher profile for monitoring in respect of certain Directives eg the Surface Water Abstraction Directive and the Groundwater Directive.The first "standardised" reports will cover the period 1993 to 1995. i
i
i
i
i

2 .8.8 Freedan of Access to Infornation on the EnvironmentThe objective of this Directive, adopted in June 1990, is to ensure freedom of access to, and dissemination of, information on the environment held by public bodies. It sets out the basic terms and conditions on which such Information should be made available. The Directive covers information on all environmental waters and must be implemented by 1993. The Government is currently undertaking a consultation exercise on proposals to implement the Directive.
2.8.9 Proposed DirectivesThe following proposed environmental Directives are currently undergoing consideration and development:
■ Ecological Quality of Surface Water;■ Tandf i 11 of Waste;■ Hazardous Waste;■ Conservation of habitats and wild flora/fauna (adopted May 1992).
Progress on these Directives will depend mainly upon the political will of the Member State which holds the presidency of the Conmission (for the second half of 1992 this will be the UK).
2.9 Pollution IncidentsThe reporting of incidents which result in pollution ocnmenoed in 1974. In 1991 a new, oenputer based, system of recording pollution incidents was introduced in this region. The system, called FOLLEASE, enables district field staff to enter details of an incident onto computer as they investigate it. At regular intervals details of all completed investigations are copied to a computer at Regional Headquarters to enable regionwide statistics to be compiled. __ _____ - -------A certain number of incidents which are reported to the NRA turn out, upon detailed investigation, to be due to factors other than pollution. For example natural, temperature induced changes in river conditions, may have been the cause of the reported incident. In April a new category, "no pollution”, was introduced to take account of these incidents.The total number of reported pollution incidents in 1991, including those where no pollution was found, was 3,004. When those incidents in the "no pollution" category are excluded the figure is 2,141, an increase of 14% on 1990's figures. Figure 2.4 shows the number of pollution incidents reported annually since 1974.
28


FIGURE 2.4NUMBERS OF POLLUTION INCIDENTS
800
600
400
200
1 0 0 0
Industrial Chemicals Organic Industrial Waste Agricultural Pesticides Organic Farm Wastes Oil and Related Products Untreated Sewage Miscellaneous
0 *--- ----------------------------------------------— ------------ — J1974197519761977197819791980 1981 198219831984198519861987198819891990 1991


Amongst the biggest pollution incidents during the year were:-» A spillage of timber preservative contaminated a stretch of the
River Flit fran Flitwick Moor to Clophill. A biological survey showed that there had been a major impact cn invertebrates both in the stream across the moor, and in the river. Successful prosecution.
v The Pike Drain in Lincoln was contaminated by a discharge of 200 litres of turbine cleaner. Several thousand fish fcere killed including eels, dace, roach, and gudgeon, as wsll as small fry and sticklebacks. Successful prosecution.
ff About 1,000 fish (mostly pike, roach, chutb, eels and carp) died due to extremely high levels of anmonia in polluted effluent fran a bakery supplies manufacturer. The effluent, from a site at Needham Market, affected 3km of the River Gipping. Not prosecuted.
• A public water supply borehole at East Harling was taken out of service by Anglian Water Services Ltd because of high levels of herbicides in the water. The source of the pollution was unclear. Prosecution inappropriate.
ff Liquid fertiliser fran a local farm contaminated a 100m stretch of the River Kym at Kimboltcn. About 150 fish, mainly roach, bream, and gudgeon were killed. Successful prosecution.
8 High concentrations of airtnonia in the River Ancholme at Cadney lead to the closure of the Cadney intake. Hie contamination was possibly caused by the draining of a pond upstream of the intake. Prosecution inappropriate.
The total number of reported incidents was higher in 1991 than in 1990, despite the mainly dry conditions. Dry weather tends to reduce incidents associated with storm discharges and run-off. The definition of accurate trends in pollution incidents within regions, and explanation of differences between regions is a difficult, perhaps invalid, exercise because of the volatility of the statistics.Better legislative powers-and our growing effectiveness at pollution prevention will tend to reduce incidents and their inpacts .“ However, as our monitoring becomes even more effective, and public awareness continues to grow, so we may see greater numbers of incidents being reported. We would expect these to be in categories of less significance.We also expect to find more evidence of historic and on-going chronic pollution, such as that in the Helps tcn/Ettcn area (see 2.13), because we are now looking harder for it.Figure 2.5 gives a breakdown of incidents resulting in fish mortalities. Despite the relatively hot, dry sumner, with low flows, numbers were not
29

I

FIGURE 2.5NUMBER OF POLLUTION INCIDENTS RESULTING IN FISH MORTALITIES


exceptionally high; although there is a slight increase carpared with1990.
2.10 Prosecutions
Under Section 85 of the Water Resources Act (1991) it is an offence to "cause or kncwingly permit any poisonous, noxious or polluting matter or _ any solid waste matter to enter any controlled waters". Prosecutions , are normally brought only where serious pollution has occurred or some . negligence or deliberate act was involved and where sufficient evidence can be accumulated to mount a successful case.
This means that the number of prosecutions is a small fraction of the total number of pollution incidents. Hie cases brought to court in 1991 are listed at Appendix II and the trend in the number of prosecutions each year is shewn in Figure 2.6. In 1991 45 prosecutions were undertaken, the highest number in any year, and all categories showed an increase in prosecution when compared with 1990.
Biological data is often prepared for use as evidence in court. It provides evidence on the nature and toxicity of the pollutant, and the source and extent of the waterway affected, together with the recovery rate of the biota.
In addition to prosecutions, the NRA is able to issue a Rrnnal Caution. These are issued in respect of pollution incidents where it is inappropriate to prosecute but it is clear that an offence has been committed. Such a caution, whilst not leading to court action, does require the alleged offender to acknowledge their guilt. A list of formal cautions issued in 1991 is produced in Appendix III.
2.11 Groundwater
Half of the drinking water supplied in the region is taken from groundwaters, which in most cases require treatment only by disinfection. In addition there are thousands of abstractions for agricultural and industrial water supplies and many wells are used for private supplies of drinking water.
Protecting the quality of groundwaters is of great importance, particularly because groundwater pollution is very difficult to remedy cnoe it has occurred. In areas where the aquifer is overlain with clay or other impermeable strata, pollution spilling onto land poses greater immediate risks to rivers then to groundwaters.
2.11.1 Monitoring
Many of the boreholes which gave us water quality data for groundwaters are now owned by Anglian Water Services. Work is continuing on the definition of the NRA Monitoring Network.
30

FIGURE 2.6NUMBERS OF PROSECUTIONS FOR POLLUTION INCIDENTS
50-
40-
30-
20-
10-
0 -
Z I
A A
□
□
n□
OrganLc Farm Wastes Organic Industrial Waste Rqrlcultural Pesticides & FertilizerOilIndustrial Chemicals Untreated SewageMiscellaneous
A
t"7^1
F
A A A
r
7A
A
/
-
1978 1979 1980 1981 1982 1983 1984 1985 1986 1987 1988 1989 1990 1991


About 500 points are routinely monitored to provide information on groundwaters. Analytical sets range fran those for the chlorinity and overall ionic strength of the water, to complex lists including metals, pesticides and microbes.
National guidelines are being drawn up for monitoring groundwaters. If implemented as policy, they will require extra resources for our Region.
.11 .*2 Protection * :
Policies on Aquifer Protection will give priority to protecting areas where the aquifer :-is exposed directly to the land surface. A regional policy was produced in 1989 and is referred to in dealings with planning authorities. A draft national policy was offered for public consultation in December 1991. The responses are being considered for incorporation into the final document.
Through the waste disposal site licensing authorities (County Councils),- we are increasing .the pressure an site operators to prevent leachate- reaching Controlled Waters.'. For example, major remedial vrorks at waste
disposed sites have been completed around Paxhall, . and are underway at Kesgrave, both near . Ipswich and work is about -to . ocnmenoe at Wangford, south of Lowestoft. A x- .
Our staff are working -very closely with County Councils to investigate and improve the situations around a number of contaminated sources. We have investigated a number of reports of groundwater contamination, for
. example at boreholes at East Harling’ (herbicides), Rendlesham (herbicide), and Trowse Newton (chlorinated solvents).
Further investigations have been conducted of polluted groundwater around a public water supply borehole at Etton, near Peterborough. One pollutant, a herbicide, has been traced back to a series of landfill
.. sites which lie to the ‘south west _of the borehole. Although the pol-• lutant is adequately removed from the groundwater at the site of the --borehole using Granular Activated Carbon, we intend to pursue options to
- prevent further pollution occurring; and to clean up the “existing cbn- . tamination. - - .. > * "
In respect of chlorinated solvent pollution of groundwater at Sawston, Cambridge Water Company , lost their civil-action against those responsible. They are appealing against the decision/
Following contamination of the Public Water Supply borehole at Beck How a groundwater scavenging system was installed by the Property Services Agency. The groundwater is treated by air-stripping, and then discharged to sewer.
31

2.12 Nitrate
2.12.1 Nitrate in Rivers
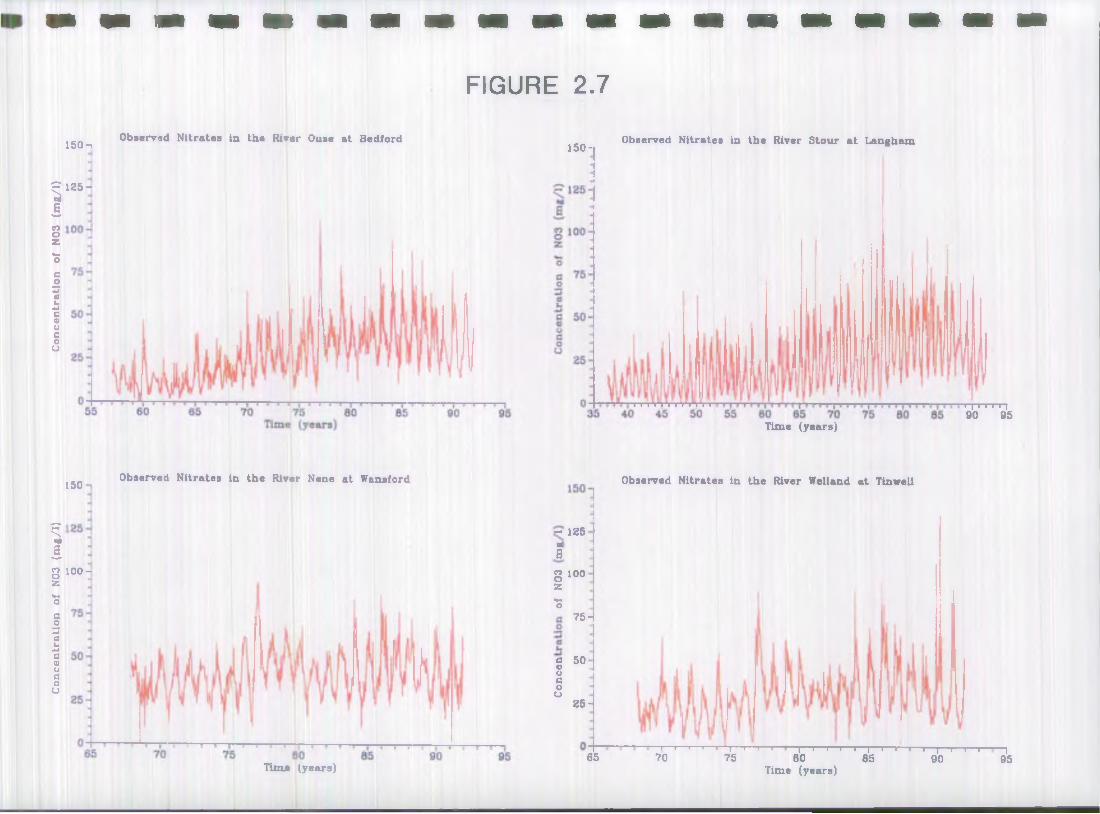
Concentrations of nitrate in rivers vary with site and season. Figure 2.7 illustrates this variability and shows trends at four major surface water abstraction sites in the region.
The technique known as Multiple Regression has been used to identify trends, and to relate nitrate concentrations to river flews. The method has been used to predict future levels of nitrate in our rivers and reservoirs. The results indicate ttat average concentrations .of nitrate in surface waters may continue to rise by 1 mg N03 per litre per year. However, Figure 2.7 suggests that since 1976 the upward trend appears to have levelled off.
2.12.2 Nitrate Sensitive Areas
The water Resources Act allows for the designation of Nitrate Sensitive Areas (NSAs) in which it is desirable to reduce the leaching of nitrate
.... in ground and surface waters.. In 1990, following notification by the NRA of candidate areas and consultations with fanners, the Ministry of Agriculture, Fisheries and Food (MAFF) established 10 NSAs of which 2 are in Anglian Region. These are at Sleaford and Branston Booths, near Lincoln. Nine further areas were identified as nitrate advisory areas (NAAs), of which 5 are in the Anglian Region.
. In conjunction with the water companies (whose borehole sources are being protected by the NSAs and NAAs), we are monitoring nitrate concentrations within the NSAs and at abstraction boreholes. Results of this monitoring are sent to DoE and, through MAFF, to the farmers involved. (See Figure 2.8):-. \
Tte scheme is voluntary and runs for five years fran 1990. Farmers are given small compensatory payments for the relatively modest changes in fanning practice in the "basic scheme". Larger payments are given for major land use change in the "premium scheme". Virtually 100% of land in the Branston and Sleaford NSAs is included in the "basic scheme". In addition, 13% and 33% respectively is also in the "premium scheme".
IXie to the very dry winters in 1990 and 1991 it has not been possible to get a true estimate of the effectiveness of the NSA measures. The decline in nitrate since 1988 is believed to be due to the effects of the drought causing less nitrate to be leached frcm the soil.
2.13 Blue-Green AIgae
Routine monitoring programnes were established during 1989 and 1990 to
32
Conc
entra
tion
of N03
(m
g/1)
Conc
entra
tion
of N03
(m
g/1)
FIGURE 2.7
150 —»
1 2 5-
Observed Nitrates in the River Ouae at Bedford 150 -I Observed Nitrates in the River Stour at Langham
M ' ' » M 90 95Time (years)
150
100 -
Observed Nitrates in the River Nene at Wansford
-125OiB
g 100 zV*O
Observed Nitrates in the River Welland at Tinwell
7 5 -
a 50 uoaou 25 i
Time (years)65
—i—i—i—i—i—i—i—i—r 70 75 — |— i— i— i— I— |— i— i— i— i— |— i— i— r80 85 90Time (years)
~l95


g/L
(N0
3)
1 0 0
FIGURE 2.8BRANSTON BOOTHS - NITRATE CONCENTRATIONS
1970 1976 1982 1988 1994 2000
DATE


assess the occurrence of blooms of potentially toxic blue-green algae. In 1991 a different sampling strategy was adopted which was aimed at reducing the extensive routine monitoring programmes and concentrating efforts on resolving the problems.
The 1989 and 1990 programmes had effectively identified a large number of high priority waters that are most likely to develop blue-green algal problems in later years. Since lake ecology does not change greatly from year to year and fluctuations in algal populations are largely weather dependent, the Toxic Algae Task Group, set up during the summer of 1989, considered it unnecessary to repeat extensive routine monitoring programmes each year. Instead it was considered that algal problems are likely to re-occur each year and that owners should take the necessary precautions to prevent recreational and amenity users from coming into contact with blooms and scums and to contact the NRA when they do arise.
Hie 1991 programme was designed so that reactive sampling of waters that were not sampled, or did not contain "abundant" populations of blue- green algae, daring the routine monitoring programmes of 1989 and 1990, was carried out. This meant that resources could be channelled to developing methods and recommendations for resolving the blue-green algal problems and preventing further incidents. Die Task Group is currently working on guidelines for the development and implementation of "Action Plans". Haase plans aim to provide information for control options and work necessary to enable more effective management actions to be taken for specific water bodies of high priority.
Media coverage in the region was extensive, testimony to the fact that toxic blue-green algae are still a key issue. Clearly there is still a need to maintain detailed records of the incidence of blue-green algal problems and the events of toxicity.
In Anglian Region 28 waters were sampled for the first time on a reactive basis during 1991. Of these 12 contained populations of potentially toxic species at levels sufficiently high to warn owners that blocms of blue-green algae could occur. Fourteen waters contained scums and/or blocms.
Anglian Water-Services have continued to dose IT reservoirs with ferricT sulphate to reduce phosphorus levels and problems with blue-green algae. Hie NRA has monitored the effects of ferric sulphate dosing on the benthos and plankton of Rutland Water, Pitsford Reservoir, Covenham Reservoir, Grafham Water and Foxcote Reservoir.
In order to underpin Action Plan development an extensive research programme has been progressed which includes the following:
□ development of a model to determine factors responsible for algal growth;
□ production of a "field kit" to test whether or not a blocsn or scuui is toxic;
33

■ establishment of a library of toxins in British freshwaters;
■ identification of factors that control the production and release of toxins;
■ provision of information on what happens to toxins in the environment and whether they are taken up in the food chain.
Research and development projects are progressing well and a field test kit for detecting microcystin-LH toxicity should be ready for testing in 1992. Microcyst in is the most carmanly occurring blue-green algal toxin. A one year study to develop an analytical method for the detection of Microcystin will be completed in 1992.
2.14 The Norfolk Broads
The NRA is continuing to work with the Broads Authority and English Nature, to restore the water quality of the Norfolk Broads by reducing eutrophication. Like many other shallow lakes in Europe, the Broads have proved more resilient to change, following the successful reduction of phosphorous inputs, than had been expected. The reasons for this are being investigated by a research programme jointly funded by the NRA and the above organisations. IVo factors have been identified as important, the release of phosphorous fran the sediment and a complex series of biological interactions which tend to stabilise the late acmnunity in its present, algal dominated state.
Hie results of this research are being used to carry out a range of experimented management techniques designed to overcome these problems. Lew doses of iron salts have been added to an area of one of the Broads to control the release of phosphorous fran sediments, and a number of large scale temporary fish removal experiments have been established. Similar work is being carried out on a number of other lakes in mainland Europe. Contacts with the organisations responsible for this vrork have been established to ensure the exchange of information and ideas. During the year a new initiative to examine the role of nitrogen in eutrophication of these lakes has also been initiated.
By collaborating with other agencies and combining a carefully planned monitoring programme with specific laboratory and whole lake experiments the NRA has been able to make significant advances in understanding the management of shallow eutrophic lakes. This information is being used to develop a restoration strategy that will progressively improve the water quality of the area and continue to further our understanding of the complex processes that influence it.
2.15 Pesticides
Pesticides are used to control insects, weeds, fungi, and so on, in both
34

agricultural and non-agricultural situations. Their use results in lew concentrations of unwanted chemicals in surface and groundwaters.
In sane cases Water Canpanies have notified us that pesticide concentrations have exceeded the standard specified in the EC Drinking Water Directive. Most of these exceedences were caused by two persistent herbicides predominantly used for amenity weed control on roads and paths. Hie major users of these herbicides, such as local authorities, were approached. When the pollution problem was brought to their attention many agreed to change to less persistent alternatives.
We have made contributions to a number of national guidance documents for pesticide users. These are aimcrf at ensuring oorrect storage, use and disposal of pesticides whilst minimising the risk of water pollution. This is in line with the general principle of Best Environmental PracticeSpillages of pesticides can result in significant pollution incidents, even in small quantities (see 2.9) and disposal can give rise to significant contamination of water supplies.
16 Catctnient Management Plans :
A river catchment is the geographical area fran which the river system derives its flew and water quality. It includes associated groundwater, coastal, and estuarine waters. The size may vary between 500 and 5,000 square kilaoetres. — .
The river is influenced by climate, land-use, geology, soil-type, vegetation, and the density and economic activity of the population within its catchnent. These factors determine the rates of input and loss of water, and the input and removal of both dissolved and suspended loads.
Hie interplay of forces and processes determine the quality of a particular length of river, and, to a great extent, the uses to which it may be put. These uses are recognised as Environmental Quality Objectives (See 2.3).
Hie concept of Integrated Catctment Management attempts to balance the sanetimes conflicting demands on a river system, such as drinking v&ter supply and waste disposal, water abstraction and amenity usage. The objective is to oversee activities which impinge on the use of water and to intervene where necessary to balance interests.
To put the concept into practice, all interested parties contribute to a process of review of both the existing state of the catchnent, and of anticipated future changes.
This consultation process is being effected by the NRA by the production of Catchment Management Plans. These identify present and future uses of water and associated land,, land drainage and flood defence activities.
35

I
Standards are defined for each, with particular attention to the NRA's™ statutory duties. Areas of conflict are identified and an action plan formulated to meet the various objectives. Consultation is made as wideA as possible, with specific reference being irade to local authorities,® sewerage and water undertakers, conservation groups and trade organisations. Statutory committees (Regional Rivers Advisory Carmittees) ares consulted first and help to identify conflicting needs. I
Priority is being given to catchments :
■ where conflict exists between users of the water within the catchment;
■ where present objectives are not being met; and,
■ where significant development is being planned which could have a major impact on the water environment.
In 1991, the process was initiated with the publication of a draft plan for the catchment of the River Cam. A plan was also prepared for the coastal catchment surrounding Louth in Lincolnshire which covers the Rivers Long Eau, Great Eau, Waithe Beck, Louth Canal, Steeping and hynm.
After the draft plans have been ccnmented upon and revised, definitive plans will be published which will form the basis for NRA management decisions. It is envisaged that the plans will look forward at least 10 years and be reviewed at five yearly intervals.-
2.17 Mathematical Modelling
SIMCAT, our river water quality model, describes the quality of river water throughout a catchment. SIMCAT is used to help to plan the measures needed to improve water quality. SIMEAT has special features which enable it to produce results quickly whilst controlling the effect on decision-making of the statistical uncertainties associated with water quality data.
Data files have been produced for the following rivers:
Blackwater, Chelmer, Gipping, Great Ouse, Ivel, Little Ouse, Mardyke, Nene, Stour, Thet, Waveney, Welland, Wensum, Wid and Witham.
The WRC nitrate model for the Central Lincolnshire Limestone has been used to examine the impact of changed land-use with the two Nitrate Sen- sitive Areas (See part 2.12). Predictions have been run forward for 50 years.
The results suggest that the land-use changes which have been implemented will have little effect on levels of nitrate within the aquifer. Further work is planned to check assumptions Trade and mechanists used in the model.
36

Fart 3: ESTUARIES & COASTAL WATERS
There were no significant changes in estuary water quality during 1991. Most lengths of estuary are of good quality although there are localised areas of pollution around sane outfalls. All estuaries support fish life and allow the passage of migratory fish, principally eels.
The coastal waters of the Anglian Region have same of the strongest tides in the whole of the North Sea. In seme areas the tidal range (the difference in height between low water and high water) can be as much as 7 metres.
These tides ensure that discharges axe rapidly diluted and dispersed. Also, there are relatively few discharges of industrial or sewage effluent to coastal waters compared to rivers and estuaries. As a result the quality of coastal waters is good.
3.1 Monitoring
Routine sampling for water quality in estuaries and ooastal waters vras performed at over 100 sites during 1991, including monitoring at the 33 identified Bathing Waters. A further 150 sites were sampled for special surveys. Hhe total number of samples collected was in excess of 3,000.
Die frequency of sampling ranged fran annually to weekly.
Samples of sediments were mainly collected for investigations of discharges which might contain Dangerous Substances, and as part of the Humber monitoring progranme. The frequencies ranged fron one to four per year.
Samples of shellfish were collected from several sites in the Wash to monitor the bacteriological impact of sewage effluents on the fishery and to gather information for the Shellfish Hygiene Directive.
Biological monitoring was performed on all of our major estuaries and at several sites on the coastline. The numbers of samples are given in Appendix I.
3.2 Classification of Estuaries
Estuaries are classified on the basis of quality, according to the system devised by the Department of the Environment and the National Water Council. This is called the Classification of Estuaries Working Party (CEWP) System after the working party which set it up. The CEWP System is highly subjective and is being re-evaluated by a national working group.
37

- A surnnary of the results for 1991 is given in Figure 3.1 with data for previous years for canpariscn. Most lengths of estuary are in Class A with 25% of Class B and 7.5% of Class C. There is one snail length of Class D (in the Orwell).
.3 EC Directives ■ - _ - ... •.>. .
Hie principal long-standing Directives affecting saline waters are those relating to: ~
■ s:, . . r / r - c r . . o - r .v* iij ■■ Dangerous Substances in Surface Waters;. :
■ Shellfish Waters;
..f / ■ Titanium Dioxide; • . ^
■ Bathing Waters.- "... —
IXiring 1990 and 1991, new Directives of significance to water quality matters were adopted and their requirements will come into force progressively over the next few years. These were directives relating
~:-to: ; . ~ - tu-..: : - . . v v . X ; . ......... . . . -1 r-.' 'V . ' ‘ ’
. Urban .Waste Water Treatment; ._• ^
■ Shellfish Hygiene;
■ Polluticn of waters by nitrates from agriculture;t “ . . r r* f * ‘ *
■ Harmonisation of reporting on environmental Directives;v :1' 1. .-"I.. ..'v .-’t r.- > ’
■ Freedom of access to information on the environment.
The situation for 1991 is surrmarised below:
.3.1 Dangerous Substances in Surface Waters
i The scope and objectives of this Directive are.outlined in 2.8.1.
All the discharge-related saline water monitoring sites passed the Directive List I quality standards. There were four sites for Lindane,
four for Mercury, five for Cadmium, one for Pentachlorophenol, and one for the Drins (Aldrin, Dieldrin, Endrin, and Isodr in). We also undertook background monitoring for List I substances, as required by the DaE.
Downstream monitoring of saline waters in relation to 15 discharges oon- l taining List II substances was undertaken.: Five sites exceeded the .. . relevant national quality standards, these being:
_ 38--------

FIGURE 3.1ESTURRIRL WRTER QURLITY
KMS
CLRSS R CLASS B CLRSS C CLRSS D


■ The Blackwater estuary at Fullbridge for zinc;
■ The Orwell estuary at Woolverstone Marina for zinc and copper;
■ The Humber Estuary at South Killingholme for copper; and,
■ Penn Creek (R. Crouch estuary) south of Eyotts Farm for copper.
No obvious cause for the zinc exceedences has been identified but the use of dissolving zinc anodes on pleasure craft is a suspected source. Hie copper failures In the Humber resulted fran inputs to the river system which are upstream of the Anglian Region. Work by WRC has shewn that this copper is bound up with organic natter and lias lew toxicity. The failure in the Orwell is thought to relate to Cliff Quay sewage treatment works and investigations have been instigated. No specific cause for the failure in Fenn Creek has been identified. The upstream STW (Woodham Ferrers) is being investigated as a possible source.
3.3.2 Shellfish Waters
This Directive lays down quality standards for waters designated as shellfisheries, the objective being to ensure a suitable environment for shellfish growth. It is not a direct public health measure (in contrast to the Shellfish Hygiene Directive - see 3.3.6). There are currently six designated shellfish waters in our region. Monitoring of the waters at specified minimum frequencies is required for a range of parameters.
Hie relevant waters were monitored during 1991 as required under the Directive. Hie data were reported to the DoE and will be submitted to the Ccnmission. There were few exceedences of the mandatory standards. Individual dissolved oxygen results of less than the minimum standard were experienced but these are not considered to have harmed the shellfish colonies. There was a single significant result for DDT at one site (Hamford Water) and an investigation is being undertaken. Four sites experienced exceedenoes of the DoE guideline standard for zinc:
■ River Blackwater off Marconi Sailing Club, Stansgate;
■ -Hamford Water,-Hie TVizzle off Titchmarsh; - - - —
■ River Roach, Monktm Quay, Foulness; and,
■ River Roach, East End, Paglesham.
Dissolving zinc anodes on yachts are a possible cause. There was a single copper failure at one site which may be affected by an industrial discharge whose consent is to be reviewed.
The number of designated shellfish waters is likely to increase significantly over the next few years as a consequence of the recent Shellfish Hygiene Directive.
39

3.3.3 Titanium Dioxide
Waste frcm the Titanium Dioxide industry is harmful to the environment, mainly because of its high acid and iron content.
The Directives on Titanium Dioxide require that factories discharging such waste should reduce pollution caused by their discharges, within a specified timescale. There are three factories in the UK. The two largest, Tioocide UK Ltd and SCM, are located on the south bank of the Humber and discharge their effluent to the estuary.
In 1988, the outfalls from both factories were relocated to deeper water where dilution and dispersion would be much greater. A major survey in 1989 confirmed that the re-siting of the outfalls produced a substantial reduction in the size of the affected area.
Chemical and biological monitoring of the receiving waters in 1991 was carried out as required by the Directives and reported to DoE.
This was the third full year of monitoring since the two discharges were moved into deeper water. The significant reduction in iron concentrations in the receiving waters, evident since the relocation of the tvro
.r outfalls,' has been maintained. Otoe biological monitoring results indicate that there has been sane deterioration in status since 1988, particularly around the :Tioxide outfall. It seems likely that this decline relates to the discharge, although further investigation is in hand which will clarify the situation.
Boring 1991, the DoE had been in the process of drafting Directions to- the NRA under the Water Act 1989, to enshrine within UK law, one of the
Titanium Dioxide Directives / The Directive laid down the timescales within which reduction and elimination of pollution from these discharges must be achieved. In mid-1991, the Directive was annulled following an action by the Cormission (over the legal basis of the legislation) in the European Court of Justice. The DoE has advised us that national policy is to proceed in enforcing the standards of the former Directive and that UK legislation will be progressed under the Environmental Protection Act. Hie Directive will be resurrected by the Ccrrtnis- sion but with a different legal basis..
't - J3.3.4 Bathing Waters
The purpose of the Directive is to reduce pollution of bathing waters, prevent further deterioration, and thereby protect public health and the environment.
Of the 33 Anglian Region sites identified under the Directive for the 1991 bathing season, 29 passed the water quality standards as assessed by the DoE criteria. Ibis compares with 27 out of 29 in 1990 (See Table 3 .1). West Mersea, Gorleston Beach, Caister Point,and Hemsby were the
40

newly identified waters for 1991. The first two of these sites failed the directive together with Cleethorpes and Great Yarmouth South, which also failed in 1990.
Hie current "pass/fail" method of assessing compliance with the Directive has several drawbacks, based mainly on its statistical volatility. The large variation in bacteria] numbers over a short period of time coupled with the relatively infrequent sampling rate required by the Directive may result in bathing waters failing for statistical reasons rather than those of poor water quality. Bearing in mind these drawbacks it is useful to look at the trend in bathing water quality fran a different viewpoint, using the Median values of the Total and Faecal Coliform parameters for each bathing water over the bathing season (see also Part 2.3.1).
By ranking the median values of all bathing waters for each of several years and plotting them graphically, it is possible to see the trend in bathing water quality in the relative positions of the different year's graphical results. Thus Figure 3.2 plots the median Faecal Coliform values for each bathing water for each of the years 1987 to 1991 against the proportion of beaches with a median less than that particular value. Essentially the further the graphical plot is to the right for a particular year, then the better the bathing water quality for that year.
In general there would appear to have been a trend of steady improvement in water quality for the years 1987 to 1991. Approximately 89% of bathing waters had a median of less than 500 faecal coliforms per 100 ml in 1987. In 1991 this figure had risen to 100%, showing a significant improvement in bathing water quality. This is considered to be due to a caribinaticn of remedial capital expenditure schemes by the Utility companies, together with sutnners which have been particularly dry and sunny (causing increased bacterial die-off and reduced storm-water overflow operation).
IXiring 1991, Regulations and Water Quality Objectives under the Water Act 1989 were expected from the DoE. These will put the requirements of the Bathing Water Directive into UK law. The NRA will have a duty to achieve compliance with the Objectives within a specified timescale and to monitor. The Regulations were issued in July 1991 and established a classification system for bathing waters, basedon jthe_ mandatory_values_ in the EC Directive. As at the end of 1991 the classification had not been applied to any specific waters as the Quality Objectives were still awaited. (Subsequently issued on 5th May 1992. We must achieve compliance with the Objectives by 15th May 1992 ie. with almost immediate effect).
41

TABLE 3.1
BASHING WATER D1KHJTIVE
Canplianoe with Standards for Total andFaecal Coliforms
BATHING WATER 1987 1988 1989 1990 1991
Cleethorpes Fail Efeil Fail Fail FailMablethorpe Fail Bass* Fail Bass* PassSutton an Sea Bcu.1 Fail Bass Bass* PassMoggs Eye Pass Bass Bass* Pass PassAnderty Pass* Bass Pass* Bass PassChapel St. Leonards Fail Pass Bass Bass* PassIngoldmells Fail Bass* Bass* Bass* BassSkegness Pass Bass Bass* Pass* PassHeacham Pass Ffcil Pass Bass* Bass*Hunstanton Pass Fail Bass Bass PassWells Fail Bass* Bass* Bass* PassSheringham Fail Fail Fciil Bass BassCroner Fail Fail Fail Bass Pass*Mundesley Bass Pass* Pass Bass PassGorelestcn Beach — — — — FailG.Yarmouth North Fail Pass Bass Bass BassG. Yarmouth Pier Fail Fail Bass* Bass* Pass*G. Yarmouth South Fail Fail Fail Fail FailLowestoft North Pass Pass Pass Pass* Pass*Lewestoft South Pass Pass Bass Bass PassSouthwold Hie Denes — — — Pass PassFelixstowe North Pass Pass Pass Pass PassFelixstowe South Pass Pass Bass Pass Bass*Dovercourt Fail fail Pass* Bass* PassWalton Fail Pass Bass* Bass BassFrinton Pass Pass* Pass Bass PassHolland Fail Pass Bass Pass BassClacton Fail Pass* Bass Pass PassJaywick Pass Pass Bass Bass* Pass*Brightlingsea Fail Pass* Bass* Pass* BassWest Mersea — — — — Fail
* These sites have had at least one failing sample.
42

FIGURE 3,2BATHING WATER QUALITY
PROPORTION OF VRLUES EXPRESEED


This Directive has significant implications for the UK water industry. ( See part 2.8.5) Discharges to saline waters will be particularly affected, with full sewage treatment becoming the "norm" at many locations, in contrast to the best past practice of minimal treatment and discharge via a long sea outfall. In many instances, standards to be imposed are tighter than those which we have derived for the needs of the receiving waters.
3.3.5 Urban Waste Water Treatment
3.3.6 Shellfish Hygiene Directive
This Directive, which was originally drafted as a directly binding EC Regulation, was formally adopted in July 1991.
Hie Directive lays down health conditions for the production and placing on the market of live bivalve molluscs which are intended for iircnediate human consumption, or for further processing before consumption. It covers the production, harvesting, transportation, relaying, purification, processing, handling, dispatch, storage, wrapping, and labelling of live bivalve molluscs, including public health measures and the monitoring of production areas.
The principal points of relevance to dischargers and regulators in the Water Industry, are the requirements relating to the harvesting areas and to the monitoring of those areas. Shellfish harvesting areas are classified into three groups, principally on the basis of the bacterial content of the shellfish flesh. Shellfish may only be marketed if they are taken from waters falling into these groups and, for two of the groups, only after relaying or purification. The new Directive will apply to all the main ramrngrcriai shellfisheries and not just to those designated under the Shellfish Waters Directive.
Hie classification of harvesting areas will be based upon sampling undertaken by local authorities and port health authorities during 1991/92. Around 75 Harvesting Areas have been identified to date. Regulations under the Food Safety Act 1990 (expected mid-1992) will be produced by 1993 to implement J^e pirective. ____________ ________________
Many of the commercial UK shellfisheries will fall into the categories which will require relaying or purification of the molluscs prior to marketing. As a result of this, and with the introduction of SWQO, there will be pressure on the NRA to bring about improvements in the water quality (and thus the classification) of shellfisheries, and to initiate further designations of waters under the Shellfish Waters Directive. DoE have indicated that initial responsibility for such new designations lies with the NRA. All waters identified as harvesting areas under the new Directive should logically be also designated under the Shellfish Waters Directive. Improvements to (or elimination of) discharges adversely affecting these waters will be required.
43

There is likely to be considerable pressure upon the NRA to establish the inpact of potentially polluting discharges on shellfish quality. This implies a substantial ongoing aflflit-innal monitoring burden to establish ambient water quality over shellfish beds caught by the two Directives.
It seems likely that the NRA will principally monitor waters under the Shellfish Waters Directive (as at present) and local authorities/port health authorities will undertake the Shellfish Hygiene Directive monitoring (relating mainly to shellfish quality).
3.3.7 Pollution of Waters by Nitrates fran Agriculture
The scope of this Directive is outlined in Section 2.8.6. Its relevance to saline waters is with respect to estuaries or coastal waters which are eutrophic, vulnerable Zones will need to be designated in relation to any such areas.
3.4 Red List/Annex 1A ...
The second North Sea Conference (held in 1987) agreed to reduce by 1995 50% of the loads of certain dangerous substances which are discharged to the North Sea by 1995. The UK Government identified a list of 23 such substances: the Red List. The third North Sea Conference (held in 1990) identified a list of 36 such substances. This list (which includes all of the Rod List except PCBs) is known as Annex 1A.
The NRA started Red List survey work in July 1990. Rivers, industrial effluents and seuage effluents were all sampled. This was extended to include the additional,Annex 1A parameters in January 1991.
The objective of the surveys is to identify the sources of at least 90% of the load of the listed substances being. discharged to Anglian Region's estuaries and coastal waters.. ..
The results of the 1990 Red List survey work are now available and have been compared to loads discharged in other NRA regions to give nationally ranked positions. This ranking indicates that, from Anglian Region, there is only one substance, hexachlorobenzene, which makes a major contribution to the national load. The SCM discharge on the south HUmber bank is identified as having 35% of the national load. Discussions are taking place with the industrialist concerned about why this is present in the effluent and what steps can be taken to reduce it. However the more major Anglian freshwater rivers (eg Great Oise, Yare etc) do show up as carrying measurable loads of the agricultural pesticides and herbicides. This is not unexpected given the nature of the region and probably results fran diffuse inputs such as runoff from farm land. The implications of such diffuse sources are being addressed by Central Government.
44
Annex 1A extends the range of dangerous substances being monitored by including the List II metals and Increasing the number of organic sol- vents and organcphosphorus pesticides that are looked for. It is unlikely that Anglian Region will feature high in the ranked lists for these additional substances with the exception of zinc where it is kncwn there is a substantial source at Courtaulds on the south Humber bank and possibly chloroform where the 1991 monitoring has revealed significant amounts in the Dow Chemicals effluent at Kings Lynn.
3.5 North Sea
Following the second and third North Sea Conferences the North Sea Task Force agreed a Monitoring Master Plan. Within the UK this was incorporated into a national baseline monitoring progranroe overseen by the Marine Pollution Monitoring Management Group. Anglian Region have two estuaries, the Humber and the Wash, within the programme and baseline monitoring started on these two estuaries in 1991. Water quality in the estuaries is monitored four times per year and biological health and sediment quality once per year. Hie results for the Wash confirm the known high nutrient loading in the Great Ouse Estuary. In the Humber the results confirm that despite carrying a substantial effluent loading water quality in the main channel of the Humber is good.
Nutrients and eutrophication of estuaries and coastal waters were topics of particular concern to the North Sea Conferences. Anglian region has responded to this by increasing its monitoring of nutrients in marine waters and by significantly improving our ability to detect low levels of nutrients. We also contribute to the JoNuS research progranme which vras started by MAFF in May 1990 (described below).
3.5 JoNuS Programme
Hie JoNUS (Joint Nutrient Study) programme looks at the transport of nutrient loads through estuaries to the sea and is based on the Humber and the Wash.
In addition to. providing-nutrient data"foir*the Humber, the Wash and the-Wash "estuaries, JdNuS will generate information concerning nutrient
mobilisation mechanisms, leading to management guidance for nutrient- rich discharges. Initial results indicate that whilst the Wash estuaries have high nutrient loads and may be eutrophic a significant proportion of those loads are trapped within the estuary and do not escape to sea.
3.7 Paris Caimissicn
In 1988 the Paris Commission decided to implement a comprehensive annual survey of selected pollutants to Convention waters. The first study was carried out in 1990, Hie objective of the survey is to monitor 90% of
45

In Anglian Region 17 rivers, 14 sewage effluents and eight industrial effluents are monitored. Rivers are monitored close to their tidal limit. Major industrial and sewage treatment works effluents downstream of these points are also monitored.
Figure 3.3 shows estimates of the contribution made by rivers, industrial and sewage effluents to the toted load fran the region.
the input of each selected pollutant.
3.8 Coastal Survey Vessel
In August 1991 Anglian Region took delivery of the purpose built coastal survey vessel, "Sea Vigil". The vessel is a 16.5m twin screw steel fcuilt boat with a 13m2 laboratory/survey cabin for processing chemical, biological and bacteriological samples. Figure 3.4 gives detaiIs of the utilisation of "Sea Vigil" fran August to the end of 1991.
Initial experience with the vessel has shown that it can operate successfully in all the major areas of the region. However, there were sane difficulties. The Wash proved awkward due to limited access to and frati the estuaries and dock facilities at many states of the tide. There were also constraints caused by the storage of the survey inflatable when not in use. Hie opportunity was taken at the end of the year to carry out sane minor modifications to overcane these difficulties. On board sleeping accomodation has been increased reducing the need for overnight docking. A high level storage platform has been created for the inflatable giving improved stem end working arrangements.
3.9 Mathematical Modelling
Hie aim of modelling work is to provide a suite of consistent techniques for calculating the measures needed to achieve our objectives for water quality.
3.9.1 Estuaries
Mathematical Models constructed by the Water Research Centre have been extended to include techniques for calculating effluent standards defined as 95-percentiles. This feature, and the inclusion of the option to model microbes and nutrients, illustrates the way in which we are able to adapt and up-date the models to meet increased demands.
Hie Crouch and Roach Estuary Model has been used to help determine future quality standards for discharges to the estuary so that water quality can be improved. A typical set of predicted water quality data is shown in Figure 3.5.
46

FIGURE 3.3
• •
Anglian Region -1991.
1,000,000
Loading kg/year
(Log Scale)
Metal
Industrial Rivers
Sewage
Loading kg/year
(Log Scale)
1
1,000,000
100,00010,000
1,000
Nutrient
Rivers Sewage
Industrial

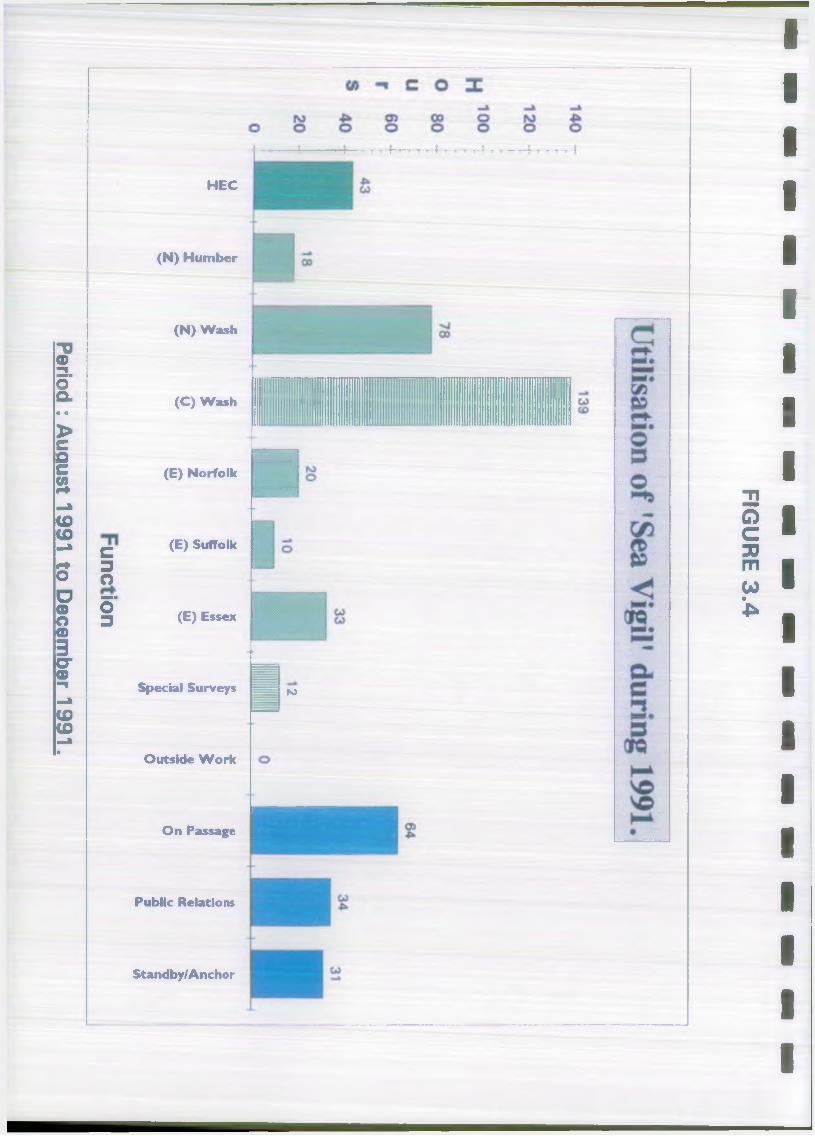
Period : August
1991 to
December
1991.
c3ommm ■
O3
H EC
(N) Humber
(N) Wash
(C) Wash
(E) Norfolk
(E) Suffolk
(E) Essex
Special Surveys
Outside W ork
On Passage
Public Relations
Standby/Anchor
NJ
FIGU
RE 3
.4


FIGURE 3.5CROUCH AND ROOCH ESTURRY MODEL PREDICTED CURRENT CONDITIONSAmmonia mg/l (95 Xlle)
CeLL
PREDICTED CONDITIONS RFTER CLERN-UP
Rmmonla mg/L (95 /.lie)


A model of the Colne Estuary system has been completed and another model, for the Stour/Orwell/Harwich Harbour System, is nearing canple- tian by the Water Research Centre.
Further models are planned over the next 5 years for the the Wash, Witham, Welland and Yare estuaries.
9.2 Coastal Waters
In 1987, the Water Research Centre completed mathematical models describing coastal waters in the area of Heacham and Hunstanton in the Wash. These models were used to assess the impact of discharges from existing and proposed outfalls on the bacterial quality of recreational waters and fisheries.
Following the success of this study, models wore proposed for ten further locations, which are shown in Figure 3.6.
The work was set in motion by Anglian Water and is mainly funded new by Anglian Water Services. Details of the studies are ranaged by a Steering Group comprised of representatives from Anglian Water Services, the Water Research centre, and our region of the NRA.
The construction of the models takes two stages. The first is a mathematical description of the tidal movements (hydrodynamics) of the water. The next stage requires a description of how bacterial pollution can be expected to disperse in sea water. Most models work on the average microbial quality of a cell 333m square. ~
IXaring 1991, further information to build the models was acquired. These data were gathered from a number of sources, including the Admiralty, the Harbour Authorities and boat and helicopter-based field surveys by Anglian Water Services.
Copies of all completed models are maintained on our own computer. We have made further enhancements to the output, so that animated displays can be shown on any PC we chose. Figure 3.7 shows an example of such a display____ ______ ____ — - — — ---- - ^ --
47

FIGURE 3.6
COASTAL MODELLING FINE GRIDS

FIGURE 3.7
C O A S T A L M O D E L D I S P L A Y S Y S T E M vl.O NRA A N G L I A N R E G I O N No v e m b e r 1990
RUN 3 U N T R E A T E D S E W A G E F LOW - 332L/S, COLI CONC - 10**8/L C l e e t h o r p e s Spring tide 333 m grid
10: 0 0am (HW + 10: 25) lkm
NE 20.0 m/sWIND «60/205.00m2/s diffusion As S c a rborough


Fart 4: DISCHARGES
The discharge of wastewaters is controlled by granting a Legal Consent. A Consent is the legal permission to discharge pollution to a Controlled Water, and one is required for every sewage or industrial effluent discharged to the environment. Consent is also required for discharges of surface water drainage (except fran roads).
Before the 1989 Water Act, Consents for the discharges operated by Anglian Water Services were issued by the Secretary of State for the Environment under Part II of the Control of Pollution Act. Consents for all other discharges were issued by the former Water Authority, Anglian Water.
Since the Water Act 1989, all Consents have been issued by the NRA. Prior to December 1991 consent processing was administered regionally, but fran December 1991 this passed to Area administration. Because they have different types of Consent, we distinguish between STWs owned by the main Utility (Anglian Water Services) and those which are not. Hie latter are called Non-Utility discharges.
On 1 December 1991, to consolidate all existing rivers law into one document, the Water Resources Act 1991 wholly replaced the Water Act1989.
4.1 Utility Discharges
4.1.1 Discharges
Discharges made by Anglian Water Services m y be categorised thus:
Of the SIMs, 693 works had Legal Consents which included numeric limits on the quality of the effluent. Descriptive consents applied to 354 small works and a few large coastal outfalls.
The Legal Consent is the consent now in force. This may contain numeric limits on the quality and quantity of the effluent. For small works the Legal Consent may be a statement of the type of treatment which must be
Surface Water Sewers- Vfater-Treatment Works -
Sewage Treatment Works Storm Sev&ge Overflows Emergency Overflows
1049 1516 852 368
“ 152
4.1.2 Types of Consents
48

I
provided. This is a Descriptive Consent. iCompliance against numeric Legal Consents is reported each year to the® Department of the Environment. |
The River Needs Consent has no legal force but is a working estimate of^ the Consent which may be needed in the future to achieve the Quality Qb-w, jectives for Controlled Waters (see Section 1.2). ^
In the run up to privatisation, the Water Authorities were given at chance to reduce their risk of prosecution. In our Region Time-limitariB Consents were granted to 200 STW discharges which were failing their Legal Consents. These relaxations were conditional. The new private^ water company vrould have to bring these works into compliance, duringj 1992, with the stricter of either the old Legal Consent or a Consent based on maintaining the 1984 load. The Company would achieve the River^ Needs Consent for discharges where the extra cost was less than 10% . I
Perhaps it is surprising that the net effect of all this activity is that sewage treatment works in this Region have, on average, the! tightest standards in the United Kingdom. P
4.1.3 Policy on Setting Consents »The policy of the National Rivers Authority is that all revised or new^ Consents will maintain the quality of Controlled Waters {No Deterlora-m tlcn) and meet Water Quality Objectives by achieving River Needs Ccn-^ sents. The Water Quality Objective is the same concept as the River Quality Objective, but is applied to all kinds of Controlled Water. ■
The main policy of Anglian Water Serviaes is to ensure compliance with Legal Consents. The conpany has identified works at risk of failing» Legal Consents and intends to design schemes to meet the current dis-l charged load. ™
The Ccnpany will want to apply to the Director General for Cost-Pass Through for expenditure beyond this in order to achieve River Needs Con-B sents.
. . . ___________ *IXiring 1991, 146 Consent Applications were received frcci the Utility. Byl the end of 1991, the total number of Applications lodged with us was* 386. Hie proportions of applications in different categories are shewn , in Figure 4.1. £
During 1991, 96 Consents were issued. Of these, 40 were for sewage treatment wotks and most of the rest were for storm or emergency over-A flows. Under the Water Resources Act 1991 Section 91(2), the person who| applied for the consent my appeal to the Secretary of State against the
49 I
i
i

FIGURE 4.1UTILITY : APPLICATIONS RECEIVED
□ WRTER TREATMENT WORKS□ SEWRGE WORKS (NUMERIC)□ SEWRGE WORKS (DESCRIPTIVE)E SURFRCE WRTER SEWERSD STORM SEWRGE OVERFLOWS
PUMPING STRTION STORM OVERFLOWS 0 EMERGENCY OVERFLOW


conditions of the consent. The Utility started to appeal against sane of the conditions included in their consents early in 1991. We stopped issuing storm/emergency overflow consents until the situation could be resolved. This accounts for the low number of consents issued during1991.
4.1.5 Monitoring
The minimum frequency at which a discharge is sampled is governed mainly by its size. The size of the works is a key factor governing the potential impact of the effluent on the Environment. The number of samples taken at works is indicated in the following table:
EquivalentPopulation
( ’000s)
Samples per Year
>100 48> 10 <100 41> 5 < 10 17> 1 < 5 8
< 1 4
A secondary factor, the degree of treatment provided at the works, is also used to determine the sampling rate. This factor is applied by starting with the category produced f ran the above table and moving to a higher or lower category according to the following rules:
Secondary treatment Primary treatment
No treatment Tertiary treatment
No change Down one class Down two classes Up one class
These adjustments work well where river quality is good because the degree of treatment will reflect what has been constructed in order to protect the Environment. A final condition was added to cater for sites where the current degree of treatment may be inadequate: if the River Needs-Consent for the BOCT is- less than 20 mg/1, the sampling rate is moved up by one class.
Sane Legal Consents contain criteria for List I and List II Dangerous Substances (Part 2.8). We analyse for these determinands at monthly intervals.
During 1991, the planned number of samples was 11599. Because some warks discharge effluents from more than one outfall, and because separate samples are required for extended suites of analysis, the actual number collected was 12,829.
50

1
We aim to inspect works with Descriptive Consents quarterly. DescriptivJ Consents include the need to refer to the state of the receiving water, so monitoring is co-ordinated with the inspections of these waters. |
4.1.6 Compliance with standards ■
Two summary statistics are used to monitor performance. The first, the Percent of Canpllant Works, is a simple statement of the number of sites which meet their Consent. This can be volatile and does not necessarily! reflect the inpact of effluents on the receiving water. %
In managing the quality of receiving waters, large works are more impor-! tant than snail ones so we also report the percent of the total flow] from all works which ccnplies with the Consent Limits. This statistic, the Percent of Compliant Flow, is less volatile and gives a better- measure of the damage which can be done by non-ocrapliance. I
Hie pollutants oannonly associated with sewage treatment are Suspended Solids, BCD and Armenia. These are called sanitary determinands. Other! determinands are called nan-sanitary. The Consent Limits for the(! sanitary determinands are 95-percentile limits. Hie 95-percentile is a concentration which must be met for 95% of the time. Hence a sunmaryj| target which covers all discharges is a Percent of Compliant Flow whichJ exceeds 95%.
Hie definition of compliance allows a certain number of sample results! to exceed the limit. If the number of exceedences is more than the per- mitted number, then we are 95% certain that the failure is not due to chance. We then report the discharge as having failed its Consent. jj
Hie numbers of permitted failures is laid down in a look-up Table, which is referred to in the Legal Consent. j
Some works also have additional standards for sanitary determinands which are absolute limits on quality. These must not be exceeded at any^ time and are called Upper Tier Limits. Upper tier limits apply to works! with Time-Limited Consents and all numeric STW consents issued since ■ the NRA was formed.
Figure 4.2 shows the performance of works against the percentile limits^ in their Legal Consents. Hie results cover all discharges which have numeric limits on the discharge quality. ^
Around 20% of all flows are discharged to Tidal waters. Table 4.1 summarises the proportions of discharges to Non-Tidal and Tidal waters and shows the improvements seen over the last year. J|
i
i
i
i

FIGURE 4.2COMPLIANCE WITH LEGAL CONSENTS
PERCENT
0 7. COMPLIANT FLOW (TARGET 95)□ 7. COMPLIANT WORKS (TARGET 95)
DEC'82 DEC'83 DEC'84 DEC'85 DEC'86 DEC'87 DEC'88 DEC'89 DEC'90 DEC'91YEAR ENDING

A-.*,
tai
n

Table 4.1: Sanitary Criteria
ReceivingWater
Numberof
WorksPercent Compliant
Works Flow 1990 1991 1990 1991
Non-tidal 657 91.8 94.1 82.5 92.4Tidal 36 86.1 94.4 88.0 90.2Total 693 91.5 94.1 91.3 91.8
The percent of discharges which fail the Upper Tier Limits in their Consents is now 10.6 (11 discharges), compared with 16.6 at the end of1990.There are 33 discharges with criteria for non-sanitary substances in Legal Consents. All limits for ncn-sanitary determinands are absolute. Three STWs had a single failed sample, Roys ten for mercury, Ashton for cyanide, and Cambridge for lindane.At the end of 1991, 354 snail discharges had Legal Descriptive Consents, compared with 353 at the end of 1990. About 99% (352 discharges) were inspected at least once in 1991, compared with 92% (326 discharges) in1990.Figure 4.3 shows how the compliance of these discharges has altered over the last two years. Hie proportion which complied at the latest inspection is 90% (317 discharges).Performance against a River Needs Consent gives an indication of the action needed to cater for growth and achieve Water Quality Objectives. Figure 4.4 shows that since December 1990 the Percent of Compliant Flow judged against River Needs Consents has decreased from 76.1% to 73.8%, although the Percentage of Compliant Works has improved fran 71.5% to -75 .7-over the same-period-- ----------- -------------- ,_____
4.2 Non-Utility Discharges4.2.1 Discharges
Non-Utility discharges nay be categorised thus:Sewage Treatment Works 30581Industrial Effluent 586Surface Water 813Agriculture 63
52

I
I
I
1
I
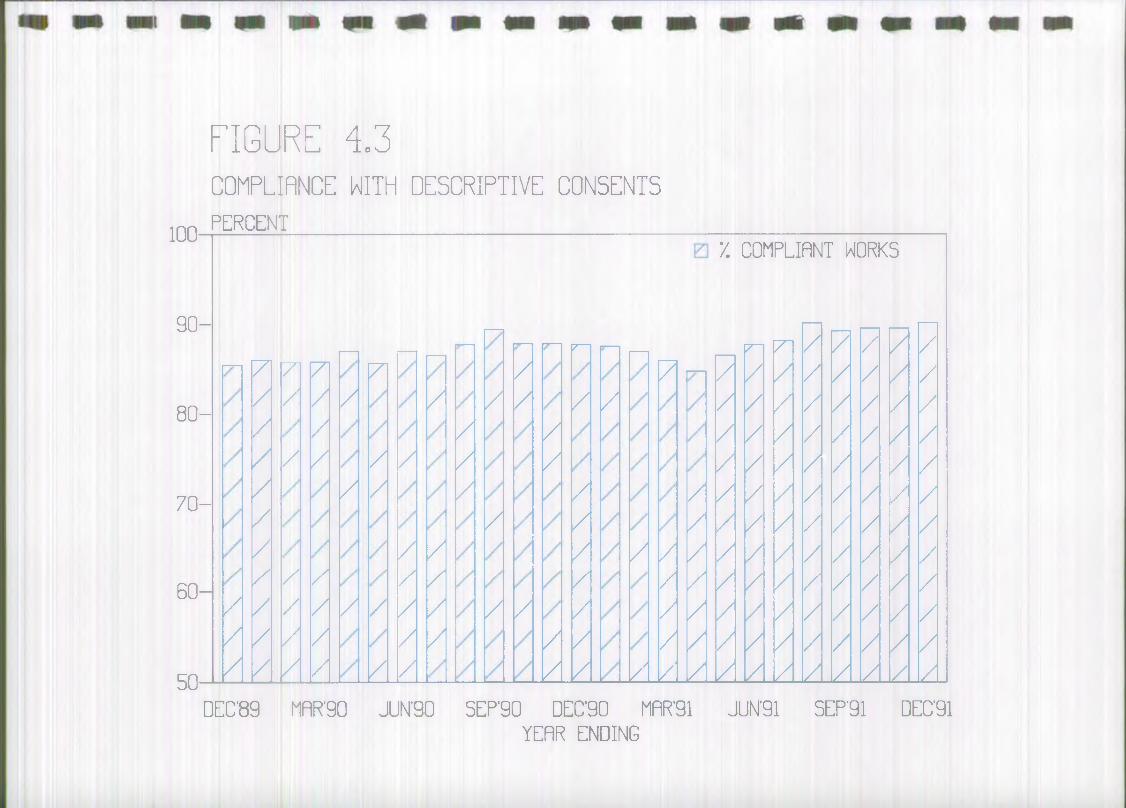
1 0 0 -
FIGURE 4.3COMPLIANCE WITH DESCRIPTIVE CONSENTS
DERCENT
90-
80-
70-
60-
50-
/
/
/
7
/
/
/
//
//
/
/
/
z/I
/
//
/
/
7/
/
/
//
/
/
/
/
/
7
/
/
/
/
7
77777
7
77
77
/
77
7
7
77
7 7
77
/
7
v~
7
7/
77777
77
Mi/ /
/
/
klkl
7777777.
DEC'89 MFIR'90 JUN'90 SEP'90 DEC'90 MflR'91YERR ENDING
7. COMPLIANT WORKS
n pn 7 7 77 7 /] 7(7 7 7 7 / 7 7 7 7 7 7 / 7 7 / / / / / / / /
/ / / / / / / / / / / / / / / / / / / / / / / / / / / / / / / /
/ / / / / / / /
/ / / / / / / /
/ / / / / / / /
A \A \A \A 17 ,7 ,/l 1/JUN'91 SEP'91 DEC'91


90-
FIGURE 4.4COMPLIANCE WITH RIVER NEEDS CONSENTS
PERCENT
80-
70-
60-
50- A
□ COMPLIANT FLOW (TARGET 95)
[Z
A A A / A77 78 79 80 81 82 83 84 85 86 87 88 89 90 91
YEAR


Miscellaneous 93■ This figure excludes septic tanks of which there are 10566.
2.2 Types of ConsentMost of the consents on the Water Resources Act Register, are Descriptive Consents for discharges of effluent from private sewage treatment works and industrial premises. Discharges with the greatest potential to affect the environment have numeric limits in their Consents. Legally, all numeric limits for the non-utility discharges are absolute, even those for the sanitary determinands.
2.3 Application ProcessingThe number of Applications for Consent decreased during 1991. The total was 490 of which 331 were for sewage effluents. The proportions of applications in different categories are shown in Figure 4.5. IXiring 1991, 529 Consents were issued.Die reduced number of applications was due to the change in policy for consenting sewage effluent discharges to land. From 1 September 1990 these discharges have not been consented. Pending the introduction of a National Policy of controlling these discharges we have been sending letters to potential dischargers detailing the conditions to which the treatment system should be constructed. This oontrols the installation of the soakav&y and also exempts the discharger f ran paying the application fee (see Fart 4.6).
2.4 MonitoringMany of the records on the Water Act Register are for tiny discharges whose effect on the environment is negligible. We monitor only those effluents judged to have a potential for environmental impact (as a safeguard we rely on the biological monitoring of watercourses to tell us if we have misjudged the potential iirpact _of discharges).---- -----The audit sampling frequencies range fran twice per week for the larger discharges to the Humber, to a minimum of four times per year for smaller discharges. Some other discharges, not on the routine sampling programme, are sampled as part of occasional or routine inspections.Of the 170 significant private sewage treatment works, 59% (94 discharges), were sampled, compared to 51% (84 discharges) in 1990. In addition forty nine discharges are the responsibility of the Property Services Agency. These are Crown Property and are exempt fran prosecution.Most trade discharges are direct to sewer. These are managed by Anglian


FIGURE 4.5
NON-UTILITY : APPLICATIONS

RECEIVED□ SEWRGES TO LRND□ SEHRGES TO RIVER□ TRRDES TO LRND□ SURFRCE HRTERS TO RIVER□ TRRDES TO RIVER


Water Services. Our control of these traders rests with setting consents for sewage treatment works. For Industrial discharges, the NRA issues Consents only for those which discharge direct to environmental water. Over 150 industrial effluents in this category were sampled. This compares with 140 in 1990.
4.2.5 ComplianceThe proportion of compliant private sewage treatment works is 40% (38 discharges). This is a greater number of discharges than last year. The figure for discharges owned by the Property Services Agency is 49% (20 discharges). This is four fewer discharges than last year.The proportion of compliant industrial effluent discharges is 46% (71 discharges). More discharges are monitored and more are compliant than in 1990.The compliance position is poor but the potential impact of most of these effluents is small. The proportions of sites failing when judged as 95-percentiles against the Look-Up table are:
Non-utility STVfe ■ ; 29 %Industrial Discharges : 34 %Crown Properties : 24 %
When assessed on this basis, the compliance figures can be cxxnpared more fairly with those for Anglian Water Services'- sewage treatment works where the failure rate is 5.9% against Legal Consents and 24% against River Needs Consents.
4.3 Priority Lists and the Index of Discharge ImpactThe Index of Discharge Impact (IDI) is used to rank discharges in terms of their apparent or potential impact on receiving waters. The IDI is calculated fran statistics for the compliance of discharges with their River Needs Consents, and fran an assessment of compliance of waters with their quality standards. These data are then weighted according to ourviews-cn“the relative-importance-of-different -waters— _____ ___We are investigating the use of biological data in assessing the effects of discharges on receiving waters. This infonraticn will be incorporated into the IDI to further refine the system.We use the IDI as the basis for producing ranked lists of discharges where we would like to see improvements in the quality of their effluents .A preliminary list of about 50 works was passed to the Utility in September 1991. Discussions about improvements to effluent quality were then initiated.
54

4.4 Targeting and Tripartite SamplingWhen a discharge consistently fails to meet its legal consent csondi-J[ tians, that discharge becomes a candidate for the routine collection of Tripartite Samples. These are samples which are especially collected,— documented and analysed. The main sample is split into 3 parts : one® part is analysed by the NRA, one is given to the discharger and one is* held in reserve. They provide the basis for legal evidence. If sufficient tripartite samples fail the allowed Look-15) Table ratios over aA one year period, the discharger can be prosecuted in court. •In the year ending December, 1991, we were targeting 6 utility sewage treatment works by talcing tripartite samples of their effluent. Pour discharges, Fritwell, East Rudham, Wickford, and Great Totham, had enough failed tripartite samples for us to be able to successfully prosecute the Utility. A further four cases, Acle, Beachamptcn, Bristcn, and Soutlminster, are to heard in 1992.
4.5 Progress on Consent ConditionsWe need to calculate revised standards for discharges for a number of reasons. These include:- -
■ growth in loads;r
■ changes in environmental standards;■ new or altered discharges.
We are continuing to extend the number of consents which include standards for fish and invertebrate toxicity testing.During 1991 several national NRA consenting policies were formulated. These cover the following topics:
■ Enforcement and Prosecution with respect to Pollution Incidents affecting Controlled Waters;
■ Enforcement of Numeric Discharge Consents;■ Interim Guidance on Issuing Consents for Discharge;■ Short-term (Constructional) Variations to Consents;■ Control of Pollution (Silage, Slurry and Agricultural Fuel Oil)
Regulations 1991.
55
1

4.6 Charging for DischargesA scheme of charges for consented discharges was introduced in 1991. There are two kinds of charge, an application charge, and an annual charge.
4.6.1 Application ChargeThe charging scheme incorporates charges for the processing of consent applications. This was introduced in September 1990 and is as follows:-Sewage effluents of less than five m3/day - £ 50Cooling water of less than ten m3/day - £ 50Unoontaminated surface water - £ 50All other effluents - £350
4.6.2 Annual ChargeIn 1991 an annual recurring charge on most categories of discharge was also Introduced. Small domestic sewage discharges of less than 5m3/day are exempted from the scheme.Die scheme was introduced to recover part of the oosts of the NRA’s pollution control function, in accordance with the Water Resources Act1991, section 131.The draft scheme was advertised at the beginning of March and dischargers were given two months in which to give their comments to the Secretary of State for the Environment.The revised scheme was approved at the end of May and came into force on 1 JUly 1991. It is due to run for three years and will then be subject to review.As part of the preparation for the scheme, discharge consents held on the Public Register were checked to confirm the accuracy of the inf or-
-- mat ion. Details of discharge consents were entered onto a computerdatabase. Charges_will_be'levied cn 5700-ccnsented dischargesThe annual charge is onlcnlaftBrt on the basis of the size , nature and location of the discharge, three features significant in determining the cost to the NRA of carrying out our pollution control function. Each discharge is assigned a weighting to reflect the volume and nature of the discharge and the nature of the receiving water. The weighting is multiplied by the unit charge for the financial year (£270 for 1991/92). The. unit charge is set annually in agreement with the Government.Here are sane examples for a full year:Domestic sewage of less than five m3 /day - No Charge
56

I
Energency overflow fran a pumping station to stream - £108 Drainage fran Trade premises to a watercourse - £270Cooling water of high temperature, pH or chlorinity - £270 STW serving 1,000 people, discharging to estuary - £2,430 Large trade effluent, toxic Substances, to estuary - £30,375
4.7 Integrated Pollution Control
i
i
i
Integrated Pollution Control (IFC) was introduced on 1st April 1991 un-M der the Environmental Protection Act 1990. IPC is administered by Ho tI Majesty's Inspectorate of Pollution (IMP).The main abjective of IPC is to prevent, minimise or render harmless^ discharges of the most persistent pollutants entering the whole environment, air, land and water. IPC lists the specific pollutants as_ "prescribed substances" and the industrial processes that produoe mostl of the prescribed substances as "prescribed processes".Operation of a prescribed process will require an Authorisation (IMPft version of a consent). All new operations will require authorisation im-B mediately. For the large number of existing operations it was decided to split the prescribed processes into groups, and deal with them on aa rolling programme which will reach completion in 1996. In 1991 the ex-^ isting large combustion processes (power stations) have applied.Before the introduction of IFC, discharges to controlled waters (surface® and groundwater), required discharge consents fran the NRA. Those dis-™ charges not resulting from prescribed processes will continue to be dealt with in this way. However, discharges fran prescribed processes ■ will also require RHP authorisation which will in seme circumstances® replace the NRA Consent.The NRA is a statutory consultee in the authorisation process for dis- | charges to controlled waters. IMP send NRA a copy of an application. NRA provide detailed recarmendations to IMP on the conditions that must be included in the Authorisation. IIMP must ensure that the conditions of an Authorisation are at least as tight as the NRA reccnmendations. However IMEP can require more strin-B gent limits in its Authorisations based on two principles of IPC. The J first is that the operator should use the "best available technique not entailing excessive cost" (BA2NEEC) to minimise all discharges from the^ process, and the second that the operator should choose the "best prac-l ticable environmental option" (BPEO) for any discharge made.IPC is a step towards the complete integration of pollution control un-B der the auspices of an environmental protection agency. V
57 I
I
i

part 5: 1HE WATER RESOURCES ACT: WATER QUALITY REGISTER
The Water Resources Act Water Quality Register contains copies of all Consents to discharge effluent, together with Applications for Consents dating back five years. The Register also holds the results of analysis of samples of effluent and environmental waters.Hie Register contains tails of over 31,000 Consents and new Applications are being made at a rate of 600 per year. Hie Register holds information on 276,000 samples taken since August 1985, and new samples are added at a rate of 50,200 per year. There are more than one million analytical results.The Consents and Applications are held in the form of paper copies and the sample results are stored on computer.The Register is kept at Peterborough and is open on weekdays (except Bank Holidays) fran 10.00 to 16.30. Inspection of the Register is free. Data retrieval is free to most students in full time education as well as to water undertakers. Otherwise a charge of £5.00 is made for an initial retrieval from the Register with copies of any data/consents being charged at 5Op per sheet. Lengthy retrievals are charged at £15.00 per hour of staff time plus 5Op per sheet of hard copy produced. An appointment to view the Register is not essential, but recommended, written requests for information can also be made, but telephone requests for information will not be accepted.Details of Consents are retained on the Register until 5 years after they are revoked.Inmediate access is provided for sample results. Results for samples obtained before August 1985 are not available fran the Register.The Register utilises a geographical mapping system. This makes it easier for the enquirer to find out what is available for a particular location. As well as enhancing the display of data, the system assists with data retrieval. _______________ ____ _______Hie year saw another large increase in interest in the Register. Pour hundred and eighty eight enquiries for information were received in1991, of which 137 were fran students. Many students, of all levels of education and ages, make good vise of the Register facilities to assist with their studies. Trends are shown in Figure 5.1.
58

i
i
i
ai

180 160 140 120
100
80 60 40 20
01985 1986 1987 1988 1989 1990 1991
YERR
FIGURE 5.1HFITER ACT REGISTER ENQUIRIES
NUMBER
CommercialEnvironmental GroupsIndustryRngllng Clubs /
- Students/Research /Official Bodies etc/Others /


Part 6: CAPITAL DEVELOPMENT PROGRAMME
The initial budget awarded for Capital Development in the financial year 1991/92 was £1,239,000. This was subsequently reduced to £850,000 through a transfer of £389,000 to Head Office. Later additional bids raised the final programme total to £1,290,000.The number of schemes funded by the Department of the Environment was 44. Die assets developed under these schemes are:
TOBUE 6.1
Type of asset Number Cost (£ 000's)
Water Quality Monitoring Stations 8 - 86.5Pollution Control 7 147.8Marine Survey Facilities 7 375.2Scientific Equipment 13 201.0laboratories 9 480.2Totals 44 1290.7
The total for 1991 compares with £2,164,000 (at September 1991 prices) for 1990. Although reduced, the expenditure reflects the Authority's continuing expanding responsibilities, with water quality monitoring and associated laboratory developments being the area of greatest increase.
59

I
IPart 7: RESEARCH AND DEVELOPMENT
lIn 1991, Anglian Region maintained its position at the forefront of research within the NRA. The research undertaken fell into twc*| programmes, the National Research and Development Prograrrme, which ad-B dresses National issues, and the Regional Operational Investigatiorr Programme which covers site-specific or region-specific research within Anglian Region. ftIn the 1991 National Programme, 23 Anglian staff lead 32 projects. We are developing areas of expertise, in particular, blue-green algae groundwater quality, water resource ranagement and coastal engineering In the fiscal year 1991/92, the Anglian programne budget of £1,400,000 was achieved, representing the largest single budget devolved to a^ Region for R & D. IUnder the Regional Programme we managed 34 projects in 1991/92 and £573,000 was spent on these. £32,000 of the expenditure on RegionalM Operational Investigations was met by contributions fran other environ-M mental organisations. A reduction in expenditure on Operational Investigations was made with the canpletion of several large projects and then increase in the role of the National R&D programme. ^
7.1 Benefits aBenefits are closely assessed before any project is initiated. A continual assessment of progress and benefits is undertaken by the Project leader and R&D support staff throughout the life of a project.Benefits of R&D include:
■ the development of strategies to implement new legislation;■ responding to and meeting new environmental concerns;■ improvements in effectiveness and efficiency in the Authority's
business; and |■ underpinning knowledge about the aquatic environment which allows
i
i
i
i
i
60

Part 8: CHEMICAL LABORATORY SERVICES
During 1991 the laboratory at Kingfisher House was extended to meet increased workloads. This extension was integrated into the operation of the laboratory with minimal disruption to service.All NBA laboratories have established a timetable for achieving the standard recognised by the National Measurement Accreditation Service (NAMA5). The NAMAS scheme is an internationally recognised mark of quality assurance. This Regions chemistry laboratory has new been accredited under the scheme. Written procedures have needed to be produced in connection with this and these cover a wide range of activities, including Methods, Protocols, Training, and Analytical Quality Control. All methods and equipment in routine use in the laboratory are covered by the scheme. New items of equipment and non-routine methods will be added as required.All analyses are performed using strict methods of control on precisian. As part of the NAMAS scheme the laboratory runs a quality control check on every batch of samples. In addition, the laboratory participates in the Aquacheck quality control scheme organised by the Water Research Centre. CXir performance has generally been good.Numbers of samples handled for routine monitoring purposes are given in Table 8.1. In addition, a number of unplanned samples are also analysed by the laboratory. These may be taken when there is a pollution incident, for example. The total number of samples processed in 1991 is 50 132, and the total number of determinations is 466 000. A breakdown of the total number of samples taken is shown in Figure 8.1. The total determinations figure oovers over 500 determinands/techniques, ranging from relatively simple autcnated methods eg pH, to more complex Organics eg pesticides at ng/1 levels.There is a trend for reduction of samples requiring basic sanitary analysis (eg SlW's) and an increase in samples requiring more acmplex. _ analysis. New equipment _was purchased to-replace ageing tiechnology and
___ - - -to - improve - capacity~and efficiency.The increase in Tripartite Sampling observed last year has continued, and analysis and handling of the associated documentation creates a large workload. The laboratory continues to provide an emergency and out of hours service. The number of pollution incidents also has an impact on workload.The Regulations on the Control of Substances Hazardous to Health (C0SHH) have continued to have an impact. A centralised inventory of controlled substances is maintained and a system has been established for handling the requirements of the regulations. All laboratories in the Region are checked for compliance with the OOSHH systesn, and a fomal record is
61

I
produced. A self audit approach for each laboratory has been deve and will be applied to all laboratories in the next year.The Laboratory Information Management System (LIMS) has been further! developed, both within the laboratory and by connection to District Offices. LIMS has reduced errors and enabled better planning. It has reduced over-sampling and ensures that we take samples at the frequency] required.
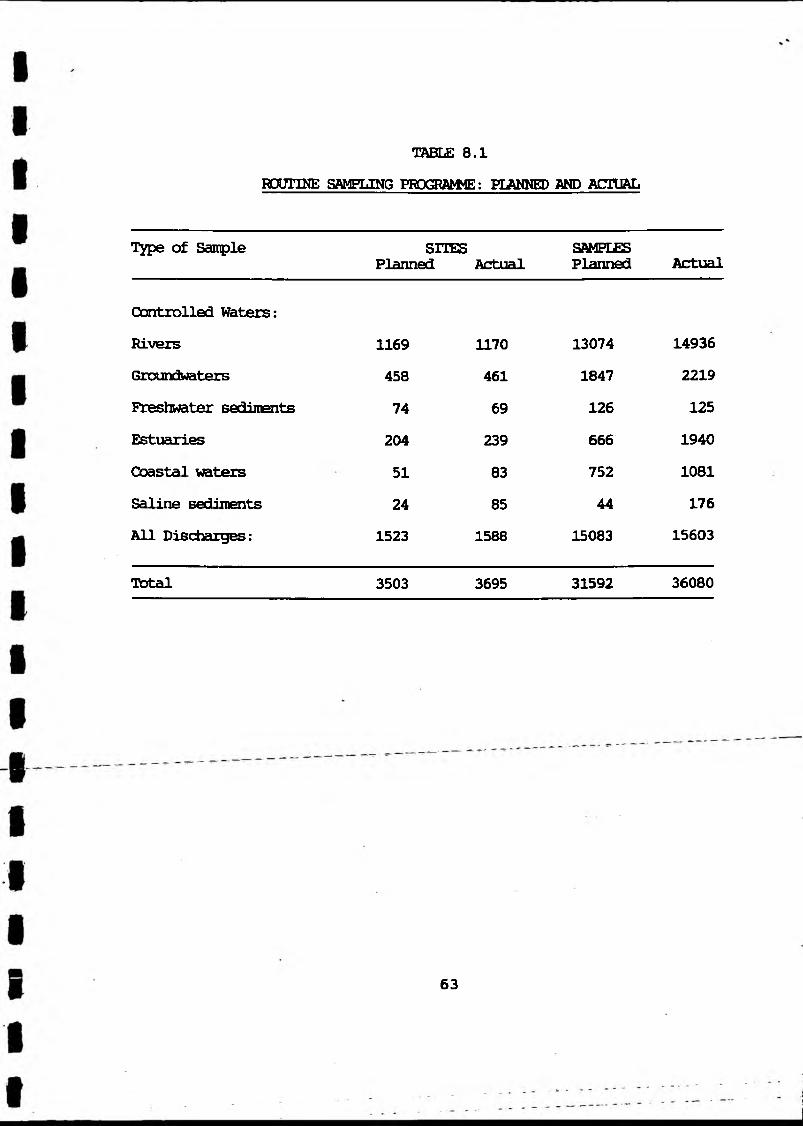
ROUTINE SAMPLING PROGRAMME: PLANNED AND ACTUALTABLE 8.1
Type of Sample SITESPlanned Actual
SAMPLESPlanned Actual
Controlled Waters:Rivers 1169 1170 13074 14936Groundwaters 458 461 1847 2219Freshwater sediments 74 69 126 125Estuaries 204 239 666 1940Coastal waters 51 83 752 1081Saline sediments 24 85 44 176All Discharges: 1523 1588 15083 15603
Total 3503 3695 31592 36080
63


No.
of sa
mpl
esFigure 8.1 — Sample Breakdown
25000
20000
15000
10000
5000
Sample Types 1991
A-AQBABC BD BE BF BG BH B! BJ B Z C -D -E -F -H - I— J-LALBLCLDLFLGLZNRSample types
SAMPLE TYPES
A- Any GasAQ Analytical Quality ControlBA Reservior WaterBC Spring/Artesian WaterBD Pumped GroundwaterBE Static GroundwaterBF River/Stream WaterBG Canal WaterBH Lake/Broad/Pond etc.Bl Estuarine WaterBJ Coastal WaterBZ Miscellaneous Environmental WaterC- Any Supply WaterD- Any AWS ’D’ Type EffluentE- Any AWS ’E’ Type EffluentF- Any LeachateH- Any SolidI- Any BiotaJ- Any WTW EffluentLA AWS STW Final EffluentLB Non-AWS STW Final EffluentLC Surface Water DrainageLD Any Other Sewage DischargeLF Industrial EffluentsLG Agricultural EffluentsLZ Miscellaneous DischargesNR NRA - Southern Samples


Part 9: Information Strategy
Water Quality monitoring is a complex process. Thousands of sites are sampled and hundreds of thousands of analytical results are generated each year. Efficient nanagement would be impossible without computer- based systems for handling information.Die laboratory Infornation Management System (LUC) helps manage our resources of sampling and analysis. It is operated on a network of Personal Computers (PCs), and co-ordinates sampling, analysis and storage of results. laboratory equipment is linked directly to LIMS. Validated results are transferred to the Region's Honeywell mainframe computer for secure long-term storage and for access by the Water Resources Act Register (Part 5).Die Sampling Information Management System (SIMS) is PC-based system which brings together the various monitoring requirements for each site and confirms that LM5 is set up to analyse for all the requirements. In 1991 we extended SIMS to include data conversion facilities. These allow us to extract chemical results fran LIMS or the Honeywell mainframe and convert the data into a consistent and accessible format for use by other systems.We have since developed powerful computer software that can access the formatted chemical data and produce graphs of results against time (Figure 9.1). This allows us to investigate environmental trends.We have also modified our computer mapping software to access the formatted chemical data and produce graphs of chemical results on a background map (Figure 9.2). This allows us to investigate trends along a river or across an estuary or aquifer.IXiring 1991 we developed software to read waste disposed databases purchased fran Aspinwall & Company. Die software will enable us to target our sampling towards sites receiving hazardous materials.
_have_extensive- sof tvrare-on-the-nainf rame_ccinputer~that_cadculates thecompliance of effluents and rivers against standards. During 1991 we developed new ocmp1 iannp assessment software on the PC. The new software can take chemical results directly from LIMS. This approach yields compliance statistics faster than the mainframe software.Diroughout 1991 the Water Quality section was involved with WAMS (Water Archive Monitoring System). WAMS is a national project involved with bringing together all aspects of data storage and analysis within the NRA. Much work has been done in defining standards and system requirements.
64


FIGURE
R01BFBR01: Gulthavon Fluae
lS.OOn
16.00
14.00-
12.00-
10.00-4
8.00.
6.00. \
4.00. 4
2.00.0.00. y*-
& % f v * r v ' * / <y n*v ❖ * ♦' «»' v' * «r *r $r *i— r
L i»«Rr»f VI.2n « a Af»oll«n
06 - 08-92
Kay:BFBROl: TEMP C 0076 In CELBFBROl: D.O 0082 In M6/L 0BFBROl: BOO+ATU 0085 In MG/L 0
v < Result ▲ > Result□ No Result

1
River Brain; AMonla in *q/1
>
L l M 0r»f vi . 2 nra Anolian06-0B-92
Kay:.BFBROl: AMMONIA 0111 In M6/L NBFBR0150: AMMONIA 0111 In MG/L NBFBRO161: AMMONIA 0111 In MG/L NBFBRO2: AMMONIA 0111 In MG/L NBFBR03: AMMONIA
*0111 In MG/L Nv < Result A > Raault□ No Raault

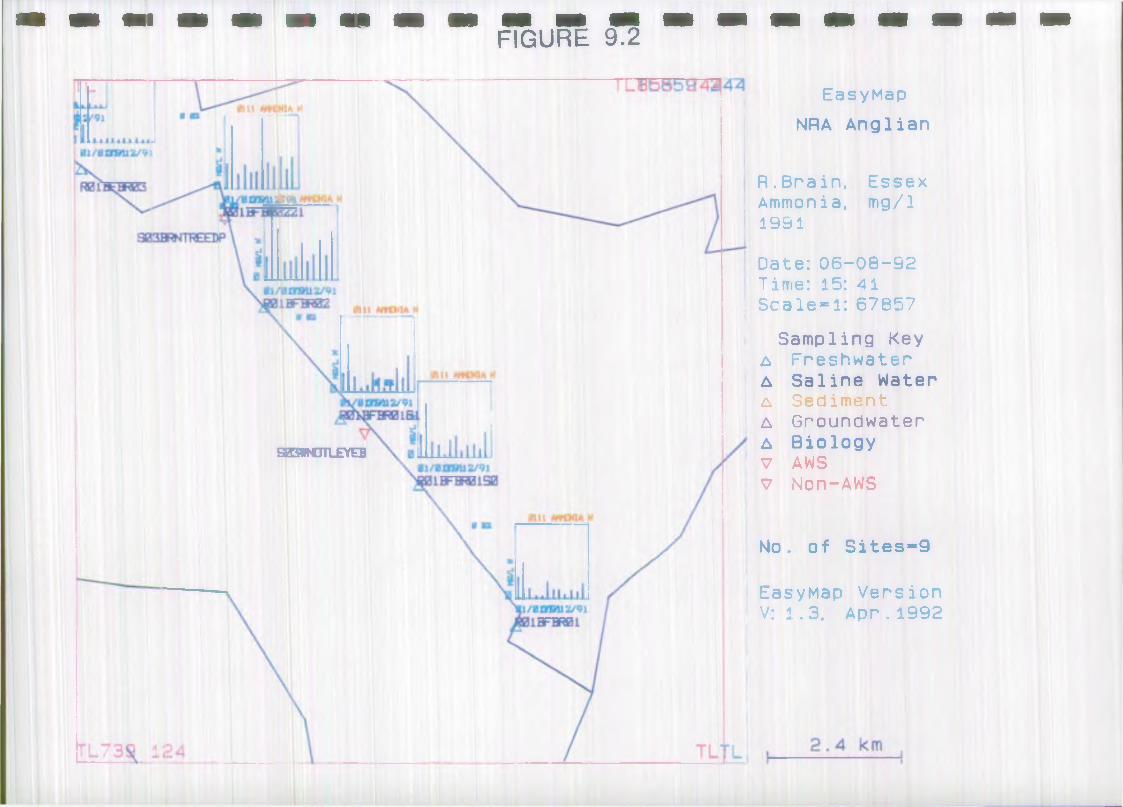
FIGURE 9.2
EasyMap
NRA Anglian
S03WNOTLEYEB
R . Brain, Ammon i a.1991
Essexmg/1
Date:06-08-92 Time: 15: 41 Scale = l: 67857
Sampling Keya FreshwaterA Saline Watera SedimentA GroundwaterA BiologyV AWSV Non-AWS
No. of Sites=9
EasyMap Version V: 1.3. Apr . 1992


Appendix I: Biological Sampling 1991
Sample Category1. Freshwater - Rivers
a. MacroinvertebratesRoutine 3656Pollution 292Special investigation 143Others 7Quantitative 148
b. Macrophytes 161c. Microbes 967d. Phytoplankton 108e. Zooplankton 81f. Others 18
Blue-green Algae 102. Freshwater -
a. Macroinvertebrates 1169b. Macrophytes 78c. Microbes 25d. Phvtoplankton - - 1142e. Zooplankton 851f. Others 2503
Blue-green Algae 433. Estuary and Coastal waters
a. MacroinvertebratesIntertidal 676Subtidal 813
b. Intertidal algae 19c. Microbes 2113d. Phytcplankton__--------------- 94
---------eT Zooplankton 60f. Beam trawl 14g. Other 32
4. Boreholea. Microbes 4
65

Appendix II: Prosecutions brought to Court
Incident Hearing Defendant Fine (£) CostsOil;Yaxley Watercourse YaxleyPig Slurry;Paunch Beck Waddingbam, Lincs.Benzene Discharge; River (R) HumberSilage Effluent; Panton &Sta infield Becks LincolnTrade Effluent;R NeneWellingboroughFish Waste; Tributary (Trib) of R TiffeyTrade Effluent;R WensumGreat WitchinghamSewage Effluent; Fritwell S1WPiggery Effluent; StfillandCider Waste;Trib of R ThetPiggery Effluent; BadinghamPollution of Trib of Stone Brook;
1.2.91 R Humphrey
23.1.91 Ermine forms Ltd
18.1.91 Simons Storage
8.2.91 A Parscnscn
6.2.91 Cbettles Ltd
19.3.91 Gateway Ftodmarket Ltd
19.3.91 Bernard Matthews Foods Ltd
25.3.91
25.2.91
19.3.91
15.4.91
Anglian Water Services LtdP P Ebrd
W M Gaymer & Sons LtdD Simper
Vegetable Ltd
66
800 600
Not Guilty
Case Dismissed
500
1000
1200
200020002000
1750
100
1000
500
29.4.91 Lorien Laboratories 150015001000
250
696
846
3374
559
480
986
1000
868
610

Appendix II: Prosecutions brought to Court - continued
Incident Hearing Defendant Fine (£) CostsTrade Effluent;Pollution of Somers Brook;Trib of R StourTrade Effluent; Green End Brook Great Barf ordTrade Effluent; Puny Drain SetcheyTrade Effluent; Cenetry Drain SpaldingSewage Effluent; Rudham Stream East RudhamTrade Effluent;R NeneDog-in-a-DouhletEffluent to R Can;ChelmsfordPollution of Brone Stream;- Eye, - Suffolk— — -Poultry Effluent; R Little Ouse RedgraveSewage Effluent;R Blackwater Hatfield PeverelSevrage Effluent; Spicketts Brook Great Tortham
4.4.91 Frigoscandia Ltd7.5.91 Stoke By Nayland
Golf Club
4.6.91 Barf ordian Coaches Ltd
18.6.91 J Rudd & Son Willow Bend
28.6.91 Christian Salvesen
2.7.91 Anglian Water Services Ltd
5.7.91 McCain Foods Ltd
15.7.91
17.7.91
R J Matthews & Sons
Camstar Herbal Products Ltd
19.7.91 A E Button & Sons
23.7.91 Wickham Bishops Nursing Heme Ltd
23.7.91 Anglian Water Services Ltd
500200
400
300
400
1500
2000
500
500_750-1000
500
2500
1000
75060
600
344
835
620
300
755
598
796
500
500
67

Appendix II: Prosecutions brought to Court - continued
Incident Hearing Defendant Fine (£) CostsTrade Effluent; Exeter Drain SpaldingDairy Slurry;R Oxwell Brook IngatestoneEffluent into Stambridge Brook; Great StambridgeEffluent into Trib of Mar Dyke; Cranham, EssexTrade Effluent; Trib of R LinnetEffluent to R Flit;Shefford,Bedfordshire
26.7.91 Turners Turkeys Ltd
1.8.91 Miss MoodyRadley Green Farm
6.8.91 Mr Hume, Royal Oak Public House
7.8.91 Palmers Wholesale Butchers
9.8.91 Britag Industries Chedburgh, Suffolk
19.8.91 Beadlcw Golf & Country Club
4000
2000
250
1000
3000
50010001500
554
874
430
889
845
667
Trade Effluent; Trib of Cranbrook Drain
19.8.91 Hensby Canposts Ltd
4000 1161
Trade Effluent; Ampthill
Oil;R Tud OostesseyPiggery Waste; Ranscnmore Drain DuddingtcnSewage Effluent; Fen Lane Drain Marham
20.8.91 Builriform Ltd
19.9.91 Fincham Demolition
3.10.91 S S Mondair(Plumtree Mobile Park)
101010
400
24.9.91 Ccneywood Piggeries 2000
Not Guilty
450
300
324
68

Appendix II: Prosecutions brought to Court - continued
Incident Hearing Defendant Fine (£) CostsPoultry Effluent; 8.10.91Trib of R Thet Carletan RodeTrade Effluent; 21.10.91Barrowtoy Beck/StreamTrade Effluent; 30.10.91Clipstcne Brook &R OuzelSewage Effluent; 25.11.91R Crouch EstuaryWickford
Fenwood Country Chickens Ltd
Jo Treasure Ltd HarlaxtonLeighton Finishers Ltd
Anglian Water Services Ltd Wickford STW
70003000
10001000
12000
15001500
962
700
1161
901
Trade Effluent; Buckenham Stream Fettlebridge
3.12.91 Fettlebridge Co Ltd 500 244
Sewage Effluent; 3.12.91Trib of R Thet Bunns BankTrade Effluent; 4.12.91Trib of R SapistonElmswellOil; 10.12.91Parkeston QuayHarwichOil & Grease; 12.12.91Nar Valley Drain __-Setchey--- — -
Banham Poultry Produce Ltd
Farm Kitchen Foods Ltd
Sealink Stena Line Ltd
Kier Construction Ltd __
5000
20002000
212
854
ConditionalDischarge
500 510
69

I
Appendix III: Formal Cautions Issued
Incident Defendant Date IssuedPiggery Effluent; Z Munter Farms Ltd 11.9.91 Stream at SoutholtOil; A W Cowley 20.11.91 R OrwellEffluent; Z Munter Farms Ltd 4.12.91
70
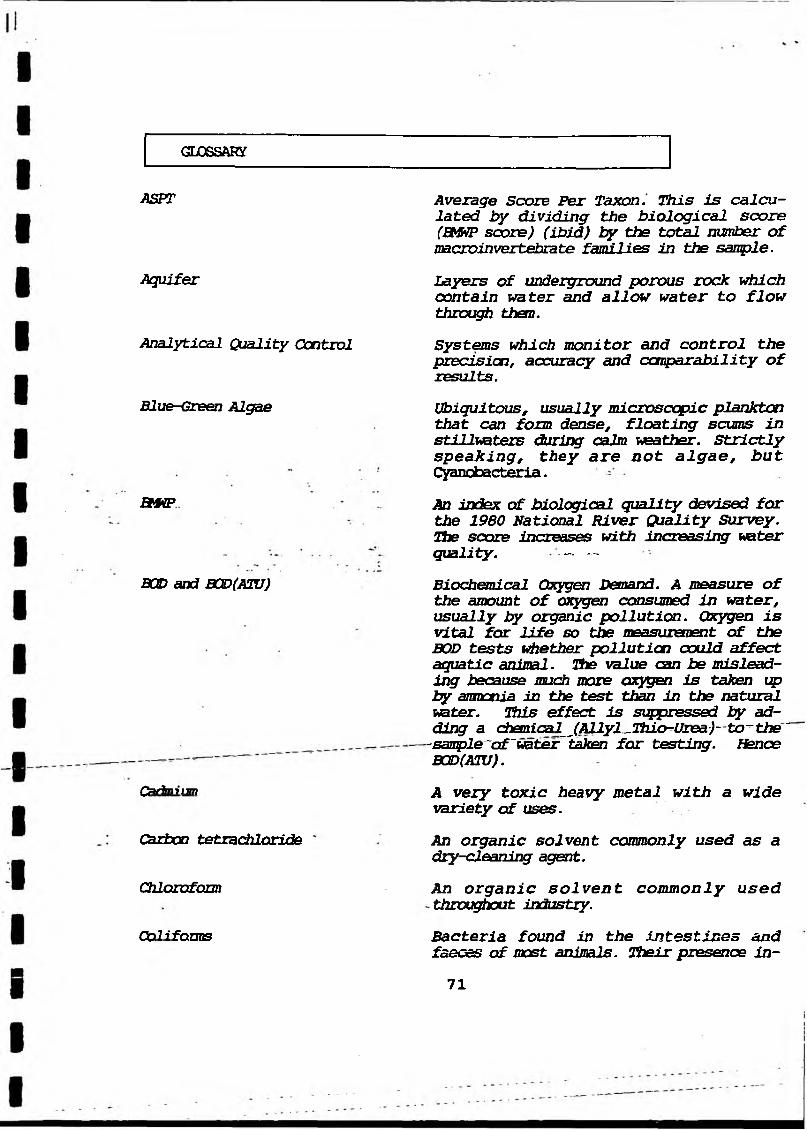
GLOSSARY
ASPT
Aquifer
Analytical Quality Control
Blue-Green Algae
BMP
BCD and BQD(ATV)
Qarftrmiro
Carbon tetrachloride
Chloroform
Coliforms
Average Score Per Taxon.' This is calculated by dividing the biological score (EMfiP score) (ibid) by the total number of nacroinvertabrate families in the sample.
Layers of underground porous rock which contain water and allow water to flow through them.
Systems which monitor and control the precisian, accuracy and comparability of results.
Ubiquitous, usually microscopic plankton that can form dense, floating scums in stillwaters during calm weather. Strictly speaking, they are not algae, but Cyanobacteria.An index of biological quality devised for the 1980 National River Quality Survey. The score increases with increasing water quality. - —Biochemical Oxygen Demand. A measure of the amount of oxygen consumed in water, usually by organic pollution. Oxygen is vital for life so the measurement of the BOD tests whether pollution could affect aquatic animal. The value can be misleading because much more oxygen is taken qp by amonia in the test than in the natural water. This effect is suppressed by adding a chpsnical jAllyl lfoio-Urea)-to^the ~ -sample ~of ~water taken for testing. Hence BOD(ATU).
A very toxic heavy metal with a wide variety of uses.
An organic solvent commonly used as a dry-cleaning agent.
An organic solvent commonly used throughout industry.
Bacteria found in the intestines and faeces of most animals. Their presence in-
71

I
Controlled Waters
CQPA (Pt II)
OOSHH
Cyprinid Fish EOT
Determinand
Direct Data Capture
Dissolving Zinc Anode
Drills
Ecological Quality Index
Environmental Quality Objective
Environmental Impact Assessment
dicates faecal pollution by humans o. animals.
i
All rivers, lakes, groundwaters, estuari and coastal waters.
j
Part II of Ihe Control of Pollution Act 1974. Part II is the section dealin mainly with water. I
iRegulations concerning the Control of Substances Hazardous to Health.
iCoarse fish like roach, dace and bream.
An acronym for Dichloro-diphenyl-■ tetrachloroethane. This is a persistent organochlorine pesticide no longer approved for use in the united Kingdom. IA general name for a characteristic or aspect of water quality. Usually a faa-B ture which can be described numerically as| a result of scientific measurement.
The collection of analytical results /rorri laboratory instruments, by linking the in-® struments directly to a data storage system - usually a microocoputer. |A zinc block found on boats. It is designed to dissolve and prevent corrosionm of other metal fittings on the boat. |The abbreviated name for a group of per-— sistent Organophosphorous insecticides ,m including Aldrin, Dieldrin and Isodr in. ®This describes how close biologicalM quality is to expectations. An index oil 1.0 indicates that the aninetls are unaffected by adverse conditions.
iA Use or target for a Controlled Water, which the NRA will aim to maintain or secure, e.g. a coarse fishery. |A procedure by which a developer describes the effect of his proposals on the vironment. The purpose is to provide formation to the public and to decision
72 i
i
i

Ethyl Acrylate
Eutrophication
Eaecal Coliforms
Groundwater
Harmonised Monitoring Site
Hexachlorobenzene
Hexachlordbutadiene
Invertebrates
-Legal-Ccnsent- -------“ ' ‘
r.irriarte*
HMS
taking bodies. For big projects the procedure is controlled by an EC Directive.
A volatile organic chemical used in the manufacture of plastics.
The process of nutrient enrichment of surface waters; often the cause of unsightly growths of microscopic plants (algae).
Usually taken to be synonymous with Escherichia coli (E.coli). These are coliform (ibid) bacteria characteristic of faecal pollution of mammalian origin. These bacteria are relatively harmless but their absence indicates the absence of harmful micro-organisns.
Underground water especially in or from aquifers (ibid).
A site agreed with the DoE under the Harmonised Monitoring Scheme devised in 1974. The sites are used to assess input loads from rivers to estuaries and identify long term trends.
A fungicide camonly used for treating cereal crops.
An intermediary compound ccttmonly used in the plastics industry, particularly in Europe.
A general term for all animals without backbones,ie. all groups except the vertebrates.
The legal permission to noke a controlled discharge of any effluent or other matter. Consents are issued under the Water Act (1989).
An organochlorine insect icide (1,2,3,4,5,6-hexachlorocyclohexane, also known as Gama-BX).
laboratory Information Management System. This is based on micro-carputers and generates schedules for sampling and analysis, captures data from instruments,73
Look-up T&ble
Mercury
Microcystin-LR
Multiple Regression
NAA
NSA
NWC Class
PCB
Pentadhlorophenol
POLLEASE
and evaluates and archives the results.
i
i
The numbers of permitted failures in a se® of samples is laid down in a Look-u^ Table, which is referred to in the Legal Consent (ibid).
A very toxic heavy metal with a variety of uses.
Iwid&
The most commonly occurring toxin iil blue-green algal blooms. It is produced by a number of blue-green algae.
iA mathematical technique for identifying an association between sets of data, foi^ example, river flow and river quality. INitrate Advisory Area. An area where nitrate concentrations in drinking watei sources exceed or are at risk of the EC Drinking Mater Directive limit, Free advice is offered to farmers cn houm to modify current agricultural practice tcm reduce nitrate leaching to controllea waters.
jNitrate Sensitive Area. An area when nitrate concentrations in drinking water sources exceed or are at risk of the EC Drinking Water Directive limit.\ Payments are name to farmers who voluntarily restrict agricultural practices tc** reduce nitrate leaching to controlledI waters.
A summary of the quality of river Jb&secfl largely on the measured chemical qualityM Used by the Government to report on river quality. Originally devised through National Water Council. “i
Polychlorinated Biphenyls. These sub stances were widely used in the manufac-Mture of electrical insulators.
An organochlorine fungicide, primarily for timber preservation.
uset
A computer-based system for recording pob lution incidents
74 i
i
i

Property Services Agency
River-Needs Consent
River Quality Indices
River Quality Objective SaJmonid Fish Surface Water Taxon
Tetrachloroethylene
Time-Limited Consent
Trichlordhenzene
Trichloroethylene
fteter Act Register 1-2 dichloroethane
95-percentile Standard
1990 River Quality Survey
The organisation that administers and maintains Crown Property.
The quality standard required of an effluent in order to achieve Water Quality Objectives (ibid), usually calculated for seme estimate of the future flow from a treatment works.
A management tool for summarising data used to ensure the sanpling programme is achieved, to set nonagement targets, and to alert management to strategic problems of water quality.See JOxvircnmental Quality Objective.
Game fish, e.g. trout and salmon.
Rivers, canals, lakes or impoundments.
A specific group of macroinvertebrates (a family)
A chlorinated organic solvent commonly used as a dry-cleaning agent.
Legal Consent conditions for the sewage treatment works owned by the Utility, which apply for a limited period of time and only to works where provision has been made for improving the quality of the effluent by capital investment.
A chlorinated organic solvent.
A chlorinated organic solvent used as a dry-cleaning agent.
Formerly the COPA Register (see Part 5).
A chlorinated solvent used as a degreasing agent.
A level of water quality, usually a concentration, which may be exceeded for 5-percent of the time. Many water quality standards are expressed as 95-percentiles.
The national survey of the quality of rivers, canals, lakes and estuaries which was carried out by the NRA in 1990.75