Water Quality Assessment and Monitoring Study:...
203
Water Quality Assessment and Monitoring Study: Bacteria Sources/Pathways in CSO Receiving Waters October 2017 Alternative Formats Available
-
Upload
truongquynh -
Category
Documents
-
view
216 -
download
0
Transcript of Water Quality Assessment and Monitoring Study:...

Water Quality Assessment and Monitoring Study:
Bacteria Sources/Pathways in CSO Receiving Waters
October 2017
Alternative Formats Available

Water Quality Assessment and Monitoring Study: Bacteria Sources/Pathways in CSO Receiving Waters Prepared for: King County Wastewater Treatment Division Submitted by: Timothy Clark, Wendy Eash-Loucks, Kate Macneale, and Dean Wilson King County Water and Land Resources Division Department of Natural Resources and Parks


Water Quality Assessment and Monitoring Study: Bacteria Sources/Pathways in CSO Receiving Waters
King County i October 2017
Acknowledgements The authors would like to thank the following for their contributions to this report:
• The King County Environmental Laboratory, especially the Field Services Unit employees for collecting up to 144 samples over the course of a morning and the Microbiology Unit for performing colony counts of these samples in a single day.
• King County project team members: Judy Pickar (project manager), Dean Wilson (science lead), Bob Bernhard, Mark Buscher, Timothy Clark, Betsy Cooper, Wendy Eash-Loucks, Elizabeth Gaskill, Martin Grassley, Richard Jack, Erica Jacobs, Susan Kaufman-Una, Deborah Lester, Kate Macneale, Chris Magan, Bruce Nairn, Sarah Ogier, Erika Peterson, John Phillips, Cathie Scott, Jim Simmonds, Jeff Stern, Dave White, Mary Wohleb, and Olivia Wright.
• The project’s Science and Technical Review Team members—Virgil Adderley, Mike Brett, Jay Davis, Ken Schiff, and John Stark—for guidance and review of this report.
Citation King County. 2017. Water Quality Assessment and Monitoring Study: Bacteria
Sources/Pathways in CSO Receiving Waters. Prepared by Timothy Clark, Wendy Eash-Loucks, Kate Macneale, and Dean Wilson, Water and Land Resources Division. Seattle, Washington.

Water Quality Assessment and Monitoring Study: Bacteria Sources/Pathways in CSO Receiving Waters
King County ii October 2017
Table of Contents Executive Summary.......................................................................................................................................... viii
Abbreviations and Acronyms ........................................................................................................................ xiv
1.0 Introduction .......................................................................................................................................... 1-1
1.1 Water Quality Assessment and Monitoring Study ............................................................ 1-1
1.2 Rationale and Scope of Bacteria Study .................................................................................. 1-4
1.3 Pathways and Fate of Bacteria in Surface Waters ............................................................. 1-5
1.4 Previous Studies ............................................................................................................................. 1-7
1.4.1 1999 CSO Water Quality Assessment for the Duwamish River and Elliott Bay ................................................................................................................................................. 1-7
1.4.2 2006 Microbial Source Tracking Study in the Green-Duwamish Watershed ................................................................................................................................... 1-8
2.0 Study Areas ........................................................................................................................................... 2-1
2.1 Lake Union/Ship Canal ................................................................................................................ 2-1
2.1.1 Water Circulation ..................................................................................................................... 2-1
2.1.2 Human Uses ................................................................................................................................ 2-2
2.1.3 Potential Upstream Pathways of Bacteria ...................................................................... 2-2
2.1.4 Current Conditions and Long-Term Bacteria Trends ................................................ 2-5
2.2 Duwamish Estuary ........................................................................................................................ 2-5
2.2.1 Water Circulation ..................................................................................................................... 2-6
2.2.2 Human Uses ................................................................................................................................ 2-9
2.2.3 Potential Upstream Pathways of Bacteria ...................................................................... 2-9
2.2.4 Current Conditions and Long-Term Bacteria Trends ............................................. 2-10
2.3 Elliott Bay ....................................................................................................................................... 2-11
2.3.1 Water Circulation .................................................................................................................. 2-11
2.3.2 Human Uses ............................................................................................................................. 2-11
2.3.3 Potential Upstream Pathways of Bacteria ................................................................... 2-14
2.3.4 Current Conditions and Long-Term Trends ............................................................... 2-14
3.0 Methods .................................................................................................................................................. 3-1
3.1 Sample Collection ........................................................................................................................... 3-1
3.2 Laboratory Methods ..................................................................................................................... 3-6
3.3 Geospatial Analysis ....................................................................................................................... 3-7
Water Quality Assessment and Monitoring Study: Bacteria Sources/Pathways in CSO Receiving Waters
King County iii October 2017
3.4 Comparison to Criteria ................................................................................................................ 3-7
3.4.1 EPA and Washington State Bacteria Criteria................................................................. 3-7
3.4.2 Relevance to Study Areas ...................................................................................................... 3-9
4.0 Results and Discussion—Lake Union/Ship Canal .................................................................. 4-1
4.1 Sampling Conditions and CSO Discharges ............................................................................ 4-1
4.1.1 Dry-Weather Sampling .......................................................................................................... 4-1
4.1.2 Wet-Weather Sampling.......................................................................................................... 4-2
4.2 Bacteria Distribution .................................................................................................................... 4-4
4.2.1 Dry-Weather Events ............................................................................................................... 4-4
4.2.2 Wet-Weather Events ............................................................................................................... 4-9
4.3 Discussion ...................................................................................................................................... 4-12
4.3.1 Dry-Weather Findings ......................................................................................................... 4-12
4.3.2 Wet-Weather Findings ........................................................................................................ 4-16
5.0 Results and Discussion—Duwamish Estuary .......................................................................... 5-1
5.1 Sampling Conditions and CSO Discharges ............................................................................ 5-1
5.1.1 Dry-Weather Sampling .......................................................................................................... 5-1
5.1.2 Wet-Weather Sampling.......................................................................................................... 5-1
5.2 Bacteria Distribution .................................................................................................................... 5-3
5.2.1 Dry-Weather Events ............................................................................................................... 5-4
5.2.2 Wet-Weather Events ............................................................................................................... 5-9
5.3 Discussion ...................................................................................................................................... 5-14
6.0 Results and Discussion—Elliott Bay ........................................................................................... 6-1
6.1 Sampling Conditions and CSO Discharges ............................................................................ 6-1
6.1.1 Dry-Weather Sampling .......................................................................................................... 6-1
6.1.2 Wet-Weather Sampling.......................................................................................................... 6-1
6.2 Bacteria Distribution .................................................................................................................... 6-4
6.2.1 Dry-Weather Events ............................................................................................................... 6-4
6.2.2 Wet-Weather Events ............................................................................................................... 6-9
6.3 Discussion ...................................................................................................................................... 6-15
7.0 Summary and Recommendations ................................................................................................ 7-1
7.1 Summary of Study Area Findings ............................................................................................ 7-1
7.1.1 Lake Union/Ship Canal .......................................................................................................... 7-2

Water Quality Assessment and Monitoring Study: Bacteria Sources/Pathways in CSO Receiving Waters
King County iv October 2017
7.1.2 Duwamish Estuary .................................................................................................................. 7-2
7.1.3 Elliott Bay .................................................................................................................................... 7-3
7.2 Recommendations for Future Studies ................................................................................... 7-3
7.2.1 Human and Non-Human Source Tracking ..................................................................... 7-4
7.2.2 Characterization of Baseflow and Stormflow from Stormwater Outfalls .......... 7-4
7.2.3 In Situ Bacteria Decay Rates ................................................................................................ 7-6
8.0 References ............................................................................................................................................. 8-1
Appendix A: Sampling Locations
Appendix B: Kriging Methods and Hot Spot Anaysis
Appendix C: Conductivity and Salinity Maps
Appendix D: Hu-2-Bacteroides Maps
Appendix E: Sampling Results
Appendix F: Barplots of Bacteria and Hu-2-Bacteroides Concentrations
Appendix G: Major Stormwater Basins
Appendix H: Bacteria Survivorship in Surface Waters
Figures Figure 1-1. Reports and study questions answered as part of the Water Quality
Assessment and Monitoring Study. ................................................................................... 1-3
Figure 2-1. Orthoimagery and notable areas in Lake Union/Ship Canal (2012). .................. 2-3
Figure 2-2. Generalized water circulation patterns in Lake Union/Ship Canal. ..................... 2-4
Figure 2-3. Orthoimagery and notable areas in the Duwamish Estuary (2012). ................... 2-7
Figure 2-4. Generalized surface water flow directions in the Duwamish Estuary. ............... 2-8
Figure 2-5. Orthoimagery and notable areas in Elliott Bay (2012). ......................................... 2-12
Figure 2-6. Generalized surface water circulation patterns in Elliott Bay. ............................ 2-13
Figure 3-1. Sampling sites, CSO outfalls, and stormwater outfalls in Lake Union/Ship Canal. ............................................................................................................................................. 3-3
Figure 3-2. Sampling sites, CSOs, and stormwater outfalls in the Duwamish Estuary. ....... 3-4
Figure 3-3. Sampling sites, CSOs, and stormwater outfalls in Elliott Bay. ................................ 3-5
Figure 3-4. Recreational use designations and human exposure areas in Lake Union/Ship Canal. (Waterfront parks also noted.) .................................................. 3-10
Figure 3-5. Recreational use designations and human exposure areas in the Duwamish Estuary. (Waterfront parks also noted.) ...................................................................... 3-11
Water Quality Assessment and Monitoring Study: Bacteria Sources/Pathways in CSO Receiving Waters
King County v October 2017
Figure 3-6. Recreational use designations and human exposure areas in Elliott Bay. (Waterfront parks also noted.) ........................................................................................ 3-12
Figure 4-1. Observed and interpolated bacteria concentrations in Lake Union/Ship Canal for dry-weather event 1 – 1/16/14. Interpolated values computed through Kriging. ....................................................................................................................... 4-6
Figure 4-2. Observed and interpolated bacteria concentrations in Lake Union/Ship Canal for dry-weather event 2 – 7/16/14. Interpolated values computed through Kriging. ....................................................................................................................... 4-7
Figure 4-3. Observed and interpolated bacteria concentrations in Lake Union/Ship Canal for dry-weather event 3 – 9/10/14. Interpolated values computed through Kriging. ....................................................................................................................... 4-8
Figure 4-4. Observed and interpolated bacteria concentrations and CSO discharge volumes in Lake Union/Ship Canal for wet-weather event 1 – 1/29/14. Interpolated values computed through Kriging. ...................................................... 4-13
Figure 4-5. Observed and interpolated bacteria concentrations and CSO discharge volumes in Lake Union/Ship Canal for wet-weather event 2 – 2/18/14. Interpolated values computed through Kriging. ...................................................... 4-14
Figure 4-6. Observed and interpolated bacteria concentrations and CSO discharge volumes in Lake Union/Ship Canal for wet-weather event 3 – 3/17/14. Interpolated values computed through Kriging. ...................................................... 4-15
Figure 5-1. Observed and interpolated bacteria concentrations in the Duwamish Estuary for dry-weather event 1 – 1/22/2014. Interpolated values computed through Kriging. .................................................................................................. 5-6
Figure 5-2. Observed and interpolated bacteria concentrations in the Duwamish Estuary for dry-weather event 2 – 7/1/2014. Interpolated values computed through Kriging. ....................................................................................................................... 5-7
Figure 5-3. Observed and interpolated bacteria concentrations in the Duwamish Estuary for dry-weather event 3 – 8/28/2014. Interpolated values computed through Kriging. .................................................................................................. 5-8
Figure 5-4. Observed and interpolated bacteria concentrations and CSO discharges in the Duwamish Estuary for wet-weather event 1 – 2/12/2014. Interpolated values computed through Kriging. ................................................................................. 5-11
Figure 5-5. Observed and interpolated bacteria concentrations and CSO discharges in the Duwamish Estuaryfor wet-weather event 2 – 3/3/2014. Interpolated values computed through Kriging. ................................................................................. 5-12
Figure 5-6. Observed and interpolated bacteria concentrations and CSO discharges in the Duwamish Estuary for wet-weather event 3 – 5/5/2014. Interpolated values computed through Kriging. ................................................................................. 5-13

Water Quality Assessment and Monitoring Study: Bacteria Sources/Pathways in CSO Receiving Waters
King County vi October 2017
Figure 6-1. Observed and interpolated bacteria concentrations in Elliott Bay for dry-weather event 1 – 1/23/2014. Interpolated values computed through Kriging. ......................................................................................................................................... 6-6
Figure 6-2. Observed and interpolated bacteria concentrations in Elliott Bay for dry-weather event 2 – 6/30/2014. Interpolated values computed through Kriging. ......................................................................................................................................... 6-7
Figure 6-3. Observed and interpolated bacteria concentrations in Elliott Bay for dry-weather event 3 – 8/27/2014. Interpolated values computed through Kriging. ......................................................................................................................................... 6-8
Figure 6-4. Observed and interpolated bacteria concentrations and CSO discharges in Elliott Bay for wet-weather event 1 – 3/4/2014. Interpolated values computed through Kriging. ............................................................................................... 6-12
Figure 6-5. Observed and interpolated bacteria concentrations and CSO discharges in Elliott Bay for wet-weather event 2 – 3/5/2014. Interpolated values computed through Kriging. ............................................................................................... 6-13
Figure 6-6. Observed and interpolated bacteria concentrations and CSO discharges in Elliott Bay for wet-weather event 3 – 10/14/2014. Interpolated values computed through Kriging. ............................................................................................... 6-14
Tables Table 1-1. Elements of the Water Quality Assessment and Monitoring Study. ..................... 1-3
Table 2-1. Seasonal Mann-Kendall trends for fecal coliform bacteria concentrations in Lake Union/Ship Canal. ......................................................................................................... 2-5
Table 2-2. Seasonal Mann-Kendall trends for fecal coliform bacteria concentrations in the Duwamish Estuary. ....................................................................................................... 2-10
Table 2-3. Seasonal Mann-Kendall trends for fecal coliform bacteria concentrations in Elliott Bay. ................................................................................................................................ 2-15
Table 3-1. Laboratory methods and detection limits. ..................................................................... 3-6
Table 3-2. EPA Recommended 2012 Recreational Water Quality Criteria for bacteria in water designated for primary contact recreational use (CFU/100 mL). ...... 3-8
Table 3-3. Washington State water contact fecal coliform bacteria criteria for waterbodies in and near the study areas (Chapter 173-201A WAC). ................. 3-9
Table 4-1. Most recent rain events and associated CSO discharges prior to dry-weather sampling in the Lake Union/Ship Canal study area. ................................. 4-1
Table 4-2. Rain events triggering wet-weather sampling in the Lake Union/Ship Canal study area.................................................................................................................................... 4-2
Water Quality Assessment and Monitoring Study: Bacteria Sources/Pathways in CSO Receiving Waters
King County vii October 2017
Table 4-3. King County and Seattle CSO discharges into the Lake Union/Ship Canal study area within two days of wet-weather sampling. ............................................. 4-2
Table 4-4. Dry-weather E. coli concentrations in the Lake Union/Ship Canal study area (CFU/100 mL; n=132). ........................................................................................................... 4-4
Table 4-5. Wet-weather E. coli concentrations in the Lake Union/Ship Canal study area (CFU/100 mL; n =1 32). .............................................................................................. 4-9
Table 5-1. Most recent rain events and associated CSO discharges prior to dry-weather sampling in the Duwamish Estuary study area. ......................................... 5-1
Table 5-2. Rain events triggering wet-weather sampling in the Duwamish Estuary study area.................................................................................................................................... 5-2
Table 5-3. King County and Seattle CSO discharges into the Duwamish Estuary study area within two days of wet-weather sampling. ......................................................... 5-2
Table 5-4. Dry-weather Enterococcus concentrations in the Duwamish Estuary study area (CFU/100 mL; n = 109). .............................................................................................. 5-4
Table 5-5. Wet-weather Enterococcus concentrations in the Duwamish Estuary study area (CFU/100 mL; n = 109). .............................................................................................. 5-9
Table 6-1. Most recent rain events and associated CSO discharges prior to dry-weather sampling in the Elliott Bay study area. .......................................................... 6-1
Table 6-2. Rain events triggering wet-weather sampling in the Elliott Bay study area. ... 6-2
Table 6-3. King County and Seattle CSO discharges into the Elliott Bay and Duwamish Estuary study areas within two days of wet-weather sampling. .......................... 6-2
Table 6-4. Dry-weather Enterococcus concentrations in the Elliott Bay study area (CFU/100 mL; n = 144). ........................................................................................................ 6-4
Table 6-5. Wet-weather Enterococcus concentrations in Elliott Bay (CFU/100 mL; n = 144). .............................................................................................................................................. 6-9

Water Quality Assessment and Monitoring Study: Bacteria Sources/Pathways in CSO Receiving Waters
King County viii October 2017
EXECUTIVE SUMMARY King County completed a study of bacterial contamination in the waterbodies where it is planning combined sewer overflow (CSO) control projects: Lake Union/Ship Canal, Elliott Bay, and the Duwamish Estuary. The study was prepared as part of a Water Quality Assessment and Monitoring Study, undertaken to explore ways to optimize water quality improvements in these three waterbodies.
Background King County updates its CSO control plan about every five years. Before each update, the County reviews its entire CSO Control Program against conditions that have changed since the last update. In September 2012, the King County Council passed Ordinance 17413 approving an amendment to King County’s long-term CSO control plan. The amended plan includes nine projects to control the County’s remaining 14 uncontrolled CSO locations in Lake Union and the Lake Washington Ship Canal (Lake Union/Ship Canal), Elliott Bay, and the Duwamish Estuary by 2030 to meet the Washington State standard of no more than one overflow per year on average. The recommended projects involve construction of underground storage tanks, green stormwater infrastructure, wet weather treatment facilities, or a combination of approaches. Ordinance 17413 also calls for completion of a Water Quality Assessment and Monitoring Study (assessment) to inform the next CSO control plan update due to the Washington State Department of Ecology (Ecology) in 2019. The ordinance specified that the assessment answer the following questions:
1. What are the existing and projected water quality impairments in receiving waters (waterbodies) where King County CSOs discharge?
2. How do county CSOs contribute to the identified impairments? 3. How do other sources contribute to the identified impairments? 4. What activities are planned through 2030 that could affect water quality in the
receiving waters? Three additional questions will be addressed by the County’s CSO planning team based partly on the results of the assessment:
5. How can CSO control projects and other planned or potential corrective actions be most effective in addressing the impairments?
6. How do various alternative sequences of CSO control projects integrated with other corrective actions compare in terms of cost, schedule, and effectiveness in addressing impairments?
7. What other possible actions, such as coordinating projects with the City of Seattle and altering the design of planned CSO control projects, could make CSO control projects more effective and/or help reduce the costs to WTD and the region of completing all CSO control projects by 2030?

Water Quality Assessment and Monitoring Study: Bacteria Sources/Pathways in CSO Receiving Waters
King County ix October 2017
Study Areas This study focused on areas where uncontrolled CSOs discharge:
• Lake Union/Ship Canal, which includes the waters flowing out of Lake Washington into the Montlake Cut, Portage Bay, Lake Union, the Fremont Cut, and Salmon Bay upstream of the Hiram M. Chittenden Locks. The Locks separate the salt water of Puget Sound from the fresh water of Lake Union.
• Elliott Bay, which encompasses the area east of a line drawn between Duwamish Head in West Seattle and Magnolia Bluff near Smith Cove, including the downtown Seattle waterfront. This area, also known as Inner Elliott Bay, is open to Outer Elliott Bay and Puget Sound to the west and receives freshwater inflows from the Duwamish Estuary.
• The Duwamish Estuary, which includes the East, West, and Lower Duwamish waterways. The estuary receives freshwater flows from the Duwamish River and Green River watershed. The Duwamish Estuary is influenced by tidal exchange with Elliott Bay.
Lake Union/Ship Canal, Elliott Bay, and the Duwamish Estuary are surrounded by the highly urbanized and industrialized city of Seattle. Stormwater, CSOs, and other surface waters drain to these receiving waterbodies. All three waterbodies are on Ecology’s 303(d) list (“polluted waters that require a total maximum daily load [TMDL]”) because of exceedance of the state water quality criteria for fecal coliform (Ecology WAC 173-201A). The presence of fecal coliform bacteria in surface waters indicates the possible presence of pathogenic bacteria, viruses, and protozoans that may pose health risks to humans engaging in water activities or ingesting shellfish. Ambient water quality monitoring of fecal coliform bacteria in the study areas has been conducted since the 1970s. Escherichia coli (E. coli) and Enterococcus have also been monitored but much less extensively. These monitoring programs were designed to understand overall water quality and to track bacterial contamination over time by collecting data on a monthly basis at several stations within each waterbody. Trend analyses from these long-term ambient monitoring data suggest that overall bacterial contamination has decreased since routine monitoring began in the 1970s/early 1980s. The decreasing trend in bacteria levels is in part attributable to CSO and stormwater controls that have been completed to date. Despite these improvements, bacteria are still

Water Quality Assessment and Monitoring Study: Bacteria Sources/Pathways in CSO Receiving Waters
King County x October 2017
present at or above the state water quality criteria at many monitoring stations. Point sources, such as the remaining uncontrolled CSOs that periodically discharge into these waterbodies, likely contribute to these persistent water quality problems. However, recent analyses suggest non-point and unidentified sources are potential important contributors as well. In general, the current ambient monitoring stations are positioned to capture general water quality conditions throughout the waterbodies, but the spatial distribution of stations is not extensive enough identify sources of bacteria.
Study Approach The purpose of this study was to examine bacterial contamination in the three study areas at a spatial resolution sufficient to identify potential areas of concern. The study is a synoptic investigation (i.e., many samples over a short time period) intended to provide information about specific pathways of bacterial contamination, and in some cases can serve as a starting point for identifying specific sources. It is a survey–level analysis that provides detailed spatial information on bacteria levels in the study areas, but limited temporal information, given cost, field collection, and analytical constraints. There were 132 sampling locations in Lake Union/Ship Canal, 144 in Elliott Bay, and 109 in the Duwamish Estuary. Samples were collected every 500 feet along the shoreline of each waterbody, bracketing potential pathways of bacterial contamination. Sampling in Elliott Bay also included offshore sites. Each waterbody was sampled six times: three dry-weather events and three wet-weather (storm) events. In addition to fecal indicator bacteria (E .coli in Lake Union/Ship Canal and Enteroccocus in Elliot Bay and the Duwamish Estuary), a human feces specific genetic tracer was used to assess the human contribution to bacteria levels.
Study Findings General study findings are as follows:
• In storm events sampled, where CSO discharges occurred, there were large amounts of bacteria present, particularly near CSO discharge points. This suggests that CSO discharges can be a dominant pathway of bacteria in the study areas during storm events.
• During smaller storm events and under dry-weather conditions, some bacteria were still found in the study areas. This suggests that other inputs of bacteria — such as from stormwater outfalls and from direct surface runoff and feces deposited from birds, mammals, and illicit discharges — are present These inputs may be substantial, as they may occasionally cause exceedances of the established water quality criteria.
• Contaminated baseflow that discharges through stormwater outfalls and creeks is also a likely pathway of bacteria during dry-weather conditions. Possible signals of such contaminated baseflow were seen in Lake Union/Ship Canal (the Capitol Hill stormwater outfall into Lake Union and the Ballard stormwater outfalls into Salmon Bay) and in the Duwamish Estuary (Longfellow and Hamm creeks and the Hanford stormwater basin into the East Waterway).
Water Quality Assessment and Monitoring Study: Bacteria Sources/Pathways in CSO Receiving Waters
King County xi October 2017
The following sections describe findings for each study area in more detail. Lake Union/Ship Canal
• Concentrations of E. coli in water entering from Lake Washington via the Montlake Cut are low relative to values in southern Lake Union and Salmon Bay during both dry- and wet-weather conditions.
• Despite millions of gallons of effluent discharged from the Montlake and University CSOs during the sampled storm events, Portage Bay E. coli concentrations remain low relative to values further downstream in Lake Union and Salmon Bay. Elevated bacteria levels were detected in southwest Portage Bay. The flushing rate of Portage Bay likely prevents the buildup of bacteria, but stagnation in the southern portion of the bay is possible. Runoff from the shoreline and outflow (baseflow and stormflow) from stormwater outfalls are potential pathways of bacteria in this part of Portage Bay.
• E. coli concentrations in Lake Union were greater in the southern half of the lake relative to the northern portion during two of the three wet-weather events and one of the three dry-weather events. During the remaining events, concentrations in these areas were similar. Because of the dominant flow patterns in the lake, immobility of stormwater discharges and runoff in southern Lake Union may contribute to elevated bacteria concentrations. A signal in southeast Lake Union suggests inputs from the Capitol Hill stormwater drainage basin and the immediate shoreline. In addition, elevated concentrations in this area during a dry-weather event suggest baseflow input from this drainage basin.
• Salmon Bay had the greatest concentration of E. coli during both dry- and wet-weather conditions. Runoff, stormwater, and CSO effluent are likely pathways during wet weather. During dry weather, direct deposition (such as bird droppings), illicit discharge from boats, contaminated baseflow, and other shoreline discharges are likely the primary pathways.
• The data do not suggest that houseboats in Lake Union and Portage Bay are a substantial source of bacteria because no elevated levels were found during dry weather.
• Human feces−associated bacteria were found at greater concentrations in Salmon Bay relative to Lake Union and Portage Bay during two of the three dry-weather events. Additional targeted studies are recommended to identify and control specific sources.
Elliott Bay
• Levels of bacteria are greatest in Elliott Bay near the mouths of the Duwamish Estuary. Outflow from the Duwamish Estuary is the dominant pathway of bacteria to Elliott Bay. Two plumes of bacteria-rich water flowing from the West and East waterways into Elliott Bay were detected. The counterclockwise circulation pattern of Elliott Bay pushes these plumes against the bay’s eastern shore along the
Water Quality Assessment and Monitoring Study: Bacteria Sources/Pathways in CSO Receiving Waters
King County xii October 2017
waterfront. Stormwater and CSO inputs and surface runoff likely augment this volume of water as it travels northward.
• Dry-weather Enterococcus concentrations were typically low (< 10 CFU/100 mL); no spatial trends were observed. Relatively elevated concentrations (30−50 CFU/100 mL) were found at the mouth of the East Waterway during one dry-weather event.1
• Relative to other areas of Elliott Bay, elevated levels of bacteria associated with human feces and Enterococcus were found in the East Waterway during dry-weather in late August. Illicit discharge from boats, leaking septic systems, and contaminated stormwater baseflows are potential pathways.
• Smith Cove (Piers 90 & 91) and the shore near Centennial Park in northern Elliott Bay experienced elevated bacteria concentrations during two of the three wet-weather events. Potential bacteria pathways in this area include runoff from the piers, stormwater collected from Interbay, the Seattle CSO 68, and waters from Elliott Bay’s eastern shore that are pushed towards the area by the dominant circulation pattern.
• During wet-weather events, the surface waters above the Magnolia CSO outfall had low Enterococcus concentrations (less than 40 CFU/100 mL) relative to other regions of Elliott Bay, including nearby Smith Cove. Effluent from the Magnolia CSO, when it does overflow, is diluted and transported from the surface waters to a degree that masks the signal of this outfall in terms of Enterococcus concentrations.
Duwamish Estuary
• The East Waterway consistently experienced elevated bacteria concentrations during both dry- and wet-weather conditions. Bacteria concentrations in the East Waterway were consistently greater than those in the West Waterway and immediately upstream.
• During dry conditions, the elevated bacteria levels in the East Waterway may be linked to lower flow and decreased flushing relative to levels in the West Waterway. Deposition by birds, illicit discharges from boats, and baseflow from the Lander stormwater drainage basin may also serve as bacteria pathways.
• Elevated levels (relative to other areas of the estuary) of human-associated bacteria were found in the East Waterway during dry- and wet-weather conditions. Concentrations were generally a magnitude greater during wet weather. Dry-weather pathways of bacteria associated with human feces in the East Waterway include illicit discharge of boat sanitary systems, baseflow input from stormwater outfalls, and leaking sewage systems.
• A definite signal of the import of bacteria from the Duwamish and Green rivers into the Duwamish Estuary occurred during one of the wet-weather sampling events and one of the dry-weather events. These rivers may occasionally be substantial
1 CFU = colony forming unit.

Water Quality Assessment and Monitoring Study: Bacteria Sources/Pathways in CSO Receiving Waters
King County xiii October 2017
pathways of bacteria during dry- and wet-weather events. These bacteria do not appear to be associated with human feces.
• When elevated concentrations of bacteria enter the Duwamish Estuary from the Duwamish and Green rivers, concentrations of bacteria appear to decay moving downstream until further input occurs via streams, stormwater, or CSOs. This decay is likely due to the increased salinity and sunlight exposure experienced by bacteria as they travel downstream.
• In addition to pathways from the East Waterway, other indications of bacteria inputs include the mouth of Longfellow Creek into the southwestern corner of the West Waterway, the mouth of Hamm Creek in the southern Lower Duwamish Waterway, and the CSOs south of Harbor Island.
Other Assessment Reports This report is one of several reports that have been prepared as part of King County’s Water Quality Assessment and Monitoring Study. Other reports are as follows:
• Three reports describe existing conditions and long-term trends in the Lake Union/Ship Canal, Elliott Bay, and Duwamish Estuary study areas.
• Two reports discuss the methodology and results of selected new studies to improve understanding of existing conditions: a survey of contaminants of emerging concern and a literature review of potential conservative sewage tracers.
• A loadings report discusses present-day contributions of pollutants from various pathways, including stormwater runoff and CSOs, into the study areas and evaluates water quality impairments.
• A future loadings report assesses the potential of planned actions such as CSO control to improve water quality.
• A final report summarizes these analyses and implications.
King County will use the information from the Water Quality Assessment and Monitoring Study to inform the next CSO control plan update. The information from the assessment can also be used to inform regional efforts to continue to improve water and sediment quality.

Water Quality Assessment and Monitoring Study: Bacteria Sources/Pathways in CSO Receiving Waters
King County xiv October 2017
ABBREVIATIONS AND ACRONYMS CFU colony forming unit CSO combined sewer overflow EPA U.S. Environmental Protection Agency FOD frequency of detection GM geometric mean HRT hydraulic residence time KCEL King County Environmental Laboratory MG million gallons MLLW Mean Lower Low Water MST microbial source tracking NPDES National Pollutant Discharge Elimination System qPCR quantitative polymerase chain reaction RWQC Recreational Water Quality Criteria STRT Science and Technical Review Team STV statistical threshold value WQA Water Quality Assessment WRIA Water Resource Inventory Area WTD King County Wastewater Treatment Division

Water Quality Assessment and Monitoring Study: Bacteria Sources/Pathways in CSO Receiving Waters
King County 1-1 October 2017
1.0 INTRODUCTION This report documents the methodology and results of a study that examined bacterial contamination in the three waterbodies where King County is planning combined sewer overflow (CSO) control projects: Lake Union/Ship Canal, the Duwamish Estuary, and Elliott Bay. The study is a part of the Water Quality Assessment and Monitoring Study, undertaken to explore ways to optimize water quality improvements in these waterbodies The following sections describe the Water Quality Assessment and Monitoring Study, rationale and scope of the bacteria study, pathways and fate of bacteria in surface waters, and previous studies.
1.1 Water Quality Assessment and Monitoring Study
King County owns and operates 39 CSO outfalls in the City of Seattle. The County’s 2012 CSO control plan includes nine projects to control 14 uncontrolled CSOs by 2030 to meet the Washington State standard of no more than one overflow per year on a 20-year moving average. The recommended projects involve construction of underground storage tanks, green stormwater infrastructure, and/or wet weather treatment facilities. Four projects are in the Lake Union/Ship Canal area and five in the Duwamish Estuary and Elliott Bay areas. Ordinance 17413, approving the CSO control plan, also calls for completion of a Water Quality Assessment and Monitoring Study (assessment) to inform the next plan update, which is due to regulators in 2019. In September 2013, the King County Council approved the assessment’s scope of work through Motion 13966. The assessment includes a comprehensive scientific and technical analysis of water quality of the receiving waters (“study areas”) where uncontrolled county CSOs discharge (Elliott Bay, Lake Union/Ship Canal, and the Duwamish Estuary). A key component of the Water Quality Assessment and Monitoring Study was to complete water quality characterizations of the study areas using data previously collected from a variety of monitoring programs and studies. The characterizations included assessment of current water, sediment, and fish and shellfish tissue quality and other indicators of ecological health; evaluation of long-term trends in conditions over time; comparison to Washington State water and sediment quality standards to help identify impairments; and estimation of loadings to these waterbodies from contaminant pathways and expected future loadings following planned water quality improvement actions. Early in the assessment, a number of gaps were identified in the existing data that if filled, would provide critical information on existing conditions in the study areas. Studies were identified to fill the data gaps and three were selected for implementation: sources and pathways of bacteria, chemical sewage tracers, and contaminants of emerging concern.
Water Quality Assessment and Monitoring Study: Bacteria Sources/Pathways in CSO Receiving Waters
King County 1-2 October 2017
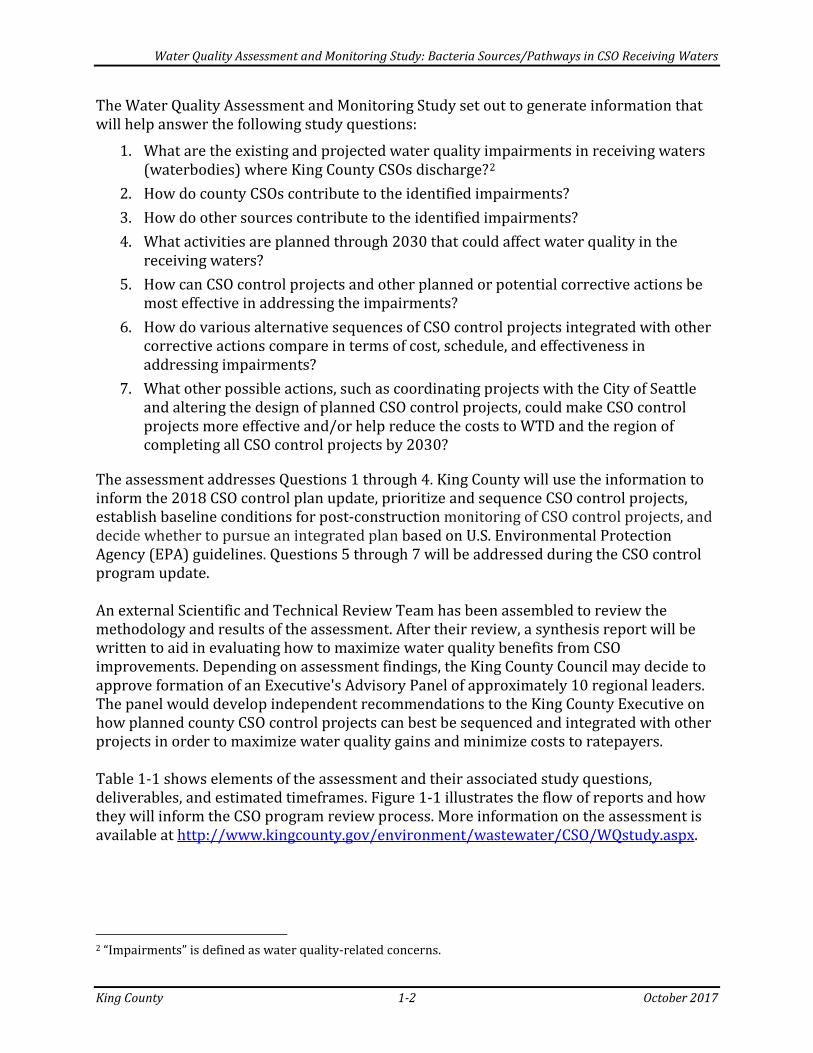
The Water Quality Assessment and Monitoring Study set out to generate information that will help answer the following study questions:
1. What are the existing and projected water quality impairments in receiving waters (waterbodies) where King County CSOs discharge?2
2. How do county CSOs contribute to the identified impairments? 3. How do other sources contribute to the identified impairments? 4. What activities are planned through 2030 that could affect water quality in the
receiving waters? 5. How can CSO control projects and other planned or potential corrective actions be
most effective in addressing the impairments? 6. How do various alternative sequences of CSO control projects integrated with other
corrective actions compare in terms of cost, schedule, and effectiveness in addressing impairments?
7. What other possible actions, such as coordinating projects with the City of Seattle and altering the design of planned CSO control projects, could make CSO control projects more effective and/or help reduce the costs to WTD and the region of completing all CSO control projects by 2030?
The assessment addresses Questions 1 through 4. King County will use the information to inform the 2018 CSO control plan update, prioritize and sequence CSO control projects, establish baseline conditions for post-construction monitoring of CSO control projects, and decide whether to pursue an integrated plan based on U.S. Environmental Protection Agency (EPA) guidelines. Questions 5 through 7 will be addressed during the CSO control program update. An external Scientific and Technical Review Team has been assembled to review the methodology and results of the assessment. After their review, a synthesis report will be written to aid in evaluating how to maximize water quality benefits from CSO improvements. Depending on assessment findings, the King County Council may decide to approve formation of an Executive's Advisory Panel of approximately 10 regional leaders. The panel would develop independent recommendations to the King County Executive on how planned county CSO control projects can best be sequenced and integrated with other projects in order to maximize water quality gains and minimize costs to ratepayers. Table 1-1 shows elements of the assessment and their associated study questions, deliverables, and estimated timeframes. Figure 1-1 illustrates the flow of reports and how they will inform the CSO program review process. More information on the assessment is available at http://www.kingcounty.gov/environment/wastewater/CSO/WQstudy.aspx.
2 “Impairments” is defined as water quality-related concerns.

Water Quality Assessment and Monitoring Study: Bacteria Sources/Pathways in CSO Receiving Waters
King County 1-3 October 2017
Table 1-1. Elements of the Water Quality Assessment and Monitoring Study.
Element Applicable Study
Question
Deliverable Timeframe
Review and analyze existing scientific and technical data on impairments in Lake Union/Ship Canal, Duwamish Estuary, and Elliott Bay.
1 Area reports: • Elliott Bay • Lake Union/Ship Canal • Duwamish Estuary
2013–2017
Conduct targeted data gathering and monitoring to fill some of the identified gaps in scientific data on water quality in these receiving waters.
1,2,3 Data gaps analysis reporta Data gap study reports: • Bacteria • Contaminants of
emerging concern • Literature review of
conservative sewage tracers
2014–2017
Identify and quantify the current (2015) pathways of contaminants into the receiving waters.
2,3 Loadings Report 2015–2017
Identify changes in contaminant loadings between 2015 and 2030, including the potential impact of planned corrective actions on identified impairments in the waterbodies.
1,2,3,4 Future Loadings Report 2015–2017
Summarize scientific and technical data collected and reviewed during the assessment.
1,2,3,4 Synthesis Report 2015–2017
a Identification and Assessment of New Studies to Improve Understanding of Existing Conditions.
Figure 1-1. Reports and study questions answered as part of the Water Quality Assessment and
Monitoring Study.
• Three reports on existing data:
• Lake Union/Ship Canal
• Elliott Bay • Duwamish
Estuary
Study Question 1: Existing
impairments
• Loadings Reports
Study Questions 1-4: How county
CSOs and other sources contribute
to impairments, and planned
corrective activities
• Reports on three new studies:
• Bacteria Sources• Contaminants of
Emerging Concern
• Method to Trace Sewage
Study Questions 1-3: Exising impairments
and how county CSOs and other
sources contribute to impairments
• Synthesis Report
• Summary and Analysis
Study Questions 1-4:
• CSO Control Program review process
Study Questions 5-7: Effective CSO
sequences
Data Gap Analysis Report

Water Quality Assessment and Monitoring Study: Bacteria Sources/Pathways in CSO Receiving Waters
King County 1-4 October 2017
1.2 Rationale and Scope of Bacteria Study The Washington State Department of Ecology lists waterbodies where beneficial uses—such as drinking, recreation, aquatic habitat, and industrial use—are impaired by pollution, commonly referred to as the 303(d) list (Chapter 173-201A WAC). All three waterbodies are on Ecology’s 303(d) list because of elevated bacteria levels. A primary concern related to bacterial contamination is the potential human health risk. Members of two bacteria groups, coliforms (such as fecal coliforms and Escherichia coli [E. coli]) and fecal streptococci (such as Enterococcus), are used as indicators of bacterial contamination in water because they are commonly found in human and animal feces. In the past, fecal coliform bacteria have been used as the primary indictor. Recently, EPA began recommending E. coli or Enterococcus as better indicators of health risk. Many states, including Washington, continue to use fecal coliform bacteria as the indicator bacteria for water quality criteria. E. coli and Enterococcus were used in this study to better identify human health risk. Although generally not harmful, indicator bacteria suggest the possible presence of pathogenic bacteria, viruses, and protozoans that also live in human and animal digestive systems. Their presence in surface waters suggests that pathogenic microorganisms may also be present and that swimming and/or eating shellfish may be a health risk. E. coli and Enterococcus are more specific than fecal coliform bacteria to the feces of humans and other warm-blooded animals. Fecal coliform bacteria also include bacteria known to exist in the environment outside the intestines of animals. Ambient water quality monitoring of fecal coliform bacteria has been conducted in the three study areas since the 1970s. E. coli and Enterococcus have also been monitored but much less extensively. These monitoring programs are designed to understand overall water quality and to track bacterial contamination over time by collecting data monthly from several stations in each waterbody. The ambient monitoring stations are positioned to capture general conditions throughout the waterbodies; the spatial distribution of stations is not sufficient to identify sources. Unidentified sources need to be found and addressed in order to meet water quality criteria for bacteria and to control point sources. Trend analysis of long-term ambient monitoring data suggests that overall bacterial contamination in the three waterbodies has decreased over time (King County, 2017a, b, and c). This decreasing trend in fecal coliform bacteria is in part attributable to CSO and stormwater controls, improvements in sewer and septic systems, and improvements in upstream agricultural practices in the Green-Duwamish watershed. Despite these improvements, bacteria are present at or above the Washington State water quality criteria at many stations. Point sources, such as the remaining uncontrolled CSOs, likely contribute to these persistent water quality problems, but recent analyses suggest non-point and unidentified sources are important contributors as well (for example, King County, 2007). The purpose of this study is to examine bacterial contamination in the three waterbodies at a spatial resolution sufficient to identify potential areas of concern using fecal indicator

Water Quality Assessment and Monitoring Study: Bacteria Sources/Pathways in CSO Receiving Waters
King County 1-5 October 2017
bacteria. For the reasons described above, the fecal indicator bacteria chosen for sampling and analyses were E. coli in Lake Union/Ship Canal and Enterococcus in the Duwamish Estuary and Elliott Bay). The study is a synoptic investigation (i.e., many samples over a short time period) intended to better understand specific pathways of contamination. It is a survey-level analysis that is spatially explicit but temporally limited because of cost, field collection, and analytical constraints. In addition to E. coli and Enterococcus, which indicate the general presence of feces, a human-specific genetic tracer for Bacteroides spp. was used in some samples to assess the contribution of human feces to bacterial contamination. Bacteroides spp. are an anaerobic species of bacteria commonly found in human fecal material. They constitute a significant component of human fecal material and therefore are an indication of human fecal contamination. Because of their short survival time and inability to reproduce in the environment, Bacteroides spp. in surface waters is an indication of recent human pollution, as opposed to bird or canine feces. The human-specific genetic marker, HF183, can be measured through real-time quantitative polymerase chain reaction (qPCR) analysis. It is not feasible to estimate the survival rate of indicator bacteria (E. coli and Enterococcus) for the study areas because of the multitude of factors affecting survivorship and the variability of these factors. An order-of-magnitude decrease in concentration may occur in under an hour or after two or more days. It can generally be assumed that bacteria in the water are not growing but rather decaying at some rate over time. The survival rate of indicator bacteria in fresh water and salt water depends primarily on solar radiation, salinity, temperature, nutrient availability, presence of organic matter, predation by protozoa, and presence of algal toxins; of these factors, solar radiation has the greatest influence (Alkan et al., 1995; Davies-Colley et al., 1994;Gameson and Gould, 1975; McCambridge and McMeekin, 1981; Noble et al., 2004; Rozen and Belkin, 2001; Sinton et al., 1994, 1999, and 2002; Whitman et al., 2004). The survival rate of human fecal Bacteroides markers has not been as rigorously characterized. Solar radiance, salinity, temperature, predation, and particulate size and concentration have been found to affect marker decay rates (Green et al., 2011). Harwood et al. (2014) recently published a thorough review of microbial source tracking literature, which served as the basis for examining survivorship of the Bacteroides genetic markers. Generally, Bacteroides markers are expected to persist on a shorter timescale than indicator bacteria. Further discussion of the individual factors influencing bacteria survivorship is presented in Appendix H.
1.3 Pathways and Fate of Bacteria in Surface Waters
Bacteria levels depend on the input of bacteria to surface waters through stormwater outfalls, surface runoff, direct discharges, CSOs, and upstream sources; the transport and dilution of bacteria in the waterbody; and the survival rate of the bacteria. Within each

Water Quality Assessment and Monitoring Study: Bacteria Sources/Pathways in CSO Receiving Waters
King County 1-6 October 2017
waterbody in a study area, prevailing flow patterns dictate water movement; the direction and magnitude can vary by location and depth. Vertical and horizontal mixing will lead to the dilution of entering waters containing bacteria. Chapter 2 describes circulation patterns for each study area. The following are bacteria pathways to the three study areas:
• Stormwater as direct surface runoff. Runoff from land or structures near waterbodies that does not enter the stormwater conveyance system may reach waterbodies through direct overland flow. Nearby sources where mammals or birds may deposit feces include waterfront parks, docks and piers, boats, and the shoreline.
• Stormwater from stormwater conveyance system. In the urban environment, much of the surface runoff enters the stormwater conveyance system. Ecology recently compiled 2007─2012 National Pollutant Discharge Elimination System (NPDES) stormwater characterization monitoring data from King, Pierce, and Clark counties; the cities of Seattle and Tacoma; and the ports of Seattle and Tacoma. The compilation found that fecal coliform concentrations were significantly higher during the dry season (median: 1,200 CFU/100 mL) compared with the wet season (median: 300 CFU/100 mL) (Ecology, 2015).3 The higher concentrations may be due to increased domestic and wildlife sources, decreased dilution, and increased persistence of bacteria under certain conditions such as humidity and rainfall patterns (Hathaway et al., 2010). Sediment in stormwater conveyance pipes may also be reservoirs for bacteria. The concentration in stormwater of the HF183 genetic marker for human-specific Bacteroides spp. has not been well characterized.
• Baseflow as direct runoff or from a stormwater outfall. The majority of baseflow in stormwater pipes is assumed to originate from groundwater intrusion; additional sources include irrigation, car washes, overflow from lakes and ponds, and cross-connected sanitary sewer lines (Brandes et al., 2005; Grimmond and Oke, 1986). Although there is decreased infiltration in the impervious urban environment, urban groundwater may be augmented by leakages from water, stormwater, wastewater, and piped stream infrastructure. Groundwater contaminated from leaking wastewater pipes may contribute enteric (“gut”) bacteria to baseflow (for example, Belt et al., 2012, and Lerner, 2002).
• CSOs. CSOs discharges are typically composed of approximately 90 percent stormwater and 10 percent wastewater. Domestic sewage in wastewater containing human feces augmented by stormwater input contains extremely high levels of bacteria. The interquartile range of fecal coliform bacteria for King County CSO effluent is 74,000 CFU/100 mL to 500,000 CFU/100 mL (King County, 2009). The concentrations of the HF183 genetic marker for human-specific Bacteroides spp. in King County CSO effluent have not been well characterized. A single sample of influent to the West Point wastewater treatment plant in May 2014 during dry weather found HF183 concentrations ranging from 4.6*108 to 1.6*109 genetic copies
3 CFU = colony forming unit.

Water Quality Assessment and Monitoring Study: Bacteria Sources/Pathways in CSO Receiving Waters
King County 1-7 October 2017
per liter (King County, unpublished data). In Belgium, Seurinck et al. (2005) found that HF183 concentrations ranged from 8.4±0.1*105 to 7.2±1.1*109 genetic copies per gram of wet human feces and 5.9±0.7*109 to 3.1±0.3*1010 copies per liter of influent to a wastewater treatment plant.4 Ahmed et al. (2010) found a similar range of 1.2*107 to 3.9*108 copies per gram of wet human feces.
• Sediment resuspension. Stream, lake, and estuarine sediments provide an environment suitable for the extended survival and possible growth of bacteria (Burton et al., 1987; Doyle et al., 1992; Gerba and McLeod, 1976; LaLiberte and Grimes, 1982; Sherer et al., 1992), and bacteria concentrations in sediments are typically higher than in the overlying water. Wave action, subsurface currents, propeller-wash, and physical perturbation may resuspend lake and estuarine sediments. Stream sediments may act as a source of bacteria to the overlying waters through resuspension caused by storm events and other physical perturbations (Jamieson et al., 2005). Bacteria resuspension during storm events occurs when stream flows are increasing, which suggests a finite reservoir of sediment-associated bacteria.
• Upstream and tributary waterbodies. Bacteria in upstream and tributary waterbodies and sediments can enter the downstream waterbody. Streams will transport bacteria entering from surface runoff, stormwater, and CSOs downstream to receiving waterbodies.
• Direct discharge. Direct discharge includes fecal material immediately deposited by warm-blooded animals (mammals and birds), illicit wastewater discharges, and any other discharges that flow directly to surface waters. This occurs during both dry- and wet-weather conditions.
1.4 Previous Studies The following sections summarize the results of two previous studies that provide insight into bacteria concentrations in the study areas:
• The Combined Sewer Overflow Water Quality Assessment for the Duwamish River and Elliott Bay modeled bacteria, viruses, and protozoa in the Duwamish Estuary and Elliott Bay under 1999 baseline conditions and a scenario with no CSOs (King County, 1999).
• In 2006, King County published a report on microbial source tracking for the Green-Duwamish watershed that included sites at the mouth of Hamm Creek and upstream of the confluence of the Green and Duwamish rivers (King County, 2006).
1.4.1 1999 CSO Water Quality Assessment for the Duwamish River and Elliott Bay
The 1999 Combined Sewer Overflow Water Quality Assessment (WQA) for the Duwamish River and Elliott Bay modeled fecal coliform bacteria, enteric bacteria (E. coli, Salmonella, 4 Whether the wastewater sampled at the Ossemeersen, Belgium, treatment plant contained stormwater was not noted. The city is on a combined sewer system, but samples were taken in summer when rainfall is low.
Water Quality Assessment and Monitoring Study: Bacteria Sources/Pathways in CSO Receiving Waters
King County 1-8 October 2017
Yersinia), enteric viruses, and Giardia in the Duwamish Estuary and Elliott Bay under baseline conditions (1999 conditions including CSO discharges) and under no CSO conditions. The modeled data were used for human health risk assessments. The modeled survival of pathogens and indicator bacteria was based on estimates by Feachem et al. (1983). Sunlight and ultraviolet radiation were not included in the estimates of survival rates. The model could not be calibrated to virus and Giardia results because of insufficient monitoring data; only CSO contributions of viruses and Giardia were modeled; and stormwater inputs of viruses and Giardia were not calculated. Thus, the “no CSO scenario” showed no concentrations of these pathogens. The WQA found risks from viruses and Giardia to people who swim during or immediately after a CSO event, primarily in the Duwamish Estuary and along the eastern shore of Elliott Bay. Relative to baseline conditions, risks of infection from direct contact with viruses and Giardia throughout the Duwamish Estuary and along the Elliott Bay shoreline were predicted to decrease with removal of CSOs. Predicted fecal coliform concentrations indicated frequent risks of infection from consumption of shellfish under both the baseline and the no CSO scenario.
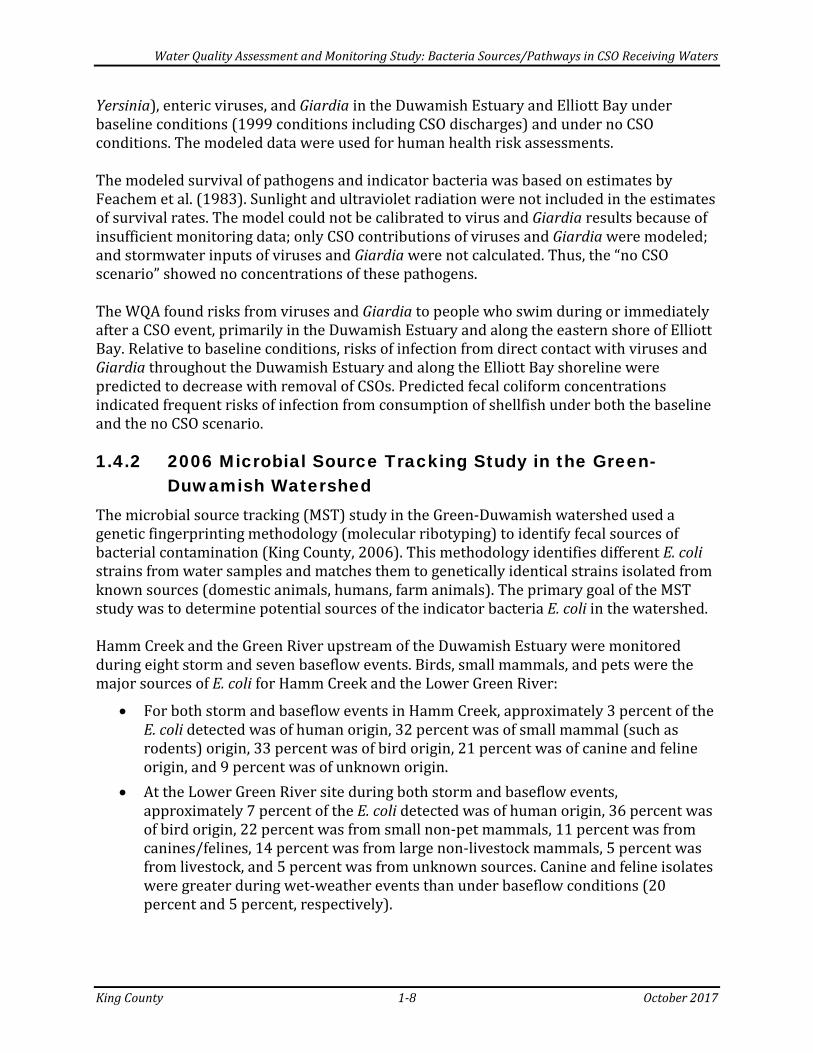
1.4.2 2006 Microbial Source Tracking Study in the Green-Duwamish Watershed
The microbial source tracking (MST) study in the Green-Duwamish watershed used a genetic fingerprinting methodology (molecular ribotyping) to identify fecal sources of bacterial contamination (King County, 2006). This methodology identifies different E. coli strains from water samples and matches them to genetically identical strains isolated from known sources (domestic animals, humans, farm animals). The primary goal of the MST study was to determine potential sources of the indicator bacteria E. coli in the watershed. Hamm Creek and the Green River upstream of the Duwamish Estuary were monitored during eight storm and seven baseflow events. Birds, small mammals, and pets were the major sources of E. coli for Hamm Creek and the Lower Green River:
• For both storm and baseflow events in Hamm Creek, approximately 3 percent of the E. coli detected was of human origin, 32 percent was of small mammal (such as rodents) origin, 33 percent was of bird origin, 21 percent was of canine and feline origin, and 9 percent was of unknown origin.
• At the Lower Green River site during both storm and baseflow events, approximately 7 percent of the E. coli detected was of human origin, 36 percent was of bird origin, 22 percent was from small non-pet mammals, 11 percent was from canines/felines, 14 percent was from large non-livestock mammals, 5 percent was from livestock, and 5 percent was from unknown sources. Canine and feline isolates were greater during wet-weather events than under baseflow conditions (20 percent and 5 percent, respectively).

Water Quality Assessment and Monitoring Study: Bacteria Sources/Pathways in CSO Receiving Waters
King County 2-1 October 2017
2.0 STUDY AREAS This chapter describes water circulation and human uses of the three waterbodies examined in this study. The descriptions rely on information from three water quality assessments completed as part of this Water Quality Assessment and Monitoring Study: Lake Union/Ship Canal (King County, 2017c), the Duwamish Estuary (King County, 2017a), and Elliott Bay (King County, 2017b).
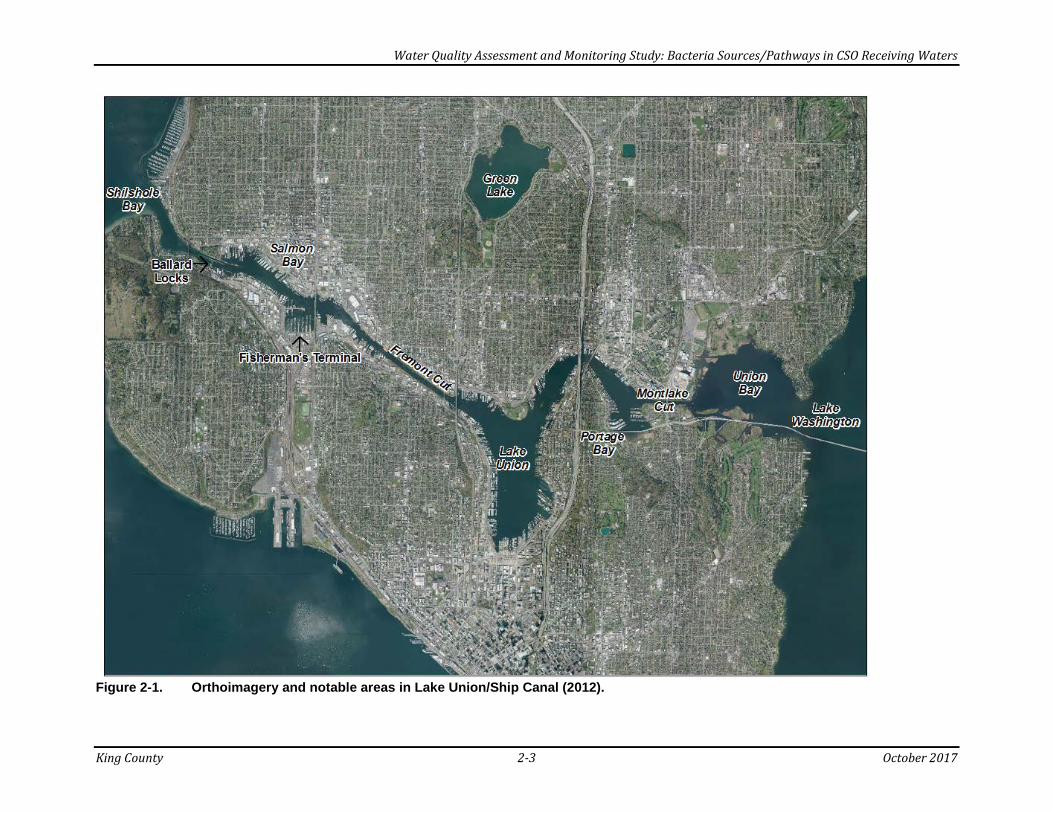
2.1 Lake Union/Ship Canal The Lake Union/Ship Canal study area was divided into three sections for this study: Salmon Bay, Lake Union, and Portage Bay (Figure 2-1). The study area is bordered by Seattle on all sides. The shoreline is widely developed with docks, houseboats, and bulkheads; very little natural shoreline exists. Southern Portage Bay has a small amount of natural shoreline and shallow water habitat, and dozens of beavers have been observed residing there.
2.1.1 Water Circulation Lake Union/Ship Canal forms the mouth of the Cedar River watershed. The dominant surface water flow pattern is from east to west (Figure 2-2). Circulation is likely dominated by the inflow from Lake Washington. Water generally passes from Lake Washington through the Montlake Cut into Portage Bay, through northern Lake Union, out into the Fremont Cut and Salmon Bay, and finally into Puget Sound’s Shilshole Bay through the Hiram M. Chittenden Locks. This flow pattern can be treated as a river with the Locks at the downstream outlet and the Montlake Cut at the upstream inlet. This dominant flow pattern largely circumvents the southern portion of Lake Union. The water of southern Lake Union will generally flow out through the Fremont Cut, although the water may reside for a prolonged period relative to the water that passes through northern Lake Union. The hydraulic residence time (HRT) of Lake Union/Ship Canal is estimated to be 10 days; the HRT is greater in the summer during low flow conditions (26 to 30 days for the entire system) and lower in the winter during higher flow conditions (5 to 7 days) (King County, 2015c). Portage Bay and Salmon Bay have shorter HRTs than Lake Union (1 to 2 days on an annual basis). Stagnation (little circulation and movement of water) in the southern portion of the main body of Lake Union and in the southwestern portion of Portage Bay is possible during periods of dominant north-to-south movement (strong northerly wind) or minimal circulation (low wind and low incoming flow). The mean and maximum depths of Lake Union/Ship Canal are 8.3 and 15.8 m, respectively. Portage and Salmon bays are shallower than Lake Union. Vertical mixing in Lake Union may be somewhat limited by thermal or saline stratification. Summertime stratification occurs in the Lake Union basin with a thermocline depth of approximately 10 m. The volume of the summer epilimnion is roughly 78 percent of the basin’s total volume.

Water Quality Assessment and Monitoring Study: Bacteria Sources/Pathways in CSO Receiving Waters
King County 2-2 October 2017
Intruding salt water from summer Locks operations may enter Lake Union; remain for an extended period, potentially through the winter and spring; and isolate a discrete volume of water from mixing. The depth of the chemocline depends on the volume of intruding salt water and the meteorological variables during its establishment. The saltwater layer may comprise between 0 and 20 percent of the lake’s volume. Existing data suggest that Salmon and Portage bays have not been impacted by thermal or saline stratification.
2.1.2 Human Uses The land use surrounding Lake Union/Ship Canal is predominately urban. Industry is found primarily along Salmon Bay and the Ship Canal, and mid-density residential and commercial developments are found along the shores of Lake Union and Portage Bay. Commercial and industrial marinas are common throughout the water system. The 19.1-acre Gas Works Park, site of the former Seattle Gas Light Company gasification plant, is located on the northern shore of Lake Union. The Port of Seattle operates Fisherman’s Terminal, a commercial and recreational boat moorage site, in Salmon Bay. More than 400 houseboats and floating homes are found along Lake Union’s eastern shore and Portage Bay’s western shore. In 1967, Seattle municipal code required that houseboats be connected to the sewer system to mitigate wastewater discharge directly into the lake. Lake Union boasts scenic views of Seattle. It is heavily used recreationally by motorized craft and sailboats, in addition to kayaking, paddle-boarding, rowing, and other low-speed activities. A speed limit of 7 knots throughout the area maintains an environment favorable for small watercraft. Swimming is not allowed at Gas Works Park, and no swimming beaches exist on Lake Union. Despite the lack of facilities, swimming and other direct contact activities occur regularly. In the recently redeveloped South Lake Union Park, a beach designated for canoe launching has been used as an unsanctioned swimming beach. Limited data exist on the fish catch and consumption rates by anglers in Lake Union/Ship Canal, but fishing activity has been observed (King County, 2003). Lake Union also provides a landing and takeoff strip for commercial floatplanes.
2.1.3 Potential Upstream Pathways of Bacteria Potential upstream bacteria pathways for Lake Union/Ship Canal are Lake Washington via the Montlake Cut and baseflow and stormwater discharged from stormwater outfalls. The presence of baseflow has not been examined at many stormwater outfalls that discharge to the study area. Two outfalls, the Densmore Drain and an outfall draining a portion of the University District, have been examined for baseflow volume and constituents. The partially separated sewer areas of Ballard, Fremont, Wallingford, University District, Capitol Hill, and Portage Bay are neighborhood drainage basins that may also contribute baseflow inputs to Lake Union/Ship Canal.
Water Quality Assessment and Monitoring Study: Bacteria Sources/Pathways in CSO Receiving Waters
King County 2-3 October 2017
Figure 2-1. Orthoimagery and notable areas in Lake Union/Ship Canal (2012).

Water Quality Assessment and Monitoring Study: Bacteria Sources/Pathways in CSO Receiving Waters
King County 2-4 October 2017
Figure 2-2. Generalized water circulation patterns in Lake Union/Ship Canal.

Water Quality Assessment and Monitoring Study: Bacteria Sources/Pathways in CSO Receiving Waters
King County 2-5 October 2017
2.1.4 Current Conditions and Long-Term Bacteria Trends The Lake Union/Ship Canal water quality assessment included discussion of long-term trends and recent conditions (2004 through 2013) for fecal coliform bacteria (King County, 2017c). Monthly and bimonthly samples for analysis of fecal coliform bacteria have been collected at 1 m below the surface at five sites in the study area (Table 2-1). Generally, fecal coliform bacteria concentrations were lowest at the Montlake Cut site and increased moving downstream. From 2004 to 2013, violations of the State of Washington fecal coliform water quality criteria occurred commonly near the Locks−Salmon Bay but never at Montlake Cut. Fecal coliform bacteria have decreased at all sampling sites in Lake Union/Ship Canal from the mid-1970s through 2013 at rates ranging from 0.62 to 1.60 CFU/100 mL per year as determined by Seasonal Mann-Kendall tests (Table 2-1). The Locks−Salmon Bay site experienced the greatest decrease in fecal coliform bacteria. This site has historically shown the greatest variation and spikes in the annual geometric mean, but since 2008, the means have remained consistently low. This decrease, along with the reduction in southwest Lake Union, may be attributed to the completion and optimization of the Elliott West wet weather treatment facility, which decreased outflow from the King County Dexter Ave CSO and Seattle CSOs 124 and 127 in south Lake Union, installation of green stormwater infrastructure in the Ballard drainage basin, and other source control improvements. Table 2-1. Seasonal Mann-Kendall trends for fecal coliform bacteria concentrations in Lake
Union/Ship Canal.
Site Years Evaluated Direction Significance p-value Magnitude
(CFU/100 mL/yr) Locks−Salmon Bay 1976–2013 ⇩ *** < 0.0001 –1.60 Fremont–NW Lake Union 1992–2008 ⇩ ** 0.0497 –1.00
Dexter–SW Lake Union 1984–2013 ⇩ *** < 0.0001 –1.02
NE Lake Union–Portage Bay 1992–2008 ⇩ *** < 0.0001 –1.57
Montlake Cut 1984–2013 ⇩ *** < 0.0001 –0.62 Adjusted p-values were calculated using three-day prior rainfall as a covariate and corrected for inter-block covariance. n.s. = not significant (p > 0.10); * = marginally significant (p = 0.05-0.10); ** = significant (p = 0.01-0.05); *** = highly significant (p < 0.01).
2.2 Duwamish Estuary The Duwamish Estuary includes the lowest 6.3 miles of the Duwamish River (as measured from the northernmost tip of Harbor Island). The estuary includes all of Harbor Island (a manmade industrial area of approximately 0.6 square mile) that fronts Elliott Bay, the East and West waterways that bound Harbor Island, and the Lower Duwamish Waterway that includes an additional 4.8 miles of cut channel upstream of the southern tip of Harbor Island (Figure 2-3). At the southern terminus of the estuary, the Turning Basin is
Water Quality Assessment and Monitoring Study: Bacteria Sources/Pathways in CSO Receiving Waters
King County 2-6 October 2017
maintained as a trap for sediment carried downstream by the Green-Duwamish River system. Frequent dredging of the basin is necessary to prevent the accumulation of sand in the lower reaches of the waterways.
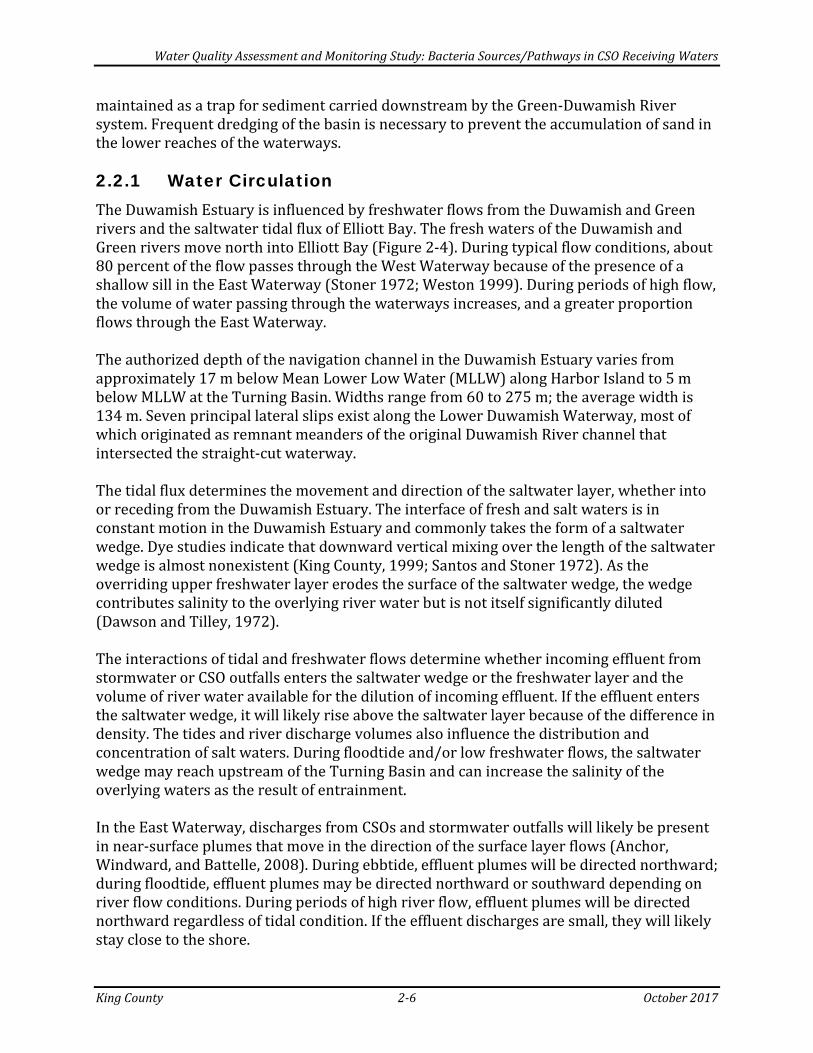
2.2.1 Water Circulation The Duwamish Estuary is influenced by freshwater flows from the Duwamish and Green rivers and the saltwater tidal flux of Elliott Bay. The fresh waters of the Duwamish and Green rivers move north into Elliott Bay (Figure 2-4). During typical flow conditions, about 80 percent of the flow passes through the West Waterway because of the presence of a shallow sill in the East Waterway (Stoner 1972; Weston 1999). During periods of high flow, the volume of water passing through the waterways increases, and a greater proportion flows through the East Waterway. The authorized depth of the navigation channel in the Duwamish Estuary varies from approximately 17 m below Mean Lower Low Water (MLLW) along Harbor Island to 5 m below MLLW at the Turning Basin. Widths range from 60 to 275 m; the average width is 134 m. Seven principal lateral slips exist along the Lower Duwamish Waterway, most of which originated as remnant meanders of the original Duwamish River channel that intersected the straight-cut waterway. The tidal flux determines the movement and direction of the saltwater layer, whether into or receding from the Duwamish Estuary. The interface of fresh and salt waters is in constant motion in the Duwamish Estuary and commonly takes the form of a saltwater wedge. Dye studies indicate that downward vertical mixing over the length of the saltwater wedge is almost nonexistent (King County, 1999; Santos and Stoner 1972). As the overriding upper freshwater layer erodes the surface of the saltwater wedge, the wedge contributes salinity to the overlying river water but is not itself significantly diluted (Dawson and Tilley, 1972). The interactions of tidal and freshwater flows determine whether incoming effluent from stormwater or CSO outfalls enters the saltwater wedge or the freshwater layer and the volume of river water available for the dilution of incoming effluent. If the effluent enters the saltwater wedge, it will likely rise above the saltwater layer because of the difference in density. The tides and river discharge volumes also influence the distribution and concentration of salt waters. During floodtide and/or low freshwater flows, the saltwater wedge may reach upstream of the Turning Basin and can increase the salinity of the overlying waters as the result of entrainment. In the East Waterway, discharges from CSOs and stormwater outfalls will likely be present in near-surface plumes that move in the direction of the surface layer flows (Anchor, Windward, and Battelle, 2008). During ebbtide, effluent plumes will be directed northward; during floodtide, effluent plumes may be directed northward or southward depending on river flow conditions. During periods of high river flow, effluent plumes will be directed northward regardless of tidal condition. If the effluent discharges are small, they will likely stay close to the shore.

Water Quality Assessment and Monitoring Study: Bacteria Sources/Pathways in CSO Receiving Waters
King County 2-7 October 2017
Figure 2-3. Orthoimagery and notable areas in the Duwamish Estuary (2012).

Water Quality Assessment and Monitoring Study: Bacteria Sources/Pathways in CSO Receiving Waters
King County 2-8 October 2017
Figure 2-4. Generalized surface water flow directions in the Duwamish Estuary.

Water Quality Assessment and Monitoring Study: Bacteria Sources/Pathways in CSO Receiving Waters
King County 2-9 October 2017
2.2.2 Human Uses The Duwamish Estuary is ranked as one of the busiest ports in North America, moving over 35 million metric tons of cargo in 2014, and supports a diverse range of commercial and industrial maritime activity (Port of Seattle, 2015). The East Waterway is used primarily for container loading, storage, and transport; petroleum product transport; rail access; and intermodal transfer. Tugboats, barges, and small craft also use the Duwamish Estuary. The shoreline along the majority of the East, West, and Lower Duwamish waterways has been developed for industrial and commercial operations, although it still retains limited residential sections and mudflats. Common shoreline features include constructed bulkheads, piers, wharves, sheet piling walls, buildings that extend over the water, and steeply sloped banks armored with riprap, sheet pile, or other fill material. The Duwamish Estuary is used for a limited number of recreational activities. Recreational boating is irregular. Use of the estuary to pass from Elliott Bay to higher reaches of the Green and Duwamish rivers may account for a substantial fraction of recreational boating. Viewing wildlife at habitat restoration sites and new parks along the limited shore is becoming more common (such as at the Hamm Creek Estuary). Despite advisories against such activities, occasional fishing for resident fish and crabbing in the waterways occur along wharfs, piers, docks, and bridges that provide easy access to deep waters. The Duwamish Estuary is designated as a usual and accustomed harvest area for both the Muckleshoot and Suquamish Indian tribes. These tribes maintain rights for fishing and harvesting seafood in the estuary and for traditional ceremonial and cultural practices associated with various locations in the watershed. The Muckleshoot Tribe maintains a commercial net fishery for salmon in the estuary. These fishing and harvesting rights are frequently not exercised because of the toxicological, carcinogenic, and biological hazards associated with consumption of seafood collected from these areas.
2.2.3 Potential Upstream Pathways of Bacteria The Duwamish Estuary is influenced by inflow from the Duwamish and Green rivers and from Hamm, Longfellow and Puget creeks. These rivers and creeks receive surface stormwater. Baseflow inputs of bacteria from stormwater outfalls into the Duwamish Estuary and its tributaries are likely but have not been characterized.
• In addition to stormwater, Longfellow Creek receives effluent from three Seattle CSOs (168, 169, 170). The mouth of the creek is piped and is located in the southwest corner of the West Waterway. Past sampling indicated that the creek frequently exceeded the Washington State criteria for fecal coliform bacteria (King County, unpublished data; Seattle, 2007).
• Hamm Creek enters the Duwamish Estuary just north of the Turning Basin. The lowest 1,000 feet of Hamm Creek was daylighted in 2000, converting it from a culvert to enhanced stream habitat. An estimated annual input of 1,900 CFU and 1,200 CFU of fecal coliforms and E. coli, respectively, enter the Duwamish from
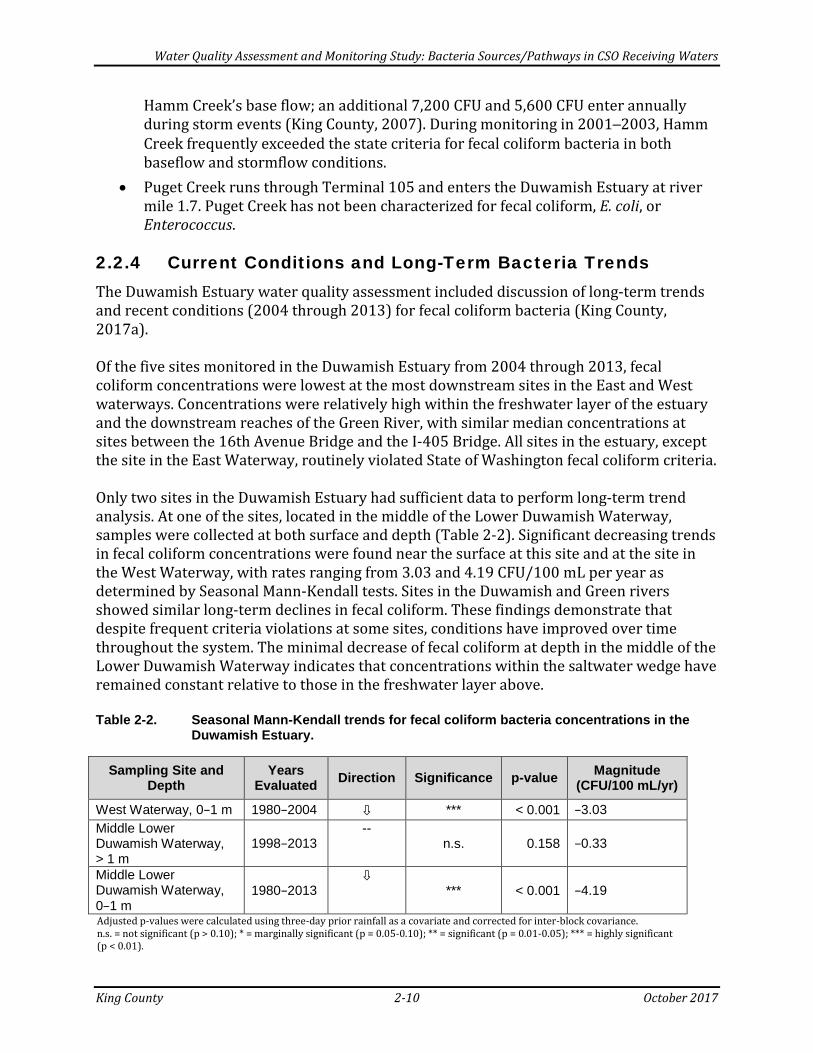
Water Quality Assessment and Monitoring Study: Bacteria Sources/Pathways in CSO Receiving Waters
King County 2-10 October 2017
Hamm Creek’s base flow; an additional 7,200 CFU and 5,600 CFU enter annually during storm events (King County, 2007). During monitoring in 2001─2003, Hamm Creek frequently exceeded the state criteria for fecal coliform bacteria in both baseflow and stormflow conditions.
• Puget Creek runs through Terminal 105 and enters the Duwamish Estuary at river mile 1.7. Puget Creek has not been characterized for fecal coliform, E. coli, or Enterococcus.
2.2.4 Current Conditions and Long-Term Bacteria Trends The Duwamish Estuary water quality assessment included discussion of long-term trends and recent conditions (2004 through 2013) for fecal coliform bacteria (King County, 2017a). Of the five sites monitored in the Duwamish Estuary from 2004 through 2013, fecal coliform concentrations were lowest at the most downstream sites in the East and West waterways. Concentrations were relatively high within the freshwater layer of the estuary and the downstream reaches of the Green River, with similar median concentrations at sites between the 16th Avenue Bridge and the I-405 Bridge. All sites in the estuary, except the site in the East Waterway, routinely violated State of Washington fecal coliform criteria. Only two sites in the Duwamish Estuary had sufficient data to perform long-term trend analysis. At one of the sites, located in the middle of the Lower Duwamish Waterway, samples were collected at both surface and depth (Table 2-2). Significant decreasing trends in fecal coliform concentrations were found near the surface at this site and at the site in the West Waterway, with rates ranging from 3.03 and 4.19 CFU/100 mL per year as determined by Seasonal Mann-Kendall tests. Sites in the Duwamish and Green rivers showed similar long-term declines in fecal coliform. These findings demonstrate that despite frequent criteria violations at some sites, conditions have improved over time throughout the system. The minimal decrease of fecal coliform at depth in the middle of the Lower Duwamish Waterway indicates that concentrations within the saltwater wedge have remained constant relative to those in the freshwater layer above. Table 2-2. Seasonal Mann-Kendall trends for fecal coliform bacteria concentrations in the
Duwamish Estuary.
Sampling Site and Depth
Years Evaluated Direction Significance p-value Magnitude
(CFU/100 mL/yr)
West Waterway, 0−1 m 1980−2004 ⇩ *** < 0.001 −3.03 Middle Lower Duwamish Waterway, > 1 m
1998−2013 --
n.s. 0.158 −0.33
Middle Lower Duwamish Waterway, 0−1 m
1980−2013 ⇩
*** < 0.001 −4.19
Adjusted p-values were calculated using three-day prior rainfall as a covariate and corrected for inter-block covariance. n.s. = not significant (p > 0.10); * = marginally significant (p = 0.05-0.10); ** = significant (p = 0.01-0.05); *** = highly significant (p < 0.01).

Water Quality Assessment and Monitoring Study: Bacteria Sources/Pathways in CSO Receiving Waters
King County 2-11 October 2017
2.3 Elliott Bay Elliott Bay is a deep bay, reaching 190 m in depth in some areas (Figure 2-5). Elliott Bay is dominated by Puget Sound marine water masses. The freshwater layer from the Duwamish Estuary is limited to the upper five meters. During large rain events, this layer is sediment-laden and appears as a brown plume. The Elliott Bay study area is divided into two sections:
• Inner Elliott Bay, east of a line drawn between the Duwamish Head in West Seattle and Magnolia Bluff near Smith Cove. Inner Elliott Bay includes all of King County’s uncontrolled CSOs in the bay not currently undergoing upgrades.
• Outer Elliott Bay, east of a line drawn between Four Mile Rock and Alki Point.
2.3.1 Water Circulation The Duwamish Estuary discharges into southern Elliott Bay. In winter, late spring, and early summer when flow from the Duwamish Estuary is highest, a freshwater lens that moves counterclockwise from the river along the downtown Seattle waterfront and northward is evident (Figure 2-6). In late summer during low freshwater flow, the circulation pattern in Elliott Bay is marginally influenced by the incoming flow but the dominant counterclockwise circulation persists. Effluent and runoff are isolated at the surface because of the greater density of marine water. Subsurface effluent will be transported vertically upward; downward fallout of particulate matter may still occur. Little downward vertical mixing between the freshwater lens and the salt water occurs; the salinity of the freshwater lens, however, increases as the salt water mixes upward.
2.3.2 Human Uses Eastern Elliott Bay is primarily devoted to commerce. It is bordered by the high-intensity development in the commercial and residential area of downtown Seattle. The bay is bordered in areas outside of the downtown core by mixed-use lands including medium- to low-intensity development, developed open-spaces, and forested/undeveloped lands, the largest of which is Discovery Park. Overwater structures, seawalls, and riprap dominate the shoreline; only 17 percent of the shoreline is exposed sand/mud substrate. The Port of Seattle owns and operates several piers, shipping and cruise terminals, parks, and the Bell Harbor Marina on Elliott Bay. Additional uses include fishing, boating, scuba diving, and beach activities. Recreational fishing occurs at several docks and marinas. Elliott Bay is designated as a usual and accustomed harvest area for both the Muckleshoot and Suquamish Indian tribes. These tribes operate a net pen in the northeast corner of Inner Elliott Bay for raising juvenile coho salmon relocated from tribal hatcheries for delayed release into the wild. Although public clamming beaches are present, mostly in the outer bay, they are often closed by the Washington State Department of Health because of their proximity to multiple pollution sources.

Water Quality Assessment and Monitoring Study: Bacteria Sources/Pathways in CSO Receiving Waters
King County 2-12 October 2017
Figure 2-5. Orthoimagery and notable areas in Elliott Bay (2012).

Water Quality Assessment and Monitoring Study: Bacteria Sources/Pathways in CSO Receiving Waters
King County 2-13 October 2017
Figure 2-6. Generalized surface water circulation patterns in Elliott Bay.
Water Quality Assessment and Monitoring Study: Bacteria Sources/Pathways in CSO Receiving Waters
King County 2-14 October 2017
2.3.3 Potential Upstream Pathways of Bacteria The primary upstream pathway of bacteria to Elliott Bay is the Duwamish Estuary, especially its freshwater component. A minor ephemeral stream (Fairmount Creek) contributes to southwestern Elliott Bay; the outlet of this stream is piped and also serves as a CSO (Seattle 78). Baseflow inputs from stormwater outfalls are likely but have not been characterized.
2.3.4 Current Conditions and Long-Term Trends The Elliott Bay water quality assessment included discussion of long-term trends and recent conditions (2004 through 2013) for fecal coliform bacteria (King County, 2017b). Fecal coliform has been monitored at 10 long-term water quality monitoring sites in Elliott Bay (6 nearshore sites and 4 offshore sites). Fecal coliform concentrations were greatest at the surface of Elliott Bay. Concentrations differed significantly among sites, with nearshore sites having greater concentrations than offshore sites. In addition, concentrations were typically higher in Inner Elliott Bay along the waterfront compared to Outer Elliott Bay. The higher concentrations in Inner Elliott Bay are attributable to the abundance of bacteria pathways, including the Duwamish Estuary. Violations of water quality criteria occurred more frequently at nearshore sites than offshore sites; four of the six nearshore sites exceeded one or both of the state criteria for fecal coliform bacteria more than 10 percent of the time over the last 10 years. Three of the four sites that frequently violated criteria were located near CSO outfalls in the northern part of the bay where control projects or upgrades are under way (Magnolia and Denny Way) and near several CSO and stormwater outfalls along the downtown Seattle waterfront. Eight sites were evaluated for long-trends. Five of these sites showed significant decreasing slopes, ranging from 0.15 to 2.20 CFU/100 mL per year as determined by Seasonal Mann-Kendall tests (Table 2-3). Sites that did not exhibit significant trends had very low concentrations of fecal coliform throughout the time period. One site in southwestern Elliott Bay showed an increase of 0.11 CFU/100 mL per year between 1991 and 2011. The generally decreasing bacteria trends in Elliott Bay demonstrate that despite frequent criteria violations at some sites, conditions have improved over time.
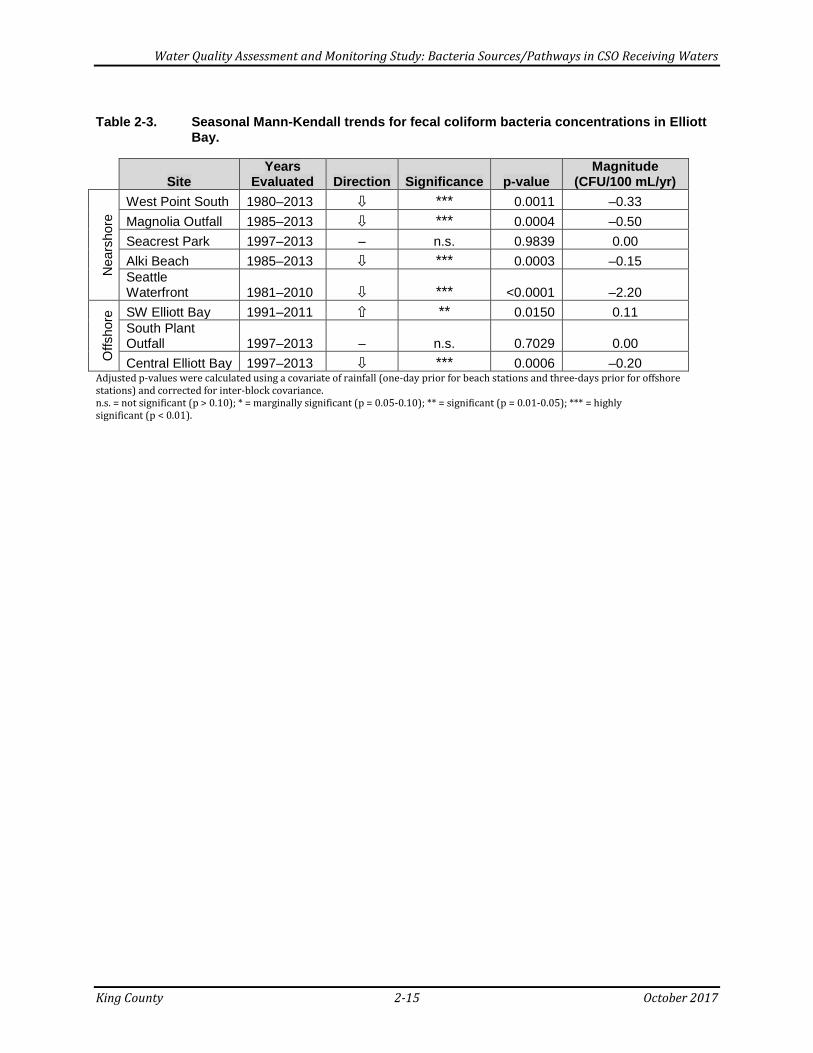
Water Quality Assessment and Monitoring Study: Bacteria Sources/Pathways in CSO Receiving Waters
King County 2-15 October 2017
Table 2-3. Seasonal Mann-Kendall trends for fecal coliform bacteria concentrations in Elliott
Bay.
Site
Years Evaluated Direction Significance p-value
Magnitude (CFU/100 mL/yr)
Nea
rsho
re West Point South 1980–2013 ⇩ *** 0.0011 –0.33
Magnolia Outfall 1985–2013 ⇩ *** 0.0004 –0.50 Seacrest Park 1997–2013 – n.s. 0.9839 0.00 Alki Beach 1985–2013 ⇩ *** 0.0003 –0.15 Seattle Waterfront 1981–2010 ⇩ *** <0.0001 –2.20
Offs
hore
SW Elliott Bay 1991–2011 ⇧ ** 0.0150 0.11 South Plant Outfall 1997–2013 – n.s. 0.7029 0.00 Central Elliott Bay 1997–2013 ⇩ *** 0.0006 –0.20
Adjusted p-values were calculated using a covariate of rainfall (one-day prior for beach stations and three-days prior for offshore stations) and corrected for inter-block covariance. n.s. = not significant (p > 0.10); * = marginally significant (p = 0.05-0.10); ** = significant (p = 0.01-0.05); *** = highly significant (p < 0.01).

Water Quality Assessment and Monitoring Study: Bacteria Sources/Pathways in CSO Receiving Waters
King County 2-16 October 2017
This page intentionally left blank.

Water Quality Assessment and Monitoring Study: Bacteria Sources/Pathways in CSO Receiving Waters
King County 3-1 October 2017
3.0 METHODS This chapter describes the sample collection, laboratory, and statistical methods used for this study. The sampling and analysis plan was published by King County (2014).
3.1 Sample Collection This study collected bacteria samples from 132 sampling sites in Lake Union/Ship Canal, 109 in the Duwamish Estuary, and 144 in Elliott Bay (Figures 3-1, 3-2, and 3-3; Appendix A). Samples were collected every 500 feet along shorelines and at some offshore sites in Elliott Bay. Sampling sites were defined using data layers for the watersheds, stream networks, combined sewers, CSOs, storm drains, and stormwater outfalls from both City of Seattle and King County geographic information system (GIS) databases. Samples were collected during six events in each study area: three dry-weather events and three wet-weather events. Dry-weather events were characterized by no measureable rainfall in the three days prior to sampling. Wet-weather (storm) events were characterized by rainfall of 0.5 inch or greater over a 12-hour period that resulted in CSO discharge. For each sampling event, either Enterococcus (Elliott Bay and Duwamish Estuary) or E. coli (Lake Union/Ship Canal) were analyzed. Enterococcus was used in the both the Duwamish Estuary and Elliott Bay because the estuary contains both brackish water and fresh water from the persistent saltwater wedge that moves up and down the river with the tidal cycles from Elliott Bay. Use of the same indicator allows for a more comprehensive analysis of bacterial issues and human health risks, including identification of areas of concern that may have a common source of bacterial contamination. In Lake Union/Ship Canal, 20 of the E. coli samples were subsampled for Hu-2-Bacteroides during two dry-weather events. In both the Duwamish Estuary and Elliott Bay, 20 Enterococcus samples were subsampled for Hu-2-Bacteroides during two dry-weather and one wet-weather event. Subsampling sites are shown in yellow in Figures 3-1, 3-2, and 3-3. Whenever Hu-2-Bacteroides concentrations were measured, except for the wet-weather event in the Duwamish Estuary, specific conductivity was also measured to assess the distribution of the freshwater lens in the Duwamish Estuary and Elliott Bay and the impact of the saltwater intrusion on the conductivity of surface waters in Lake Union/Ship Canal. Grab samples were collected from just below the surface. Sterilized 500-mL polypropylene bottles were tipped upside down and plunged through the surface layer then tipped upright under water and filled from below the surface at a depth of approximately 0.15 m. Sampling sequences for each study area are as follows:
• In Lake Union/Ship Canal, samples were first collected in the west end of the Fremont Cut; samples from Salmon Bay were then collected along the south shore, continuing clockwise. Samples were collected from Lake Union and Portage Bay in a

Water Quality Assessment and Monitoring Study: Bacteria Sources/Pathways in CSO Receiving Waters
King County 3-2 October 2017
counterclockwise direction, starting on the southern shoreline near the Fremont Bridge (Figure 3-1).
• The timing of sampling in the Duwamish Estuary did not depend on tides and proceeded in order of station number beginning at the mouth of the East Waterway and continuing south to the tip of Harbor Island, and then starting at the mouth of the West Waterway and moving south to the Turning Basin (Figure 3-2).
• Most sample collection in Elliott Bay was conducted during the outgoing tide (ebbtide). Samples were collected in order of station number starting from the northwest corner of the bay near Elliott Bay marina in Magnolia clockwise to the last site near Duwamish Head (Figure 3-3). Two sampling sites were located near the mouths of the East and West waterways. Two rows of stations were situated along the shoreline in Elliott Bay in an attempt to determine directionality of detected bacteria concentrations. If concentrations were higher in the nearshore row of stations, onshore bacteria sources were assumed. If the concentrations were higher in the offshore row of stations, offshore sources were assumed.

Water Quality Assessment and Monitoring Study: Bacteria Sources/Pathways in CSO Receiving Waters
King County 3-3 October 2017
Figure 3-1. Sampling sites, CSO outfalls, and stormwater outfalls in Lake Union/Ship Canal.

Water Quality Assessment and Monitoring Study: Bacteria Sources/Pathways in CSO Receiving Waters
King County 3-4 October 2017
Figure 3-2. Sampling sites, CSOs, and stormwater outfalls in the Duwamish Estuary.
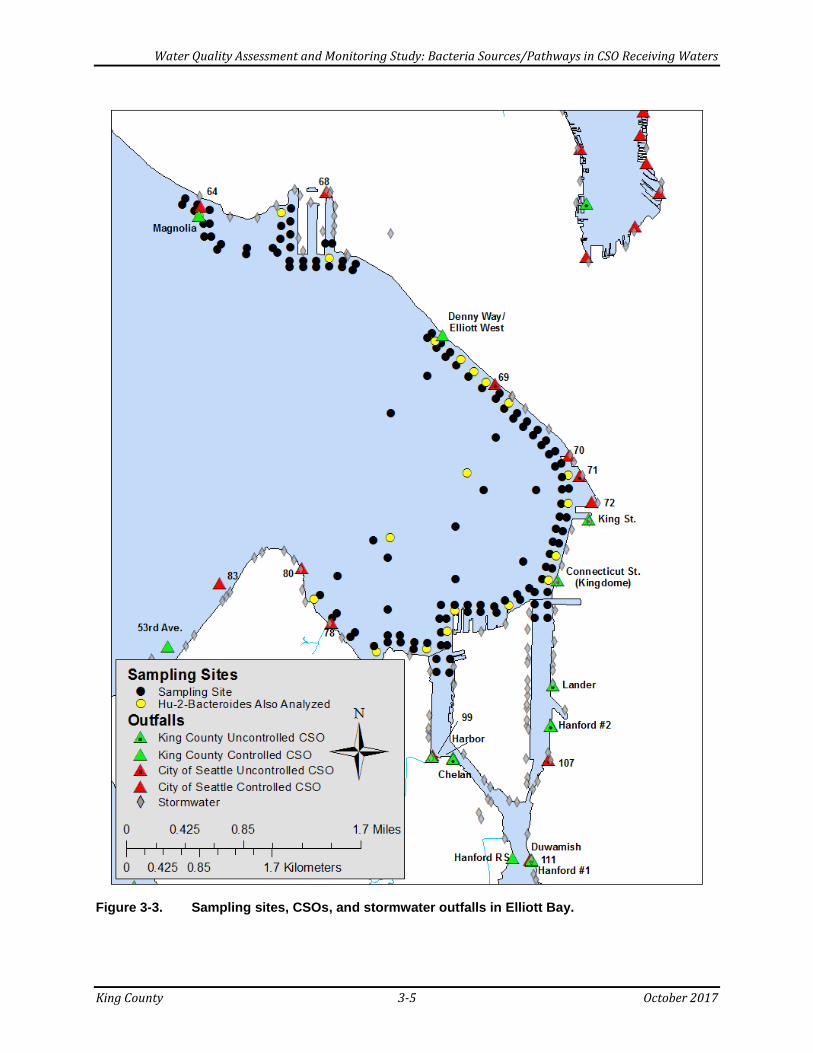
Water Quality Assessment and Monitoring Study: Bacteria Sources/Pathways in CSO Receiving Waters
King County 3-5 October 2017
Figure 3-3. Sampling sites, CSOs, and stormwater outfalls in Elliott Bay.

Water Quality Assessment and Monitoring Study: Bacteria Sources/Pathways in CSO Receiving Waters
King County 3-6 October 2017
3.2 Laboratory Methods Table 3-1 shows the laboratory methods used for assessing Enterococcus and E. coli concentrations. Routine quality control analyses for all bacterial tests monitored method performance of each sample analysis batch. A sample analysis batch was not to exceed 20 samples of the same matrix and were prepared together and analyzed using the same reagents, media equipment, and analysts. No field replicates were collected. Table 3-1. Laboratory methods and detection limits.
Parameter Reference Method and Technique
Reported Unit
Lower Reporting
Limit Holding
Time Preservation
Enterococcus Standard Methods; 9230C, Membrane Filtration
CFU/100 mL
1 CFU/100 mL
24 hours
Cool to < 8°C but > 0°C
E.coli Standard Methods; 9213D, Membrane Filtration
CFU/100 mL
1 CFU/100 mL
24 hours
Cool to < 8°C but > 0°C
Hu-2-Bacteroides
King County Microbiology Lab Unit: 563V0
Gene copies/mL
0.01 gene copies/mL
24 hours
Cool to < 8°C but > 0°C
Specific Conductivity Standard Methods; 2510-B µS/cm 1 µS/cm In situ In situ CFU = colony forming unit.
The human marker Bacteroides (Hu-2-Bacteroides) method used at the King County Environmental Laboratory (KCEL) targets the 16s rRNA gene cluster known commonly as HF183. The HF183 gene cluster was identified by Dr. Katherine Field of Oregon State University, and the gene cluster is known to be shared by a number of Bacteroidales spp. in the genus Bacteroides. The HF183 marker was selected as the microbial source tracking bacterial gene target based on its availability and outstanding performance (Boehm et al., 2013). In particular, the method demonstrated the highest specificity (greater than 80 percent) as compared to other human-based source tracking methods, and when used in conjunction with other lines of evidence, the results from this method can provide useful information to track human fecal pollution. Numerical values for the Hu-2-Bacteroides method are reported as gene copies/mL; the sensitivity of the assay is 0.01 gene copies/mL. Specific conductivity (conductivity standardized to 25°C) measured in Hu-2-Bacteroides samples was converted to salinity concentrations. Conversion was completed using the following equation (Williams, 1986):
𝑆𝑆 = 0.4665 ∗ �𝑆𝑆𝑆𝑆
1000�1.0878
Where: S = salinity in parts per thousand (ppt) SC = specific conductance in µS/cm

Water Quality Assessment and Monitoring Study: Bacteria Sources/Pathways in CSO Receiving Waters
King County 3-7 October 2017
3.3 Geospatial Analysis The spatial distribution of bacteria concentrations was examined for each sampling event. The Kriging interpolation method was used to estimate bacteria concentrations between sampling points and to identify spatial trends. Additionally, “hot spot analysis” was used to investigate specific regions of elevated (or depressed) concentrations relative to all samples; the methods and results of these analyses are presented in Appendix B. Spatial analysis was completed using ArcGIS 10.1 and the “geoR” package for R (Diggle and Ribeiro, 2007; Ribeiro and Diggle, 2001). Kriging is a geostatistical method of interpolating data. It is based on the regionalized variable theory that assumes that the spatial variation in the phenomenon represented by the observed values is statistically homogeneous throughout the surface. The accuracy of this model decreases as predictions increase in distance from the input data. Therefore, the estimated concentrations for areas with no nearby sampling points (western Elliott Bay, the vicinity of Kellogg Island in the Duwamish Estuary, and the center of Lake Union) should be interpreted with caution.
3.4 Comparison to Criteria
3.4.1 EPA and Washington State Bacteria Criteria EPA’s 2012 Recreational Water Quality Criteria (RWQC) (EPA, 2012) recommends criteria for marine and fresh waters based on concentrations of the enteric bacteria Enterococcus spp. (marine and freshwater) and E. coli (for fresh water only). Enterococcus and E. coli are considered reliable indicators of human health risks. The RWQC includes recommendations for protecting human health in all coastal and noncoastal waters designated for primary contact recreational use. These recommendations are a non-regulatory scientific assessment of effects on human health. The purpose of these recommendations is to inform federal and state agencies pursuant to Section 304(a) of the Clean Water Act. EPA provides two sets of recommended criteria based on an estimated illness rate of either 36 or 32 per 1,000 primary contact recreators.5 The magnitude of the bacterial indicators is described by both a geometric mean (GM) and a statistical threshold value (STV) for the bacteria samples for a single monitoring site. The STV approximates the 90th percentile of the water quality distribution and is intended to be a value that should not be exceeded by more than 10 percent of the samples taken. Table 3-2 summarizes the magnitude components of the recommendations.
5 EPA considers both criteria sets as protective of the designated use of primary contact recreation. The 36 per 1,000 rate corresponds to the 1986 EPA water quality criteria. The 32 per 1,000 rate is meant to encourage incremental improvement in water quality (EPA, 2012).
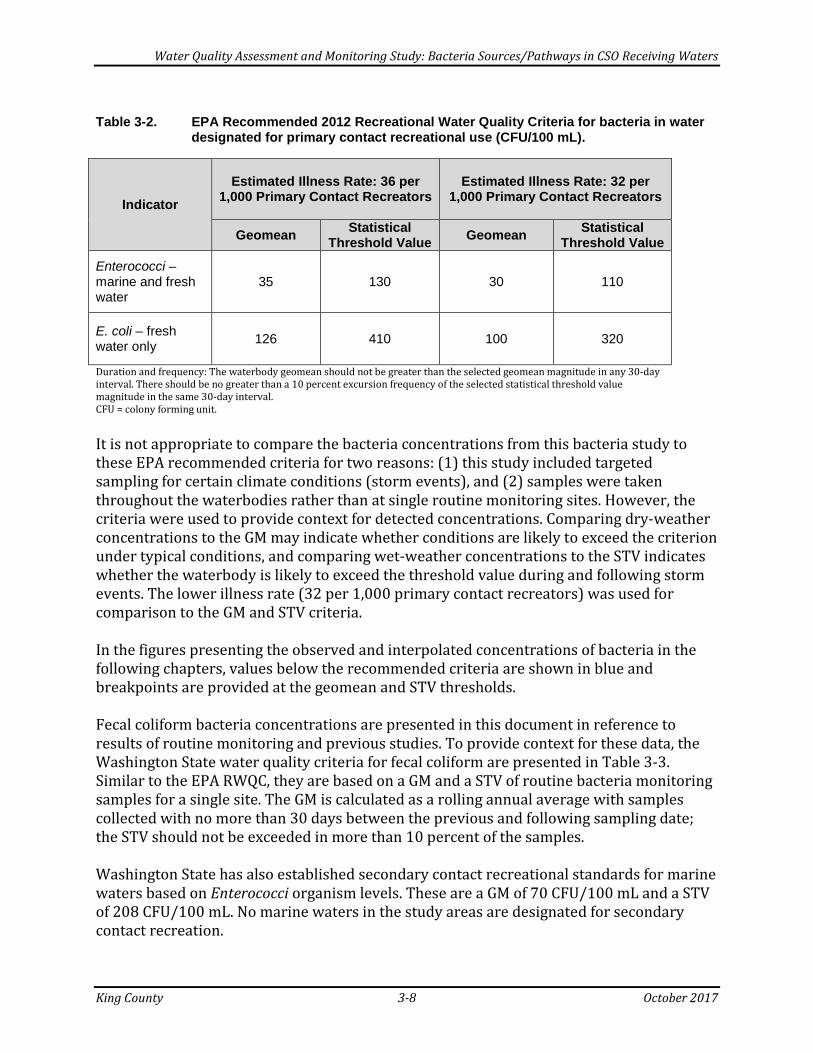
Water Quality Assessment and Monitoring Study: Bacteria Sources/Pathways in CSO Receiving Waters
King County 3-8 October 2017
Table 3-2. EPA Recommended 2012 Recreational Water Quality Criteria for bacteria in water
designated for primary contact recreational use (CFU/100 mL).
Indicator Estimated Illness Rate: 36 per
1,000 Primary Contact Recreators Estimated Illness Rate: 32 per
1,000 Primary Contact Recreators
Geomean Statistical Threshold Value Geomean Statistical
Threshold Value Enterococci – marine and fresh water
35 130 30 110
E. coli – fresh water only 126 410 100 320
Duration and frequency: The waterbody geomean should not be greater than the selected geomean magnitude in any 30-day interval. There should be no greater than a 10 percent excursion frequency of the selected statistical threshold value magnitude in the same 30-day interval. CFU = colony forming unit.
It is not appropriate to compare the bacteria concentrations from this bacteria study to these EPA recommended criteria for two reasons: (1) this study included targeted sampling for certain climate conditions (storm events), and (2) samples were taken throughout the waterbodies rather than at single routine monitoring sites. However, the criteria were used to provide context for detected concentrations. Comparing dry-weather concentrations to the GM may indicate whether conditions are likely to exceed the criterion under typical conditions, and comparing wet-weather concentrations to the STV indicates whether the waterbody is likely to exceed the threshold value during and following storm events. The lower illness rate (32 per 1,000 primary contact recreators) was used for comparison to the GM and STV criteria. In the figures presenting the observed and interpolated concentrations of bacteria in the following chapters, values below the recommended criteria are shown in blue and breakpoints are provided at the geomean and STV thresholds. Fecal coliform bacteria concentrations are presented in this document in reference to results of routine monitoring and previous studies. To provide context for these data, the Washington State water quality criteria for fecal coliform are presented in Table 3-3. Similar to the EPA RWQC, they are based on a GM and a STV of routine bacteria monitoring samples for a single site. The GM is calculated as a rolling annual average with samples collected with no more than 30 days between the previous and following sampling date; the STV should not be exceeded in more than 10 percent of the samples. Washington State has also established secondary contact recreational standards for marine waters based on Enterococci organism levels. These are a GM of 70 CFU/100 mL and a STV of 208 CFU/100 mL. No marine waters in the study areas are designated for secondary contact recreation.

Water Quality Assessment and Monitoring Study: Bacteria Sources/Pathways in CSO Receiving Waters
King County 3-9 October 2017
Table 3-3. Washington State water contact fecal coliform bacteria criteria for waterbodies in and near the study areas (Chapter 173-201A WAC).
Category Description of Category
Fecal Coliform Criteria (CFU/100 mL) Applicable
Waterbodies Geomean Statistical Threshold
Value
Freshwater: Extraordinary Primary Contact Recreation
Waters providing extraordinary protection against waterborne disease or that serve as tributaries to extraordinary quality shellfish harvesting areas
50 100 Lake Union/Ship Canal
Freshwater: Primary Contact Recreation
Activities where a person would have direct contact with water to the point of complete submergence including, but not limited to, skin diving, swimming, and water skiing
100 200 Longfellow Creek, Hamm Creek, Puget Creek
Freshwater: Secondary Contact Recreation
Activities where a person's water contact would be limited (such as wading or fishing) to the extent that bacterial infections of eyes, ears, respiratory or digestive systems, or urogenital areas would normally be avoided
200 400 Duwamish River (south of Turning Basin)
Marine: Primary Contact Recreation
Activities where a person would have direct contact with water to the point of complete submergence including, but not limited to, skin diving, swimming, and water skiing
14 43
Elliott Bay, Duwamish Estuary (East, West, and Lower Duwamish waterways)
CFU = colony forming unit.
3.4.2 Relevance to Study Areas All of Lake Union/Ship Canal is designated for freshwater extraordinary primary contact use (Figure 3-4), and the Duwamish Estuary and Elliott Bay are designated as marine primary contact use (Figures 3-5 and 3-6). The Duwamish River upstream of the estuary is designated as freshwater secondary contact use (Figure 3-5). Each study area contains multiple locations of potential human exposure to pathogens. The different activities in the study areas can be grouped into two general categories:
• Direct contact activities that may result in direct contact with the water. Examples include swimming and scuba diving.
• Indirect contact activities that may result in exposures to pathogens that have bioaccumulated in seafood. Examples include seafood consumption by recreational and subsistence fishers.

Water Quality Assessment and Monitoring Study: Bacteria Sources/Pathways in CSO Receiving Waters
King County 3-10 October 2017
Figure 3-4. Recreational use designations and human exposure areas in Lake Union/Ship Canal. (Waterfront parks also noted.)

Water Quality Assessment and Monitoring Study: Bacteria Sources/Pathways in CSO Receiving Waters
King County 3-11 October 2017
Figure 3-5. Recreational use designations and human exposure areas in the Duwamish
Estuary. (Waterfront parks also noted.)

Water Quality Assessment and Monitoring Study: Bacteria Sources/Pathways in CSO Receiving Waters
King County 3-12 October 2017
Figure 3-6. Recreational use designations and human exposure areas in Elliott Bay.
(Waterfront parks also noted.)
Water Quality Assessment and Monitoring Study: Bacteria Sources/Pathways in CSO Receiving Waters
King County 3-13 October 2017
The consumption of shellfish collected from the study areas may result in indirect exposures to waterborne pathogens. Activities that may result in direct exposure with the water and/or sediment of the study areas include the following:
• Swimming and wading • Scuba diving (Elliott Bay only) • Boating and sailing • Windsurfing • Jet skiing (Elliott Bay only) • Canoeing, kayaking, and paddle-
boarding
• Water skiing (Elliott Bay only) • Parasailing (Elliott Bay only) • Occupational exposures • Line fishing and net fishing • Collecting organisms other than
fish (such as crabs and squid) (Elliott Bay only)
Figures 3-4, 3-5, and 3-6 show access points along the shorelines of the waterbodies where people may swim and wade:
• In Lake Union/Ship Canal, the two primary public access points are Gas Works Park and Lake Union Park.
• In the Duwamish Estuary, the primary public access point is at Duwamish Waterway Park along the Lower Duwamish Waterway.
• In Elliott Bay, Duwamish Head (Seacrest Park) is the primary public access point.
Other public access points include shoreline street ends and trails and parks that border the waters. None of these public swimming locations is generally considered to be popular compared to other Puget Sound beaches in Seattle such as Alki Beach or Golden Gardens Beach. Additionally, the Lake Union/Ship Canal houseboat communities have private access for swimming in the lake. Swimming and wading in the waterbodies is assumed to largely occur in the warmer summer months because of the cold water temperatures of the waterbodies. Anecdotal information indicates that in the late 1990s the majority of the people that scuba dive in Elliott Bay at the Seacrest Park in West Seattle (phone interview conducted with the long-time manager of a dive shop at Seacrest Park [Ferdico cited in King County, 1999]). It was estimated that between 0 and 100 people dive at Seacrest Park on any given day, with higher numbers of divers during the summer than winter and more on weekends than on weekdays. For comparison, the number of divers at Alki Beach (outside the study area) was estimated to range between 0─20 divers per day depending on day of the week and season (King County, 1999). The dive shop manager suggested an average diving frequency in the study area of once per month. There is heavy boat use in the study areas. Boat size varies from small one-person sailboats to large supertankers that dock at Harbor Island. It is possible that people on boats would come into contact with surface water or sediments. Such contact could occur from

Water Quality Assessment and Monitoring Study: Bacteria Sources/Pathways in CSO Receiving Waters
King County 3-14 October 2017
wind/wave spray or while pulling in anchors, ropes, and bumpers. The study areas also are used for canoeing and kayaking. People likely do not windsurf, jet ski, or parasail in the Duwamish Estuary, but these activities occur in Elliott Bay and windsurfing occurs in Lake Union/Ship Canal. People who work in and around the study areas may be exposed to pathogens in the waters. For example, construction, repair, and maintenance workers may be exposed if they are working on underwater pilings. Persons monitoring or sampling pilings or other underwater objects may also be exposed.

Water Quality Assessment and Monitoring Study: Bacteria Sources/Pathways in CSO Receiving Waters
King County 4-1 October 2017
4.0 RESULTS AND DISCUSSION—LAKE UNION/SHIP CANAL
This chapter describes the observed and interpolated concentrations of bacteria in the Lake Union/Ship Canal study area. It also discusses the conditions prior to and during sampling, including a description of CSO discharges. While this study did not examine specific sources, the discussion also includes an identification of potential pathways or sources for bacteria results that were observed. Detailed sampling results are shown in Appendix E.
4.1 Sampling Conditions and CSO Discharges Samples were collected in 2014 from 132 sites in Lake Union/Ship Canal on six separate occasions: three dry-weather and three wet-weather sampling events.
4.1.1 Dry-Weather Sampling Recent rain events and CSO discharges prior to dry-weather sampling are shown in Table 4-1. The 1/16/2014 dry-weather sampling event occurred four days after a large storm (2.2 inches) resulting in more than 10 MG of CSO discharges. Hu-2-Bacteroides concentrations were measured for the 7/16/2014 and 9/10/2014 dry-weather events. The 9/10/2014 dry-weather event was marked by a recent significant intrusion of salt water into Salmon Bay and Lake Union through the Locks, which resulted in elevated conductivity in Lake Union/Ship Canal surface waters. Conductivity values in September were approximately 1.5 times greater in Portage Bay, 2 to 3 times greater in Lake Union, and 4 times greater in Salmon Bay than values measured in July (Appendix C). The increased conductivity (salinity) would be expected to result in decreased survival rates of enteric bacteria (Appendix H). Table 4-1. Most recent rain events and associated CSO discharges prior to dry-weather
sampling in the Lake Union/Ship Canal study area.
Event Number
Sampling Date
Days Since Last Rain
Event Ended
Duration of Last Event
(hr.)
Intensity of Last
Event (in.)
CSO Discharge Prior to
Sampling Date
1 1/16/2014 4 123 2.2 10 CSOs ─ 10.3 MG
2 7/16/2014 20 36 0.13 No
3 9/10/2014 2 4 0.12 No
Rainfall data from Dexter Ave CSO rain gauge.

Water Quality Assessment and Monitoring Study: Bacteria Sources/Pathways in CSO Receiving Waters
King County 4-2 October 2017
4.1.2 Wet-Weather Sampling Rain events that triggered wet-weather sampling are shown in Table 4-2, and CSO discharges that occurred within two days of sampling are shown in Table 4-3. Sample collection for the 1/29/2014 wet-weather event began at 8:30 a.m. and ended at 2:44 p.m.; rain fell throughout the sampling period, sometimes heavily. The majority of the CSO discharge associated with this sampling event occurred between 2 a.m. and 4 a.m., prior to sampling. The County’s 11th Ave NW and Seattle’s 147, 150/151, and 152 CSOs discharged for a second time in the late morning and afternoon between 10 a.m. and 3:15 p.m. Sites near the 11th Ave NW, 150/151, and 152 CSOs in Salmon Bay were sampled prior to the second discharge, but the sites along the northern shore of Lake Union’s northwest arm were sampled while CSO 147 discharged. The total CSO discharge volume was 4.84 MG. The second wet-weather event (2/18/2014) began at 8:20 a.m. and ended at 1:20 p.m. Rain fell throughout the sampling effort, sometimes heavily. The 11th Ave NW and 3rd Ave W King County CSOs and Seattle 147, 150/151, 152, and 174 CSOs discharged during sampling. During sampling in Salmon Bay (8:20 a.m. – 9:30 a.m.), only CSO 152 was actively discharging into Salmon Bay; the rate of that discharge is unknown. CSO 147 discharged while the rest of Lake Union was sampled, including the Fremont Cut and the southern and northern shores of the lake’s northwest arm. The total CSO discharge volume was 43.9 MG. The third wet-weather event (3/17/2014) began at 8:37 a.m. and ended at 2:01 p.m. CSOs discharged the previous day, ceasing by 1:30 a.m. the morning of sampling. A trace amount of rain fell during sampling. The total volume discharged by CSOs was 6.78 MG. Table 4-2. Rain events triggering wet-weather sampling in the Lake Union/Ship Canal study
area.
Event Number
Sampling Date
Storm Start Date/Time
Storm End Date/Time
Duration (hr.)
Intensity (in.)
Rainfall prior to sampling
(in.)
1 1/29/2014 1/28/2014 8:51 p.m.
1/29/2014 2:49 p.m. 18 1.04 0.86
2 2/18/2014 2/15/2014 11:54 a.m.
2/20/2014 1:53 a.m. 110 2.59 1.15
3 3/17/2014 3/15/2014 6:48 p.m.
3/17/2014 1:54 a.m. 31 1.16 1.16
Rainfall data from Dexter Ave CSO rain gauge. Rainfall prior to sampling was estimated by the King County Environmental Laboratory’s field unit. Table 4-3. King County and Seattle CSO discharges into the Lake Union/Ship Canal study
area within two days of wet-weather sampling.
Event Number Owner CSO Start
Date/Time End
Date/Time Duration
(hr.) Volume
(MG) 1 (1/29/2014)
King County Ballard siphons 1/29/2014
1:16 a.m. 1/29/2014 3:54 a.m. 2.6 0.14

Water Quality Assessment and Monitoring Study: Bacteria Sources/Pathways in CSO Receiving Waters
King County 4-3 October 2017
Event Number Owner CSO Start
Date/Time End
Date/Time Duration
(hr.) Volume
(MG)
11th Ave NW 1/29/2014 12:49 a.m.
1/29/2014 12:30 p.m. 11.7 0.28
Dexter Ave 1/29/2014 1:14 a.m.
1/29/2014 2:00 a.m. 0.8 0.03
University 1/29/2014 2:03 a.m.
1/29/2014 2:30 a.m. 0.4 0.9
Montlake 1/29/2014 1:08 a.m.
1/29/2014 2:24 a.m. 1.3 1.04
Seattle
147 1/28/2014 10:35 p.m.
1/29/2014 2:48 p.m. 16.2 0.46
150/151 1/29/2014 12:28 a.m.
1/29/2014 2:16 p.m. 13.8 0.15
152 1/28/2014 9:45 p.m.
1/29/2014 3:15 p.m. 17.5 1.61
174 1/29/2014 1:05 a.m.
1/29/2014 3:42 a.m. 2.6 0.23
2 (2/18/2014)
King County
11th Ave NW
2/16/2014 6:23 p.m.
2/17/2014 12:07 a.m. 5.7 0.73
2/18/2014 10:16 a.m.
2/18/2014 11:30 a.m. 1.2 0.12
3rd Ave W
2/16/2014 7:41 p.m.
2/17/2014 12:54 a.m. 5.2 1.46
2/18/2014 11:12 a.m.
2/18/2014 2:45 p.m. 3.6 0.02
Dexter Ave 2/16/2014 8:27 p.m.
2/16/2014 11:57 p.m. 3.5 1.61
University 2/16/2014 8:03 p.m.
2/17/2014 1:22 a.m. 5.3 22.4
Montlake
2/16/2014 8:08 p.m.
2/17/2014 1:20 a.m. 5.2 8.01
2/18/2014 2:16 p.m.
2/18/2014 2:51 p.m. 0.6 0.37
Seattle
20 2/16/2014 9:50 p.m.
2/17/2014 2:02 a.m. 4.2 0.15
140 2/16/2014 9:32 p.m.
2/17/2014 12:52 a.m. 3.3 0.13
147
2/15/2014 12:45 p.m.
2/17/2014 6:42 a.m. 42.0 1.20
2/18/2014 9:40 a.m.
2/18/2014 3:45 p.m. 6.1 0.35
150/151
2/16/2014 6:04 p.m.
2/16/2014 11:58 p.m. 5.9 0.59
2/18/2014 10:00 a.m.
2/18/2014 11:28 a.m. 1.5 0.04
152 2/15/2014 12:30 p.m.
2/18/2014 3:55 p.m. 75.4 5.45
174
2/16/2014 7:35 p.m.
2/17/2014 2:40 a.m. 7.1 0.98
2/18/2014 11:10 a.m.
2/18/2014 3:55 p.m. 4.8 0.29
3 (3/17/2014)
King County 11th Ave NW 3/16/2014
7:03 p.m. 3/16/2014 9:01 p.m. 2.0 0.08

Water Quality Assessment and Monitoring Study: Bacteria Sources/Pathways in CSO Receiving Waters
King County 4-4 October 2017
Event Number Owner CSO Start
Date/Time End
Date/Time Duration
(hr.) Volume
(MG)
3rd Ave W 3/16/2014 7:37 p.m.
3/16/2014 9:55 p.m. 2.3 0.08
University 3/16/2014 8:20 p.m.
3/16/2014 9:58 p.m. 1.6 2.79
Montlake 3/16/2014 7:42 p.m.
3/16/2014 9:54 p.m. 2.2 1.77
Seattle
147 3/15/2014 6:15 p.m.
3/17/2014 1:14 a.m. 31.0 0.5
150/151 3/16/2014 5:56 p.m.
3/16/2014 6:38 p.m. 0.7 0.01
152 3/15/2014 6:05 p.m.
3/17/2014 1:30 a.m. 31.4 1.08
174 3/16/2014 6:20 p.m.
3/16/2014 10:44 p.m. 4.4 0.45
The start and end time of CSO discharges was available only for King County CSOs. Only the start date and duration were provided for Seattle CSOs; it can be assumed that Seattle CSOs ceased discharging within two or three hours of nearby King County CSOs.
4.2 Bacteria Distribution This section presents a summary of the E. coli concentrations detected in Lake Union/Ship Canal during the dry- and wet-weather sampling events. Figures 4-1 through 4-6 show the E. coli concentrations observed and interpolated by Kriging during the six sampling events; CSO discharge volumes within two days of sampling are also presented for the wet-weather events.
4.2.1 Dry-Weather Events Dry-weather E. coli concentrations ranged from no detection to 300 CFU/100 mL, as shown in Table4-4. Pairwise non-parametric Wilcoxon signed rank tests found that each of the sampling events yielded significantly distinguishable E. coli concentrations (p < 0.0001). The highest geomean concentrations were observed in the first sampling event (1/16/2014), although the maximum concentration for this event did not reach the maximums observed in the later dry-weather events. EPA’s RWQC STV (32 CFU/100 mL) was not exceeded during any dry-weather sampling events; the GM (100 CFU/100 mL) was exceeded in three samples (two during the second event in Lake Union and southern Portage Bay and one during the third event in the northeast arm of Lake Union).
Table 4-4. Dry-weather E. coli concentrations in the Lake Union/Ship Canal study area (CFU/100 mL; n=132).
Event Number Minimum Maximum Mean Median Standard
Deviation Geomean 90th Percentile
1 (1/16/2014) 2 92 29 32 20 20.9 52.9
2 (7/16/2014) 0 300 13 5 35 4.2 21.9
3 (9/10/2014) 0 230 19 11 25 10.7 41.9 CFU = colony forming unit.

Water Quality Assessment and Monitoring Study: Bacteria Sources/Pathways in CSO Receiving Waters
King County 4-5 October 2017
Dry-Weather Event Number 1
Figure 4-1 presents the E. coli concentrations observed and interpolated by Kriging during the first dry-weather sampling event on 1/16/2014. Concentrations were greatest in Salmon Bay and decreased moving eastward. Southern Lake Union concentrations were greater those of northern Lake Union. Lake Union’s northeast arm and Portage Bay had the lowest concentrations.
Dry-Weather Event Number 2
No spatial trends were evident during the second dry-weather sampling event, but peaks were seen in southern Portage Bay and Salmon Bay where concentrations were generally greater relative to the rest of the system (Figure 4-2). Elevated concentrations in Portage Bay may be related to direct deposition by resident beavers in addition to waterfowl. The concentrations of Hu-2-Bacteroides do not reflect the respective observed concentrations of E. coli (Spearman’s rho: 0.04; p-value = 0.8514). The greatest Hu-2-Bacteroides concentration (26.3 copies/mL) was found in western Salmon Bay, west of West Commodore Way and 27th Avenue West. The concentration is nearly seven times greater than all other observed Hu-2-Bacteroides concentrations.
Dry-Weather Event Number 3
No general spatial trends in E. coli concentrations were apparent during the third dry-weather sampling event, but isolated peaks were detected along Lake Union’s eastern and southeastern shores. Salmon Bay concentrations were generally greater relative to the rest of the system. Slightly elevated levels in southern Portage Bay may be related to beaver and waterfowl activity. The concentrations of Hu-2-Bacteroides were positively correlated to the respective observed concentrations of E. coli (Spearman’s rho: 0.42; p-value = 0.0628). A notable exception was the high Hu-2-Bacteroides concentration at the Dexter Ave CSO in Southwest Lake Union (114 copies/mL) and the corresponding low E. coli concentration (5 CFU/100 mL). Western Salmon Bay had the next greatest concentrations, with a maximum of 26.9 copies/mL.

Water Quality Assessment and Monitoring Study: Bacteria Sources/Pathways in CSO Receiving Waters
King County 4-6 October 2017
Figure 4-1. Observed and interpolated bacteria concentrations in Lake Union/Ship Canal for dry-weather event 1 – 1/16/14. Interpolated values computed through Kriging.
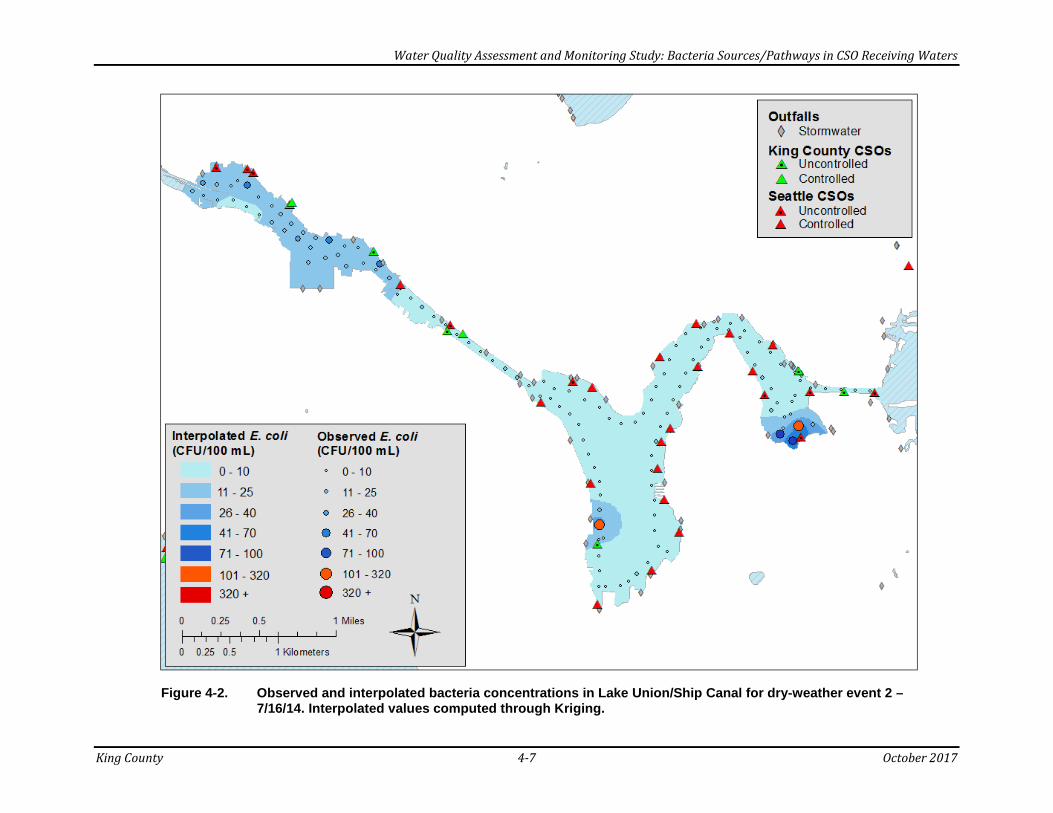
Water Quality Assessment and Monitoring Study: Bacteria Sources/Pathways in CSO Receiving Waters
King County 4-7 October 2017
Figure 4-2. Observed and interpolated bacteria concentrations in Lake Union/Ship Canal for dry-weather event 2 – 7/16/14. Interpolated values computed through Kriging.

Water Quality Assessment and Monitoring Study: Bacteria Sources/Pathways in CSO Receiving Waters
King County 4-8 October 2017
Figure 4-3. Observed and interpolated bacteria concentrations in Lake Union/Ship Canal for dry-weather event 3 – 9/10/14. Interpolated values computed through Kriging.

Water Quality Assessment and Monitoring Study: Bacteria Sources/Pathways in CSO Receiving Waters
King County 4-9 October 2017
4.2.2 Wet-Weather Events Wet-weather E. coli concentrations ranged from no detection to 2,300 CFU/100 mL (Table 4-5). Pairwise non-parametric Wilcoxon signed rank tests found that the third sampling event yielded significantly lower E. coli concentrations than the first two events (p < 0.0003) and that concentrations in the second sampling event were marginally statistically greater than in the first event (p = 0.0735). The EPA’s RWQC STV (90th percentile) was exceeded at 14 of 132 sites during the first event (12 sites in Salmon Bay and two sites in southern Lake Union), at 4 sites during the second event (2 sites in eastern Salmon Bay and 2 sites in southeastern Lake Union), and no sites during the third event. Table 4-5. Wet-weather E. coli concentrations in the Lake Union/Ship Canal study area
(CFU/100 mL; n =1 32).
Event Number Minimum Maximum Mean Median Standard
Deviation Geomean 90th Percentile
1 (1/29/2014) 2 2,300 162 68 346 55.9 354
2 (2/18/2014) 5 390 140 150 96 96.3 259
3 (3/17/2014) 0 290 66 54 61 37.3 140 CFU = colony forming unit.
Wet-Weather Event Number 1
Figure 4-4 presents the E. coli concentrations observed and interpolated by Kriging during the first wet-weather sampling event on 1/29/2014 and the CSO discharge volumes of the day before and two days after the event. Concentrations were greatest in western Salmon Bay, and peaks were observed in southern Lake Union and along the eastern shore of the lake’s northeast arm. Concentrations in southwestern Portage Bay were elevated relative to other portions of the bay. Values exceeding the EPA STV (90th percentile) were detected in Salmon Bay and near the Dexter Ave CSO in southwestern Lake Union. CSO discharges totaled over 2.2 MG into Salmon Bay, 1.9 MG into Portage Bay and the Montlake Cut, 0.5 MG into northwest Lake Union, and 0.03 MG into southern Lake Union. These discharges predominately occurred the morning of sampling, although Seattle CSOs 147 and 152 in northwestern Lake Union and western Salmon Bay, respectively, began discharging sometime after 9 p.m. the evening before sampling. In Portage Bay, E. coli concentrations did not appear to reflect the 1.9 MG discharged from CSOs, except possibly along the southwestern shore. Bacteria concentrations near this shore would also be affected by runoff from the Montlake Playfield and the Seattle and Queen City yacht clubs. Elevated E. coli concentrations were detected in northeastern Lake Union, possibly from the transport of effluent from Portage Bay and from runoff of feces-associated bacteria from Fairview Park, Gas Works Park, and the impervious surfaces (docks and houseboats) in the area.

Water Quality Assessment and Monitoring Study: Bacteria Sources/Pathways in CSO Receiving Waters
King County 4-10 October 2017
The Dexter Ave CSO discharged a relatively low volume (0.03 MG) early in the morning of the sampling event, but elevated E. coli concentrations were detected near the outfall and eastward near the 1100─1200 blocks of Fairview Avenue North. An elevated concentration was detected west of CSO 147 in northwest Lake Union; CSO 147 was discharging while sites along the northern shore were sampled. Elevated concentrations were not seen at the sites immediately south of CSO 147; the effluent may have been pushed westward by the dominant flow pattern. Shoreline runoff and stormwater discharges may also have contributed fecal material. In Salmon Bay, elevated E. coli concentrations were detected at the western end of the Fremont Cut. Concentrations generally increased moving west toward the Locks. These increases may be due to the volume of CSO and stormwater discharges, the high amount of runoff from the shoreline, and transportation of bacteria from inputs farther upstream.
Wet-Weather Event Number 2
Elevated E coli concentrations during the second wet-weather sampling event (2/18/2014) were detected in eastern Salmon Bay, southern Lake Union, and in southwestern Portage Bay (Figure 4-5). The majority of CSO discharges occurred two days prior to sampling: over 30 MG into Portage Bay and the Montlake Cut, 1.5 MG into northwest Lake Union, 1.6 MG into southwestern Lake Union from the Dexter Ave CSO, 2.8 MG into the west Fremont Cut, and 6.9 MG into Salmon Bay. Because of the two-day interval between discharges and sample collection, proximate sampling sites will likely not reflect the discharges. The 11th Ave NW, 3rd Ave W, Montlake, 147, 150/151, 152, and 174 CSOs discharged the afternoon of the day before sampling; the influence of these discharges may be reflected in E. coli concentrations near the CSO outfalls. Despite the more than 30 MG of CSO discharged into Portage Bay, E. coli concentrations did not appear to reflect a large pulse in effluent, except possibly along the southwestern shore. Concentrations near this shore may also be affected by runoff from the Montlake Playfield and the Seattle and Queen City yacht clubs. Some of the discharge from previous events may have stagnated in southern Portage Bay. Low concentrations were observed in the flow channel until just west of the I-5 Bridge where nearby stormwater outfalls and runoff from Fairview Park and the surrounding area are potential vectors of bacteria associated with fecal matter. E. coli concentrations increased moving south from Lake Union’s northeast arm, reaching a maximum near the 1300 block of Fairview Avenue North. A stormwater outfall, surface runoff, and stagnation of previously discharged effluent may explain these elevated concentrations. Concentrations remained elevated along Lake Union’s western shore, possibly from the introduction of bacteria from the northeast arm, flow of bacteria from southern Lake Union, or overland flow from the Westlake Avenue North commercial area. Concentrations were elevated near CSO 147, which may be influenced by the discharge
Water Quality Assessment and Monitoring Study: Bacteria Sources/Pathways in CSO Receiving Waters
King County 4-11 October 2017
from CSO 147 during sampling, discharge from nearby stormwater outfalls, runoff from nearby docks, and/or bacteria loading from northeastern and southern Lake Union. The elevated concentrations in eastern Salmon Bay may be due to the recent discharges from the 11th Ave NW, 3rd Ave W, and 174 CSOs and nearby stormwater outfalls. The elevated concentrations east of these CSOs in the Fremont Cut are likely due to stormwater discharge, surface runoff, and bacteria transported from inputs further upstream. The discharges from CSO 152, from a nearby stormwater outfall, and surface runoff appear to have contributed to the elevated concentrations at nearby sampling sites.
Wet-Weather Event Number 3
During the third wet-weather sampling event (3/17/2014), elevated E. coli concentrations were seen in western Salmon Bay, the Fremont Cut, and along the northwestern shore of Lake Union (Figure 4-6). All King County CSO discharges had ceased between 9 p.m. and 10 p.m. on the evening prior to sampling; it is likely that Seattle CSOs ceased discharging around the same time. Rainfall ceased at 2 a.m. on the day of sampling. During the storm event, CSOs discharged 4.8 MG into Portage Bay and the Montlake Cut, 0.5 MG into northwestern Lake Union, 0.6 MG into western Fremont Cut, and 1.2 MG into Salmon Bay. E. coli concentrations did not appear to reflect the more than 4.8 MG of CSO discharged into Portage Bay. Elevated bacteria concentrations were detected along the southern shore of Lake Union’s northeast arm; pathways may include runoff from nearby shoreline structures and the shoreline, unmapped stormwater outfalls, and transport from upstream. The elevated bacteria concentrations in southern Lake Union near the Dexter Ave CSO and the 1200─1400 blocks of Fairview Avenue North seen in the first two wet-weather events were not observed. The lower bacteria concentrations may have been due to the limited rainfall before and during the sampling event, bacterial decay between the discharge event and sampling, and the dilution and downstream (northwestward) transport of stormwater discharged to southern Lake Union. Possible causes of the elevated concentrations seen along Lake Union’s western shore may include the introduction of bacteria from the northeast arm, flow of bacteria from southern Lake Union, overland flow from the Westlake Avenue North commercial area, and runoff from docks and houseboats. Concentrations in the Fremont Cut were similar to those detected in Lake Union’s western shore, except that concentrations at the eastern end of the Fremont Cut were lower than in northwestern Lake Union. Significantly elevated concentrations relative to the average concentrations in the study area were not observed except in northwestern Salmon Bay, where many CSO and stormwater outfalls exist. Additional contributing pathways include runoff from in-water structures and the shoreline. Trapping and stagnation of contaminated surface water in

Water Quality Assessment and Monitoring Study: Bacteria Sources/Pathways in CSO Receiving Waters
King County 4-12 October 2017
northwestern Salmon Bay may have occurred because the area is bounded to the south by the large structure at the Locks.
4.3 Discussion The survival dynamics of E. coli and the Hu-2-Bacteroides genetic marker in the Lake Union/Ship Canal study area are unknown, but solar radiation, ambient temperatures, and conductivity are likely the most influential factors. Predation, nutrient availability, and other factors may marginally influence the decay rate. In winter conditions, E. coli populations and the Hu-2-Bacteroides genetic marker may be expected to persist in fresh water for half a week or longer as a result of low solar radiance and cool temperatures. In the summer when temperature, solar radiation, and biotic activity are high, E. coli populations and the Hu-2-Bacteroides genetic marker likely persist for hours. The heightened conductivity caused by saltwater intrusion during the third dry-weather sampling event may have decreased bacteria survivorship. For all dry- and wet-weather sampling events, E. coli concentrations were relatively low in the Montlake Cut (geometric means of 5 CFU/100 mL and 10 CFU/100 mL for dry and wet conditions, respectively). Based on these data, it does not appear that Lake Washington waters entering through the Montlake Cut are a substantial pathway for E. coli relative to the inputs entering from CSOs, stormwater outfalls, surface runoff, and direct deposition. E. coli concentrations were approximately an order of magnitude greater during wet-weather conditions. Significantly greater concentrations were detected during the first dry-weather event, which occurred during the winter; the other two dry-weather events took place in summer.
4.3.1 Dry-Weather Findings Dry-weather E. coli concentrations were generally low (< 50 CFU/100 mL); no strong signal of continuous input from leaking septic infrastructure or other sources is apparent. Baseflow from stormwater outfalls may be a significant pathway of bacteria input following storm events and for outfalls draining large stormwater basins. Beaver and waterfowl activity in southern Portage Bay may contribute to the elevated concentrations observed during the latter two dry-weather events.
First Dry-Weather Event
Relatively high levels of E. coli (approximately 50 CFU/100 mL) detected in Salmon Bay, the Fremont Cut, and the southern half of Lake Union during the first dry-weather event (1/16/2014) were likely a result of the increased winter baseflow and a recent storm. A total of 2.2 inches of rain fell four to five days prior to sampling. Because no rain fell between the storm event and sampling, surface runoff would not be expected to actively occur. A heightened water table, however, may lead to increased baseflow.

Water Quality Assessment and Monitoring Study: Bacteria Sources/Pathways in CSO Receiving Waters
King County 4-13 October 2017
Figure 4-4. Observed and interpolated bacteria concentrations and CSO discharge volumes in Lake Union/Ship Canal for wet-weather event 1 – 1/29/14. Interpolated values computed through Kriging.
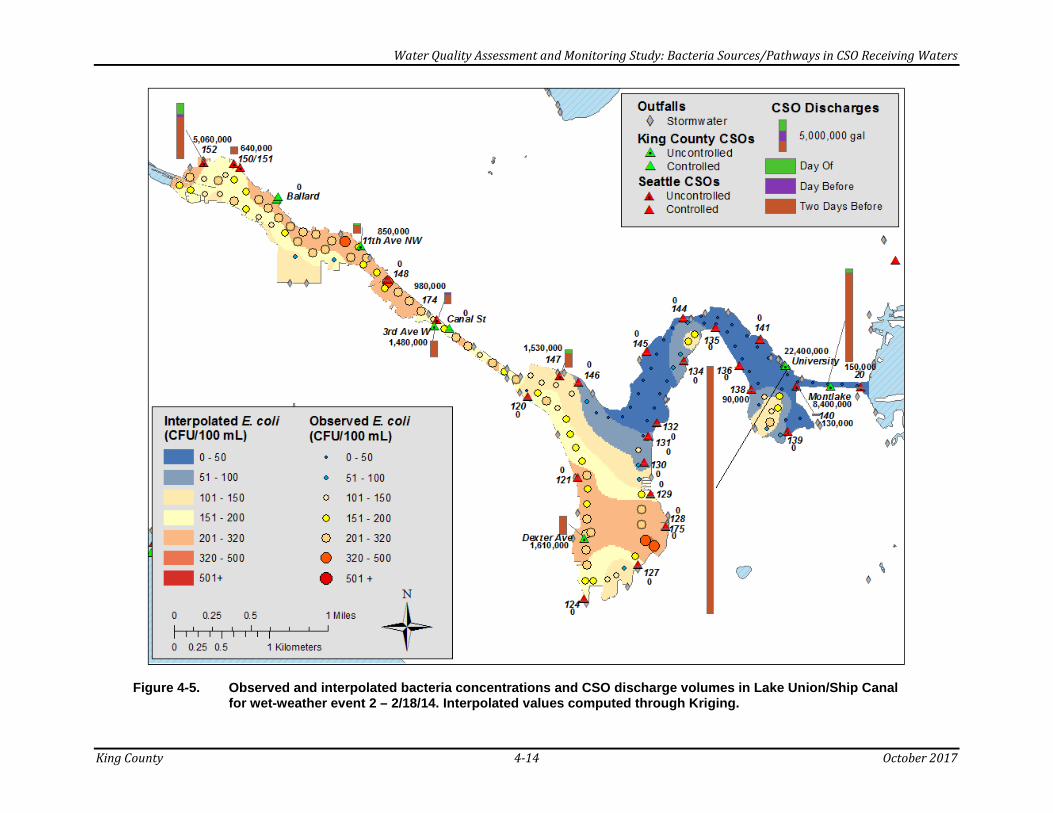
Water Quality Assessment and Monitoring Study: Bacteria Sources/Pathways in CSO Receiving Waters
King County 4-14 October 2017
Figure 4-5. Observed and interpolated bacteria concentrations and CSO discharge volumes in Lake Union/Ship Canal for wet-weather event 2 – 2/18/14. Interpolated values computed through Kriging.

Water Quality Assessment and Monitoring Study: Bacteria Sources/Pathways in CSO Receiving Waters
King County 4-15 October 2017
Figure 4-6. Observed and interpolated bacteria concentrations and CSO discharge volumes in Lake Union/Ship Canal for wet-weather event 3 – 3/17/14. Interpolated values computed through Kriging.

Water Quality Assessment and Monitoring Study: Bacteria Sources/Pathways in CSO Receiving Waters
King County 4-16 October 2017
The spatial distribution of E. coli seen in Figure 4-1 for the first dry-weather sampling event reflects the circulation pattern of Lake Union/Ship Canal, E. coli survival rates, and baseflow inputs from stormwater outfalls. The dominant flow pattern moves through Portage Bay, bypasses the southern half of Lake Union, and moves through the Fremont Cut to Salmon Bay. The low concentrations of E. coli in Portage Bay and the northeast arm of Lake Union indicate that nearly all E. coli that had entered through stormwater outfalls, CSOs, and surface runoff had been flushed out. Higher concentrations were detected in the southern portion of Lake Union than in the northern portion, potentially from stagnation of effluent and runoff containing E. coli and continuous influent from stormwater outfalls that drain large basins (such as the Capitol Hill stormwater basin). Trapping and stagnation of baseflow inputs in Salmon Bay’s Fishermen’s Terminal and northwest shoreline may have contributed to the continued presence and distribution of E. coli throughout Salmon Bay. The elevated bacteria concentrations in the Fremont Cut were not expected because the channel is typically flushed quickly. A similar pattern was not observed during the other dry-weather events. Bacteria concentrations in the Fremont Cut during the first dry-weather event may represent E. coli populations in transit from upstream areas or from local outfalls. Baseflow entering from stormwater outfalls is a likely continuous pathway of bacterial input. However, it would be expected that a baseflow signal would be observed at the Densmore Drain outfall in Lake Union’s northeast arm; inputs from this outfall may be diluted and flow toward the main body of Lake Union and the Fremont Cut fairly quickly.
Second and Third Dry-Weather Events
Heterogeneous and spatially inconsistent areas of elevated bacteria concentrations were detected during the other dry-weather events in Lake Union/Ship Canal. The elevated levels of E. coli detected during the second and third sampling events are possibly due to direct discharge by birds, boats, and other sources and by baseflow. These bacteria were not likely introduced from runoff or CSOs given the lengthy dry periods prior to sampling. The elevated Hu-2-Bacteroides concentrations detected during these events suggest that there may be a consistent source of human feces during dry weather in Salmon Bay. Elevated Hu-2-Bacteroides concentrations (16─61 copies/mL) were detected near the Locks during the 9/10/2014 dry-weather sampling event. Potential dry-weather sources of human feces─associated bacteria in Salmon Bay include boats, resuspended sediments, leaking sewage systems, and contaminated baseflow entering through stormwater outfalls.
4.3.2 Wet-Weather Findings Despite a large volume of effluent entering Portage Bay from the Montlake and University CSOs during wet-weather events, Portage Bay did not experience elevated E. coli concentrations relative to southern Lake Union and Salmon Bay. Values were typically greater during wet-weather events than dry-weather events. These data suggest that incoming effluent is largely diluted and flushed from Portage Bay through the dominant incoming flow path from Lake Washington that carries low concentrations of bacteria. During the first and second wet-weather events, bacteria concentrations in southwestern
Water Quality Assessment and Monitoring Study: Bacteria Sources/Pathways in CSO Receiving Waters
King County 4-17 October 2017
Portage Bay were elevated relative to the remainder of Portage Bay, possibly from trapping and stagnation of some effluent entering Portage Bay, inputs from stormwater outfalls, and runoff from in-water structures and parks. The third wet-weather sampling event was dissimilar from the previous two events. During the third event, elevated E. coli concentrations were not detected in southern Lake Union and concentrations in Salmon Bay were low relative to levels previously observed. This may be due to the length of time between the storm event and sampling, relatively warmer water contributing to increased predation and nutrient competition, and/or a lower overall input of E. coli entering the system. Potential trapping and stagnation of high E. coli waters was apparent in northwestern Salmon Bay. It is not possible to pinpoint outfalls and areas where bacteria are entering because the Lake Union/Ship Canal study area was not sampled continuously over the course of each storm. It is likely that any discharging CSOs are vectors of enteric bacteria of variable concentrations. However, as seen in Portage Bay with the Montlake and University CSOs, the dominant water circulation pattern may mask the signal of CSO discharge. Similar dilution and export may be present in Lake Union’s northeast arm (no signal of the Densmore Drain outfall was detected), northern Lake Union, the Fremont Cut, and Salmon Bay. Southern Lake Union is bypassed by the primary direction of flow and thus may not be as substantially influenced by bacteria inputs from upstream in the northeast arm and Portage Bay and by the diluting flow pattern. A tentative signal near the 1200─1400 blocks of Fairview Avenue North was detected in southeastern Lake Union; a stormwater outfall that drains a portion of the Capitol Hill neighborhood and the I-5 freeway is located there.

Water Quality Assessment and Monitoring Study: Bacteria Sources/Pathways in CSO Receiving Waters
King County 4-18 October 2017
This page intentionally left blank.

Water Quality Assessment and Monitoring Study: Bacteria Sources/Pathways in CSO Receiving Waters
King County 5-1 October 2017
5.0 RESULTS AND DISCUSSION—DUWAMISH ESTUARY
This chapter describes the observed and interpolated concentrations of bacteria in the Duwamish Estuary study area. It also discusses the conditions prior to and during sampling, including a description of CSO discharges. While this study did not examine specific sources, the discussion also includes an identification of potential pathways or sources for bacteria results that were observed. Detailed sampling results are shown in Appendix E.
5.1 Sampling Conditions and CSO Discharges Samples were collected in 2014 from 109 sites in the Duwamish Estuary on six separate occasions: three dry-weather and three wet-weather sampling events.
5.1.1 Dry-Weather Sampling Recent rain events and CSOs prior to dry-weather sampling are shown in Table 5-1. The first dry-weather sampling event on 1/22/2014 occurred 11 days after a large storm that resulted in more than 24.4 MG of CSO discharges in the Duwamish Estuary. Given the low survival rate of bacteria in salt water, the sampling event was not likely influenced by the previous rain event. All dry-weather sampling was initiated during slack tide and continued through the ebbtide. Hu-2-Bacteroides concentrations were measured during the second and third dry-weather sampling events at 20 of the 109 sites. Table 5-1. Most recent rain events and associated CSO discharges prior to dry-weather
sampling in the Duwamish Estuary study area.
Event Number
Sampling Date
Days Since Last Rain
Event Ended
Duration of Last Event
(hr.)
Intensity of Last Event
(in.)
CSO Discharge Prior to Sampling
Date 1 1/22/2014 11 113 2.07 8 CSOs – 24.4 MG 2 7/1/2014 3 23 0.06 No 3 8/28/2014 13 4 0.03 1 CSO – 0.001 MG
Rainfall data from the Chelan CSO rain gauge.
5.1.2 Wet-Weather Sampling Rain events that triggered wet-weather sampling are shown in Table 5-2, and CSO discharges that occurred within two days of sampling are shown in Table 5-3. Sample collection for the first wet-weather event started at 8:45 a.m. under dry and slack-tide conditions; sampling ended at 12:37 p.m. During the previous night, 0.75 inch of rain fell. The CSO discharges ceased prior to the morning of sampling during an incoming tide. The total volume discharged was 25.5 MG.

Water Quality Assessment and Monitoring Study: Bacteria Sources/Pathways in CSO Receiving Waters
King County 5-2 October 2017
Prior to start of the second wet-weather sampling event on 3/3/2014, 0.9 inch of rain fell between 10:00 a.m. on 3/2/14 and 8:45 a.m. on 3/3/2014. Sampling began at 9:04 a.m. and ended at 12:59 p.m. Most CSOs had ceased to discharge prior to sampling; however, the King St and Hanford #2 CSOs continued to discharge until after 10:00 a.m. The East Waterway was sampled while the CSOs were actively discharging. An ebbtide was observed during sampling. The total volume discharged was 9.2 MG. Prior to sample collection for the third wet-weather event on 5/5/2014, 1 inch of rain fell between 1:30 p.m. on 5/3/14 and midnight on 5/4/2014. Sampling began at 8:38 a.m. and ended at 11:39 a.m.; the tidal condition during sampling was slack. Some scattered showers were observed during sampling. All CSOs ceased to discharge by 4:11 a.m. on the day prior to sampling. A total of 39.5 MG was discharged. Hu-2-Bacteroides concentrations were measured at 20 of the 109 sites sampled for this third event. Table 5-2. Rain events triggering wet-weather sampling in the Duwamish Estuary study area.
Event Number
Sampling Date
Storm Start Date/Time
Storm End Date/Time
Duration (hr.)
Intensity (in.)
Estimated rainfall at start
of sampling (in.)
1 2/12/2014 2/9/2014 2:11 p.m.
2/14/2014 10:37 a.m. 116 2.11 0.75
2 3/3/2014 3/1/2014 2:33 p.m.
3/6/2014 7:51 a.m. 113 3.08 0.9
3 5/5/2014 5/3/2014 1:39 p.m.
5/5/2014 3:47 p.m. 50 1.51 1.0
Rainfall data from the Chelan CSO rain gauge. Rainfall prior to sampling was estimated by the King County Environmental Laboratory’s field unit.
Table 5-3. King County and Seattle CSO discharges into the Duwamish Estuary study area
within two days of wet-weather sampling.
Event Number Owner CSO Start
Date/Time End
Date/Time Duration
(hr.) Volume
Discharged (MG)
1 (2/12/2014)
King County
Connecticut St (Kingdome)
2/10/2014 8:19 a.m.
2/10/2014 8:23 a.m. 0.07 < 0.01
2/11/2014 9:32 p.m.
2/11/2014 11:54 p.m. 2.37 0.35
Lander
2/10/2014 7:53 a.m.
2/10/2014 9:51 a.m. 1.95 1.47
2/11/2014 8:50 p.m.
2/12/2014 1:19 a.m. 4.49 7.83
Hanford #2
2/10/2014 7:53 a.m.
2/10/2014 10:40 a.m. 2.78 5.69
2/11/2014 8:50 p.m.
2/12/2014 2:41 a.m. 5.85 7.46
Chelan 2/11/2014 9:20 p.m.
2/12/2014 12:57 a.m. 3.62 1.41
Hanford #1 2/11/2014 10:00 p.m.
2/11/2014 11:26 p.m. 1.43 0.85
Brandon 2/11/2014 10:49 p.m.
2/12/2014 12:32 a.m. 1.71 0.44
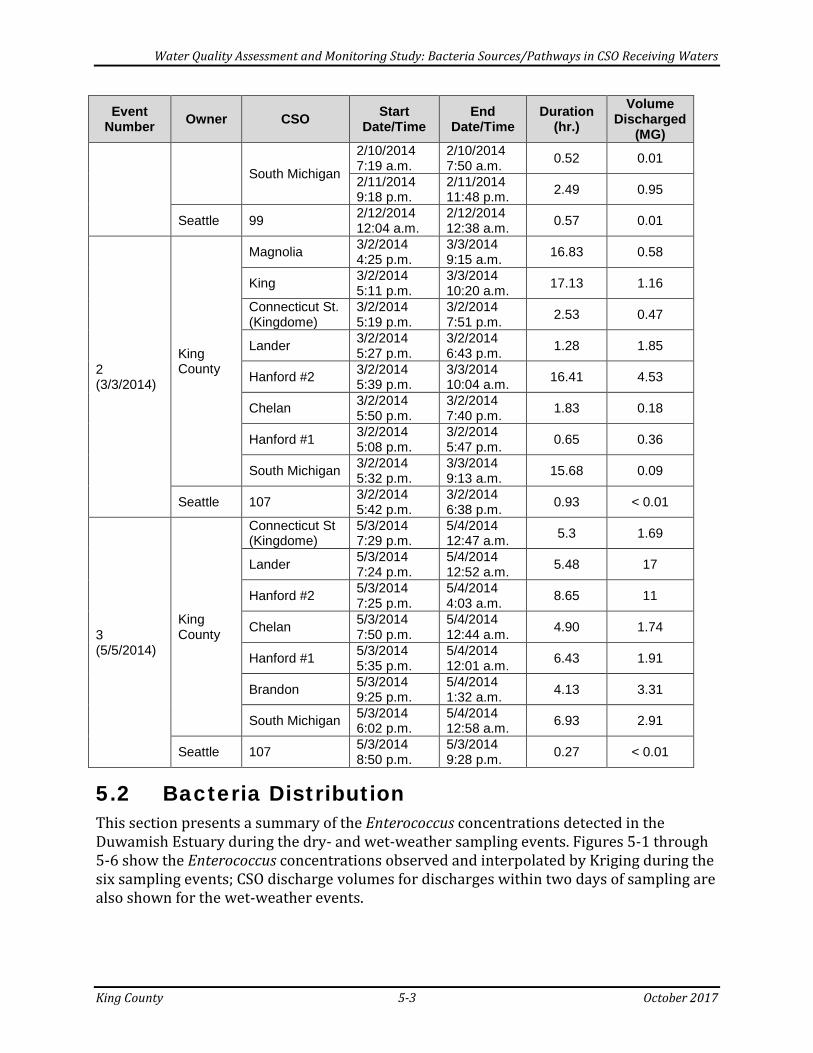
Water Quality Assessment and Monitoring Study: Bacteria Sources/Pathways in CSO Receiving Waters
King County 5-3 October 2017
Event Number Owner CSO Start
Date/Time End
Date/Time Duration
(hr.) Volume
Discharged (MG)
South Michigan
2/10/2014 7:19 a.m.
2/10/2014 7:50 a.m. 0.52 0.01
2/11/2014 9:18 p.m.
2/11/2014 11:48 p.m. 2.49 0.95
Seattle 99 2/12/2014 12:04 a.m.
2/12/2014 12:38 a.m. 0.57 0.01
2 (3/3/2014)
King County
Magnolia 3/2/2014 4:25 p.m.
3/3/2014 9:15 a.m. 16.83 0.58
King 3/2/2014 5:11 p.m.
3/3/2014 10:20 a.m. 17.13 1.16
Connecticut St. (Kingdome)
3/2/2014 5:19 p.m.
3/2/2014 7:51 p.m. 2.53 0.47
Lander 3/2/2014 5:27 p.m.
3/2/2014 6:43 p.m. 1.28 1.85
Hanford #2 3/2/2014 5:39 p.m.
3/3/2014 10:04 a.m. 16.41 4.53
Chelan 3/2/2014 5:50 p.m.
3/2/2014 7:40 p.m. 1.83 0.18
Hanford #1 3/2/2014 5:08 p.m.
3/2/2014 5:47 p.m. 0.65 0.36
South Michigan 3/2/2014 5:32 p.m.
3/3/2014 9:13 a.m. 15.68 0.09
Seattle 107 3/2/2014 5:42 p.m.
3/2/2014 6:38 p.m. 0.93 < 0.01
3 (5/5/2014)
King County
Connecticut St (Kingdome)
5/3/2014 7:29 p.m.
5/4/2014 12:47 a.m. 5.3 1.69
Lander 5/3/2014 7:24 p.m.
5/4/2014 12:52 a.m. 5.48 17
Hanford #2 5/3/2014 7:25 p.m.
5/4/2014 4:03 a.m. 8.65 11
Chelan 5/3/2014 7:50 p.m.
5/4/2014 12:44 a.m. 4.90 1.74
Hanford #1 5/3/2014 5:35 p.m.
5/4/2014 12:01 a.m. 6.43 1.91
Brandon 5/3/2014 9:25 p.m.
5/4/2014 1:32 a.m. 4.13 3.31
South Michigan 5/3/2014 6:02 p.m.
5/4/2014 12:58 a.m. 6.93 2.91
Seattle 107 5/3/2014 8:50 p.m.
5/3/2014 9:28 p.m. 0.27 < 0.01
5.2 Bacteria Distribution This section presents a summary of the Enterococcus concentrations detected in the Duwamish Estuary during the dry- and wet-weather sampling events. Figures 5-1 through 5-6 show the Enterococcus concentrations observed and interpolated by Kriging during the six sampling events; CSO discharge volumes for discharges within two days of sampling are also shown for the wet-weather events.

Water Quality Assessment and Monitoring Study: Bacteria Sources/Pathways in CSO Receiving Waters
King County 5-4 October 2017
5.2.1 Dry-Weather Events Dry-weather Enterococcus concentrations ranged from no detection to 200 CFU/100 mL (Table 5-4). Pairwise non-parametric Wilcoxon signed rank tests found that each of these sampling events yielded significantly distinguishable Enterococcus concentrations (p < 0.0001); significantly higher concentrations were observed during the third event. EPA’s RWQC GM (30 CFU/100 mL) was exceeded in 27 of the 109 samples; only one sample exceeded the RWQC STV (90th percentile) (110 CFU/100 mL). Table 5-4. Dry-weather Enterococcus concentrations in the Duwamish Estuary study area
(CFU/100 mL; n = 109).
Event Number Minimum Maximum Mean Median Standard
Deviation Geomean 90th Percentile
1 (1/22/2014) 1 200 11.8 7.0 21.4 7.7 16.0
2 (7/1/2014) 0 70 7.5 6.0 8.4 5.5 11.4
3 (8/28/2014) 5 51 19.3 16.0 10.3 17.1 36.2 CFU = colony forming unit.
Dry-Weather Event Number 1
The highest Enterococcus concentration (200 CFU/100 mL) was detected during the first dry-weather sampling event (1/22/2014) in the East Waterway along Harbor Island (Figure 5-1). Concentrations at sites downstream of this location were slightly higher than those detected upstream. Concentrations at all other locations were at or below 16 CFU/100 mL.
Dry-Weather Event Number 2
The highest Enterococcus concentration (70 CFU/100 mL) during the second dry-weather sampling event (7/1/2014) was detected in the East Waterway along the eastern shore (Figure 5-2). Elevated concentrations detected during this event were confined to a small local area in the East Waterway. Concentrations at nearly all other locations were at or below 15 CFU/100 mL. Hu-2-Bacteroides concentrations were greatest in the East Waterway; all concentrations were less than 9 copies/mL (Appendix D). Enterococcus and Hu-2-Bacteroides concentrations were not correlated (Spearman’s rho: ─0.28; p-value = 0.2356).(Hu-2-Bacteroides levels measured the previous day [6/30/2014] in Elliott Bay were highest at the mouth of the East Waterway.)
Dry-Weather Event Number 3
The highest Enterococcus concentration (51 CFU/100 mL) during the third dry-weather sampling event (8/28/2014) was detected in the southern portion of the Lower Duwamish Waterway between South 92nd Place and South 93rd Avenue (Figure 5-3). Relative to concentrations of Enterococcus downstream of the 16th Avenue Bridge, concentrations
Water Quality Assessment and Monitoring Study: Bacteria Sources/Pathways in CSO Receiving Waters
King County 5-5 October 2017
were higher starting just northwest of the bridge and moving upstream (greater than 30 CFU/100 mL). Concentrations at most other locations in the estuary were between 11 and 30 CFU/100 mL; concentrations in two samples in the East Waterway were above 30 CFU/100 mL. Despite the elevated upstream Enterococcus concentrations, Hu-2-Bacteroides concentrations were greatest in the East Waterway; upper Lower Duwamish Waterway concentrations did not show a strong positive signal of the genetic tracer. Observed Enterococcus and Hu-2-Bacteroides concentrations were not correlated (Spearman’s rho: 0.05; p-value = 0.8234). (Hu-2-Bacteroides concentrations in Elliott Bay on the previous day [8/27/2014] were highest at the mouth of the East Waterway.)
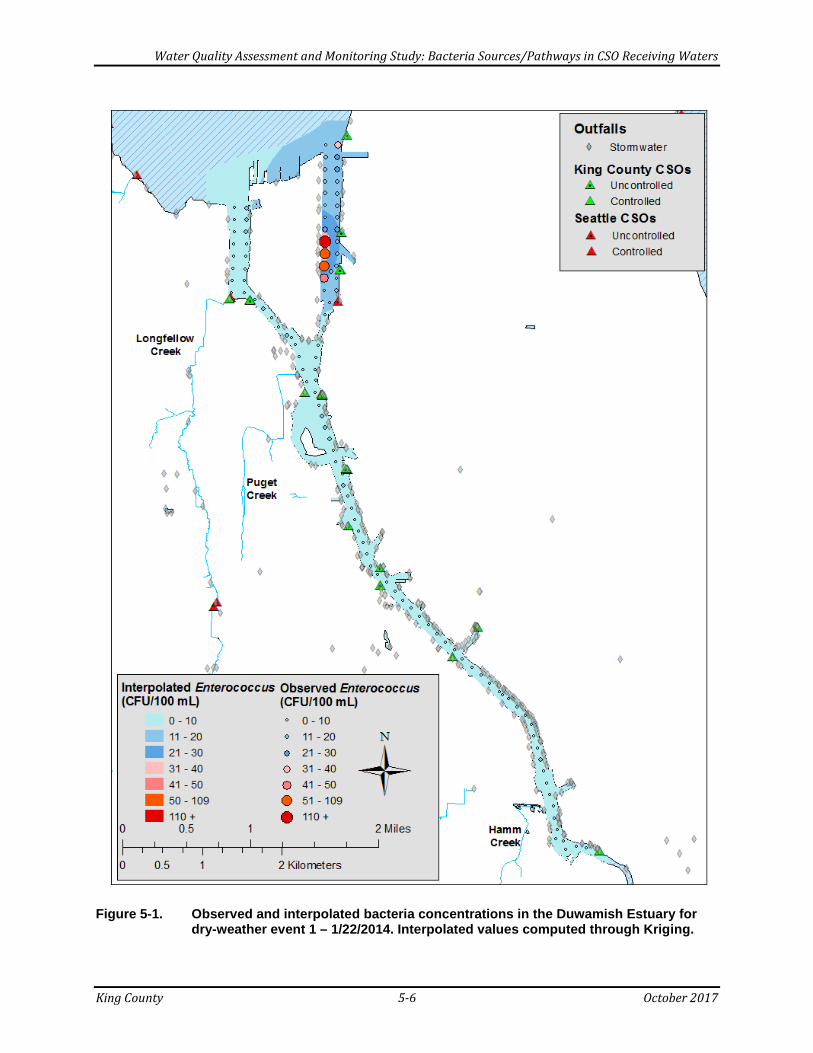
Water Quality Assessment and Monitoring Study: Bacteria Sources/Pathways in CSO Receiving Waters
King County 5-6 October 2017
Figure 5-1. Observed and interpolated bacteria concentrations in the Duwamish Estuary for dry-weather event 1 – 1/22/2014. Interpolated values computed through Kriging.

Water Quality Assessment and Monitoring Study: Bacteria Sources/Pathways in CSO Receiving Waters
King County 5-7 October 2017
Figure 5-2. Observed and interpolated bacteria concentrations in the Duwamish Estuary for dry-weather event 2 – 7/1/2014. Interpolated values computed through Kriging.
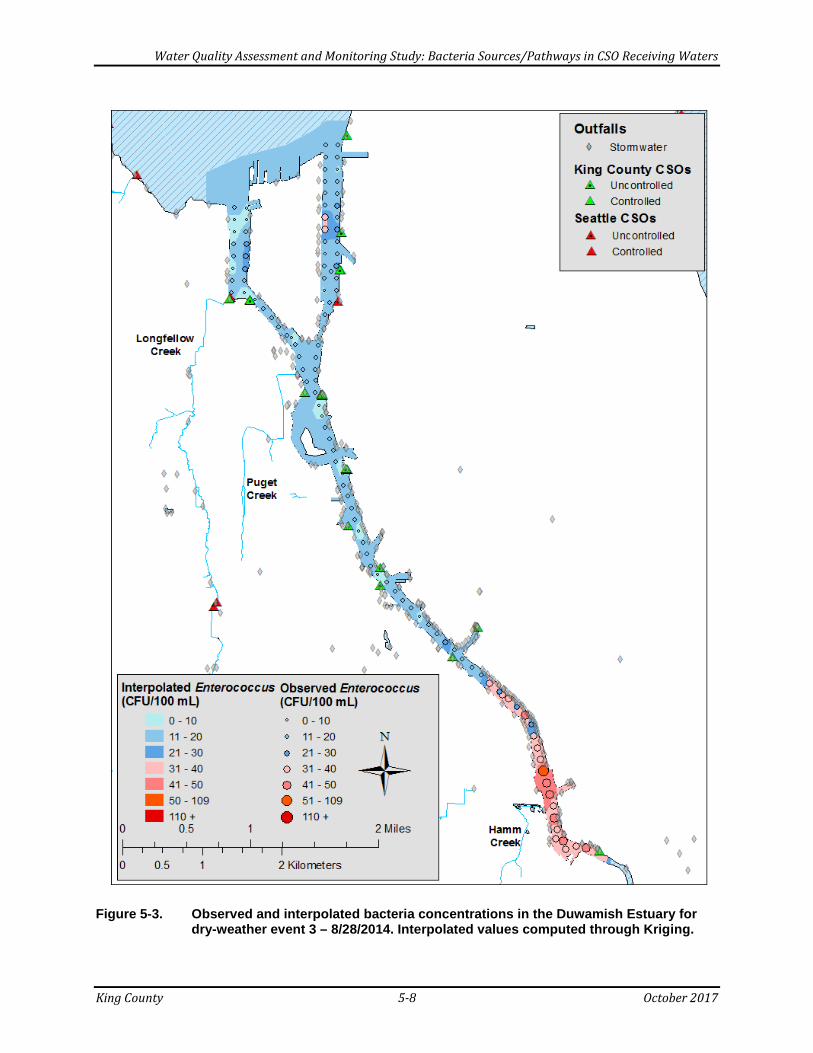
Water Quality Assessment and Monitoring Study: Bacteria Sources/Pathways in CSO Receiving Waters
King County 5-8 October 2017
Figure 5-3. Observed and interpolated bacteria concentrations in the Duwamish Estuary for
dry-weather event 3 – 8/28/2014. Interpolated values computed through Kriging.

Water Quality Assessment and Monitoring Study: Bacteria Sources/Pathways in CSO Receiving Waters
King County 5-9 October 2017
5.2.2 Wet-Weather Events Wet event Enterococcus concentrations ranged from 24 CFU/100 mL to 5,600 CFU/100 mL (Table 5-5). Pairwise non-parametric Wilcoxon signed rank tests indicate that each sampling event yielded significantly distinguishable Enterococcus concentrations (p < 0.0001). Significantly lower concentrations were detected during the second sampling event than during the first and third events. EPA’s RWQC STV (90th percentile) (110 CFU/100 mL) was exceeded at most sites during the first (n = 88) and third (n = 78) events. During the second event, concentrations in 26 of the 109 samples were greater than the STV. Samples exceeding the STV during the wet-weather events were collected in the East Waterway, south of Harbor Island, southwestern West Waterway, and near the confluence with Hamm Creek. Table 5-5. Wet-weather Enterococcus concentrations in the Duwamish Estuary study area
(CFU/100 mL; n = 109).
Event Number Minimum Maximum Mean Median Standard
Deviation Geomean 90th Percentile
1 (2/12/2014) 53 5,600 231 170 643 192 562
2 (3/3/2014) 24 2,900 166 55 416 78 256
3 (5/5/2014) 49 780 155 140 79 143 230
CFU = colony forming unit.
Wet-Weather Event Number 1
Enterococcus concentrations were highest (200─5,600 CFU/100 mL) in the East Waterway during the first wet-weather sampling event (2/12/2014), especially downstream of the Hanford #2 and Lander CSOs (Figure 5-4). During the night and morning prior to the sampling event, 15.3 MG were discharged from CSOs into the East Waterway, 1.4 MG into the West Waterway, and 2.2 MG into the Lower Duwamish Waterway (Table 5-3). Between cessation of CSO discharge and initiation of sampling, the tide was incoming (floodtide), which may have limited the dilution and export of CSO and stormwater effluent especially from the East Waterway. Elevated Enterococcus concentrations relative to the estuary as a whole were also detected downstream of the Hanford #1 CSO near the southern tip of Harbor Island. Concentrations in this area were greater along the eastern shore than the western shore. South of the Hanford #1 CSO, concentrations were generally between 100 CFU/100 mL and 200 CFU/100 mL. A single elevated concentration (630 CFU/100 mL) was observed in the southwest corner of the West Waterway, near the piped outlet of Longfellow Creek.
Wet-Weather Event Number 2
During the second wet-weather event on 3/3/2014, samples were collected from the East Waterway while the King St and Hanford #2 CSOs were discharging (Table 5-3; Figure 5-5). Between 5 p.m. on 3/2/2014 and the start of sample collection, 1.6 MG were discharged

Water Quality Assessment and Monitoring Study: Bacteria Sources/Pathways in CSO Receiving Waters
King County 5-10 October 2017
from CSOs into southeastern Elliott Bay, 6.4 MG into the East Waterway, 0.2 MG into the West Waterway, and 0.4 MG into the Lower Duwamish Waterway. Elevated Enterococcus concentrations (relative to concentrations upstream and at the inlets of the West and East waterways) were detected downstream of the Hanford #1 CSO near the southern tip of Harbor Island. Similar to the first wet-weather event, concentrations in this area were greater along the eastern shore than the western shore. Concentrations in the middle of the Lower Duwamish Waterway were slightly lower than those in the upper portion of Lower Duwamish Waterway.
Wet-Weather Event Number 3
The spatial distribution of Enterococcus concentrations observed during the third wet-weather sampling event does not reflect the influence of specific outfalls and other pathways (Figure 5-6). This is likely due to the nearly 30 hours, multiple tidal cycles, and low rainfall intensity between the cessation of CSO discharge and initiation of sampling. It is likely that most of CSO and stormwater effluent discharged over this period had been substantially diluted and/or transported from the estuary. On the day before sampling (5/4/2014), all CSOs had ceased to discharge by 4:11 a.m. (Table 5-3). Between 6 p.m. on 5/3/14 and 4 a.m. on 5/4/2014, 1.7 MG were discharged from CSOs into southeastern Elliott Bay, 28.0 MG into the East Waterway, 1.7 MG into the West Waterway, and 8.1 MG into the Lower Duwamish Waterway. The high bacteria concentrations in the southwest corner of the West Waterway (780 CFU/100 mL compared to less than 200 CFU/100 mL at other sites in the waterway) may be due to stagnation or inputs from Longfellow Creek. Enterococcus concentrations in the upper portion of the Lower Duwamish Waterway may reflect upstream inputs and/or the numerous stormwater outfalls in the area. Elevated Enterococcus concentrations were also detected along the southern edges of Harbor Island. This region may be influenced by local stormwater inputs and/or transport from upstream. Hu-2-Bacteroides concentrations were greatest in the East Waterway (maximum of 67 copies/mL) (Appendix D). However, these concentrations were low relative to the highest levels observed during the third wet-weather event in Elliott Bay on 10/14/2014 (2,250 copies/mL downstream of the mouth of the East Waterway). Human-sourced bacteria did not appear to be entering the Lower Duwamish Waterway at high concentrations. Observed Enterococcus and Hu-2-Bacteroides concentrations were not correlated (Spearman’s rho: ─0.28; p-value = 0.2392).

Water Quality Assessment and Monitoring Study: Bacteria Sources/Pathways in CSO Receiving Waters
King County 5-11 October 2017
Figure 5-4. Observed and interpolated bacteria concentrations and CSO discharges in the Duwamish Estuary for wet-weather event 1 – 2/12/2014. Interpolated values computed through Kriging.

Water Quality Assessment and Monitoring Study: Bacteria Sources/Pathways in CSO Receiving Waters
King County 5-12 October 2017
Figure 5-5. Observed and interpolated bacteria concentrations and CSO discharges in the Duwamish Estuaryfor wet-weather event 2 – 3/3/2014. Interpolated values computed through Kriging.

Water Quality Assessment and Monitoring Study: Bacteria Sources/Pathways in CSO Receiving Waters
King County 5-13 October 2017
Figure 5-6. Observed and interpolated bacteria concentrations and CSO discharges in the Duwamish Estuary for wet-weather event 3 – 5/5/2014. Interpolated values computed through Kriging.
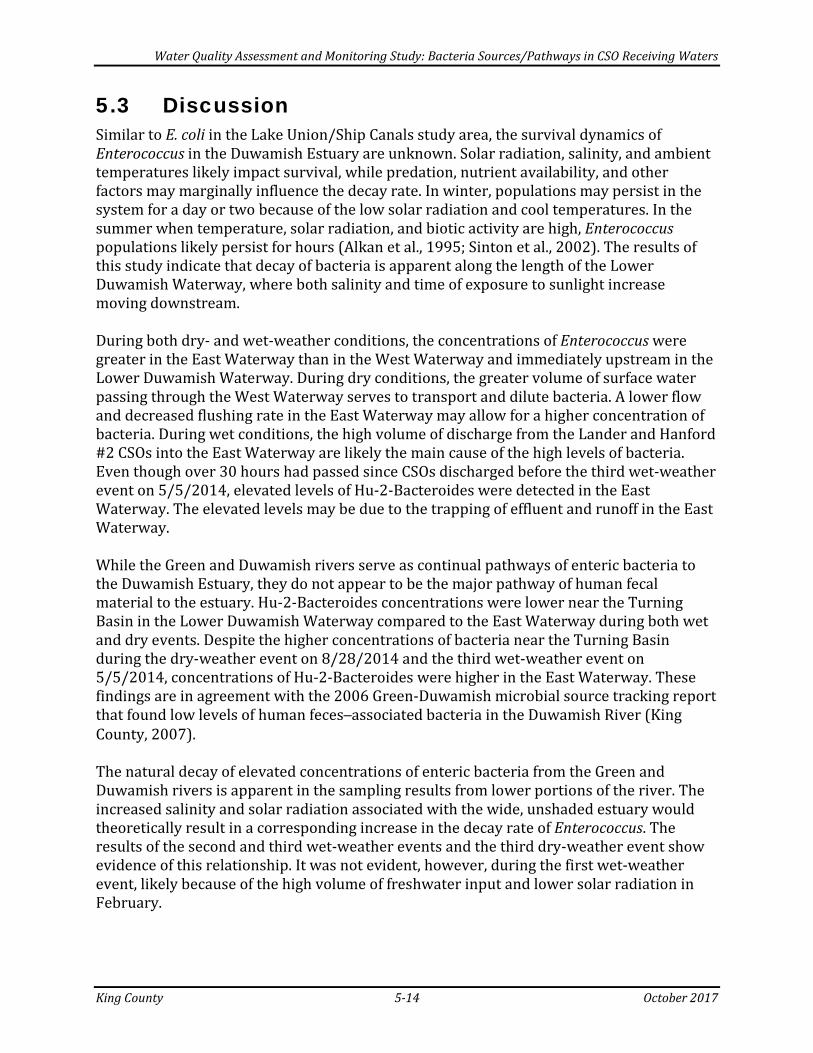
Water Quality Assessment and Monitoring Study: Bacteria Sources/Pathways in CSO Receiving Waters
King County 5-14 October 2017
5.3 Discussion Similar to E. coli in the Lake Union/Ship Canals study area, the survival dynamics of Enterococcus in the Duwamish Estuary are unknown. Solar radiation, salinity, and ambient temperatures likely impact survival, while predation, nutrient availability, and other factors may marginally influence the decay rate. In winter, populations may persist in the system for a day or two because of the low solar radiation and cool temperatures. In the summer when temperature, solar radiation, and biotic activity are high, Enterococcus populations likely persist for hours (Alkan et al., 1995; Sinton et al., 2002). The results of this study indicate that decay of bacteria is apparent along the length of the Lower Duwamish Waterway, where both salinity and time of exposure to sunlight increase moving downstream. During both dry- and wet-weather conditions, the concentrations of Enterococcus were greater in the East Waterway than in the West Waterway and immediately upstream in the Lower Duwamish Waterway. During dry conditions, the greater volume of surface water passing through the West Waterway serves to transport and dilute bacteria. A lower flow and decreased flushing rate in the East Waterway may allow for a higher concentration of bacteria. During wet conditions, the high volume of discharge from the Lander and Hanford #2 CSOs into the East Waterway are likely the main cause of the high levels of bacteria. Even though over 30 hours had passed since CSOs discharged before the third wet-weather event on 5/5/2014, elevated levels of Hu-2-Bacteroides were detected in the East Waterway. The elevated levels may be due to the trapping of effluent and runoff in the East Waterway. While the Green and Duwamish rivers serve as continual pathways of enteric bacteria to the Duwamish Estuary, they do not appear to be the major pathway of human fecal material to the estuary. Hu-2-Bacteroides concentrations were lower near the Turning Basin in the Lower Duwamish Waterway compared to the East Waterway during both wet and dry events. Despite the higher concentrations of bacteria near the Turning Basin during the dry-weather event on 8/28/2014 and the third wet-weather event on 5/5/2014, concentrations of Hu-2-Bacteroides were higher in the East Waterway. These findings are in agreement with the 2006 Green-Duwamish microbial source tracking report that found low levels of human feces─associated bacteria in the Duwamish River (King County, 2007). The natural decay of elevated concentrations of enteric bacteria from the Green and Duwamish rivers is apparent in the sampling results from lower portions of the river. The increased salinity and solar radiation associated with the wide, unshaded estuary would theoretically result in a corresponding increase in the decay rate of Enterococcus. The results of the second and third wet-weather events and the third dry-weather event show evidence of this relationship. It was not evident, however, during the first wet-weather event, likely because of the high volume of freshwater input and lower solar radiation in February.

Water Quality Assessment and Monitoring Study: Bacteria Sources/Pathways in CSO Receiving Waters
King County 5-15 October 2017
In addition to CSOs in the East Waterway, other signals of bacteria input include the mouth of Longfellow Creek into the southwestern corner of the West Waterway, the mouth of Hamm Creek into southern Lower Duwamish Waterway, and the CSOs south of Harbor Island into the Lower Duwamish Waterway. During each wet-weather event, elevated concentrations of Enterococcus were detected where Longfellow Creek enters the West Waterway. The second and third wet-weather sampling events show an increase in Enterococcus immediately downstream of the mouth of Hamm Creek, as does the first event but to a lesser degree. Hamm Creek also provided a signal during the third dry-weather sampling event. Results of Hu-2-Bacteroides sampling near these confluences do not suggest a strong signal of human feces─associated bacteria. During the first and second wet-weather events, the waters north of the Hanford #1, Duwamish, and Seattle 111 CSOs and the Duwamish-Diagonal storm drain along the eastern shore to the southern tip of Harbor Island were elevated relative to concentrations upstream and along the western shore. These bacteria concentrations were lower relative to those in the East Waterway, which was not unexpected because of the low discharge (0.85 MG and 0.35 MG) from the Hanford #1 CSO relative to the Lander and Hanford #2 CSOs (22 MG and 6.3 MG) during these events. Elevated bacteria levels were not observed during the third wet-weather event, likely because the 32 hours that elapsed between the discharge from Hanford #1 and initiation of sampling. Overall, results of the dry-weather sampling indicated that there are some bacteria inputs into the East Waterway and that a portion of these inputs includes human fecal material. Since over two weeks had passed without rainfall prior to sampling, these elevated concentrations are likely linked to direct discharge from ships or boats, leaking sewage systems, contaminated baseflow input from stormwater outfalls, and/or other shoreline discharges. The third dry-weather and third wet-weather sampling events indicated that bacterial loading from the Duwamish and Green Rivers occurs, but little of this input is of human origin.

Water Quality Assessment and Monitoring Study: Bacteria Sources/Pathways in CSO Receiving Waters
King County 5-16 October 2017
This page intentionally left blank.

Water Quality Assessment and Monitoring Study: Bacteria Sources/Pathways in CSO Receiving Waters
King County 6-1 October 2017
6.0 RESULTS AND DISCUSSION—ELLIOTT BAY
This chapter describes the observed and interpolated concentrations of bacteria in the Elliott Bay study area. It also discusses the conditions prior to and during sampling, including a description of CSO discharges. While this study did not examine specific sources, the discussion also includes an identification of potential pathways or sources for bacteria results that were observed. Detailed sampling results are shown in Appendix E.
6.1 Sampling Conditions and CSO Discharges Samples were collected in 2014 from 144 sites in Elliott Bay6 on six separate occasions: three dry-weather and three wet-weather sampling events.
6.1.1 Dry-Weather Sampling Recent rain events and CSOs prior to dry-weather sampling are shown in Table 6-1. The first dry-weather sampling event occurred 12 days after a large storm that resulted in more than 25 MG of CSO discharge. Given the low survival rate of bacteria in salt water, this discharge did not likely influence bacteria concentrations detected from the sampling. All dry-weather sampling took place during ebbtide. Hu-2-Bacteroides concentrations were measured at 20 of the 144 sites during the second and third dry-weather events. Table 6-1. Most recent rain events and associated CSO discharges prior to dry-weather
sampling in the Elliott Bay study area.
Event Number
Sampling Date
Days Since Last Rain
Event Ended
Duration of Last Event
(hr.)
Intensity of Last Event
(in.)
CSO Discharge Prior to Sampling
Date
1 1/23/2014 12 123 2.2 10 CSOs ─ 25.0 MG
2 6/30/2014 2 36 0.11 No 3 8/27/2014 12 16 0.03 1 CSO – 0.001 MG
Rainfall data from Denny CSO rain gauge.
6.1.2 Wet-Weather Sampling Rain events that triggered wet-weather sampling are shown in Table 6-2, and CSO discharges that occurred within two days of sampling are shown in Table 6-3. Sample collection for the first wet-weather event started at 8:13 a.m. on 3/4/2014 and ended at 10:23 a.m. Little rain fell during the night and morning before sampling, and light rain fell throughout the sampling. An ebbtide was observed throughout the sampling. Heavy rainfall and discharges from nine CSOs occurred days prior to sampling. The CSOs
6 Four sites were located in the mouth of the East Waterway and four in the mouth of the West Waterway of the Duwamish Estuary.

Water Quality Assessment and Monitoring Study: Bacteria Sources/Pathways in CSO Receiving Waters
King County 6-2 October 2017
ceased on the evening of 3/2/2014 or the morning of 3/3/2014 (Table 6-3); a total of 9.2 MG were discharged. The second wet-weather event occurred the day following the first wet-weather event. A heavy rainfall between 1:30 and 6:00 a.m. on 3/5/2014 triggered the sampling event. Sampling started 8:52 a.m. and ended at 11:28 a.m.; little rain fell during sampling. All samples were collected during an ebbtide. Earlier in the morning, CSOs discharged during an incoming tide. Thirteen CSOs discharged while sampling. Most of these CSOs discharged into the Duwamish Estuary (The County’s Lander, Hanford #2, Chelan, Hanford #1, Brandon, South Michigan, and West Michigan CSOs and Seattle’s 99, 107, and 111 CSOs); the County’s Magnolia, King, and Connecticut St CSOs discharged into Elliott Bay. Sample collection for the third wet-weather event started at 10:22 a.m. on 10/14/2014 and ended at 12:38 p.m.; no rainfall occurred during sample collection. A half-inch of rain fell the previous night, resulting in a discharge of 5.4 MG from seven King County CSOs. During the sampling effort the tide was incoming between 4 a.m. and 10:30 a.m. followed by slack conditions before shifting to an ebbtide around noon. Hu-2-Bacteroides concentrations were measured at 20 of the 144 sites during this event. Table 6-2. Rain events triggering wet-weather sampling in the Elliott Bay study area.
Event Number
Sampling Date
Storm Start Date/Time
Storm End Date/Time
Duration (hr.)
Intensity (in.)
Estimated intensity at
time of sampling (in.)
1 3/4/2014 3/1/2014 1:23 p.m.
3/6/2014 12:55 p.m. 120 3.04 1.1
2 3/5/2014 3/1/2014 1:23 p.m.
3/6/2014 12:55 p.m. 120 3.04 2.1
3 10/14/2014 10/13/2014 8:36 p.m.
10/18/2014 7:31 a.m. 107 1.17 0.5
Rainfall data from Denny CSO rain gauge. Rainfall prior to sampling estimated by King County Environmental Laboratory’s field unit. Sampling for events 1 and 2 was associated with the same storm event. Table 6-3. King County and Seattle CSO discharges into the Elliott Bay and Duwamish
Estuary study areas within two days of wet-weather sampling.
Event Number Owner CSO Start
Date/Time End
Date/Time Duration
(hr.) Volume
Discharged (MG)
1 (3/4/2014)
King County
Magnolia 3/2/2014 4:25 p.m.
3/3/2014 9:15 a.m. 16.83 0.58
King 3/2/2014 5:11 p.m.
3/3/2014 10:20 a.m. 17.13 1.16
Connecticut St (Kingdome)
3/2/2014 5:19 p.m.
3/2/2014 7:51 p.m. 2.53 0.47
Lander 3/2/2014 5:27 p.m.
3/2/2014 6:43 p.m. 1.28 1.85
Hanford #2 3/2/2014 5:39 p.m.
3/3/2014 10:04 a.m. 16.41 4.53

Water Quality Assessment and Monitoring Study: Bacteria Sources/Pathways in CSO Receiving Waters
King County 6-3 October 2017
Event Number Owner CSO Start
Date/Time End
Date/Time Duration
(hr.) Volume
Discharged (MG)
Chelan 3/2/2014 5:50 p.m.
3/2/2014 7:40 p.m. 1.83 0.18
Hanford #1 3/2/2014 5:08 p.m.
3/2/2014 5:47 p.m. 0.65 0.36
South Michigan 3/2/2014 5:32p.m.
3/3/2014 9:13 a.m. 15.68 0.09
Seattle 107 3/2/2014 5:42 p.m.
3/2/2014 6:38 p.m. 0.93 < 0.01
2 (3/5/2014)
King County
Magnolia 3/4/2014 7:35 p.m.
3/6/2014 1:50 a.m. 30.25 1.44
King 3/5/2014 2:26 a.m.
3/6/2014 3:17 a.m. 24.85 4.08
Connecticut St (Kingdome)
3/5/2014 2:35 a.m.
3/6/2014 5:28 a.m. 26.88 10.6
Lander 3/5/2014 2:38 a.m.
3/6/2014 9:08 a.m. 30.49 15.5
Hanford #2 3/5/2014 2:27 a.m.
3/6/2014 10:33 a.m. 32.10 23.5
Chelan 3/5/2014 2:33 a.m.
3/6/2014 9:32 a.m. 30.97 26.3
Hanford #1 3/5/2014 1:57 a.m.
3/5/2014 11:58 p.m. 22.02 20.6
Brandon 3/5/2014 2:20 a.m.
3/5/2014 10:15 p.m. 19.91 11
South Michigan 3/5/2014 2:13 a.m.
3/5/2014 8:35 p.m. 18.37 13.2
West Michigan 3/5/2014 2:49 a.m.
3/5/2014 10:01 a.m. 7.20 0.88
Seattle
62 3/5/2014 2:40 a.m.
3/5/2014 3:08 a.m. 0.47 <0.01
68 3/5/2014 4:10 a.m.
3/5/2014 6:14 a.m. 2.07 0.16
69 3/5/2014 2:46 a.m.
3/5/2014 3:12 a.m. 0.43 0.05
71 3/5/2014 2:40 a.m.
3/5/2014 3:12 a.m. 0.53 0.02
99 3/5/2014 2:40 a.m.
3/5/2014 2:14 p.m. 11.57 1.16
107 3/5/2014 2:40 a.m.
3/5/2014 8:52 p.m. 18.20 0.2
111 3/5/2014 2:38 a.m.
3/5/2014 11:15 a.m. 8.62 0.03
3 (10/14/2014)
King County
Magnolia 10/14/2014 12:15 a.m.
10/14/2014 2:20 a.m. 2.08 0.15
Connecticut St (Kingdome)
10/14/2014 2:30 a.m.
10/14/2014 2:58 a.m. 0.47 0.07
Lander 10/14/2014 2:26 a.m.
10/14/2014 3:21 a.m. 0.92 0.98
Hanford #2 10/14/2014 2:25 a.m.
10/14/2014 4:50 a.m. 2.42 3.84
Hanford #1 10/14/2014 1:39 a.m.
10/14/2014 1:50 a.m. 0.18 0.01

Water Quality Assessment and Monitoring Study: Bacteria Sources/Pathways in CSO Receiving Waters
King County 6-4 October 2017
Event Number Owner CSO Start
Date/Time End
Date/Time Duration
(hr.) Volume
Discharged (MG)
Brandon 10/14/2014 2:32 a.m.
10/14/2014 2:40 a.m. 0.14 < 0.01
South Michigan 10/14/2014 1:04 a.m.
10/14/2014 2:56 a.m. 1.85 0.32
6.2 Bacteria Distribution This section presents a summary of the Enterococcus concentrations detected in Elliott Bay during the dry- and wet-weather sampling events. Figures 6-1 through 6-6 show the Enterococcus concentrations observed and interpolated by Kriging during the six sampling events; CSO discharge volumes are shown for discharges within two days of the wet-weather sampling events.
6.2.1 Dry-Weather Events Dry-weather Enterococcus concentrations ranged from no detection to 1,800 CFU/100 mL (Table 6-4). Pairwise non-parametric Wilcoxon signed rank tests found that each sampling event yielded significantly distinguishable Enterococcus concentrations (p < 0.0001). Significantly lower concentrations were detected during the second sampling event. Enterococcus concentrations were typically greater at nearshore than at offshore sites. EPA’s RWQC GM (30 CFU/100 mL) was exceeded in 18 of the 144 samples (three during the first event in samples that visibly captured bird feces and 15 during the third event at the mouth of the East Waterway). Only two samples—both including visible bird feces—exceeded the STV (90th percentile) (110 CFU/100 mL). Table 6-4. Dry-weather Enterococcus concentrations in the Elliott Bay study area (CFU/100
mL; n = 144).
Event Number Minimum Maximum Mean Median Standard
Deviation Geomean 90th Percentile
1 (1/23/2014) 0 1,800 18.8 3.0 150 2.9 15.7
2 (6/30/2014) 0 25 1.6 0 2.9 0.4 5.0
3 (8/27/2014) 0 69 8.3 2.0 13.9 1.5 31.1 CFU = colony forming unit.
Dry-Weather Event Number 1
Enterococcus concentrations during the first dry-weather sampling event (1/23/2014) were low (less than 5 CFU/100 mL) throughout most of Elliott Bay except in two regions: northeastern and southwestern Elliott Bay (Figure 6-1). The highest concentration (1,800 CFU/100 mL) was detected in northeastern Elliott Bay. A significant mass of bird feces was observed floating near the sampling site. Elevated concentrations, relative to rest of the waterbody, were detected in southwestern Elliott Bay west of the West Waterway.

Water Quality Assessment and Monitoring Study: Bacteria Sources/Pathways in CSO Receiving Waters
King County 6-5 October 2017
Waterfowl residing near Seacrest and Jack Block parks may have contributed to the elevated Enterococcus levels.
Dry-Weather Event Number 2
Enterococcus was detected in 63 of the 144 sites during the second dry-weather sampling event (6/30/2014) (Figure 6-2). Concentrations were low. The highest concentration (25 CFU/100 mL) was detected near Pier 56, west of Alaskan Way and Seneca Street. Hu-2-Bacteroides concentrations were also low (maximum: 6.9 copies/mL; median: 0 copy/mL) (Appendix D). Hu-2-Bacteroides levels were not significantly correlated with observed Enterococcus concentrations (Spearman’s rho: 0.14; p-value = 0.5673). Sampling in the Duwamish Estuary on the following day (7/1/2014) found that Hu-2-Bacteroides and Enterococcus concentrations were slightly higher in the middle of the East Waterway than in Elliott Bay on the day prior.
Dry-Weather Event Number 3
During the third dry-weather sampling event (8/27/2014), elevated concentrations of Enterococcus (greater than 40 CFU/100 mL) were detected at the mouth of the East Waterway and northeast of the mouth of the West Waterway (Figure 6-3). Hu-2-Bacteroides concentrations were not significantly correlated with observed Enterococcus concentrations (Spearman’s rho: 0.26; p-value = 0.2568). The concentration of Hu-2-Bacteroides in the mouth of the East Waterway was substantially greater than concentrations in the bay (67.3 copies/mL compared to a median of 0.4 copy/mL). Sampling of the Duwamish Estuary on the following day (8/28/2014) found that Hu-2-Bacteroides levels in the East Waterway were similarly elevated (7 to 24 copies/mL), although lower than those observed at the mouth on 8/27/2014. The presence human-source bacteria in the East Waterway in late August, despite the lack of recent rainfall, may be due to illicit discharge of wastewater from ships, cross-connection of sanitary sewer lines with stormwater sewers, or other illicit discharges.

Water Quality Assessment and Monitoring Study: Bacteria Sources/Pathways in CSO Receiving Waters
King County 6-6 October 2017
Figure 6-1. Observed and interpolated bacteria concentrations in Elliott Bay for dry-weather
event 1 – 1/23/2014. Interpolated values computed through Kriging.
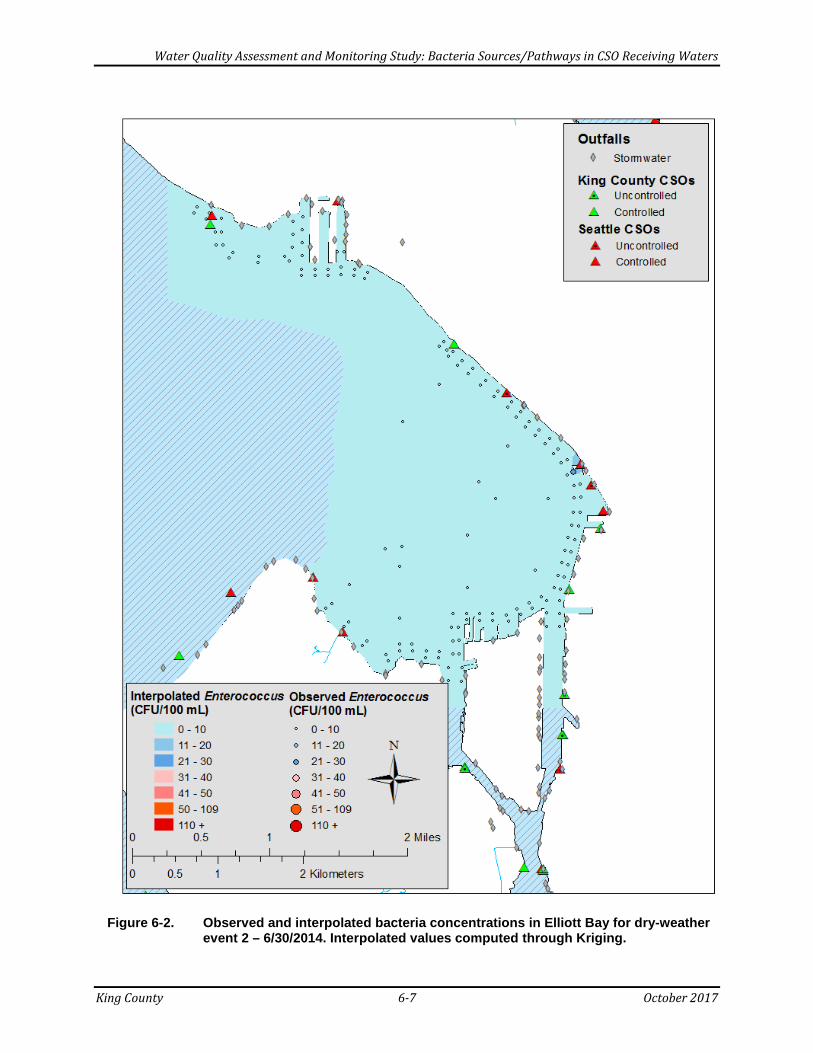
Water Quality Assessment and Monitoring Study: Bacteria Sources/Pathways in CSO Receiving Waters
King County 6-7 October 2017
Figure 6-2. Observed and interpolated bacteria concentrations in Elliott Bay for dry-weather event 2 – 6/30/2014. Interpolated values computed through Kriging.

Water Quality Assessment and Monitoring Study: Bacteria Sources/Pathways in CSO Receiving Waters
King County 6-8 October 2017
Figure 6-3. Observed and interpolated bacteria concentrations in Elliott Bay for dry-weather event 3 – 8/27/2014. Interpolated values computed through Kriging.

Water Quality Assessment and Monitoring Study: Bacteria Sources/Pathways in CSO Receiving Waters
King County 6-9 October 2017
6.2.2 Wet-Weather Events Wet event Enterococcus concentrations ranged from 2 CFU/100 mL to 6,100 CFU/100 mL (Table 6-5). Pairwise non-parametric Wilcoxon signed rank tests found that each of these sampling events yielded significantly distinguishable Enterococcus concentrations (p < 0.0001). Concentrations detected during the second sampling were significantly greater than those detected during the other two events. Significantly lower concentrations were detected during the first sampling event. EPA’s RWQC STV (90th percentile) was exceeded in 212 of 432 samples; only three of these exceedances occurred during the first wet-weather event. The second and third wet-weather events detected concentrations exceeding the STV at the mouths of the West and East waterways, along the downtown Seattle waterfront, and at Smith Cove. Table 6-5. Wet-weather Enterococcus concentrations in Elliott Bay (CFU/100 mL; n = 144).
Event Number Minimum Maximum Mean Median Standard
Deviation Geomean 90th Percentile
1 (3/4/2014) 2 310 32.8 29.0 38.1 24.8 43.7
2 (3/5/2014) 4 6100 723 285 1,240 210 1,950
3 (10/14/2014) 2 2100 348 225 390 181 973 CFU = colony forming unit.
Wet-Weather Event Number 1
A number of CSOs discharged into Elliott Bay and the Duwamish Estuary two days prior to the first wet-weather sampling event (3/4/2014) (0.6 MG into northwest Elliott Bay, 1.6 MG into southeastern Elliott Bay, 6.3 MG into the East Waterway, 0.2 MG into the West Waterway, and 0.1 MG into the mid-reach of the Lower Duwamish Waterway). All discharges ceased by the morning of the 3/3/2014, the day before sampling. The data suggest that these CSO discharges did not have an influence on the spatial distribution of bacterial concentrations after such a lengthy period, possibly because of dilution, export to Puget Sound, and/or bacterial decay (Figure 6-4). Relatively elevated concentrations of Enterococcus were observed at the mouths of the East and West waterways, along the northern side of Harbor Island, and along the downtown Seattle waterfront.
Wet-Weather Event Number 2
During the second wet-weather sampling event (3/5/2014), high concentrations of Enterococcus (over 500 CFU/100 mL) were detected in the East Waterway and along Elliott Bay’s eastern shore (Figure 6-5). Elevated concentrations (200─700 CFU/100 mL) were also detected in the West Waterway. Enterococcus concentrations from the mouth of the East Waterway to northwest of Pier 46 exceeded 1,000 CFU/100 mL. High levels were interpolated along the East Waterway’s eastern shore through Piers 90 and 91 in north Elliott Bay. Concentrations near the Magnolia CSO outfall were below 30 CFU/100 mL (the EPA RWQC GM) despite a 1.4-MG CSO discharge. The Magnolia outfall is located on the bay’s floor at a depth of approximately 7.5 m. Effluent from this CSO is likely diluted and

Water Quality Assessment and Monitoring Study: Bacteria Sources/Pathways in CSO Receiving Waters
King County 6-10 October 2017
quickly transported from the surface waters to a degree that may mask the signal of this outfall. On the day of sampling, a number of CSOs discharged into Elliott Bay and the estuary: 1.6 MG into northwestern Elliott Bay, 0.1 MG into northeastern Elliott Bay, 14.7 MG into southeast Elliott Bay, 29.2 into the East Waterway, 27.5 MG into the West Waterway, and 25.1 MG into the mid-reach of the Lower Duwamish Waterway. These volumes may overestimate the discharges prior to sampling because they represent the volumes from the entire discharge events, a portion of which may have occurred after sample collection. The Elliott West CSO Treatment Plant Monitoring Report (King County, unpublished data) indicates that the treatment plant discharged 12.0 MG of treated effluent on 3/5/2014; the effluent had an Enterococcus concentration of 1 CFU/100 mL. The incoming freshwater flow from the Duwamish Estuary appears to have a strong influence on the spatial distribution of bacteria in mid- and southern Elliott Bay. Two plumes coming from the East and West waterways are evident in the Enterococcus data (> 200 CFU/100 mL), with low concentrations (< 30 CFU/100 mL) immediately north of Harbor Island and in southwestern Elliott Bay. The King St and Kingdome CSOs and stormwater outfalls contributed to the eastern plume. These CSO and stormwater outfalls were discharging the morning before sampling during an incoming tide, which may have limited the dilution and exit of bacteria-rich waters.
Wet-Weather Event Number 3
Similar to the second wet-weather event, Enterococcus concentrations were elevated during the third event (10/14/2014) in the East and West waterways and along Elliott Bay’s eastern shore (Figure 6-6). The elevated concentrations along the eastern shore did not extend as far north as during the second event. Enterococcus concentrations from the mouth of the East Waterway to northwest of Pier 46 were high, exceeding 1,000 CFU/100 mL. Concentrations above 110 CFU/100 mL (the EPA RWQC STV) were detected along the eastern and northern shores. The lowest concentrations were detected in northwestern Elliott Bay near the Magnolia CSO outfall and in southwest Elliott Bay near Seacrest Park, where concentrations were below 40 CFU/100 mL. On the morning of the sampling event, a number of CSOs discharged into the study area (0.2 MG into northwestern Elliott Bay, 0.1 MG into southeastern Elliott Bay, 4.8 MG into the East Waterway, and 0.3 MG into the mid-reach of the Lower Duwamish Waterway). No CSOs discharged directly into the West Waterway. As in the second wet-weather sampling event, incoming flow from the Duwamish Estuary appears to have a strong influence on the spatial distribution of bacteria in mid- and southern Elliott Bay. Two plumes of high bacteria concentrations (> 250 CFU/100 mL) coming from the East and West waterways were evident, with low concentrations (< 30 CFU/100 mL) immediately north of Harbor Island and in southwestern Elliott Bay. Incoming tide conditions during the discharge of CSOs and stormwater outfalls may have limited the dilution of effluent and prevented its exit.

Water Quality Assessment and Monitoring Study: Bacteria Sources/Pathways in CSO Receiving Waters
King County 6-11 October 2017
Hu-2-Bacteroides concentrations were highly correlated with observed Enterococcus concentrations (Spearman’s rho: 0.72; p-value = 0.0003). Hu-2-Bacteroides concentrations were greatly elevated in the East Waterway plume along Elliott Bay’s eastern shore (650─2,250 copies/mL) relative to the rest of the bay (1─250 copies/mL). Despite high Enterococcus concentrations entering from the West Waterway and Elliott Bay’s northern shore, Hu-2-Bacteroides concentrations did not reach the levels seen in the East Waterway. Since the majority of CSO discharge was in the East Waterway, it is reasonable to expect that a higher level of human feces─associated bacteria would be observed in that area. The elevated levels in the West Waterway and northern shore may reflect inputs from Lower Duwamish Waterway CSOs, stormwater, Longfellow Creek, and backwash from the East Waterway.

Water Quality Assessment and Monitoring Study: Bacteria Sources/Pathways in CSO Receiving Waters
King County 6-12 October 2017
Figure 6-4. Observed and interpolated bacteria concentrations and CSO discharges in Elliott Bay for wet-weather event 1 – 3/4/2014. Interpolated values computed through Kriging.

Water Quality Assessment and Monitoring Study: Bacteria Sources/Pathways in CSO Receiving Waters
King County 6-13 October 2017
Figure 6-5. Observed and interpolated bacteria concentrations and CSO discharges in Elliott Bay for wet-weather event 2 – 3/5/2014. Interpolated values computed through Kriging.

Water Quality Assessment and Monitoring Study: Bacteria Sources/Pathways in CSO Receiving Waters
King County 6-14 October 2017
Figure 6-6. Observed and interpolated bacteria concentrations and CSO discharges in Elliott Bay for wet-weather event 3 – 10/14/2014. Interpolated values computed through Kriging.

Water Quality Assessment and Monitoring Study: Bacteria Sources/Pathways in CSO Receiving Waters
King County 6-15 October 2017
6.3 Discussion The survival dynamics of Enterococcus spp. in Elliott Bay are unknown. The factors affecting the bacteria levels in Elliott Bay are likely similar to those discussed for the Duwamish Estuary. In winter, bacteria populations may persist in the system for a day or two because of low solar radiation and cool temperatures. In the summer when temperatures, solar radiation, and biotic activity are high, Enterococcus populations likely persist for only hours. Enterococcus concentrations from the first wet-weather sampling event were very different from the other two sampling events, even though the second event occurred the day after the first event. CSO discharges had ceased more than 24 hours before the start of the first sampling event. Despite a 0.2-inch rainfall between 2 a.m. and 10:30 a.m. on the day of sampling, few areas of elevated bacteria were found. The data likely reflect the short survival time of enteric bacteria in high salinity waters exposed to sunlight. This short survival time starkly contrasts to the possible four- or five-day survival of E. coli in Lake Union/Ship Canal in mid-January. Additionally, the first wet-weather sampling event demonstrates that inputs of enteric bacteria from non-CSO pathways are relatively minor during such a light rain event. The results of this study indicate that the Duwamish Estuary is a major pathway of enteric bacteria to Elliott Bay. The second and third wet-weather events (3/5/2014 and 10/14/2014) found that two substantial plumes of water with high concentrations of Enterococcus enter the bay from the West and East waterways. Because the counterclockwise circulation pattern of Elliott Bay pushes incoming flows from the Duwamish Estuary eastward along the shoreline, it is difficult to distinguish the Enterococcus signals that enter from the Duwamish from those that enter from CSOs, stormwater outfalls, and surface runoff along Elliott Bay’s eastern shore. During the second and third wet-weather events, high Enterococcus concentrations were detected along the bay’s eastern shore and some elevated concentrations were detected in open water. Elevated open-water concentrations were not observed during the first wet-weather event or during any of the dry-weather events. Results from the Hu-2-Bacteroides sampling during the third wet-weather event indicate that the bacteria-rich plume emanating from the East Waterway contains a high level of bacteria from human feces. Relatively low levels were detected in the West Waterway. Based on the low Hu-2-Bacteroides concentration observed at Smith Cove (Piers 90 and 91) during the second and third wet-weather events, the elevated levels of Enterococcus observed are likely linked to runoff from docks and stormwater transport of predominately non-human fecal material sources. During the third dry-weather sampling event (8/27/2014), elevated Enterococcus concentrations were detected in the East Waterway and north of Harbor Island. Hu-2-Bacteroides concentrations indicated the presence of human fecal material in the East

Water Quality Assessment and Monitoring Study: Bacteria Sources/Pathways in CSO Receiving Waters
King County 6-16 October 2017
Waterway. Given that over two weeks had passed without rainfall before sampling began, these elevated concentrations are likely linked to stormwater outfalls discharging contaminated baseflow, direct discharge from ships, and/or leaking sewage systems. The second and third dry-weather sampling events (7/1/2014 and 8/28/2014) in the Duwamish Estuary also indicated the presence of human fecal material in the East Waterway.
Water Quality Assessment and Monitoring Study: Bacteria Sources/Pathways in CSO Receiving Waters
King County 7-1 October 2017
7.0 SUMMARY AND RECOMMENDATIONS This chapter summarizes the findings of the bacterial study for each of the study areas and then presents recommendations for additional studies to follow up on these findings.
7.1 Summary of Study Area Findings The spatial distribution of enteric bacteria in Lake Union/Ship Canal, the Duwamish Estuary, and Elliott Bay is determined by three factors:
• Inputs such as stormwater, CSOs, surface runoff, direct deposition by birds and mammals, illicit wastewater discharges, and upstream sources
• Circulation patterns of the waterbodies (flow and tidal patterns) • Bacteria survivorship
For all three study areas, CSOs are a dominant pathway of enteric bacteria during storm events that are large enough to trigger discharges. Concentrations were greatest during wet-weather events. Human-specific enteric bacteria were detected at higher concentrations during wet-weather events than dry-weather events for Elliott Bay and the Duwamish Estuary. (Hu-2-Bacteroides concentrations were not measured in Lake Union/Ship Canal during wet weather.) However, reducing CSO discharges is not expected to completely remove the threats of waterborne pathogens to humans, and enteric bacteria concentrations after CSO control may still exceed EPA’s RWQC. During smaller storm events and under dry-weather conditions, substantial concentrations of bacteria enter the waterbodies from stormwater outfalls, direct surface runoff, and feces deposited from birds, mammals, and illicit discharges. Contaminated baseflow discharged through stormwater outfalls and creeks is also a likely pathway of bacteria during dry weather. Possible signals of contaminated baseflow were observed in Lake Union/Ship Canal (the Capitol Hill stormwater outfall into Lake Union and the Ballard stormwater outfalls into Salmon Bay) and in the Duwamish Estuary (Longfellow Creek, Hamm Creek, and the Hanford stormwater basin into the East Waterway). Three areas showed potential to exceed the EPA RWQC GM during dry-weather: East Waterway, southern Lower Duwamish Waterway, and, to a lesser degree, Salmon Bay. Other areas showed potential to exceed the EPA RWQC STV during wet-weather: the length of the Duwamish Estuary, including the West Waterway; the downtown Seattle waterfront, Smith Cove; the center of inner Elliott Bay; and southern Lake Union (not including the South Lake Union waterfront). While much of the bacteria in dry weather seem to be of non-human origin, two areas—Salmon Bay in Lake Union/Ship Canal and the East Waterway of the Duwamish Estuary—show clear signals of human-associated bacteria.

Water Quality Assessment and Monitoring Study: Bacteria Sources/Pathways in CSO Receiving Waters
King County 7-2 October 2017
7.1.1 Lake Union/Ship Canal Findings from bacteria sampling in the Lake Union/Ship Canal study area are as follows:
• E. coli concentrations in water that enters the system from Lake Washington are lowrelative to values observed downstream in southern Lake Union and Salmon Bayduring both dry- and wet-weather conditions.
• Despite discharge from the Montlake and University CSO outfalls, E. coliconcentrations in Portage Bay remain low relative to downstream values. Someelevated levels were detected in southwestern Portage Bay, possibly from runofffrom the shoreline and discharge of baseflow and stormflow from stormwateroutfalls. The flushing rate of Portage Bay likely prevents the buildup of bacteria, butstagnation in southern Portage Bay is possible.
• During two of the wet-weather events and one dry-weather event, concentrations ofE. coli were greater in southern than in northern Lake Union. During the otherevents, concentrations throughout the lake were similar. Stagnation of stormwaterdischarges and runoff in southern Lake Union resulting from dominant flowpatterns may contribute to elevated bacteria concentrations. A bacteria signal insoutheastern Lake Union suggests inputs from the Capitol Hill stormwater drainagebasin and the immediate shoreline during wet weather. Elevated concentrations inthis area during a dry-weather event suggest baseflow input from the drainagebasin as well.
• Salmon Bay had the greatest concentrations of E. coli during both dry- and wet-weather conditions. Runoff, stormwater, CSOs, and upstream inflow are likelypathways during wet weather. Direct deposition (such as bird droppings), illicit boatdischarges, contaminated baseflow, and other shoreline discharges are likely theprimary pathways during dry weather.
• Houseboats in Lake Union and Portage Bay did not appear to contribute substantialinputs of enteric bacteria during the sampling events.
• Bacteria associated with human feces were detected at greater concentrations inSalmon Bay than in the rest of the study area during two of the dry-weather events.
7.1.2 Duwamish Estuary Findings from bacteria sampling in the Duwamish Estuary study area are as follows:
• Enterococcus concentrations were consistently greater in the East Waterway than inthe West Waterway and immediately upstream during both dry- and wet-weatherevents.
• The elevated dry-weather bacteria levels in the East Waterway may be linked tolower flow and decreased flushing relative to the West Waterway. Other potentialbacteria pathways include deposition by birds, illicit discharges from boats, andbaseflow from the Lander stormwater drainage basin.
• Levels of human feces─associated bacteria were also higher in the East Waterwaythan other parts of the study area during both dry and wet weather; concentrations
Water Quality Assessment and Monitoring Study: Bacteria Sources/Pathways in CSO Receiving Waters
King County 7-3 October 2017
were generally a magnitude greater in wet weather. Possible dry-weather pathways in the East Waterway include illicit discharges from boats, baseflow input from stormwater outfalls, and leaking sewage systems.
• Data from one dry-weather and one wet-weather sampling event indicate enteric bacteria inputs from the Duwamish and Green rivers; little of the input appears to be from human feces.
• Enteric bacteria input from the Green and Duwamish rivers appears to decay as salinity and the time exposed to solar radiation increase, until further bacteria loading from CSOs, stormwater outfalls, and runoff downstream increase concentrations.
• Other signals of bacteria inputs include the mouth of Longfellow Creek into the southwestern corner of the West Waterway, the mouth of Hamm Creek in the southern Lower Duwamish Waterway, and the CSOs south of Harbor Island.
7.1.3 Elliott Bay Findings from bacteria sampling in the Elliott Bay study area are as follows:
• Outflow from the Duwamish Estuary is the dominant pathway of bacteria loading to Elliott Bay. The counterclockwise circulation pattern of Elliott Bay pushes plumes emanating from the estuary against the bay’s eastern shore. Stormwater and CSO effluents and surface runoff likely augment the plume as it travels northward.
• Dry-weather Enterococcus concentrations were typically low; no apparent spatial trends were observed. Relatively elevated concentrations were detected at the mouth of the East Waterway during one dry-weather event.
• During the dry-weather sampling events in Elliott Bay and the Duwamish Estuary in late August, elevated concentrations of Enterococcus and human feces─associated bacteria were detected in the East Waterway compared to concentrations in Elliott Bay. Illicit discharge from boats, leaking septic systems, and contaminated stormwater baseflows are possible pathways.
• Smith Cove (Piers 90 and 91) and the shore near Centennial Park in northern Elliott Bay had elevated bacteria concentration during two of the wet-weather events. Possible pathways are runoff from the piers, stormwater collected from the piers and from the Interbay area, Seattle CSO 68, and waters from Elliott Bay’s eastern shore pushed toward the area by the circulation pattern.
• During wet-weather events, surface waters above the Magnolia CSO outfall had low Enterococcus concentrations relative to other regions of Elliott Bay, including nearby Smith Cove. Discharges from the Magnolia CSO are likely diluted and transported from the surface waters to a degree that masks the signal of this outfall.
7.2 Recommendations for Future Studies While this study provides a starting point, more information about pathways and specific sources of bacteria is needed to determine appropriate management actions. Bacteria pathways and hot spots in the study areas could be further characterized through tracking
Water Quality Assessment and Monitoring Study: Bacteria Sources/Pathways in CSO Receiving Waters
King County 7-4 October 2017
human and non-human sources and characterizing baseflow and stormflow from stormwater outfalls. In addition, determination of in situ bacterial decay rates would assist in data interpretation and future bacteria modeling efforts. The following sections describe these recommendations in more detail.
7.2.1 Human and Non-Human Source Tracking The Hu-2-Bacteroides analysis in this study provided limited, although intriguing, insight into the distribution of human feces─associated bacteria in the three study areas. To better evaluate and identify specific sources and pathways of human feces, resampling of Salmon Bay and the East Waterway at a finer spatial resolution during both dry and wet weather is recommended. Longfellow Creek serves as a pathway of bacteria to the West Waterway, and the creek consistently experiences high fecal coliform bacteria concentrations. Potential sources or pathways contributing to these elevated levels may be wildlife and pet waste, leaking wastewater systems, failing septic systems, and CSOs. Human-source tracking during dry and wet weather could be used to determine the contribution of human feces to the bacteria in Longfellow Creek. Hamm and Puget creeks could be similarly studied. The 2006 Green-Duwamish Microbial Source Tracking study established that avian species, small mammals, and canine/felines are the dominant sources of E. coli for tributaries in the Lower Green River. It is recommended that the distribution of enteric bacteria source categories be established for the northern Lower Duwamish Waterway, East and West waterways, Smith Cove, southwest Elliott Bay, southern Lake Union, and Salmon Bay. The distribution would help in prioritizing of source control actions, such as whether to focus on pet waste or geese; in determining whether human fecal contamination or stormwater contributions of non-human fecal material is the dominant cause of elevated bacteria levels; and targeting particular stormwater drainage basins.
7.2.2 Characterization of Baseflow and Stormflow from Stormwater Outfalls
The presence of baseflow and its bacterial contributions to the three study areas is not well understood. A better understanding of this pathway would help determine whether and what type of actions are needed. In the Duwamish Estuary, baseflow in Hamm, Puget, and Longfellow creeks is readily visible given their open exposure, although the outlet from Longfellow Creek is piped. The addition of monitoring sites at the confluences of Hamm and Puget creeks could be added to the King County water quality monitoring program. Longfellow Creek is currently monitored. In addition, some stormwater outfalls may be continuous pathways of bacteria inputs during dry weather, with increased baseflow and loading during wet weather especially in the days following rainfall. The volume and bacteria concentrations of baseflow entering

Water Quality Assessment and Monitoring Study: Bacteria Sources/Pathways in CSO Receiving Waters
King County 7-5 October 2017
stormwater outfalls in the study areas have not been characterized, other than in a small stormwater basin in the University District that was monitored by Seattle Public Utilities for an NPDES permit. Stormwater has been characterized on a regional and national scale through programs such as the National Stormwater Quality Database, the Nationwide Urban Runoff Program, and Ecology’s Special Condition 8.D of the 2007─2012 Phase I Municipal Stormwater Permit. Data from these programs allow for generalization of stormwater volume and constituents based on land use, drainage area, and season. However, the variability of stormwater basins on a local scale makes it necessary to monitor and characterize outfall effluent in order to identify particular stormwater basins of concern. The data from the aforementioned programs may be useful in developing an inventory of basins that warrant baseflow characterization, including flow, bacteria concentrations, and perhaps nutrient concentrations. Based on the results of this study, the following are stormwater outfalls of interest in the study areas:
• Lake Union/Ship Canal (see Appendix G) o Portage Bay outfall o Densmore Drain/Green Lake outfall west of the I-5 Bridge into the northeast
arm of Lake Union o Capitol Hill drainage outfall into southeastern Lake Union o Wallingford outfall into northwestern Lake Union o Fremont outfalls into the Fremont Cut o Ballard outfalls into Salmon Bay
• Duwamish Estuary (see Appendix G) o Lander (SoDo) outfalls into the East Waterway o Duwamish Diagonal (Central District, Beacon Hill, SoDo) outfall into the East
Waterway o Delridge outfalls into the Lower Duwamish and West waterways o South Park outfalls into the Lower Duwamish Waterway o King County Airport outfalls into the Lower Duwamish Waterway o Slip 5 outfall into the Lower Duwamish Waterway o Norfolk outfall into the Lower Duwamish Waterway
• Elliott Bay (see Appendix G) o Interbay outfall into Smith Cove in Elliott Bay o Magnolia outfalls into outer northwestern Elliott Bay o North Admiral outfalls into southwestern Elliott Bay
Water Quality Assessment and Monitoring Study: Bacteria Sources/Pathways in CSO Receiving Waters
King County 7-6 October 2017
7.2.3 In Situ Bacteria Decay Rates Determination of the bacteria decay rates for E. coli or Enterococcus in various regions of the three study areas would enhance the interpretation of measured bacteria concentrations and improve future modeling efforts to understand spatiotemporal distribution of bacteria and help target management action. Submerged transparent bags inoculated with feces can be used to monitor decay at a discrete time increment. Temperature, salinity, and insolation should be coincidently measured..
7.3 Next Steps
The next step in the Water Quality Assessment and Monitoring Study is to condense and synthesize the information presented in this and previous reports. A synthesis report will include a description of the ways the information can be used to assist in CSO control and other regional water quality planning activities.

Water Quality Assessment and Monitoring Study: Bacteria Sources/Pathways in CSO Receiving Waters
King County 8-1 October 2017
8.0 REFERENCES Ahmed, W., R. Yusuf, I. Hasan, A. Goonetilleke, and T. Gardner. 2010. Quantitative PCR assay
of sewage-associated Bacteroides markers to assess sewage pollution in an urban lake in Dhaka, Bangladesh. Canadian Journal of Microbiology 56: 838–845.
Alkan, U., D.J. Elliott, and L.M. Evison. 1995. Survival of enteric bacteria in relation to
simulated solar radiation and other environmental factors in marine waters. Water Research 29: 2071–2081.
An, Y., D.H. Kampbell, and G.P. Breidenbach. 2002. Escherichia coli and total coliforms in
water and sediments at lake marinas. Environmental Pollution 120: 771–778. Anchor, Windward, and Battelle. 2008. East Waterway Operable Unit, Supplemental
Remedial Investigation/Feasibility Study, Draft Final Conceptual Site Model and Data Gaps Analysis Report. Prepared for Port of Seattle.
Anderson, I.C., M.W. Rhodes, and H.I. Kator. 1979. Sublethal stress in Escherichia coli: a
function of salinity. Applied and Environmental Microbiology 38: 1147–1152 Anderson, K.L., J.E. Whitlock, and V.J. Harwood. 2005. Persistence and differential survival
of fecal indicator bacteria in subtropical waters and sediments. Applied and Environmental Microbiology 71:3041–3048.
Auer, M.T., and S.L. Niehaus. 1993. Modeling fecal coliform bacteria-field and laboratory
determination of loss kinetics. Water Research 27: 693–701 Bae, S., and S. Wuertz. 2009. Rapid decay of host-specific fecal Bacteroidales cells in
seawater as measured by quantitative PCR with propidium monoazide. Water Research 43: 4850–4859.
Balleste, E., and A.R. Blanch. 2010. Persistance of Bacteroides species populations in a river
as measure by molecular and culture techniques. Applied and Environmental Microbiology 76: 7608–7616
Balleste, E., X. Bonjoch, L.A. Belanche, and A.R. Blanch. 2010. Molecular indicators used in
the development of predictive models for microbial source tracking. Applied and Environmental Microbiology 76: 1789–1795.
Belt, K.T., W.P. Stack, R.V. Pouyat, K. Burgess, P.M. Groffman, W.M. Frost, SS Kaushal, and G.
Hager. 2012. Ultra-urban baseflow and stormflow concentrations and fluxes in a watershed undergoing restoration (WS263). In Proceedings of the Water Environment Federation, Stormwater 2012. 2012(5): 262–276.
Water Quality Assessment and Monitoring Study: Bacteria Sources/Pathways in CSO Receiving Waters
King County 8-2 October 2017
Boehm, A.B., L.C. Van De Werfhorst, J.F. Griffith, P.A. Holden, J.A. Jay, O.C. Shanks, D. Wang, and S.B. Weisberg. 2013. Performance of forty-one microbial source tracking methods: a twenty-seven lab evaluation study. Water Research 47: 6812–6828.
Brandes, D., J.C. Gregory, and M.L. Nilson. 2005. Base flow trends in urbanizing watersheds
of the Delaware river basin. Journal of the American Water Resources Association 41:1377–1391
Burton, G.A., D. Gunnison, and G.R. Lanza. 1987. Survival of pathogenic bacteria in various
freshwater sediments. Applied and Environmental Microbiology 53:633–638. Carlucci, A.F., and D. Pramer. 1960. An evaluation of factors affecting the survival of
Escherichia coli in seawater II: Salinity, pH, and nutrients. Applied and Environmental Microbiology 8: 247–250.
Carlucci, A.F., and D. Pramer. 1960. An evaluation of factors affecting the survival of
Escherichia coli in seawater IV: Bacteriophages. Applied and Environmental Microbiology 8: 254–256.
City of Seattle. 2007. State of the Waters 2007, Volume I: Seattle Watercourses. Prepared by
Seattle Public Utilities. Seattle, WA. Davies-Colley, R.J., R.G. Bel, and A.M. Donnison. 1994. Sunlight inactivation of Enterococci
and fecal coliforms in sewage effluent diluted in seawater. Applied and Environmental Microbiology 60: 2049–2058.
Dawson, W.A., and L.J. Tilley. 1972. Measurement of the Salt-Wedge Excursion Distance in
the Duwamish River Estuary, Seattle, Washington, by Means of the Dissolved-Oxygen Gradient. U.S. Department of Interior Geological Survey. Washington, DC.
Dick, L.K., E.A. Stelzer, E.E. Bertke, D.L. Fong, and D.M. Stoeckel. 2010. Relative decay of
Bacteroidales microbial source tracking markers and cultivated Escherichia coli in freshwater microcosms. Applied and Environmental Microbiology 76: 3255–3262.
Diggle, P.J., and P.J. Ribeiro. 2007. Model-Based Geostatistics. Springer Series in Statistics,
NY. Doyle, J., B. Tunnicliff, R. Kramer, R. Kuehl, and S. Brickler. 1992. Instability of fecal coliform
populations in waters and bottom sediments at recreational beaches in Arizona. Water Research 26: 979–988.
Enzinger, R.M., and R.C. Cooper. 1976. Role of bacteria and protozoa in the removal of
Escherichia coli from estuarine waters. Applied and Environmental Microbiology 31: 758–763.

Water Quality Assessment and Monitoring Study: Bacteria Sources/Pathways in CSO Receiving Waters
King County 8-3 October 2017
Ecology. 2015. Western Washington NPDES Phase I Stormwater PermitFinal S8.D Data Characterization 2009-2013. Washington State Department of Ecology. Olympia, WA.
EPA. 2012. Recreational Water Quality Criteria. U. S. Environmental Protection Agency
Office of Water, Washington, DC. Feachem, R.G., D.J. Bradley, H. Garelick, and D.D. Mara. 1983. Sanitation and Disease: Health
Aspects of Excreta and Wastewater Management. Chichester, U.K.: John Wiley & Sons.
Gameson, A.L.H., and D.J. Gould. 1975. Effects of solar radiation on the mortality of some
terrestrial bacteria in sea water. In Discharge of Sewage from Sea Outfalls, ed. A.L.H. Gameson. pp. 209–219. Pergamon Press, Oxford and New York.
Gerba, C. P., and J. S. McLeod. 1976. Effect of sediments on the survival of Escherichia coli in
marine waters. Applied Environmental Microbiology 32: 114–120. Green, H.C., O.C. Shanks, M. Sivaganesan, R.A. Haugland, and K.G. Field. 2011. Differential
decay of human faecal Bacteroides in marine and freshwater. Environmental Microbiology 13: 3325–3249.
Grimmond, C.S.B., and T.R. Oke. 1986. Urban water balance 2. Results from a suburb of
Vancouver, British Columbia. Water Resources Research 22:1404–1412 Harwood, V.J., C. Staley, B.D. Badgley, K. Borges, and A. Korajkic. 2014. Microbial source
tracking markers for detection of fecal contamination in environmental waters: relationships between pathogens and human health outcomes. FEMS Microbiology Review 38: 1–40.
Hathaway, J., W. Hunt, and O. Simmons. 2010. Statistical evaluation of factors affecting
indicator bacteria in urban storm-water runoff. Journal of Environmental Engineering 136: 1360–1368.
Jamieson, R.C., D.M. Joy, H. Lee, R. Kostaschuck, and R.J. Gordon. 2005. Resuspension of
sediment-associated Escherichia coli in a natural stream. Journal of Environmental Quality 34: 581–589.
King County. 1999. Combined Sewer Overflow Water Quality Assessment for the Duwamish
River and Elliott Bay. Prepared by the Duwamish River and Elliott Bay Water Quality Assessment Team: Parametrix and King County Wastewater Treatment Division and Water and Land Resources Division. Seattle, WA.
King County. 2003. Results of a human use survey for shoreline areas of Lake Union, Lake
Washington, and Lake Sammamish. Prepared by Parametrix. Seattle, WA

Water Quality Assessment and Monitoring Study: Bacteria Sources/Pathways in CSO Receiving Waters
King County 8-4 October 2017
King County. 2006. Green-Duwamish Watershed Water Quality Assessment: Microbial
Source Tracking Study Report. Prepared by Herrera Environmental Consultants. Water and Land Resources Division. Seattle, WA.
King County. 2007. Water Quality Statistical and Pollutant Loadings Analysis. Prepared by
Herrera Environmental Consultants. Water and Land Resources Division. Seattle, WA.
King County. 2009. Comprehensive Sediment Quality Summary Report for CSO Discharge
Locations. Wastewater Treatment Division. Seattle, WA. King County. 2014. CSO WQA/MS Bacteria Study Sampling and Analysis Plan. Water and
Land Resources Division. Seattle, WA. King County. 2017a. Water Quality Assessment and Monitoring Study: Analysis of Existing
Data on the Duwamish Estuary. Prepared by Chris Magan, Bob Bernhard, Tim Clark, Martin Grassley, Kate Macneale, and Dean Wilson. King County Wastewater Treatment Division. Seattle, WA.
King County. 2017b. Water Quality Assessment and Monitoring Study: Analysis of Existing
Data on Elliott Bay. Prepared by Wendy Eash-Loucks, Tim Clark, Chris Magan, and Dean Wilson. King County Wastewater Treatment Division. Seattle, WA.
King County. 2017c. Water Quality Assessment and Monitoring Study: Analysis of Existing
Data on Lake Union/Ship Canal, Draft. Prepared by Tim Clark, Wendy Eash-Loucks, and Dean Wilson. King County Wastewater Treatment Division. Seattle, WA.
Korhonen, L.K., and P.J. Martikainen. 1991. Comparison of the survival of Campylobacter
jejuni and Campylobacter coli in culturable form in surface water. Canadian Journal of Microbiology 37: 530–533.
Kreader, C.A. 1998. Persistence of PCR-detectable Bacteroides distasonis from human feces
in river water. Applied and Environmental Microbiology 64: 4103–4105. LaLiberte P., and D.J. Grimes. 1982. Survival of Escherichia coli in lake bottom sediment.
Applied Environmental Microbiology 43: 623–628. Lerner, D.N. 2002. Identifying and quantifying urban recharge: A review. Hydrogeology
Journal 10:143–152 McCambridge, J., and T.A. McMeekin. 1981. Effect of solar radiation and predacious
microorganisms on survival of fecal and other bacteria. Applied and Environmental Microbiology 41: 1083–1087.

Water Quality Assessment and Monitoring Study: Bacteria Sources/Pathways in CSO Receiving Waters
King County 8-5 October 2017
Noble, R.T., I.M. Lee, and K.C. Schiff. 2004. Inactivation of indicator micro-organisms from various sources of faecal contamination in seawater and freshwater. Journal of Applied Microbiology 96: 464–472.
Metro. 1987. University Regulator Combined Sewer Overflow Control Predesign Project:
Water Quality Impact Analysis. Prepared by James M. Montgomery, Consulting Engineers, Inc., and Entranco Engineers. Seattle, WA.
Okabe, S., N. Okayama, O. Savichtcheva, and T. Ito. 2007. Quantification of host-specific
Bacteroides-Prevotella 16S rRNA genetic markers for assessment of fecal pollution in freshwater. Applied Microbiology Biotechnology 74: 890–901.
Port of Seattle. 2015. “Seaport Statistics.” Retrieved January 4, 2015:
http://www.portseattle.org/About/Publications/Statistics/Seaport/Pages/default.aspx.
Ribeiro, P.J., and P.J. Diggle. 2001. geoR: a package for geostatistical analysis R-NEWS,
1(2):15–18. Rozen, Y., and S. Belkin. 2001. Survival of enteric bacteria in seawater. FEMS Microbiology
Reviews 25: 513–529. Santos, J.F., and J.D. Stoner. 1972. Physical, Chemical, and Biological Aspects of the
Duwamish River Estuary, King County, Washington, 1963-67. U.S. Geological Survey. Washington, DC.
Seurinck, S., T. Defoirdt, W. Verstraete, and S.D. Siciliano. 2005. Detection and
quantification of the human-specific HF183 Bacteroides 16S rRNA genetic marker with real-time PCR for assessment of human faecal pollution in freshwater. Environmental Microbiology 7: 249–259.
Sherer, B., R. Miner, J. Moore, and J. Buckhouse. 1992. Indicator bacterial survival in stream
sediments. Journal of Environmental Quality 21: 591–595. Sinton, L.W., C.H. Hall, P.A. Lynch, and R.J. Davies-Colley. 2002. Sunlight inactivation of fecal
indicator bacteria and bacteriophages from waste stabilization pond effluent in fresh and saline waters. Applied and Environmental Microbiology 68: 1122–1131.
Sinton, L.W., R.J. Davies-Colley, and R.G. Bell. 1994. Inactivation of enterococci and fecal
coliforms from sewage and meatworks effluents in seawater chambers. Applied and Environmental Microbiology 60: 2040–2048.
Sinton, L.W., R.K. Finlay, and P.A. Lynch. 1999. Sunlight inactivation of fecal bacteriophages
and bacteria in sewage-polluted seawater. Applied and Environmental Microbiology 65: 3605–3613.

Water Quality Assessment and Monitoring Study: Bacteria Sources/Pathways in CSO Receiving Waters
King County 8-6 October 2017
Solic, M., and N. Krstulovic. 1992. Separate and combined effects of solar radiation, temperature, salinity, and pH on the survival of faecal coliforms in seawater. Marine Pollution Bulletin 24: 411–416.
Stoner, J.D. 1972. Determination of Mass Balance and Entrainment in the Stratified
Duwamish River Estuary, King County, Washington. U.S. Geological Survey, Washington, DC.
Walters, S.P., and K. Field. 2009. Survival and persistence of human and ruminant-specific
faecal Bacteroidales in freshwater microcosms. Environmental Microbiology 11: 1410–1421.
Walters, S.P., K.M. Yamahara, and A.B. Boehm. 2009. Persistence of nucleic acid markers of
health-relevant organisms in seawater microcosms: implications for their use in assessing risk in recreational waters. Water Research 43: 4929–4939.
Weston. 1999. Site Inspection Report. Lower Duwamish River. RK 2.5-11.5. Volume 1-
Report and Appendices. Prepared byRoy F. Weston, Inc., for U.S. Environmental Protection Agency, Region 10. Seattle, WA.
Whitman, RL, MB Nevers, GC Korinek, and MN Byappanahalli. 2004. Solar and temporal
effects on Escherichia coli concentration at a Lake Michigan swimming beach. Applied and Environmental Microbiology 70: 4276–4285.
Williams, W.D. 1986. Conductivity and salinity of Australian salt lakes. Journal of Marine
and Freshwater Research 32: 177–182.

Water Quality Assessment and Monitoring Study: Bacteria Sources/Pathways in CSO Receiving Waters
King County A-1 October 2017
APPENDIX A: SAMPLING LOCATIONS

Water Quality Assessment and Monitoring Study: Bacteria Sources/Pathways in CSO Receiving Waters
King County A-2 October 2017
Table A-1. Location of Lake Union/Ship Canal Sampling Stations
Site Name X-Value Y-Value
Site Name X-Value Y-Value
Site Name X-Value Y-Value
0512 1255339 246408 BSLU045 1266487 240002 BSLU089 1274418 240876 BSLU002 1255697 246678 BSLU046 1266915 239724 BSLU090 1274672 240433 BSLU003 1255717 246256 BSLU047 1267274 239366 BSLU091 1274910 239999 BSLU004 1256203 246098 BSLU048 1267637 239271 BSLU092 1275229 239605 BSLU005 1256182 246631 BSLU049 1267951 239003 BSLU093 1275434 239123 BSLU006 1256656 246574 BSLU050 1268319 238756 BSLU094 1275239 238874 BSLU007 1256733 246096 BSLU051 1268627 238380 BSLU095 1275674 238642 BSLU008 1256907 246775 BSLU052 1268757 237861 BSLU096 1275631 238269 BSLU009 1257217 246600 BSLU053 1268949 237379 BSLU097 1275520 238047 BSLU010 1257199 245859 BSLU054 1269158 236916 BSLU098 1275967 237815 BSLU011 1257618 246198 BSLU055 1269339 236434 BSLU099 1276669 238396 BSLU012 1258063 245906 BSLU056 1269347 235971 BSLU100 1276177 238348 BSLU013 1257629 245587 BSLU057 1269340 235463 BSLU101 1275894 238757 BSLU014 1258059 245328 BSLU058 1269326 234948 BSLU102 1275942 239172 BSLU015 1258378 245616 BSLU059 1269312 234426 BSLU103 1276040 239397 BSLU016 1258729 245279 A522 1269458 234484 BSLU104 1276576 239644 BSLU017 1258503 245054 BSLU061 1269298 233869 BSLU105 1277090 239625 BSLU018 1258967 244774 BSLU062 1269333 233361 0540 1277624 239584 BSLU019 1259136 244981 BSLU063 1269291 232811 BSLU107 1278119 239563 BSLU020 1259569 244794 BSLU064 1269539 232811 BSLU108 1278628 239525 BSLU021 1259390 244470 BSLU065 1270051 232857 BSLU109 1276222 239906 BSLU022 1259317 243958 BSLU066 1270329 233013 BSLU110 1276035 240169 BSLU023 1259898 244096 BSLU067 1270615 233245 BSLU111 1275565 240467 BSLU024 1260029 244715 BSLU068 1270987 233649 BSLU112 1275201 240854 BSLU025 1260565 244506 BSLU069 1271650 234018 BSLU113 1274824 241221 BSLU026 1260330 244200 BSLU070 1271348 234191 BSLU114 1274315 241609 BSLU027 1260632 243835 BSLU071 1271222 234738 BSLU115 1273833 241872 BSLU028 1261021 244470 BSLU072 1271215 235267 BSLU116 1273257 241905 BSLU029 1261484 244271 BSLU073 1271208 235782 BSLU117 1272788 241709 BSLU030 1261205 243931 BSLU074 1271125 236297 BSLU118 1272281 241497 BSLU031 1261650 243687 BSLU075 1271104 236798 BSLU119 1271965 241100 BSLU032 1261766 243907 BSLU076 1271111 237320 BSLU120 1271729 240617 BSLU033 1262115 243418 BSLU077 1271265 237808 BSLU121 1271546 240120 BSLU034 1262493 243093 BSLU078 1271411 238319 BSLU122 1271261 239702 BSLU035 1262392 242856 BSLU079 1271641 238765 BSLU123 1271106 239231 BSLU036 1262839 242722 BSLU080 1271849 239237 BSLU124 1270841 238771 BSLU037 1263238 242420 BSLU081 1272093 239690 BSLU125 1270553 238458 BSLU038 1263630 242087 BSLU082 1272298 240150 BSLU126 1270082 238416 BSLU039 1264043 241801 BSLU083 1272559 240607 BSLU127 1269658 238588 BSLU040 1264426 241485 BSLU084 1272823 241053 BSLU128 1269328 238969 BSLU041 1264833 241184 BSLU085 1273048 241298 BSLU129 1268819 239242 BSLU042 1265246 240878 BSLU086 1273353 241676 BSLU130 1268281 239540 BSLU043 1265664 240588 BSLU087 1273768 241634 BSLU131 1267783 239619 BSLU044 1266079 240298 BSLU088 1274160 241368 BSLU132 1267402 239862

Water Quality Assessment and Monitoring Study: Bacteria Sources/Pathways in CSO Receiving Waters
King County A-3 October 2017
Table A-2. Location of Duwamish Estuary Sampling Stations.
Site Name X-Value Y-Value
Site Name X-Value Y-Value
Site Name X-Value Y-Value
BSDW001 1267272 219370 BSDW038 1263975 214764 BSDW075 1269136 201974 BSDW002 1267773 219369 BSDW039 1263461 214780 BSDW076 1269432 201608 BSDW003 1267767 218869 BSDW040 1263438 214280 BSDW077 1269795 201302 BSDW004 1267266 218879 BSDW041 1263937 214257 BSDW078 1270131 200932 BSDW005 1267259 218378 BSDW042 1263920 213758 BSDW079 1270463 200554 BSDW006 1267761 218371 BSDW043 1263410 213781 BSDW080 1270809 200211 BSDW007 1267759 217871 BSDW044 1263373 213282 BSDW081 1271157 199865 BSDW008 1267257 217878 BSDW045 1263906 213258 BSDW082 1271533 199524 BSDW009 1267256 217378 BSDW046 1264353 212996 BSDW083 1271879 199163 BSDW010 1267759 217371 BSDW047 1264684 212610 BSDW084 1272220 198799 BSDW011 1267759 216871 BSDW048 1265028 212237 BSDW085 1272595 198488 BSDW012 1267251 216878 BSDW049 1265335 211852 BSDW086 1272930 198116 BSDW013 1267250 216376 BSDW050 1265687 211497 BSDW087 1273323 197782 BSDW014 1267751 216371 LTKE03 1265871 211418 BSDW088 1273694 197441 BSDW015 1267752 215871 BSDW052 1266012 211111 BSDW089 1274066 197102 BSDW016 1267248 215876 BSDW053 1266962 211082 BSDW090 1274447 196777 BSDW017 1267241 215381 BSDW054 1266868 210600 LTUM03 1274591 196629 BSDW018 1267743 215372 BSDW055 1266188 210608 BSDW092 1274829 196476 BSDW019 1267744 214872 BSDW056 1266339 210085 BSDW093 1275185 196128 BSDW020 1267234 214876 BSDW057 1266844 210100 BSDW094 1275543 195778 BSDW021 1267224 214376 BSDW058 1266859 209655 BSDW095 1275786 195396 BSDW022 1267734 214372 BSDW059 1266506 209589 BSDW096 1275894 194928 BSDW023 1267715 213867 BSDW060 1266833 209135 BSDW097 1276025 194443 HNFD01 1267486 214139 BSDW061 1266985 208614 BSDW098 1276153 193960 BSDW025 1267215 213876 BSDW062 1267107 208161 BSDW099 1276297 193479 BSDW026 1267206 213376 BSDW063 1267246 207680 BSDW100 1276425 192996 BSDW027 1267706 213367 BSDW064 1267425 207213 BSDW101 1276528 192513 BSDW028 1267425 212872 BSDW065 1267595 206740 BSDW102 1276689 192024 BSDW029 1267244 212350 BSDW066 1267695 206261 BSDW103 1276731 191540 BSDW030 1264008 216776 BSDW067 1267957 205768 BSDW104 1276862 191057 BSDW031 1263491 216788 BSDW068 1268013 205307 BSDW105 1276796 190671 BSDW032 1263496 216281 BSDW069 1268195 204854 BSDW106 1277114 190592 BSDW033 1263996 216276 BSDW070 1268340 204362 BSDW107 1277203 190249 BSDW034 1263983 215776 BSDW071 1268480 203882 BSDW108 1277636 190354 BSDW035 1263485 215779 BSDW072 1268646 203411 LTXQ01 1278053 190313 BSDW036 1263484 215279 BSDW073 1268809 202934
BSDW037 1263998 215276 BSDW074 1268975 202458

Water Quality Assessment and Monitoring Study: Bacteria Sources/Pathways in CSO Receiving Waters
King County A-4 October 2017
Table A-3. Location of Elliott Bay Sampling Stations.
Site Name X-Value Y-Value
Site Name X-Value Y-Value
Site Name X-Value Y-Value
BSEB001 1253859 234455 BSEB049 1264911 227811 BSDW006 1267761 218371 BSEB002 1253733 234239 BSEB050 1264726 227641 BSEB092 1267069 219493 BSEB003 1254208 234010 BSEB051 1265246 227185 BSEB093 1266593 219282 BSEB004 1254310 234238 BSEB052 1265398 227384 BSEB094 1266713 219062 BSEB005 1254787 234028 BSEB053 1265925 226972 BSEB095 1266265 218825 BSEB006 1254388 233799 BSEB054 1265774 226773 BSEB096 1266134 219028 BSEB007 1254541 233492 BSEB055 1266096 226413 BSEB097 1265706 218805 BSEB008 1254791 233514 BSEB056 1266257 226593 BSEB098 1265797 218568 BSEB009 1254833 233009 BSEB057 1266600 226223 BSEB099 1265192 218605 BSEB010 1254586 232994 BSEB058 1266439 226033 BSEB100 1265198 218855 BSEB011 1255089 232512 BSEB059 1265762 225293 BSEB101 1264700 218861 BSEB012 1255237 232713 LTED04 1264675 223909 BSEB102 1264696 218611 BSEB013 1256226 232571 BSEB061 1266821 225710 BSEB103 1264196 218618 BSEB014 1256192 232324 BSEB062 1266982 225900 BSEB104 1264198 218868 BSEB015 1257379 232393 BSEB063 1267369 225584 BSEB105 1264229 219870 BSEB016 1257214 232581 BSEB064 1267211 225390 BSEB106 1264227 221863 BSEB017 1257512 232918 BSEB065 1267521 225007 BSEB107 1263664 218875 BSEB018 1257524 233425 BSEB066 1267713 225163 BSEB108 1263871 218343 BSEB019 1257525 233925 BSEB067 1268040 224753 BSEB109 1263621 218344 BSEB020 1257912 234097 BSEB068 1267819 224637 BSEB110 1263659 217800 BSEB021 1257893 233592 BSEB069 1268057 224187 BSEB111 1263905 217844 BSEB022 1257890 233092 BSEB070 1268274 224311 BSEB112 1263913 217326 BSEB023 1257875 232594 BSEB071 1268540 223825 BSEB113 1263663 217318 BSEB024 1257867 232085 BSEB072 1268310 223765 BSDW030 1264008 216776 BSEB025 1257867 231835 BSEB073 1268326 223319 BSDW031 1263491 216788 BSEB026 1258367 231835 BSEB074 1268575 223341 BSDW032 1263496 216281 BSEB027 1258367 232085 BSEB075 1267320 223263 BSDW033 1263996 216276 BSEB028 1258867 232085 BSEB076 1265319 223265 BSEB114 1263125 217165 BSEB029 1258867 231835 BSEB077 1268298 222761 BSEB115 1263132 217415 BSEB030 1259367 231879 BSEB078 1268553 222754 BSEB116 1262632 217429 BSEB031 1259364 232157 BSEB079 1268478 222232 BSEB117 1262625 217179 BSEB032 1259223 232745 BSEB080 1268224 222254 BSEB118 1262132 217437 BSEB033 1259911 232079 BSEB081 1268095 221771 BSEB119 1262104 217691 BSEB034 1259502 232737 BSEB082 1268335 221709 BSEB120 1261636 218686 BSEB035 1259868 231833 BSEB083 1268211 221225 BSEB121 1261636 220674 BSEB036 1260278 231730 BSEB084 1267970 221290 BSEB122 1261717 221435 BSEB037 1260394 231951 BSEB085 1267839 220807 BSEB123 1261629 217686 BSEB038 1263323 229287 BSEB086 1268081 220742 BSEB124 1261632 217434 BSEB039 1263137 229120 BSEB087 1267937 220263 BSEB125 1261176 217042 LTBC43 1263430 228985 BSEB088 1267699 220334 BSEB126 1261108 217281 BSEB041 1263483 228735 BSEB089 1266815 220535 BSEB127 1260369 217818 BSEB042 1263657 228915 BSEB090 1267553 219856 BSEB128 1260188 217646 BSEB043 1264017 228567 BSEB091 1267801 219799 BSEB129 1259483 218361 BSEB044 1263843 228388 BSDW001 1267272 219370 BSEB130 1259662 218536 BSEB045 1263154 227663 BSDW002 1267773 219369 BSEB131 1261079 221355 BSEB046 1261745 226224 BSDW003 1267767 218869 BSEB132 1259683 219979 BSEB047 1264257 228075 BSDW004 1267266 218879 BSEB133 1259014 219236 BSEB048 1264417 228271 BSDW005 1267259 218378 BSEB134 1258786 219078
Water Quality Assessment and Monitoring Study: Bacteria Sources/Pathways in CSO Receiving Waters
King County B-1 October 2017
APPENDIX B: KRIGING METHODS AND HOT SPOT ANAYSIS

Water Quality Assessment and Monitoring Study: Bacteria Sources/Pathways in CSO Receiving Waters
King County B-2 October 2017
Kriging Interpolation Analysis Methods The “krige .conv” script in the R package, “geoR”, was applied to each sampling event for Elliott Bay, Duwamish Estuary, and Lake Union/Ship Canal. The square root of the data was used to provide a more normal distribution and decrease the large numerical variation between sites. The inputs for the kriging model were selected through the process provided below.
1. “Ordinary” Kriging was used because it assumes the constant mean is unknown, whereas “Simple” Kriging assumes a known constant mean and “Universal” Kriging assumes there is a deterministic function; both of these latter assumptions are not possible given the volatile conditions inherent to bacteria concentrations within the study environments.
2. The “Spherical” semivariogram method for the Kriging model was selected because it provides an adequate representation of the spatial autocorrelation between sites in that the variation between sites increases with distance until a threshold distance where the variation remains constant (i.e., where sites no longer influence one another). The “eyefit” tool in the “geoR” package allows the manual adjustment of the semivariogram best-fit model parameter and was used to estimate the initial parameters. Based on the output from the “eyefit” tool in “geoR”, 5,000 feet was employed as a maximum threshold distance for Lake Union/Ship Canal and Elliott Bay study areas and 10,000 feet was used for the Duwamish study area.
3. To determine if anisotropy (i.e., directional dependence) exists in the system, directional semivariograms were examined using the “variog4” script. If a dominant directional influence on variation was observed, adjustments for anisotropy were included in the final model.
4. The “variofit” script was used to determine the model parameters for creating a best fit line for the semivariogram. Initial parameter estimates were provided based on the output from the “eyefit” tool. Cressie’s (1985) approximation for weighted least squares was used to improve the model by giving more weight to early lags (i.e. closer bins) and less weight to bins with a low number of pairs.
5. The model created with variofit was input into the “krige.conv” script, which was
used to create the spatial predictions for bacteria distribution; these values were back-corrected by squaring. Anisotropy impacts were included in this model, if applicable.
6. The output of the krige.conv was used to create a raster with 50-ft by 50-ft cells. In
ArcMap 10.1, this raster was converted to polygons and then clipped to the waterbody outline.
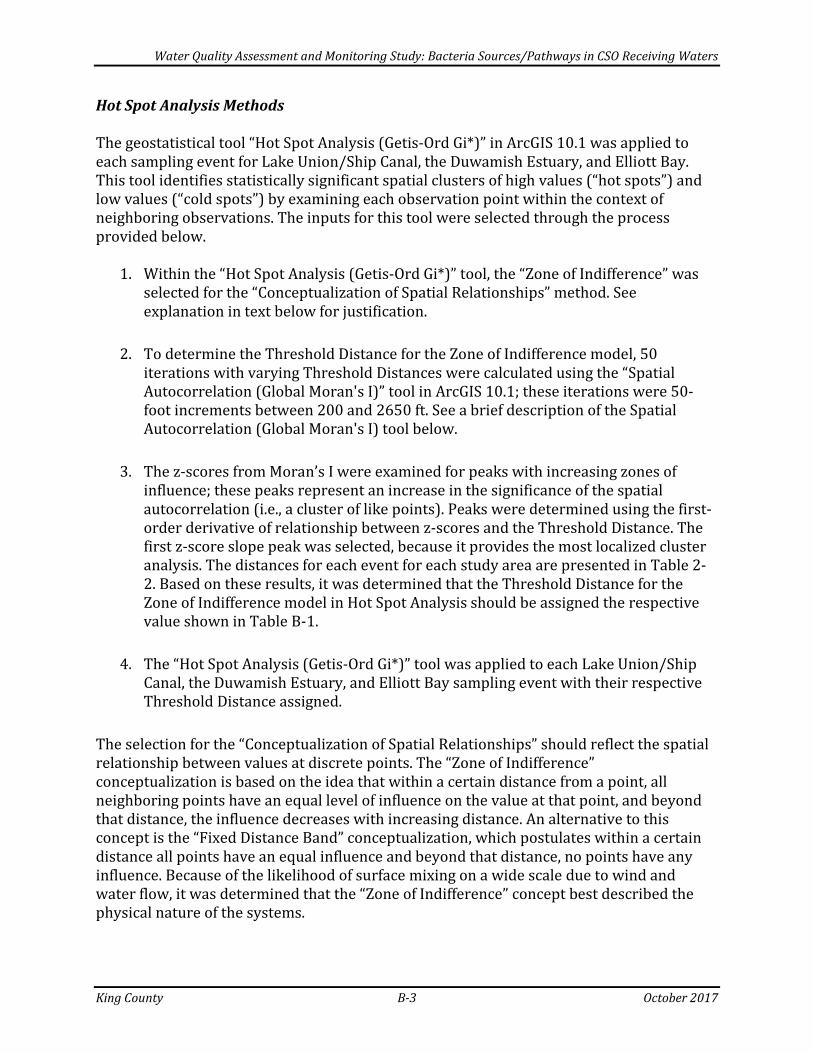
Water Quality Assessment and Monitoring Study: Bacteria Sources/Pathways in CSO Receiving Waters
King County B-3 October 2017
Hot Spot Analysis Methods The geostatistical tool “Hot Spot Analysis (Getis-Ord Gi*)” in ArcGIS 10.1 was applied to each sampling event for Lake Union/Ship Canal, the Duwamish Estuary, and Elliott Bay. This tool identifies statistically significant spatial clusters of high values (“hot spots”) and low values (“cold spots”) by examining each observation point within the context of neighboring observations. The inputs for this tool were selected through the process provided below.
1. Within the “Hot Spot Analysis (Getis-Ord Gi*)” tool, the “Zone of Indifference” was selected for the “Conceptualization of Spatial Relationships” method. See explanation in text below for justification.
2. To determine the Threshold Distance for the Zone of Indifference model, 50 iterations with varying Threshold Distances were calculated using the “Spatial Autocorrelation (Global Moran's I)” tool in ArcGIS 10.1; these iterations were 50-foot increments between 200 and 2650 ft. See a brief description of the Spatial Autocorrelation (Global Moran's I) tool below.
3. The z-scores from Moran’s I were examined for peaks with increasing zones of
influence; these peaks represent an increase in the significance of the spatial autocorrelation (i.e., a cluster of like points). Peaks were determined using the first-order derivative of relationship between z-scores and the Threshold Distance. The first z-score slope peak was selected, because it provides the most localized cluster analysis. The distances for each event for each study area are presented in Table 2-2. Based on these results, it was determined that the Threshold Distance for the Zone of Indifference model in Hot Spot Analysis should be assigned the respective value shown in Table B-1.
4. The “Hot Spot Analysis (Getis-Ord Gi*)” tool was applied to each Lake Union/Ship
Canal, the Duwamish Estuary, and Elliott Bay sampling event with their respective Threshold Distance assigned.
The selection for the “Conceptualization of Spatial Relationships” should reflect the spatial relationship between values at discrete points. The “Zone of Indifference” conceptualization is based on the idea that within a certain distance from a point, all neighboring points have an equal level of influence on the value at that point, and beyond that distance, the influence decreases with increasing distance. An alternative to this concept is the “Fixed Distance Band” conceptualization, which postulates within a certain distance all points have an equal influence and beyond that distance, no points have any influence. Because of the likelihood of surface mixing on a wide scale due to wind and water flow, it was determined that the “Zone of Indifference” concept best described the physical nature of the systems.

Water Quality Assessment and Monitoring Study: Bacteria Sources/Pathways in CSO Receiving Waters
King County B-4 October 2017
The “Spatial Autocorrelation (Global Moran's I)” tool measures spatial autocorrelation based on both feature locations and feature values simultaneously. Given a set of features and an associated attribute, it evaluates whether the pattern expressed is clustered, dispersed, or random. The tool calculates the Moran's I Index value and both a z-score and a p-value to evaluate the significance of that Index. The interpretation of the resulting p-values is detailed below:
p-value Significant Difference from Mean Concentration
>0.10 No significant difference 0.05-0.10 Slight significant difference 0.01-0.05 Significant difference <0.01 Strong significant difference
Table B-1. z-score peak distance for each study area sampling event.
Study Area Event z-score peak distance (ft)
Lake Union/ Ship Canal
Dry 1 550 Dry 2 600 Dry 3 550 Wet 1 950 Wet 2 550 Wet 3 550
Duwamish Waterway
Dry 1 550 Dry 2 500 Dry 3 550 Wet 1 500 Wet 2 500 Wet 3 500
Elliott Bay
Dry 1 500 Dry 2 500 Dry 3 500 Wet 1 550 Wet 2 500 Wet 3 550

Water Quality Assessment and Monitoring Study: Bacteria Sources/Pathways in CSO Receiving Waters
King County B-5 October 2017
Lake Union/Ship Canal Dry Weather Hot spot analysis of the first dry-weather sampling event determined that Salmon Bay E. coli concentrations were significantly greater relative to the whole system and that Portage Bay concentrations were significantly lower (Figure B-1). Slightly significant hot spots were also observed in south Lake Union just east of the Center for Wood Boats and along Lake Union’s eastern shore just west of Lynn Street Park. For the second dry-weather event, statistically significant hot spot were found along Lake Union’s western shore just east of 1600-1700 Westlake Ave N blocks and in south Portage Bay near the Montlake Playfield and Seattle and Queen City Yacht Clubs and under the 520 bridge (Figure B-2). No hot spots were found in Salmon Bay. For the third dry-weather event, statistically significant hot spots were found along Lake Union’s northeastern shore west of Fairview Park and in Salmon Bay near the Locks and Fisherman’s Terminal (Figure B-3). A slightly significant hot spot was also observed in south Lake Union just east of the Center for Wood Boats. Wet Weather For the first wet-weather event, statistically significant hot spots were observed in western Salmon Bay alone, especially along the northern shore (Figure B-4). For the second wet-weather event, statistically significant hot spots were observed in eastern Salmon Bay and Lake Union near the Dexter Ave CSO and near the 1300 block of Fairview Ave; significant cold spots were detected in the NE arm of Lake Union, except near and north of Fairview Park, in N Portage Bay and the Montlake Cut (Figure B-5). For the third wet-weather event, statistically significant hot spots were observed in western Salmon Bay, the Fremont Cut, and the northwestern shore of Lake Union (Figure B-6). Significant cold spots were detected in Portage Bay.

Water Quality Assessment and Monitoring Study: Bacteria Sources/Pathways in CSO Receiving Waters
King County B-6 October 2017
Figure B-1. Hot spot analysis showing differences relative to the event mean for dry sampling event #1 – 1/23/14.

Water Quality Assessment and Monitoring Study: Bacteria Sources/Pathways in CSO Receiving Waters
King County B-7 October 2017
Figure B-2. Hot spot analysis showing differences relative to the event mean for dry sampling event #2 – 7/16/14.

Water Quality Assessment and Monitoring Study: Bacteria Sources/Pathways in CSO Receiving Waters
King County B-8 October 2017
Figure B-3. Hot spot analysis showing differences relative to the event mean for dry sampling event #3 – 9/10/14.

Water Quality Assessment and Monitoring Study: Bacteria Sources/Pathways in CSO Receiving Waters
King County B-9 October 2017
Figure B-4. Hot spot analysis showing differences relative to the event mean for wet sampling event #1 – 1/29/14.

Water Quality Assessment and Monitoring Study: Bacteria Sources/Pathways in CSO Receiving Waters
King County B-10 October 2017
Figure B-5. Hot spot analysis showing differences relative to the event mean for wet sampling event #2 – 2/18/14.

Water Quality Assessment and Monitoring Study: Bacteria Sources/Pathways in CSO Receiving Waters
King County B-11 October 2017
Figure B-6. Hot spot analysis showing differences relative to the event mean for wet sampling event #3 – 3/17/14.

Water Quality Assessment and Monitoring Study: Bacteria Sources/Pathways in CSO Receiving Waters
King County B-12 October 2017
Duwamish Estuary Dry Weather For the first dry-weather event, Hot spot analysis determined that mid-East Waterway had significantly higher concentrations than the rest of the waterbody (Figure B-7). The elevated concentrations were confined to a small, local area in the East Waterway. Again for the second dry-weather event, hot spot analysis determined that mid-East Waterway had significantly higher concentrations than the rest of the waterbody (Figure B-8). The elevated concentrations were confined to a small, local area in the East Waterway. For the third dry-weather event, hot spot analysis determined that the southern reach of the Lower Duwamish Waterway, starting at just northwest of the 16th Ave Bridge and moving upstream, had significantly higher concentrations (greater than 30 CFU/100 mL) than the rest of the waterbody (Figure B-9). Wet Weather For the first wet-weather event, statistically significant hot spots were detected in the East Waterway near the Lander and Hanford #2 CSO outfalls (Figure B-10). No other hot spots or cold spots were detected. For the second wet-weather event, statistically significant hot spots were detected in the East Waterway near the Lander and Hanford #2 CSO outfalls (Figure B-11). No other hot spots or cold spots were detected. For the third wet-weather event, statistically significant hot spots were detected in the southwest corner of the West Waterway and in the upper Lower Duwamish Waterway, especially near Slip 6 (Figure B-12).
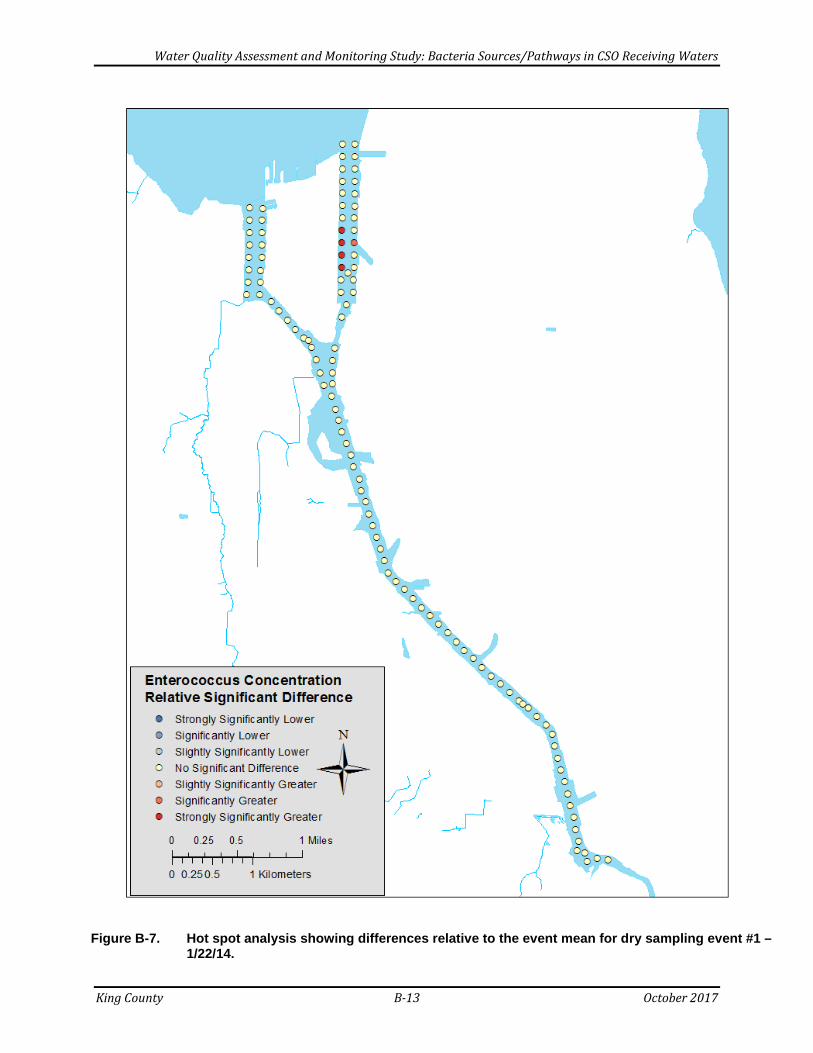
Water Quality Assessment and Monitoring Study: Bacteria Sources/Pathways in CSO Receiving Waters
King County B-13 October 2017
Figure B-7. Hot spot analysis showing differences relative to the event mean for dry sampling event #1 – 1/22/14.

Water Quality Assessment and Monitoring Study: Bacteria Sources/Pathways in CSO Receiving Waters
King County B-14 October 2017
Figure B-8. Hot spot analysis showing differences relative to the event mean for dry sampling event #2 – 7/1/14.

Water Quality Assessment and Monitoring Study: Bacteria Sources/Pathways in CSO Receiving Waters
King County B-15 October 2017
Figure B-9. Hot spot analysis showing differences relative to the event mean for dry sampling event #3 – 8/28/14.

Water Quality Assessment and Monitoring Study: Bacteria Sources/Pathways in CSO Receiving Waters
King County B-16 October 2017
Figure B-10. Hot spot analysis showing differences relative to the event mean for wet sampling event #1 – 2/12/14.

Water Quality Assessment and Monitoring Study: Bacteria Sources/Pathways in CSO Receiving Waters
King County B-17 October 2017
Figure B-11. Hot spot analysis showing differences relative to the event mean for wet sampling event #2 – 3/3/14.
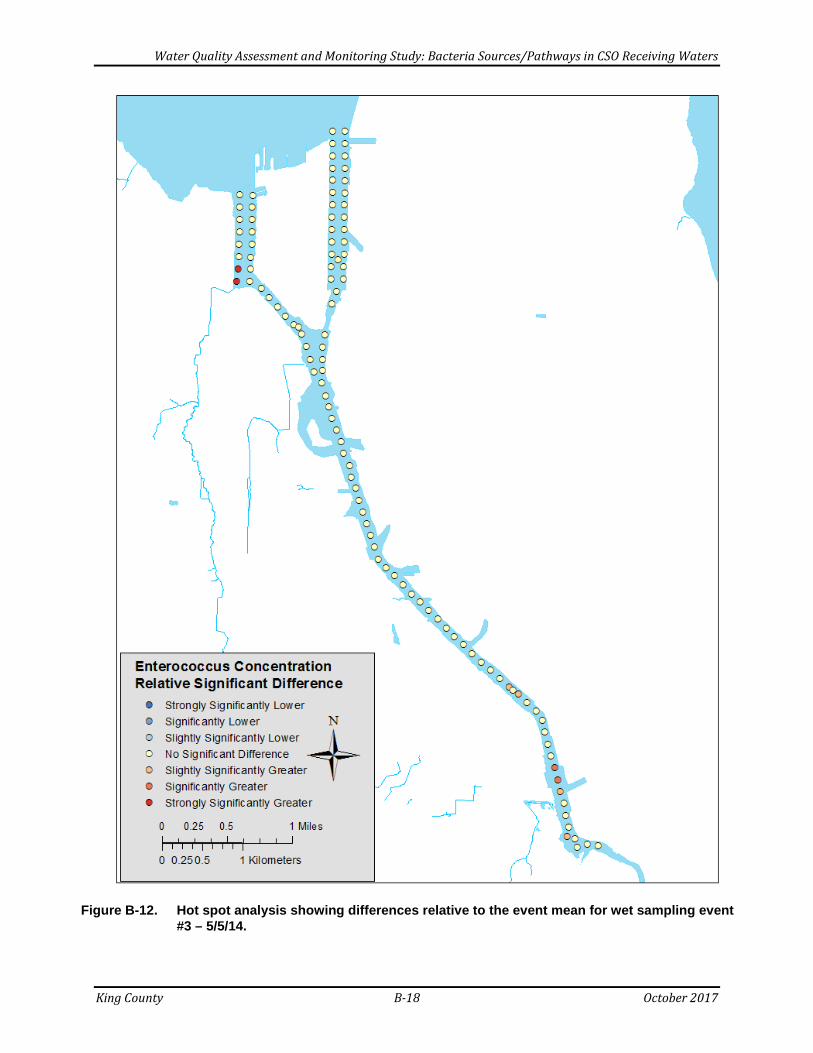
Water Quality Assessment and Monitoring Study: Bacteria Sources/Pathways in CSO Receiving Waters
King County B-18 October 2017
Figure B-12. Hot spot analysis showing differences relative to the event mean for wet sampling event #3 – 5/5/14.

Water Quality Assessment and Monitoring Study: Bacteria Sources/Pathways in CSO Receiving Waters
King County B-19 October 2017
Elliott Bay Dry Weather Hot spot analysis of the first dry-weather sampling event determined that only the two sites in NE Elliott Bay where bird feces were found were significantly greater relative to the entire waterbody (Figure B-13). Hot spot analysis of the second dry-weather sampling event determined that values near Pier 56, at the mouth of the West Waterway, in SW Elliott Bay, and near the Edgewater Hotel in NE Elliott Bay were significantly greater relative to the entire waterbody (Figure B-14). All values except those near Pier 56 were below 10 CFU/100 mL. For the third dry-weather event, hot spot analysis determined that sites near Pier 56, west of Alaskan Way and Seneca St. had significantly greater bacteria concentrations (Figure B-15). Wet Weather For the first wet-weather event, statistically significant hot spots were detected west of Pier 46, west of the Seattle Ferry Terminal (Colman Dock, Pier 52), and NE of the mouth of the West Waterway (Figure B-16). Statistically significant hot spots during the second wet-weather event were detected along the eastern shore of the East Waterway to NW of Pier 46. Enterococcus concentrations in this region exceeded 1000 CFU/100 mL. For the third wet-weather event, statistically significant hot spots were detected at the mouth of the East Waterway to NW of Pier 46. Enterococcus concentrations in this region exceeded 1000 CFU/100 mL. Hot spots were also detected at the mouth of the West Waterway (500 to 1300 CFU/100 mL). Statistically significant cold spots were detected in NW Elliott Bay near the Magnolia CSO outfall, where concentrations were below 40 CFU/100 mL.

Water Quality Assessment and Monitoring Study: Bacteria Sources/Pathways in CSO Receiving Waters
King County B-20 October 2017
Figure B-13. Hot spot analysis showing differences relative to the event mean for dry sampling event #1 – 1/23/14.

Water Quality Assessment and Monitoring Study: Bacteria Sources/Pathways in CSO Receiving Waters
King County B-21 October 2017
Figure B-14. Hot spot analysis showing differences relative to the event mean for dry sampling event #2 – 6/30/14.
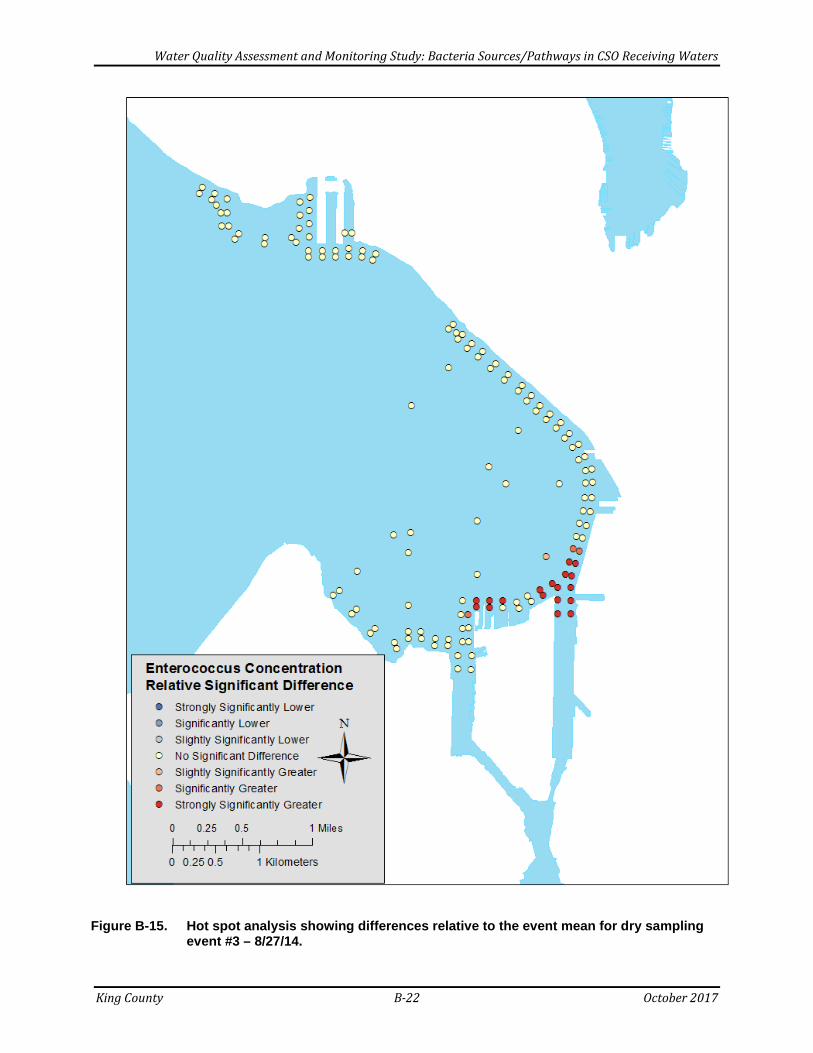
Water Quality Assessment and Monitoring Study: Bacteria Sources/Pathways in CSO Receiving Waters
King County B-22 October 2017
Figure B-15. Hot spot analysis showing differences relative to the event mean for dry sampling event #3 – 8/27/14.
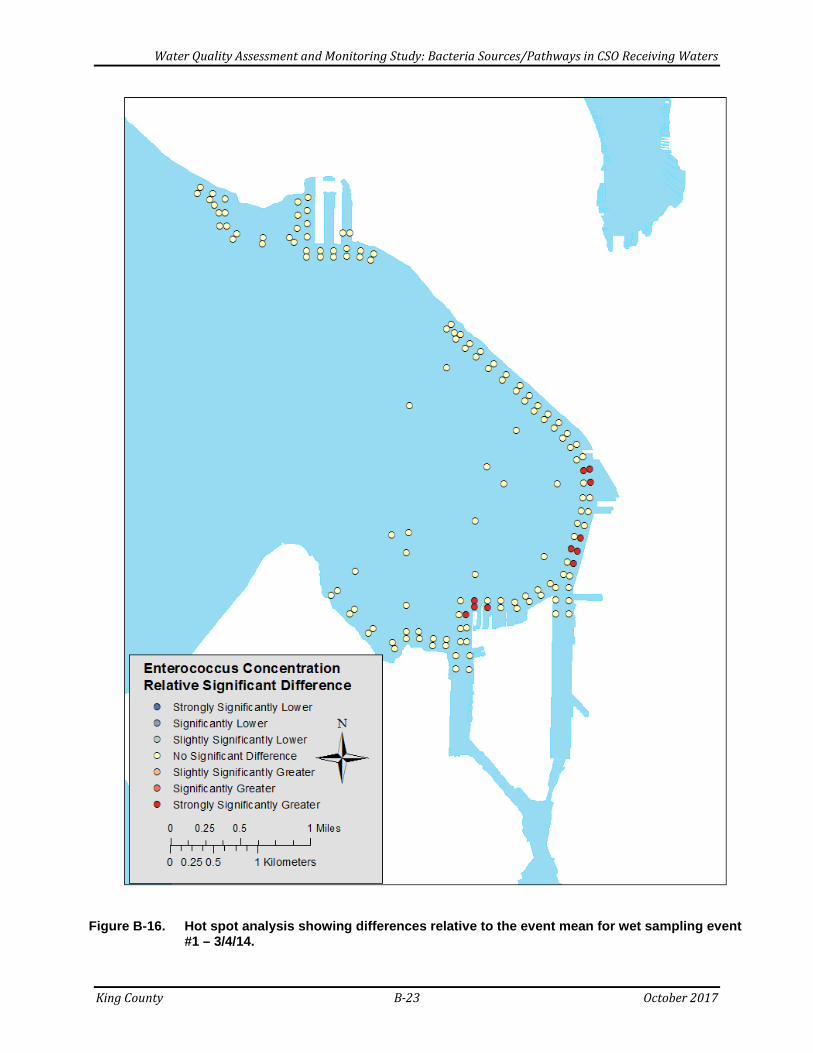
Water Quality Assessment and Monitoring Study: Bacteria Sources/Pathways in CSO Receiving Waters
King County B-23 October 2017
Figure B-16. Hot spot analysis showing differences relative to the event mean for wet sampling event #1 – 3/4/14.
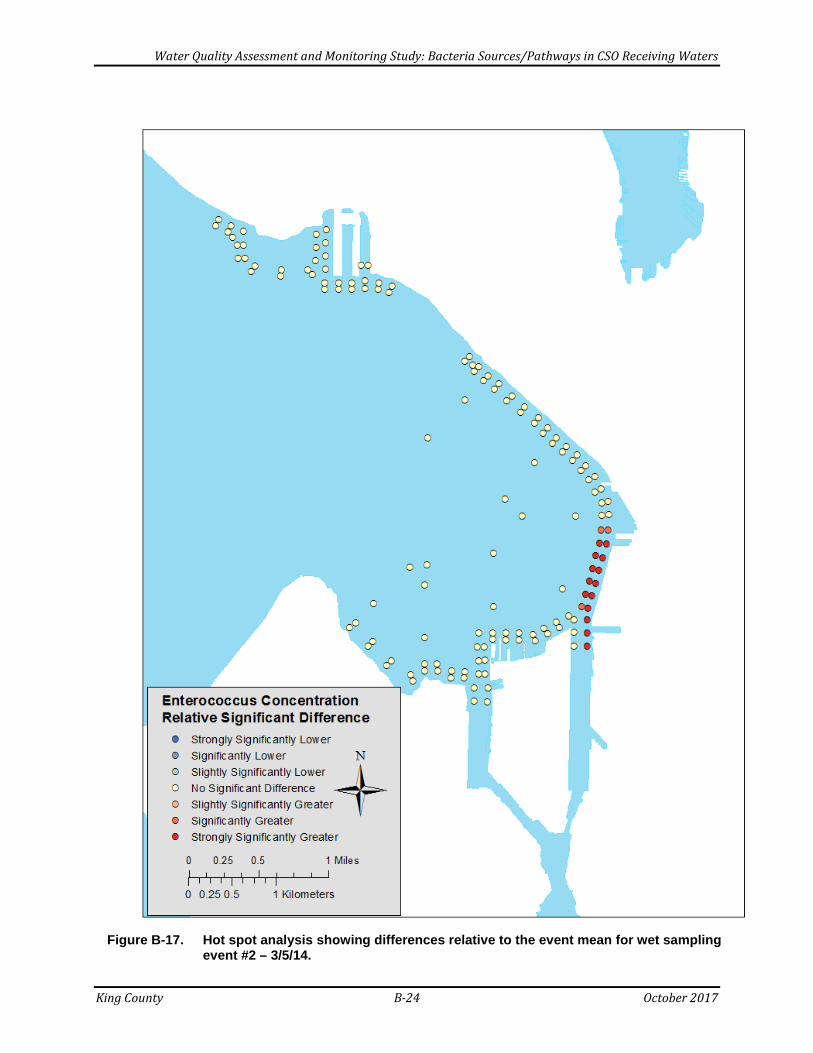
Water Quality Assessment and Monitoring Study: Bacteria Sources/Pathways in CSO Receiving Waters
King County B-24 October 2017
Figure B-17. Hot spot analysis showing differences relative to the event mean for wet sampling event #2 – 3/5/14.

Water Quality Assessment and Monitoring Study: Bacteria Sources/Pathways in CSO Receiving Waters
King County B-25 October 2017
Figure B-18. Hot spot analysis showing differences relative to the event mean for wet sampling event #3 – 10/14/14.

Water Quality Assessment and Monitoring Study: Bacteria Sources/Pathways in CSO Receiving Waters
King County B-26 October 2017

Water Quality Assessment and Monitoring Study: Bacteria Sources/Pathways in CSO Receiving Waters
King County C-1 October 2017
APPENDIX C: CONDUCTIVITY AND SALINITY MAPS
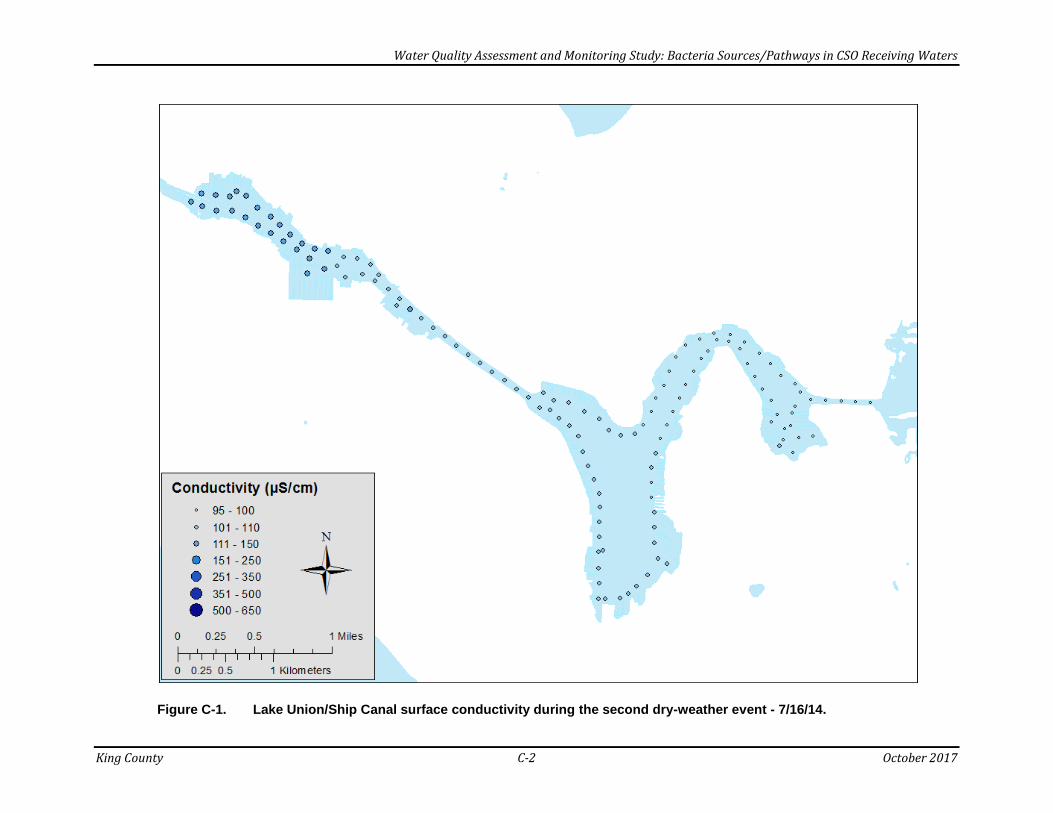
Water Quality Assessment and Monitoring Study: Bacteria Sources/Pathways in CSO Receiving Waters
King County C-2 October 2017
Figure C-1. Lake Union/Ship Canal surface conductivity during the second dry-weather event - 7/16/14.

Water Quality Assessment and Monitoring Study: Bacteria Sources/Pathways in CSO Receiving Waters
King County C-3 October 2017
Figure C-2. Lake Union/Ship Canal surface conductivity during the third dry-weather event - 9/10/14.
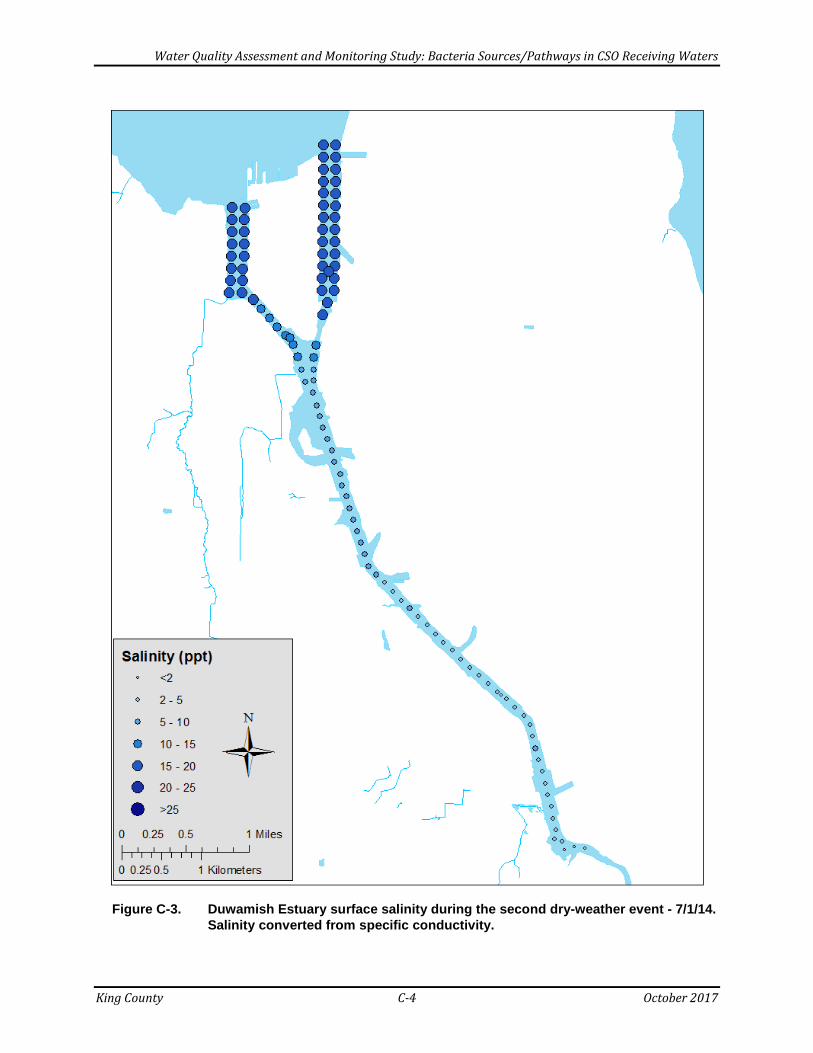
Water Quality Assessment and Monitoring Study: Bacteria Sources/Pathways in CSO Receiving Waters
King County C-4 October 2017
Figure C-3. Duwamish Estuary surface salinity during the second dry-weather event - 7/1/14.
Salinity converted from specific conductivity.

Water Quality Assessment and Monitoring Study: Bacteria Sources/Pathways in CSO Receiving Waters
King County C-5 October 2017
Figure C-4. Duwamish Estuary surface salinity during the third dry-weather event - 8/28/14. Salinity converted from specific conductivity.

Water Quality Assessment and Monitoring Study: Bacteria Sources/Pathways in CSO Receiving Waters
King County C-6 October 2017
Figure C-5. Elliott Bay surface salinity during the second dry-weather event - 6/30/14. Salinity converted from specific conductivity.
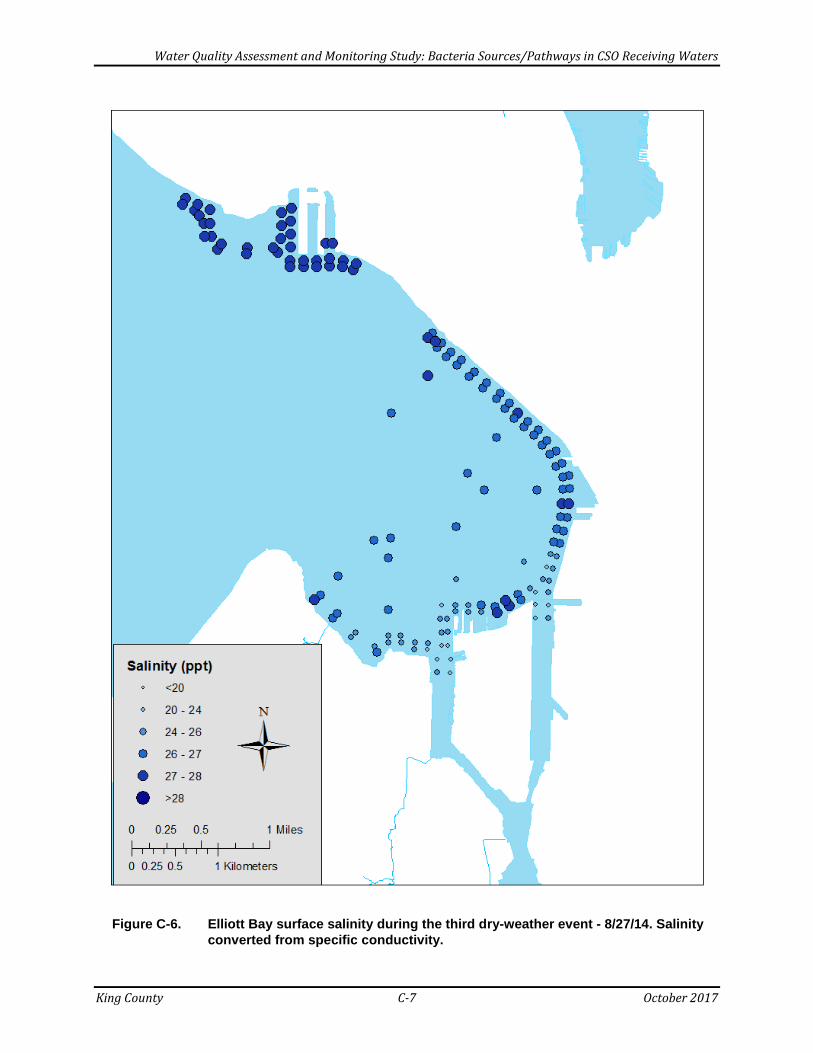
Water Quality Assessment and Monitoring Study: Bacteria Sources/Pathways in CSO Receiving Waters
King County C-7 October 2017
Figure C-6. Elliott Bay surface salinity during the third dry-weather event - 8/27/14. Salinity converted from specific conductivity.
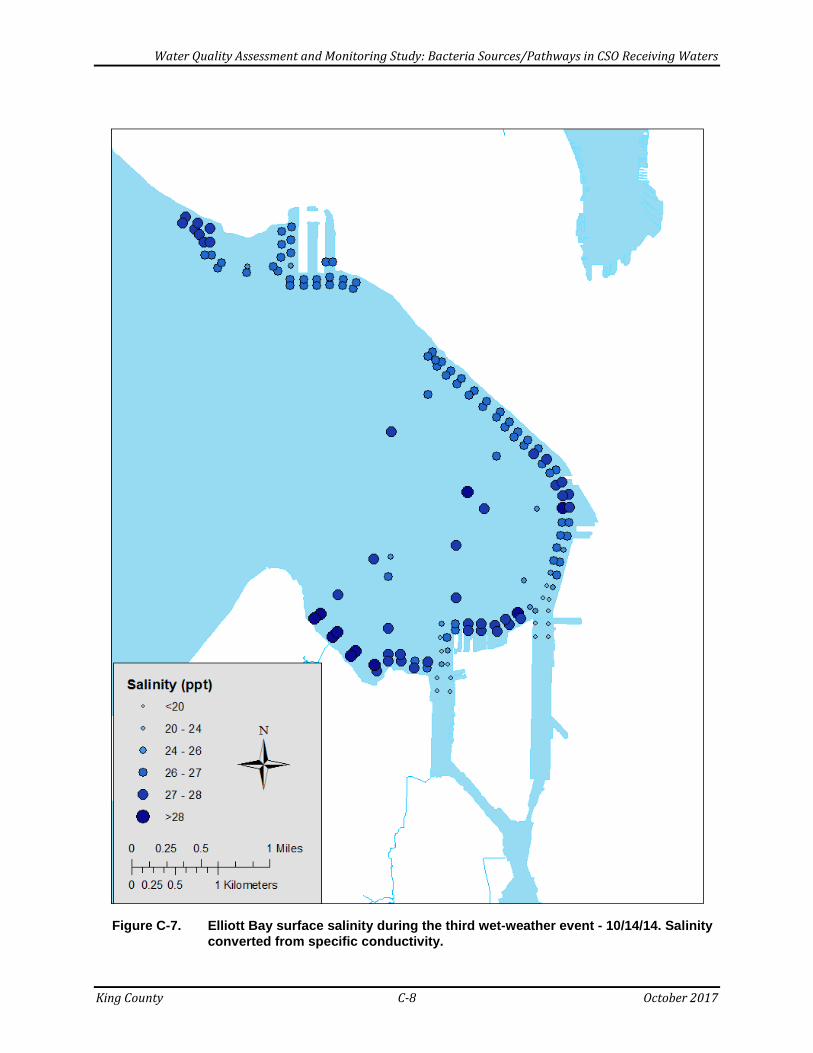
Water Quality Assessment and Monitoring Study: Bacteria Sources/Pathways in CSO Receiving Waters
King County C-8 October 2017
Figure C-7. Elliott Bay surface salinity during the third wet-weather event - 10/14/14. Salinity converted from specific conductivity.
Water Quality Assessment and Monitoring Study: Bacteria Sources/Pathways in CSO Receiving Waters
King County D-1 October 2017
APPENDIX D: HU-2-BACTEROIDES MAPS

Water Quality Assessment and Monitoring Study: Bacteria Sources/Pathways in CSO Receiving Waters
King County D-2 October 2017
Figure D-1. Hu-2-Bacteroides and E. coli concentrations in Lake Union/Ship Canal for dry sampling event #2 –7/16/14.
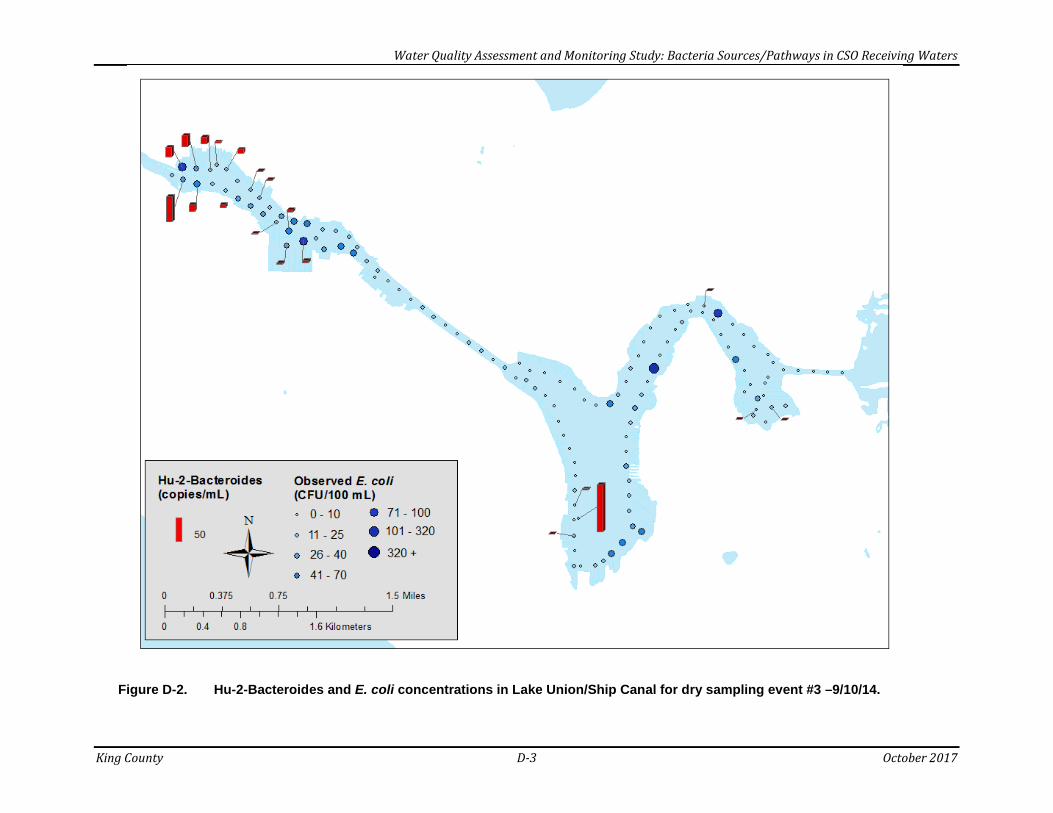
Water Quality Assessment and Monitoring Study: Bacteria Sources/Pathways in CSO Receiving Waters
King County D-3 October 2017
Figure D-2. Hu-2-Bacteroides and E. coli concentrations in Lake Union/Ship Canal for dry sampling event #3 –9/10/14.
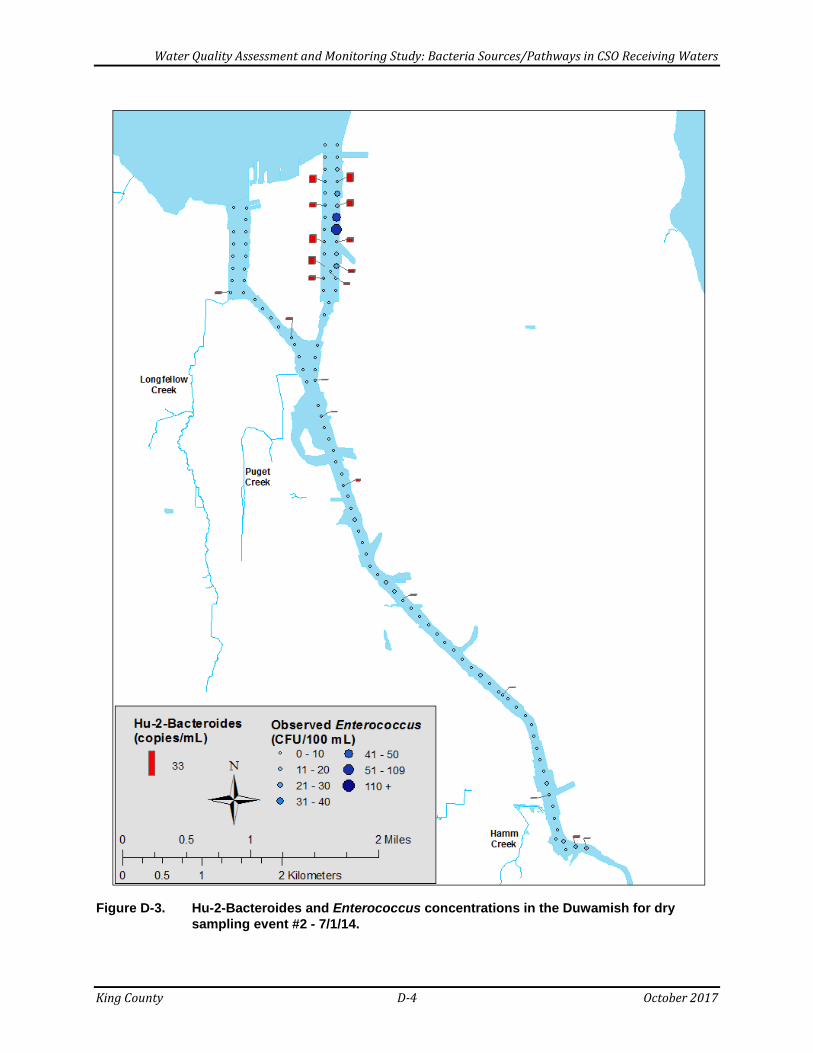
Water Quality Assessment and Monitoring Study: Bacteria Sources/Pathways in CSO Receiving Waters
King County D-4 October 2017
Figure D-3. Hu-2-Bacteroides and Enterococcus concentrations in the Duwamish for dry
sampling event #2 - 7/1/14.
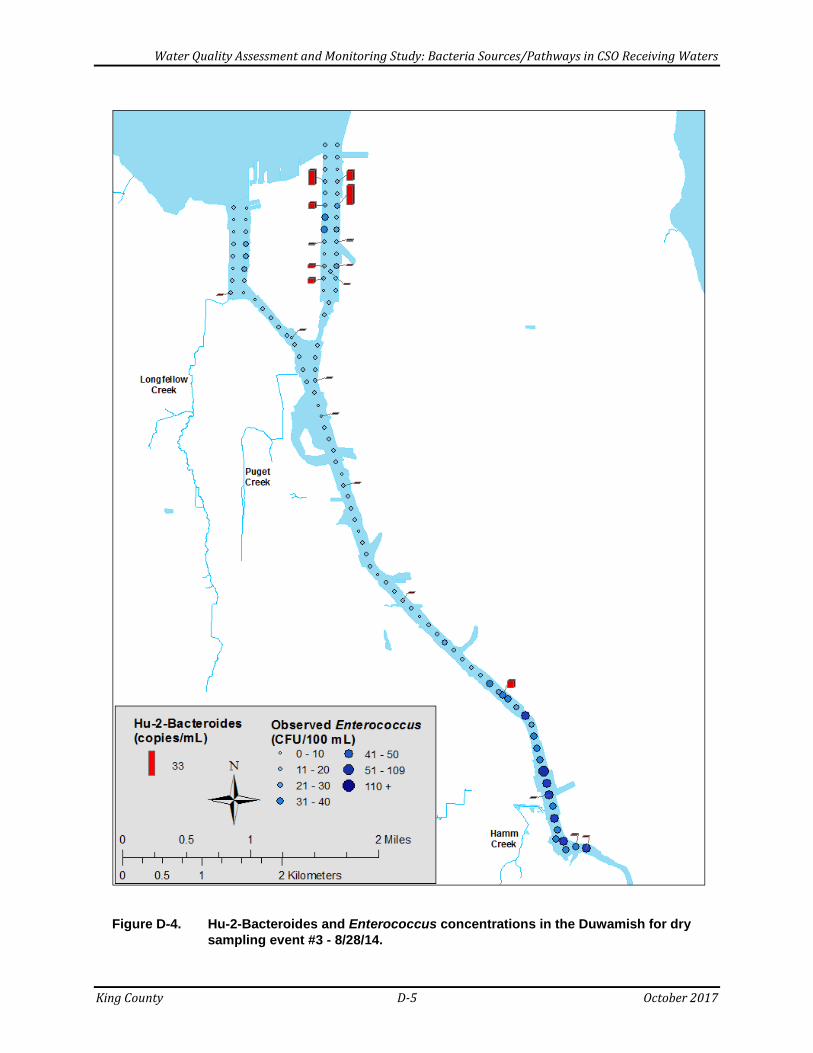
Water Quality Assessment and Monitoring Study: Bacteria Sources/Pathways in CSO Receiving Waters
King County D-5 October 2017
Figure D-4. Hu-2-Bacteroides and Enterococcus concentrations in the Duwamish for dry sampling event #3 - 8/28/14.

Water Quality Assessment and Monitoring Study: Bacteria Sources/Pathways in CSO Receiving Waters
King County D-6 October 2017
Figure D-5. Hu-2-Bacteroides and Enterococcus concentrations in the Duwamish for wet
sampling event #3 5/5/14.

Water Quality Assessment and Monitoring Study: Bacteria Sources/Pathways in CSO Receiving Waters
King County D-7 October 2017
Figure D-6. Hu-2-Bacteroides and Enterococcus concentrations in Elliott Bay for dry
sampling event #2 –6/30/14.
Fairmount Creek

Water Quality Assessment and Monitoring Study: Bacteria Sources/Pathways in CSO Receiving Waters
King County D-8 October 2017
Figure D-7. Hu-2-Bacteroides and Enterococcus concentrations in Elliott Bay for dry
sampling event #3 –8/27/14.
Fairmount Creek
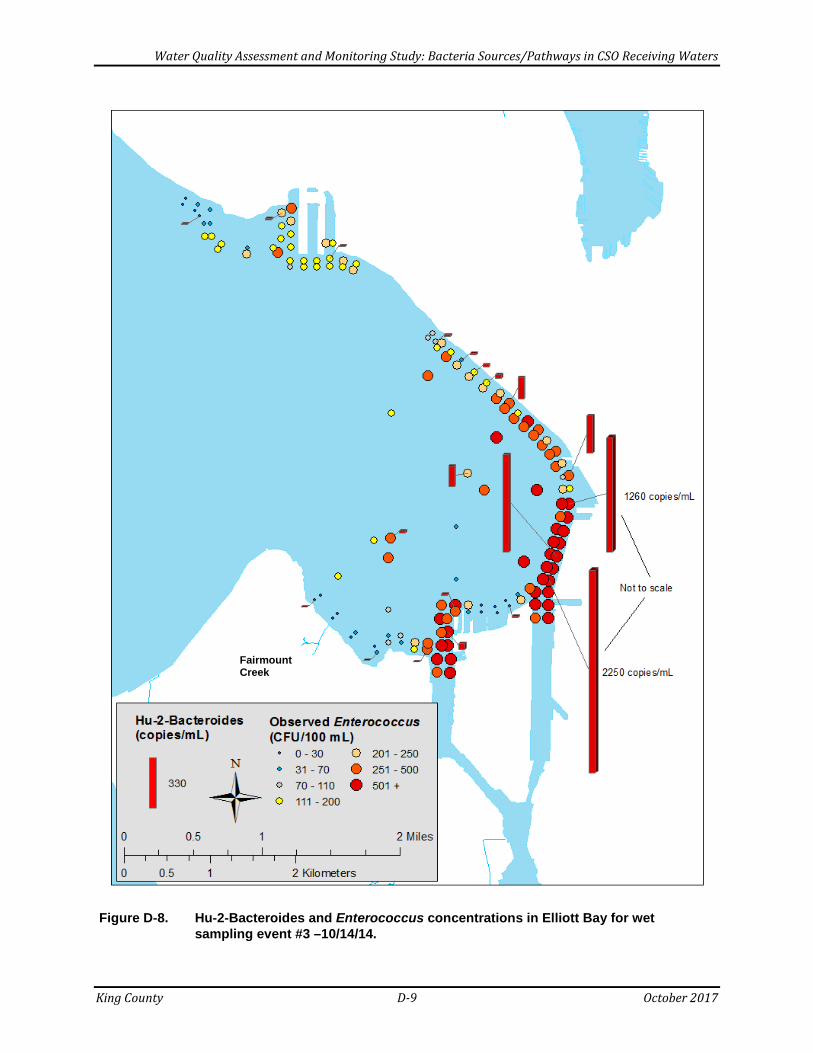
Water Quality Assessment and Monitoring Study: Bacteria Sources/Pathways in CSO Receiving Waters
King County D-9 October 2017
Figure D-8. Hu-2-Bacteroides and Enterococcus concentrations in Elliott Bay for wet
sampling event #3 –10/14/14.
Fairmount Creek
Water Quality Assessment and Monitoring Study: Bacteria Sources/Pathways in CSO Receiving Waters
King County D-10 October 2017
Water Quality Assessment and Monitoring Study: Bacteria Sources/Pathways in CSO Receiving Waters
King County E-1 October 2017
APPENDIX E: SAMPLING RESULTS

Water Quality Assessment and Monitoring Study: Bacteria Sources/Pathways in CSO Receiving Waters
King County E-2 October 2017
Table E-1. E. coli (CFU/100 ml) and Hu-2 Bacteroides (copies/mL) concentrations and specific conductivity (µS/cm) in Lake Union/Ship Canal for each sampling event. Blank cells refer to sites that were not sampled during an event.
Dry-Weather Wet-Weather
1/16/14 7/16/14 9/10/14 1/29/14 2/18/14 3/17/14 Site Name E. coli E. coli
Hu-2-Bact.
Sp. Cond. E. coli
Hu-2-Bact.
Sp. Cond. E. coli E. coli E. coli
0512 62 16 138 21 615 80 200 91 BSLU002 73 39 0.00 140 86 24.00 607 770 300 150 BSLU003 55 8 3.79 138 31 60.64 584 300 180 84 BSLU004 55 9 26.29 146 59 16.19 565 220 150 99 BSLU005 49 14 0.00 131 38 26.93 574 740 150 280 BSLU006 50 6 3.87 129 15 16.50 570 900 220 130 BSLU007 44 6 130 14 551 77 110 63 BSLU008 65 9 1.11 129 18 2.92 568 700 130 150 BSLU009 69 60 3.40 128 24 10.50 543 550 200 240 BSLU010 42 5 0.00 128 20 6.08 538 680 220 59 BSLU011 68 9 125 22 524 880 180 72 BSLU012 56 9 2.61 124 18 2.68 502 2100 260 110 BSLU013 41 8 123 29 522 410 160 75 BSLU014 53 11 119 29 525 450 140 110 BSLU015 41 11 3.16 120 21 1.66 490 290 210 78 BSLU016 36 25 117 25 472 2900 220 43 BSLU017 36 20 120 29 491 490 130 43 BSLU018 57 27 1.82 117 17 2.21 469 190 180 77 BSLU019 41 18 118 27 475 290 250 59 BSLU020 49 22 112 45 446 180 230 70 BSLU021 52 23 0.00 118 42 4.90 463 170 290 58 BSLU022 92 20 0.63 117 39 4.42 515 270 86 140 BSLU023 45 21 0.00 116 77 6.08 456 230 220 68 BSLU024 55 50 115 46 413 250 240 77 BSLU025 45 5 106 18 396 200 220 100 BSLU026 41 22 107 22 394 130 230 72 BSLU027 49 21 107 29 416 140 99 140 BSLU028 41 5 106 12 402 200 330 96 BSLU029 38 10 106 23 379 180 170 87 BSLU030 36 7 106 68 389 90 290 60 BSLU031 41 9 106 41 378 72 190 80 BSLU032 40 70 106 23 382 59 240 99 BSLU033 49 12 105 14 408 84 190 160 BSLU034 49 13 105 12 425 54 390 89 BSLU035 42 8 105 7 369 74 180 95 BSLU036 45 6 112 7 393 32 230 97 BSLU037 40 12 102 6 368 34 230 89 BSLU038 44 6 102 9 328 28 220 100 BSLU039 73 6 102 16 316 31 140 96 BSLU040 41 5 102 11 330 27 160 130 BSLU041 43 4 103 8 336 16 210 140 BSLU042 46 5 101 7 322 9 240 190 BSLU043 42 7 101 15 335 15 140 180 BSLU044 43 14 101 11 320 8 250 120

Water Quality Assessment and Monitoring Study: Bacteria Sources/Pathways in CSO Receiving Waters
King County E-3 October 2017
Dry-Weather Wet-Weather
1/16/14 7/16/14 9/10/14 1/29/14 2/18/14 3/17/14 Site Name E. coli E. coli
Hu-2-Bact.
Sp. Cond. E. coli
Hu-2-Bact.
Sp. Cond. E. coli E. coli E. coli
BSLU045 48 14 101 10 305 14 180 260 BSLU046 25 9 102 11 306 6 250 160 BSLU047 31 7 101 8 303 13 50 42 BSLU048 29 5 101 13 289 7 180 100 BSLU049 23 8 101 11 294 7 260 130 BSLU050 32 3 102 8 299 6 140 240 BSLU051 32 4 101 8 285 8 160 160 BSLU052 33 3 101 6 276 6 170 290 BSLU053 26 2 101 6 272 25 190 140 BSLU054 35 2 101 6 272 7 170 170 BSLU055 33 1 101 5 274 40 270 120 BSLU056 36 2 101 10 276 21 200 61 BSLU057 34 16 101 11 278 23 190 64 BSLU058 24 240 1.18 102 9 3.08 281 22 290 50 BSLU059 32 2 102 5 281 190 280 46 A522 38 7 0.00 102 5 114.33 287 210 210 43 BSLU061 41 2 0.00 102 16 0.00 294 440 210 13 BSLU062 33 3 102 5 295 65 210 18 BSLU063 28 5 102 16 299 15 160 14 BSLU064 28 7 103 7 295 5 180 11 BSLU065 50 2 103 14 295 7 150 14 BSLU066 48 3 102 15 294 9 130 20 BSLU067 50 17 102 45 295 85 60 60 BSLU068 36 1 102 65 290 280 190 46 BSLU069 36 0 101 56 286 85 360 26 BSLU070 32 2 102 34 286 360 380 57 BSLU071 50 0 101 18 288 200 290 70 BSLU072 42 1 102 17 290 75 230 26 BSLU073 36 1 102 11 289 19 200 30 BSLU074 55 2 100 30 282 5 90 30 BSLU075 50 2 100 9 286 5 80 33 BSLU076 46 2 101 9 273 2 130 48 BSLU077 10 25 101 11 239 10 43 51 BSLU078 9 5 100 34 231 150 35 50 BSLU079 13 0 100 13 220 140 36 42 BSLU080 15 1 100 10 226 170 39 50 BSLU081 11 1 99 230 222 77 41 87 BSLU082 9 0 100 6 209 170 59 77 BSLU083 10 1 100 9 203 78 70 69 BSLU084 5 1 99 7 206 71 180 66 BSLU085 8 8 99 15 192 69 190 140 BSLU086 7 6 98 4 189 69 23 9 BSLU087 6 5 99 5 188 58 25 17 BSLU088 7 6 98 4 179 50 18 14 BSLU089 3 6 98 8 170 48 20 6 BSLU090 6 5 100 4 161 38 26 11 BSLU091 8 12 98 46 151 42 29 7
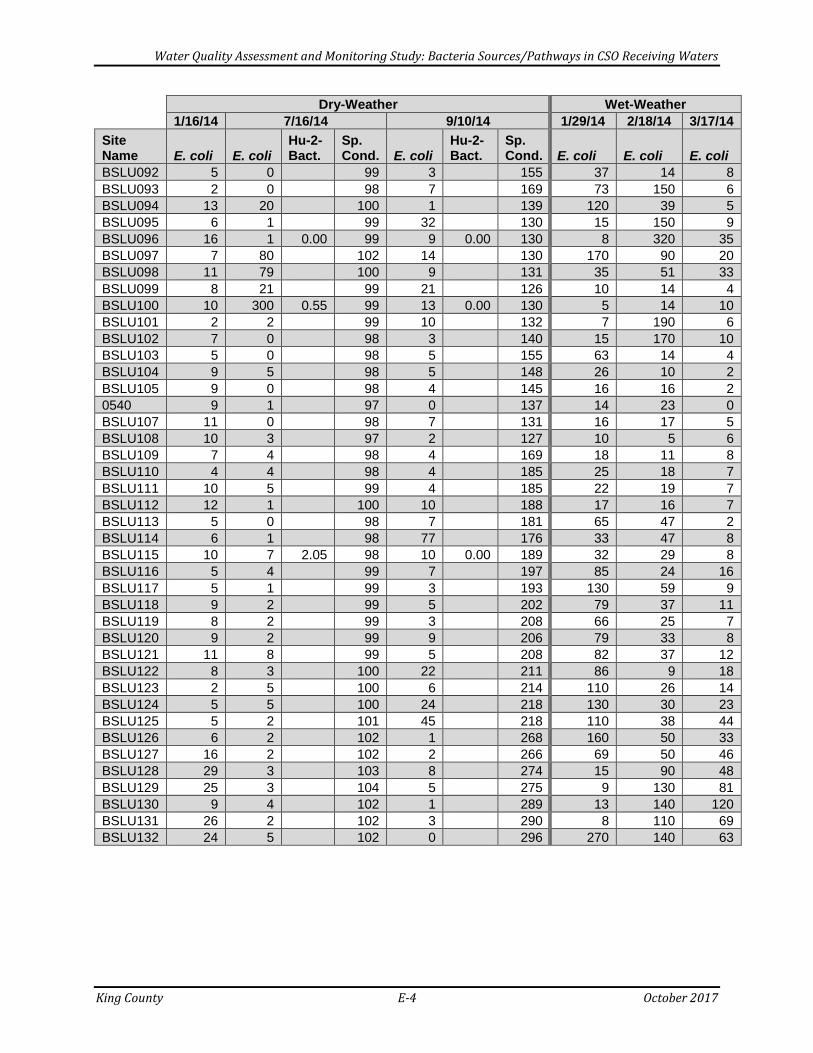
Water Quality Assessment and Monitoring Study: Bacteria Sources/Pathways in CSO Receiving Waters
King County E-4 October 2017
Dry-Weather Wet-Weather
1/16/14 7/16/14 9/10/14 1/29/14 2/18/14 3/17/14 Site Name E. coli E. coli
Hu-2-Bact.
Sp. Cond. E. coli
Hu-2-Bact.
Sp. Cond. E. coli E. coli E. coli
BSLU092 5 0 99 3 155 37 14 8 BSLU093 2 0 98 7 169 73 150 6 BSLU094 13 20 100 1 139 120 39 5 BSLU095 6 1 99 32 130 15 150 9 BSLU096 16 1 0.00 99 9 0.00 130 8 320 35 BSLU097 7 80 102 14 130 170 90 20 BSLU098 11 79 100 9 131 35 51 33 BSLU099 8 21 99 21 126 10 14 4 BSLU100 10 300 0.55 99 13 0.00 130 5 14 10 BSLU101 2 2 99 10 132 7 190 6 BSLU102 7 0 98 3 140 15 170 10 BSLU103 5 0 98 5 155 63 14 4 BSLU104 9 5 98 5 148 26 10 2 BSLU105 9 0 98 4 145 16 16 2 0540 9 1 97 0 137 14 23 0 BSLU107 11 0 98 7 131 16 17 5 BSLU108 10 3 97 2 127 10 5 6 BSLU109 7 4 98 4 169 18 11 8 BSLU110 4 4 98 4 185 25 18 7 BSLU111 10 5 99 4 185 22 19 7 BSLU112 12 1 100 10 188 17 16 7 BSLU113 5 0 98 7 181 65 47 2 BSLU114 6 1 98 77 176 33 47 8 BSLU115 10 7 2.05 98 10 0.00 189 32 29 8 BSLU116 5 4 99 7 197 85 24 16 BSLU117 5 1 99 3 193 130 59 9 BSLU118 9 2 99 5 202 79 37 11 BSLU119 8 2 99 3 208 66 25 7 BSLU120 9 2 99 9 206 79 33 8 BSLU121 11 8 99 5 208 82 37 12 BSLU122 8 3 100 22 211 86 9 18 BSLU123 2 5 100 6 214 110 26 14 BSLU124 5 5 100 24 218 130 30 23 BSLU125 5 2 101 45 218 110 38 44 BSLU126 6 2 102 1 268 160 50 33 BSLU127 16 2 102 2 266 69 50 46 BSLU128 29 3 103 8 274 15 90 48 BSLU129 25 3 104 5 275 9 130 81 BSLU130 9 4 102 1 289 13 140 120 BSLU131 26 2 102 3 290 8 110 69 BSLU132 24 5 102 0 296 270 140 63

Water Quality Assessment and Monitoring Study: Bacteria Sources/Pathways in CSO Receiving Waters
King County E-5 October 2017
Table E-2. Summarized data Hu-2 Bacteroides in Lake Union/Ship Canal for each sampling event. All values in copies/mL.
Event Minimum Maximum Mean Median St. Dev. Geomean 90th
Percentile
Dry Event #2 0 26.29 2.52 0.87 5.77 0.26 3.80 Dry Event #3 0 114.3 15.16 4.66 27.39 2.23 30.30

Water Quality Assessment and Monitoring Study: Bacteria Sources/Pathways in CSO Receiving Waters
King County E-6 October 2017
Table E-3. Enterococcus (CFU/100 ml) and Hu-2 Bacteroides (copies/mL) concentrations and specific conductivity (µS/cm) in the Duwamish for each sampling event. Blank cells refer to sites that were not sampled during an event.
Dry-Weather Wet-Weather 1/22/14 7/1/14 8/28/14 2/12/14 3/3/14 5/5/14
Site Name Entero. Entero. Hu-2-Bact.
Sp. Cond. Entero.
Hu-2-Bact.
Sp. Cond. Entero. Entero. Entero.
Hu-2-Bact.
BSDW001 7 3 28,100 12 40,100 500 36 80 BSDW002 31 8 26,100 14 37,900 380 330 130 BSDW003 22 7 26,000 17 36,800 290 620 130 BSDW004 14 7 26,900 20 40,200 490 61 90 BSDW005 14 2 25,900 12 38,400 530 140 80 BSDW006 23 15 26,000 9 37,600 390 150 130 BSDW007 19 5 8.29 26,000 16 12.08 37,300 410 67 170 26.61 BSDW008 12 6 7.11 27,000 13 17.77 38,400 580 86 170 13.42 BSDW009 13 6 26,900 16 37,800 550 70 100 BSDW010 14 23 25,700 14 37,000 590 300 90 BSDW011 14 11 5.76 25,900 21 23.92 36,100 680 970 100 49.19 BSDW012 9 5 3.79 25,400 14 7.26 36,200 580 41 100 12.00 BSDW013 10 4 26,200 33 36,700 570 29 140 BSDW014 15 49 25,700 16 35,600 3400 430 100 BSDW015 26 70 26,600 27 35,600 5600 1400 150 BSDW016 26 3 27,900 32 37,200 560 54 110 BSDW017 200 2 7.66 26,600 19 1.03 36,200 230 170 99 7.50 BSDW018 13 8 4.03 26,400 18 1.11 35,800 1500 2900 160 66.56 BSDW019 16 20 26,800 14 35,200 1300 500 140 BSDW020 95 3 26,200 10 35,200 180 300 190 BSDW021 53 1 7.34 27,900 16 3.89 34,200 320 38 170 5.84 BSDW022 14 26 2.76 26,500 25 0.00 34,700 380 2900 140 17.84 BSDW023 6 6 29,800 19 33,600 460 42 140 HNFD01 15 3 1.18 28,900 16 0.00 34,700 230 32 170 14.53 BSDW025 43 2 4.11 28,700 14 5.61 35,700 160 39 230 14.37 BSDW026 8 5 30,900 10 38,300 230 55 310 BSDW027 11 3 31,100 14 34,600 270 50 140 BSDW028 7 7 25,600 16 33,100 230 35 130 BSDW029 6 2 25,600 18 33,700 320 35 100 BSDW030 16 6 27,100 10 33,500 140 36 61 BSDW031 7 4 30,200 16 37,700 80 28 77 BSDW032 8 1 30,200 9 36,300 230 99 160 BSDW033 11 4 27,700 10 35,500 90 99 100 BSDW034 12 7 28,200 15 37,900 110 38 120 BSDW035 10 8 29,800 5 37,000 120 47 110 BSDW036 8 5 29,300 14 36,600 140 110 140 BSDW037 10 6 29,400 23 36,700 65 110 49 BSDW038 8 7 27,400 23 36,500 170 51 80 BSDW039 2 5 27,800 13 34,500 150 46 160 BSDW040 5 3 26,200 6 36,800 190 54 150 BSDW041 9 8 28,000 25 38,600 120 140 150 BSDW042 1 5 27,500 14 35,800 170 57 110

Water Quality Assessment and Monitoring Study: Bacteria Sources/Pathways in CSO Receiving Waters
King County E-7 October 2017
Dry-Weather Wet-Weather 1/22/14 7/1/14 8/28/14 2/12/14 3/3/14 5/5/14
Site Name Entero. Entero. Hu-2-Bact.
Sp. Cond. Entero.
Hu-2-Bact.
Sp. Cond. Entero. Entero. Entero.
Hu-2-Bact.
BSDW043 6 4 28,200 17 35,900 120 280 170 BSDW044 5 5 1.42 29,200 12 0.00 32,500 630 250 780 10.74 BSDW045 6 5 27,500 8 35,300 150 41 110 BSDW046 10 2 26,500 10 32,400 140 40 140 BSDW047 12 3 22,600 18 31,700 120 55 170 BSDW048 6 4 22,500 14 30,200 170 52 150 BSDW049 5 6 20,100 16 28,500 150 24 180 BSDW050 12 0 18,800 16 31,200 180 47 190 LTKE03 8 3 1.82 20,500 10 0.00 28,800 200 37 170 6.79 BSDW052 7 7 18,200 11 29,300 68 37 130 BSDW053 5 5 21,000 12 28,100 320 130 130 BSDW054 10 5 17,700 13 29,200 280 210 180 BSDW055 6 6 18,000 13 29,500 58 26 260 BSDW056 4 2 16,100 14 28,900 53 41 120 BSDW057 8 2 15,600 18 27,500 160 240 190 BSDW058 4 6 0.00 15,400 14 0.00 28,500 1500 160 100 12.87 BSDW059 5 3 15,500 14 29,500 140 41 140 BSDW060 6 1 15,200 16 28,300 120 45 140 BSDW061 9 2 14,600 8 27,700 190 41 99 BSDW062 15 4 0.00 14,100 9 0.00 26,200 150 41 160 5.84 BSDW063 12 6 14,000 20 26,200 150 41 110 BSDW064 12 5 13,900 14 26,800 150 31 150 BSDW065 5 6 13,800 14 29,700 180 43 140 BSDW066 7 7 13,200 11 25,900 140 25 120 BSDW067 5 10 12,900 10 25,900 86 39 160 BSDW068 11 5 2.53 13,100 17 0.00 27,200 230 110 140 10.34 BSDW069 4 7 12,300 14 33,000 120 41 90 BSDW070 10 10 12,500 12 27,300 120 56 140 BSDW071 4 14 12,800 13 22,400 180 59 110 BSDW072 5 9 11,500 9 25,400 170 35 200 BSDW073 5 6 12,100 12 30,700 150 46 150 BSDW074 9 5 12,300 16 21,800 130 46 200 BSDW075 4 10 9,460 16 19,100 190 46 140 BSDW076 8 5 8,960 9 20,900 160 37 150 BSDW077 7 11 7,900 11 20,100 170 39 80 BSDW078 3 11 7,880 18 16,800 170 42 50 BSDW079 10 9 1.11 7,560 16 0.00 22,200 150 48 140 0.00 BSDW080 8 9 9,300 14 19,100 120 41 110 BSDW081 1 9 6,710 10 21,900 99 44 90 BSDW082 5 5 6,040 14 17,200 80 42 140 BSDW083 5 7 5,590 11 20,800 99 46 140 BSDW084 6 7 5,150 25 21,400 180 48 190 BSDW085 8 5 4,690 18 20,300 140 110 160 BSDW086 7 10 4,890 20 16,400 64 54 130

Water Quality Assessment and Monitoring Study: Bacteria Sources/Pathways in CSO Receiving Waters
King County E-8 October 2017
Dry-Weather Wet-Weather 1/22/14 7/1/14 8/28/14 2/12/14 3/3/14 5/5/14
Site Name Entero. Entero. Hu-2-Bact.
Sp. Cond. Entero.
Hu-2-Bact.
Sp. Cond. Entero. Entero. Entero.
Hu-2-Bact.
BSDW087 5 6 5,110 20 18,000 62 110 110 BSDW088 5 15 5,080 18 17,400 150 99 99 BSDW089 4 5 4,510 38 13,800 64 53 230 BSDW090 6 9 4,940 30 14,200 73 110 230 LTUM03 8 5 0.00 3,810 32 9.08 11,500 220 130 190 3.79 BSDW092 6 2 3,830 33 10,400 190 90 260 BSDW093 3 6 4,480 30 10,600 140 59 200 BSDW094 7 5 4,530 45 9,380 100 110 140 BSDW095 2 4 4,330 23 23,800 170 52 190 BSDW096 2 6 5,560 31 16,100 170 59 200 BSDW097 5 8 9,360 36 12,200 80 120 160 BSDW098 14 6 5,220 37 13,700 140 64 140 BSDW099 5 5 5,710 51 14,300 83 130 280 BSDW100 9 15 5,330 41 16,200 200 190 280 BSDW101 3 6 0.00 5,700 47 0.00 15,600 170 210 230 5.45 BSDW102 4 9 5,430 36 14,600 160 73 190 BSDW103 2 6 6,110 45 17,600 65 75 180 BSDW104 2 5 5,140 38 17,200 140 140 230 BSDW105 4 8 5,600 37 16,200 150 60 230 BSDW106 4 13 4,490 44 14,800 90 63 230 BSDW107 4 3 2,430 32 14,700 59 70 100 BSDW108 5 11 1.34 3,480 36 1.58 13,500 170 81 220 5.84 LTXQ01 3 15 0.00 2,060 41 0.00 13,000 140 90 220 4.82
Table E-4 values in copies/mL.
Event Minimum Maximum Mean Median St. Dev. Geomean 90th
Percentile
Dry Event #2 0 8.29 3.01 2.17 16.1 0.76 7.37 Dry Event #3 0 23.92 4.17 0.52 2.85 0.23 12.64 Wet Event #3 0 66.56 14.72 10.54 6.78 7.83 28.87

Water Quality Assessment and Monitoring Study: Bacteria Sources/Pathways in CSO Receiving Waters
King County E-9 October 2017
Table E-5. Enterococcus (CFU/100 ml) and Hu-2 Bacteroides (copies/mL) concentrations and specific conductivity (µS/cm) in Elliott Bay for each sampling event. Blank cells refer to sites that were not sampled during an event.
Dry-Weather Wet-Weather 1/23/14 6/30/14 8/27/14 3/4/14 3/5/14 10/14/14
Site Name Entero. Entero. Hu-2-Bact.
Sp. Cond. Entero.
Hu-2-Bact.
Sp. Cond. Entero. Entero. Entero.
Hu-2-Bact.
Sp. Cond.
BSEB001 2 0 41,100 0 41,800 9 17 30 42,000 BSEB002 7 0 41,400 0 41,900 6 27 19 42,200 BSEB003 4 0 41,200 0 41,900 7 26 21 42,300 BSEB004 3 0 41,800 4 42,400 12 17 31 42,200 BSEB005 4 1 41,100 0 42,400 2 19 35 42,200 BSEB006 5 0 0.00 41,700 0 0.00 42,100 11 14 26 3.55 42,500 BSEB007 5 0 41,100 0 42,300 9 23 39 42,600 BSEB008 2 0 41,200 0 42,200 14 17 38 42,500 BSEB009 2 1 41,000 1 42,200 14 25 140 41,500 BSEB010 1 0 41,900 0 42,300 18 31 190 41,100 BSEB011 0 0 41,500 0 42,300 12 28 140 41,300 BSEB012 2 0 41,700 0 42,300 9 26 160 41,200 BSEB013 2 0 41,700 0 42,300 3 33 70 40,000 BSEB014 1 0 41,900 0 42,000 5 60 240 41,100 BSEB015 2 0 41,700 0 42,300 7 180 260 40,800 BSEB016 0 0 41,300 0 42,300 2 180 140 40,900 BSEB017 1 0 39,500 1 42,500 14 39 120 41,100 BSEB018 6 0 41,400 3 42,700 10 32 140 41,200 BSEB019 19 1 2.13 41,600 0 0.24 42,700 16 39 240 9.87 40,700 BSEB020 2 0 41,600 2 42,900 20 99 390 40,500 BSEB021 1 0 41,900 0 42,900 14 38 210 40,400 BSEB022 5 0 42,000 0 42,900 14 36 130 41,300 BSEB023 1 0 41,700 1 42,400 18 59 120 40,000 BSEB024 2 0 41,700 0 42,500 14 140 180 40,800 BSEB025 5 0 42,000 1 42,800 5 150 90 41,000 BSEB026 2 0 42,100 0 42,600 7 260 160 40,900 BSEB027 4 0 42,100 0 42,500 7 210 130 40,900 BSEB028 1 0 42,000 1 42,300 10 330 150 40,700 BSEB029 3 0 42,600 0 42,300 10 200 150 41,000 BSEB030 2 0 41,900 0 42,400 15 270 170 40,700 BSEB031 2 0 0.00 41,400 2 3.47 42,200 16 230 160 4.03 40,500 BSEB032 1 1 41,600 0 42,200 19 220 220 40,500 BSEB033 2 0 42,200 1 42,100 14 130 250 40,700 BSEB034 0 0 42,000 0 42,500 16 47 150 40,800 BSEB035 1 0 42,200 0 42,300 25 280 180 40,700 BSEB036 4 0 41,900 0 42,200 13 440 240 40,700 BSEB037 2 0 41,400 0 42,100 22 360 190 40,600 BSEB038 1 0 41,400 0 41,700 27 660 90 40,500 BSEB039 1 0 41,300 0 41,800 22 1100 110 40,700 LTBC43 0 0 2.53 41,500 1 0.00 41,800 19 630 99 11.84 40,800 BSEB041 1 0 41,800 0 41,500 16 600 170 40,500 BSEB042 0 0 41,400 0 41,300 19 740 230 40,600

Water Quality Assessment and Monitoring Study: Bacteria Sources/Pathways in CSO Receiving Waters
King County E-10 October 2017
Dry-Weather Wet-Weather 1/23/14 6/30/14 8/27/14 3/4/14 3/5/14 10/14/14
Site Name Entero. Entero. Hu-2-Bact.
Sp. Cond. Entero.
Hu-2-Bact.
Sp. Cond. Entero. Entero. Entero.
Hu-2-Bact.
Sp. Cond.
BSEB043 2 0 41,800 0 41,600 19 430 160 40,600 BSEB044 3 0 41,700 0 41,700 15 400 360 40,500 BSEB045 2 0 41,600 0 42,000 24 290 480 41,100 BSEB046 0 0 41,400 1 41,400 16 77 120 42,500 BSEB047 1 0 41,800 0 41,500 15 340 220 40,500 BSEB048 5 0 0.00 41,700 0 1.50 41,600 13 440 60 9.71 40,700 BSEB049 1800 1 0.00 41,500 2 14.13 41,600 27 410 140 17.69 40,800 BSEB050 140 0 41,900 5 41,700 39 510 250 40,500 BSEB051 39 0 42,200 0 41,700 20 630 240 40,700 BSEB052 28 1 0.00 42,300 0 2.57 41,700 17 530 140 24.95 40,700 BSEB053 2 0 42,200 14 41,400 17 620 240 40,600 BSEB054 1 10 42,100 15 41,700 28 590 260 40,500 BSEB055 1 0 42,300 14 41,600 19 460 310 40,600 BSEB056 2 9 0.00 42,300 1 0.00 41,700 39 650 380 142.05 40,600 BSEB057 8 2 42,200 2 41,900 37 620 170 41,500 BSEB058 2 0 41,800 6 41,700 35 690 380 40,600 BSEB059 0 0 42,100 0 41,700 41 320 560 41,300 LTED04 0 0 0.00 42,100 0 0.00 41,600 23 110 240 135.97 43,200 BSEB061 1 0 42,100 5 41,400 45 430 430 41,200 BSEB062 3 0 42,200 0 41,500 40 370 510 41,100 BSEB063 1 0 42,200 0 41,400 36 460 280 41,200 BSEB064 0 0 42,100 6 41,100 33 270 270 41,800 BSEB065 0 0 42,200 14 41,400 46 420 310 41,400 BSEB066 2 0 42,200 0 40,700 61 450 250 41,800 BSEB067 2 8 42,200 2 41,300 45 1300 320 41,700 BSEB068 0 0 42,000 0 41,300 41 1000 320 41,400 BSEB069 0 0 42,100 3 41,200 51 1500 280 42,100 BSEB070 3 25 42,000 2 41,500 41 1500 220 42,200 BSEB071 5 0 0.00 42,000 0 1.50 41,700 260 1500 270 249.83 42,300 BSEB072 3 1 42,100 2 41,200 42 430 110 42,500 BSEB073 5 0 42,500 5 41,100 59 1300 250 43,200 BSEB074 5 0 42,600 1 41,300 46 2100 200 43,100 BSEB075 6 0 42,700 2 41,000 35 600 1200 39,900 BSEB076 5 0 42,500 1 41,500 38 800 350 42,300 BSEB077 6 0 42,100 0 42,400 40 2500 600 41,100 BSEB078 5 1 0.79 41,900 1 0.00 42,200 36 2600 1000 1264.78 41,000 BSEB079 6 0 41,600 0 41,600 39 5600 1200 40,900 BSEB080 4 0 40,800 1 41,400 35 2100 500 41,600 BSEB081 3 0 40,900 2 41,200 39 1200 1200 40,700 BSEB082 2 0 39,900 1 41,100 38 4500 1100 40,000 BSEB083 1 1 32,800 4 41,000 41 6100 910 40,500 BSEB084 1 1 32,100 3 40,900 40 2200 680 40,300 BSEB085 2 0 33,700 25 38,000 38 4800 1400 39,500 BSEB086 5 3 1.58 31,800 34 3.63 38,500 260 4400 580 650.24 40,500

Water Quality Assessment and Monitoring Study: Bacteria Sources/Pathways in CSO Receiving Waters
King County E-11 October 2017
Dry-Weather Wet-Weather 1/23/14 6/30/14 8/27/14 3/4/14 3/5/14 10/14/14
Site Name Entero. Entero. Hu-2-Bact.
Sp. Cond. Entero.
Hu-2-Bact.
Sp. Cond. Entero. Entero. Entero.
Hu-2-Bact.
Sp. Cond.
BSEB087 2 1 31,600 24 38,000 37 5500 1700 37,700 BSEB088 1 0 33,000 32 37,300 54 1000 1100 35,100 BSEB089 3 2 33,100 34 38,000 30 1000 600 39,200 BSEB090 4 3 28,700 56 38,500 53 500 1100 35,300 BSEB091 4 1 6.87 30,700 42 67.27 39,100 32 5300 1300 2247.75 36,900 BSDW001 3 4 30,900 41 36,700 31 1400 1000 37,600 BSDW002 4 3 28,200 46 38,000 31 2300 2100 34,300 BSDW003 3 5 30,000 37 37,300 41 3200 770 34,100 BSDW004 3 1 27,900 29 36,400 40 800 530 36,400 BSDW005 8 1 27,500 41 36,800 48 1100 490 33,100 BSDW006 8 2 26,600 49 37,600 43 5400 1500 33,800 BSEB092 5 1 28,700 54 39,000 39 1600 440 40,200 BSEB093 2 0 36,200 36 40,700 50 420 59 43,300 BSEB094 3 0 35,100 35 41,600 33 900 240 42,600 BSEB095 8 0 1.42 37,900 14 0.00 41,800 29 700 25 10.58 42,700 BSEB096 2 0 37,800 19 42,100 36 140 29 43,100 BSEB097 5 1 36,900 18 40,600 38 25 23 42,800 BSEB098 4 0 36,900 2 41,900 29 9 23 42,900 BSEB099 4 2 32,300 13 40,100 44 24 8 43,100 BSEB100 3 1 33,800 23 40,600 38 28 7 42,700 BSEB101 5 0 33,700 69 39,800 34 71 220 42,800 BSEB102 2 0 36,700 12 40,200 36 46 52 42,300 BSEB103 4 5 0.00 33,300 50 1.58 38,400 310 99 370 6.63 41,000 BSEB104 5 4 30,200 21 37,700 25 210 510 41,200 BSEB105 4 4 26,800 10 39,700 33 150 34 42,600 BSEB106 0 0 39,800 2 41,300 41 230 43 42,600 BSEB107 3 4 29,900 9 36,900 36 270 360 39,900 BSEB108 5 5 26,900 23 38,500 38 190 290 40,400 BSEB109 5 3 28,700 8 37,500 35 320 1300 37,300 BSEB110 14 4 25,300 4 37,700 32 320 370 36,300 BSEB111 7 4 0.00 25,200 7 0.00 37,600 28 200 840 40.82 37,500 BSEB112 3 5 24,500 9 37,200 32 260 910 35,600 BSEB113 5 6 24,600 6 36,900 34 500 700 38,100 BSDW030 5 5 22,000 7 36,300 38 250 510 33,200 BSDW031 8 3 25,600 11 37,200 31 320 1400 35,400 BSDW032 5 4 27,300 5 37,500 33 200 330 36,400 BSDW033 7 8 23,500 5 36,300 37 230 710 33,700 BSEB114 19 2 0.00 36,100 3 0.00 37,200 16 700 380 4.34 40,600 BSEB115 15 3 30,100 2 38,200 18 320 260 41,800 BSEB116 16 2 29,900 13 38,600 26 130 230 41,700 BSEB117 22 3 30,300 8 39,200 29 80 130 42,500 BSEB118 6 2 30,600 2 39,800 30 14 50 42,800 BSEB119 8 4 31,700 2 37,800 29 22 110 42,600 BSEB120 7 4 31,200 8 41,400 29 11 110 42,400
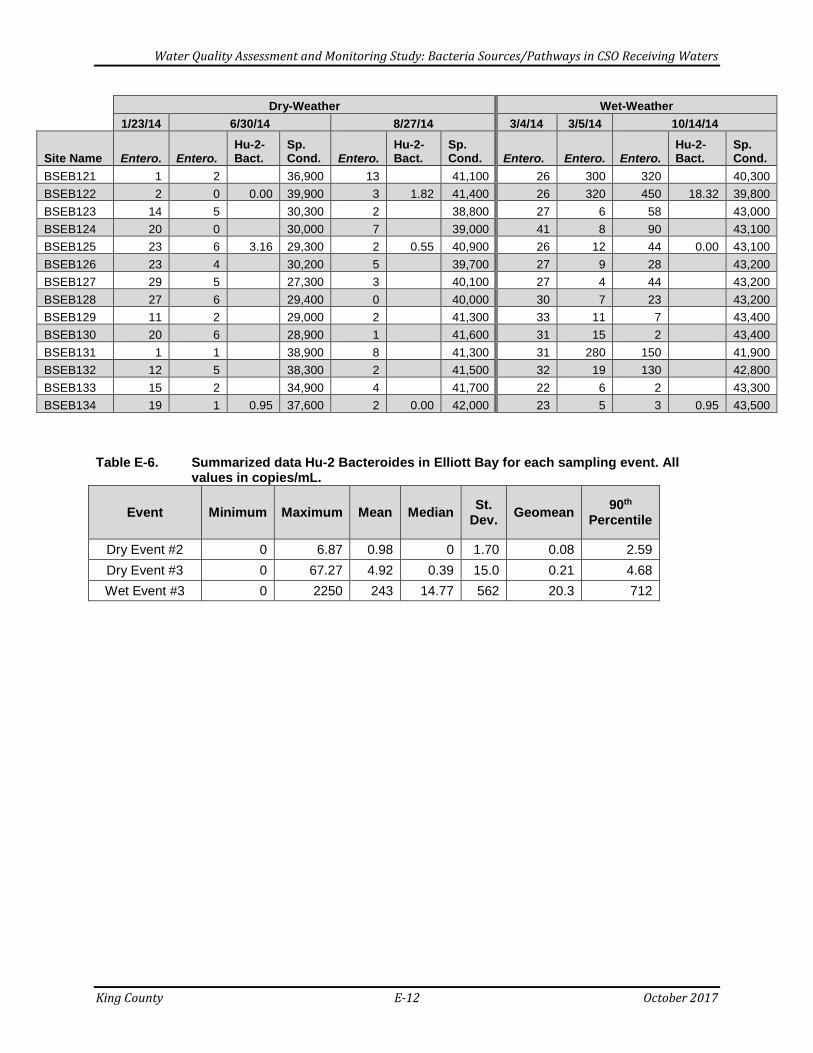
Water Quality Assessment and Monitoring Study: Bacteria Sources/Pathways in CSO Receiving Waters
King County E-12 October 2017
Dry-Weather Wet-Weather 1/23/14 6/30/14 8/27/14 3/4/14 3/5/14 10/14/14
Site Name Entero. Entero. Hu-2-Bact.
Sp. Cond. Entero.
Hu-2-Bact.
Sp. Cond. Entero. Entero. Entero.
Hu-2-Bact.
Sp. Cond.
BSEB121 1 2 36,900 13 41,100 26 300 320 40,300 BSEB122 2 0 0.00 39,900 3 1.82 41,400 26 320 450 18.32 39,800 BSEB123 14 5 30,300 2 38,800 27 6 58 43,000 BSEB124 20 0 30,000 7 39,000 41 8 90 43,100 BSEB125 23 6 3.16 29,300 2 0.55 40,900 26 12 44 0.00 43,100 BSEB126 23 4 30,200 5 39,700 27 9 28 43,200 BSEB127 29 5 27,300 3 40,100 27 4 44 43,200 BSEB128 27 6 29,400 0 40,000 30 7 23 43,200 BSEB129 11 2 29,000 2 41,300 33 11 7 43,400 BSEB130 20 6 28,900 1 41,600 31 15 2 43,400 BSEB131 1 1 38,900 8 41,300 31 280 150 41,900 BSEB132 12 5 38,300 2 41,500 32 19 130 42,800 BSEB133 15 2 34,900 4 41,700 22 6 2 43,300 BSEB134 19 1 0.95 37,600 2 0.00 42,000 23 5 3 0.95 43,500
Table E-6. Summarized data Hu-2 Bacteroides in Elliott Bay for each sampling event. All
values in copies/mL.
Event Minimum Maximum Mean Median St. Dev. Geomean 90th
Percentile
Dry Event #2 0 6.87 0.98 0 1.70 0.08 2.59 Dry Event #3 0 67.27 4.92 0.39 15.0 0.21 4.68 Wet Event #3 0 2250 243 14.77 562 20.3 712
Water Quality Assessment and Monitoring Study: Bacteria Sources/Pathways in CSO Receiving Waters
King County F-1 October 2017
APPENDIX F: BARPLOTS OF BACTERIA AND HU-2-BACTEROIDES CONCENTRATIONS

Water Quality Assessment and Monitoring Study: Bacteria Sources/Pathways in CSO Receiving Waters
King County F-2 October 2017
Figure F-1. Barplot of Lake Union/Ship Canal dry-weather event #1 E. coli concentrations from
west to east. EPA RWQC statistical threshold value shown (320 CFU/100 mL).
Figure F-2. Barplot of Lake Union/Ship Canal dry-weather event #2 E. coli concentrations from
west to east. EPA RWQC statistical threshold value shown (320 CFU/100 mL).

Water Quality Assessment and Monitoring Study: Bacteria Sources/Pathways in CSO Receiving Waters
King County F-3 October 2017
Figure F-3. Barplot of Lake Union/Ship Canal dry-weather event #2 Hu-2-Bacteroides
concentrations from west to east.
Figure F-4. Barplot of Lake Union/Ship Canal dry-weather event #3 E. coli concentrations from
west to east. EPA RWQC statistical threshold value shown (320 CFU/100 mL).
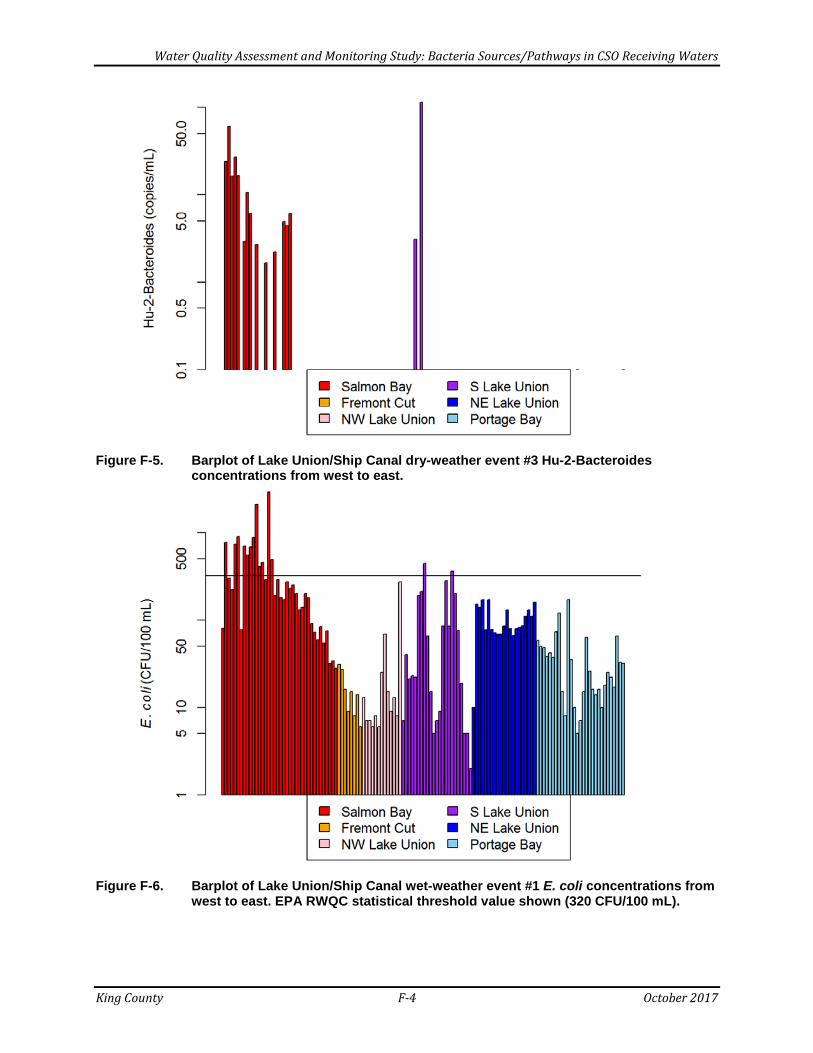
Water Quality Assessment and Monitoring Study: Bacteria Sources/Pathways in CSO Receiving Waters
King County F-4 October 2017
Figure F-5. Barplot of Lake Union/Ship Canal dry-weather event #3 Hu-2-Bacteroides
concentrations from west to east.
Figure F-6. Barplot of Lake Union/Ship Canal wet-weather event #1 E. coli concentrations from
west to east. EPA RWQC statistical threshold value shown (320 CFU/100 mL).

Water Quality Assessment and Monitoring Study: Bacteria Sources/Pathways in CSO Receiving Waters
King County F-5 October 2017
Figure F-7. Barplot of Lake Union/Ship Canal wet-weather event #2 E. coli concentrations from
west to east. EPA RWQC statistical threshold value shown (320 CFU/100 mL).
Figure F-8. Barplot of Lake Union/Ship Canal wet-weather event #3 E. coli concentrations from
west to east. EPA RWQC statistical threshold value shown (320 CFU/100 mL).

Water Quality Assessment and Monitoring Study: Bacteria Sources/Pathways in CSO Receiving Waters
King County F-6 October 2017
Figure F-9. Barplot of Duwamish Estuary dry-weather event #1 Enterococcus concentrations
in the East and West Waterways and moving south. EPA RWQC statistical threshold value shown (110 CFU/100 mL).
Figure F-10. Barplot of Duwamish Estuary dry-weather event #2 Enterococcus concentrations
in the East and West Waterways and moving south. EPA RWQC statistical threshold value shown (110 CFU/100 mL).
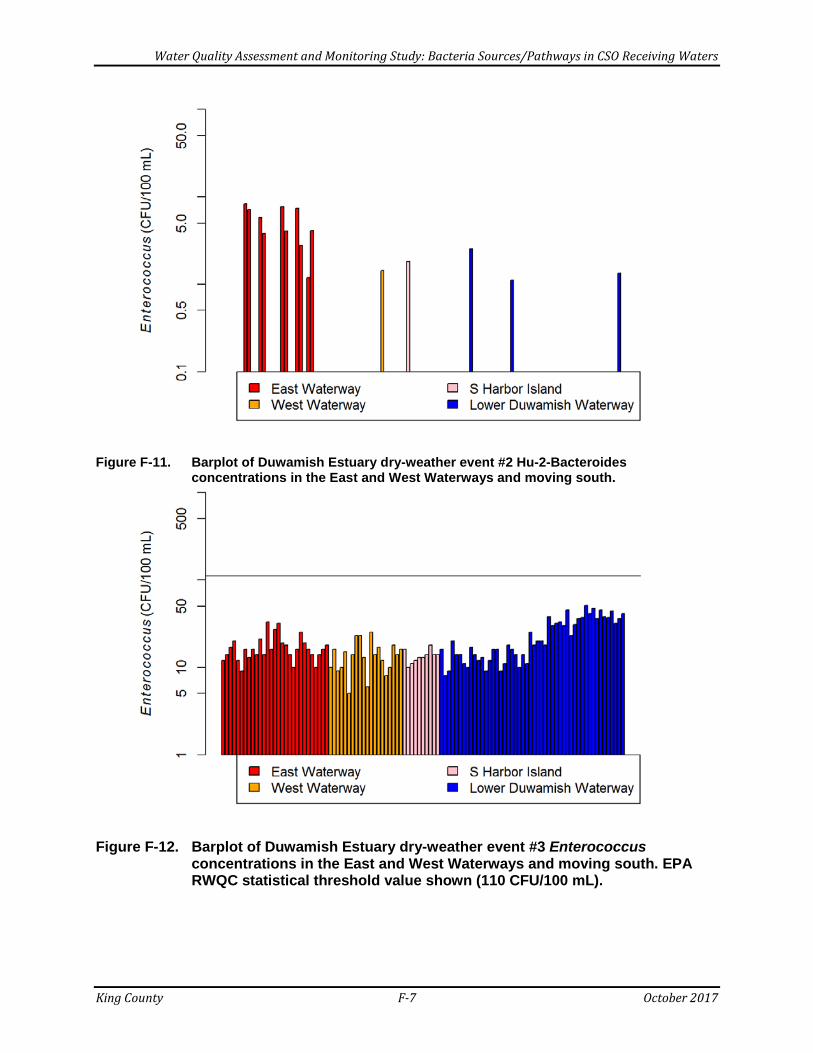
Water Quality Assessment and Monitoring Study: Bacteria Sources/Pathways in CSO Receiving Waters
King County F-7 October 2017
Figure F-11. Barplot of Duwamish Estuary dry-weather event #2 Hu-2-Bacteroides
concentrations in the East and West Waterways and moving south.
Figure F-12. Barplot of Duwamish Estuary dry-weather event #3 Enterococcus
concentrations in the East and West Waterways and moving south. EPA RWQC statistical threshold value shown (110 CFU/100 mL).

Water Quality Assessment and Monitoring Study: Bacteria Sources/Pathways in CSO Receiving Waters
King County F-8 October 2017
Figure F-13. Barplot of Duwamish Estuary dry-weather event #3 Hu-2-Bacteroides
concentrations in the East and West Waterways and moving south.
Figure F-14. Barplot of Duwamish Estuary wet-weather event #1 Enterococcus concentrations
in the East and West Waterways and moving south. EPA RWQC statistical threshold value shown (110 CFU/100 mL).
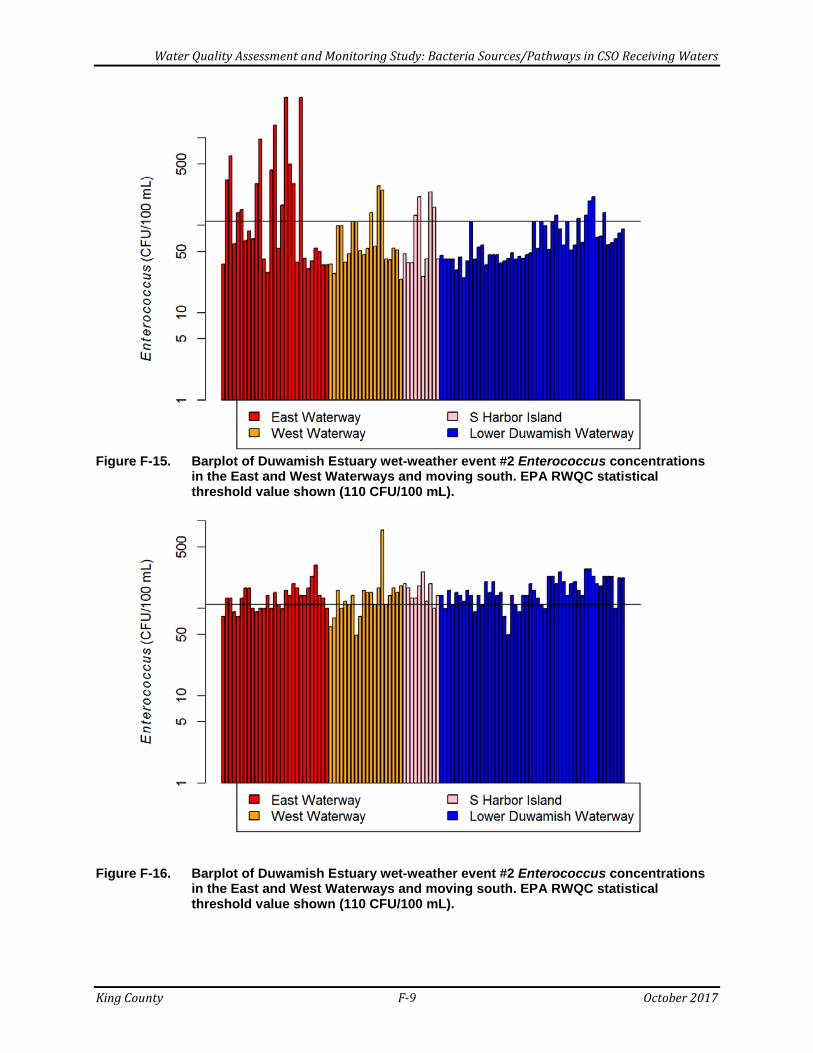
Water Quality Assessment and Monitoring Study: Bacteria Sources/Pathways in CSO Receiving Waters
King County F-9 October 2017
Figure F-15. Barplot of Duwamish Estuary wet-weather event #2 Enterococcus concentrations
in the East and West Waterways and moving south. EPA RWQC statistical threshold value shown (110 CFU/100 mL).
Figure F-16. Barplot of Duwamish Estuary wet-weather event #2 Enterococcus concentrations
in the East and West Waterways and moving south. EPA RWQC statistical threshold value shown (110 CFU/100 mL).
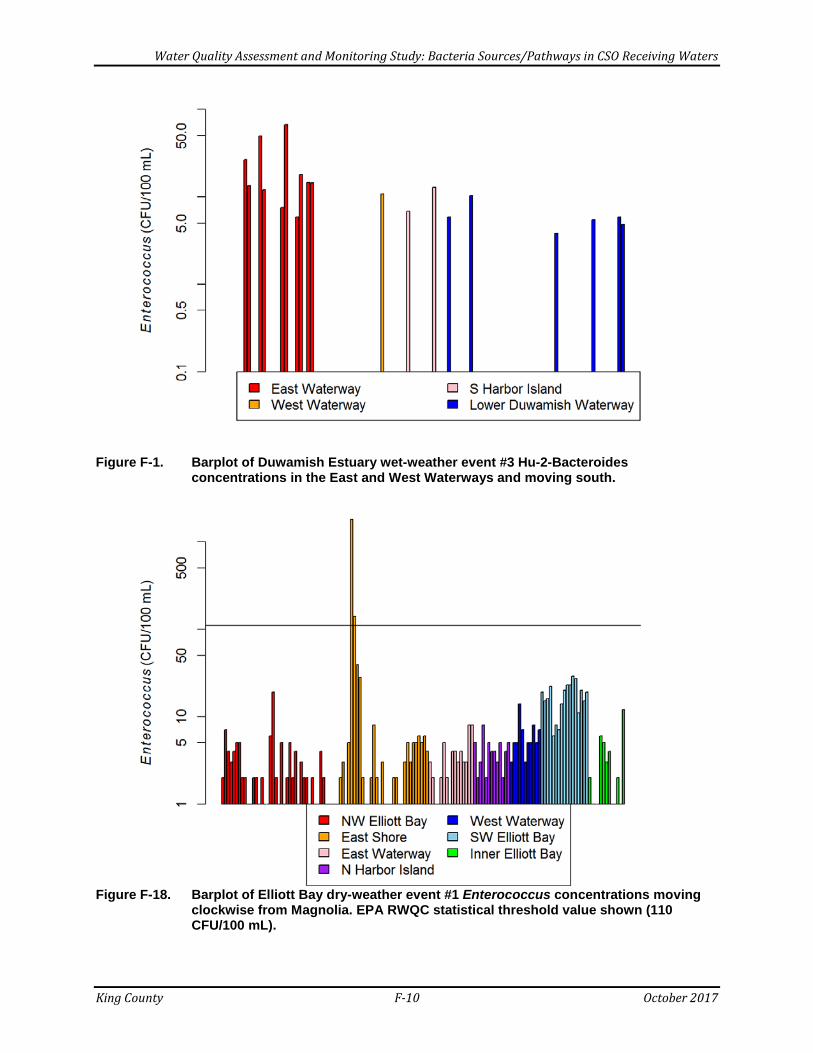
Water Quality Assessment and Monitoring Study: Bacteria Sources/Pathways in CSO Receiving Waters
King County F-10 October 2017
Figure F-1. Barplot of Duwamish Estuary wet-weather event #3 Hu-2-Bacteroides
concentrations in the East and West Waterways and moving south.
Figure F-18. Barplot of Elliott Bay dry-weather event #1 Enterococcus concentrations moving
clockwise from Magnolia. EPA RWQC statistical threshold value shown (110 CFU/100 mL).

Water Quality Assessment and Monitoring Study: Bacteria Sources/Pathways in CSO Receiving Waters
King County F-11 October 2017
Figure F-19. Barplot of Elliott Bay dry-weather event #2 Enterococcus concentrations moving
clockwise from Magnolia. EPA RWQC statistical threshold value shown (110 CFU/100 mL).
Figure F-20. Barplot of Elliott Bay dry-weather event #2 Hu-2-Bacteroides concentrations
moving clockwise from Magnolia.

Water Quality Assessment and Monitoring Study: Bacteria Sources/Pathways in CSO Receiving Waters
King County F-12 October 2017
Figure F-21. Barplot of Elliott Bay dry-weather event #3 Enterococcus concentrations moving
clockwise from Magnolia. EPA RWQC statistical threshold value shown (110 CFU/100 mL).
Figure F-22. Barplot of Elliott Bay dry-weather event #3 Hu-2-Bacteroides concentrations
moving clockwise from Magnolia.

Water Quality Assessment and Monitoring Study: Bacteria Sources/Pathways in CSO Receiving Waters
King County F-13 October 2017
Figure F-23. Barplot of Elliott Bay wet-weather event #1 Enterococcus concentrations moving
clockwise from Magnolia. EPA RWQC statistical threshold value shown (110 CFU/100 mL).
Figure F-24. Barplot of Elliott Bay wet-weather event #2 Enterococcus concentrations moving
clockwise from Magnolia. EPA RWQC statistical threshold value shown (110 CFU/100 mL).
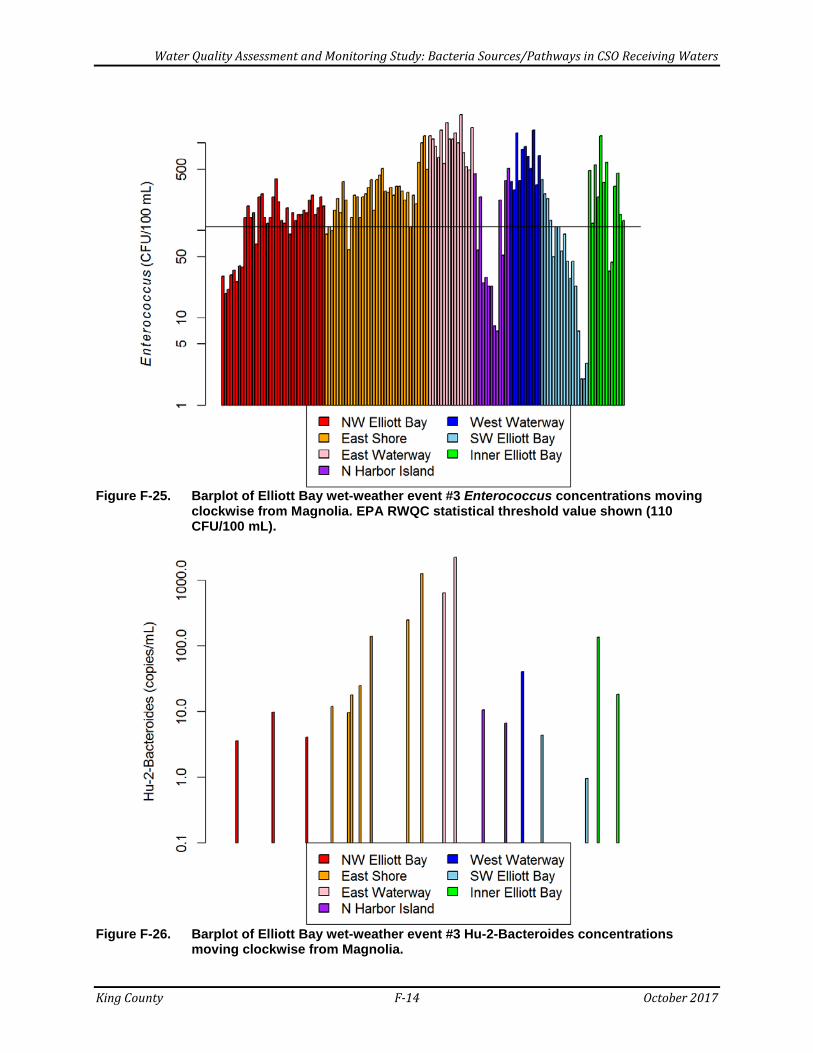
Water Quality Assessment and Monitoring Study: Bacteria Sources/Pathways in CSO Receiving Waters
King County F-14 October 2017
Figure F-25. Barplot of Elliott Bay wet-weather event #3 Enterococcus concentrations moving
clockwise from Magnolia. EPA RWQC statistical threshold value shown (110 CFU/100 mL).
Figure F-26. Barplot of Elliott Bay wet-weather event #3 Hu-2-Bacteroides concentrations
moving clockwise from Magnolia.

Water Quality Assessment and Monitoring Study: Bacteria Sources/Pathways in CSO Receiving Waters
King County G-1 October 2017
APPENDIX G: MAJOR STORMWATER BASINS

Water Quality Assessment and Monitoring Study: Bacteria Sources/Pathways in CSO Receiving Waters
King County G-2 October 2017
Figure G-1. Major stormwater basins that may contribute baseflow to Lake Union/Ship Canal.

Water Quality Assessment and Monitoring Study: Bacteria Sources/Pathways in CSO Receiving Waters
King County G-3 October 2017
Figure G-2. Major stormwater basins that may contribute baseflow to the Duwamish Estuary.
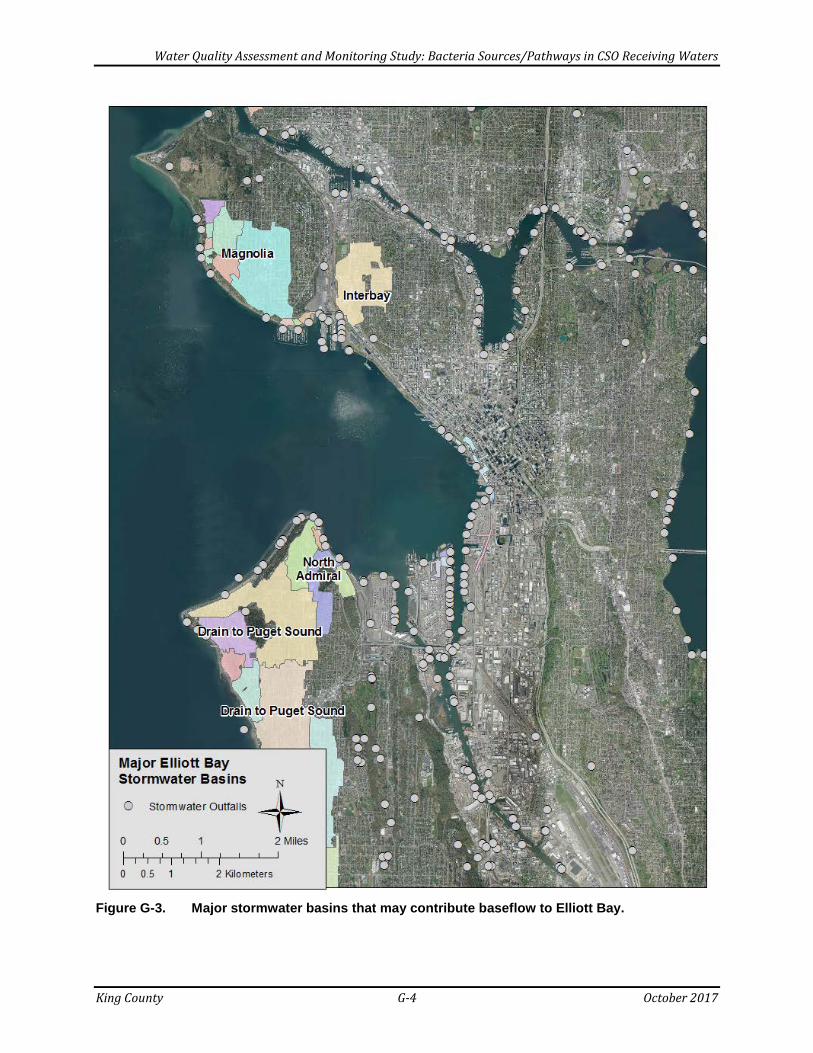
Water Quality Assessment and Monitoring Study: Bacteria Sources/Pathways in CSO Receiving Waters
King County G-4 October 2017
Figure G-3. Major stormwater basins that may contribute baseflow to Elliott Bay.

Water Quality Assessment and Monitoring Study: Bacteria Sources/Pathways in CSO Receiving Waters
King County H-1 October 2017
APPENDIX H: BACTERIA SURVIVORSHIP IN SURFACE WATERS
Water Quality Assessment and Monitoring Study: Bacteria Sources/Pathways in CSO Receiving Waters
King County H-2 October 2017
Solar Radiation (Insolation) Enteric bacteria are affected by both ultraviolet (UV) and visible light, which cause photo-oxidation damage and limit colony-forming ability. The UV-B (280-320 nm) wavelength range is the most bactericidal, causing photobiological DNA damage (Sinton et al., 1994; Rozen and Belkin, 2001). The presence of oxygen tends to exacerbate photo-oxidation inactivation. Solar radiation is a key factor influencing mortality of bacteria in seawater and freshwater (Gameson and Gould, 1975; Alkan et al., 1995; McCambridge and McMeekin, 1981; Davies-Colley et al., 1994; Noble et al., 2004; Rozen and Belkin, 2001; Sinton et al., 1994, 1997, & 2002; Whitman et al., 2004). Alkan et al. (1995) found that the time required for a 90% reduction in enterococci ranged from 0.5 to 9.8 hours, with mean values ranging from 1.14 to 1.39 hours at a 95 percent confidence level. The range of values was dependent on the environmental conditions present such as solar radiation, adsorption to sediments particles, sedimentation, physicochemical factors, nutrients, temperature and biological factors. The impact of sunlight on bacteria mortality was more significant than temperature when both are present. Whitman et al. (2004) performed an in situ study of E. coli concentrations at Lake Michigan beach in Chicago; the authors found that E. coli counts decreased exponentially with day length and exposure to insolation, but on cloudy days, E. coli decay was diminished. Additionally, nighttime population replenishment was observed. Due to the influence of insolation and the increasing solar radiation throughout the day, it is therefore likely that the timing of sampling influenced the concentration of bacteria observed. Noble et al. (2004) found that exposure to sunlight caused an order of magnitude increase in the decay rates of E. coli and Enterococcus and that with increasing sunlight intensity, there is an increase in the decay rate. They found a 90 percent decrease in freshwater E. coli levels occurred after 2 days when exposed to low solar radiation in southern California (peak = 300 W m-2). Enterococcus populations in saltwater and freshwater exposed to low solar radiance were found to have a 90 percent decrease after 0.4 days in both cases. At a peak radiation of 1200 W m-2, the authors found a 90 percent decrease of freshwater E. coli occurred in 0.7 days and a 90 percent decrease of freshwater and saltwater Enterococcus after less than 0.4 days (8.5 and 9.0 hours, respectively). In Seattle, hourly-averaged solar radiance in summer peaks at 700 W m-2, and from November to January, hourly average solar radiance peaks at less than 200 W m-2 (University of Oregon Solar Radiation Monitoring Laboratory). Studies of the effect of sunlight on microbial markers have reached contradictory conclusions (Walters and Field, 2009; Walters et al., 2009; Bae and Wuertz, 2009). Green et al. (2011) found that exposing samples to light decreased Bacteroides marker persistence. The authors also found that under sunlight conditions enterococci and enterococci markers decayed at differing rates with the former decaying more quickly than the latter. Dick et al. (2010) found a decay of qPCR signal for three Bacteroidales markers (AllBac, HF183 and BacHum) in freshwater mesocosms inoculated with sewage, but

Water Quality Assessment and Monitoring Study: Bacteria Sources/Pathways in CSO Receiving Waters
King County H-3 October 2017
exposure to sunlight did not cause a significant difference in decay rates. Under sunlight conditions, however, HF183 decayed at a greater rate than E. coli. Salinity At high salinities, enteric bacteria are subject to osmotic upshock, where salt concentrations are greater outside than within the organism. The osmoregulatory capacity to overcome this barrier determines the survivorship of enteric bacteria. Carlucci and Pramer (1960a), Anderson et al. (1979) Sinton et al. (2002), Alkan et al. (2005), and Anderson et al. (2005) have found a gradient in bacteria survivorship and salinity where survivorship increases with decreasing salinity. Enterococcus spp. have been shown to have greater persistence than E. coli under saline and high insolation conditions (Sinton et al., 1994; Alkan et al., 1995; Rozen and Belkin, 2001; Sinton et al., 2002). Thus, Enterococcus is a better indicator of human health risk than E. coli in marine and brackish waters. For both fecal indicators, organic content has been positively correlated with survivorship in saline conditions (Rozen and Belkin, 2001). Green et al. (2011) found that, unlike indicator bacteria, Bacteroides markers may persist longer in marine water than freshwater; the authors, however, attributed the difference to predator populations. Similarly, Okabe et al. (2007) found higher persistence of Bacteroides markers with increasing salinity, and this relationship was also attributed to the lack of or decreased activity of grazers with increased salinity. Temperature While enteric bacteria thrive inside the warm intestines of animals, the optimal temperature for survival is not necessarily the same as the one for growth. Bacteria have typically been found to persist longer at lower temperatures (Carlucci and Pramer, 1960a; Rozen and Belkin, 2001; An et al., 2002; Noble et al., 2004). Noble et al. (2004) suggest that the decreased survivorship with increased temperatures may be due to a corresponding increase in predator activity. Korhonen and Martikainen (1991) demonstrated that, in the absence of other microflora (grazers and other bacteria), a direct effect of temperature on survival could not be detected. A strong effect of temperature was found for the HF183 marker, which persisted for up to 24 days at 4 and 12 °C and for up to 8 days at 28 °C in fresh, unfiltered river water when measured by qPCR (Seurinck et al., 2005). The period for a 99 percent decrease of HF183 was considerably shorter in another study that found a persistence of 2.5 days at 15°C and 2.2 days at 28°C (Dick et al., 2010). Both fecal indicator bacteria and Bacteroides markers persist for greater periods at lower temperatures (Okabe et al., 2007; Dick et al., 2010). Predation The main predators of bacteria in marine and freshwater environments are protozoa (Rozen and Belkin, 2001). A reduction in E. coli was associated with increased protozoa population (Enzinger and Cooper, 1976). Carlucci and Pramer (1960b) have shown that bacteriophages were effective in reducing E. coli population sizes under nutrient-rich

Water Quality Assessment and Monitoring Study: Bacteria Sources/Pathways in CSO Receiving Waters
King County H-4 October 2017
conditions, suggesting a very minor role for bacteriophages, if any, under natural conditions Kreader (1998) investigated the persistence of Bacteroides distasonis in unfiltered and filtered Ohio River water to determine the effect of eukaryotic predators. Bacteroides distasonis persistence was inversely related to temperature, where B. distasonis DNA was detectable for up to 14, 5, and 2 days at 4, 14, and 24 °C, respectively (Kreader, 1998). Absence of eukaryotic predators extended persistence at 24 °C by more than a week, indicating that grazing by bacterivorous protozoa is also an important mechanism influencing survival (Kreader, 1998). Dick et al. (2010) found longer persistence of three Bacteroiales markers (AllBac, HF183, and BacHum) with reduced predation. Green et al. (2011) and Okabe et al. (2007) believe that the increased persistence of Bacteroides markers with increased salinity was due to the decrease in conditions favorable to predators. Other Factors Algal toxins, antibiotics, pH, and dissolved oxygen concentrations may have relatively minor influences on the survivorship of enteric bacteria in marine and freshwater (An et al., 2002; Auer and Nihaus, 1993; Rozen and Belkin, 2001; Solic and Krstulovic, 1992). Carlucci and Pramer (1960a) determined that acidic conditions (pH=5) were the most favorable for E. coli survival in both seawater and NaCl solutions, and sensitivity increased with the increase in pH. Balleste and Blanch (2010) found that Bacteroides spp. were more affected by dissolved oxygen concentrations than temperature or grazing predators. The other factors have not yet been thoroughly evaluated. References Anderson, I.C., M.W. Rhodes, and H.I. Kator. 1979. Sublethal stress in Escherichia coli: a
function of salinity. Applied and Environmental Microbiology 38: 1147-1152 Anderson, K.L., J.E. Whitlock, and V.J. Harwood. 2005. Persistence and Differential Survival
of Fecal Indicator Bacteria in Subtropical Waters and Sediments. Applied and Environmental Microbiology 71:3041-3048.
Ahmed, W, R. Yusuf, I. Hasan, A Goonetilleke, and T Gardner. 2010. Quantitative PCR assay
of sewage-associated Bacteroides markers to assess sewage pollutionin an urban lake in Dhaka, Bangladesh. Canadian Journal of Microbiology 56: 838-845.
Alkan, U., D.J. Elliott, and L.M. Evison. 1995. Survival of enteric bacteria in relation to
simulated solar radiation and other environmental factors in marine waters. Water Research 29: 2071-2081.
Auer, M.T,. and S.L. Niehaus. 1993. Modeling fecal coliform bacteria-field and laboratory
determination of loss kinetics. Water Research 27: 693-701

Water Quality Assessment and Monitoring Study: Bacteria Sources/Pathways in CSO Receiving Waters
King County H-5 October 2017
Bae, S., and S. Wuertz. 2009. Rapid decay of host-specific fecal Bacteroidales cells in seawater as measured by quantitative PCR with propidium monoazide. Water Research 43: 4850–4859.
Balleste E., and A.R. Blanch. 2010. Persistance of Bacteroides species populations in a river
as measure by molecular and culture techniques. Applied and Environmental Microbiology 76: 7608-7616
Balleste E., X. Bonjoch, L.A .Belanche, and A.R. Blanch. 2010. Molecular indicators used in
the development of predictive models for microbial source tracking. Applied and Environmental Microbiology 76: 1789–1795.
Boehm, A.B., L.C. Van De Werfhorst, J..F Griffith, P.A. Holden, J.A. Jay, O.C. Shanks, D. Wang,
and S.B. Weisberg. 2013. Performance of forty-one microbial source tracking methods: a twenty-seven lab evaluation study. Water Research 47: 6812-6828.
Burton, G.A., D. Gunnison, and G.R. Lanza. 1987. Survival of pathogenic bacteria in various
freshwater sediments. Applied and Environmental Microbiology 53:633-638. Carlucci, A.F., and D. Pramer. 1960. An evaluation of factors effecting the survival of
Escherichia coli in seawater II: salinity, pH, and nutrients. Applied and Environmental Microbiology 8: 247-250.
Carlucci, A.F., and D. Pramer. 1960. An evaluation of factors effecting the survival of
Escherichia coli in seawater IV: Bacteriophages. Applied and Environmental Microbiology 8: 254-256.
Davies-Colley, R.J., R.G. Bel, and A.M. Donnison. 1994. Sunlight inactivation of Enterococci
and fecal coliforms in sewage effluent diluted in seawater. Applied and Environmental Microbiology 60: 2049-2058.
Dick, L.K., E.A. Stelzer, E.E. Bertke, D.L. Fong, and D.M. Stoeckel. 2010. Relative decay of
Bacteroidales microbial source tracking markers and cultivated Escherichia coli in freshwater microcosms. Applied and Environmental Microbiology 76: 3255-3262
Enzinger, R.M.,, and R.C. Cooper. 1976. Role of bacteria and protozoa in the removal of
Escherichia coli from estuarine waters. Applied and Environmental Microbiology 31: 758-763.
Gameson, A.L.H., and D.J. Gould. 1975. Effects of solar radiation on the mortality of some
terrestrial bacteria in sea water. In “Discharge of Sewage from Sea Outfalls” ed. ALH Gameson. pp. 209–19. Oxford and New York: Pergamon Press.
Green, H.C., O.C. Shanks, M. Sivaganesan, R.A. Haugland, and K.G. Field. 2011. Differential
decay of human faecal Bacteroides in marine and freshwater. Environmental Microbiology 13: 3325-3249.
Water Quality Assessment and Monitoring Study: Bacteria Sources/Pathways in CSO Receiving Waters
King County H-6 October 2017
Harwood, V.J., C. Staley, B.D. Badgley, K. Borges, and A. Korajkic. 2014. Microbial source
tracking markers for detection of fecal contamination in environmental waters: relationships between pathogens and human health outcomes. FEMS Microbiology Review 38: 1-40.
Korhonen, L.K., and P.J. Martikainen. 1991. Comparison of the survival of Campylobacter
jejuni and Campylobacter coli in culturable form in surface water. Canadian Journal of Microbiology 37: 530-533.
Kreader, C.A 1998. Persistence of PCR-detectable Bacteroides distasonis from human feces in river water. Applied and Environmental Microbiology 64: 4103–4105.
McCambridge, J., and T.A. McMeekin. 1981. Effect of solar radiation and predacious
microorganisms on survival of fecal and other bacteria. Applied and Environmental Microbiology 41: 1083-1087.
Noble, R.T., I.M. Lee, and K.C. Schiff. 2004. Inactivation of indicator micro-organisms from
various sources of faecal contamination in seawater and freshwater. Journal of Applied Microbiology 96: 464-472.
Okabe S., N. Okayama, O. Savichtcheva, and T. Ito. 2007. Quantification of host-specific
Bacteroides-Prevotella 16S rRNA genetic markers for assessment of fecal pollution in freshwater. Applied Microbiology Biotechnology 74: 890–901.
Rozen, Y., and S. Belkin. 2001. Survival of enteric bacteria in seawater. FEMS Microbiology
Reviews 25: 513-529. Seurinck S., T. Defoirdt, W. Verstraete, and S.D. Siciliano. 2005. Detection and quantification
of the human-specific HF183 Bacteroides 16S rRNA genetic marker with real-time PCR for assessment of human faecal pollution in freshwater. Environmental Microbiology 7: 249–259.
Sinton, L.W., R.J. Davies-Colley, and R.G. Bell. 1994. Inactivation of enterococci and fecal
coliforms from sewage and meatworks effluents in seawater chambers. Applied and Environmental Microbiology 60: 2040-2048.
Sinton, L.W., R.K. Finlay, and P.A. Lynch. 1999. Sunlight inactivation of fecal bacteriophages
and bacteria in sewage-polluted seawater. Applied and Environmental Microbiology 65: 3605-3613.
Sinton, L.W., C.H. Hall, P.A. Lynch, and R.J. Davies-Colley. 2002. Sunlight inactivation of fecal
indicator bacteria and bacteriophages from waste stabilization pond effluent in fresh and saline waters. Applied and Environmental Microbiology 68: 1122-1131.

Water Quality Assessment and Monitoring Study: Bacteria Sources/Pathways in CSO Receiving Waters
King County H-7 October 2017
Solic, M., and N. Krstulovic. 1992. Separate and combined effects of solar radiation, temperature, salinity, and pH on the survival of faecal coliforms in seawater. Marine Pollution Bulletin 24: 411-416.
Walters, S.P., and K. Field. 2009. Survival and persistence of human and ruminant-specific
faecal Bacteroidales in freshwater microcosms. Environmental Microbiology 11: 1410– 1421.
Walters, S.P., K.M. Yamahara, and A.B. Boehm. 2009. Persistence of nucleic acid markers of
health-relevant organisms in seawater microcosms: implications for their use in assessing risk in recreational waters. Water Research 43: 4929– 4939.
Whitman, R.L., M.B. Nevers, G.C. Korinek, and M.N. Byappanahalli. 2004. Solar and temporal
effects on Escherichia coli concentration at a Lake Michigan swimming beach. Applied and Environmental Microbiology 70: 4276-4285.