Final Inventory and Assessment of Current and Historic...
93
Final Inventory and Assessment of Current and Historic Beach Feeding Sources/Erosion and Accretion Areas for the Marine Shorelines of Water Resource Inventory Areas 8 & 9 Prepared for: WRIA 9 Steering Committee Funded by: King County Department of Natural Resources and Parks and a King Conservation District Grant for the WRIA 9 Forum of Local Governments December 2005
Transcript of Final Inventory and Assessment of Current and Historic...

Final Inventory and Assessment of Current and Historic Beach Feeding Sources/Erosion and Accretion Areas for the Marine Shorelines of Water Resource Inventory Areas 8 & 9
Prepared for:
WRIA 9 Steering Committee
Funded by: King County Department of Natural Resources and Parks and a King Conservation District Grant for the WRIA 9 Forum of Local Governments
December 2005

Final WRIA 8 &9 Beach Feeding Sources and Accretion areas: Current and Historical Conditions Report COASTAL GEOLOGIC SERVICES, INC.
Acknowledgements Several people contributed to the completion of this study including:
King County Department of Natural Resources and Parks archives (who lent us the air photos), Walker and Associates, Hugh Shipman with Department of Ecology, UW special collections, and Matt Chase and Bill Schenken at CGS.
Preferred Citation Johannessen, J.W., MacLennan, A., and McBride, A, 2005. Inventory and Assessment of Current and Historic Beach Feeding Sources/Erosion and Accretion Areas for the Marine Shorelines of Water Resource Inventory Areas 8 & 9, Prepared by Coastal Geologic Services, Prepared for King County Department of Natural Resources and Parks, Seattle, WA.
Author Contact Information Coastal Geologic Services, Inc. 701 Wilson Avenue Bellingham, WA 98225 [email protected] www.coastalgeo.com 360 647-1845 (phone) 360 671-6654 (fax)
Cover Photograph Credits Southside of Burton Head, Vashon Island, Dockton Drydock, 1892: Photo by Oliver S. Van Olinda. University of Washington, Special Collections Libraries, Negative no. 19278. Southwest Vashon Island, CGS field photo, 2004

Final WRIA 8 &9 Beach Feeding Sources and Accretion areas: Current and Historical Conditions Report COASTAL GEOLOGIC SERVICES, INC.
i
EXECUTIVE SUMMARY This report was initiated by King County Department of Natural Resources and Parks in order to provide much needed data and analysis of the marine shoreline within Watershed Resource Inventory Areas (WRIA) 8 and 9. This study entailed field mapping to document the current geomorphic conditions within the study area, followed by research into the historic condition of all currently modified shores within this largely urban marine environment. Detailed mapping of Feeder Bluff and Accretion Shoreforms was carried out for both current and historic conditions at 1:24,000 scale throughout the approximately 120 lineal miles of the King County and southern Snohomish County study area. There is a data gap of detailed, primary, historic mapping information of erosional bluffs in the Puget Sound area. The most detailed primary data source is the topographic (T-sheet) maps produced in the late 1800s by government surveyors. However, when examined in detail, this map set only showed areas that were the most obviously erosional as such, and showed only limited lengths of bluffs as erosional. Also, the T-sheets were quite inconsistent from one sheet to the next in this regard, making their use further limited. Efforts to recreate historic bluff conditions in a large area that rely heavily on T-sheets and other existing map sets (which are all less informative) would not produce reliable results. Hence, the present study was initiated. Bluffs were present along the majority of the length of the King and southern Snohomish county shores. Beaches in the study area were composed of gravel and sand and were ubiquitous, whether at the toe of bluffs or along very low elevation backshores. The concept of a net shore-drift cell has been employed in coastal studies to represent a coastal sediment transport sector from a source area to the depositional area at the terminus of the drift cell. This study evaluated bluff and beach segments in detail and also in landscape context using drift cells as an analysis unit. Shore modifications such as bulkheads and fill have substantially changed WRIA 8 & 9 nearshore conditions and have impacted nearshore habitat
Methods Field mapping throughout the study area delineated the shore into one of six different alongshore segments: Feeder Bluff Exceptional, Feeder Bluff, Transport Zone, Modified, Modified-by the Burlington Northern Santa Fe Railroad (BNSF RR), and Accretion Shoreform (with limited No Appreciable Drift segments when outside a drift cell). Toe erosion and landsliding were mapped as ancillary data within/across these six different segments. Sources of significant freshwater input including seeps, springs, creeks and outfalls were also mapped and coded, and the approximate size of outfalls was enumerated. All features were mapped from a small boat at mid to high tide times with good visibility. The Feeder Bluff Exceptional (FBE) classification was applied to bluff segments that were eroding rapidly (Figure 1). The Feeder Bluff (FB) classification was used for areas that had substantial sediment input into the net shore-drift system (Figure 2). Feeder Bluff segments identified segments that had periodic sediment input with a longer recurrence interval as compared to Feeder Bluff Exceptional segments. Transport Zone segments represented areas that did not appear to be contributing appreciable amounts of sediment to the net shore-drift system, nor showed evidence of past long-term accretion. Transport zones were shore segments where net shore-drift sediment is merely transported alongshore (Figure 3). The Modified classification was used to designate areas that had been bulkheaded or otherwise altered to a state where its natural geomorphic character was largely concealed by the modification such that the bank no longer provided sediment input to the beach system (Figure 4). The Modified-by BNSF RR classification was used to designate areas that had been altered by the Burlington Northern Santa Fe railroad seawall specifically. The No Appreciable Drift classification was used in areas where there was no appreciable net volume of sediment being transported, following the methods development by Schwartz et al. (1991). The Accretion Shoreform (AS) classification was used to identify areas that were depositional in the past or present.

Final WRIA 8 &9 Beach Feeding Sources and Accretion areas: Current and Historical Conditions Report COASTAL GEOLOGIC SERVICES, INC.
ii
Historic conditions were classified as Feeder Bluff Exceptional, Feeder Bluff (two of the seven shoretypes used for the current conditions mapping), Potential Feeder Bluff, and Not Feeder Bluff (two additional shoretypes). Due to the limitations in the pre-1930s data, a complete mapping of historic shoretypes was not possible with accuracy even close to current conditions mapping. Therefore the current conditions mapping was used as a starting point for historic sediment source mapping. All areas characterized as Modified or Modified-by BNSF RR in the current conditions mapping were analyzed in detail to determine their historic character. All other current conditions segments mapped were assumed to be unchanged from the historic pre-development period. Classification of historic sediment sources in the study area was conducted by scoring each modified unit (or sub-unit) of shoreline from the CGS current conditions mapping using an index developed by CGS, which demanded investigation of reach topography, surface geology, known landslide history, landscape and net shore-drift context, historic topographic maps, and historic air photos (in stereo-pairs where available). The new index was termed the Historic Sediment Source Index or HSSI. Each unit was then scored using the index, which produced a value that conveyed the relative likelihood that the shore unit was a source of substantial littoral sediment: “Feeder Bluff”. Units with very low index scores were classified as “Not Feeder Bluffs”, which would correspond to historic Transport Zones. The heavily modified shores of Elliott Bay and Smith Cove were developed prior to much of the available mapping and presented a challenge as little data existed that would describe the pre-development geomorphic character. In Elliott Bay, additional supporting data were utilized. This included historic drawings and maps, text documents (reports and records), historic vertical air and ground photos, and engineering drawings. Historic Accretion Shoreform mapping was conducted using different methods, which consisted largely of traditional geomorphic air photo interpretation along with support from historic T-sheet maps, an interpretation of T-sheets based on surveyor notes (Collins and Sheikh 2005), and 1936-1948 vertical aerial photos. Geologic maps (1:100,000 and 1:24,000 where available), and topographic quadrangles (1:24,000) were used to corroborate interpretation of the T-sheets and aerial photos. Accretion Shoreforms were initially divided into two categories: 1) open beaches and 2) estuaries. Open beaches were primarily influenced by wave deposition, while estuarine beaches were influenced, to varying degrees, by current or historic fluvial deposition. Further delineation of these shoretypes was conducted based on pocket estuary landscape features inherited from the geologic history of the shore and smaller scale processes that influenced nearshore conditions. Estuarine Accretion Shoreforms were further divided into 4 different types, which included: stream mouths, delta lagoons, drowned channel lagoons, and longshore lagoons.
Current Conditions Results Results of the current conditions mapping will be valuable for a wide variety of applications, such as restoration and conservation planning for nearshore areas, modeling of biological or ecological processes and change over time, land use planning, and management of potential development. A total of 858 individual units alongshore were delineated which represented current conditions for the entire study area of WRIA 8 and 9. Mapping was performed at 1:24,000 scale, with average lengths on the order of 300-700 ft. The total length of modified shore was far greater than any other unit, representing 45.6% of the total study area length. In addition, the BNSF railway line and seawall north of the Shilshole was mapped separately. “Modified-by BNSF RR” was the dominant mapped feature of the WRIA 8 portion of the study area, representing an additional 13.4% of the entire study area shore. Cumulatively, modified shores (including those along Accretion Shoreforms (9.9% of the study area) and those caused by the BNSF railway) represent 69% of the study area shore length. Only 3 drift cells in the study area were unmodified.

Final WRIA 8 &9 Beach Feeding Sources and Accretion areas: Current and Historical Conditions Report COASTAL GEOLOGIC SERVICES, INC.
iii
Feeder Bluff Exceptional units (highest sediment input into the nearshore) represented 3.3% of the study area and were mapped in only 29 individual units in 10 drift cells under current conditions mapping. Feeder Bluff Exceptional units were located at the Magnolia Bluffs, north of Saltwater State Park, Maury Island, and southwest Vashon Island. Feeder Bluff units were mapped along 15.1% of the study area shore cumulatively, in 184 units. Twenty-two drift cells (of 61 total cells and NAD areas mapped) had no intact sediment sources, as they are now bulkheaded. These represent a substantial number of drift cells that could clearly be considered as not properly functioning. Feeder Bluffs were more prevalent along the shores of Vashon and Maury islands due to less frequent modifications. Transport zone units were mapped along 4.1% of the study area shore into 95 units. This shoretype was uncommon likely due to the overall sediment-starved nature of most drift cells (due to bulkheads). Accretion Shoreform units were typically shorter in length than all other shoretypes (except transport zones), as many of these features were at small stream mouths and a good number of individual accretion shores were divided into smaller units based on the general elevation of bulkheads present. Note that Accretion Shoreforms were the only shoretype mapped where modifications were present but since they did not affect the nature of the mapped feature they were mapped as an Accretion Shoreform, with the modification mapped as ancillary data. Large Accretion Shoreforms occurred at Point Wells, West Point, Alki Beach, Three Tree Point, and Point Heyer. Much more detail can be found in the drift cell summaries. Mapped recent landslides occurred most commonly along Vashon and Maury Islands and in several smaller areas on the mainland, such as Magnolia and north of Des Moines. Extensive bulkheading and fill along much of the mainland shore generally precluded recent slides. However, the cluster of moderate recent slides between Mukilteo and Picnic Point was within the BNSF railroad revetment area, indicating that bluffs remain unstable and are subject to mass wasting, even though the bluffs have been bulkheaded for approximately 110 years. Slides occasionally occurred at other bulkheaded areas also, with colluvium (slide debris) that extended over the bulkhead and onto the beach in some cases. Recent bluff toe erosion was mapped most frequently south of Normandy Park, north and south of West Point, in several clusters near Des Moines, and at the unstable slopes between Redondo and Dash Point. On the islands, recent toe erosion was fairly common on the west and east sides of Maury Island, and along southwest and northwest shores of Vashon Island.
Historic Conditions Results and Analysis Comparison of current conditions to historic conditions mapping revealed that widespread and far-reaching changes have occurred to coastal processes and the nearshore area throughout much of the study area. Historic analysis (combined with current conditions mapping) revealed that the most common shoretype mapped in pre-development conditions was Historic Feeder Bluff, which occurred along 35.3% of the 120-mile study area shore (Table 15b). Historic Feeder Bluff Exceptional was mapped along 15% of the shore, bringing the total Historic sediment sources to 50.3% of the shore, as compared to 18.4% in current conditions mapping. An additional 8.6% of shore was Potential Historic Feeder Bluff, but was not counted as Feeder Bluff/sediment source areas due to the ambiguity of data for these units. When comparing current to historic sediment sources there was a 63.4% loss for the entire study area, leaving only 36.6% of the historic sediment sources currently intact (not including Potential Feeder Bluffs). Historic Accretion Shoreform mapping was performed independently from the HSSI analysis of modified units. The entire shore of the study area was examined for mapping of Historic Accretion Shoreforms using the best historic sources. Historic Accretion Shoreforms were mapped along 33.2% of the shore-equivalent length. Due to the different methods, some overlap of the Historic Accretion shoreforms and other units (mapped in current conditions work) occurred. Almost 40 miles of the shore was mapped as Historic Accretion Shoreform, which represented pre-

Final WRIA 8 &9 Beach Feeding Sources and Accretion areas: Current and Historical Conditions Report COASTAL GEOLOGIC SERVICES, INC.
iv
development conditions; far more than the approximately 22 miles mapped during current conditions fieldwork. Detailed analysis and description of Historic Accretion Shoreforms is not included here due to the quantity and complexity of these features. The most frequently occurring Historic Accretion Shoreforms were stream mouths, longshore lagoons, and depositional open beaches. These features were most common at drift cell termini, but also occurred frequently within drift cells, usually where a change in shore orientation occurred. Further work should be carried out on evaluating the distribution of Historic Accretion Shoreforms.
Restoration and Conservation Prioritization
Following the completion of current and historic conditions mapping a study area wide prioritization of all potential restoration and conservation sites was performed at landscape and drift cell scales. In each case historic (modified) and current Feeder Bluff and Feeder Bluff Exceptional unit HSSI scores were used to determine the relative value of each segment as a source of beach sediment. Drift cells were ranked by calculating the percent of intact sediment sources (relative to historic conditions) in the drift cell, and then weighting that number by the score(s) of the individual current and historic sediment source units that make up that drift cell. This prioritization was solely based on the geomorphology and geology of the study area. This report did not evaluate biological or habitat values, such that the data produced in this report may be of higher value when incorporated with biological data. The Historic Feeder Bluff units of the highest priority for restoration were located throughout the study area. Analysis of the top 25 units reveal that the highest rated bluff restoration segments were most abundant in the Northern Railroad sub-area, where the BNSF railway impedes the influx of valuable beach sediment from upland bluffs. Additional clusters of high priority bluff restoration sites were found at Magnolia Bluffs, the shore between Normandy Park and Des Moines, and at the entrance to Quartermaster Harbor. Several shorter reaches of priority restoration bluff were located along the high bluff shore of east Vashon Island. Results indicate that drift cells of the highest priority for restoration were found along the entire Northern Railroad and Shilshole sub-areas. Additional drift cells of the highest priority include cell KI-7-2, located on the north side of Three Tree Point and cells KI-13-17 and KI-13-18 in Quartermaster Harbor on the north side of the Burton Peninsula. Due to the extensive amount of modification in WRIA 8 and northern Seattle (and lack of conservation opportunities), the northern most conservation priority bluff unit was located just north of West Point. The Feeder Bluff segments of the highest priority for conservation were located in southern Quartermaster Harbor, southeast Vashon Island, Federal Way, and Magnolia. The second prioritization approach compared HSSI unit scores within individual drift cells and listed the top three highest scoring units. This method of examining restoration and conservation potential should be valuable for prioritizing restoration or protection in drift cells where sediment sources are deemed critical locally, without relying on the total potential yield of particular bluff segments area-wide. This may be the case where Accretion Shoreforms or pocket estuaries are lost or threatened due to sediment supply in more protected environments. These bluff units represent the greatest potential sediment yield within each drift cell and would therefore constitute the first candidates for recreating or conserving sediment supply in specific cells. The third prioritization approach summarized and scored data for entire drift cells and compared the scores across the study area. Results of the restoration prioritization indicate that drift cells of the highest priority for restoration were found along the entire Northern Railroad and Shilshole sub-areas. Additional drift cells of the highest restoration priority include cell KI-7-2, located on the north side of Three Tree Point and cells KI-13-17 and KI-13-18 in Quartermaster Harbor on the north side of the Burton Peninsula. Drift cells of high restoration priority include the longest cell in the study area, cell KI-5-1 from Burien to Duwamish Head (that is extensively bulkheaded), and cell KI-13-12, which is located along the northeastern shore of Quartermaster Harbor, just south of the

Final WRIA 8 &9 Beach Feeding Sources and Accretion areas: Current and Historical Conditions Report COASTAL GEOLOGIC SERVICES, INC.
v
Portage. The results of the conservation prioritization of drift cells show that due to pervasive modifications, largely from the BNSF railway, cells with conservation potential were primarily located in WRIA 9. Drift cells with the highest conservation prioritization include cells KI-7-2 located on the north side of Three Tree Point, and KI-13-18 located on the north side of the Burton Peninsula in Quartermaster Harbor. Other high priority drift cells for conservation include southwest Salmon Bay, east Vashon Island (cell 13-12), and the Burien to Duwamish Head cell. As unmodified bluffs in the study area continue to gradually recede through erosion and landsliding, there will likely be a continued desire for landowners to build bulkheads. If carried out, this would lead to further sediment impoundment and further reduction of the natural sediment input to the nearshore system, as well as site-specific impacts to the beach. The possibility of further decreasing sediment supply volumes for net shore-drift cells, along with the lag time of impacts from past modifications, would likely lead to substantially-increased, negative, cumulative impacts to nearshore habitats. Restoration and conservation efforts should proceed with this in mind.
Final WRIA 8 &9 Beach Feeding Sources and Accretion areas: Current and Historical Conditions Report COASTAL GEOLOGIC SERVICES, INC.
vi
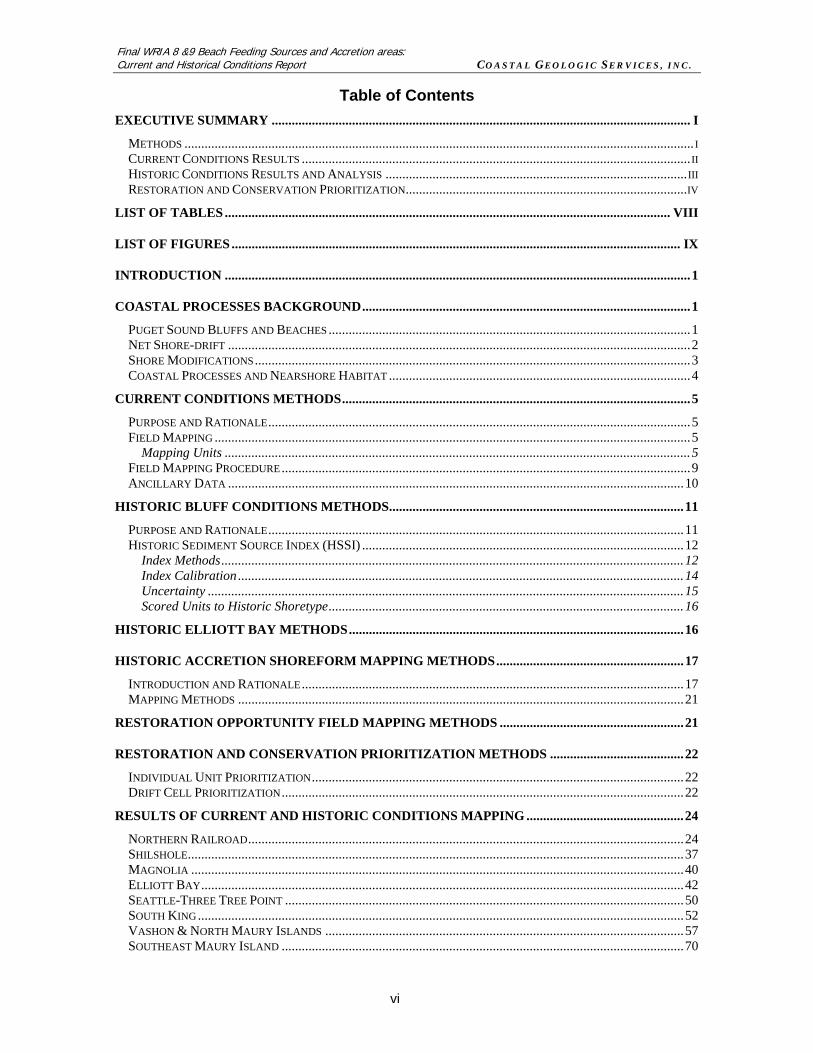
Table of Contents EXECUTIVE SUMMARY ............................................................................................................................. I
METHODS ........................................................................................................................................................ I CURRENT CONDITIONS RESULTS ....................................................................................................................II HISTORIC CONDITIONS RESULTS AND ANALYSIS ..........................................................................................III RESTORATION AND CONSERVATION PRIORITIZATION....................................................................................IV
LIST OF TABLES ..................................................................................................................................... VIII
LIST OF FIGURES ...................................................................................................................................... IX
INTRODUCTION ...........................................................................................................................................1
COASTAL PROCESSES BACKGROUND..................................................................................................1 PUGET SOUND BLUFFS AND BEACHES ............................................................................................................1 NET SHORE-DRIFT ..........................................................................................................................................2 SHORE MODIFICATIONS..................................................................................................................................3 COASTAL PROCESSES AND NEARSHORE HABITAT ..........................................................................................4
CURRENT CONDITIONS METHODS........................................................................................................5 PURPOSE AND RATIONALE..............................................................................................................................5 FIELD MAPPING ..............................................................................................................................................5
Mapping Units ...........................................................................................................................................5 FIELD MAPPING PROCEDURE..........................................................................................................................9 ANCILLARY DATA ........................................................................................................................................10
HISTORIC BLUFF CONDITIONS METHODS........................................................................................11 PURPOSE AND RATIONALE............................................................................................................................11 HISTORIC SEDIMENT SOURCE INDEX (HSSI) ................................................................................................12
Index Methods..........................................................................................................................................12 Index Calibration .....................................................................................................................................14 Uncertainty ..............................................................................................................................................15 Scored Units to Historic Shoretype..........................................................................................................16
HISTORIC ELLIOTT BAY METHODS....................................................................................................16
HISTORIC ACCRETION SHOREFORM MAPPING METHODS........................................................17 INTRODUCTION AND RATIONALE..................................................................................................................17 MAPPING METHODS .....................................................................................................................................21
RESTORATION OPPORTUNITY FIELD MAPPING METHODS .......................................................21
RESTORATION AND CONSERVATION PRIORITIZATION METHODS ........................................22 INDIVIDUAL UNIT PRIORITIZATION...............................................................................................................22 DRIFT CELL PRIORITIZATION........................................................................................................................22
RESULTS OF CURRENT AND HISTORIC CONDITIONS MAPPING ...............................................24 NORTHERN RAILROAD..................................................................................................................................24 SHILSHOLE....................................................................................................................................................37 MAGNOLIA ...................................................................................................................................................40 ELLIOTT BAY................................................................................................................................................42 SEATTLE-THREE TREE POINT .......................................................................................................................50 SOUTH KING.................................................................................................................................................52 VASHON & NORTH MAURY ISLANDS ...........................................................................................................57 SOUTHEAST MAURY ISLAND ........................................................................................................................70
Final WRIA 8 &9 Beach Feeding Sources and Accretion areas: Current and Historical Conditions Report COASTAL GEOLOGIC SERVICES, INC.
vii
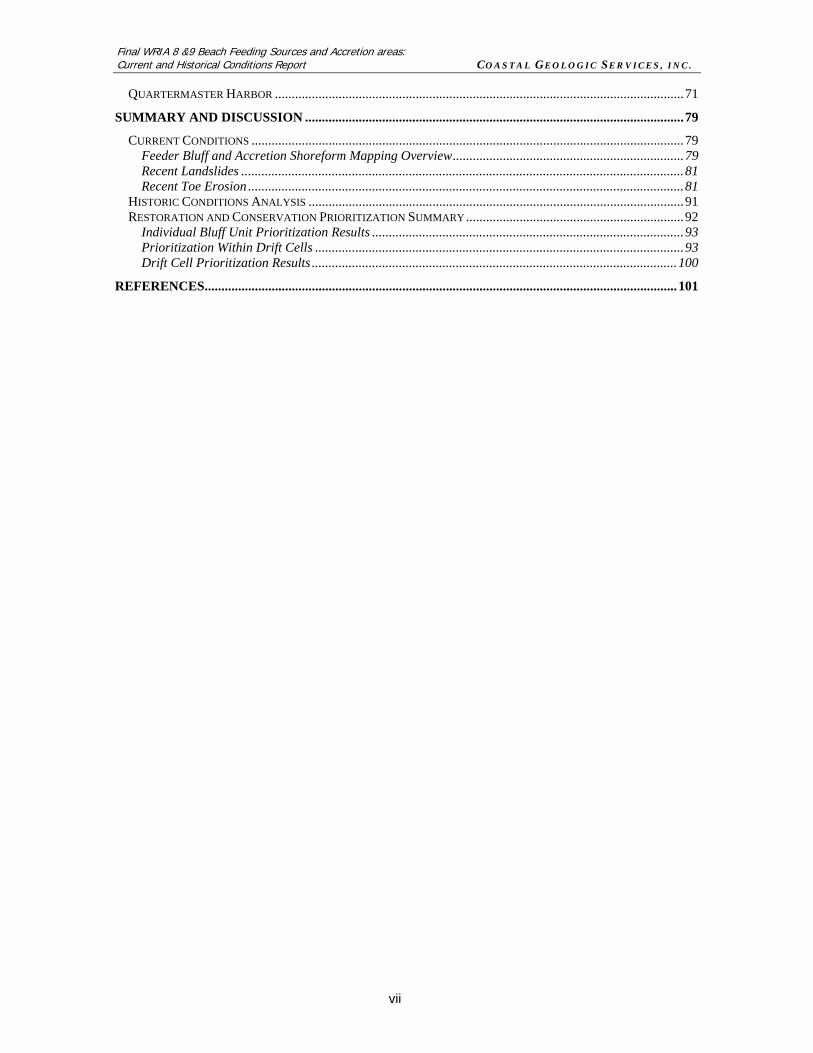
QUARTERMASTER HARBOR ..........................................................................................................................71 SUMMARY AND DISCUSSION .................................................................................................................79
CURRENT CONDITIONS .................................................................................................................................79 Feeder Bluff and Accretion Shoreform Mapping Overview.....................................................................79 Recent Landslides ....................................................................................................................................81 Recent Toe Erosion ..................................................................................................................................81
HISTORIC CONDITIONS ANALYSIS ................................................................................................................91 RESTORATION AND CONSERVATION PRIORITIZATION SUMMARY.................................................................92
Individual Bluff Unit Prioritization Results .............................................................................................93 Prioritization Within Drift Cells ..............................................................................................................93 Drift Cell Prioritization Results .............................................................................................................100
REFERENCES.............................................................................................................................................101

Final WRIA 8 &9 Beach Feeding Sources and Accretion areas: Current and Historical Conditions Report COASTAL GEOLOGIC SERVICES, INC.
viii
List of Tables Table 1. Field mapping criteria (adapted from Johannessen and Chase, 2005).................................8 Table 2. Accretion Shoreform categories and descriptions .................................................................9 Table 3. Available data for analysis of historic conditions in WRIA 8 and 9......................................13 Table 4. Historic Sediment Source Index score sheet.......................................................................14 Table 5. Historic shoretype delineations based on HSSI scores.......................................................16 Table 6a and 6b. Accretion Shoreform types for historic (pre-development) Accretion
Shoreforms (6a. simplified, 6b descriptive).. .......................................................................19 Table 7. CGS and Washington State Department of Ecology net-shore-drift (NSD) cell names
and description of locations.................................................................................................25 Table 8. CGS Current Conditions Field Mapping. .............................................................................26 Table 9. CGS Current Conditions Field Mapping. Summary of Accretion shoreform types..............27 Table 10. Predevelopment (historic) sediment sources relative to current conditions sorted by
drift cell. ...............................................................................................................................28 Table 11. Predevelopment conditions of driftcell are cumulative (modified+current)........................29 Table 12. Change in Accretion Shoreforms (AS) from historic to current conditions. .......................31 Table 13. Historic Accretion Shoreform (AS) types. Historic shoretypes. .........................................32 Table 14. Elliott Bay Historic Geomorphic Shoretypes; Not Feeder Bluff units are likely Historic
Transport Zones. .................................................................................................................44 Table 15a. CGS current conditions mapping summary for entire study area....................................80 Table 15b. CGS historic (pre-development) conditions mapping summary for entire study area.....91 Table 16. Restoration prioritization. ...................................................................................................94 Table 17. Conservation prioritization. ................................................................................................95 Table 18. Restoration prioritization listing top 3 scoring modified units in each drift cell. .................96 Table 19. Conservation prioritization listing top 3 scoring existing sediment sources in each drift
cell. ......................................................................................................................................97 Table 20. Restoration prioritization by drift cell, sorted by RP (restoration prioritization) score........98 Table 21. Conservation prioritization by drift cell, sorted by CP (conservation prioritization)
score....................................................................................................................................99

Final WRIA 8 &9 Beach Feeding Sources and Accretion areas: Current and Historical Conditions Report COASTAL GEOLOGIC SERVICES, INC.
ix
List of Figures Figure 1a. Magnolia Bluff FBE, photo by CGS ....................................................................................6 Figure 1b. Normandy Park FB, photo by CGS ....................................................................................6 Figure 1c. Transport zone, south of Sunset Beach, west Vashon Island. Note conifers and
mature vegetation, photo by CGS. ....................................................................................6 Figure 2a. Modified shore impeding erosion of uplands, photo by CGS. ............................................7 Figure 2b. Point Robinson, Accretion Shoreform, photo by CGS. ......................................................7 Figure 3. Historic sediment source index calibration scores; numbers indicate score, no value
on x-axis...........................................................................................................................15 Figure 4. Conceptual framework for geomorphic classification (McBride et al. 2005). .....................18 Figure 5. Habitat-forming, landscape processes impact habitats over varying rates and
spatial extents (McBride and Beamer 2004)....................................................................18 Figure 6. Estuary geomorphic type by tertiary diagram (McBride and Beamer 2005). .....................19 Figure 7. 1931 photo of bluff erosion in Northern Railroad subarea (exact location unknown).
University of Washington, Special Collections Libraries, Lee Picket, negative no. .........30 Figure 8. Edmonds Marina Accretion Shoreform in 1879 (T-sheet 1389b,US Coast and
Geodetic Survey). Purple line marks position of current shoreline (DNR 2001). ............33 Figure 9. Edmonds waterfront (~1900) showing backshore lagoonal marsh complex and fill
along railroad causeway. Camera copy of photo at Edmonds-South Snohomish County Historical Society. ................................................................................................33
Figure 10. Deer Creek landslide in Woodway, south of Edmonds. (USGS 1998). ...........................34 Figure 11. Ballard Beach with eroding bluffs in 1909. Museum of History and Industry
(MOHAI) photo no. 5246.2...............................................................................................35 Figure 12. 1959 Landslide displaced BNSF railway track, near Carkeek Park, MOHAI, photo
no. 1986.6591.1. ..............................................................................................................36 Figure 13. Golden Gardens beach with adjacent high gradient uplands, prior to grading and
fill (1910). MOHAI photo no. 1980.6880.235. ..................................................................37 Figure 14. Seaview Drive, Ballard. 1943. Built atop fill adjacent to Historic Feeder Bluff.
Seattle Municipal Archives...............................................................................................38 Figure 15. Historic mapping (1867) of Shilshole Marina depicting bluffs. Current shoreline in
purple (DNR 2001). (T-sheet 1064, US Coast and Geodetic Survey).............................38 Figure 16. Interior shore of Salmon Bay in 1971 shows lack of sediment sources and
presence of Accretion Shoreforms prior to modification (north side of Bay in foreground) and Accretion Shoreforms and sediment sources of KI-2-3 in background. MOHAI, photo no. 1933.10.10575. .............................................................39
Figure 17. Low bank shores of Salmon Bay in 1900. MOHAI, photo no. 1988.33.33. ......................39 Figure 18. Magnolia Bluffs, north of West Point, showing historic Feeder Bluffs in 1940.
MOHAI, photo no. 2002.48.823. ......................................................................................40 Figure 19. Magnolia Bluffs-north near Discovery Park (1913). MOHAI, photo no.
1983.10.7803.2. ...............................................................................................................42 Figure 20. Magnolia bluffs-south bluffs near Perkins Lane (1951), Seattle Municipal Archives. ......42 Figure 21. Slides at NE Duwamish head, 1902. By A. Curtis, UW Special Collections Library,
Negative no. A. Curtis 1300. ............................................................................................51 Figure 22. North Alki beach, slides in background, 1911. Seattle Municipal Archives......................51 Figure 23. Seawall construction at Alki, 1913. Seattle Municipal Archives. ......................................51 Figure 24. Seawall at bluff toe near Alki beach, 1913. Seattle Municipal Archives...........................51 Figure 25. Southern KI-5-1, Bluffs in background 1884. By Boyd and Braas. UW Special
Final WRIA 8 &9 Beach Feeding Sources and Accretion areas: Current and Historical Conditions Report COASTAL GEOLOGIC SERVICES, INC.
x
Collections Libraries, Negative no. UW18560. ................................................................52 Figure 26. Historic mapping (1877) of Des Moines Marina area showing Des Moines creek
mouth and marshlands. Current shoreline in purple (DNR, 2001). (T-sheet 1452b, US Coast and Geodetic Survey)......................................................................................54
Figure 27. Landslide near Lakota, just northeast of Dumas Bay, 3/1934. Seattle Municipal Archives. ..........................................................................................................................56
Figure 28. Vashon Heights (near current ferry terminal), 1912. King County Archives. ...................58 Figure 29. Tramp Harbor 1893, Portage in background. University of Washington Special
Collections Libraries, Negative no. UW18698. ................................................................62 Figure 30. 1906-1917. Colvos Wharf with bluffs in background. King County Archives. ..................68 Figure 31. Dockton, no date. UW Special Collections Libraries, Negative no. VAN198. ..................72 Figure 32. Mileta wharf, in eastern Quartermaster Harbor, looking north, no date. King County
Archives. ..........................................................................................................................73 Figure 33. Pre-development condition of the Raabs lagoon entrance (T-sheet 1452b, 1876-
77). ...................................................................................................................................74 Figure 34. Judd Creek estuary looking upstream, 1892. UW Special Collections Libraries,
Order no. VAN411 ...........................................................................................................77 Figure 35. Judd Creek estuary looking downstream. UW Special Collections Libraries,
Negative no. UW19099....................................................................................................77 Figure 36. Southside of Burton Head, 1892. Property of MSCUA, UW Special Collections,
Neg. no. 19278. ...............................................................................................................79 Figure 37. Figure 37. Current Conditions of Drift Cell by Shoretype .................................................81 Figure 38. Figure 38. Current and Historic Conditions Comparison by Drift Cell–Northern
Railroad sub area.............................................................................................................82 Figure 39. Current and Historic Conditions Comparison by Drift Cell–Shilshole sub area ...............83 Figure 40. Current and Historic Conditions Comparison by Drift Cell–Magnolia sub area ...............84 Figure 41. Current and Historic Conditions Comparison by Drift Cell–Seattle to Three Tree
Point sub area..................................................................................................................85 Figure 42. Curent and Historic Conditions Comparison by Drift Cell–South King sub area..............86 Figure 43. Current and Historic Conditions Comparison by Drift Cell–Vashon-N. Maury sub
area ..................................................................................................................................87 Figure 44. Current and Historic Conditions Comparison by Drift Cell–SE Maury Is. sub area .........88 Figure 45. Current and Historic Conditions Comparison by Drift Cell–Quartermaster Harbor
sub area ...........................................................................................................................89 Figure 46. Historic Conditions of Drift Cell by Shoretype ..................................................................90
INTRODUCTION
This report was initiated by King County Department of Natural Resources and Parks in order to provide much needed data and analysis of the marine shorelines within Watershed Resource Inventory Areas (WRIA) 8 and 9. While drift cells were delineated many years ago, more spatially explicit characterization of the physical processes occurring within each drift cell has not been attempted within King County or southern Snohomish County previously. Unlike other recent related studies in Puget Sound, this inventory and assessment is based on field-based mapping of current conditions, and not just on analyses of existing Geographic Information System (GIS) data sets. This effort was originated through salmon conservation planning work, but is applicable to many different planning efforts. The primary objectives of this report were:
• To understand the current conditions related to sediment input and transport processes within each drift cell and where modifications to those processes have occurred.
• To be able to quantitatively prioritize conservation actions to protect currently
functioning sediment sources.
• To gain an understanding of the historic conditions of each drift cell, specifically in relation to sediment sources which have been disconnected and which sediment sources were likely providing the largest benefit to the shoreline so that restoration actions can be prioritized.
• Provide coastal geomorphic context for salmonid restoration actions being undertaken
within WRIAs 8 and 9.
• To provide basic data for a characterization of ecosystem processes, which is required for Shoreline Master Plan updates under the Shoreline Management Act.
COASTAL PROCESSES BACKGROUND
Puget Sound Bluffs and Beaches Puget Sound is the central feature in the Puget Lowland, and consists of a complex series of generally north-south trending deep basins. The Sound was created by the repeated advance and scouring of glacial ice-sheets, the most recent of which advanced into the King and Snohomish county portions of the Puget Lowland between 15,000 and 13,000 years ago (Booth 1994). Glacially derived sediment dominates the Puget Lowlands (Easterbrook 1992, Booth 1991), and along with less common interglacial sediment, is exposed in coastal bluffs (sometimes referred to as sea cliffs although correctly termed bluffs). Bluffs are present along the majority of the length of the King and southern Snohomish county shores. Puget Sound bluffs are relatively recent landforms. Bluffs have formed in the “fresh” landscape left behind after the most recent ice-sheet advance (Vashon advance). Sea levels were generally rising with the global melting of ice-sheets up until approximately 5,000 years ago. This is thought to be the time when the current configuration of bluffs began to evolve. The elevation and morphology of coastal bluffs in the study area varies greatly due to differences in upland relief, geologic composition and stratigraphy, hydrology, orientation and exposure, erosion rates, mass wasting mechanisms, and vegetation (Shipman 2004). Bluff heights reach up to 450 ft in the study area, among the highest in the Puget Lowland. Bluffs are subjected to wave attack at the toe of the slope, which contributes to intermittent bluff retreat through mass wasting events (commonly referred to as landslides) such as slumps and debris avalanches. Landslides are also
Final WRIA 8 &9 Beach Feeding Sources and Accretion areas: Current and Historical Conditions Report COASTAL GEOLOGIC SERVICES, INC.
2
initiated by hydrologic processes and land use/development changes. Beaches in the study area are composed of gravel and sand and are ubiquitous, whether at the toe of bluffs or along very low elevation backshores. The morphology and composition of beaches in the study area are controlled by sediment input, wave climate, and shore orientation. Bluff sediment input, primarily glacially deposited units, is the primary source of beach sediment in Puget Sound. Landslides and erosion of these bluffs deliver sediment to the beach in moderate quantities. A secondary sediment source is rivers and streams. However, river and stream sediment input is though to be responsible for on the order of 10% of beach sediment in Puget Sound, with the majority (90%) originating from bluff erosion (Keuler 1988). The most basic control over beach characteristics is the wave climate, which is controlled by the open water distance that winds blow unobstructed (fetch), and the orientation of a shore relative to incoming waves. Low wave energy beaches are composed of poorly sorted sediment with a relatively narrow backshore and intermittent vegetation. Higher wave energy beaches contain areas with well-sorted sediment, often consisting of cobble, over a broad intertidal and supratidal area. Beach sediment size is strongly influenced by the available sediment coming from bluff erosion as well as wave energy, and therefore varies considerably across the study area. Beaches are accumulations of sediment along a shore. As sediment is transported along a beach, it must be continuously replaced for the beach to maintain its integrity. The erosional nature of the majority of Puget Sound area beaches is evident in that most beaches generally consist of a thin veneer of sediment that is only 3-10 inches thick vertically, atop eroding glacial deposits. A beach serves as a buffer against direct wave attack at the bluff toe. The value of a "healthy" beach fronting a coastal bluff should not be underestimated for absorbing storm wave energy. A gravel berm can serve as a resilient landform with an ability to alter shape under different wave conditions, effectively dissipating most wave energy. Extreme waves do reach bluffs causing erosion, which delivers sediment to the beach and is vital to maintaining the beach. Therefore, bluffs, beaches, and nearshore areas are completely connected as integral parts of a coastal system. Past and current management typically treated the bluffs and beaches as separate parts of the coastal system, which has resulted in substantial negative impacts to coastal erosion and nearshore habitats and wildlife.
Net Shore-drift To understand the processes controlling nearshore systems and their continued evolution, the three-dimensional sediment transport system must be examined. The basic coastal processes that control the “behavior” of the beach will be explained first and then put into the context of “drift cells.” Shore drift is the combined effect of longshore drift, the sediment transported along a coast in the nearshore waters, and beach drift, the wave-induced motion of sediment on the beachface in an alongshore direction. While shore drift may vary in direction seasonally, net shore-drift is the long-term, net effect of shore drift occurring over a period of time along a particular coastal sector (Jacobsen and Schwartz 1981). The concept of a drift cell has been employed in coastal studies to represent a sediment transport sector from source to terminus along a coast. A drift cell is defined as consisting of three components: a site (erosional feature or river mouth) that serves as the sediment source and origin of a drift cell; a zone of transport, where wave energy moves drift material alongshore; and an area of deposition that is the terminus of a drift cell. Deposition of sediment occurs where wave energy is no longer sufficient to transport the sediment in the drift cell. Net shore-drift in the King County portion of the study area was mapped in the early 1980s and was reprinted in Schwartz et al. (1991). The southern Snohomish County net shore-drift mapping was completed by Johannessen (1992). The net shore-drift studies were conducted through systematic field investigations of the entire coast to identify geomorphologic and sedimentologic

Final WRIA 8 &9 Beach Feeding Sources and Accretion areas: Current and Historical Conditions Report COASTAL GEOLOGIC SERVICES, INC.
3
indicators that revealed net shore-drift cells and drift direction. The methods employed in net shore-drift mapping utilized 9-10 well-documented, isolated indicators of net shore-drift in a systematic fashion. Previous drift cell mapping efforts such as the Coastal Zone Atlas of Washington relied exclusively on historic wind records. That method is known as wave hindcasting, where inland wind data records were used for the determination of net shore-drift, without consideration of local variations in winds, landforms, or coastal morphology. Drift directions indicated in the atlas series have commonly been proven inaccurate by extensive field reconnaissance (i.e. Jacobsen and Schwartz 1981). When the geographic complexity of the Puget Sound area and subsequent variability of the surface winds, in addition to the seasonal variability of atmospheric circulation and the locally varying amount of drift sediment are considered, the geomorphic approach described above is better suited to the physical conditions of the region than traditional engineering methods like hindcasting. Net shore-drift is strongly influenced by several oceanographic parameters. The most important of which are waves, which provide the primary mechanism for sediment erosion, inclusion of sediment into the littoral system, and transport. The Puget Lowland is composed of inland waters exhibiting an extreme range of wave regimes. Storm wave heights reach relatively large size during prolonged winds, in contrast to chop formed during light winds, which have little geomorphic effect on coasts (Keuler 1988). Fetch has been proven to be the most important factor controlling net shore-drift in fetch-limited environments (Nordstrom 1992). This has been demonstrated in the Puget Lowland by a number of workers (Downing 1983). Due to the elimination of ocean swell in protected waters, waves generated by local winds are the primary transport agents in the littoral zone. The direction of maximum fetch that acts on a shoreline segment will correspond with the direction of the largest possible wave generation, and subsequently, the direction of greatest potential shore-drift. Where fetch is limited the wind generates the largest waves possible in fairly short time periods.
Shore Modifications Erosion control or shore protection structures are common in the study area. Residential and industrial bulkheading (also called seawalls) are typically designed to limit the erosion of the backshore area or bluff, but have numerous direct and indirect impacts on nearshore systems. Seawalls and bulkheads have been installed more routinely in the past few decades as property values have risen and marginal lands are developed. The effects of bulkheads and other forms of shore armoring on physical processes have been the subject of much concern in the Puget Sound region (for example, PSAT 2003). Macdonald et al. (1994) completed studies assessing the impacts to the beach and nearshore system caused by shore armoring at a number of sites. Additional studies on impacts from shoreline armoring have quantitatively measured conditions in front of a bulkhead and at adjacent un-bulkheaded shores and showed that in front of a bulkhead the suspended sediment volume and littoral drift rate all increased substantially compared to unarmored shores, which resulted in beach scouring and lowering along the armored shores studied (Miles et al. 2001). A bulkhead constructed near the ordinary high water mark (OHWM) in a moderate energy environment increases the reflectivity at the upper beach substantially, causing backwash (outgoing water after a wave strikes shore) to be more pronounced. Increased backwash velocity removes beach sediment from the beachface, thereby lowering the beach profile (Macdonald et al. 1994). A bulkhead constructed lower on the beach causes greater impacts (Pilkey 1988). Construction of a bulkhead at or below OHWM results in coarsening of beach sediment in front of the bulkhead (Macdonald et al. 1994). Relatively fine-gain size sediment is mobilized by the increased turbulence caused by the bulkhead (Miles et al. 2001), and is preferentially transported away, leaving the coarser material on the beach. This process also leads to the removal of large woody debris (LWD) from the upper beachface. Over the long term, the construction of bulkheads on an erosional coast leads to the loss of the beach (Fletcher et al. 1997, Douglass and Bradley
Final WRIA 8 &9 Beach Feeding Sources and Accretion areas: Current and Historical Conditions Report COASTAL GEOLOGIC SERVICES, INC.
4
1999). Of all the impacts of shore armoring in the Puget Sound area, sediment impoundment is probably the most significant negative impact (PSAT 2003). A structure such as a bulkhead, if functioning correctly, “locks up” bluff material that would otherwise be supplied to the net shore-drift system. This results in a decrease in the amount of sediment available for maintenance of down-drift beaches. The negative impact of sediment impoundment is most pronounced when armoring occurs along actively eroding bluffs (Macdonald et al. 1994, Griggs 2005). Additionally, the extent of cumulative impacts from several long runs of bulkheads is a subject of great debate in the coastal research and management communities.
Coastal Processes and Nearshore Habitat Shore modifications, almost without exception, damage the ecological functioning of nearshore coastal systems. The proliferation of these structures has been viewed as one of the greatest threats to the ecological functioning of coastal systems (PSAT 2003, Thom et al. 1994). Modifications often result in the loss of the very feature that attracted coastal property owners in the first place, the beach (Fletcher et al. 1997). With bulkheading and other shore modifications such as filling and dredging, net shore-drift input from bluffs is reduced and beaches become “sediment starved.” The installation of structures typically results in the direct burial of the backshore area and portions of the beachface, resulting in reduced beach width (Griggs 2005) and loss of habitat area. Beaches would also become more coarse-grained as sand is winnowed out and transported away. When fines are removed from the upper intertidal beach due to bulkhead-induced impacts, the beach is often converted to a gravel beach (MacDonald et al. 1994). A gravel beach does not provide the same quality of habitat as a finer grain beach (Thom et al. 1994). Large woody debris (LWD) is usually also transported away from the shore following installation of bulkheads, with corresponding changes in habitat. This leads to a direct loss of nearshore habitats due to reduction in habitat patch area. Habitats of particular value to the local nearshore system that may have been substantially impacted include forage fish (such as surf smelt) spawning habitat. These habitat areas are only found in the upper intertidal portion of fine gravel and sand beaches, with a high percentage of 1-7 mm sediment (Pentilla 1978). Beach sediment coarsening can also affect hardshell clam habitat, by decreasing or locally eliminating habitat. Bulkheading also leads to reduction in epibenthic prey items, potentially increased predation of salmonids, loss of organic debris (logs, algae) and shade, and other ecological impacts (Thom et al. 1994). The reduction in beach sediment supply can also lead to an increase in coastal flooding and wave-induced erosion of existing low elevation armoring structures and homes. Nearshore habitat assessments in the Puget Sound region have found that large estuaries and small “pocket” estuaries provide very high value nearshore habitat for salmon as well as other species (Beamer et al. 2003, Redman and Fresh 2005). Reduction in net shore-drift volumes due to bulkheading and other modifications and site-specific impacts induced by modifications can cause partial or major loss of spits that form estuaries and embayments. Therefore, with consideration of all these factors, shore modifications can have substantial negative impacts on nearshore habitats.

Final WRIA 8 &9 Beach Feeding Sources and Accretion areas: Current and Historical Conditions Report COASTAL GEOLOGIC SERVICES, INC.
5
CURRENT CONDITIONS METHODS
Purpose and Rationale
The purpose of the current conditions mapping was to map current and historic Feeder Bluffs and Accretion Shoreforms along the entire marine shore of Water Resource Inventory Areas (WRIA) 8 & 9 (including Vashon and Maury Islands). The total length of the study area shore was approximately 120 miles. The study employed a process-based approach. Mapping was conducted in the field based on interpretation of coastal geomorphic and geologic features and was supplemented by aerial photo review, as explained below. Mapping was completed on the decadal to century time scale, meaning that geomorphic shoretypes mapped were characteristic of physical processes that take place over the decade to century time frame, although the characterization likely applies for longer-term processes in most areas. However, mapping Feeder Bluffs in the field is somewhat dependent on recent landslide history at a particular site, such that mapping may not always apply to processes taking place over longer time scales. The use of primarily geomorphic indicators observed in the field is not new in the Puget Sound region, as the net shore-drift mapping published by the Washington Department of Ecology that are now in wide use employed these same methods (for example, Schwartz et al. 1991, Johannessen 1992). This section summarizes the methods applied to complete the mapping of current conditions only. Historic conditions methods and results are found in the following section.
Field Mapping
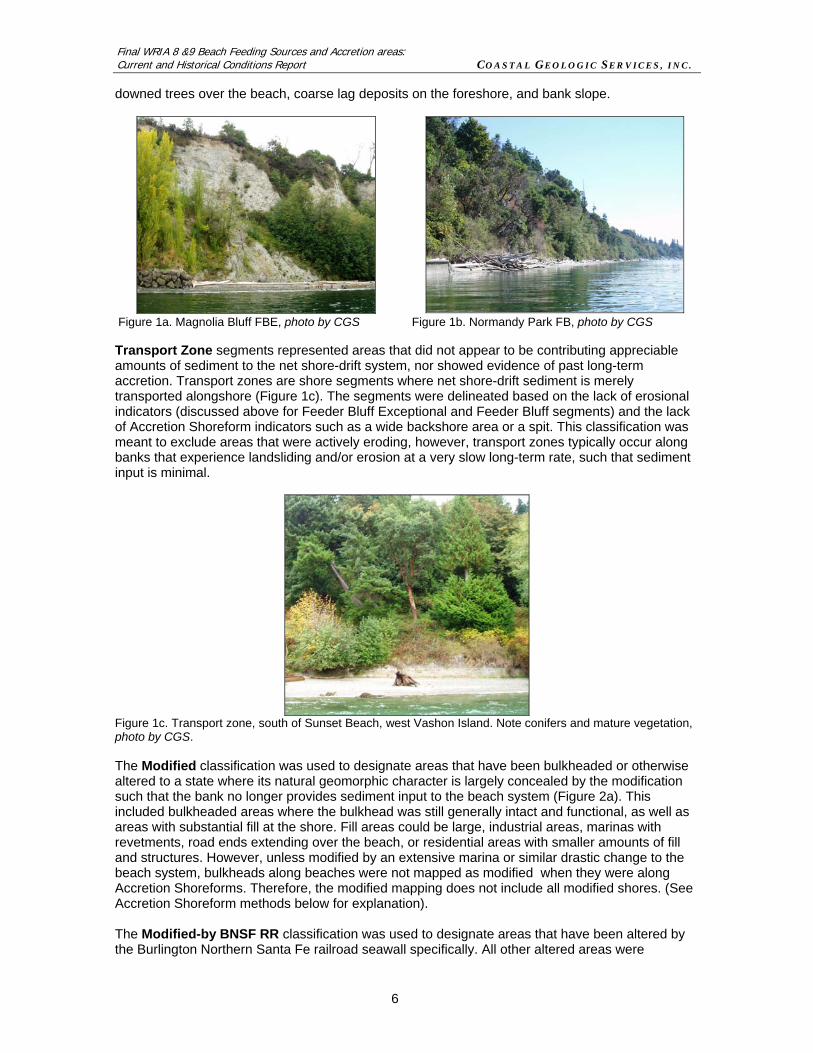
This task was accomplished primarily through mapping in the field, based on applying a mapping criteria (Table 1) developed for similar mapping in Island County (Johannessen and Chase 2005). The entire shore within the study area was visited during field mapping. Additional analysis was carried out using field observations, field photos and aerial photography. Field mapping data were checked through a review of oblique aerial photos taken in 2000 by the Department of Ecology and vertical aerial photos from 2002, and Best Available Science (BAS) documents. Relevant data sources used to confirm field observations include geologic maps, atlases, and historic maps (for investigation of Accretion Shoreforms). Mapping Units All of the shore included in the study area was delineated into one of six different alongshore segments: Feeder Bluff Exceptional, Feeder Bluff, Transport Zone, Modified, Modified-by the Burlington Northern Santa Fe Railroad (BNSF RR), Accretion Shoreform, and No Appreciable Drift. Toe erosion and landsliding were mapped as ancillary data within/across these six different segments. Sources of significant freshwater input including seeps, springs, creeks and outfalls were also mapped and coded, and the approximate size of outfalls was enumerated. The segments were delineated into the following shoretypes: The Feeder Bluff Exceptional (FBE) classification was applied to rapidly eroding bluff segments (Figure 1a). This classification was meant to identify the highest volume sediment input areas per lineal foot. This classification was not common in the study area. Feeder Bluff Exceptional segments were characterized by the presence of recent landslide scarps, and/or bluff toe erosion. Additionally, a general absence of vegetative cover and/or portions of bluff face fully exposed were often used for this classification. Other indicators included the presence of colluvium (slide debris), boulder or cobble lag deposits on the beach, and fallen trees across the beachface. Feeder Bluff Exceptional segments lacked a backshore, old or rotten logs, and coniferous bluff vegetation. See Table 1 for a summary of mapping criteria. The Feeder Bluff (FB) classification was used for areas of substantial sediment input into the net shore-drift system (Figure 1b). Feeder Bluff segments identify segments that have periodic sediment input with a longer recurrence interval as compared to Feeder Bluff Exceptional segments. Feeder Bluff segments were characterized by the presence of historic slide scarps, a lack of mature vegetation on the bank, and intermittent bank toe erosion. Other indicators included
Final WRIA 8 &9 Beach Feeding Sources and Accretion areas: Current and Historical Conditions Report COASTAL GEOLOGIC SERVICES, INC.
6
downed trees over the beach, coarse lag deposits on the foreshore, and bank slope.
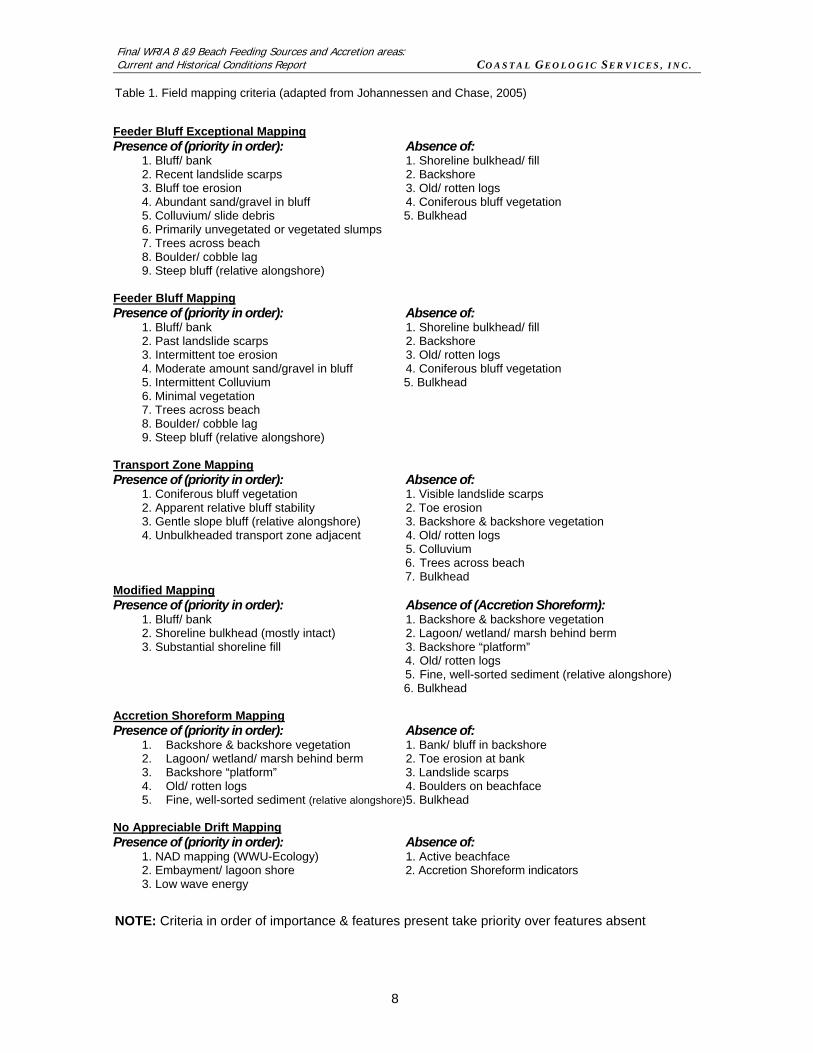
Figure 1a. Magnolia Bluff FBE, photo by CGS Figure 1b. Normandy Park FB, photo by CGS Transport Zone segments represented areas that did not appear to be contributing appreciable amounts of sediment to the net shore-drift system, nor showed evidence of past long-term accretion. Transport zones are shore segments where net shore-drift sediment is merely transported alongshore (Figure 1c). The segments were delineated based on the lack of erosional indicators (discussed above for Feeder Bluff Exceptional and Feeder Bluff segments) and the lack of Accretion Shoreform indicators such as a wide backshore area or a spit. This classification was meant to exclude areas that were actively eroding, however, transport zones typically occur along banks that experience landsliding and/or erosion at a very slow long-term rate, such that sediment input is minimal.
Figure 1c. Transport zone, south of Sunset Beach, west Vashon Island. Note conifers and mature vegetation, photo by CGS. The Modified classification was used to designate areas that have been bulkheaded or otherwise altered to a state where its natural geomorphic character is largely concealed by the modification such that the bank no longer provides sediment input to the beach system (Figure 2a). This included bulkheaded areas where the bulkhead was still generally intact and functional, as well as areas with substantial fill at the shore. Fill areas could be large, industrial areas, marinas with revetments, road ends extending over the beach, or residential areas with smaller amounts of fill and structures. However, unless modified by an extensive marina or similar drastic change to the beach system, bulkheads along beaches were not mapped as modified when they were along Accretion Shoreforms. Therefore, the modified mapping does not include all modified shores. (See Accretion Shoreform methods below for explanation). The Modified-by BNSF RR classification was used to designate areas that have been altered by the Burlington Northern Santa Fe railroad seawall specifically. All other altered areas were

Final WRIA 8 &9 Beach Feeding Sources and Accretion areas: Current and Historical Conditions Report COASTAL GEOLOGIC SERVICES, INC.
7
designated as Modified. The No Appreciable Drift classification was used in areas where there was no appreciable net volume of sediment transport, following the methods development by Schwartz et al. (1991). The Accretion Shoreform classification was used to identify areas that were depositional in the past or present. These segments were classified based on the presence of several of the following features: broad backshore area (greater than 10 ft), backshore vegetation community, spit and/or lagoon landward of a spit. Additional indicators for delineating an Accretion Shoreform were the presence of relatively fine-grained sediment or very old drift logs in the backshore (Figure 2b). Due to the densely developed and modified nature of the study area shore, Accretion Shoreforms were further classified into five sub-categories (Table 2). These categories were applied to capture the contrasting conditions of Accretion Shoreforms including the location of shoreline modifications on the beachface/backshore, and the presence of a stream or creek mouth. Accretion Shoreforms lacking in modifications or freshwater inputs received no further classification and represent those that are in a relatively unmodified condition. Accretion Shoreforms with modifications were classified based on the elevation of the modification (e.g. modification located in the backshore (AS-MB), at the high watermark (AS-MH), or mid-intertidal (AS-MI)). A different classification was used if a source of freshwater, such as a creek or stream mouth, was observed (AS-SM). Additionally, the sediment size found on the upper intertidal beach was estimated (dominant, subdominant) and later entered the GIS attribute file.
Figure 2a. Modified shore impeding erosion of uplands, photo by CGS.
Figure 2b. Point Robinson, Accretion Shoreform, photo by CGS.
Final WRIA 8 &9 Beach Feeding Sources and Accretion areas: Current and Historical Conditions Report COASTAL GEOLOGIC SERVICES, INC.
8
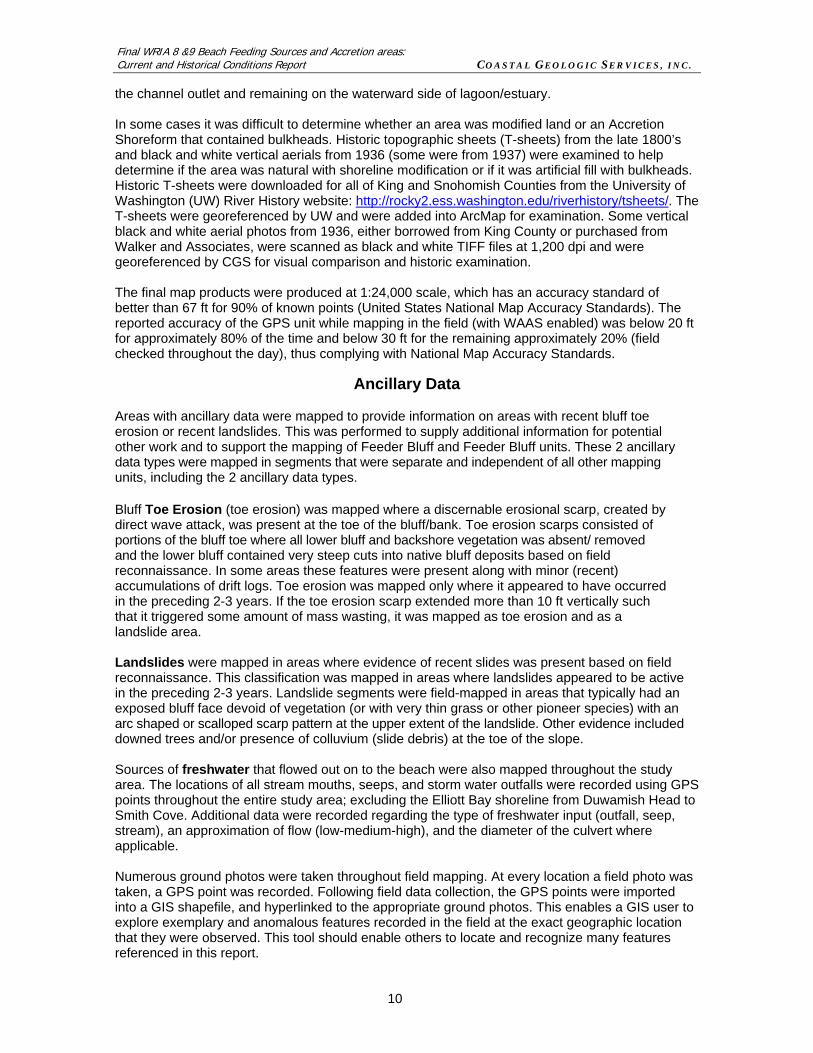
Table 1. Field mapping criteria (adapted from Johannessen and Chase, 2005)
NOTE: Criteria in order of importance & features present take priority over features absent
Feeder Bluff Exceptional Mapping Presence of (priority in order): Absence of:
1. Bluff/ bank 1. Shoreline bulkhead/ fill 2. Recent landslide scarps 2. Backshore 3. Bluff toe erosion 3. Old/ rotten logs 4. Abundant sand/gravel in bluff 4. Coniferous bluff vegetation 5. Colluvium/ slide debris 5. Bulkhead 6. Primarily unvegetated or vegetated slumps 7. Trees across beach 8. Boulder/ cobble lag 9. Steep bluff (relative alongshore)
Feeder Bluff Mapping Presence of (priority in order): Absence of:
1. Bluff/ bank 1. Shoreline bulkhead/ fill 2. Past landslide scarps 2. Backshore 3. Intermittent toe erosion 3. Old/ rotten logs 4. Moderate amount sand/gravel in bluff 4. Coniferous bluff vegetation 5. Intermittent Colluvium 5. Bulkhead 6. Minimal vegetation 7. Trees across beach 8. Boulder/ cobble lag 9. Steep bluff (relative alongshore)
Transport Zone Mapping Presence of (priority in order): Absence of:
1. Coniferous bluff vegetation 1. Visible landslide scarps 2. Apparent relative bluff stability 2. Toe erosion 3. Gentle slope bluff (relative alongshore) 3. Backshore & backshore vegetation 4. Unbulkheaded transport zone adjacent 4. Old/ rotten logs 5. Colluvium
6. Trees across beach 7. Bulkhead
Modified Mapping Presence of (priority in order): Absence of (Accretion Shoreform):
1. Bluff/ bank 1. Backshore & backshore vegetation 2. Shoreline bulkhead (mostly intact) 2. Lagoon/ wetland/ marsh behind berm 3. Substantial shoreline fill 3. Backshore “platform”
4. Old/ rotten logs 5. Fine, well-sorted sediment (relative alongshore)
6. Bulkhead Accretion Shoreform Mapping Presence of (priority in order): Absence of:
1. Backshore & backshore vegetation 1. Bank/ bluff in backshore 2. Lagoon/ wetland/ marsh behind berm 2. Toe erosion at bank 3. Backshore “platform” 3. Landslide scarps 4. Old/ rotten logs 4. Boulders on beachface 5. Fine, well-sorted sediment (relative alongshore)5. Bulkhead
No Appreciable Drift Mapping Presence of (priority in order): Absence of:
1. NAD mapping (WWU-Ecology) 1. Active beachface 2. Embayment/ lagoon shore 2. Accretion Shoreform indicators 3. Low wave energy

Final WRIA 8 &9 Beach Feeding Sources and Accretion areas: Current and Historical Conditions Report COASTAL GEOLOGIC SERVICES, INC.
9
Table 2. Accretion Shoreform categories and descriptions Type Type (full text) Description AS Accretion Shoreform Lacking modifications affecting landform
development AS-MB Accretion Shoreform with
Modified Backshore Modification of backshore only (including fill, riprap, bulkhead etc.)
AS-MH Accretion Shoreform Modified at High water mark
Bulkhead, riprap, seawall at or near high water mark
AS-MI Accretion Shoreform Modified at mid-Intertidal
Bulkhead, riprap, seawall within intertidal
AS-SM Accretion Shoreform with Stream-Mouth
Stream-mouth contributing to accretion of alongshore sediment; unmodified
AS-SM-MB Accretion Shoreform with Stream-Mouth and Modified Backshore
Stream-mouth contributing to accretion of alongshore sediment; modified backshore
AS-SM-MH Accretion Shoreform with Stream-Mouth, Modified at High water Mark
Stream-mouth contributing to alongshore sediment; modified at High water mark
Field Mapping Procedure
All features were mapped from a small boat at mid to high tide times with good visibility. Field mapping criteria (Tables 1 and 2) were used to map individual segments in the field based on observed shoreline features. Positional data were recorded using a handheld Garmin Etrex Venture GPS unit in the UTM NAD83 projected coordinate system. The GPS unit was WAAS (wide area augmentation system) enabled, and generally had accuracy of +/- 20 ft. Waypoints were marked at the beginning and end of each field-mapped segment as close inshore to the position of mean high water (MHW) as possible. The waypoints were correlated to segments, ancillary data, and notes that were recorded in a field notebook. A total of 2,803 waypoints were collected over 7 field days in the fall of 2004. Field mapping from September 20th through 22nd was focused on the south and central King County shoreline. The northern and eastern sides of Vashon were mapped on Oct 15th. Western and southern Vashon Island were mapped on Oct 16th. On October 17th, field mapping was focused on Quartermaster Harbor and Maury Island. The northern extent of the study area, from Golden Gardens in Seattle to Mukilteo, was mapped on November 16th 2004. The GPS was downloaded using GPSU 4.02, creating a text file of the positions and waypoints. The text file was opened in Excel in order to delete header rows and unnecessary columns for it to import into ArcMap 9.1. The Excel file was then saved as a comma separated file and imported into ArcMap 9.1 using the “Add x,y data” under the tools menu, creating an event. The event was then exported from ArcMap 8.3 in the ESRI shapefile format and assigned the appropriate projection that they were collected in (UTM NAD83), within ArcCatalog. The points were added into ArcMap, along with digital background information, which included US Geological Survey (USGS) quadrangles, Washington Department of Natural Resources (DNR) black and white orthophotos from 1990, a shoreline shapefile from Shorezone, USGS 2002 orthophotos, and historic topographic sheets (T-sheets). Features were digitized within ArcMap at a scale of 1:3,000 using the field book(s) and visually interpolating the points normal to a high water shoreline. The features were snapped to the Shorezone high water shoreline and to the ends of each feature, except in the few cases where the Shorezone shoreline substantially deviated from the actual mean high water (MHW) line as derived from the 2002 air photos. In those cases, the features were digitized along the MHW line of the USGS quadrangle. In several cases the Shorezone shoreline went inland inside a small lagoon or estuary where there was no appreciable net shore-drift. In these cases, shoreline units were digitized “across” the channel, leaving a gap at
Final WRIA 8 &9 Beach Feeding Sources and Accretion areas: Current and Historical Conditions Report COASTAL GEOLOGIC SERVICES, INC.
10
the channel outlet and remaining on the waterward side of lagoon/estuary. In some cases it was difficult to determine whether an area was modified land or an Accretion Shoreform that contained bulkheads. Historic topographic sheets (T-sheets) from the late 1800’s and black and white vertical aerials from 1936 (some were from 1937) were examined to help determine if the area was natural with shoreline modification or if it was artificial fill with bulkheads. Historic T-sheets were downloaded for all of King and Snohomish Counties from the University of Washington (UW) River History website: http://rocky2.ess.washington.edu/riverhistory/tsheets/. The T-sheets were georeferenced by UW and were added into ArcMap for examination. Some vertical black and white aerial photos from 1936, either borrowed from King County or purchased from Walker and Associates, were scanned as black and white TIFF files at 1,200 dpi and were georeferenced by CGS for visual comparison and historic examination. The final map products were produced at 1:24,000 scale, which has an accuracy standard of better than 67 ft for 90% of known points (United States National Map Accuracy Standards). The reported accuracy of the GPS unit while mapping in the field (with WAAS enabled) was below 20 ft for approximately 80% of the time and below 30 ft for the remaining approximately 20% (field checked throughout the day), thus complying with National Map Accuracy Standards.
Ancillary Data
Areas with ancillary data were mapped to provide information on areas with recent bluff toe erosion or recent landslides. This was performed to supply additional information for potential other work and to support the mapping of Feeder Bluff and Feeder Bluff units. These 2 ancillary data types were mapped in segments that were separate and independent of all other mapping units, including the 2 ancillary data types.
Bluff Toe Erosion (toe erosion) was mapped where a discernable erosional scarp, created by direct wave attack, was present at the toe of the bluff/bank. Toe erosion scarps consisted of portions of the bluff toe where all lower bluff and backshore vegetation was absent/ removed and the lower bluff contained very steep cuts into native bluff deposits based on field reconnaissance. In some areas these features were present along with minor (recent) accumulations of drift logs. Toe erosion was mapped only where it appeared to have occurred in the preceding 2-3 years. If the toe erosion scarp extended more than 10 ft vertically such that it triggered some amount of mass wasting, it was mapped as toe erosion and as a landslide area. Landslides were mapped in areas where evidence of recent slides was present based on field reconnaissance. This classification was mapped in areas where landslides appeared to be active in the preceding 2-3 years. Landslide segments were field-mapped in areas that typically had an exposed bluff face devoid of vegetation (or with very thin grass or other pioneer species) with an arc shaped or scalloped scarp pattern at the upper extent of the landslide. Other evidence included downed trees and/or presence of colluvium (slide debris) at the toe of the slope. Sources of freshwater that flowed out on to the beach were also mapped throughout the study area. The locations of all stream mouths, seeps, and storm water outfalls were recorded using GPS points throughout the entire study area; excluding the Elliott Bay shoreline from Duwamish Head to Smith Cove. Additional data were recorded regarding the type of freshwater input (outfall, seep, stream), an approximation of flow (low-medium-high), and the diameter of the culvert where applicable. Numerous ground photos were taken throughout field mapping. At every location a field photo was taken, a GPS point was recorded. Following field data collection, the GPS points were imported into a GIS shapefile, and hyperlinked to the appropriate ground photos. This enables a GIS user to explore exemplary and anomalous features recorded in the field at the exact geographic location that they were observed. This tool should enable others to locate and recognize many features referenced in this report.

Final WRIA 8 &9 Beach Feeding Sources and Accretion areas: Current and Historical Conditions Report COASTAL GEOLOGIC SERVICES, INC.
11
HISTORIC BLUFF CONDITIONS METHODS
Purpose and Rationale
The objective of the historic analysis portion of this study was to characterize the historic (pre-development) geomorphic character of marine shores in WRIA 8 and 9, including Vashon and Maury Islands. Two of the seven shoretypes used for the current conditions mapping (Feeder Bluff Exceptional and Feeder Bluff) plus two additional shoretypes, Potential Feeder Bluff and Not Feeder Bluff, were used to classify historic shoreforms. Because the biological assemblages and ecosystem structure of Puget Sound shorelines are largely dependent upon substrate size and quantity, understanding the historic nearshore geomorphic conditions (including sediment supply to drift cells) provides a valuable management tool. This is most important in the considerable portions of the study area that are modified from their original condition. Comparing current and historic conditions elucidates the location and measured loss of sediment sources within each drift cell. This enables managers to prevent further degradation of nearshore sediment systems, while providing relevant historic data for prioritizing restoration aimed at reintroducing sediment into net shore-drift cells that are particularly deprived of sediment as compared to their historic condition. Due to limitations in the pre-1930s data, a complete mapping of historic shoretypes was not possible with accuracy even close to current conditions mapping. Therefore the current conditions mapping was used as a starting point for historic sediment source mapping. All areas characterized as Modified or Modified by the BNSF railroad in the current conditions mapping were analyzed in detail to determine their historic character. All other mapped current conditions segments were assumed to be the same in the pre-development period. A potential weakness of this assumption results from the fact that time lags often exist between erosion, transport and deposition of unconsolidated sediment (Brunsden 2001). Since current conditions mapping documents the present geomorphic character of the study area’s shores, and beaches are inherently dynamic features, it is possible for a some shore segments to have changed geomorphic character during the period between pre-development and current conditions. An example of this may be that a former transport zone may have been gradually changed into a Feeder Bluff in the absence of continued natural sediment supply volumes. However, the chance that substantial reaches of the coast had changed geomorphic character is low in the relatively low wave-energy conditions of Puget Sound and data limitations preclude a more complete historic analysis. The exception to the reliance on portions of the current conditions mapping was the historic Accretion Shoreform mapping, the methods of which are described below. Net shore-drift cells that have been significantly altered by development (such as surrounding the Des Moines Marina or Shilshole Marina) were first identified and analyzed separately within the context of inferred, historic net shore-drift cells. The specific methods used are described below.
Documented historic conditions are assumed to be close to pre-development conditions and represented by a range of time periods based on data availability (mid-1800s to 1936-48). The methods applied in this analysis rely heavily on concurrence between available data sets, Best Available Science, and previous work performed in portions of the present study area with similar objectives. Data used in the analysis are listed in Table 3. In an attempt to produce an analytical method that could be applied to the entire study area, datasets that included as much of the study area as possible were selected over those with only partial coverage. For example, Lidar data were only available for a portion of the study area, therefore USGS topographic maps was the preferred data source for unit topography.
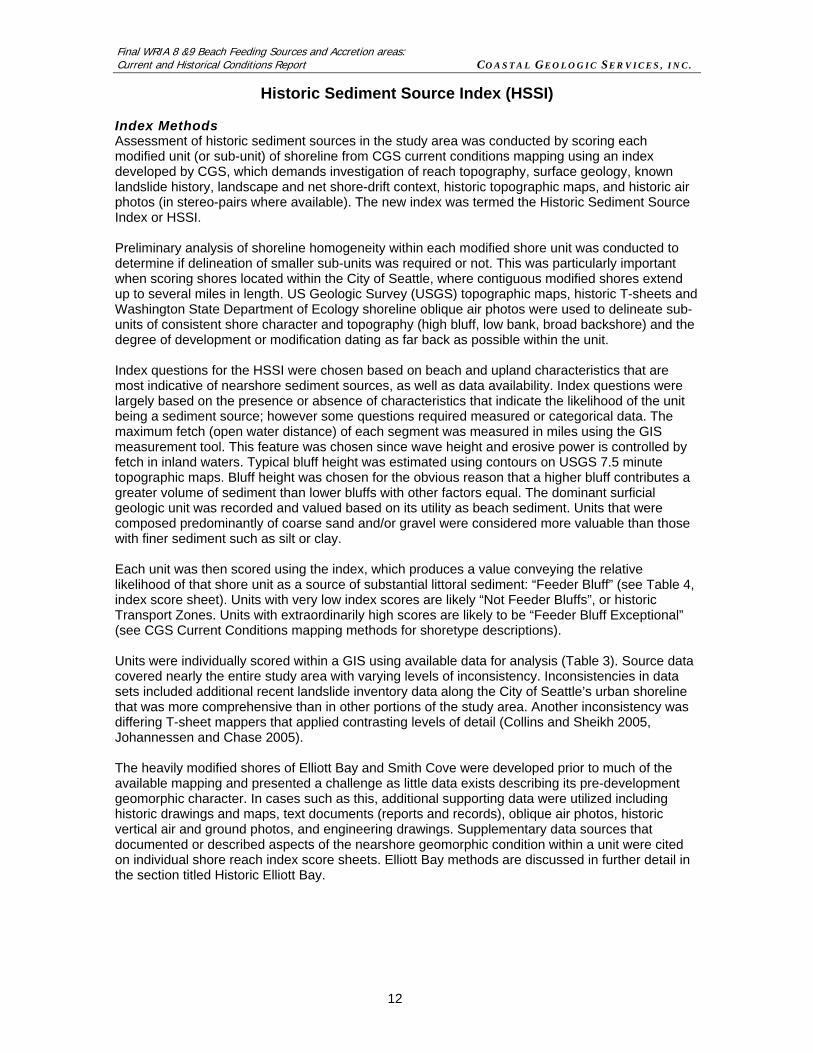
Final WRIA 8 &9 Beach Feeding Sources and Accretion areas: Current and Historical Conditions Report COASTAL GEOLOGIC SERVICES, INC.
12
Historic Sediment Source Index (HSSI)
Index Methods Assessment of historic sediment sources in the study area was conducted by scoring each modified unit (or sub-unit) of shoreline from CGS current conditions mapping using an index developed by CGS, which demands investigation of reach topography, surface geology, known landslide history, landscape and net shore-drift context, historic topographic maps, and historic air photos (in stereo-pairs where available). The new index was termed the Historic Sediment Source Index or HSSI. Preliminary analysis of shoreline homogeneity within each modified shore unit was conducted to determine if delineation of smaller sub-units was required or not. This was particularly important when scoring shores located within the City of Seattle, where contiguous modified shores extend up to several miles in length. US Geologic Survey (USGS) topographic maps, historic T-sheets and Washington State Department of Ecology shoreline oblique air photos were used to delineate sub-units of consistent shore character and topography (high bluff, low bank, broad backshore) and the degree of development or modification dating as far back as possible within the unit. Index questions for the HSSI were chosen based on beach and upland characteristics that are most indicative of nearshore sediment sources, as well as data availability. Index questions were largely based on the presence or absence of characteristics that indicate the likelihood of the unit being a sediment source; however some questions required measured or categorical data. The maximum fetch (open water distance) of each segment was measured in miles using the GIS measurement tool. This feature was chosen since wave height and erosive power is controlled by fetch in inland waters. Typical bluff height was estimated using contours on USGS 7.5 minute topographic maps. Bluff height was chosen for the obvious reason that a higher bluff contributes a greater volume of sediment than lower bluffs with other factors equal. The dominant surficial geologic unit was recorded and valued based on its utility as beach sediment. Units that were composed predominantly of coarse sand and/or gravel were considered more valuable than those with finer sediment such as silt or clay. Each unit was then scored using the index, which produces a value conveying the relative likelihood of that shore unit as a source of substantial littoral sediment: “Feeder Bluff” (see Table 4, index score sheet). Units with very low index scores are likely “Not Feeder Bluffs”, or historic Transport Zones. Units with extraordinarily high scores are likely to be “Feeder Bluff Exceptional” (see CGS Current Conditions mapping methods for shoretype descriptions). Units were individually scored within a GIS using available data for analysis (Table 3). Source data covered nearly the entire study area with varying levels of inconsistency. Inconsistencies in data sets included additional recent landslide inventory data along the City of Seattle’s urban shoreline that was more comprehensive than in other portions of the study area. Another inconsistency was differing T-sheet mappers that applied contrasting levels of detail (Collins and Sheikh 2005, Johannessen and Chase 2005). The heavily modified shores of Elliott Bay and Smith Cove were developed prior to much of the available mapping and presented a challenge as little data exists describing its pre-development geomorphic character. In cases such as this, additional supporting data were utilized including historic drawings and maps, text documents (reports and records), oblique air photos, historic vertical air and ground photos, and engineering drawings. Supplementary data sources that documented or described aspects of the nearshore geomorphic condition within a unit were cited on individual shore reach index score sheets. Elliott Bay methods are discussed in further detail in the section titled Historic Elliott Bay.

Final WRIA 8 &9 Beach Feeding Sources and Accretion areas: Current and Historical Conditions Report COASTAL GEOLOGIC SERVICES, INC.
13
Table 3. Available data for analysis of historic conditions in WRIA 8 and 9. Media Year Source Coverage & Applicability, Misc.
Vertical aerial photography
1936 Walker & Assoc.
Historic conditions, landslide mapping WRIA 9 only, stereo pairs
1940 US ACOE Photo mosaics – WRIA8 & 9 – not georeferenced 1947 Snoho Cty Historic conditions, landslide mapping, WRIA8 only 1977/78 DOE & SC Color and 1:6000 1990 DNR B&W orthos – 3 ft resolution 2002 USGS Coastal areas only - 1ft pixel Oblique aerial photos
2000/01 DOE King and Snohomish County (no scale)
Maps 1841 US Ex. West Point to Alki Point (Wilkes map) 1841 NOAA Puget Sound Admiralty Inlet (Wilkes map) 1850+ GLO Cadastral GLO Survey Maps – some digitized in S. end,
minimal detail 1854 USCS Reconnaissance of Seattle Harbor and Duwamish Bay 1855-56 Anonymous Plan of Seattle 1855-56 1878 Koch, A. Bird’s Eye View of Seattle and Environs (Kroll) perspective
drawing 1878 Glover, E. Birds Eye View of City of Seattle (Kroll)
perspective drawing 1879 NOAA Seattle Harbor, Puget Sound 1884 Kroll City of Seattle –downtown perspective drawing 1891 NOAA Seattle to Olympia & Vashon/Maury Islands 1890 City of Seattle Seattle Tidelands, many maps, filed by subarea. 1891 Kroll Bird’s eye view of Seattle, incl. Smith Cove to Alki 1866/99 USC&GS All WRIA8&9 T-sheets plus descriptive reports 1899;
Shilshole to Alki and City Front to Bayhead 1905 NOAA Admiralty Inlet & Puget Sound 1991 USGS Geology of Vashon & Maury Islands (landslide and beach
seds) 1893-34 M. Stixrud Map of part of Seattle Harbor showing Soundings 1854 US Coast
Survey Preliminary survey of Duwamish Bay, Washington Territory
B. Collins data 2004 T-sheets Aquatic/tidal wetland habitat loss – Elliott Bay (Green/Duw) 2005 T-sheets Cartographic symbol mapping Vector data Year Source Theme Notes 2004 DNR-geology Surface Geology Mapped Qb, Qls 1975 DOE-CZA Slope stability Recent landslides 1975 DOE-CZA Slope stability Historic landslides 2004 KC-DNR&P 1933-60 landslides WRIA9 shoreline 2004 KC-DNR&P 1996-97 landslides WRIA9 shoreline 2004 BNSF/WRIA8 1996-97 landslides WRIA8 shoreline Shoretype 2004 CGS Geomorphic character FBE, FB, TZ, AS, Mod Landslides 2004 CGS Recent landslides In previous 2-3 yrs Toe erosion 2004 CGS Recent toe erosion In previous 2-3 yrs
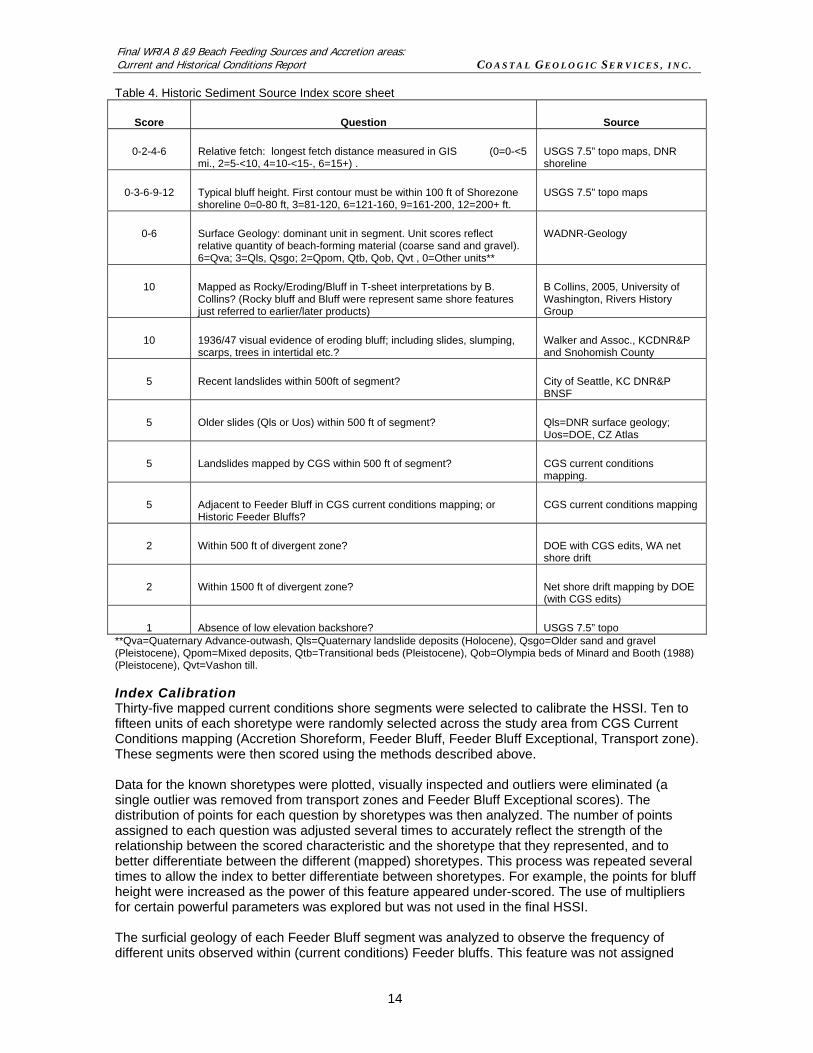
Final WRIA 8 &9 Beach Feeding Sources and Accretion areas: Current and Historical Conditions Report COASTAL GEOLOGIC SERVICES, INC.
14
Table 4. Historic Sediment Source Index score sheet
Score Question Source
0-2-4-6 Relative fetch: longest fetch distance measured in GIS (0=0-<5 mi., 2=5-<10, 4=10-<15-, 6=15+) .
USGS 7.5” topo maps, DNR shoreline
0-3-6-9-12 Typical bluff height. First contour must be within 100 ft of Shorezone shoreline 0=0-80 ft, 3=81-120, 6=121-160, 9=161-200, 12=200+ ft.
USGS 7.5” topo maps
0-6 Surface Geology: dominant unit in segment. Unit scores reflect relative quantity of beach-forming material (coarse sand and gravel). 6=Qva; 3=Qls, Qsgo; 2=Qpom, Qtb, Qob, Qvt , 0=Other units**
WADNR-Geology
10 Mapped as Rocky/Eroding/Bluff in T-sheet interpretations by B. Collins? (Rocky bluff and Bluff were represent same shore features just referred to earlier/later products)
B Collins, 2005, University of Washington, Rivers History Group
10 1936/47 visual evidence of eroding bluff; including slides, slumping, scarps, trees in intertidal etc.?
Walker and Assoc., KCDNR&P and Snohomish County
5 Recent landslides within 500ft of segment? City of Seattle, KC DNR&P BNSF
5 Older slides (Qls or Uos) within 500 ft of segment? Qls=DNR surface geology; Uos=DOE, CZ Atlas
5 Landslides mapped by CGS within 500 ft of segment? CGS current conditions mapping.
5 Adjacent to Feeder Bluff in CGS current conditions mapping; or Historic Feeder Bluffs?
CGS current conditions mapping
2 Within 500 ft of divergent zone? DOE with CGS edits, WA net shore drift
2 Within 1500 ft of divergent zone? Net shore drift mapping by DOE (with CGS edits)
1 Absence of low elevation backshore? USGS 7.5” topo **Qva=Quaternary Advance-outwash, Qls=Quaternary landslide deposits (Holocene), Qsgo=Older sand and gravel (Pleistocene), Qpom=Mixed deposits, Qtb=Transitional beds (Pleistocene), Qob=Olympia beds of Minard and Booth (1988) (Pleistocene), Qvt=Vashon till. Index Calibration Thirty-five mapped current conditions shore segments were selected to calibrate the HSSI. Ten to fifteen units of each shoretype were randomly selected across the study area from CGS Current Conditions mapping (Accretion Shoreform, Feeder Bluff, Feeder Bluff Exceptional, Transport zone). These segments were then scored using the methods described above. Data for the known shoretypes were plotted, visually inspected and outliers were eliminated (a single outlier was removed from transport zones and Feeder Bluff Exceptional scores). The distribution of points for each question by shoretypes was then analyzed. The number of points assigned to each question was adjusted several times to accurately reflect the strength of the relationship between the scored characteristic and the shoretype that they represented, and to better differentiate between the different (mapped) shoretypes. This process was repeated several times to allow the index to better differentiate between shoretypes. For example, the points for bluff height were increased as the power of this feature appeared under-scored. The use of multipliers for certain powerful parameters was explored but was not used in the final HSSI. The surficial geology of each Feeder Bluff segment was analyzed to observe the frequency of different units observed within (current conditions) Feeder bluffs. This feature was not assigned

Final WRIA 8 &9 Beach Feeding Sources and Accretion areas: Current and Historical Conditions Report COASTAL GEOLOGIC SERVICES, INC.
15
many points as several geologic sections have not been mapped to date, and the HSSI should not weigh surficial units too highly, as bluff stratigraphy (in addition to other physical features of a slope) is of greater influence to slope stability than surface geology alone. See Figure 3 for results of the calibration exercise.
Historic Sediment Source Index - calibration scores
33.0
15.016.012.0
2.0
15.011.0
2.0
27.0
48.0
35.037.0
31.0
52.0
47.0
36.036.033.0
51.0
35.0
29.0
47.044.0
39.0 38.0
53.0
47.043.040.0
50.0
42.0
47.0
37.0
47.0
34.0
0
10
20
30
40
50
60
shoretypes
inde
x sc
ore
TZ FB FBE
Figure 3. Historic sediment source index calibration scores; numbers indicate score, no value on x-axis Uncertainty Although the HSSI method is data intensive it has the potential to produce results with a relatively high level of certainty for the majority of the study area. However some sub-areas and individual areas have a moderate level of uncertainty due to limited data availability documenting the original shore character. Shores with substantial data limitations were typically considerably modified prior to the 1890s and were largely limited to the shores of Elliott Bay and the Northern Railroad sub-areas. For example, much of Elliott Bay was substantially altered prior to the turn of the 20th century, and documentation of its historic character is inconsistent and confined to early charts, hand drawn maps, and renderings. The Northern Railroad area was investigated in detail, which resulted in more pertinent landslide data than did Elliott Bay. To account for units with varying degrees of uncertainty, the number of supporting documents (maps, photos, drawings etc.) supplemented each unit score within the Elliott Bay sub-area. Ranging from 2 to 7 (sources), this number can be used as a measure of certainty in characterizing the pre-development condition of each shore unit. This tool enables managers to apply the level of uncertainty into their management decision calculus. Additional sources of uncertainty that are far more difficult to account for include contrasting detail associated with different T-sheet mappers, degraded visibility of north-facing slopes on air photos, and the lack of stereo-pairs for air photos on Vashon-Maury Islands and southern Snohomish County. Additionally, some uncertainty can be attributed to the type of bluff that the model was designed to capture. The choice was made in using the HSSI to keep the weighting consistent throughout the study area. The HSSI methodology weights a number of factors that include high-elevation bluffs with documented past landslides, which appeared to capture moderate and high sediment source area well. However, low energy shores with very low sediment input and low net shore-drift volumes would not necessarily be scored as historic Feeder Bluffs in the index. Quartermaster Harbor, with low elevation bluffs and protection from wind waves, was an area where historic
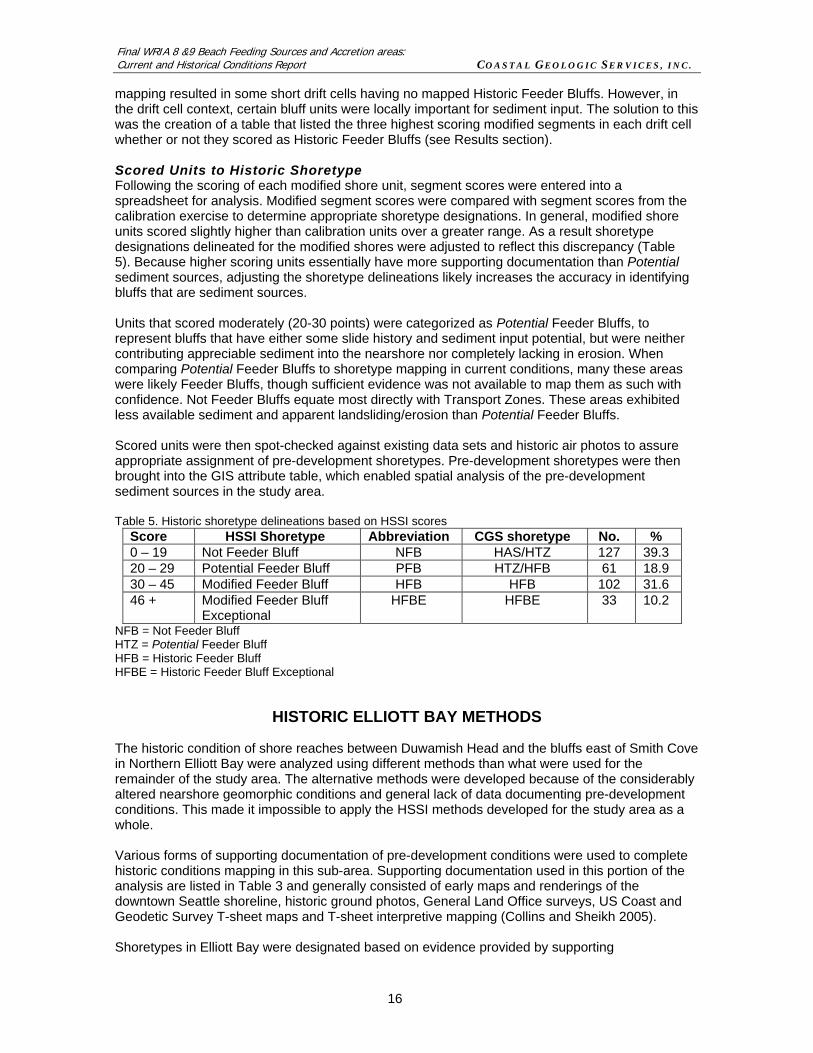
Final WRIA 8 &9 Beach Feeding Sources and Accretion areas: Current and Historical Conditions Report COASTAL GEOLOGIC SERVICES, INC.
16
mapping resulted in some short drift cells having no mapped Historic Feeder Bluffs. However, in the drift cell context, certain bluff units were locally important for sediment input. The solution to this was the creation of a table that listed the three highest scoring modified segments in each drift cell whether or not they scored as Historic Feeder Bluffs (see Results section). Scored Units to Historic Shoretype Following the scoring of each modified shore unit, segment scores were entered into a spreadsheet for analysis. Modified segment scores were compared with segment scores from the calibration exercise to determine appropriate shoretype designations. In general, modified shore units scored slightly higher than calibration units over a greater range. As a result shoretype designations delineated for the modified shores were adjusted to reflect this discrepancy (Table 5). Because higher scoring units essentially have more supporting documentation than Potential sediment sources, adjusting the shoretype delineations likely increases the accuracy in identifying bluffs that are sediment sources. Units that scored moderately (20-30 points) were categorized as Potential Feeder Bluffs, to represent bluffs that have either some slide history and sediment input potential, but were neither contributing appreciable sediment into the nearshore nor completely lacking in erosion. When comparing Potential Feeder Bluffs to shoretype mapping in current conditions, many these areas were likely Feeder Bluffs, though sufficient evidence was not available to map them as such with confidence. Not Feeder Bluffs equate most directly with Transport Zones. These areas exhibited less available sediment and apparent landsliding/erosion than Potential Feeder Bluffs. Scored units were then spot-checked against existing data sets and historic air photos to assure appropriate assignment of pre-development shoretypes. Pre-development shoretypes were then brought into the GIS attribute table, which enabled spatial analysis of the pre-development sediment sources in the study area. Table 5. Historic shoretype delineations based on HSSI scores
Score HSSI Shoretype Abbreviation CGS shoretype No. % 0 – 19 Not Feeder Bluff NFB HAS/HTZ 127 39.3 20 – 29 Potential Feeder Bluff PFB HTZ/HFB 61 18.9 30 – 45 Modified Feeder Bluff HFB HFB 102 31.6 46 + Modified Feeder Bluff
Exceptional HFBE HFBE 33 10.2
NFB = Not Feeder Bluff HTZ = Potential Feeder Bluff HFB = Historic Feeder Bluff HFBE = Historic Feeder Bluff Exceptional
HISTORIC ELLIOTT BAY METHODS The historic condition of shore reaches between Duwamish Head and the bluffs east of Smith Cove in Northern Elliott Bay were analyzed using different methods than what were used for the remainder of the study area. The alternative methods were developed because of the considerably altered nearshore geomorphic conditions and general lack of data documenting pre-development conditions. This made it impossible to apply the HSSI methods developed for the study area as a whole. Various forms of supporting documentation of pre-development conditions were used to complete historic conditions mapping in this sub-area. Supporting documentation used in this portion of the analysis are listed in Table 3 and generally consisted of early maps and renderings of the downtown Seattle shoreline, historic ground photos, General Land Office surveys, US Coast and Geodetic Survey T-sheet maps and T-sheet interpretive mapping (Collins and Sheikh 2005). Shoretypes in Elliott Bay were designated based on evidence provided by supporting
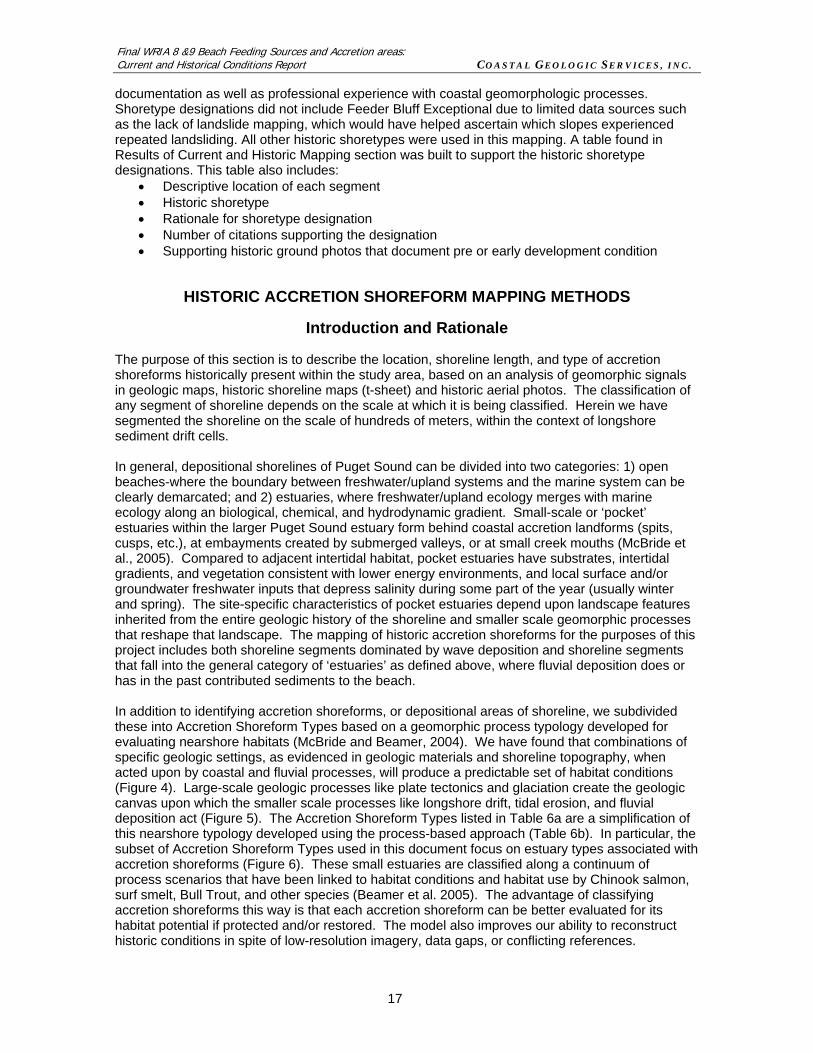
Final WRIA 8 &9 Beach Feeding Sources and Accretion areas: Current and Historical Conditions Report COASTAL GEOLOGIC SERVICES, INC.
17
documentation as well as professional experience with coastal geomorphologic processes. Shoretype designations did not include Feeder Bluff Exceptional due to limited data sources such as the lack of landslide mapping, which would have helped ascertain which slopes experienced repeated landsliding. All other historic shoretypes were used in this mapping. A table found in Results of Current and Historic Mapping section was built to support the historic shoretype designations. This table also includes:
• Descriptive location of each segment • Historic shoretype • Rationale for shoretype designation • Number of citations supporting the designation • Supporting historic ground photos that document pre or early development condition
HISTORIC ACCRETION SHOREFORM MAPPING METHODS
Introduction and Rationale The purpose of this section is to describe the location, shoreline length, and type of accretion shoreforms historically present within the study area, based on an analysis of geomorphic signals in geologic maps, historic shoreline maps (t-sheet) and historic aerial photos. The classification of any segment of shoreline depends on the scale at which it is being classified. Herein we have segmented the shoreline on the scale of hundreds of meters, within the context of longshore sediment drift cells. In general, depositional shorelines of Puget Sound can be divided into two categories: 1) open beaches-where the boundary between freshwater/upland systems and the marine system can be clearly demarcated; and 2) estuaries, where freshwater/upland ecology merges with marine ecology along an biological, chemical, and hydrodynamic gradient. Small-scale or ‘pocket’ estuaries within the larger Puget Sound estuary form behind coastal accretion landforms (spits, cusps, etc.), at embayments created by submerged valleys, or at small creek mouths (McBride et al., 2005). Compared to adjacent intertidal habitat, pocket estuaries have substrates, intertidal gradients, and vegetation consistent with lower energy environments, and local surface and/or groundwater freshwater inputs that depress salinity during some part of the year (usually winter and spring). The site-specific characteristics of pocket estuaries depend upon landscape features inherited from the entire geologic history of the shoreline and smaller scale geomorphic processes that reshape that landscape. The mapping of historic accretion shoreforms for the purposes of this project includes both shoreline segments dominated by wave deposition and shoreline segments that fall into the general category of ‘estuaries’ as defined above, where fluvial deposition does or has in the past contributed sediments to the beach. In addition to identifying accretion shoreforms, or depositional areas of shoreline, we subdivided these into Accretion Shoreform Types based on a geomorphic process typology developed for evaluating nearshore habitats (McBride and Beamer, 2004). We have found that combinations of specific geologic settings, as evidenced in geologic materials and shoreline topography, when acted upon by coastal and fluvial processes, will produce a predictable set of habitat conditions (Figure 4). Large-scale geologic processes like plate tectonics and glaciation create the geologic canvas upon which the smaller scale processes like longshore drift, tidal erosion, and fluvial deposition act (Figure 5). The Accretion Shoreform Types listed in Table 6a are a simplification of this nearshore typology developed using the process-based approach (Table 6b). In particular, the subset of Accretion Shoreform Types used in this document focus on estuary types associated with accretion shoreforms (Figure 6). These small estuaries are classified along a continuum of process scenarios that have been linked to habitat conditions and habitat use by Chinook salmon, surf smelt, Bull Trout, and other species (Beamer et al. 2005). The advantage of classifying accretion shoreforms this way is that each accretion shoreform can be better evaluated for its habitat potential if protected and/or restored. The model also improves our ability to reconstruct historic conditions in spite of low-resolution imagery, data gaps, or conflicting references.

Final WRIA 8 &9 Beach Feeding Sources and Accretion areas: Current and Historical Conditions Report COASTAL GEOLOGIC SERVICES, INC.
18
The Geomorphic Classification predicts habitat based on landscape process:
Landscape Processes
Habitat Conditions
Biotic Response
Working within the conceptual framework:
upland topography
shoreline material
dominant process
intertidalhabitat
Figure 4. Conceptual framework for geomorphic classification (McBride et al. 2005).
Relative Sea Level Change
Glaciers
Climate
Faults
Days Centuries MillenniaYears
RATE
EXTE
NT
Plate Tectonics
Hundreds of Meters
Region
Continent
Tens of Meters
Landslides
Storms
Waves
Tides
Rivers
Figure 5. Habitat-forming, landscape processes impact habitats over varying rates and spatial extents (McBride and Beamer 2004).

Final WRIA 8 &9 Beach Feeding Sources and Accretion areas: Current and Historical Conditions Report COASTAL GEOLOGIC SERVICES, INC.
19
Fluvial Processes
Tidal Processes
Wave Processes
Tidal Channel LagoonDrowned
Channel Lagoon
Delta Lagoon
Drowned Channel
Longshore Lagoon
Tidal Channel Estuary
Delta
Estuary geomorphic types are defined by processes
along a continuum
Figure 6. Estuary geomorphic type by tertiary diagram (McBride and Beamer 2005). Table 6a and 6b. Accretion Shoreform types for historic (pre-development) Accretion Shoreforms (6a. simplified, 6b descriptive). The landscape features listed in the description for each Accretion Shoreform type were identifiable in the two primary mapping references (t-sheets and 1936 aerial photos), and in secondary mapping references (geologic and topographic maps) depending on the size of the feature and the scale of the best available geologic map. Examples of each Accretion Shoreform type follow descriptions. Most examples are sites in their historic condition due to the near complete elimination of these shoretypes across the study area, from abundant modifications and development. 6a. Nearshore Habitat Type
Accretion Shoreform Type Description
Stream mouth A stream mouth where fluvial processes contribute sediment to net shore-drift cells, e.g. Dilworth and Gorsuch Creeks on eastern Vashon Island.
Delta lagoon A spit, behind which is a stream delta and possibly an open water impoundment and/or marsh channel complex, e.g. historic Des Moines Creek estuary.
Drowned channel lagoon
A spit, behind which is a drowned stream channel and possibly an open water impoundment and/or marsh channel complex, e.g. historic Raabs lagoon, Maury Island.
Estuaries
Longshore lagoon A spit, behind which is an open water impoundment and /or marsh channel complex, e.g. Point Heyer, Vashon Island.
Open beaches
Depositional open beach
An open beach with a broad, low backshore, backshore vegetation community and/or accumulated drift logs, e.g. Alki Beach, West Seattle.
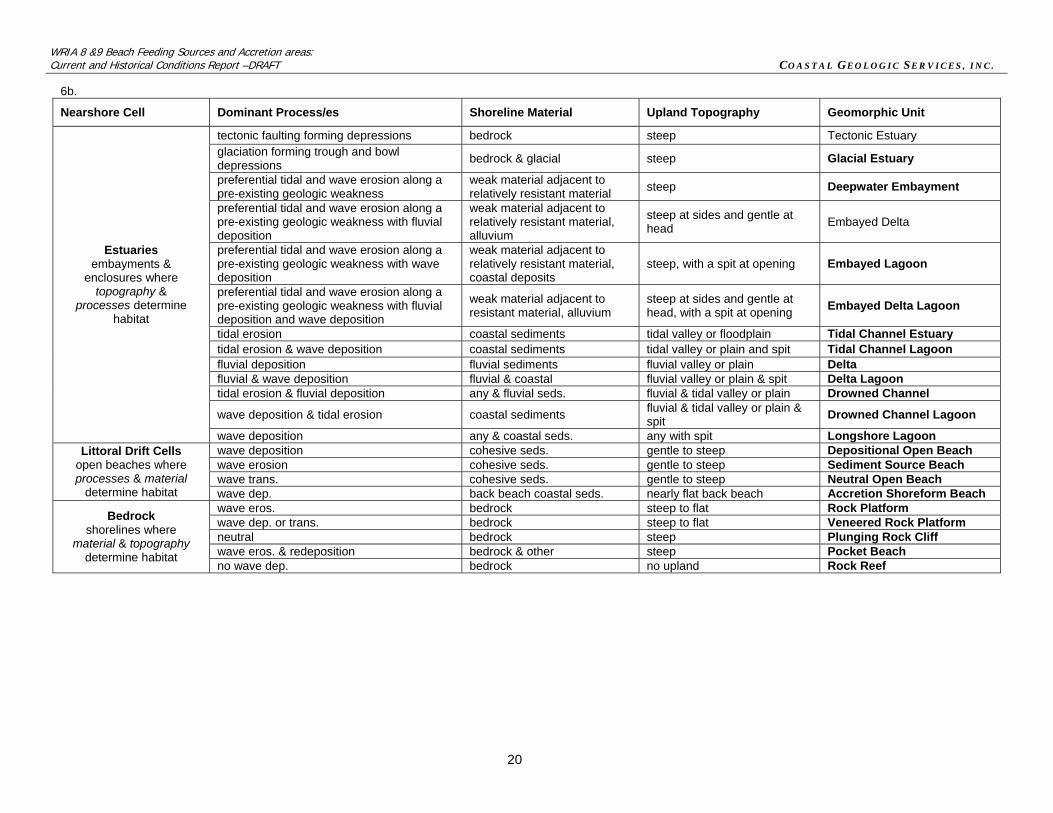
WRIA 8 &9 Beach Feeding Sources and Accretion areas: Current and Historical Conditions Report –DRAFT COASTAL GEOLOGIC SERVICES, INC.
20
6b.
Nearshore Cell Dominant Process/es Shoreline Material Upland Topography Geomorphic Unit
tectonic faulting forming depressions bedrock steep Tectonic Estuary glaciation forming trough and bowl depressions bedrock & glacial steep Glacial Estuary
preferential tidal and wave erosion along a pre-existing geologic weakness
weak material adjacent to relatively resistant material steep Deepwater Embayment
preferential tidal and wave erosion along a pre-existing geologic weakness with fluvial deposition
weak material adjacent to relatively resistant material, alluvium
steep at sides and gentle at head Embayed Delta
preferential tidal and wave erosion along a pre-existing geologic weakness with wave deposition
weak material adjacent to relatively resistant material, coastal deposits
steep, with a spit at opening Embayed Lagoon
preferential tidal and wave erosion along a pre-existing geologic weakness with fluvial deposition and wave deposition
weak material adjacent to resistant material, alluvium
steep at sides and gentle at head, with a spit at opening Embayed Delta Lagoon
tidal erosion coastal sediments tidal valley or floodplain Tidal Channel Estuary tidal erosion & wave deposition coastal sediments tidal valley or plain and spit Tidal Channel Lagoon fluvial deposition fluvial sediments fluvial valley or plain Delta fluvial & wave deposition fluvial & coastal fluvial valley or plain & spit Delta Lagoon tidal erosion & fluvial deposition any & fluvial seds. fluvial & tidal valley or plain Drowned Channel
wave deposition & tidal erosion coastal sediments fluvial & tidal valley or plain & spit Drowned Channel Lagoon
Estuaries embayments &
enclosures where topography &
processes determine habitat
wave deposition any & coastal seds. any with spit Longshore Lagoon wave deposition cohesive seds. gentle to steep Depositional Open Beach wave erosion cohesive seds. gentle to steep Sediment Source Beach wave trans. cohesive seds. gentle to steep Neutral Open Beach
Littoral Drift Cells open beaches where processes & material
determine habitat wave dep. back beach coastal seds. nearly flat back beach Accretion Shoreform Beach wave eros. bedrock steep to flat Rock Platform wave dep. or trans. bedrock steep to flat Veneered Rock Platform neutral bedrock steep Plunging Rock Cliff wave eros. & redeposition bedrock & other steep Pocket Beach
Bedrock shorelines where
material & topography determine habitat
no wave dep. bedrock no upland Rock Reef
Final WRIA 8 &9 Beach Feeding Sources and Accretion Areas: Current and Historical Conditions Report COASTAL GEOLOGIC SERVICES, INC.
21
Mapping Methods
Historic accretion shoreforms were mapped by systematically comparing historic t-sheet maps and an interpretation of those maps based on surveyor notes (Collins and Sheikh, 2005), and historic vertical aerial photos from 1936. Comparisons were made using GIS software to overlay images or by traditional geomorphic image analysis methods when data were not available digitally. Geologic maps (1:100,000 and 1:24,000 where available), and topographic maps (1:24,000) were used to corroborate interpretation of the t-sheets and aerial photos. All T-sheets, aerial photos for the mainland, topographic maps, and 1:100,000 scale geologic maps were available digitally. Aerial photos and the 1:24,000 geologic maps for Maury and Vashon islands were not available digitally. Comparisons between data sets were made using landmarks and distance measurements to locate features being mapped. Historic data were compiled in an ARCGIS polyline shapefile created by segmenting the DNR Shorezone shoreline. Segments with two or more sources confirming the presence of an accretion shoreform were labeled “AS” and the accretion shoreform type noted, if identifiable (Table 6a). If only one source showed accretion shoreform features, the area was labeled “AS-po” for potential accretion shoreform. The rationale for the shoreline typing was listed in the attribute table of historic accretion shoreform line segments. The Shorezone line feature class was used as a common geospatial reference for analyzing shoreline changes between historic and current conditions. Accuracy in historic mapping was limited by differences in scale and geospatial accuracy between the data sets; therefore edges of historic features are approximate and accuracy is not quantifiable. GIS work was completed in UTM10 NAD83 projection. Historic mapping accuracy is also limited by the methods and media limitation of historic datasets, particularly when reconstructing the historic locations of depositional open beaches. Workers creating the T-sheets did not specifically map depositional open beaches. Additionally, each mapper described shoreline characteristics to varying degrees of detail. Only if low-lying sand deposits or grasslands were mapped on the T-sheet along an open beach were shorelines classified as depositional open beaches. Aerial photo interpretation of depositional open beaches was limited by tree and bluff shadows on the beach. Historic depositional open beaches could only be identified in cases where the depositional open beach indicators (accumulated driftwood or backshore vegetation) were wide enough to be identifiable outside the tree and bluff shadows. Because of these limitations, historic depositional open beaches mapped should be considered a low approximation of true historic conditions. In all cases, the ‘ends’ of line segments were approximated by visually averaging the feature size in all the applicable data sources.
RESTORATION OPPORTUNITY FIELD MAPPING METHODS While mapping the current geomorphic conditions in the field, beach/shore sites exhibiting restoration potential were identified and mapped as “restoration opportunities”. This study also includes a more rigorous analysis of sediment supply potential for bluff segments that includes landscape-scale restoration prioritization focused on bluff sediment sources, which can be found in the next section. The restoration opportunities detailed in this results section was a more observational effort based on field experience and visible opportunities for coastal processes/habitat improvements. The restoration opportunities identified at each site were based on the potential action’s ability to restore coastal processes at specific sites and to remove unnecessary stressor(s) to the nearshore ecosystem. Restoration opportunities included removal of: failed/failing bulkheads, creosoted structures, anthropogenic debris on the beach, and estuarine/lagoon/stream mouth restoration, fish access improvement, and invasive species eradication. Restoration opportunities described here include actions that would restore sediment input locally or improve nearshore habitat conditions. A map and “menu” of the restoration opportunities identified during field mapping can be found in Appendix 1. Restoration opportunities calling for bulkhead removal were recommended in locations where
Final WRIA 8 &9 Beach Feeding Sources and Accretion Areas: Current and Historical Conditions Report COASTAL GEOLOGIC SERVICES, INC.
22
either the structure was already failing or failed and there was no apparent need for shore protection. A relatively small number of other sites were mapped where bulkhead(s) were structurally sound but unnecessary for erosion control within an Accretion Shoreform or other beach area that would significantly benefit from removal of the structure.
RESTORATION AND CONSERVATION PRIORITIZATION METHODS
Restoration and conservation prioritization (based on sediment sources) was performed at both the unit and drift cell scale so as to enhance the usability of this analysis. In each case (modified) historic and current Feeder Bluff and Feeder Bluff Exceptional unit HSSI scores were used to determine the relative value of each segment as a source of beach material. Because units falling within Elliott Bay were not scored using the HSSI and most of the shoreline is exceptionally modified from its pre-development condition, this area was excluded from this portion of the analysis.
Individual Unit Prioritization The first step in prioritizing historic sediment sources for restoration was to identify the highest HSSI scoring units. The highest scoring units were considered to be the greatest historic sources of sediment per lineal shore foot and therefore high restoration priorities. Units that scored higher than one standard deviation above the mean should be considered the highest restoration priority when assessing individual units regardless of their context within the drift cell. The top 3 scoring historic (currently modified) sediment sources in each drift cell were identified and can be used to select the restoration site(s) of the highest priority within specific drift cells. These same steps were repeated for all currently intact sediment sources, so as to clearly identify bluff units that are of high conservation priority. Current sediment sources that scored higher than one standard deviation above the mean are of the greatest priority without regard for landscape context. For example, preserving these sediment sources will ensure the conservation of a sediment source that is contributing substantial sediment to the nearshore. The 3 top scoring currently intact sediment sources in each drift cell were identified so as to enable managers to select the highest priority bluff conservation site(s) within a given drift cell.
Drift Cell Prioritization The final step of the restoration and conservation prioritization was completed at the drift cell scale. The fundamental approach underlying this step was that drift cells that have lost more high-quality Feeder Bluff units to modification are high priority restoration and conservation drift cells. Or alternatively, drift cells with the least percent of intact sediment sources are in greater need of restoring modified bluff units and conserving those that remain intact. Down-drift habitats or occurrence of particular biological components were not considered in this analysis, as this analysis relied strictly on physical parameters. Each drift cell was ranked by calculating the percent of intact sediment sources (relative to historic conditions) in the drift cell, and then weighting that number by the score(s) of the individual current and historic sediment units that make up that drift cell. The first step (Step A) of the calculation was to multiply each shore unit score by the percent of the historic sediment source that it encompassed. This step added the value of the (sediment source) unit score to the portion of the cell that it made up. Step A was repeated for all current and historic sediment source units. Next (Step B), the products of each unit score and % historic sediment source were summed. This value was the numerator. To calculate the denominator (Step C), each current shore unit score was multiplied by the percent of the historic sediment source that it encompassed. This step was repeated for all current sediment source units. These products were summed (Step D), to produce the denominator of the prioritization score for a drift cell.
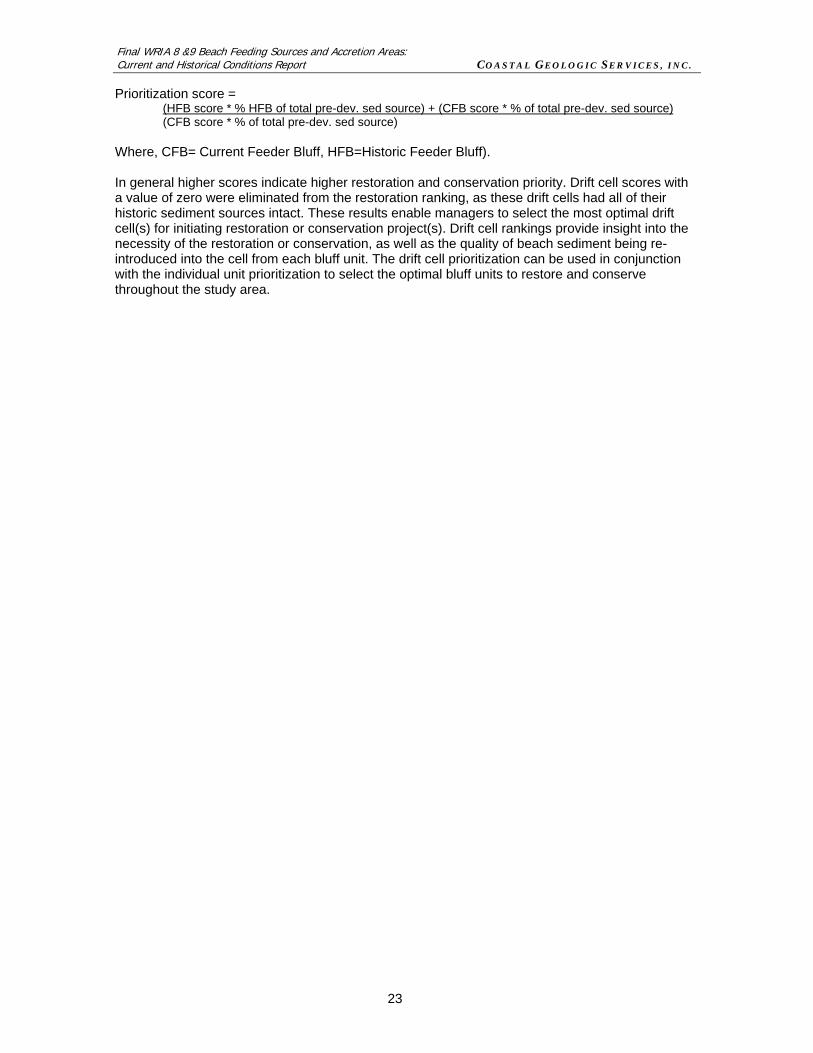
Final WRIA 8 &9 Beach Feeding Sources and Accretion Areas: Current and Historical Conditions Report COASTAL GEOLOGIC SERVICES, INC.
23
Prioritization score = (HFB score * % HFB of total pre-dev. sed source) + (CFB score * % of total pre-dev. sed source) (CFB score * % of total pre-dev. sed source)
Where, CFB= Current Feeder Bluff, HFB=Historic Feeder Bluff). In general higher scores indicate higher restoration and conservation priority. Drift cell scores with a value of zero were eliminated from the restoration ranking, as these drift cells had all of their historic sediment sources intact. These results enable managers to select the most optimal drift cell(s) for initiating restoration or conservation project(s). Drift cell rankings provide insight into the necessity of the restoration or conservation, as well as the quality of beach sediment being re-introduced into the cell from each bluff unit. The drift cell prioritization can be used in conjunction with the individual unit prioritization to select the optimal bluff units to restore and conserve throughout the study area.
Final WRIA 8 &9 Beach Feeding Sources and Accretion Areas: Current and Historical Conditions Report COASTAL GEOLOGIC SERVICES, INC.
24
RESULTS OF CURRENT AND HISTORIC CONDITIONS MAPPING This section summarizes the results of these analyses of current and historic geomorphic conditions by drift-cell (Table 7, and Map 1 in Appendix 2), from north to south along the mainland and then clockwise around Vashon and Maury Islands. Results are organized by sub-area (Map 2, Appendix 2). Maps 3-7 (Appendix 2) display the current and historic sediment sources. Maps 8 and 9 (Appendix 2) display ancillary data, which includes recent landslides and toe erosion observed during field mapping. Maps 8-12 (Appendix 2) display current and historic Accretion Shoreforms. All mapping presented in this report was performed by CGS.
Northern Railroad Northern Railroad was the northernmost sub-area, extending from the northern boundary of the study area, located approximately 1,500 ft west of City of Mukilteo’s most northeast boundary, to central Meadow Point, where the railway deviates inland and was no longer adjacent to the shore (Map 2, Appendix 2). This sub-area is characterized by the Burlington Northern Santa Fe (BNSF) railway and seawall, which runs adjacent to, and occasionally over, 73.7% of the (linear) marine shoreline. The seawall and associated backfill were constructed into the upper foreshore between 1889 and 1891 to defend the overlying railroad from wave erosion and burial by landslide colluvium from adjacent receding bluffs. As a result, the structure has eliminated the primary nearshore sediment source. Without bluff-derived sediment, sediment derived from small streams is the largest remaining source of shore-drift sediment (Johannessen 1992). Isolated Accretion Shoreforms were found throughout the subarea waterward of the railroad tracks either as remnants of historic Accretion Shoreforms or derived from small streams. Occasionally landslide colluvium has been transported over the railroad and into the nearshore, though these events are far less common than in pre-development conditions and do not contribute the substantial volumes of sediment to the nearshore that it once did. The shores of southern Snohomish County are comprised of unconsolidated, Quaternary sediment of glacial and non-glacial origin. Bluffs range in elevation from 75-200 ft along shore (Johannessen 1992). Net shore-drift direction is predominantly south to north (net shore-drift cells SN-2, SN-3), though the net shore-drift cell KI-2-1, with southward transport, is located at the south end of the sub-area. Each of 3 net shore-drift cells within the Northern Railroad sub-area (SN-2, SN-3, KI-2-1) and one region of negligible drift (SN-2/SN-3-NAD), are described below. SN-2 The northern-most net shore-drift cell (SN-2) originates approximately 1,000 ft north of the Edmonds ferry terminal and extends approximately 10.7 miles to just beyond Elliott Point in Mukilteo. Eighty-nine percent (88.7%) of the shores of this drift cell are modified by the BNSF seawall (Table 8). Landslides delivered sediment over the top of the BNSF railroad in 3% of the drift cell. The remaining 11.3% consisted of small Accretion Shoreform typically formed from sediment derived from nearby streams (Tables 8 and 9). Historic – Currently there are no intact bluff sediment sources in this drift cell (Table 10). However, historic mapping and analysis performed by CGS shows that at least 74.2% of this cell was an active sediment source prior to construction of the BNSF seawall. Results of the HSSI scoring indicated that prior to modification, 55.6% of the drift cell was previously Feeder Bluff Exceptional and 18.6% was Feeder Bluff (Table 11). An additional 6.8% of the drift cell was Potential Feeder Bluff. This accounts for a 100% loss of the sediment sources in this drift cell due to anthropogenic alteration of the nearshore, or in this case, the BNSF seawall.

WRIA 8 & 9 Feeder Bluff Study Table 7. CGS and Washington State Department of Ecology net-shore-drift (NSD) cell names and description of locations
Drift Cell Name DOE Name(s) Cell Length (ft) Location Within Study Area SN-2 SN-2 55,603 Mukilteo ferry to just north of Edmonds ferry landingSN-2/SN-3-NAD SN-2/SN-3 12,004 Edmonds ferry terminal to Edmonds marina SN-3 SN-3/KI-2-1 34,176 Edmonds marina (south) to north of CarkeekKI-2-1 KI-2-1 15,026 Carkeek to Shillshole KI-2-1/2-2-NAD KI-2-1/2-2 17,629 South end of Golden Gardens, Shillshole and N. Salmon BayKI-2-2 KI-2-2 2,244 Salmon Bay into ship canal - north sideKI-2-3 KI-2-3 4,135 South side of ship canal into Salmon Bay KI-2-4 KI-3-1 6,887 Shilshole Bay to Westpoint KI-3-2 KI-3-2 15,982 Magnolia Bluffs to Smith Cove KI-3-2/3-3-NAD NAD 7,584 Smith Cove marina and breakwater KI-3-3 KI-3-3 1,346 Small cell east of Smith Cove marina, heading into Smith CoveKI-4-1-NAD KI-4-1 46,719 Smith Cove and Elliot Bay KI-5-1 KI-5-1/6-1/7-1 59,326 Eastside of Duwamish head south to bay north of Three Tree PointKI-7-2 KI-7-2 8,605 Bay north of Three Tree Point to Three Tree Point KI-7-3 KI-7-3/KI-8-1 24,012 Three Tree Point south to just north of Des Moines Creek KI-8-2 KI-8-2 982 Des Moines Creek south to marina KI-8-2/8-3-NAD NAD 8,608 Des Moines marina KI-8-3 KI-8-3/9-1 10,985 South of Des Moines marina to Rodondo Beach KI-9-2 KI-9-2 25,368 Rodondo Beach to southwest Dumas BayKI-10-2 KI-10-2 1,562 Headland just west of Dumas Bay to the southwest corner Dumas BayKI-10-3 KI-10-3/PI-1-1 8,102 Headland just west of Dumas Bay southwest to Dash PointKI-12-1 KI-12-1 5,512 North Vashon - Ferry Terminal to Dolphin PointKI-12-2 KI-12-2 5,581 East Vashon - Dolphin point to Aquarium siteKI-12-3 KI-12-3 11,586 Aquarium site to Point Beal KI-12-4 KI-12-4/13-1 7,558 Point Beal to Vashon Landing KI-13-2 KI-13-2 11,648 Vashon Landing to Point HeyerKI-13-3 KI-13-3 843 Point Heyer to EllisportKI-13-4 KI-13-4 1,485 East Vashon Ellisport to corner of Tramp Harbor KI-13-5 KI-13-5 2,166 East Vahon - Tramp Harbor north of PortageKI-13-6 KI-14-1/13-6 19,757 East Vashon/Maury - Tramp Harbor, including Portage, to Pt Robinson KI-14-2 KI-13-7/14-2 29,721 East Maury to South Maury Island - Point Robinson to Piner Point KI-13-8 KI-13-8 17,489 Piner Point to Dockton Boat rampKI-13-9 KI-13-9 2,254 Quartermaster Harbor - Docton Boat ramp to the northeast
KI-13-10 KI-13-10 8,625 Quartermaster Harbor - NE of Docton boat ramp to Raab's Lagoon opening
KI-13-10/13-11-NAD NAD 3,288 Raab's Lagoon, internal shoreKI-13-11 KI-13-11 587 Quartermaster Harbor - west of Raab's lagoon KI-13-12 KI-13-12 5,436 Quartermaster Harbor-west of Raab's lagoon to PortageKI-13-13 KI-13-13 2,677 Quartermaster Harbor - east into PortageKI-13-14 KI-13-14 1,529 Quartermaster Harbor - miniestuary with fish barrier - northKI-13-15 KI-13-15 2,903 Quartermaster Harbor - mini-estuary east to Judd Creek estuary KI-13-16-NE KI-13-16 607 Quartermaster Harbor - Judd creek estuary - NE shoreKI-13-16-SW KI-13-16 901 Quartermaster Harbor - Judd creek estuary- SW shroeKI-13-17 KI-13-17 3,936 Quartermaster harbor - Judd creek estuary to Burton KI-13-18 KI-13-18 5,084 Quartermaster Harbor - west shore, Burton around Burton acres park KI-13-19 KI-13-19 1,580 Quartermaster Harbor - west shore, Burton park to boatrampKI-13-20 KI-13-20 30,641 Quartermaster Harbor - west shore, Burton boat ramp to Neill point KI-13-21 KI-13-21 4,850 South Vashon - Neill Point to TahlequahKI-13-22 KI-13-22 4,867 South - West Vashon - Tahlequah to north Pt DalcoKI-13-23 KI-13-23 23,777 Southwest Vashon - north of Pt Dalco to Sanford PointKI-13-24 KI-13-24 2,150 West Vashon - Sandford Point to south of Christensen CoveKI-13-25 KI-13-25 1,845 West Vashon - Christensen Creek/CoveKI-13-26 KI-13-26 3,626 West Vashon - Lisabuela to south of Green Valley Creek KI-13-27-S KI-13-27-S 653 West Vashon - Green Valley Creek estuary- south KI-13-27-N KI-13-27-N 600 West Vashon - Green Valley Creek north KI-13-28 KI-11-8 17,982 West Vashon - including Sunset beach - long stretch of shorelineKI-11-7 KI-11-7 2,483 West Vashon - Light north KI-11-6 KI-11-6 4,517 West Vashon - Peter Point south KI-11-5 KI-11-5 2,933 Peter Point to Fern CoveKI-11-4 KI-11-4 1,314 Fern Cove estuary - south KI-11-3 KI-11-3 2,600 Fern Cove estuary - north KI-11-2 KI-11-2 9,051 Northwest Vashon Island - Sandy Beach to Vashon HeightsKI-11-1 KI-11-1 1,338 North Vashon Island- Vashon Heights

WRIA 8 & 9 Feeder Bluff Study - Current Conditions
FBE FB TZ AS MOD MOD-RR
SN-2 55,603 0.0% 0.0% 0.0% 11.3% 0.0% 88.7% 3.0% 0.0%SN-2/SN-3-NAD 12,004 0.0% 0.0% 0.0% 17.5% 75.5% 7.0% 0.0% 0.0%SN-3 34,176 0.0% 0.0% 0.0% 28.7% 4.8% 66.5% 0.0% 0.0%KI-2-1 15,026 0.0% 0.0% 0.0% 21.7% 0.0% 78.3% 1.5% 0.0%KI-2-1/2-2 17,629 0.0% 0.0% 0.0% 3.5% 96.5% 0.0% 0.0% 0.0%KI-2-2 2,244 0.0% 0.0% 4.0% 1.2% 94.9% 0.0% 0.0% 0.0%KI-2-3 4,135 0.0% 7.1% 0.0% 0.0% 92.9% 0.0% 0.0% 0.0%KI-2-4 6,887 0.0% 17.8% 2.2% 36.9% 43.1% 0.0% 11.7% 11.7%KI-3-2 15,982 22.5% 11.8% 1.5% 11.9% 52.3% 0.0% 27.0% 20.7%KI-3-2/3-3 7,584 0.0% 0.0% 0.0% 0.0% 100.0% 0.0% 0.0% 0.0%KI-3-3 1,346 0.0% 0.0% 0.0% 11.1% 88.9% 0.0% 0.0% 0.0%KI-4-1-NAD 46,718 0.0% 0.2% 0.5% 0.3% 99.0% 0.0% 0.0% 0.0%KI-5-1 59,326 2.3% 3.0% 0.7% 34.7% 59.2% 0.0% 1.2% 0.2%KI-7-2 8,605 0.0% 0.7% 0.0% 22.8% 76.5% 0.0% 0.0% 0.0%KI-7-3 24,012 0.0% 16.4% 3.6% 39.7% 40.3% 0.0% 6.5% 6.4%KI-8-2 982 0.0% 0.0% 0.0% 31.7% 68.3% 0.0% 0.0% 0.0%KI-8-2/8-3-NAD 8,608 0.0% 0.0% 0.0% 0.0% 100.0% 0.0% 0.0% 0.0%KI-8-3 10,985 16.1% 12.0% 0.0% 16.6% 55.3% 0.0% 6.4% 19.7%KI-9-2 25,368 0.0% 16.5% 4.2% 20.4% 58.8% 0.0% 2.2% 10.7%KI-10-2 1,562 0.0% 39.6% 37.8% 18.1% 4.5% 0.0% 42.5% 45.7%KI-10-3 8,101 0.0% 57.9% 6.9% 7.9% 27.3% 0.0% 39.8% 44.7%KI-12-1 5,512 0.0% 25.4% 0.0% 2.7% 71.9% 0.0% 1.1% 35.2%KI-12-2 5,581 0.0% 19.9% 8.9% 28.3% 42.9% 0.0% 3.8% 4.4%KI-12-3 11,586 0.0% 36.6% 0.8% 12.3% 50.4% 0.0% 3.0% 7.6%KI-12-4 7,558 0.0% 47.0% 1.4% 16.2% 35.4% 0.0% 10.5% 9.7%KI-13-2 11,648 0.0% 53.6% 12.3% 23.0% 11.2% 0.0% 21.1% 23.0%KI-13-3 843 0.0% 0.0% 0.0% 0.0% 100.0% 0.0% 5.6% 0.0%KI-13-4 1,485 0.0% 0.0% 0.0% 62.0% 38.0% 0.0% 0.0% 0.0%KI-13-5 2,166 0.0% 0.0% 0.0% 3.6% 96.4% 0.0% 0.0% 0.0%KI-13-6 19,757 5.8% 36.4% 6.2% 28.6% 23.0% 0.0% 22.7% 12.2%KI-14-2 29,721 15.8% 28.4% 8.5% 27.3% 20.1% 0.0% 16.6% 10.2%KI-13-8 17,489 0.0% 27.8% 4.6% 21.6% 46.0% 0.0% 6.7% 5.7%KI-13-9 2,254 0.0% 51.9% 0.0% 22.0% 26.1% 0.0% 3.2% 17.9%KI-13-10 8,625 0.0% 57.0% 14.4% 8.5% 20.2% 0.0% 14.6% 43.2%KI-13-11 587 0.0% 68.6% 0.0% 0.0% 31.4% 0.0% 0.0% 53.4%KI-13-12 5,436 0.0% 15.8% 1.8% 8.8% 73.6% 0.0% 1.6% 5.7%KI-13-13 2,677 0.0% 0.0% 7.1% 40.4% 52.5% 0.0% 0.0% 0.0%KI-13-14 1,529 0.0% 0.0% 0.0% 0.0% 100.0% 0.0% 0.0% 0.0%KI-13-15 2,903 0.0% 0.0% 3.2% 0.0% 96.8% 0.0% 0.0% 0.0%KI-13-16-NE 607 0.0% 0.0% 0.0% 86.7% 13.3% 0.0% 0.0% 0.0%KI-13-16-SW 901 0.0% 0.0% 0.0% 46.9% 53.1% 0.0% 0.0% 6.3%KI-13-17 3,935 0.0% 0.0% 6.9% 7.4% 85.7% 0.0% 0.0% 0.0%KI-13-18 5,084 0.0% 6.4% 22.0% 3.9% 67.7% 0.0% 0.0% 0.0%KI-13-19 1,580 0.0% 0.0% 0.0% 39.4% 60.6% 0.0% 16.7% 0.0%KI-13-20 30,641 2.2% 28.3% 2.8% 15.0% 51.8% 0.0% 15.5% 10.8%KI-13-21 4,850 13.9% 8.8% 1.4% 5.0% 70.9% 0.0% 10.8% 1.6%KI-13-22 4,867 40.0% 9.9% 3.1% 4.3% 42.7% 0.0% 22.5% 43.8%KI-13-23 23,777 13.0% 28.8% 13.1% 16.7% 28.4% 0.0% 16.0% 18.5%KI-13-24 2,150 73.0% 20.1% 0.0% 2.1% 4.9% 0.0% 46.7% 0.0%KI-13-25 1,845 0.0% 22.7% 32.0% 35.3% 9.9% 0.0% 18.4% 0.0%KI-13-26 3,626 0.0% 31.8% 52.5% 15.7% 0.0% 0.0% 12.7% 29.4%KI-13-27-S 653 0.0% 26.6% 48.0% 25.4% 0.0% 0.0% 0.0% 71.4%KI-13-27-N 600 0.0% 77.6% 0.0% 22.4% 0.0% 0.0% 0.0% 0.0%KI-13-28 17,982 0.0% 44.3% 16.6% 11.4% 27.7% 0.0% 15.6% 16.1%KI-11-7 2,483 0.0% 24.2% 10.3% 14.2% 51.3% 0.0% 3.5% 23.7%KI-11-6 4,517 0.0% 23.3% 11.6% 39.6% 25.5% 0.0% 5.8% 15.0%KI-11-5 2,933 0.0% 30.7% 4.2% 9.0% 56.0% 0.0% 1.2% 29.6%KI-11-4 1,313 0.0% 0.0% 8.5% 36.6% 54.9% 0.0% 0.0% 0.0%KI-11-3 2,600 0.0% 0.0% 21.7% 30.1% 48.3% 0.0% 0.0% 0.0%KI-11-2 9,051 0.0% 5.8% 6.8% 24.5% 62.9% 0.0% 4.4% 4.8%KI-11-1 1,338 0.0% 12.7% 0.0% 87.3% 0.0% 0.0% 0.0% 0.0%
Table 8. CGS Current Conditions Field Mapping. FBE = Feeder Bluff Exceptional. FB = Feeder Bluff. TZ = Transport Zone. AS = Accretion Shoreform. MOD = Modified. MOD-RR = Modified by BNSF Railway. NAD = No Appreciable Drift. LS = Landslide. TE = Toe Erosion.
CGS SHORE TYPES
Drift Cell Name TELSLength (ft)

AS AS-SM AS-MB AS-MH AS-MI AS-SM-MB AS-SM-MHSN-2 55,603 6,257 4.5% 3.6% 0.5% 0.2% 2.3% 0.2% 0.0%SN-2/SN-3-NAD 12,004 2,102 7.8% 0.0% 2.8% 3.3% 3.6% 0.0% 0.0%SN-3 34,176 9,801 22.0% 4.8% 0.9% 0.0% 1.0% 0.0% 0.0%KI-2-1 15,026 3,255 19.1% 2.6% 0.0% 0.0% 0.0% 0.0% 0.0%KI-2-1/2-2-NAD 17,629 625 2.2% 0.0% 1.3% 0.0% 0.0% 0.0% 0.0%KI-2-2 2,244 26 0.0% 0.0% 1.2% 0.0% 0.0% 0.0% 0.0%KI-2-3 4,135 0 0.0% 0.0% 0.0% 0.0% 0.0% 0.0% 0.0%KI-2-4 6,887 2,538 14.5% 0.0% 3.9% 0.0% 18.5% 0.0% 0.0%KI-3-2 15,982 1,902 10.4% 0.9% 0.0% 0.0% 0.6% 0.0% 0.0%KI-3-2/3-3-NAD 7,584 0 0.0% 0.0% 0.0% 0.0% 0.0% 0.0% 0.0%KI-3-3 1,346 149 0.0% 0.0% 11.1% 0.0% 0.0% 0.0% 0.0%KI-4-1-NAD 46,718 129 0.0% 0.0% 0.3% 0.0% 0.0% 0.0% 0.0%KI-5-1 59,326 20,596 6.1% 1.0% 12.4% 12.5% 2.8% 0.0% 0.0%KI-7-2 8,605 1,966 4.8% 0.0% 14.7% 0.0% 3.3% 0.0% 0.0%KI-7-3 24,012 9,544 13.7% 0.0% 18.5% 3.7% 3.8% 0.0% 0.0%KI-8-2 982 312 0.0% 31.7% 0.0% 0.0% 0.0% 0.0% 0.0%KI-8-2/8-3-NAD 8,608 0 0.0% 0.0% 0.0% 0.0% 0.0% 0.0% 0.0%KI-8-3 10,985 1,828 8.4% 1.1% 7.2% 0.0% 0.0% 0.0% 0.0%KI-9-2 25,368 5,186 2.4% 0.5% 6.4% 5.6% 0.0% 1.4% 4.2%KI-10-2 1,562 282 18.1% 0.0% 0.0% 0.0% 0.0% 0.0% 0.0%KI-10-3 8,102 639 7.6% 0.3% 0.0% 0.0% 0.0% 0.0% 0.0%KI-12-1 5,512 147 2.7% 0.0% 0.0% 0.0% 0.0% 0.0% 0.0%KI-12-2 5,581 1,579 18.3% 0.0% 0.0% 10.0% 0.0% 0.0% 0.0%KI-12-3 11,586 1,420 8.6% 0.0% 0.0% 3.7% 0.0% 0.0% 0.0%KI-12-4 7,558 1,224 7.6% 6.0% 2.6% 0.0% 0.0% 0.0% 0.0%KI-13-2 11,648 2,676 16.7% 0.0% 3.8% 2.6% 0.0% 0.0% 0.0%KI-13-3 843 0 0.0% 0.0% 0.0% 0.0% 0.0% 0.0% 0.0%KI-13-4 1,485 921 15.6% 0.0% 3.5% 0.0% 42.9% 0.0% 0.0%KI-13-5 2,166 78 0.0% 0.0% 0.0% 0.0% 3.6% 0.0% 0.0%KI-13-6 19,757 5,658 5.4% 1.3% 3.5% 13.7% 4.7% 0.0% 0.0%KI-14-2 29,721 8,100 10.1% 0.0% 10.4% 0.0% 6.8% 0.0% 0.0%KI-13-8 17,489 3,770 7.0% 0.1% 2.2% 0.0% 12.2% 0.0% 0.0%KI-13-9 2,254 495 0.0% 0.0% 0.0% 0.0% 22.0% 0.0% 0.0%KI-13-10 8,625 729 1.8% 5.1% 0.0% 1.6% 0.0% 0.0% 0.0%KI-13-11 587 0 0.0% 0.0% 0.0% 0.0% 0.0% 0.0% 0.0%KI-13-12 5,436 478 0.0% 0.0% 0.0% 8.8% 0.0% 0.0% 0.0%KI-13-13 2,677 1,082 0.0% 4.3% 16.6% 19.5% 0.0% 0.0% 0.0%KI-13-14 1,529 0 0.0% 0.0% 0.0% 0.0% 0.0% 0.0% 0.0%KI-13-15 2,903 0 0.0% 0.0% 0.0% 0.0% 0.0% 0.0% 0.0%KI-13-16-NE 607 526 0.0% 86.7% 0.0% 0.0% 0.0% 0.0% 0.0%KI-13-16-SW 901 423 12.2% 0.0% 0.0% 0.0% 0.0% 0.0% 0.0%KI-13-17 3,935 291 5.1% 1.3% 0.0% 0.0% 0.0% 0.0% 0.0%KI-13-18 5,084 197 1.3% 0.0% 0.0% 0.0% 2.6% 0.0% 0.0%KI-13-19 1,580 622 20.2% 0.0% 0.0% 19.2% 0.0% 0.0% 0.0%KI-13-20 30,641 4,583 6.1% 0.1% 3.8% 3.8% 1.2% 0.0% 0.0%KI-13-21 4,850 243 2.2% 0.0% 0.0% 2.8% 0.0% 0.0% 0.0%KI-13-22 4,867 208 0.0% 0.0% 0.0% 0.0% 4.3% 0.0% 0.0%KI-13-23 23,777 3,969 3.4% 3.5% 2.4% 7.4% 0.0% 0.0% 0.0%KI-13-24 2,150 45 0.0% 2.1% 0.0% 0.0% 0.0% 0.0% 0.0%KI-13-25 1,845 652 0.0% 35.3% 0.0% 0.0% 0.0% 0.0% 0.0%KI-13-26 3,626 568 0.0% 15.7% 0.0% 0.0% 0.0% 0.0% 0.0%KI-13-27-S 653 166 0.0% 25.4% 0.0% 0.0% 0.0% 0.0% 0.0%KI-13-27-N 600 134 0.0% 22.4% 0.0% 0.0% 0.0% 0.0% 0.0%KI-13-28 17,982 2,049 0.8% 4.5% 0.0% 3.9% 1.9% 0.0% 0.2%KI-11-7 2,483 353 14.2% 0.0% 0.0% 0.0% 0.0% 0.0% 0.0%KI-11-6 4,517 1,787 18.0% 9.5% 8.6% 3.5% 0.0% 0.0% 0.0%KI-11-5 2,933 264 9.0% 0.0% 0.0% 0.0% 0.0% 0.0% 0.0%KI-11-4 1,313 481 4.3% 20.4% 0.0% 12.0% 0.0% 0.0% 0.0%KI-11-3 2,600 782 0.0% 21.9% 8.2% 0.0% 0.0% 0.0% 0.0%KI-11-2 9,051 2,220 5.8% 0.0% 2.5% 6.2% 10.1% 0.0% 0.0%KI-11-1 1,338 1,168 0.0% 0.0% 0.0% 0.0% 87.3% 0.0% 0.0%
Table 9. CGS Current Conditions Field Mapping. Summary of Accretion shoreform types. AS=Accretion shoreform, SM=Stream mouth, MB=Modified backshore, MH=Modified at or below the High water mark, MI=Modified within the intertidal.
WRIA 8 &9 Feeder Bluff Study
Accretion Shoreform (% of Drift Cell)Drift Cell NameDrift cell Length
(ft)
Accretion Shoreform Length (ft)

WRIA 8 &9 Feeder Bluff Study
Drift Cell Name Drift Cell Length (ft)
% Pre-dev Sed. Source
% Current Sed. Source
Sediment Source Lost (ft)
% Sed. Source Lost
SN-2 55,603 74.2% 0.0% 41,239 100.0%SN-2/SN-3-NAD 12,004 0.0% 0.0% 0 0.0%SN-3 34,176 62.3% 0.0% 21,284 100.0%KI-2-1 15,026 78.3% 0.0% 11,771 100.0%KI-2-1/2-2-NAD 17,629 37.3% 0.0% 6,584 100.0%KI-2-2 2,244 0.0% 0.0% 0 0.0%KI-2-3 4,135 47.6% 7.1% 1,676 85.1%KI-2-4 6,887 60.9% 17.8% 2,966 70.7%KI-3-2 15,982 86.6% 34.3% 8,362 60.4%KI-3-2/3-3-NAD 7,584 29.7% 0.0% 2,254 100.0%KI-3-3 1,346 0.0% 0.0% 0 0.0%KI-4-1-NAD 125,677 24.0% 0.0% 30,162 100.0%KI-5-1 59,326 23.4% 5.4% 10,705 77.1%KI-7-2 8,605 43.4% 0.7% 3,677 98.5%KI-7-3 24,012 47.3% 16.4% 7,420 65.4%KI-8-2 982 41.5% 0.0% 408 100.0%KI-8-2/8-3-NAD 8,608 0.0% 0.0% 0 0.0%KI-8-3 10,985 83.4% 28.1% 6,073 66.3%KI-9-2 25,368 30.2% 16.5% 3,465 45.3%KI-10-2 1,562 39.6% 39.6% 0 0.0%KI-10-3 8101.5 83% 58% 2,066 30.5%KI-12-1 5,512 97.3% 25.4% 3,965 73.9%KI-12-2 5,581 61.4% 19.9% 2,318 67.6%KI-12-3 11,586 36.6% 36.6% 0 0.0%KI-12-4 7,558 71.5% 47.0% 1,851 34.3%KI-13-2 11,648 56.6% 53.6% 354 5.4%KI-13-3 843 100.0% 0.0% 843 100.0%KI-13-4 1,485 31.8% 0.0% 473 100.0%KI-13-5 2,166 96.4% 0.0% 2,088 100.0%KI-13-6 19,757 59.4% 42.2% 3,410 29.0%KI-14-2 29,721 50.6% 44.2% 1,905 12.7%KI-13-8 17,489 56.4% 27.8% 4,987 50.6%KI-13-9 2,254 51.9% 51.9% 0 0.0%KI-13-10 8,625 57.0% 57.0% 0 0.0%KI-13-11 587 68.6% 68.6% 0 0.0%KI-13-12 5,436 30.1% 15.8% 778 47.6%KI-13-13 2,677 0.0% 0.0% 0 0.0%KI-13-14 1,529 0.0% 0.0% 0 0.0%KI-13-15 2,903 0.0% 0.0% 0 0.0%KI-13-16-NE 607 0.0% 0.0% 0 0.0%KI-13-16-SW 901 53.1% 0.0% 478 100.0%KI-13-17 3,935 28.2% 0.0% 1,112 100.0%KI-13-18 5,084 17.5% 6.4% 564 63.3%KI-13-19 1,580 0.0% 0.0% 0 0.0%KI-13-20 30,641 71.1% 30.4% 12,446 57.2%KI-13-21 4,850 67.9% 22.7% 2,194 66.6%KI-13-22 4,867 62.9% 49.9% 630 20.6%KI-13-23 23,777 43.7% 41.8% 451 4.3%KI-13-24 2,150 93.1% 93.1% 0 0.0%KI-13-25 1,845 32.6% 22.7% 184 30.5%KI-13-26 3,626 31.8% 31.8% 0 0.0%KI-13-27-S 653 26.6% 26.6% 0 0.0%KI-13-27-N 600 77.6% 77.6% 0 0.0%KI-13-28 17,982 50.3% 44.3% 1,081 12.0%KI-11-7 2,483 24.2% 24.2% 0 0.0%KI-11-6 4,517 23.3% 23.3% 0 0.0%KI-11-5 2,933 39.2% 30.7% 250 21.7%KI-11-4 1,313 0.0% 0.0% 0 0.0%KI-11-3 2,600 0.0% 0.0% 0 0.0%KI-11-2 9,051 5.8% 5.8% 0 0.0%KI-11-1 1,338 12.7% 12.7% 0 0.0%
Table 10. Predevelopment (historic) sediment sources relative to current conditions sorted by drift cell. Sediment source data represents sum of the lengths of Feeder Bluffs and Feeder Bluff Exceptional shoretypes. Pre-development Sed. Source = feeder bluff + feeder bluff exceptional (current + historic). Current Sed. Source = currently intact feeder bluffs + feeder bluff exceptional shoretypes.
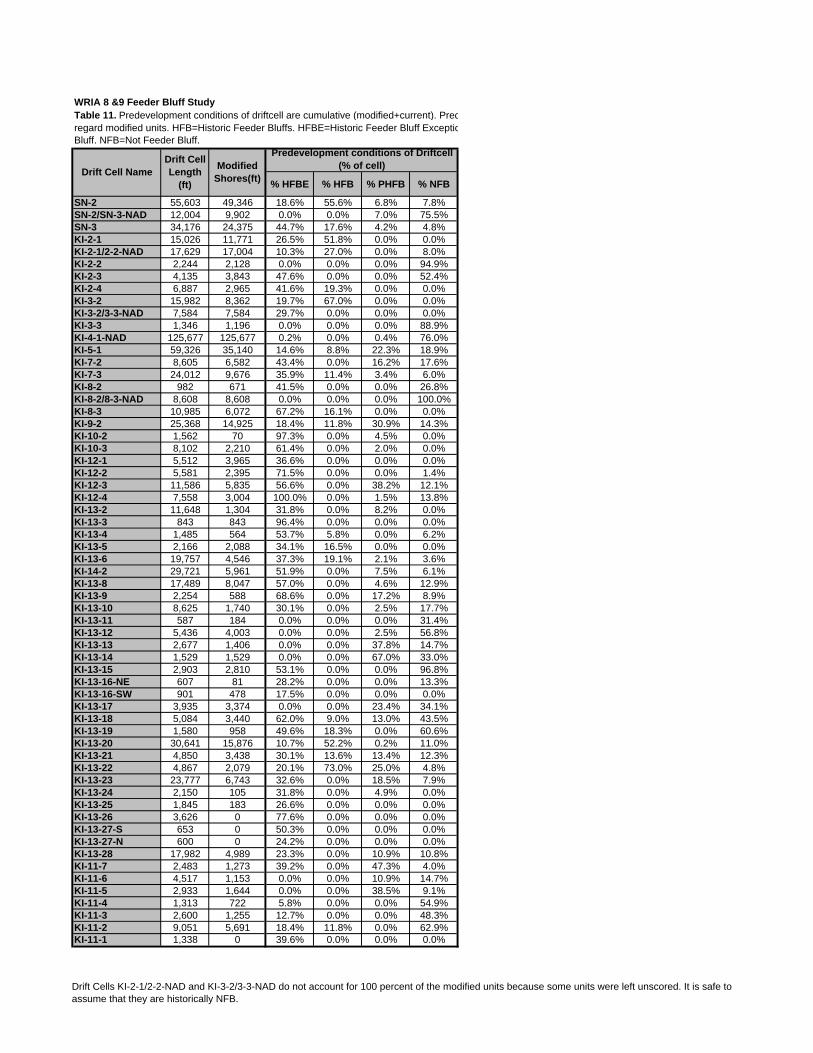
WRIA 8 &9 Feeder Bluff Study
% HFBE % HFB % PHFB % NFB
SN-2 55,603 49,346 18.6% 55.6% 6.8% 7.8%SN-2/SN-3-NAD 12,004 9,902 0.0% 0.0% 7.0% 75.5%SN-3 34,176 24,375 44.7% 17.6% 4.2% 4.8%KI-2-1 15,026 11,771 26.5% 51.8% 0.0% 0.0%KI-2-1/2-2-NAD 17,629 17,004 10.3% 27.0% 0.0% 8.0%KI-2-2 2,244 2,128 0.0% 0.0% 0.0% 94.9%KI-2-3 4,135 3,843 47.6% 0.0% 0.0% 52.4%KI-2-4 6,887 2,965 41.6% 19.3% 0.0% 0.0%KI-3-2 15,982 8,362 19.7% 67.0% 0.0% 0.0%KI-3-2/3-3-NAD 7,584 7,584 29.7% 0.0% 0.0% 0.0%KI-3-3 1,346 1,196 0.0% 0.0% 0.0% 88.9%KI-4-1-NAD 125,677 125,677 0.2% 0.0% 0.4% 76.0%KI-5-1 59,326 35,140 14.6% 8.8% 22.3% 18.9%KI-7-2 8,605 6,582 43.4% 0.0% 16.2% 17.6%KI-7-3 24,012 9,676 35.9% 11.4% 3.4% 6.0%KI-8-2 982 671 41.5% 0.0% 0.0% 26.8%KI-8-2/8-3-NAD 8,608 8,608 0.0% 0.0% 0.0% 100.0%KI-8-3 10,985 6,072 67.2% 16.1% 0.0% 0.0%KI-9-2 25,368 14,925 18.4% 11.8% 30.9% 14.3%KI-10-2 1,562 70 97.3% 0.0% 4.5% 0.0%KI-10-3 8,102 2,210 61.4% 0.0% 2.0% 0.0%KI-12-1 5,512 3,965 36.6% 0.0% 0.0% 0.0%KI-12-2 5,581 2,395 71.5% 0.0% 0.0% 1.4%KI-12-3 11,586 5,835 56.6% 0.0% 38.2% 12.1%KI-12-4 7,558 3,004 100.0% 0.0% 1.5% 13.8%KI-13-2 11,648 1,304 31.8% 0.0% 8.2% 0.0%KI-13-3 843 843 96.4% 0.0% 0.0% 0.0%KI-13-4 1,485 564 53.7% 5.8% 0.0% 6.2%KI-13-5 2,166 2,088 34.1% 16.5% 0.0% 0.0%KI-13-6 19,757 4,546 37.3% 19.1% 2.1% 3.6%KI-14-2 29,721 5,961 51.9% 0.0% 7.5% 6.1%KI-13-8 17,489 8,047 57.0% 0.0% 4.6% 12.9%KI-13-9 2,254 588 68.6% 0.0% 17.2% 8.9%KI-13-10 8,625 1,740 30.1% 0.0% 2.5% 17.7%KI-13-11 587 184 0.0% 0.0% 0.0% 31.4%KI-13-12 5,436 4,003 0.0% 0.0% 2.5% 56.8%KI-13-13 2,677 1,406 0.0% 0.0% 37.8% 14.7%KI-13-14 1,529 1,529 0.0% 0.0% 67.0% 33.0%KI-13-15 2,903 2,810 53.1% 0.0% 0.0% 96.8%KI-13-16-NE 607 81 28.2% 0.0% 0.0% 13.3%KI-13-16-SW 901 478 17.5% 0.0% 0.0% 0.0%KI-13-17 3,935 3,374 0.0% 0.0% 23.4% 34.1%KI-13-18 5,084 3,440 62.0% 9.0% 13.0% 43.5%KI-13-19 1,580 958 49.6% 18.3% 0.0% 60.6%KI-13-20 30,641 15,876 10.7% 52.2% 0.2% 11.0%KI-13-21 4,850 3,438 30.1% 13.6% 13.4% 12.3%KI-13-22 4,867 2,079 20.1% 73.0% 25.0% 4.8%KI-13-23 23,777 6,743 32.6% 0.0% 18.5% 7.9%KI-13-24 2,150 105 31.8% 0.0% 4.9% 0.0%KI-13-25 1,845 183 26.6% 0.0% 0.0% 0.0%KI-13-26 3,626 0 77.6% 0.0% 0.0% 0.0%KI-13-27-S 653 0 50.3% 0.0% 0.0% 0.0%KI-13-27-N 600 0 24.2% 0.0% 0.0% 0.0%KI-13-28 17,982 4,989 23.3% 0.0% 10.9% 10.8%KI-11-7 2,483 1,273 39.2% 0.0% 47.3% 4.0%KI-11-6 4,517 1,153 0.0% 0.0% 10.9% 14.7%KI-11-5 2,933 1,644 0.0% 0.0% 38.5% 9.1%KI-11-4 1,313 722 5.8% 0.0% 0.0% 54.9%KI-11-3 2,600 1,255 12.7% 0.0% 0.0% 48.3%KI-11-2 9,051 5,691 18.4% 11.8% 0.0% 62.9%KI-11-1 1,338 0 39.6% 0.0% 0.0% 0.0%
Table 11. Predevelopment conditions of driftcell are cumulative (modified+current). Predregard modified units. HFB=Historic Feeder Bluffs. HFBE=Historic Feeder Bluff ExceptioBluff. NFB=Not Feeder Bluff.
Drift Cell NameDrift Cell Length
(ft)
Modified Shores(ft)
Predevelopment conditions of Driftcell (% of cell)
Drift Cells KI-2-1/2-2-NAD and KI-3-2/3-3-NAD do not account for 100 percent of the modified units because some units were left unscored. It is safe to assume that they are historically NFB.

Final WRIA 8 &9 Beach Feeding Sources and Accretion Areas: Current and Historical Conditions Report COASTAL GEOLOGIC SERVICES, INC.
30
Considerable evidence of historic bluff landslides (in addition to mapped landslides used in the HSSI) throughout this drift cell is found in historic files of the Great Northern Railway Line, found at the Minnesota Historical Society (Figure 7). Several letters addressed to the President of the railway from the Superintendent S. S. Neff, describe the issue of continual slides through the winter of 1891, which presented a major challenge in keeping the railway running on time if at all. In a letter dated December 16th, 1891, the Superintendent stated “the matter of slides has already become a very serious one….it has been almost impossible to keep the line open”. He also described, “the coastline between Salmon Bay and Marysville was a mass of slides” and that slides were occurring in areas previously thought to be the least likely for slides to occur. Another letter described “slides brought down from the tops of bluffs trees and stumps”. Further letters and telegrams from the 1890s document slides throughout the sub-area displacing and burying the tracks. Results of historic Accretion Shoreform mapping indicated that 58% of the historic accretionary beaches in this drift cell have been lost due to anthropogenic alterations to the nearshore (Map 10, Appendix 2; Tables 12 and 13). Prior to development, 27% of this drift cell consisted of Accretion Shoreforms. Of these, 5% of the drift cell was comprised of stream mouth deposits and 22% of the drift cell was delta lagoon habitat. The most significant of these was an extensive delta lagoon at Mukilteo, currently the location of the ferry dock and navy tank farm.
Figure 7. 1931 photo of bluff erosion in Northern Railroad subarea (exact location unknown). University of Washington, Special Collections Libraries, Lee Picket, negative no. SN-2/SN-3-NAD South of SN-2 and from approximately 1,000 ft north of the Edmonds Ferry Terminal to the southern end of the Edmonds Marina, resides a region of negligible net shore-drift (Map 1, Appendix 2). This area is termed SN-2/SN-3-NAD based on its location between the two larger drift cells. This unit measures 2.6 miles in length. The Edmonds Ferry Terminal and southern breakwater of the Edmonds Marina impede net shore-drift in this shore segment. This southern breakwater of the Edmonds Marina prevents northward sediment transport resulting in accretion and progradation of the up-drift (southern) beach. These processes are easily observed by comparing air photos over recent history. North of the Edmonds Ferry Terminal is an apparent Accretion Shoreform. This beach was artificially nourished in 1989 with several different sizes of gravel (Shipman in prep). Beach nourishment is a successful method of replenishing material to sediment-starved beaches and has been applied at numerous Accretion Shoreforms in the park system in King County, and elsewhere. The sediment on the beach in 2004 resembles that of the nearby beaches.
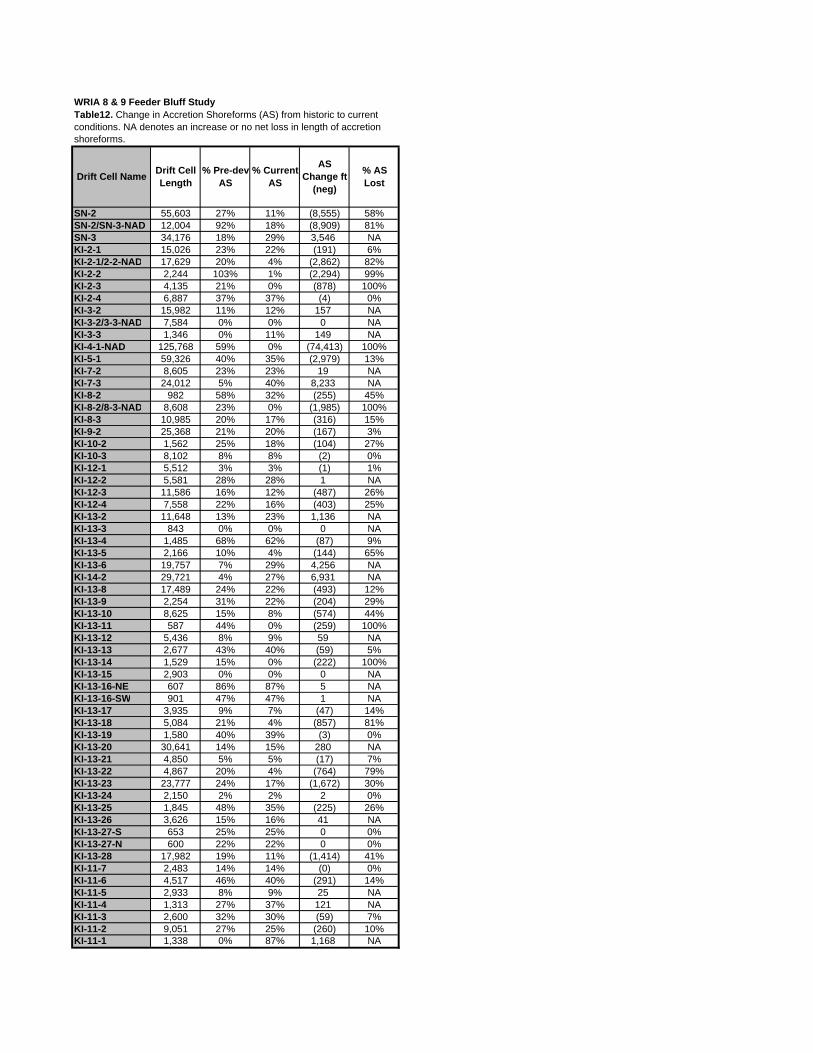
SN-2 55,603 27% 11% (8,555) 58%SN-2/SN-3-NAD 12,004 92% 18% (8,909) 81%SN-3 34,176 18% 29% 3,546 NAKI-2-1 15,026 23% 22% (191) 6%KI-2-1/2-2-NAD 17,629 20% 4% (2,862) 82%KI-2-2 2,244 103% 1% (2,294) 99%KI-2-3 4,135 21% 0% (878) 100%KI-2-4 6,887 37% 37% (4) 0%KI-3-2 15,982 11% 12% 157 NAKI-3-2/3-3-NAD 7,584 0% 0% 0 NAKI-3-3 1,346 0% 11% 149 NAKI-4-1-NAD 125,768 59% 0% (74,413) 100%KI-5-1 59,326 40% 35% (2,979) 13%KI-7-2 8,605 23% 23% 19 NAKI-7-3 24,012 5% 40% 8,233 NAKI-8-2 982 58% 32% (255) 45%KI-8-2/8-3-NAD 8,608 23% 0% (1,985) 100%KI-8-3 10,985 20% 17% (316) 15%KI-9-2 25,368 21% 20% (167) 3%KI-10-2 1,562 25% 18% (104) 27%KI-10-3 8,102 8% 8% (2) 0%KI-12-1 5,512 3% 3% (1) 1%KI-12-2 5,581 28% 28% 1 NAKI-12-3 11,586 16% 12% (487) 26%KI-12-4 7,558 22% 16% (403) 25%KI-13-2 11,648 13% 23% 1,136 NAKI-13-3 843 0% 0% 0 NAKI-13-4 1,485 68% 62% (87) 9%KI-13-5 2,166 10% 4% (144) 65%KI-13-6 19,757 7% 29% 4,256 NAKI-14-2 29,721 4% 27% 6,931 NAKI-13-8 17,489 24% 22% (493) 12%KI-13-9 2,254 31% 22% (204) 29%KI-13-10 8,625 15% 8% (574) 44%KI-13-11 587 44% 0% (259) 100%KI-13-12 5,436 8% 9% 59 NAKI-13-13 2,677 43% 40% (59) 5%KI-13-14 1,529 15% 0% (222) 100%KI-13-15 2,903 0% 0% 0 NAKI-13-16-NE 607 86% 87% 5 NAKI-13-16-SW 901 47% 47% 1 NAKI-13-17 3,935 9% 7% (47) 14%KI-13-18 5,084 21% 4% (857) 81%KI-13-19 1,580 40% 39% (3) 0%KI-13-20 30,641 14% 15% 280 NAKI-13-21 4,850 5% 5% (17) 7%KI-13-22 4,867 20% 4% (764) 79%KI-13-23 23,777 24% 17% (1,672) 30%KI-13-24 2,150 2% 2% 2 0%KI-13-25 1,845 48% 35% (225) 26%KI-13-26 3,626 15% 16% 41 NAKI-13-27-S 653 25% 25% 0 0%KI-13-27-N 600 22% 22% 0 0%KI-13-28 17,982 19% 11% (1,414) 41%KI-11-7 2,483 14% 14% (0) 0%KI-11-6 4,517 46% 40% (291) 14%KI-11-5 2,933 8% 9% 25 NAKI-11-4 1,313 27% 37% 121 NAKI-11-3 2,600 32% 30% (59) 7%KI-11-2 9,051 27% 25% (260) 10%KI-11-1 1,338 0% 87% 1,168 NA
% Pre-dev AS
% Current AS
WRIA 8 & 9 Feeder Bluff Study
AS Change ft
(neg)
% AS Lost
Table12. Change in Accretion Shoreforms (AS) from historic to current conditions. NA denotes an increase or no net loss in length of accretion shoreforms.
Drift Cell Name Drift Cell Length
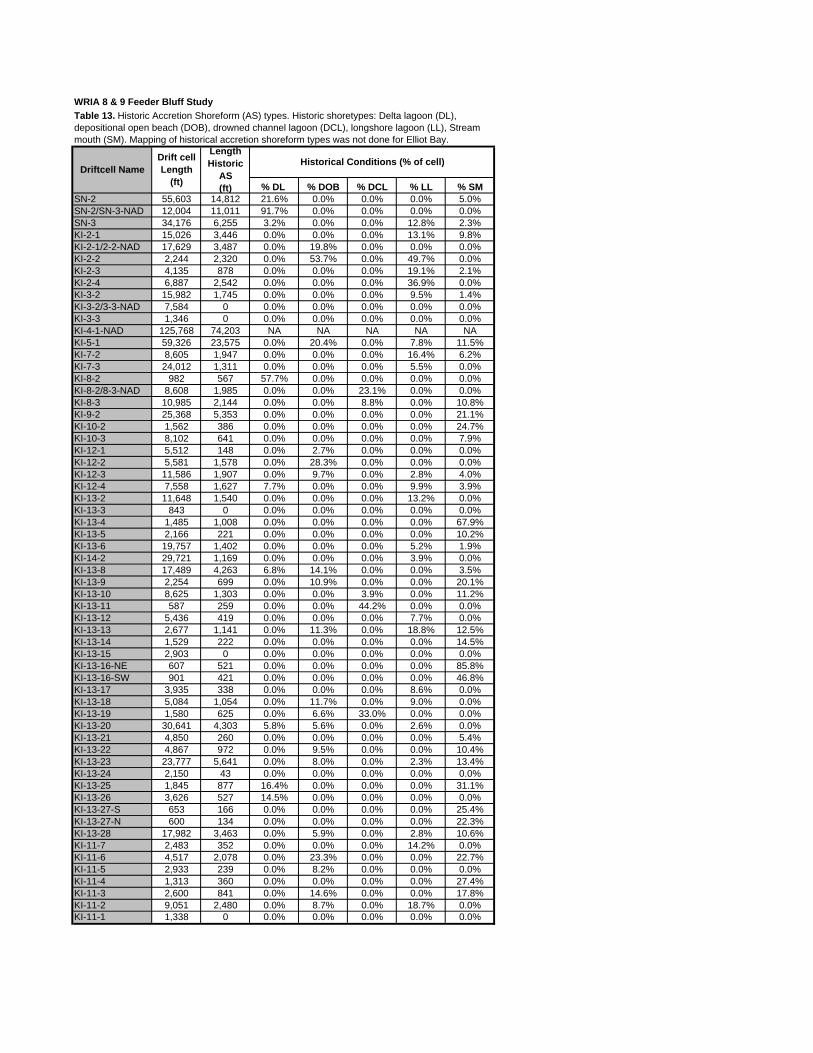
WRIA 8 & 9 Feeder Bluff Study Table 13. Historic Accretion Shoreform (AS) types. Historic shoretypes: Delta lagoon (DL), depositional open beach (DOB), drowned channel lagoon (DCL), longshore lagoon (LL), Stream mouth (SM). Mapping of historical accretion shoreform types was not done for Elliot Bay.
Driftcell NameDrift cell Length
(ft)
Length Historic
AS (ft)
Historical Conditions (% of cell)
% DL % DOB % DCL % LL % SMSN-2 55,603 14,812 21.6% 0.0% 0.0% 0.0% 5.0%SN-2/SN-3-NAD 12,004 11,011 91.7% 0.0% 0.0% 0.0% 0.0%SN-3 34,176 6,255 3.2% 0.0% 0.0% 12.8% 2.3%KI-2-1 15,026 3,446 0.0% 0.0% 0.0% 13.1% 9.8%KI-2-1/2-2-NAD 17,629 3,487 0.0% 19.8% 0.0% 0.0% 0.0%KI-2-2 2,244 2,320 0.0% 53.7% 0.0% 49.7% 0.0%KI-2-3 4,135 878 0.0% 0.0% 0.0% 19.1% 2.1%KI-2-4 6,887 2,542 0.0% 0.0% 0.0% 36.9% 0.0%KI-3-2 15,982 1,745 0.0% 0.0% 0.0% 9.5% 1.4%KI-3-2/3-3-NAD 7,584 0 0.0% 0.0% 0.0% 0.0% 0.0%KI-3-3 1,346 0 0.0% 0.0% 0.0% 0.0% 0.0%KI-4-1-NAD 125,768 74,203 NA NA NA NA NAKI-5-1 59,326 23,575 0.0% 20.4% 0.0% 7.8% 11.5%KI-7-2 8,605 1,947 0.0% 0.0% 0.0% 16.4% 6.2%KI-7-3 24,012 1,311 0.0% 0.0% 0.0% 5.5% 0.0%KI-8-2 982 567 57.7% 0.0% 0.0% 0.0% 0.0%KI-8-2/8-3-NAD 8,608 1,985 0.0% 0.0% 23.1% 0.0% 0.0%KI-8-3 10,985 2,144 0.0% 0.0% 8.8% 0.0% 10.8%KI-9-2 25,368 5,353 0.0% 0.0% 0.0% 0.0% 21.1%KI-10-2 1,562 386 0.0% 0.0% 0.0% 0.0% 24.7%KI-10-3 8,102 641 0.0% 0.0% 0.0% 0.0% 7.9%KI-12-1 5,512 148 0.0% 2.7% 0.0% 0.0% 0.0%KI-12-2 5,581 1,578 0.0% 28.3% 0.0% 0.0% 0.0%KI-12-3 11,586 1,907 0.0% 9.7% 0.0% 2.8% 4.0%KI-12-4 7,558 1,627 7.7% 0.0% 0.0% 9.9% 3.9%KI-13-2 11,648 1,540 0.0% 0.0% 0.0% 13.2% 0.0%KI-13-3 843 0 0.0% 0.0% 0.0% 0.0% 0.0%KI-13-4 1,485 1,008 0.0% 0.0% 0.0% 0.0% 67.9%KI-13-5 2,166 221 0.0% 0.0% 0.0% 0.0% 10.2%KI-13-6 19,757 1,402 0.0% 0.0% 0.0% 5.2% 1.9%KI-14-2 29,721 1,169 0.0% 0.0% 0.0% 3.9% 0.0%KI-13-8 17,489 4,263 6.8% 14.1% 0.0% 0.0% 3.5%KI-13-9 2,254 699 0.0% 10.9% 0.0% 0.0% 20.1%KI-13-10 8,625 1,303 0.0% 0.0% 3.9% 0.0% 11.2%KI-13-11 587 259 0.0% 0.0% 44.2% 0.0% 0.0%KI-13-12 5,436 419 0.0% 0.0% 0.0% 7.7% 0.0%KI-13-13 2,677 1,141 0.0% 11.3% 0.0% 18.8% 12.5%KI-13-14 1,529 222 0.0% 0.0% 0.0% 0.0% 14.5%KI-13-15 2,903 0 0.0% 0.0% 0.0% 0.0% 0.0%KI-13-16-NE 607 521 0.0% 0.0% 0.0% 0.0% 85.8%KI-13-16-SW 901 421 0.0% 0.0% 0.0% 0.0% 46.8%KI-13-17 3,935 338 0.0% 0.0% 0.0% 8.6% 0.0%KI-13-18 5,084 1,054 0.0% 11.7% 0.0% 9.0% 0.0%KI-13-19 1,580 625 0.0% 6.6% 33.0% 0.0% 0.0%KI-13-20 30,641 4,303 5.8% 5.6% 0.0% 2.6% 0.0%KI-13-21 4,850 260 0.0% 0.0% 0.0% 0.0% 5.4%KI-13-22 4,867 972 0.0% 9.5% 0.0% 0.0% 10.4%KI-13-23 23,777 5,641 0.0% 8.0% 0.0% 2.3% 13.4%KI-13-24 2,150 43 0.0% 0.0% 0.0% 0.0% 0.0%KI-13-25 1,845 877 16.4% 0.0% 0.0% 0.0% 31.1%KI-13-26 3,626 527 14.5% 0.0% 0.0% 0.0% 0.0%KI-13-27-S 653 166 0.0% 0.0% 0.0% 0.0% 25.4%KI-13-27-N 600 134 0.0% 0.0% 0.0% 0.0% 22.3%KI-13-28 17,982 3,463 0.0% 5.9% 0.0% 2.8% 10.6%KI-11-7 2,483 352 0.0% 0.0% 0.0% 14.2% 0.0%KI-11-6 4,517 2,078 0.0% 23.3% 0.0% 0.0% 22.7%KI-11-5 2,933 239 0.0% 8.2% 0.0% 0.0% 0.0%KI-11-4 1,313 360 0.0% 0.0% 0.0% 0.0% 27.4%KI-11-3 2,600 841 0.0% 14.6% 0.0% 0.0% 17.8%KI-11-2 9,051 2,480 0.0% 8.7% 0.0% 18.7% 0.0%KI-11-1 1,338 0 0.0% 0.0% 0.0% 0.0% 0.0%
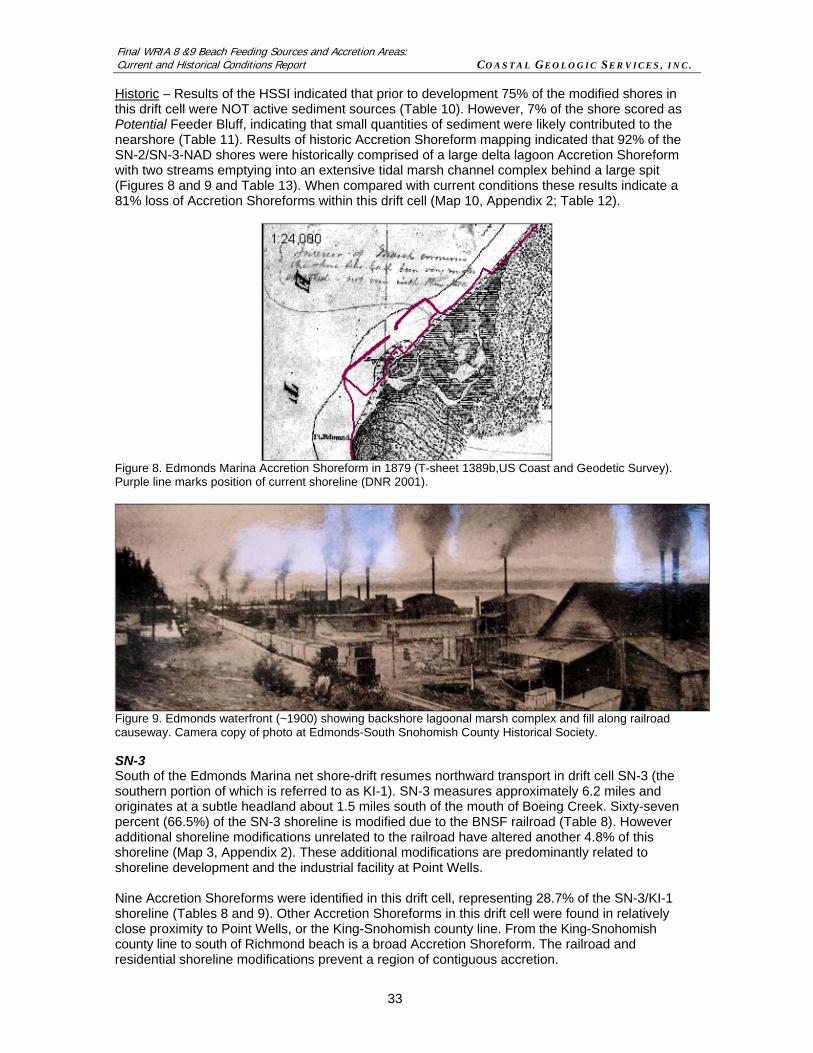
Final WRIA 8 &9 Beach Feeding Sources and Accretion Areas: Current and Historical Conditions Report COASTAL GEOLOGIC SERVICES, INC.
33
Historic – Results of the HSSI indicated that prior to development 75% of the modified shores in this drift cell were NOT active sediment sources (Table 10). However, 7% of the shore scored as Potential Feeder Bluff, indicating that small quantities of sediment were likely contributed to the nearshore (Table 11). Results of historic Accretion Shoreform mapping indicated that 92% of the SN-2/SN-3-NAD shores were historically comprised of a large delta lagoon Accretion Shoreform with two streams emptying into an extensive tidal marsh channel complex behind a large spit (Figures 8 and 9 and Table 13). When compared with current conditions these results indicate a 81% loss of Accretion Shoreforms within this drift cell (Map 10, Appendix 2; Table 12).
Figure 8. Edmonds Marina Accretion Shoreform in 1879 (T-sheet 1389b,US Coast and Geodetic Survey). Purple line marks position of current shoreline (DNR 2001).
Figure 9. Edmonds waterfront (~1900) showing backshore lagoonal marsh complex and fill along railroad causeway. Camera copy of photo at Edmonds-South Snohomish County Historical Society. SN-3 South of the Edmonds Marina net shore-drift resumes northward transport in drift cell SN-3 (the southern portion of which is referred to as KI-1). SN-3 measures approximately 6.2 miles and originates at a subtle headland about 1.5 miles south of the mouth of Boeing Creek. Sixty-seven percent (66.5%) of the SN-3 shoreline is modified due to the BNSF railroad (Table 8). However additional shoreline modifications unrelated to the railroad have altered another 4.8% of this shoreline (Map 3, Appendix 2). These additional modifications are predominantly related to shoreline development and the industrial facility at Point Wells. Nine Accretion Shoreforms were identified in this drift cell, representing 28.7% of the SN-3/KI-1 shoreline (Tables 8 and 9). Other Accretion Shoreforms in this drift cell were found in relatively close proximity to Point Wells, or the King-Snohomish county line. From the King-Snohomish county line to south of Richmond beach is a broad Accretion Shoreform. The railroad and residential shoreline modifications prevent a region of contiguous accretion.
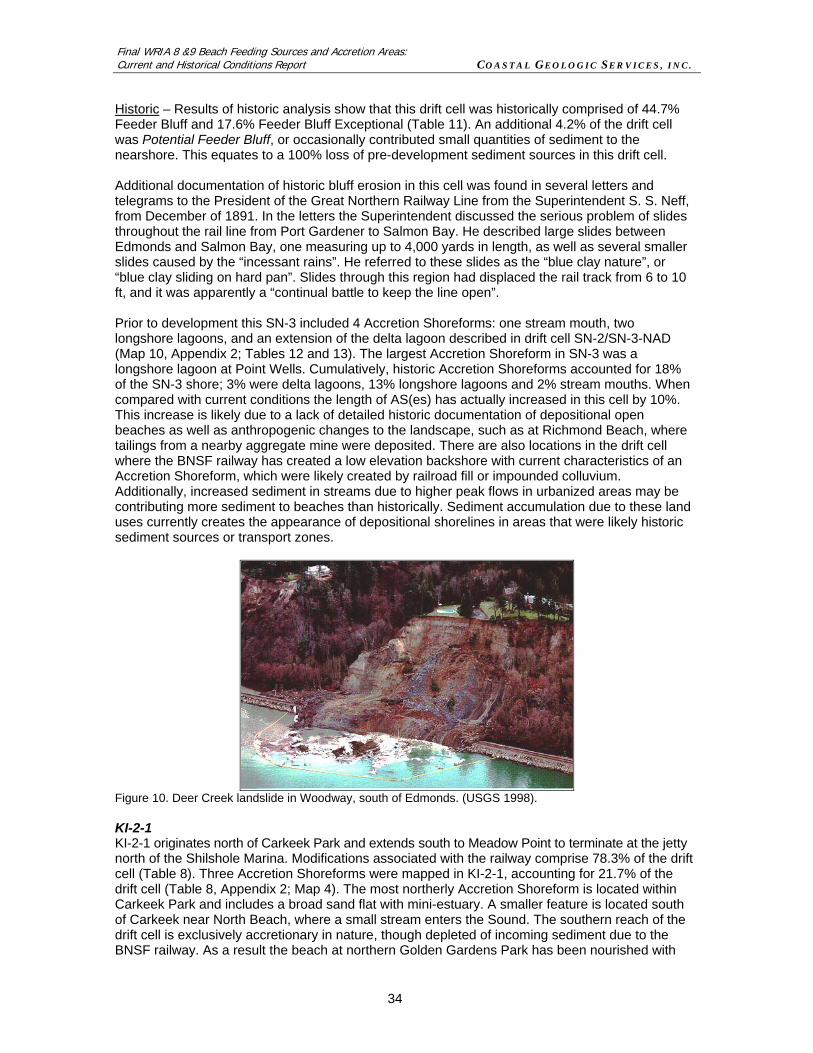
Final WRIA 8 &9 Beach Feeding Sources and Accretion Areas: Current and Historical Conditions Report COASTAL GEOLOGIC SERVICES, INC.
34
Historic – Results of historic analysis show that this drift cell was historically comprised of 44.7% Feeder Bluff and 17.6% Feeder Bluff Exceptional (Table 11). An additional 4.2% of the drift cell was Potential Feeder Bluff, or occasionally contributed small quantities of sediment to the nearshore. This equates to a 100% loss of pre-development sediment sources in this drift cell. Additional documentation of historic bluff erosion in this cell was found in several letters and telegrams to the President of the Great Northern Railway Line from the Superintendent S. S. Neff, from December of 1891. In the letters the Superintendent discussed the serious problem of slides throughout the rail line from Port Gardener to Salmon Bay. He described large slides between Edmonds and Salmon Bay, one measuring up to 4,000 yards in length, as well as several smaller slides caused by the “incessant rains”. He referred to these slides as the “blue clay nature”, or “blue clay sliding on hard pan”. Slides through this region had displaced the rail track from 6 to 10 ft, and it was apparently a “continual battle to keep the line open”. Prior to development this SN-3 included 4 Accretion Shoreforms: one stream mouth, two longshore lagoons, and an extension of the delta lagoon described in drift cell SN-2/SN-3-NAD (Map 10, Appendix 2; Tables 12 and 13). The largest Accretion Shoreform in SN-3 was a longshore lagoon at Point Wells. Cumulatively, historic Accretion Shoreforms accounted for 18% of the SN-3 shore; 3% were delta lagoons, 13% longshore lagoons and 2% stream mouths. When compared with current conditions the length of AS(es) has actually increased in this cell by 10%. This increase is likely due to a lack of detailed historic documentation of depositional open beaches as well as anthropogenic changes to the landscape, such as at Richmond Beach, where tailings from a nearby aggregate mine were deposited. There are also locations in the drift cell where the BNSF railway has created a low elevation backshore with current characteristics of an Accretion Shoreform, which were likely created by railroad fill or impounded colluvium. Additionally, increased sediment in streams due to higher peak flows in urbanized areas may be contributing more sediment to beaches than historically. Sediment accumulation due to these land uses currently creates the appearance of depositional shorelines in areas that were likely historic sediment sources or transport zones.
Figure 10. Deer Creek landslide in Woodway, south of Edmonds. (USGS 1998).
KI-2-1 KI-2-1 originates north of Carkeek Park and extends south to Meadow Point to terminate at the jetty north of the Shilshole Marina. Modifications associated with the railway comprise 78.3% of the drift cell (Table 8). Three Accretion Shoreforms were mapped in KI-2-1, accounting for 21.7% of the drift cell (Table 8, Appendix 2; Map 4). The most northerly Accretion Shoreform is located within Carkeek Park and includes a broad sand flat with mini-estuary. A smaller feature is located south of Carkeek near North Beach, where a small stream enters the Sound. The southern reach of the drift cell is exclusively accretionary in nature, though depleted of incoming sediment due to the BNSF railway. As a result the beach at northern Golden Gardens Park has been nourished with

Final WRIA 8 &9 Beach Feeding Sources and Accretion Areas: Current and Historical Conditions Report COASTAL GEOLOGIC SERVICES, INC.
35
sediment resembling its native material. Historic – All of the modified shores in KI-2-1, measuring close to 2.3 miles in length, were sediment sources prior to development and the construction of the BNSF seawall (Tables 10 and 11). Close to 52% (51.8%) of the historic shoreline was Exceptional Feeder Bluff and 26.5% was Feeder Bluff (Map 4, Appendix 2). Currently there is a complete (100%) loss of bluff sediment sources in this drift cell. Additional documentation of historic landslides within this drift cell includes numerous letters to the President of the Great Northern Railway from the Superintendent S.S. Neff. As previously mentioned, these letters describe large and small scale sliding that routinely displaced and buried the railway (Figure 12). Results of historic AS mapping indicated that this drift cell included one large longshore lagoon at Meadow Point, two small stream mouths near Carkeek Park to the north, and a potential AS (mapped on the T-sheet) between the northern streams and Meadow Point. The longshore lagoon AS at Meadow Point, accounted for 13% of the drift cell, while stream mouth AS(es) represented 10% of the cell (Map 10, Appendix 2; Tables 12 and 13). Cumulatively these AS(es) represented 23% of KI-2-1. When compared with current conditions, this accounts for a 6% loss of Accretion Shoreforms in KI-2-1.
Figure 11. Ballard Beach with eroding bluffs in 1909. Museum of History and Industry (MOHAI) photo no. 5246.2.
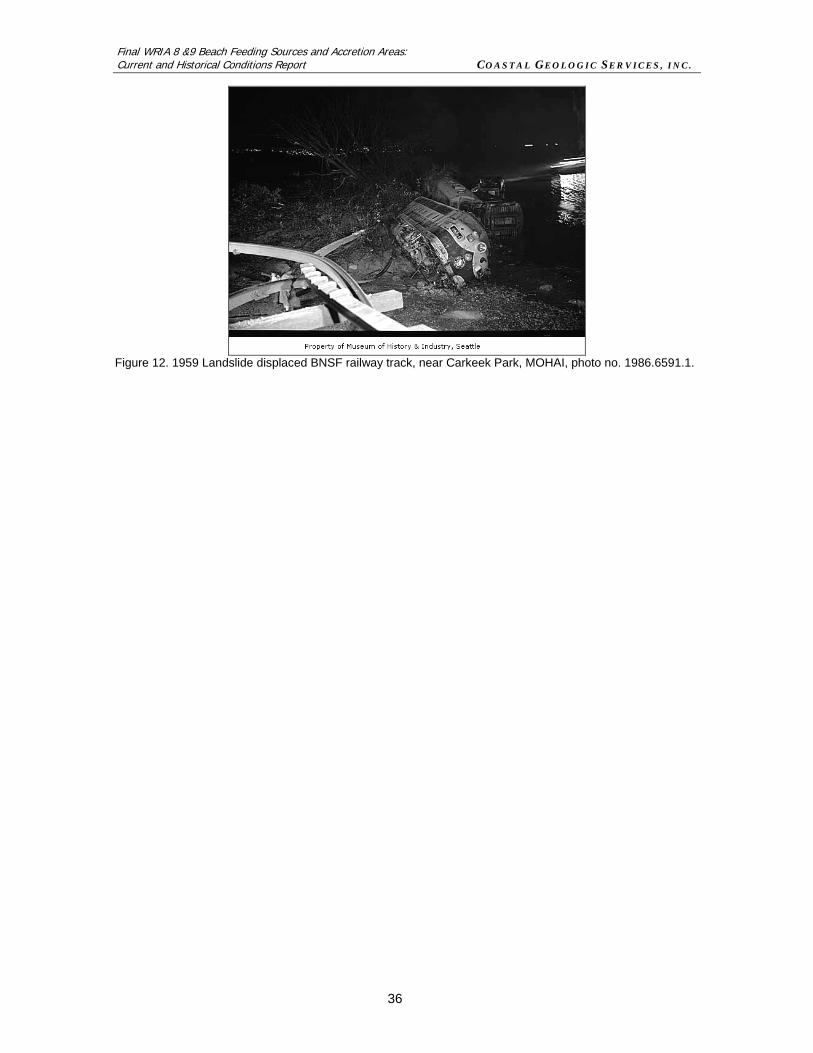
Final WRIA 8 &9 Beach Feeding Sources and Accretion Areas: Current and Historical Conditions Report COASTAL GEOLOGIC SERVICES, INC.
36
Figure 12. 1959 Landslide displaced BNSF railway track, near Carkeek Park, MOHAI, photo no. 1986.6591.1.
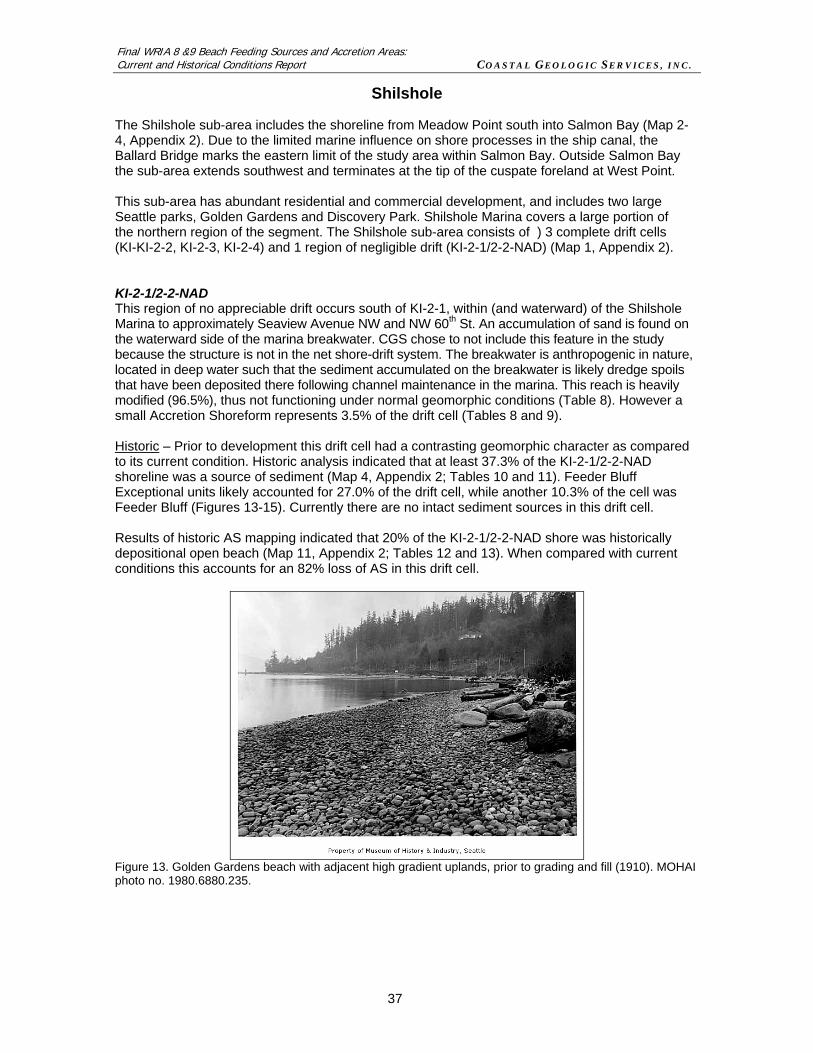
Final WRIA 8 &9 Beach Feeding Sources and Accretion Areas: Current and Historical Conditions Report COASTAL GEOLOGIC SERVICES, INC.
37
Shilshole The Shilshole sub-area includes the shoreline from Meadow Point south into Salmon Bay (Map 2-4, Appendix 2). Due to the limited marine influence on shore processes in the ship canal, the Ballard Bridge marks the eastern limit of the study area within Salmon Bay. Outside Salmon Bay the sub-area extends southwest and terminates at the tip of the cuspate foreland at West Point. This sub-area has abundant residential and commercial development, and includes two large Seattle parks, Golden Gardens and Discovery Park. Shilshole Marina covers a large portion of the northern region of the segment. The Shilshole sub-area consists of ) 3 complete drift cells (KI-KI-2-2, KI-2-3, KI-2-4) and 1 region of negligible drift (KI-2-1/2-2-NAD) (Map 1, Appendix 2).
KI-2-1/2-2-NAD This region of no appreciable drift occurs south of KI-2-1, within (and waterward) of the Shilshole Marina to approximately Seaview Avenue NW and NW 60th St. An accumulation of sand is found on the waterward side of the marina breakwater. CGS chose to not include this feature in the study because the structure is not in the net shore-drift system. The breakwater is anthropogenic in nature, located in deep water such that the sediment accumulated on the breakwater is likely dredge spoils that have been deposited there following channel maintenance in the marina. This reach is heavily modified (96.5%), thus not functioning under normal geomorphic conditions (Table 8). However a small Accretion Shoreform represents 3.5% of the drift cell (Tables 8 and 9). Historic – Prior to development this drift cell had a contrasting geomorphic character as compared to its current condition. Historic analysis indicated that at least 37.3% of the KI-2-1/2-2-NAD shoreline was a source of sediment (Map 4, Appendix 2; Tables 10 and 11). Feeder Bluff Exceptional units likely accounted for 27.0% of the drift cell, while another 10.3% of the cell was Feeder Bluff (Figures 13-15). Currently there are no intact sediment sources in this drift cell. Results of historic AS mapping indicated that 20% of the KI-2-1/2-2-NAD shore was historically depositional open beach (Map 11, Appendix 2; Tables 12 and 13). When compared with current conditions this accounts for an 82% loss of AS in this drift cell.
Figure 13. Golden Gardens beach with adjacent high gradient uplands, prior to grading and fill (1910). MOHAI photo no. 1980.6880.235.

Final WRIA 8 &9 Beach Feeding Sources and Accretion Areas: Current and Historical Conditions Report COASTAL GEOLOGIC SERVICES, INC.
38
Figure 14. Seaview Drive, Ballard. 1943. Built atop fill adjacent to Historic Feeder Bluff. Seattle Municipal Archives.
Figure 15. Historic mapping (1867) of Shilshole Marina depicting bluffs. Current shoreline in purple (DNR 2001). (T-sheet 1064, US Coast and Geodetic Survey). KI-2-2 Net shore-drift south of KI-2-2 in Salmon Bay is southeast into the bay. This drift cell measures approximately 0.7 miles in length, 94.9% of which is modified. Four-percent of the shoreline is transport zone, displaying little evidence of sediment gain or loss (Table 8). One-percent (1.2%) of the drift cell consists of Accretion Shoreforms. Two small Accretion Shoreforms are found within the drift cell. The small Accretion Shoreform south of Shilshole Marina abuts fill material and lies between modified shoreline on either side. Southeast of the beach a residential high-rise protrudes out over the intertidal, and is likely causing sediment to accumulate in this anthropogenic pocket beach. Approximately 1,475 ft east, another exceptionally small Accretion Shoreform was mapped, measuring only 30 ft in length (Table 9). Historic – Historic analysis of the KI-2-2 shoreline indicated that sediment sources were negligible in this drift cell prior to anthropogenic modification of the nearshore (Figure 16). Accretion Shoreforms were present for 100% of the drift cell, and comprised of 52% longshore lagoon and 48% depositional open beach (Map 11, Appendix 2, Tables 12 and 13). These shores included two large spits at the Salmon Bay mouth, both with open water behind them, and 3 small stream mouths. The head of the bay was developed at the time the T-sheets were made. Geologic maps suggest that the bay was an ancient glacial outwash channel inundated by rising (relative) sea level. It is likely that prior to modification a tidal channel marsh would have occupied the head of

Final WRIA 8 &9 Beach Feeding Sources and Accretion Areas: Current and Historical Conditions Report COASTAL GEOLOGIC SERVICES, INC.
39
the bay as the marine water encroached. When compared with current conditions, which measured 1% AS, the shoreline change in this cell represents a 99% loss of Accretionary Shoreforms in KI-2-2 (Table 12). The discrepancy between historic and current shoreline lengths can be attributed to accuracy issues with historic Accretion Shoreform mapping and consistent drift cell boundaries across different shorelines (Shorezone shoreline versus drift cell shoreline).
Figure 16. Interior shore of Salmon Bay in 1971 shows lack of sediment sources and presence of Accretion Shoreforms prior to modification (north side of Bay in foreground) and Accretion Shoreforms and sediment sources of KI-2-3 in background. MOHAI, photo no. 1933.10.10575. KI-2-3 Net shore-drift along the southern shore of Salmon Bay is southward toward the Hiram M. Chittenden Locks. This drift cell extends 0.8 miles and is primarily erosive, where unmodified. Ninety-three-percent (92.9%) of this drift cell is modified, leaving only two short Feeder Bluffs, representing 7.1% of the KI-2-3 shoreline. Historic – Historically 47.6% of this drift cell was comprised of sediment sources. Approximately 40.5% of the pre-development nearshore represented Feeder Bluffs. In summary, 85.1% of the historic sediment sources in this drift cell have been lost due to anthropogenic alteration to the nearshore (Tables 9 and 10). Results of historic Accretion Shoreform mapping indicated that prior to modifications 21% of the KI-2-3 shoreline was AS. Accretionary shores within the cell were comprised of 19% longshore lagoon and 2% stream mouth. When compared with current conditions, this represents a 100% loss of the historic AS(es) in KI-2-3.
Figure 17. Low bank shores of Salmon Bay in 1900. MOHAI, photo no. 1988.33.33.
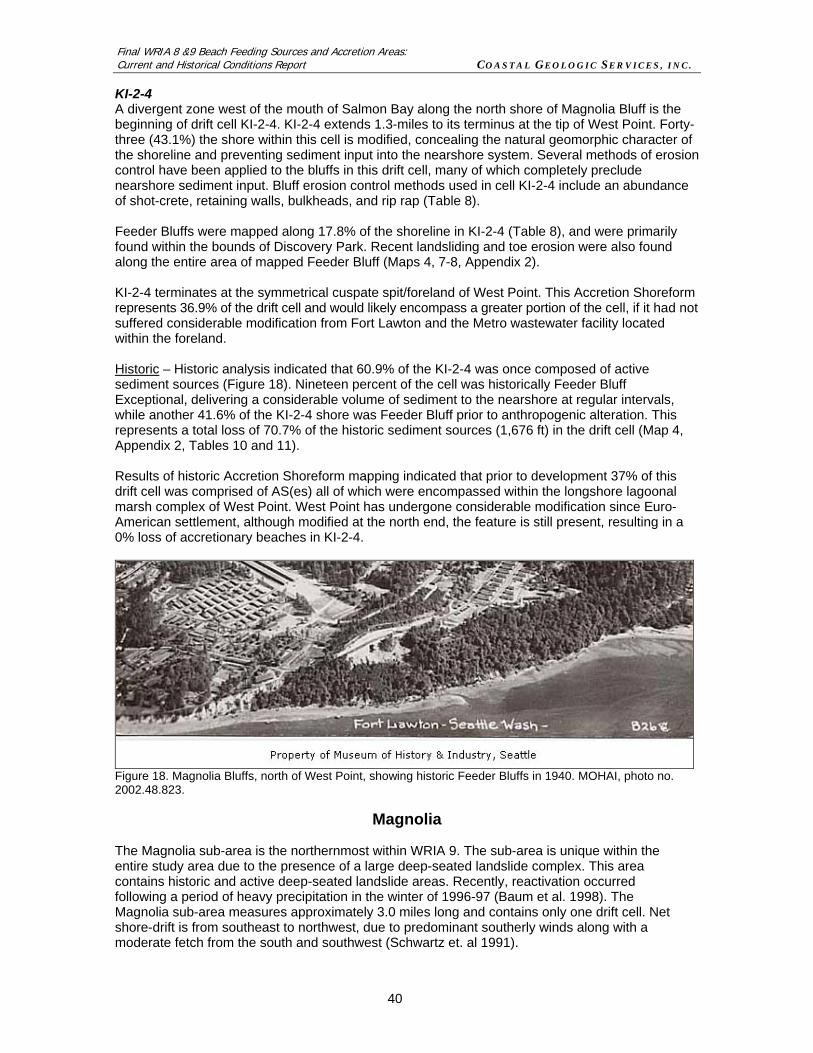
Final WRIA 8 &9 Beach Feeding Sources and Accretion Areas: Current and Historical Conditions Report COASTAL GEOLOGIC SERVICES, INC.
40
KI-2-4 A divergent zone west of the mouth of Salmon Bay along the north shore of Magnolia Bluff is the beginning of drift cell KI-2-4. KI-2-4 extends 1.3-miles to its terminus at the tip of West Point. Forty-three (43.1%) the shore within this cell is modified, concealing the natural geomorphic character of the shoreline and preventing sediment input into the nearshore system. Several methods of erosion control have been applied to the bluffs in this drift cell, many of which completely preclude nearshore sediment input. Bluff erosion control methods used in cell KI-2-4 include an abundance of shot-crete, retaining walls, bulkheads, and rip rap (Table 8). Feeder Bluffs were mapped along 17.8% of the shoreline in KI-2-4 (Table 8), and were primarily found within the bounds of Discovery Park. Recent landsliding and toe erosion were also found along the entire area of mapped Feeder Bluff (Maps 4, 7-8, Appendix 2). KI-2-4 terminates at the symmetrical cuspate spit/foreland of West Point. This Accretion Shoreform represents 36.9% of the drift cell and would likely encompass a greater portion of the cell, if it had not suffered considerable modification from Fort Lawton and the Metro wastewater facility located within the foreland. Historic – Historic analysis indicated that 60.9% of the KI-2-4 was once composed of active sediment sources (Figure 18). Nineteen percent of the cell was historically Feeder Bluff Exceptional, delivering a considerable volume of sediment to the nearshore at regular intervals, while another 41.6% of the KI-2-4 shore was Feeder Bluff prior to anthropogenic alteration. This represents a total loss of 70.7% of the historic sediment sources (1,676 ft) in the drift cell (Map 4, Appendix 2, Tables 10 and 11). Results of historic Accretion Shoreform mapping indicated that prior to development 37% of this drift cell was comprised of AS(es) all of which were encompassed within the longshore lagoonal marsh complex of West Point. West Point has undergone considerable modification since Euro-American settlement, although modified at the north end, the feature is still present, resulting in a 0% loss of accretionary beaches in KI-2-4.
Figure 18. Magnolia Bluffs, north of West Point, showing historic Feeder Bluffs in 1940. MOHAI, photo no. 2002.48.823.
Magnolia The Magnolia sub-area is the northernmost within WRIA 9. The sub-area is unique within the entire study area due to the presence of a large deep-seated landslide complex. This area contains historic and active deep-seated landslide areas. Recently, reactivation occurred following a period of heavy precipitation in the winter of 1996-97 (Baum et al. 1998). The Magnolia sub-area measures approximately 3.0 miles long and contains only one drift cell. Net shore-drift is from southeast to northwest, due to predominant southerly winds along with a moderate fetch from the south and southwest (Schwartz et. al 1991).
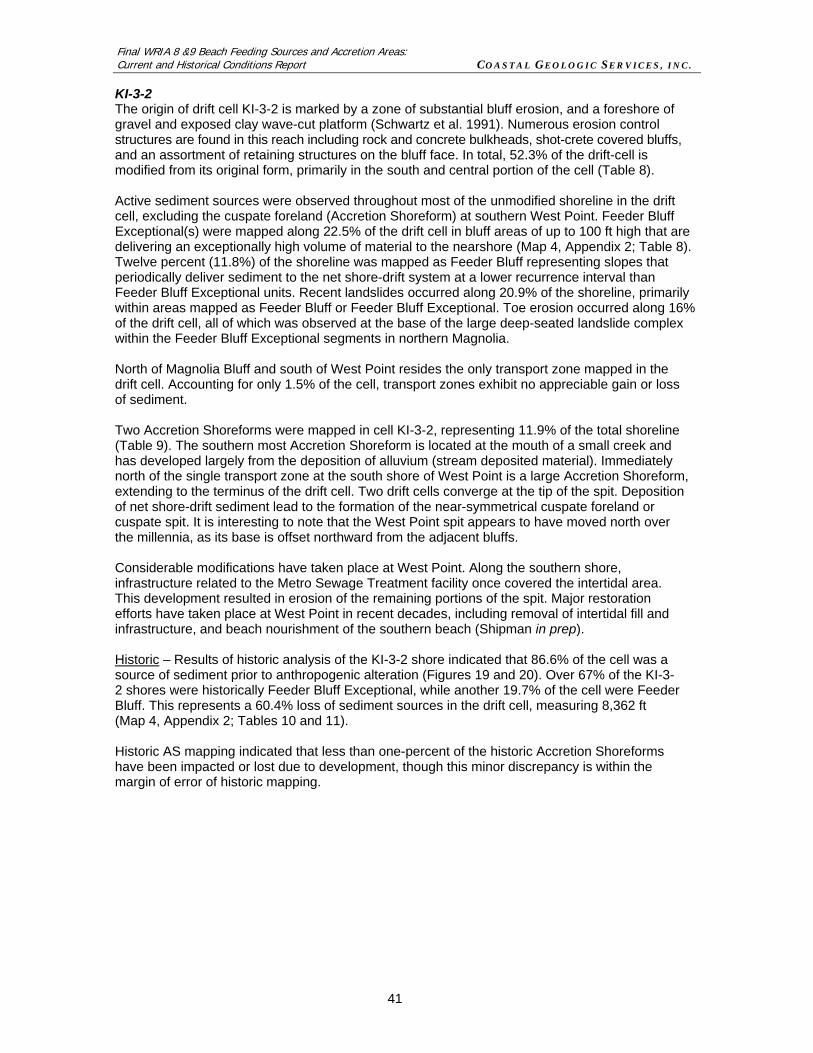
Final WRIA 8 &9 Beach Feeding Sources and Accretion Areas: Current and Historical Conditions Report COASTAL GEOLOGIC SERVICES, INC.
41
KI-3-2 The origin of drift cell KI-3-2 is marked by a zone of substantial bluff erosion, and a foreshore of gravel and exposed clay wave-cut platform (Schwartz et al. 1991). Numerous erosion control structures are found in this reach including rock and concrete bulkheads, shot-crete covered bluffs, and an assortment of retaining structures on the bluff face. In total, 52.3% of the drift-cell is modified from its original form, primarily in the south and central portion of the cell (Table 8). Active sediment sources were observed throughout most of the unmodified shoreline in the drift cell, excluding the cuspate foreland (Accretion Shoreform) at southern West Point. Feeder Bluff Exceptional(s) were mapped along 22.5% of the drift cell in bluff areas of up to 100 ft high that are delivering an exceptionally high volume of material to the nearshore (Map 4, Appendix 2; Table 8). Twelve percent (11.8%) of the shoreline was mapped as Feeder Bluff representing slopes that periodically deliver sediment to the net shore-drift system at a lower recurrence interval than Feeder Bluff Exceptional units. Recent landslides occurred along 20.9% of the shoreline, primarily within areas mapped as Feeder Bluff or Feeder Bluff Exceptional. Toe erosion occurred along 16% of the drift cell, all of which was observed at the base of the large deep-seated landslide complex within the Feeder Bluff Exceptional segments in northern Magnolia. North of Magnolia Bluff and south of West Point resides the only transport zone mapped in the drift cell. Accounting for only 1.5% of the cell, transport zones exhibit no appreciable gain or loss of sediment. Two Accretion Shoreforms were mapped in cell KI-3-2, representing 11.9% of the total shoreline (Table 9). The southern most Accretion Shoreform is located at the mouth of a small creek and has developed largely from the deposition of alluvium (stream deposited material). Immediately north of the single transport zone at the south shore of West Point is a large Accretion Shoreform, extending to the terminus of the drift cell. Two drift cells converge at the tip of the spit. Deposition of net shore-drift sediment lead to the formation of the near-symmetrical cuspate foreland or cuspate spit. It is interesting to note that the West Point spit appears to have moved north over the millennia, as its base is offset northward from the adjacent bluffs. Considerable modifications have taken place at West Point. Along the southern shore, infrastructure related to the Metro Sewage Treatment facility once covered the intertidal area. This development resulted in erosion of the remaining portions of the spit. Major restoration efforts have taken place at West Point in recent decades, including removal of intertidal fill and infrastructure, and beach nourishment of the southern beach (Shipman in prep). Historic – Results of historic analysis of the KI-3-2 shore indicated that 86.6% of the cell was a source of sediment prior to anthropogenic alteration (Figures 19 and 20). Over 67% of the KI-3-2 shores were historically Feeder Bluff Exceptional, while another 19.7% of the cell were Feeder Bluff. This represents a 60.4% loss of sediment sources in the drift cell, measuring 8,362 ft (Map 4, Appendix 2; Tables 10 and 11). Historic AS mapping indicated that less than one-percent of the historic Accretion Shoreforms have been impacted or lost due to development, though this minor discrepancy is within the margin of error of historic mapping.

Final WRIA 8 &9 Beach Feeding Sources and Accretion Areas: Current and Historical Conditions Report COASTAL GEOLOGIC SERVICES, INC.
42
Figure 19. Magnolia Bluffs-north near Discovery Park (1913). MOHAI, photo no. 1983.10.7803.2.
Figure 20. Magnolia bluffs-south bluffs near Perkins Lane (1951), Seattle Municipal Archives.
Elliott Bay The Elliott Bay sub-area extends from the northwest end of the Smith Cove Marina to the Hamilton Park Viewpoint on the east side of Duwamish Head. It is comprised of extensive no appreciable drift areas (KI-3-2/3-3-NAD and KI-4-1-NAD) and one drift-cell (KI-3-3). This sub-area is characterized by dense commercial and industrial development. It encompasses the downtown Seattle shore and the Duwamish River estuary, both of which have a long history of fill and shoreline modifications following Euro-American settlement starting in the latter part of the 19th century. Detailed reporting of the segments used to assess the historic conditions of Elliott Bay are provided in Table 12. Much of the shores of Elliott Bay have been considerably altered, and do not even slightly resemble their former condition or location. As a result, a historic shoreline based on historic T-sheets digitized by Collins and Sheikh (2005) was used for the historic conditions analysis. The contrasting shorelines (current and historic) are both displayed in Map 4. It is probable that net shore-drift along the historic shoreline under natural conditions resulted in additional drift cells within Elliott Bay. However, delineating said drift cells goes beyond the scope of this study, so historic shoretypes will only be reported. KI-3-2/3-3-NAD This region of negligible drift measures 1.4 miles and is adjacent to the southern boundary of the Magnolia sub-area. Consisting largely of fill, this unit encompasses the Smith Cove Marina and breakwater. The system of breakwaters surrounding the marina precludes net shore-drift within the enclosed shore. Historic - Historic analysis indicated that 29.7% of the pre-development shoreline in this drift cell were Feeder Bluffs. Because no current sediment sources exist in KI-3-2/3-3-NAD, this represents a 100% loss of nearshore sediment sources in the system (Tables 10 and 11). KI-3-3 East of the Smith Cove Marina, drift cell KI-3-3 begins transporting sediment east, then north into Smith Cove. This cell is relatively short, measuring only 0.25 miles, and reaches its terminus where the shore runs perpendicular to the Magnolia Bridge. The boundary of this drift cell was adjusted from where Schwartz et al. (1991) mapped the terminus of the drift (by roughly 260 ft to the south). Current conditions reflect changes to the shoreline since net shore-drift mapping occurred in the early 1980s.

Final WRIA 8 &9 Beach Feeding Sources and Accretion Areas: Current and Historical Conditions Report COASTAL GEOLOGIC SERVICES, INC.
43
Current conditions include the deposition of sediment in the adjacent unit (previously mapped as no appreciable drift). For this reason the northern boundary of the drift cell was extended north to include the depositional beach as the terminus of cell KI-3-3. Other than this small Accretion Shoreform, which represents 11.1% of the cell (Table 8), KI-3-3 is completely modified with rip rap (88.9%). Historic – This drift cell falls within the Smith Cove-Elliott Bay shoreline, all of which is heavily modified and has been since prior to the turn of the 20th century. It is likely that prior to modification of the Smith Cove shoreline, this drift cell was very different in form or did not exist. Historic analysis indicated that there were no upland sediment sources prior to development within the KI-3-3 shoreline. When this shore was part of the historic Smith Cove shoreline (based on historic T-sheet T-2422), it appears to have been part of the Smith Cove spit complex, which is an Accretion Shoreform. In general mapping of historic sediment sources and accretionary beaches in this drift cell was grouped with the Elliott Bay shores, the results of which are included in Table 14. KI-4-1-NAD The remaining Elliott Bay shoreline is encompassed by cell KI-4-1-NAD, which is highly modified with minimal residual geomorphic processes taking place. Schwartz et al. (1991) mapped this entire area as having no appreciable drift. Much of the original intertidal beaches of Elliott Bay have been filled waterward and had large seawalls constructed. Water depth and the obstruction of piers preclude any significant longshore transport (Schwartz et al. 1991). At present the only source of sediment for shore drift is undefended fill material. One such location, measuring 115 ft long, was observed during field mapping, located within the east shore of the easternmost ship berth in Smith Cove. An embayment in the riprap at Myrtle Edward Park represents a small stretch of a transport zone, as it was neither experiencing a net gain nor loss of sediment. GeoSea Consulting conducted a detailed investigation of sediment transport within Elliott Bay (McLaren et al. 1994). This study concluded that sediment in Elliott Bay is predominantly transported in a clockwise gyre and “fans” westward into Puget Sound. Sediment from the Duwamish River supplies sediment in a surface plume that circulates in a counter-clockwise direction past the Seattle waterfront. After settling through the pycnocline, Duwamish River sediment mixes with nearshore sediment sources and is transported and deposited in reverse direction (McLaren et al. 1994). GeoSea affirms previous research by Schwartz et al. (1991), that nearshore sediment sources in Elliott Bay are in extremely short supply due to urbanization and seawalls (McLaren et al. 1994). Due to the rarity of available sediment for transport, transport likely only occurs in deeper water during large storm events. Historic – As previously mentioned, historic conditions within Elliott Bay are grouped by sub-area rather than summarized by drift cell. This is because the sub-area falls within a larger region of negligible drift. Historic analysis of pre-development conditions indicated that 24% of the Elliott Bay shore was Feeder Bluff. Nineteen percent of the shore was Not Feeder Bluffs, which were likely Transport zones. Accretion Shoreforms predominantly associated with the Duwamish River Estuary and Smith Cove encompassed 58% of the Bay. When these results are compared with current conditions, it is clear that 100% of the historic Accretion Shoreforms and sediment sources have been lost in this sub-area. Accretion Shoreforms ratios may skew the rest of the shoretype data in the sub-area as the Duwamish River Estuary marsh islands comprised a large portion of the shore. The shoretypes of segments within Elliott Bay are displayed in Map 4, Appendix 2. The rational for segment shoretype designations are included in Table 14.
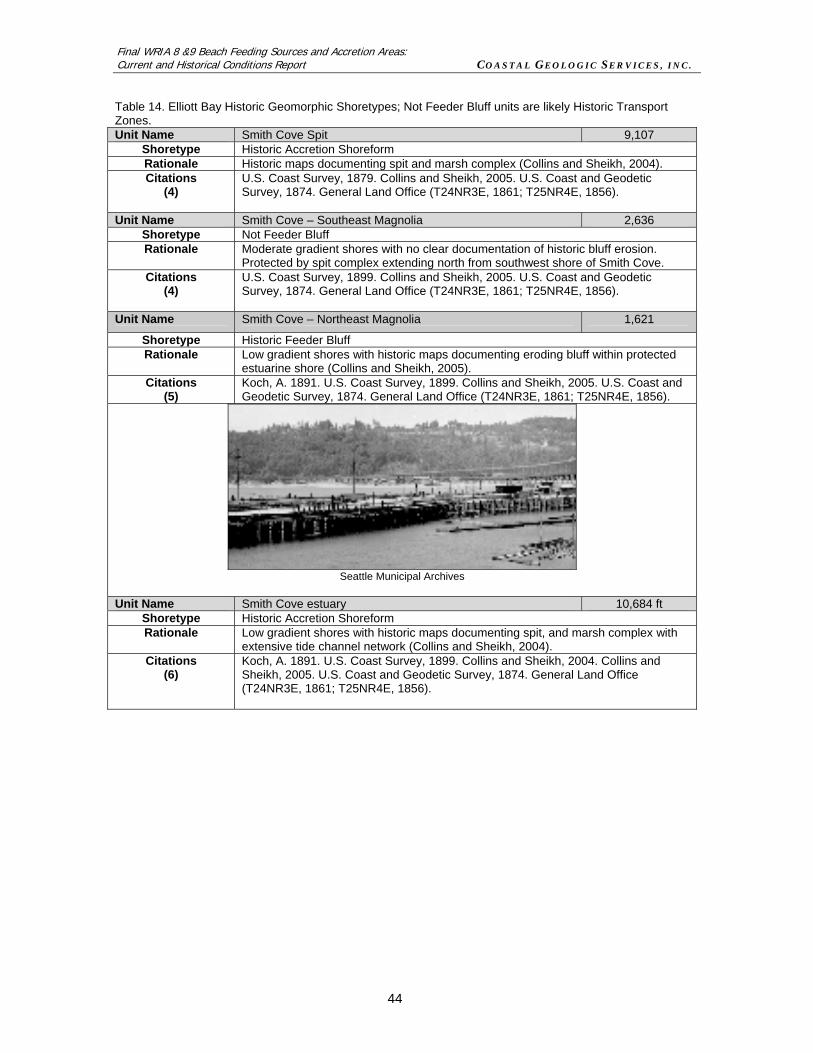
Final WRIA 8 &9 Beach Feeding Sources and Accretion Areas: Current and Historical Conditions Report COASTAL GEOLOGIC SERVICES, INC.
44
Table 14. Elliott Bay Historic Geomorphic Shoretypes; Not Feeder Bluff units are likely Historic Transport Zones. Unit Name Smith Cove Spit 9,107
Shoretype Historic Accretion Shoreform Rationale Historic maps documenting spit and marsh complex (Collins and Sheikh, 2004). Citations
(4) U.S. Coast Survey, 1879. Collins and Sheikh, 2005. U.S. Coast and Geodetic Survey, 1874. General Land Office (T24NR3E, 1861; T25NR4E, 1856).
Unit Name Smith Cove – Southeast Magnolia 2,636 Shoretype Not Feeder Bluff Rationale Moderate gradient shores with no clear documentation of historic bluff erosion.
Protected by spit complex extending north from southwest shore of Smith Cove. Citations
(4) U.S. Coast Survey, 1899. Collins and Sheikh, 2005. U.S. Coast and Geodetic Survey, 1874. General Land Office (T24NR3E, 1861; T25NR4E, 1856).
Unit Name Smith Cove – Northeast Magnolia 1,621
Shoretype Historic Feeder Bluff Rationale Low gradient shores with historic maps documenting eroding bluff within protected
estuarine shore (Collins and Sheikh, 2005). Citations
(5) Koch, A. 1891. U.S. Coast Survey, 1899. Collins and Sheikh, 2005. U.S. Coast and Geodetic Survey, 1874. General Land Office (T24NR3E, 1861; T25NR4E, 1856).
Seattle Municipal Archives
Unit Name Smith Cove estuary 10,684 ft
Shoretype Historic Accretion Shoreform Rationale Low gradient shores with historic maps documenting spit, and marsh complex with
extensive tide channel network (Collins and Sheikh, 2004). Citations
(6) Koch, A. 1891. U.S. Coast Survey, 1899. Collins and Sheikh, 2004. Collins and Sheikh, 2005. U.S. Coast and Geodetic Survey, 1874. General Land Office (T24NR3E, 1861; T25NR4E, 1856).
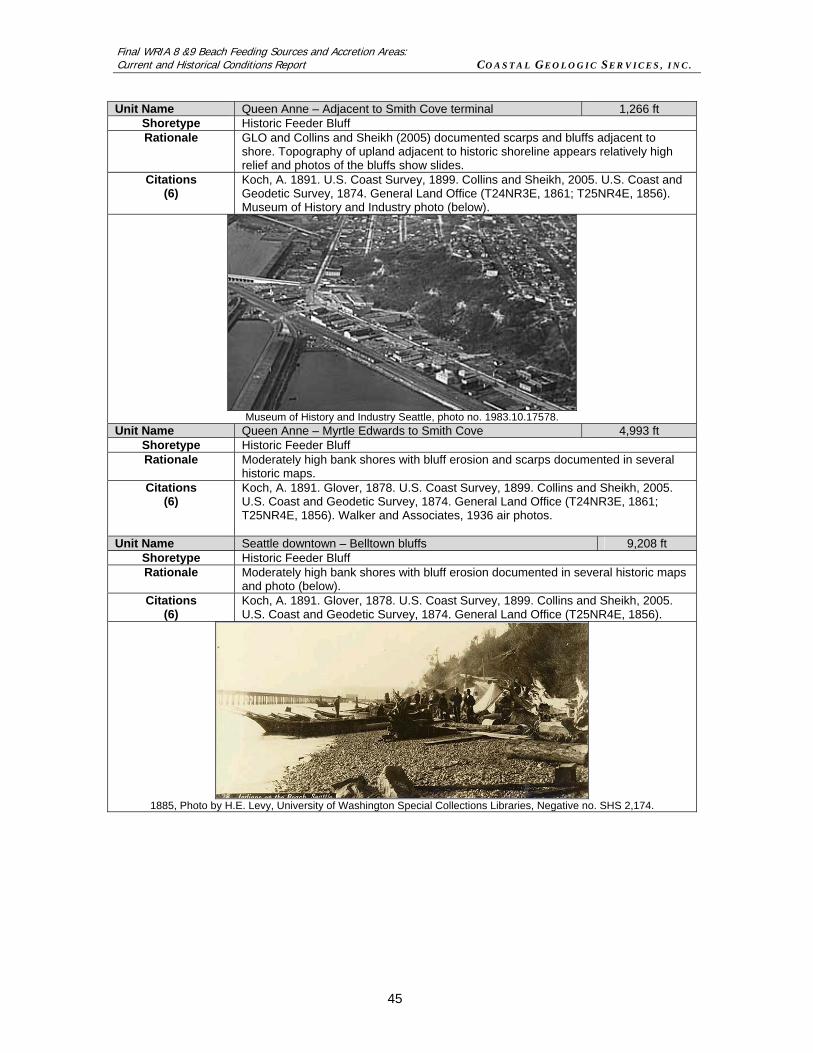
Final WRIA 8 &9 Beach Feeding Sources and Accretion Areas: Current and Historical Conditions Report COASTAL GEOLOGIC SERVICES, INC.
45
Unit Name Queen Anne – Adjacent to Smith Cove terminal 1,266 ft
Shoretype Historic Feeder Bluff Rationale GLO and Collins and Sheikh (2005) documented scarps and bluffs adjacent to
shore. Topography of upland adjacent to historic shoreline appears relatively high relief and photos of the bluffs show slides.
Citations (6)
Koch, A. 1891. U.S. Coast Survey, 1899. Collins and Sheikh, 2005. U.S. Coast and Geodetic Survey, 1874. General Land Office (T24NR3E, 1861; T25NR4E, 1856). Museum of History and Industry photo (below).
Museum of History and Industry Seattle, photo no. 1983.10.17578.
Unit Name Queen Anne – Myrtle Edwards to Smith Cove 4,993 ft Shoretype Historic Feeder Bluff Rationale Moderately high bank shores with bluff erosion and scarps documented in several
historic maps. Citations
(6) Koch, A. 1891. Glover, 1878. U.S. Coast Survey, 1899. Collins and Sheikh, 2005. U.S. Coast and Geodetic Survey, 1874. General Land Office (T24NR3E, 1861; T25NR4E, 1856). Walker and Associates, 1936 air photos.
Unit Name Seattle downtown – Belltown bluffs 9,208 ft Shoretype Historic Feeder Bluff Rationale Moderately high bank shores with bluff erosion documented in several historic maps
and photo (below). Citations
(6) Koch, A. 1891. Glover, 1878. U.S. Coast Survey, 1899. Collins and Sheikh, 2005. U.S. Coast and Geodetic Survey, 1874. General Land Office (T25NR4E, 1856).
1885, Photo by H.E. Levy, University of Washington Special Collections Libraries, Negative no. SHS 2,174.
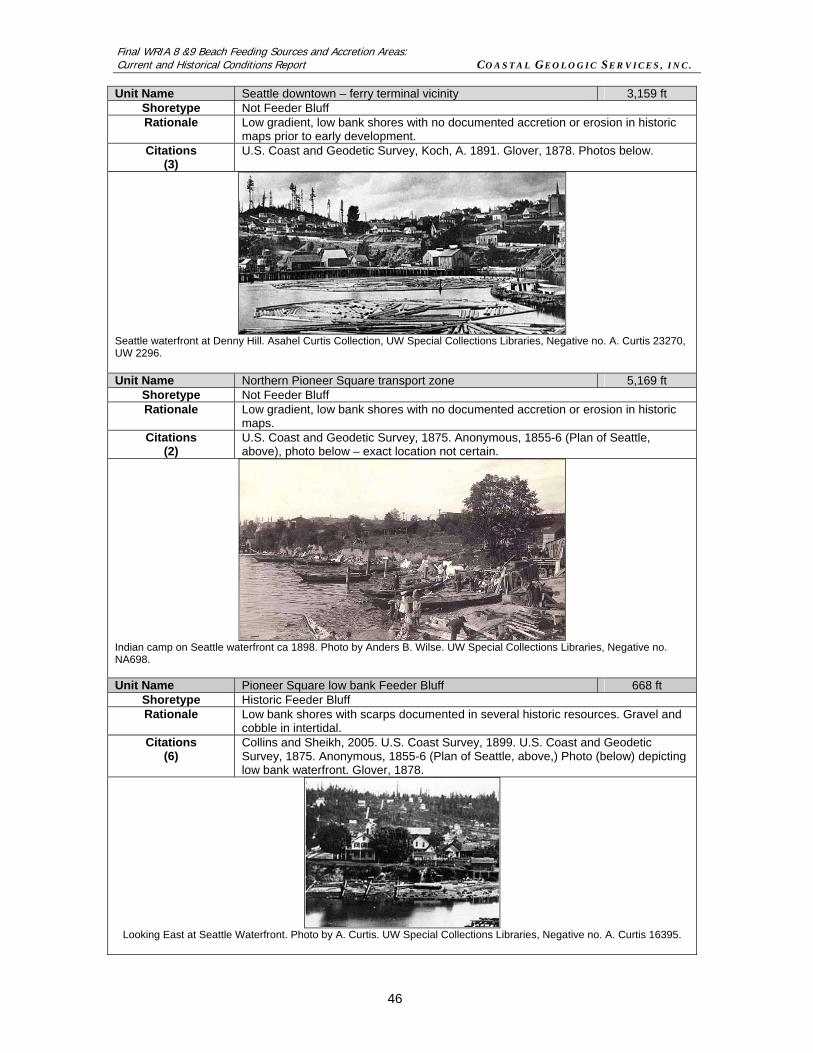
Final WRIA 8 &9 Beach Feeding Sources and Accretion Areas: Current and Historical Conditions Report COASTAL GEOLOGIC SERVICES, INC.
46
Unit Name Seattle downtown – ferry terminal vicinity 3,159 ft Shoretype Not Feeder Bluff Rationale Low gradient, low bank shores with no documented accretion or erosion in historic
maps prior to early development. Citations
(3) U.S. Coast and Geodetic Survey, Koch, A. 1891. Glover, 1878. Photos below.
Seattle waterfront at Denny Hill. Asahel Curtis Collection, UW Special Collections Libraries, Negative no. A. Curtis 23270, UW 2296.
Unit Name Northern Pioneer Square transport zone 5,169 ft
Shoretype Not Feeder Bluff Rationale Low gradient, low bank shores with no documented accretion or erosion in historic
maps. Citations
(2) U.S. Coast and Geodetic Survey, 1875. Anonymous, 1855-6 (Plan of Seattle, above), photo below – exact location not certain.
Indian camp on Seattle waterfront ca 1898. Photo by Anders B. Wilse. UW Special Collections Libraries, Negative no. NA698. Unit Name Pioneer Square low bank Feeder Bluff 668 ft
Shoretype Historic Feeder Bluff Rationale Low bank shores with scarps documented in several historic resources. Gravel and
cobble in intertidal. Citations
(6) Collins and Sheikh, 2005. U.S. Coast Survey, 1899. U.S. Coast and Geodetic Survey, 1875. Anonymous, 1855-6 (Plan of Seattle, above,) Photo (below) depicting low bank waterfront. Glover, 1878.
Looking East at Seattle Waterfront. Photo by A. Curtis. UW Special Collections Libraries, Negative no. A. Curtis 16395.

Final WRIA 8 &9 Beach Feeding Sources and Accretion Areas: Current and Historical Conditions Report COASTAL GEOLOGIC SERVICES, INC.
47
Unit Name Pioneer Square transport zone 2,839 ft Shoretype Not Feeder Bluff Rationale Low gradient, no bank shores with no apparent accretion or erosion documented in
historic maps. Citations
(5) Collins and Sheikh, 2005. U.S. Coast Survey, 1879. U.S. Coast and Geodetic Survey, 1875. Anonymous, 1855-6 (Plan of Seattle, below) Seattle Museum of History and Industry (Photo above).
Unit Name Occidental Square spit-marsh complex 780 ft Shoretype Historic Accretion Shoreform Rationale Low gradient shores with historic maps documenting spit and lagoonal-marsh
complex (Collins and Sheikh, 2004). Citations
(7) Collins and Sheikh, 2005. Collins and Sheikh, 2004. U.S. Coast Survey, 1854. U.S. Coast Survey, 1879. U.S. Coast and Geodetic Survey, 1875. Anonymous, 1855-6 (Plan of Seattle, below), Seattle Museum of History and Industry (Photo above).
MOHAI no. 2002.3.549.

Final WRIA 8 &9 Beach Feeding Sources and Accretion Areas: Current and Historical Conditions Report COASTAL GEOLOGIC SERVICES, INC.
48
Unit Name Downtown Seattle – Yesler reach 1,224 ft
Shoretype Not Feeder Bluff Rationale Low – moderate gradient upland with low bank shores. Considerable alteration at
time of early surveys. 1882 photo of Beacon Hill shows no sign of bluff erosion (below). Early photo taken of tide flats from Beacon Hill depicts low energy shores (below). T-sheets and other maps including 1878 rendering of area shows minimal signs of bluff erosion.
Citations (7)
Collins and Sheikh, 2005. DNR-Geology, 2001. U.S. Coast Survey, 1854. U.S. Coast Survey, 1879. Koch, A. 1891. USC&GS, 1875. Glover, E. 1878.
MOHAI no. 83.10.6.049.2
Unit Name Downtown Seattle – International District 3,578 ft
Shoretype Not Feeder Bluff Rationale Low gradient shores with historic maps documenting marshes, mudflats and an
absence of bluff erosion. Photo from 1882 (below) of Beacon Hill shows no sign of bluff erosion.
Citations (6)
Collins and Sheikh, 2005. DNR-Geology, 2001. U.S. Coast Survey, 1854. U.S. Coast Survey, 1879. Koch, A. 1891. USC&GS, 1875. 1882 photo below.
Looking east towards Beacon Hill. Photo by A. Curtis. UW Special Collections Libraries, Negative no. A. Curtis 16395. Unit Name Beacon Hill shoreline 5,333 ft
Shoretype Not Feeder Bluff Rationale Moderate gradient shores fronted by mud and sand flats with a general absence of
evidence of bluff erosion. Citations
(5) Collins and Sheikh, 2005. U.S. Coast Survey, 1854. U.S. Coast Survey, 1879. Koch, A. 1891. USC&GS, 1875.
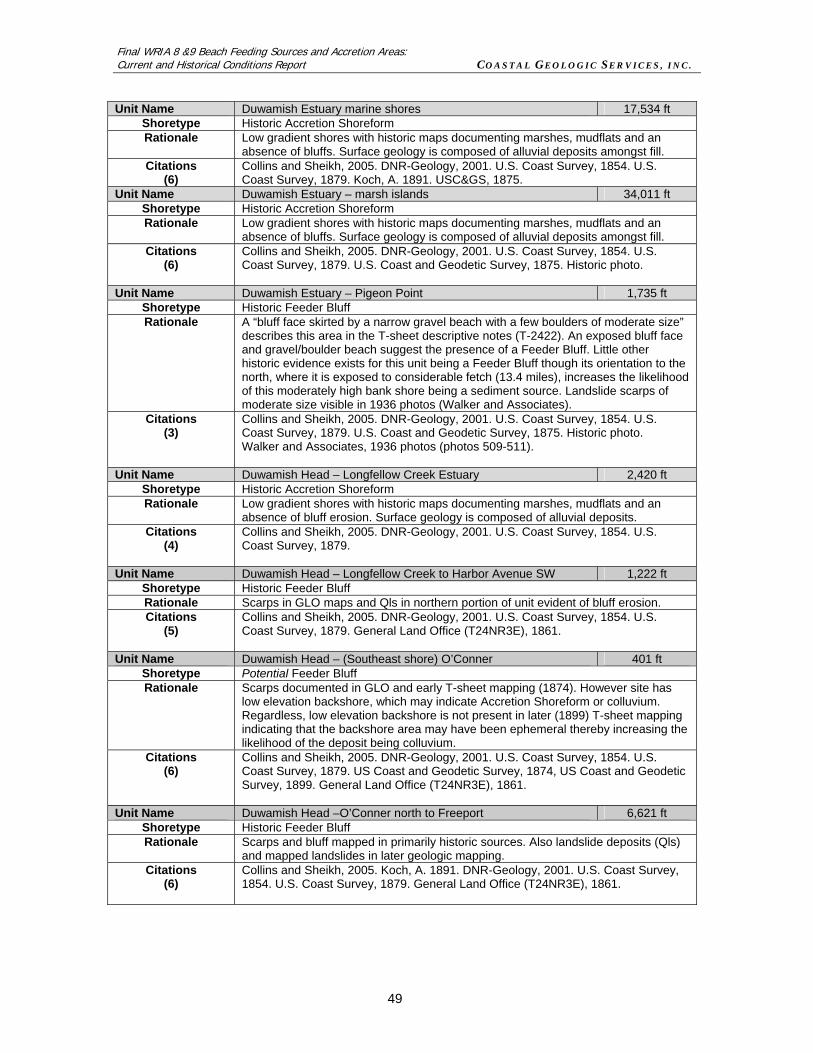
Final WRIA 8 &9 Beach Feeding Sources and Accretion Areas: Current and Historical Conditions Report COASTAL GEOLOGIC SERVICES, INC.
49
Unit Name Duwamish Estuary marine shores 17,534 ft
Shoretype Historic Accretion Shoreform Rationale Low gradient shores with historic maps documenting marshes, mudflats and an
absence of bluffs. Surface geology is composed of alluvial deposits amongst fill. Citations
(6) Collins and Sheikh, 2005. DNR-Geology, 2001. U.S. Coast Survey, 1854. U.S. Coast Survey, 1879. Koch, A. 1891. USC&GS, 1875.
Unit Name Duwamish Estuary – marsh islands 34,011 ft Shoretype Historic Accretion Shoreform Rationale Low gradient shores with historic maps documenting marshes, mudflats and an
absence of bluffs. Surface geology is composed of alluvial deposits amongst fill. Citations
(6) Collins and Sheikh, 2005. DNR-Geology, 2001. U.S. Coast Survey, 1854. U.S. Coast Survey, 1879. U.S. Coast and Geodetic Survey, 1875. Historic photo.
Unit Name Duwamish Estuary – Pigeon Point 1,735 ft Shoretype Historic Feeder Bluff Rationale A “bluff face skirted by a narrow gravel beach with a few boulders of moderate size”
describes this area in the T-sheet descriptive notes (T-2422). An exposed bluff face and gravel/boulder beach suggest the presence of a Feeder Bluff. Little other historic evidence exists for this unit being a Feeder Bluff though its orientation to the north, where it is exposed to considerable fetch (13.4 miles), increases the likelihood of this moderately high bank shore being a sediment source. Landslide scarps of moderate size visible in 1936 photos (Walker and Associates).
Citations (3)
Collins and Sheikh, 2005. DNR-Geology, 2001. U.S. Coast Survey, 1854. U.S. Coast Survey, 1879. U.S. Coast and Geodetic Survey, 1875. Historic photo. Walker and Associates, 1936 photos (photos 509-511).
Unit Name Duwamish Head – Longfellow Creek Estuary 2,420 ft Shoretype Historic Accretion Shoreform Rationale Low gradient shores with historic maps documenting marshes, mudflats and an
absence of bluff erosion. Surface geology is composed of alluvial deposits. Citations
(4) Collins and Sheikh, 2005. DNR-Geology, 2001. U.S. Coast Survey, 1854. U.S. Coast Survey, 1879.
Unit Name Duwamish Head – Longfellow Creek to Harbor Avenue SW 1,222 ft Shoretype Historic Feeder Bluff Rationale Scarps in GLO maps and Qls in northern portion of unit evident of bluff erosion. Citations
(5) Collins and Sheikh, 2005. DNR-Geology, 2001. U.S. Coast Survey, 1854. U.S. Coast Survey, 1879. General Land Office (T24NR3E), 1861.
Unit Name Duwamish Head – (Southeast shore) O’Conner 401 ft Shoretype Potential Feeder Bluff Rationale Scarps documented in GLO and early T-sheet mapping (1874). However site has
low elevation backshore, which may indicate Accretion Shoreform or colluvium. Regardless, low elevation backshore is not present in later (1899) T-sheet mapping indicating that the backshore area may have been ephemeral thereby increasing the likelihood of the deposit being colluvium.
Citations (6)
Collins and Sheikh, 2005. DNR-Geology, 2001. U.S. Coast Survey, 1854. U.S. Coast Survey, 1879. US Coast and Geodetic Survey, 1874, US Coast and Geodetic Survey, 1899. General Land Office (T24NR3E), 1861.
Unit Name Duwamish Head –O’Conner north to Freeport 6,621 ft Shoretype Historic Feeder Bluff Rationale Scarps and bluff mapped in primarily historic sources. Also landslide deposits (Qls)
and mapped landslides in later geologic mapping. Citations
(6) Collins and Sheikh, 2005. Koch, A. 1891. DNR-Geology, 2001. U.S. Coast Survey, 1854. U.S. Coast Survey, 1879. General Land Office (T24NR3E), 1861.

Final WRIA 8 &9 Beach Feeding Sources and Accretion Areas: Current and Historical Conditions Report COASTAL GEOLOGIC SERVICES, INC.
50
Seattle-Three Tree Point The Seattle-Three Tree Point sub-area extends from the northeastern side of Duwamish Head south to the tip of Three Tree Point (also called Point Pulley). The sub-area is characterized by dense residential development and is comprised of 2 complete drift cells (KI-5-1, KI-7-2). The northern drift cell is the longest in King County and originates approximately 0.6 miles north of Secoma Beach, immediately south of Seahurst Park in Burien. The southern drift cell originates at a zone of drift divergence near Secoma Beach and the origin of cell KI-5-5. This drift-cell extends southwest to its terminus at Three Tree Point (Schwartz et al.1991). KI-5-1 KI-5-1 is the longest net shore-drift cell in King County measuring 11.2 miles (Table 7, Map 5, Appendix 2). Net shore-drift is from south to north, evidenced by northward offset of stream mouths, sediment accumulations against groins, boat ramps, and bulkhead offsets (Schwartz et al. 1991, CGS field observation). The drift cell consists of 59.2% modified shoreline (Table 8), commonly consisting of cement or wood bulkheads and rip-rap structures designed to prevent erosion of private property, often fill. Combining Feeder Bluff Exceptional and Feeder Bluff, 5.3% of the KI-5-1 shoreline is contributing sediment to the nearshore. Feeder Bluffs occur along 3.0% of the cell, gradually contributing moderate quantities of sediment to the littoral zone, with less length of Feeder Bluff Exceptional delivering sediment to the beach. Sediment sources were most frequently observed in the southern portion of the drift cell, from Seahurst to just north of Seola Beach. The areas mapped as Feeder Bluff Exceptional are located just north of Seahurst Park in old slide deposits rich in sand (Vashon advance outwash) and just north of Seola Beach. Recent landslides were located mostly in the southern portion of the drift cell (6 segments; 1.2% of cell length) and active toe erosion (1 location) occurred in a Feeder Bluff segment, also in the southern portion of this drift cell (Table 8, Maps 8 and 9, Appendix 2). Less than one-percent (0.7%) of the KI-5-1 shoreline consists of transport zones. This is likely due to the highly modified condition of the shoreline. If modifications were less abundant, then it is likely that all other mapping units would occur more frequently throughout the drift cell. Of the length of cell KI-5-1, 34.7% was mapped as Accretion Shoreform. Accretion Shoreforms were typically long contiguous units, located within or near cuspate foreland-like features (e.g. Brace Point to Point Williams). One Accretion Shoreform was influenced by stream-derived sediment in Seahurst Park, this shoreform accounted for 2.8% of Accretion Shoreforms in the cell (Table 9). Many Accretion Shoreforms have undergone modification from their original form. Only 17.4% of the Accretion Shoreforms (not including Accretion Shoreforms with stream derived sediment) in KI-5-1 are free of modifications. Modified backshore areas occurred along 35.8% percent of the total length of Accretion Shoreforms. Thirty-six percent had modifications that reached down to approximately MHHW and 8.0% of the Accretion Shoreforms in KI-5-1 had modifications that extended into the intertidal. In summary, the very long cell KI-5-1 is predominantly (59.2%) modified by bulkheads and rip-rap, within mostly private property. Sources of sediment are predominantly located in the southern portion of the drift cell. Sediment is delivered to the nearshore from larger mass wasting events as well as small inputs, such as toe erosion. Minimal observations of transport zones were made, representing less than 1% of the drift cell. Of the other CGS shore types, accretionary shoreforms were observed with the highest abundance, representing 34.7% of the total KI-5-1 shoreline. Twenty percent (20.2%) of the Accretion Shoreforms were in a relatively natural state (unmodified stream mouth and regular unmodified accretionary beach). Historic - Prior to development of the KI-5-1 shoreline sediment sources accounted for 23.4% of the
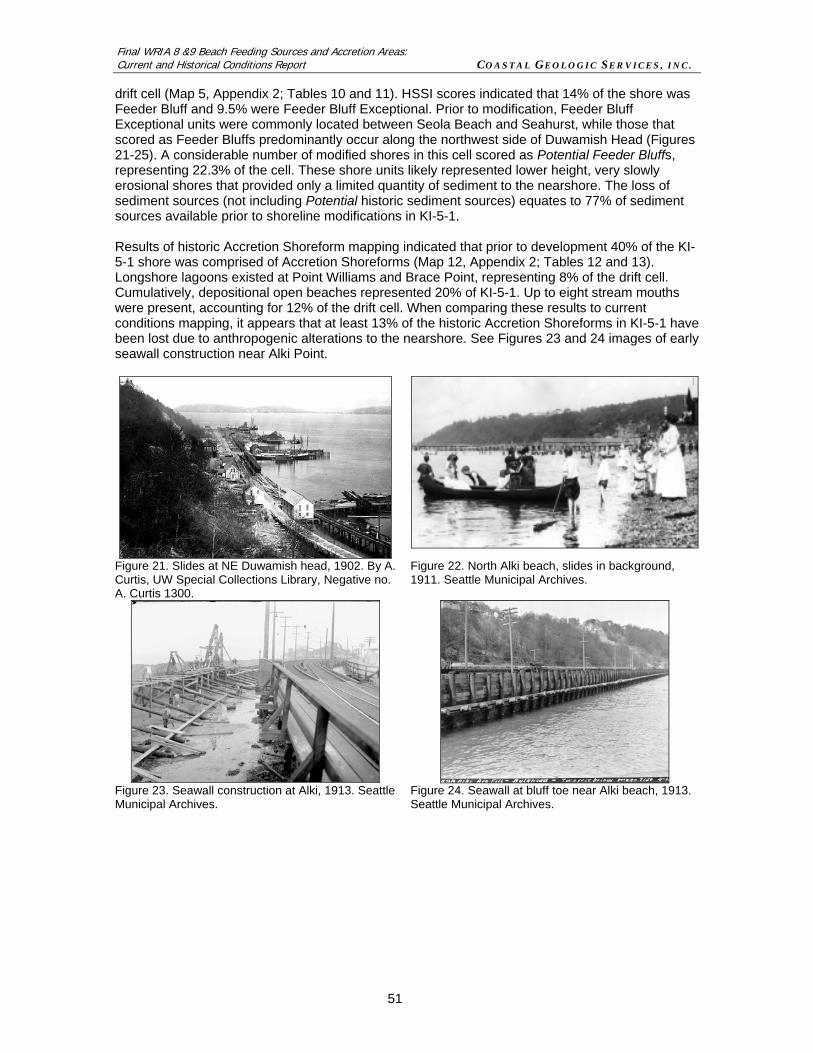
Final WRIA 8 &9 Beach Feeding Sources and Accretion Areas: Current and Historical Conditions Report COASTAL GEOLOGIC SERVICES, INC.
51
drift cell (Map 5, Appendix 2; Tables 10 and 11). HSSI scores indicated that 14% of the shore was Feeder Bluff and 9.5% were Feeder Bluff Exceptional. Prior to modification, Feeder Bluff Exceptional units were commonly located between Seola Beach and Seahurst, while those that scored as Feeder Bluffs predominantly occur along the northwest side of Duwamish Head (Figures 21-25). A considerable number of modified shores in this cell scored as Potential Feeder Bluffs, representing 22.3% of the cell. These shore units likely represented lower height, very slowly erosional shores that provided only a limited quantity of sediment to the nearshore. The loss of sediment sources (not including Potential historic sediment sources) equates to 77% of sediment sources available prior to shoreline modifications in KI-5-1. Results of historic Accretion Shoreform mapping indicated that prior to development 40% of the KI-5-1 shore was comprised of Accretion Shoreforms (Map 12, Appendix 2; Tables 12 and 13). Longshore lagoons existed at Point Williams and Brace Point, representing 8% of the drift cell. Cumulatively, depositional open beaches represented 20% of KI-5-1. Up to eight stream mouths were present, accounting for 12% of the drift cell. When comparing these results to current conditions mapping, it appears that at least 13% of the historic Accretion Shoreforms in KI-5-1 have been lost due to anthropogenic alterations to the nearshore. See Figures 23 and 24 images of early seawall construction near Alki Point.
Figure 21. Slides at NE Duwamish head, 1902. By A. Curtis, UW Special Collections Library, Negative no. A. Curtis 1300.
Figure 22. North Alki beach, slides in background, 1911. Seattle Municipal Archives.
Figure 23. Seawall construction at Alki, 1913. Seattle Municipal Archives.
Figure 24. Seawall at bluff toe near Alki beach, 1913. Seattle Municipal Archives.

Final WRIA 8 &9 Beach Feeding Sources and Accretion Areas: Current and Historical Conditions Report COASTAL GEOLOGIC SERVICES, INC.
52
Figure 25. Southern KI-5-1, Bluffs in background 1884. By Boyd and Braas. UW Special Collections Libraries, Negative no. UW18560.
KI-7-2 Drift cell KI-7-2, starting south of Seahurst Park and extending along the northern shore of Three Tree Point, is exposed to northwesterly wind-generated waves resulting in net shore-drift to the south and southwest. The cell measures 8,605 ft, 76.5% of which is heavily modified by residential bulkheads. Less than 1% of the drift cell is contributing sediment to down-drift beaches (Map 5, Appendix 2, Table 8). This single sediment source measures only 57 ft in length. No active toe erosion or landslides were observed during field mapping. Accretion Shoreforms represented 22.8% of the drift cell. Of this total length 21.2% of these beaches were free of modifications (Table 9). Modifications were present in the backshore at 64.5% of Accretion Shoreforms and 14.3% were modified into the intertidal. The west point of Three Tree Point is heavily fortified with rip-rap, constructed near the navigation light and private property. It appears that (vertical) filling may have occurred behind the rip-rap. Historic - Prior to development, sediment sources in KI-7-2 accounted for 43.4% of the drift cell (Tables 10 and 11). These sediment sources were predominantly located within 0.25-1.0 mile northeast of Three Tree Point. Feeder Bluffs historically represented 43 % of the drift cell. Slightly less than one percent (0.7%) of KI-7-2 was Feeder Bluff Exceptional and an additional 16% was Potential Feeder Bluff. In summary, drift cell KI-7-2 has lost 98.5% of its historic sediment sources. Results of historic AS mapping indicated that all of the historic AS(es) in KI-7-2 are currently intact, despite the alterations previously mentioned and summarized in Table 9. Such modifications include the loss of a longshore lagoon that was previously located within the cuspate foreland at Three Tree Point (formerly called Point Pulley).
South King
The South-King sub-area is the southernmost region of the mainland King County shoreline. It extends south from the tip of Three Tree Point to the King-Pierce County boundary. The sub-area measures 16.7 miles and is comprised of six drift cells and one region of negligible drift (Maps 1 and 2, Appendix 2). The sub-area is characterized by suburban residential development and a number of public beach parks. KI-7-3 The northern-most drift cell, KI-7-3, exhibits northward net shore-drift. It originates at the bluff just north of the Des Moines Creek estuary and terminates at the tip of Three Tree Point. It measured 4.5 miles, 40.3% of which is modified (Map 6, Table 8, Appendix 2). Sediment sources in KI-7-3 are predominantly located within the central and southern regions of
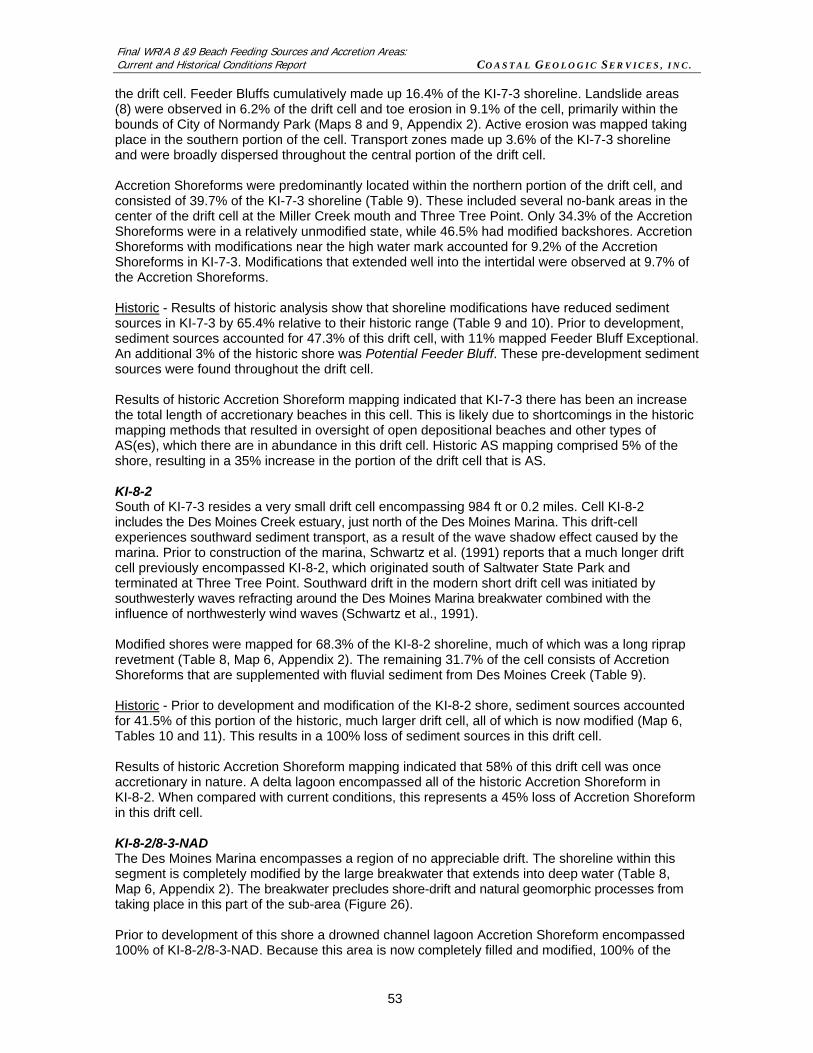
Final WRIA 8 &9 Beach Feeding Sources and Accretion Areas: Current and Historical Conditions Report COASTAL GEOLOGIC SERVICES, INC.
53
the drift cell. Feeder Bluffs cumulatively made up 16.4% of the KI-7-3 shoreline. Landslide areas (8) were observed in 6.2% of the drift cell and toe erosion in 9.1% of the cell, primarily within the bounds of City of Normandy Park (Maps 8 and 9, Appendix 2). Active erosion was mapped taking place in the southern portion of the cell. Transport zones made up 3.6% of the KI-7-3 shoreline and were broadly dispersed throughout the central portion of the drift cell. Accretion Shoreforms were predominantly located within the northern portion of the drift cell, and consisted of 39.7% of the KI-7-3 shoreline (Table 9). These included several no-bank areas in the center of the drift cell at the Miller Creek mouth and Three Tree Point. Only 34.3% of the Accretion Shoreforms were in a relatively unmodified state, while 46.5% had modified backshores. Accretion Shoreforms with modifications near the high water mark accounted for 9.2% of the Accretion Shoreforms in KI-7-3. Modifications that extended well into the intertidal were observed at 9.7% of the Accretion Shoreforms. Historic - Results of historic analysis show that shoreline modifications have reduced sediment sources in KI-7-3 by 65.4% relative to their historic range (Table 9 and 10). Prior to development, sediment sources accounted for 47.3% of this drift cell, with 11% mapped Feeder Bluff Exceptional. An additional 3% of the historic shore was Potential Feeder Bluff. These pre-development sediment sources were found throughout the drift cell. Results of historic Accretion Shoreform mapping indicated that KI-7-3 there has been an increase the total length of accretionary beaches in this cell. This is likely due to shortcomings in the historic mapping methods that resulted in oversight of open depositional beaches and other types of AS(es), which there are in abundance in this drift cell. Historic AS mapping comprised 5% of the shore, resulting in a 35% increase in the portion of the drift cell that is AS. KI-8-2 South of KI-7-3 resides a very small drift cell encompassing 984 ft or 0.2 miles. Cell KI-8-2 includes the Des Moines Creek estuary, just north of the Des Moines Marina. This drift-cell experiences southward sediment transport, as a result of the wave shadow effect caused by the marina. Prior to construction of the marina, Schwartz et al. (1991) reports that a much longer drift cell previously encompassed KI-8-2, which originated south of Saltwater State Park and terminated at Three Tree Point. Southward drift in the modern short drift cell was initiated by southwesterly waves refracting around the Des Moines Marina breakwater combined with the influence of northwesterly wind waves (Schwartz et al., 1991). Modified shores were mapped for 68.3% of the KI-8-2 shoreline, much of which was a long riprap revetment (Table 8, Map 6, Appendix 2). The remaining 31.7% of the cell consists of Accretion Shoreforms that are supplemented with fluvial sediment from Des Moines Creek (Table 9). Historic - Prior to development and modification of the KI-8-2 shore, sediment sources accounted for 41.5% of this portion of the historic, much larger drift cell, all of which is now modified (Map 6, Tables 10 and 11). This results in a 100% loss of sediment sources in this drift cell. Results of historic Accretion Shoreform mapping indicated that 58% of this drift cell was once accretionary in nature. A delta lagoon encompassed all of the historic Accretion Shoreform in KI-8-2. When compared with current conditions, this represents a 45% loss of Accretion Shoreform in this drift cell. KI-8-2/8-3-NAD The Des Moines Marina encompasses a region of no appreciable drift. The shoreline within this segment is completely modified by the large breakwater that extends into deep water (Table 8, Map 6, Appendix 2). The breakwater precludes shore-drift and natural geomorphic processes from taking place in this part of the sub-area (Figure 26). Prior to development of this shore a drowned channel lagoon Accretion Shoreform encompassed 100% of KI-8-2/8-3-NAD. Because this area is now completely filled and modified, 100% of the
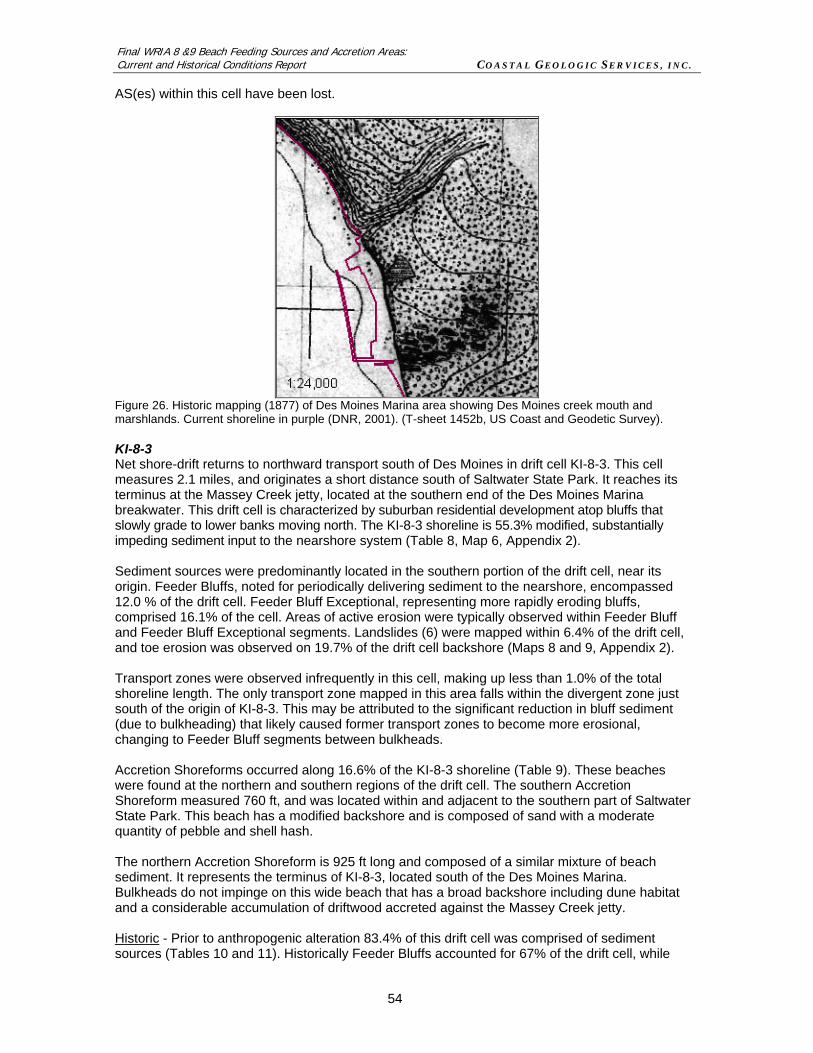
Final WRIA 8 &9 Beach Feeding Sources and Accretion Areas: Current and Historical Conditions Report COASTAL GEOLOGIC SERVICES, INC.
54
AS(es) within this cell have been lost.
Figure 26. Historic mapping (1877) of Des Moines Marina area showing Des Moines creek mouth and marshlands. Current shoreline in purple (DNR, 2001). (T-sheet 1452b, US Coast and Geodetic Survey). KI-8-3 Net shore-drift returns to northward transport south of Des Moines in drift cell KI-8-3. This cell measures 2.1 miles, and originates a short distance south of Saltwater State Park. It reaches its terminus at the Massey Creek jetty, located at the southern end of the Des Moines Marina breakwater. This drift cell is characterized by suburban residential development atop bluffs that slowly grade to lower banks moving north. The KI-8-3 shoreline is 55.3% modified, substantially impeding sediment input to the nearshore system (Table 8, Map 6, Appendix 2). Sediment sources were predominantly located in the southern portion of the drift cell, near its origin. Feeder Bluffs, noted for periodically delivering sediment to the nearshore, encompassed 12.0 % of the drift cell. Feeder Bluff Exceptional, representing more rapidly eroding bluffs, comprised 16.1% of the cell. Areas of active erosion were typically observed within Feeder Bluff and Feeder Bluff Exceptional segments. Landslides (6) were mapped within 6.4% of the drift cell, and toe erosion was observed on 19.7% of the drift cell backshore (Maps 8 and 9, Appendix 2). Transport zones were observed infrequently in this cell, making up less than 1.0% of the total shoreline length. The only transport zone mapped in this area falls within the divergent zone just south of the origin of KI-8-3. This may be attributed to the significant reduction in bluff sediment (due to bulkheading) that likely caused former transport zones to become more erosional, changing to Feeder Bluff segments between bulkheads. Accretion Shoreforms occurred along 16.6% of the KI-8-3 shoreline (Table 9). These beaches were found at the northern and southern regions of the drift cell. The southern Accretion Shoreform measured 760 ft, and was located within and adjacent to the southern part of Saltwater State Park. This beach has a modified backshore and is composed of sand with a moderate quantity of pebble and shell hash. The northern Accretion Shoreform is 925 ft long and composed of a similar mixture of beach sediment. It represents the terminus of KI-8-3, located south of the Des Moines Marina. Bulkheads do not impinge on this wide beach that has a broad backshore including dune habitat and a considerable accumulation of driftwood accreted against the Massey Creek jetty. Historic - Prior to anthropogenic alteration 83.4% of this drift cell was comprised of sediment sources (Tables 10 and 11). Historically Feeder Bluffs accounted for 67% of the drift cell, while
Final WRIA 8 &9 Beach Feeding Sources and Accretion Areas: Current and Historical Conditions Report COASTAL GEOLOGIC SERVICES, INC.
55
16% represented Feeder Bluff Exceptional units. Results of historic conditions analysis indicated that a 66.3% loss of the original sediment sources has occurred in KI-8-3. Results of historic Accretion Shoreform mapping indicated that prior to development 20% of this cell was historically AS, including a drowned channel lagoon (9%), and a stream mouth (11%). When compared with current conditions this represents a 15% loss in Accretion Shoreform in KI-8-3. KI-9-2 A short region of divergence south of Saltwater State Park is the origin of drift-cell KI-9-2. This cell measures 4.8 miles and terminates at the southwestern shore of Dumas Bay. Cell KI-9-2 exhibits southwestward net shore-drift due to the lack of exposure to the south and a shoreline orientation allowing northerly wind waves to become much larger and control net shore-drift (Schwartz et al. 1991). The cell was characterized by medium bank shore in Woodmont Beach with much residential development, the long reach of Redondo Beach (and associated seawall), and high bank west of Redondo that lowers to low bank south of Poverty Bay Park. Fifty-eight percent (58.8%) of the cell shoreline is modified (Map 6, Appendix 2; Table 8). Modifications are frequent throughout the cell but they diminish in abundance in the south-central portion of the cell. Sediment sources were predominantly found in the south-central portion of the drift cell likely due to the less modified state of the shoreline, enabling natural geomorphic processes to persist. Feeder Bluffs made up 16.5% of the shoreline in this drift cell. Five recent landslide zones were observed during field mapping representing 2.2% of the cell, and several areas of toe erosion were noted (Maps 8 and 9, Appendix 2). Toe erosion was observed on 10.1% of the KI-9-2 shoreline. Transport zones were consistently mapped only along the southwestern shore of the cell from Adelaide to Poverty Bay Park, and represented 4.2% of the KI-9-3 shoreline. Accretion Shoreforms occurred at 20.4% of the shoreline (Table 9). Accretionary beaches were distributed throughout the drift cell with slightly greater frequency in the southern portion of the cell. Near one-third of the Accretion Shoreforms (29.7%) were associated with a stream-mouth. Two of these stream mouths (1,054 ft) had modifications that extended to the mean high water mark, a third segment had a modified backshore (350 ft). Modified backshores were observed at 31.4% of the Accretion Shoreforms (free of a freshwater source) and modifications extending down to mean high water were mapped along 27.3% of the KI-9-2 beaches. In total, 11.6% of the Accretion Shoreforms in KI-9-2 were relatively unmodified. Historic - Results of historic analysis indicated sediment sources in KI-9-2 previously encompassed 30.2% of the drift cell (Map 6, Appendix 2; Table 9 and 10). Prior to development 12% of the shore in KI-9-2 was Feeder Bluff Exceptional and 18% was Feeder Bluff. An additional 31% of the drift cell was Potential Feeder Bluff. When compared with current conditions, this accounts for a minimum of 45.3% loss of sediment sources in this drift cell (Figure 27). Prior to development Accretion Shoreforms accounted for 21% of the KI-9-2 shore, all of which were stream mouths (Table 13). This represents a minimum 3% loss of Accretion Shoreform when compared with current conditions AS mapping (Map 13, Appendix 2; Table 14).

Final WRIA 8 &9 Beach Feeding Sources and Accretion Areas: Current and Historical Conditions Report COASTAL GEOLOGIC SERVICES, INC.
56
Figure 27. Landslide near Lakota, just northeast of Dumas Bay, 3/1934. Seattle Municipal Archives. KI-10-2 Drift cell KI-10-2 originates at a drift divergence located at the rounded headland immediately west of Dumas Bay (Schwartz et al. 1991). The cell measures just under one-third of a mile (1,562 ft), and terminates at a prograded beach in southwest Dumas Bay. Southeasterly drift terminates at a recurved spit at the drift cell terminus. Vegetated high bluffs with abundant LWD recruitment, grading to lower elevation bluffs with an intertidal bar and spit at the drift cell terminus, generally characterize this drift cell. Scattered residential development is found atop the bluffs. Only 4.5% of the shoreline in KI-10-2 is modified (Map 6, Appendix 2; Table 8). Feeder Bluffs accounted for 39.6% of the cell and were predominantly found near the cell’s origin and divergence with cell KI-10-3. Recent sediment sources including toe erosion (Map 9, Appendix 2) and landsliding were also consistently observed near the cell’s origin. A large landslide zone mapped near the western end of the cell continued into KI-10-3 (Map 8, Appendix 2). This single landslide zone represented 39% of the cell’s shoreline. Toe erosion was mapped along 40.2% of the KI-10-2 shoreline. Transport zones accounted for 37.8% of the short KI-10-2 drift cell. They were predominantly mapped in the central region of the cell. Accretion Shoreforms were mapped along the southwestern shore of Dumas Bay, mostly in a longshore lagoon that extended to the drift cell terminus. Eighteen percent (18.1%) of the KI-10-2 shoreline was in two Accretion Shoreforms, neither of which were modified. Historic - Of the modified shore units in KI-10-2, historic analysis indicates that an additional 4.0% was Potential Feeder Bluff. As a result no considerable loss of sediment sources has taken place in cell KI-10-2 (Tables 10 and 11). Results of historic AS mapping indicate that 25% of the KI-10-2 shore was comprised of stream mouth accretion beaches prior to development (Table 13). When compared with current conditions this represents a 27% (102 ft) loss of AS(es) in the drift cell (Table 12, Map 13, Appendix 2). The apparent loss was likely due subtle inaccuracies in historic mapping as well as changed conditions that may have influenced the range over which fluvial processes influenced nearshore conditions. KI-10-3 Drift cell KI-10-3 originates at the divergent zone in common with KI-10-2, located at the headland just west of Dumas Bay. It exhibits westward drift to its terminus at Dash Point in Pierce County. The formation of Dash Point and a series of oblique bars across the low tide terrace that run perpendicular to the northeasterly wave approach and are indicative of southwestward drift (Schwartz et al. 1991). The western 0.5 miles of the cell is south of the southern limit of the study

Final WRIA 8 &9 Beach Feeding Sources and Accretion Areas: Current and Historical Conditions Report COASTAL GEOLOGIC SERVICES, INC.
57
area. The cell is characterized by slowly receding (apparently through slumps) high bluffs with abundant large woody debris recruitment. Much of the KI-10-3 shoreline falls within Dumas Bay Park. Twenty-seven (27.3%) percent of the drift cell is modified (Map 6, Appendix 2; Table 8). Feeder Bluffs were observed throughout much of the cell, comprising 57.9% of the KI-10-3 shoreline. Thirteen landslide zones were mapped in the cell, several of which were found along the high bluffs of the headland west of Dumas Bay and surrounding Dash Point State Park. In total landslides were found along 46.9% of the KI-10-3 shoreline, including several long stretches. Toe erosion was also prevalent in this drift cell and was mapped 51.8% of the drift cell (Maps 8 and 9, Appendix 2). Few transport zones were mapped in this drift cell, which accounted for 6.9% of the KI-10-3 shore and were distributed throughout the cell. Accretion Shoreforms occurred along 7.9% of the KI-10-3 shoreline (Table 9). They were exclusively found in the western portion of the cell adjacent to the mini-estuary in Dash Point State Park. Most of the Accretion Shoreform length was unmodified, however the stream channel in the park was heavily rip rapped. Historic - Historic analysis reveals that 83% of this drift cell were sediment sources prior to development, resulting in a loss of just over a 30% (Tables 10 and 11). Prior to development 79% of KI-10-3 was Feeder Bluff, and 4% was Feeder Bluff Exceptional. An additional 2% was Potential Feeder Bluff. Accretion Shoreforms have not changed since pre-development conditions in this drift cell.
Vashon & North Maury Islands The Vashon and North Maury Islands sub-area encompasses 29.5 miles representing the greatest sub-area length. It includes all of the shoreline of Vashon Island, excluding the inner shoreline of Quartermaster Harbor--from Piner Point to Neill Point, and includes the northern shore of Maury Island. Southeast Maury Island and Quartermaster Harbor are distinct in character and were put into separate sub-areas. The Vashon and North Maury Islands sub-area is characterized by low-density and rural development with a small number of dense developments. It is comprised of 26 net shore-drift cells. CGS field mapping of this sub-area will be described by drift cell from the north Vashon Island clockwise around Maury Island, then from south to north of the west side of Vashon. KI-12-1 KI-12-1 originates at a divergent zone located 1630 ft (0.3 miles) west of the Ferry terminal on Vashon Island and extends 1.0 mile to its terminus at the tip of Dolphin Point. Development is relatively dense and bulkheads are prolific, covering 71.9% of the drift cell (Map 7, Appendix 2; Table 8). Feeder Bluffs were mapped along 25.4% of the KI-12-1 shoreline. Active erosion was taking place in a single landslide that encompassed 1.1 % of the drift cell. Toe erosion was supplying sediment from 35.2% of the shoreline in KI-12-1 (Maps 8 and 9, Appendix 2). No transport zones were mapped in this cell and only one small (146.8 ft) Accretion Shoreform was observed, located on the northern side of Dolphin Point near the drift cell convergence (Table 9). The majority of net shore-drift sediment is ultimately deposited in deep water east of the point. Historic - Results of historic analysis indicated that prior to development sediment sources comprised 97.3% of this drift cell (Tables 10 and 11). When compared with current conditions this equates to a loss of 74% (3965 ft) of the available sediment sources in the cell. Prior to
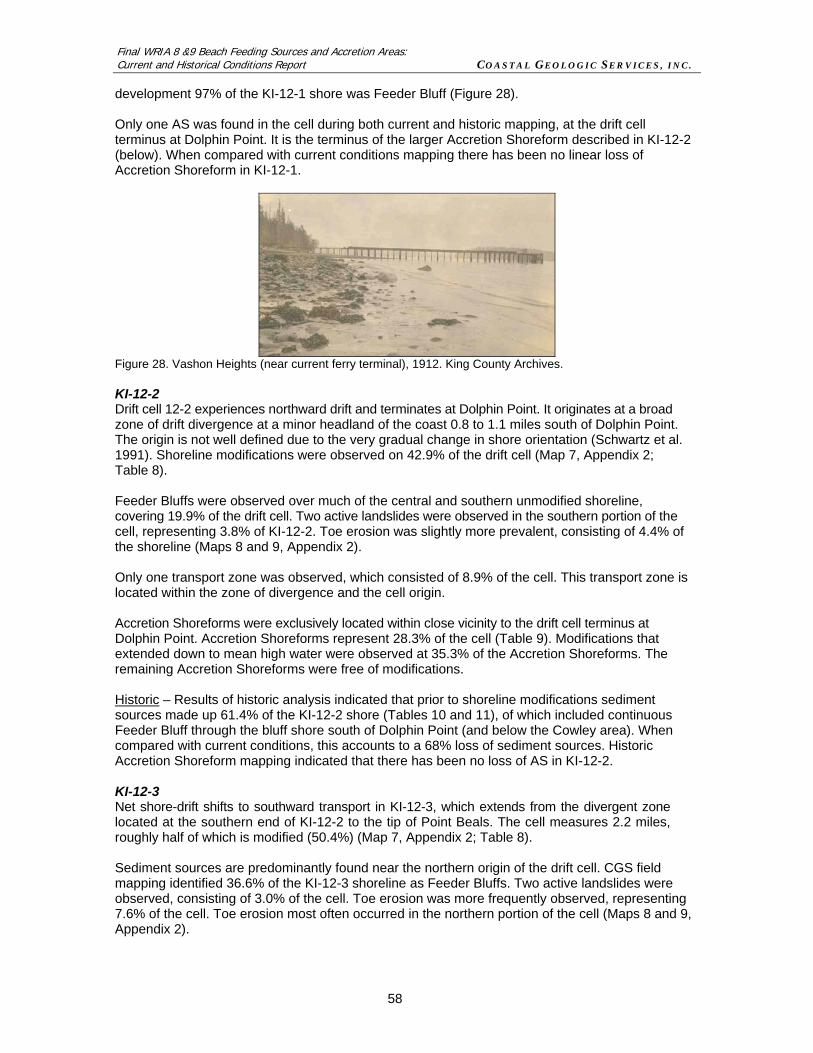
Final WRIA 8 &9 Beach Feeding Sources and Accretion Areas: Current and Historical Conditions Report COASTAL GEOLOGIC SERVICES, INC.
58
development 97% of the KI-12-1 shore was Feeder Bluff (Figure 28). Only one AS was found in the cell during both current and historic mapping, at the drift cell terminus at Dolphin Point. It is the terminus of the larger Accretion Shoreform described in KI-12-2 (below). When compared with current conditions mapping there has been no linear loss of Accretion Shoreform in KI-12-1.
Figure 28. Vashon Heights (near current ferry terminal), 1912. King County Archives. KI-12-2 Drift cell 12-2 experiences northward drift and terminates at Dolphin Point. It originates at a broad zone of drift divergence at a minor headland of the coast 0.8 to 1.1 miles south of Dolphin Point. The origin is not well defined due to the very gradual change in shore orientation (Schwartz et al. 1991). Shoreline modifications were observed on 42.9% of the drift cell (Map 7, Appendix 2; Table 8). Feeder Bluffs were observed over much of the central and southern unmodified shoreline, covering 19.9% of the drift cell. Two active landslides were observed in the southern portion of the cell, representing 3.8% of KI-12-2. Toe erosion was slightly more prevalent, consisting of 4.4% of the shoreline (Maps 8 and 9, Appendix 2). Only one transport zone was observed, which consisted of 8.9% of the cell. This transport zone is located within the zone of divergence and the cell origin. Accretion Shoreforms were exclusively located within close vicinity to the drift cell terminus at Dolphin Point. Accretion Shoreforms represent 28.3% of the cell (Table 9). Modifications that extended down to mean high water were observed at 35.3% of the Accretion Shoreforms. The remaining Accretion Shoreforms were free of modifications. Historic – Results of historic analysis indicated that prior to shoreline modifications sediment sources made up 61.4% of the KI-12-2 shore (Tables 10 and 11), of which included continuous Feeder Bluff through the bluff shore south of Dolphin Point (and below the Cowley area). When compared with current conditions, this accounts to a 68% loss of sediment sources. Historic Accretion Shoreform mapping indicated that there has been no loss of AS in KI-12-2. KI-12-3 Net shore-drift shifts to southward transport in KI-12-3, which extends from the divergent zone located at the southern end of KI-12-2 to the tip of Point Beals. The cell measures 2.2 miles, roughly half of which is modified (50.4%) (Map 7, Appendix 2; Table 8). Sediment sources are predominantly found near the northern origin of the drift cell. CGS field mapping identified 36.6% of the KI-12-3 shoreline as Feeder Bluffs. Two active landslides were observed, consisting of 3.0% of the cell. Toe erosion was more frequently observed, representing 7.6% of the cell. Toe erosion most often occurred in the northern portion of the cell (Maps 8 and 9, Appendix 2).

Final WRIA 8 &9 Beach Feeding Sources and Accretion Areas: Current and Historical Conditions Report COASTAL GEOLOGIC SERVICES, INC.
59
A very small section of shoreline in the middle of the cell was identified as a transport zone, which consisted of only 0.8% of KI-12-3 shoreline. Accretion Shoreforms typically occurred in the southern half and near the drift cell terminus at Point Beal (Table 9). These beaches represent 12.3% of the cell. Modifications were observed extending up to the mean high watermark at 38.2% of the Accretion Shoreforms. The other 61.8% were in a relatively pristine state. Historic – Results of historic conditions analysis indicated that all sediment sources in KI-12-3 are currently intact, resulting in a zero% loss of sediment sources (Tables 10 and 11). However, 38% of modified segments scored as Potential Feeder Bluff, such that these bluffs may have actually been historic sediment sources, just likely contributing smaller quantities at a lower frequency than Feeder Bluffs. Historic Accretion Shoreform mapping indicated that 16% of the KI-12-3 shore was AS prior to development. Two additional stream mouths were discovered during historic mapping (Map 14, Appendix 2). In addition, this cell included one depositional open beach, and the north shoreline of a longshore lagoon at Point Beals described in cell KI-12-4 (Tables 12 and 13). When compared to current conditions mapping, it appears that KI-12-4 has undergone a minimum of 24% loss of Accretion Shoreforms since pre-development conditions, which may be due to inaccuracies in the historic AS mapping. KI-12-4 This drift cell with northward net shore-drift originates at the minor headland near Vashon Landing, approximately 1.4 miles south of Point Beal. The cell terminus is at the convergence with cell KI-12-3 at Point Beals, aiding in the formation of the cuspate foreland. Modifications are found on 35.4% of the KI-12-4 shoreline (Map 7, Appendix 2; Table 8). CGS field mapping identified Feeder Bluffs along 47% of the KI-12-4 shoreline. Eroding bluffs were observed throughout the drift cell, with the longest contiguous stretch of unmodified eroding shoreline in the northern portion of the cell. Active landslides were observed on 10.5% of the cell and toe erosion was occurring on 9.7% of the banks and bluffs (Maps 8 and 9, Appendix 2). Transport zones were not frequently observed; making up only 1.4% of the drift cell. Accretion Shoreforms were mapped along 16.2% of the cell (Table 9). The foreland at Point Beals, the cell terminus, was the largest Accretion Shoreform. The southern end of the AS at Point Beals has a modified backshore. The only other Accretion Shoreform was found at a stream-delta complex at the mouths of Dillworth and Gorsuch Creeks. Historic – Prior to development 71.5% of the KI-12-4 shoreline was composed of sediment sources (Tables 10 and 11). HSSI scores showed that historically 71% of the KI-12-4 shore was Feeder Bluff and another 1% was Potential Feeder Bluff. When compared with current conditions this equates to a 34.3% loss of sediment sources in the drift cell. Results of historic Accretion Shoreform mapping indicated that prior to development 22% of the KI-12-4 shore was accretionary in nature. Historic AS(es) in this cell were comprised of 8% delta lagoon, 8% longshore lagoon and 4% were associated with stream mouths (Tables 12 and 13)). Point Beals was a longshore lagoon behind a spit rounding the point. This cell also included a delta lagoon at a creek originating near Ober Memorial Park and a stream mouth at Vashon Landing. When these results are compared with current conditions mapping, this equates to a 25% loss of Accretion Shoreform length in KI-12-4. KI-13-2 Originating at the southern shore of Vashon Landing, this drift cell exhibits southward drift and terminates along the west side of the large recurved spit near the marsh inlet at Point Heyer. It measures 2.5 miles in length and is characterized by minimal modifications (<10%) and eroding bluffs (Map 7, Appendix 2; Table 8). Abundant sediment sources were mapped in KI-13-2. Feeder
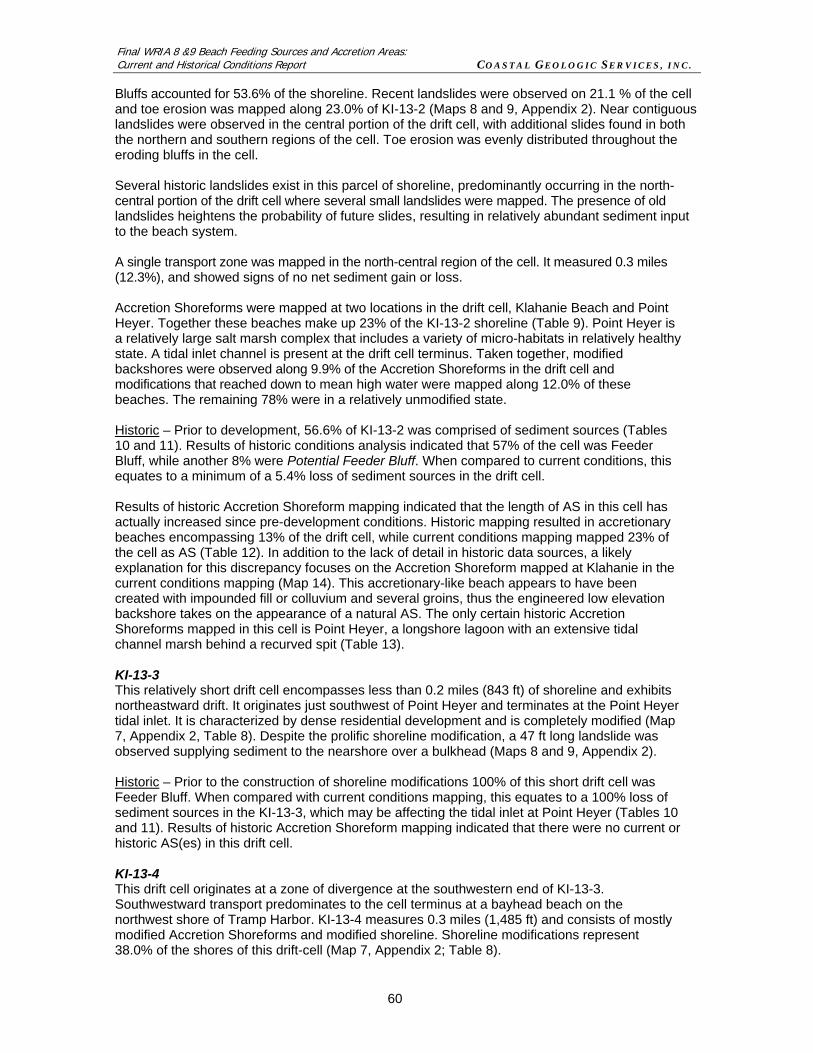
Final WRIA 8 &9 Beach Feeding Sources and Accretion Areas: Current and Historical Conditions Report COASTAL GEOLOGIC SERVICES, INC.
60
Bluffs accounted for 53.6% of the shoreline. Recent landslides were observed on 21.1 % of the cell and toe erosion was mapped along 23.0% of KI-13-2 (Maps 8 and 9, Appendix 2). Near contiguous landslides were observed in the central portion of the drift cell, with additional slides found in both the northern and southern regions of the cell. Toe erosion was evenly distributed throughout the eroding bluffs in the cell. Several historic landslides exist in this parcel of shoreline, predominantly occurring in the north-central portion of the drift cell where several small landslides were mapped. The presence of old landslides heightens the probability of future slides, resulting in relatively abundant sediment input to the beach system. A single transport zone was mapped in the north-central region of the cell. It measured 0.3 miles (12.3%), and showed signs of no net sediment gain or loss. Accretion Shoreforms were mapped at two locations in the drift cell, Klahanie Beach and Point Heyer. Together these beaches make up 23% of the KI-13-2 shoreline (Table 9). Point Heyer is a relatively large salt marsh complex that includes a variety of micro-habitats in relatively healthy state. A tidal inlet channel is present at the drift cell terminus. Taken together, modified backshores were observed along 9.9% of the Accretion Shoreforms in the drift cell and modifications that reached down to mean high water were mapped along 12.0% of these beaches. The remaining 78% were in a relatively unmodified state. Historic – Prior to development, 56.6% of KI-13-2 was comprised of sediment sources (Tables 10 and 11). Results of historic conditions analysis indicated that 57% of the cell was Feeder Bluff, while another 8% were Potential Feeder Bluff. When compared to current conditions, this equates to a minimum of a 5.4% loss of sediment sources in the drift cell. Results of historic Accretion Shoreform mapping indicated that the length of AS in this cell has actually increased since pre-development conditions. Historic mapping resulted in accretionary beaches encompassing 13% of the drift cell, while current conditions mapping mapped 23% of the cell as AS (Table 12). In addition to the lack of detail in historic data sources, a likely explanation for this discrepancy focuses on the Accretion Shoreform mapped at Klahanie in the current conditions mapping (Map 14). This accretionary-like beach appears to have been created with impounded fill or colluvium and several groins, thus the engineered low elevation backshore takes on the appearance of a natural AS. The only certain historic Accretion Shoreforms mapped in this cell is Point Heyer, a longshore lagoon with an extensive tidal channel marsh behind a recurved spit (Table 13). KI-13-3 This relatively short drift cell encompasses less than 0.2 miles (843 ft) of shoreline and exhibits northeastward drift. It originates just southwest of Point Heyer and terminates at the Point Heyer tidal inlet. It is characterized by dense residential development and is completely modified (Map 7, Appendix 2, Table 8). Despite the prolific shoreline modification, a 47 ft long landslide was observed supplying sediment to the nearshore over a bulkhead (Maps 8 and 9, Appendix 2). Historic – Prior to the construction of shoreline modifications 100% of this short drift cell was Feeder Bluff. When compared with current conditions mapping, this equates to a 100% loss of sediment sources in the KI-13-3, which may be affecting the tidal inlet at Point Heyer (Tables 10 and 11). Results of historic Accretion Shoreform mapping indicated that there were no current or historic AS(es) in this drift cell. KI-13-4 This drift cell originates at a zone of divergence at the southwestern end of KI-13-3. Southwestward transport predominates to the cell terminus at a bayhead beach on the northwest shore of Tramp Harbor. KI-13-4 measures 0.3 miles (1,485 ft) and consists of mostly modified Accretion Shoreforms and modified shoreline. Shoreline modifications represent 38.0% of the shores of this drift-cell (Map 7, Appendix 2; Table 8).

Final WRIA 8 &9 Beach Feeding Sources and Accretion Areas: Current and Historical Conditions Report COASTAL GEOLOGIC SERVICES, INC.
61
Accretion Shoreforms comprise 62% of KI-13-4. All but 23.2% of the Accretion Shoreforms in this cell have been modified from their original form (Table 9). Modified backshore occurred along 5.2% of the Accretion Shoreforms and 71.5% have modifications that cover the backshore and stretch into the intertidal. Historic – Results of historic analysis indicated that 31.8% of drift cell KI-13-4 was a source of nearshore sediment or Feeder Bluff prior to shoreline modifications (Maps 9 and 10, Appendix 2). When compared with current conditions this equates to a 100% loss of sediment sources in the drift cell, likely impacting down-drift Accretion Shoreforms. Historic Accretion Shoreform mapping indicated that prior to development AS(es) represented 68% of the KI-13-4 shore. A stream mouth-type Accretion Shoreform comprised the entire AS (Map 14, Appendix 2; Tables 12 and 13) (one first order steam and one third order stream), which converged on the shoreline with a tidal delta marsh and a wide depositional beach. When these results are compared with current conditions mapping, this represents at least a 9% loss of AS in KI-13-4. In general, Vashon and Maury Islands were historically abundant in these types of complex stream mouth Accretion Shoreforms in drowned valleys and simple drowned channel stream mouths (based on T-sheet #1452a). When comparing Historic T-sheets (1452a and b) with current USGS Topographic maps, it appears that fewer streams are present at the shoreline today. This could be attributed to scale issues on the USGS 24,000 scale quadrangles. However, investigation of this phenomenon should be conducted as part of a restoration feasibility study of any historic Accretion Shoreform on Vashon or Maury Islands. Such an investigation should explore changes to each of the Islands’ watersheds, basin by basin. KI-13-5 KI-13-5 originates at a zone of divergence just north of Portage and exhibits northwestward transport into the bayhead beach in Tramp Harbor. The cell shore is heavily modified by Dockton Road SW, which connects Maury and Vashon Islands and runs along and on top of the beach. Like KI-13-4 this drift cell is exclusively composed of modified shoreline and Accretion Shoreforms. Modifications make up 96.4% of the drift cell (Map 7, Appendix 2; Table 8). Modified Accretion Shoreforms represent 3.6% of the KI-13-5 shoreline (Table 9). This beach is the southwestern portion of the bayhead beach in Tramp harbor. It is substantially altered with shoreline hardening extending into the intertidal. Historic – One-hundred-percent of the historic sediment sources have been lost in drift cell KI-13-5 (Tables 10 and 11). Modified shores in the drift cell were exclusively Feeder Bluffs prior to development. Historic Accretion Shoreform mapping indicated that prior to development 10% of this cell was accretionary in nature, and included an extension of the stream mouth feature described in KI-13-5 (Map 14, Appendix 2; Tables 12 and 13). When comparing historic and current conditions mapping, results show that a 65% decrease in Accretion Shoreform length has taken place in KI-13-5. KI-13-6 Originating at the bluff north of Portage, this drift cell exhibits eastward transport along the entire north shore of Maury Island and terminates at Point Robinson. Measuring 3.7 miles, this drift cell is characterized by small residential developments between actively eroding bluffs. Twenty-three percent of the KI-13-6 shoreline is modified (Map 7, Appendix 2; Table 8), concealing the natural geomorphic character of the shoreline and impeding sediment input where sediment sources are precluded by beach modifications. Sediment sources were most frequently observed in the central portion of the cell, where bluffs are exposed to considerable fetch from the north. Feeder Bluffs made up 36.4% of the drift cell. Feeder Bluff Exceptional was mapped in two different regions, representing 5.8% of
Final WRIA 8 &9 Beach Feeding Sources and Accretion Areas: Current and Historical Conditions Report COASTAL GEOLOGIC SERVICES, INC.
62
the drift cell. Nineteen landslides were mapped throughout the cell covering 22.7% of the shoreline. Toe erosion was frequently observed, covering 24.4% of the cell. It was most frequently observed in the central to eastern portion of the cell (Maps 8 and 9, Appendix 2). Five small transport zones were mapped, encompassing 6.2% of the shoreline in KI-13-6. Accretion Shoreforms represent 28.6% of the drift cell and were most frequently observed in the east half of the cell (Table 9). Luna Beach, representing the longest Accretion Shoreform in the cell, is located along the shore of a large historic landslide. The north shore of the cuspate foreland of Point Robinson is located at the cell terminus. Historic – Results of historic analysis indicated that prior to modifications 60% of KI-13-6 were sediment sources (Tables 10 and 11). Pre-development shores were composed of 6% Feeder Bluff Exceptional and 54% Feeder Bluff (Figure 29), with an additional 2% of the drift cell that was Potential Feeder Bluff. When compared with current conditions this equates to at least a 29% loss of sediment sources in this drift cell. Historic Accretion Shoreform mapping reveals a net increase in the length of AS in this drift cell since pre-development conditions (Map 14, Appendix 2; Tables 12 and 13). The most likely reason for this is the lack of detailed historic resources. Additionally, there are a number of historic landslides in this cell that have deposited an abundance of colluvium into the nearshore, thus leading to the modern development of low elevation backshore areas.
Figure 29. Tramp Harbor 1893, Portage in background. University of Washington Special Collections Libraries, Negative no. UW18698. The Vashon Island sub-area jumps to southwestern Vashon Island and continues up the western shore of Vashon Island. Southeast Maury Island and Quartermaster Harbor are separate sub-areas and are discussed individually below. KI-13-21 Influenced by southeasterly fetch, this cell has westward net shore-drift originating at Neill Point and terminating at the embankment at Tahlequah Creek. It measures 0.9 miles (4,742 ft), of which 72.5% is modified (Map 7, Appendix 2; Table 8). The cell is characterized as a high bank shore with houses and bulkheads along most of the cell. Sediment sources were predominantly mapped within close vicinity of the drift cell origin near Neill Point. An Exceptional Feeder Bluff located at the divergence of KI-13-20 and KI-13-21 accounts for 14.2% of the KI-13-21 shoreline. Feeder Bluffs were mapped along the eastern portion of the cell where the shore was not bulkheaded, representing 9% of the drift cell. Several landslides were also noted along the eastern portion of the cell, cumulatively covering 10.8% of the cell. A single patch of toe erosion was also noted representing only 1.6% of KI-13-21 (Maps 8

Final WRIA 8 &9 Beach Feeding Sources and Accretion Areas: Current and Historical Conditions Report COASTAL GEOLOGIC SERVICES, INC.
63
and 9, Appendix 2). One small transport zone was mapped in this cell that consisted of 1.4% of the total shoreline. A single Accretion Shoreform was observed at the cell terminus making up only 2.8% of the drift cell (Table 9). This beach was substantially modified with bulkheading covering beach down to mean high water. Historic – Prior to development the shores of KI-13-21 were 18% Feeder Bluff Exceptional and 50% Feeder Bluff (Tables 10 and 11). Another 13.4% of the shoreline scored as Potential Feeder Bluffs using the HSSI. When compared with current conditions this equates to a loss of 66.6% of available sediment sources in the drift cell. Results of historic Accretion Shoreform mapping indicated that there has been no loss of AS in this drift cell. The historic condition of this AS was a stream mouth (Table 13). KI-13-22 Originating approximately one half mile northwest of Point Dalco, this drift cell measures 0.9 miles (4,867 ft). Southwesterly waves approaching from the vicinity of the Tacoma Narrows produce eastward net shore-drift to the cell terminus at the bayhead beach at Tahlequah (Schwartz et al. 1991). This cell is characterized by steep, rapidly eroding bluffs and relatively scattered residential dwellings. Modifications were mapped along 42.7% of the KI-13-22 shoreline (Map 7, Appendix 2, Table 8). Sediment sources were predominantly observed in the northern portion of the drift cell, where Feeder Bluff Exceptional was mapped along 40% of cell. Feeder Bluffs were also mapped in the cell, however with considerably less frequency, consisting of 9.9% of the drift cell. Both toe erosion and active landslides were clustered in the northern portion of the cell, where higher gradient slopes are found (Maps 8 and 9, Appendix 2). Landslide mapping encompassed 22.5% of the drift cell, while toe erosion was mapped along 43.8% of the cell. A single transport zone was documented west of the drift cell terminus. This unit represented 3.1 % of the cell. The only Accretion Shoreform mapped in this cell was at the bayhead beach in Tahlequah. This beach has suffered substantial modification and is now modified down into the intertidal (Table 9). Historic – Results of historic analysis indicated that 62.9% of the KI-22 shore was a sediment source prior to development (Tables 10 and 11). Fifty-two percent of the shore was comprised of Feeder Bluff Exceptional units, while 11% were Feeder Bluffs. Another 25% of the drift cell was Potential Feeder Bluff. When compared with current conditions, this results in a loss of 20.6% of the sediment sources available in the drift cell prior to shoreline development. Historic Accretion Shoreform mapping in this cell revealed that 20% of the drift cell was AS prior to nearshore development (Table 12). A complex of several stream channel mouths (including Tahlequah Creek) historically encompassed the bayhead beach in Tahlequah, and just west of this feature was a depositional open beach (Table 13, Map 14, Appendix 2). When compared with current conditions, a 79% loss of the historic Accretion Shoreforms has taken place in KI-13-22. KI-13-23 Originating one-half-mile north of Point Dalco, this drift cell exhibits northward drift due to prevailing and predominant south to southwest wind-generated waves (Schwartz et al. 1991). The cell extends 4.5 miles north to its terminus at the prograded beach south of Sandford Point. Modifications accounted for only 28.4% of this drift cell (Map 7, Appendix 2; Table 8). Sediment sources occurred throughout the drift cell, but were more concentrated south of Camp Sealth. Feeder Bluff Exceptional units comprised 13% of the total drift cell shoreline, while Feeder Bluffs made up 28.8%. Feeder Bluff Exceptional units were exclusively located in close vicinity to the drift cell origin and divergence with KI-13-22. Feeder Bluffs were dispersed throughout the

Final WRIA 8 &9 Beach Feeding Sources and Accretion Areas: Current and Historical Conditions Report COASTAL GEOLOGIC SERVICES, INC.
64
cell, aside from within Paradise Cove. Toe erosion frequently occurred in the southern portion of the cell, and was mapped along 22.9% of the drift cell. Landslides were documented throughout the cell, excluding Paradise Cove. Slightly fewer landslides were noted in the northern half of the drift cell. Cumulatively, landslides were documented along 19.7% of the KI-13-23 shoreline (Maps 9 and 10, Appendix 2). Two broad transport zones were mapped in the drift cell, accounting for 13.1 % of the drift cell. Several Accretion Shoreforms were observed, consisting of 16.7% of the shores of this drift cell. Accretion Shoreforms were observed with greater frequency in the central and northern portions of the cell. Five Accretion Shoreforms, accounting for 21.2% of the Accretion Shoreforms were associated with stream mouths in the drift cell (Table 9). Fourteen percent (14.2%) of the Accretion Shoreforms in this drift cell had modified backshores, and 44.5% of them had modifications that extended down to mean high water. Historic – Prior to development of the KI-13-23 shoreline 43.7% of the cell was comprised of sediment sources (Tables 10 and 11), with 14% Feeder Bluff Exceptional and 30% Feeder Bluff prior to nearshore modifications. Another 18.5% of the drift cell scored as Potential Feeder Bluff, indicating that these shores may have contributed small quantities of sediment to the drift cell. This signifies at least a slight (4.3%) loss of sediment sources since pre-development conditions. Historic Accretion Shoreform mapping indicated that 24% of KI-13-23 was AS prior to nearshore development. Fifteen historic AS(es) were identified during historic mapping, which are displayed in Map 14 (Appendix 2). Eight percent of the drift cell was encompassed by 5 depositional open beaches, and 2% of the cell comprised a single longshore lagoon (Table 13). Nine stream mouths were identified, which cumulatively represented 13% of the drift cell. When these results are compared with current conditions, these results indicate that at least 30% loss of Accretion Shoreform length has taken place in KI-13-23 (Table 12). KI-13-24 This relatively short drift cell measures only 0.4 miles (1,955 ft). It originates approximately 1,200 ft north of Sandford Point and exhibits southward drift to a broad sand beach that marks its terminus. High gradient receding bluffs with very little development characterize this drift cell. Modifications were mapped along only 4.9% of this drift cell (Map 7, Appendix 2; Table 8). Sediment sources were the predominant geomorphic unit in this cell. Feeder Bluff Exceptional units made up 73% of the cell, and another 20.1 % consisted of Feeder Bluffs. No toe erosion was noted in the cell, however one large landslide was mapped in the northern portion of the cell, accounting for 46.7% of the shoreline (Maps 8 and 9, Appendix 2). No transport zones were observed in this drift cell. Accretion Shoreforms were also infrequent, comprising only 2.1 % of the cell (Table 9). The Accretion Shoreform encompassed the mouth of a small stream in the southern portion of the drift cell. Historic –Results of historic conditions analysis indicated that all considerable sediment sources in KI-13-24 are currently intact, resulting in no loss of major sediment sources. Five percent of the cell that is currently modified scored as Potential Feeder Bluff, indicating that these shores may have contributed small quantities of sediment to the nearshore historically. Historic Accretion Shoreform mapping found no discrepancies between historic and current conditions in this drift cell. KI-13-25 This cell encompasses the relatively intact Christensen Creek estuary and much of Christensen Cove. It exhibits northward drift and terminates at the prograded beach on the south side of Lisabeula. It measures 0.3 miles, 9.9% of which is modified (Map 7, Appendix 2; Table 8). Feeder Bluffs were mapped along 22.7% of the KI-13-25 shoreline, primarily in the southern end of
Final WRIA 8 &9 Beach Feeding Sources and Accretion Areas: Current and Historical Conditions Report COASTAL GEOLOGIC SERVICES, INC.
65
the cell. Another small Feeder Bluff was documented on the northern shore of the cell, approximately 300 ft northwest of the mouth of Christensen Creek. Active landsliding was noted in association with both Feeder Bluffs, encompassing 18.4% of the drift cell (Maps 8 and 9, Appendix 2). Transport zones were mapped along both the northern and southern shores of the cove, and represented 32% of the shoreline. Two Accretion Shoreforms were mapped, both in association with stream mouths (Table 9). Cumulatively these beaches comprise 35.3% of the drift cell. Historic – Thirty-three percent of the KI-13-25 shore was Feeder Bluff prior to development and modification of the nearshore (Tables 10 and 11). When compared with current conditions this equates to a loss of at least 30.5% of the available sediment sources in this drift cell. Results of historic Accretion Shoreform mapping indicated that prior to development 48% of KI-13-25 was accretionary in nature (Map 14, Appendix 2, Table 12). The stream mouth AS associated with the Christensen Creek estuary accounted for 31% of the cell, while the southern portion of a delta lagoon predominantly found in KI-13-26 encompassed 16% of the cell (Table 13). When comparing current and historic conditions, these results indicate that a 26% loss of AS has occurred in KI-13-25. KI-13-26 Originating at a short zone of drift divergence approximately 600 ft south of the mouth of Green Valley Creek, this drift cell measures 0.7 miles (3,626 ft). Exposure to the northwesterly fetch results in southward net shore-drift in KI-13-26 (Schwartz et al. 1991). No modifications were mapped in this drift cell. Sediment sources were mapped as Feeder Bluff along the high gradient bluffs north of Lisabeula, representing 31.8% of the drift cell (Map 7, Appendix 2; Appendix 2, Table 8). Several recent landslides were noted within the Feeder Bluff as well small areas within the adjacent transport zones (Map 8, Appendix 2). In total, landslides were documented along 12.7% of the KI-13-26 shoreline. Toe erosion was mapped along 29.4% of the cell (Map 8, Appendix 2). Transport zones were documented near the drift cell origin as well as just north of Lisabeula. Transport zones cumulatively accounted for 52.5% of the drift cell. A single Accretion Shoreform was observed in KI-13-26, located at the cell terminus. Consisting of 15.7% of the cell, this Accretion Shoreform was associated with a small stream mouth (Table 9). Historic – Results of historic conditions analysis indicated that all sediment sources in KI-13-26 are currently intact, resulting in a no loss of sediment sources. Historic Accretion Shoreform mapping found a slight 1% (40 ft) discrepancy between historic and current conditions in this drift cell, which is likely due to an accuracy issue with the historic resources. In summary, when comparing current and historic AS(es) in KI-13-26 the difference is negligible. KI-13-27-SW This very small cell encompasses the southern shore of the embayment near the mouth of Green Valley Creek. It measures only 0.1 mile (652 ft), none of which was modified with bulkheading. This cell exhibits northward drift into the Green Valley Creek embayment. Feeder bluffs were mapped along 26.6% of the KI-13-27-SW shoreline (Map 7, Appendix 2; Table 8). Neither toe erosion nor recent landslides were mapped within the short cell. A single transport zone made up 48% of the drift cell, which terminated at an Accretion Shoreform created from sediment derived from Green Valley Creek and the convergence of KI-13-27NE and KI-13-27SW. This Accretion Shoreform comprised 25.4% of the KI-13-27-SW shoreline. Historic – Results of historic conditions analysis indicated that all sediment sources in KI-12-3 are currently intact, resulting in no loss of sediment sources.
Final WRIA 8 &9 Beach Feeding Sources and Accretion Areas: Current and Historical Conditions Report COASTAL GEOLOGIC SERVICES, INC.
66
Historic Accretion Shoreform mapping found no discrepancy between historic and current conditions in this drift cell. KI-13-27-NE On the north shore of the Green Valley Creek embayment, southward net shore-drift resumes. The cell measures only 600 ft in length and is 77.6% Feeder Bluff (Map 7, Appendix 2; Table 8). The Accretion Shoreform resulting from Green Valley Creek and the convergence of KI-13-27-NE and KI-13-27-SW represents 22.4% of the cell length. Two landslides were mapped along the shore, representing 28.9% of the cell (Maps 8 and 9, Appendix 2). Toe erosion was mapped along 77.6% of the cell. Historic – Results of historic conditions analysis indicated that all sediment sources in KI-12-3 remain intact, resulting in no loss of sediment sources. Historic Accretion Shoreform mapping found no discrepancy between historic and current conditions in this drift cell. KI-13-28 KI-13-28 originates north of the Green Valley Creek embayment and extends to its terminus at a symmetric cuspate spit in Section 26 (marked with “Light” on the USGS topographic map). It exhibits northward drift due to exposure to predominant and prevailing wind-wave conditions. KI-13-28 measures 3.4 miles in length, 27.7% of which is modified. Sediment sources were mapped by CGS throughout the drift cell. Feeder Bluffs comprised 44.3% of the cell (Map 7, Appendix 2, Table 8). Fifteen landslides were noted, covering 15.1% of the KI-13-28 shoreline. Toe erosion was mapped along 16.1 % of the cell (Maps 8 and 9, Appendix 2). Landslides were primarily observed in the central and southern portions of the cell, while toe erosion was more frequently observed in the northern half of the drift cell. Several transport zones were mapped, accounting for 16.6% of the drift cell. Accretion Shoreforms represented 11.4% of KI-13-28, six or 41.2% of which were associated with a stream mouth (Table 9). Two of the Accretion Shoreforms were modified. Seventeen percent of Accretion Shoreforms had modifications that extended into the intertidal, and 34.6% of Accretion Shoreforms had modifications that extended down to mean high water. Historic – Prior to development 50.3% of the KI-13-28 shore was comprised of sediment sources, all of which were Feeder Bluffs (Tables 10 and 11). Results of historic analysis suggest that another 11% of the cell was Potential Feeder Bluff. When compared with current conditions this equates to a loss of a minimum of 12% of the available sediment source length since historic or pre-development conditions. Results of historic Accretion Shoreform mapping indicated that prior to nearshore development 19% of KI-13-28 was accretionary in nature. Six percent of the drift cell was comprised of 2 depositional open beaches, while 3% was encompassed by a single longshore lagoon (Map 14, Appendix 2; Table 13). Six additional Accretion Shoreforms cumulatively represented 11% of the KI-13-28 shore. When comparing these results with current conditions, it appears that a 41% loss of Accretion Shoreform has taken place in this drift cell. KI-11-7 KI-11-7 exhibits southward net shore-drift and reaches its terminus at the symmetric cuspate spit where it converges with KI-13-28. It measures approximately 0.5 mile in length, 51.3% of which is modified (Table 8, Map 7, Appendix 2). Feeder bluffs were mapped along 24.2% of the drift cell, predominantly in the southern portion of the cell. A single landslide was mapped near the drift cell origin, consisting of 3.5% of the length of the cell (Maps 8 and 9, Appendix 2). Toe erosion was observed in the northern and central portions of the cell, comprising 23.7% of the shoreline.

Final WRIA 8 &9 Beach Feeding Sources and Accretion Areas: Current and Historical Conditions Report COASTAL GEOLOGIC SERVICES, INC.
67
A single transport zone was noted at the cell origin, making up 10.3% of the shores of this drift cell. Fourteen percent (14.2) of the cell was composed of Accretion Shoreforms. These depositional beaches were exclusively located at the spit located at the terminus (Table 9). Historic – Results of historic conditions analysis indicated that all considerable sources of sediment in KI-11-7 are currently intact. However, 47.3% of the cell scored as Potential Feeder Bluff, indicating that these shores likely contributed some additional volume of sediment to the drift cell prior to modification (Tables 10 and 11). Historic Accretion Shoreform mapping found no discrepancy between historic and current conditions in this drift cell. KI-11-6 Exhibiting northward drift, this cell extends 0.8 miles north from a divergence zone in common with KI-11-7 and terminates at the asymmetric cuspate spit at Peter Point. Accretion Shoreforms at both ends and forested banks of variable elevation characterize this drift cell. Twenty-five (25.5%) percent of the KI-11-6 shoreline is modified (Table 8, Map 7, Appendix 2). Sediment sources were mapped along the high gradient bluffs in the northern and central portions of the cell, as well as in close vicinity to the cell origin. Feeder Bluffs made up 23.3% of the cell. Landslides were associated with Feeder Bluffs, making up 5.8% of the shoreline. Toe erosion was more frequently observed, especially in the northern Feeder Bluff segment (Maps 8 and 9, Appendix 2). Active toe erosion was mapped along 15% of the KI-11-6 shoreline. Two small transport zones were identified in the central portion of the cell, representing 11.6% of the cell. Accretion Shoreforms comprised 39.6% of the shoreline in KI-11-6 (Table 9). These Accretion Shoreforms were distributed throughout the cell, including two near the drift cell origin, another in the center of the cell and the large cuspate spit that contains marsh and drift log deposits at the cell terminus at Peter Point. A stream mouth has influenced the formation of the Accretion Shoreform located approximately 700 ft northeast of the cell origin. Twenty-one percent (21.6%) of the Accretion Shoreforms had modified backshore areas, and nine percent had modifications that extended down to mean high water. Historic – Results of historic conditions analysis indicated that all considerable sources of sediment sources in KI-11-6 are currently intact, resulting in no loss of sediment sources. However results of the HSSI scoring indicated that prior to modification 11% of the drift cell was Potential Feeder Bluff, which likely contributed some sediment to the nearshore in the past (Tables 10 and 11). Historic Accretion Shoreform mapping indicated that prior to development 46% of the KI-11-6 shore was accretionary in nature (Map 14, Appendix 2, Table 12). Two depositional open beaches account for 23% of the KI-11-6 AS(es), while the remaining 23% consists of 2 stream mouths (Table 13). When comparing these results with those of the current conditions mapping, it appears that at least a 14% loss of Accretion Shoreforms has taken place. KI-11-5 This cell originates west of the Fern Cove delta and exhibits southwestward net shore-drift in response to principle northerly fetch. It terminates and converges with KI-11-5 at Peter Point. This cell measures one-half mile, 56.0% of which is modified (Table 8, Map 7, Appendix 2). Moderate to low bank shoreline with intermittent riparian vegetation characterizes this cell. Feeder Bluffs were mapped throughout the drift cell, accounting for 30.7% of the drift cell length. A single landslide was noted, representing 1.2% of the cell. Toe erosion occurred more frequently and was mapped along 29.6% of the drift cell (Maps 8 and 9, Appendix 2). A single transport zone was mapped, consisting of 4.2% of the cell. The cell terminates at Peter Point, the only Accretion Shoreform in the cell, which represents 9% of shoreline.

Final WRIA 8 &9 Beach Feeding Sources and Accretion Areas: Current and Historical Conditions Report COASTAL GEOLOGIC SERVICES, INC.
68
Historic – Prior to development along the shore of KI-11-5, 39% of the drift cell was comprised of Feeder Bluffs (Tables 10 and 11). Another 38% of the shore had HSSI scores suggesting they were Potential Feeder Bluffs. When compared with current conditions this equates to a minimum of 21.7% loss of sediment sources in the drift cell (Figure 30). Historic Accretion Shoreform mapping found a slight 1% (25 ft) discrepancy between historic and current conditions in this drift cell, which is likely due to an accuracy issue with the historic resources. In summary, when comparing current and historic AS(es) in KI-13-26 the difference is negligible.
Figure 30. 1906-1917. Colvos Wharf with bluffs in background. King County Archives. KI-11-4 Eastward drift into Fern Cove dominates this 0.25-mile drift-cell. Modified shoreline makes up 54.9% of the cell (Table 8, Map 7, Appendix 2). The remaining portions are predominantly accretionary with a very small segment of transport zone west of the mouth of Shingle Mill Creek. The transport zone consists of 8.5% of the drift cell. No nearshore sediment sources were mapped in this unit, though Shingle Mill Creek nourishes the beach with fine sediment. Accretion Shoreforms represent 36.6% of KI-11-4, 55% of which are associated with Shingle Mill Creek, which contains a small pocket estuary and salt marsh (Table 9). Of the remaining Accretion Shoreforms, 32.6% were modified down to mean high water. Historic – Results of historic conditions analysis indicated that all sediment sources in KI-11-4 are currently intact, resulting in a no loss of sediment sources. Historic Accretion Shoreform mapping indicated that there has been a net increase of Accretion Shoreforms in this drift cell since pre-development conditions (Map 14, Appendix 2, Tables 12 and 13). The most likely reason for this is the lack of detailed historic resources. Additionally historic air photos of north facing slopes are challenging to map from, as there are often an abundance of shaded beaches, which is often exacerbated by overhanging riparian vegetation. Historic mapping does however include the Fern Cove estuary, which encompasses 27% of the drift cell. KI-11-3 Originating approximately 0.5 mile north of Fern Cove, this drift cell exhibits southward net shore-drift into Fern Cove and terminates at a sand, granule, and pebble spit along the east shore of the inner cove (Schwartz et al. 1991). Low bank shoreline with residential development and intermittent riparian vegetation characterizes this drift cell. Modifications were mapped along 48.3% of the cell (Table 8, Map 7, Appendix 2). No sediment sources were observed in this drift cell. Two transport zones were mapped in the north and central portions of the cell. These units account for 21.7% of the KI-11-3 shoreline. Accretion Shoreforms, representing 30.1 % of the cell, were mapped at the cell terminus where a pocket estuary and rehabilitated salt marsh is present (Table 9). Stream mouths were associated with 72.5% of the Accretion Shoreforms in the cell, the remaining Accretion
Final WRIA 8 &9 Beach Feeding Sources and Accretion Areas: Current and Historical Conditions Report COASTAL GEOLOGIC SERVICES, INC.
69
Shoreform had modified backshore areas. Historic – Results of historic conditions analysis indicated that all sediment sources in KI-11-3 are currently intact, resulting in no loss of sediment sources. Prior to development 32% of the KI-11-3 shore was accretionary in nature (Map 14, Appendix 2; Table 12). Fifteen percent of the historic condition of the drift cell was comprised of depositional open beaches, while the remaining 18% was associated with the Fern Cove estuary (stream mouth) (Table 13). When compared with current conditions mapping these results indicate that at least a 7% loss of Accretion Shoreform has taken place in KI-13-3. KI-11-2 This cell originates at a drift divergence immediately north of Fern Cove where the prevailing and predominant southwesterly waves overcome the wave shadow in Fern Cove (Schwartz et al. 1991). Northward net shore-drift extends to the drift cell terminus at a prograding beach at Point Vashon. This cell measures 1.7 miles in length, 62.9% of which is modified (Table 8, Map 7, Appendix 2). Modifications conceal the natural geomorphic character of the shoreline and preclude historic sediment sources from contributing material to the nearshore. Most of the southern and middle portions of the drift cell have thick deposits of Vashon advance outwash deposits in the bluff, but much of this area is either bulkheaded or fronted by an Accretion Shoreform. Two Feeder Bluffs were mapped in this drift cell, accounting for 5.8% of the shoreline. Both of these sediment sources were located in the northern half of the cell. Two landslides were mapped north of Sylvan Beach within the larger of the two Feeder Bluffs (Maps 8 and 9, Appendix 2). These slides represented 4.4% of the drift cell. Toe erosion was mapped near Sylvan Beach and also south of Sandy Beach, cumulatively covering 4.8% of the drift cell. Four transport zones were mapped, comprising 6.8% of the cell. Accretion Shoreforms were mapped at Sandy Beach and at the cell terminus at Point Vashon. Most of the Accretion Shoreforms in this drift cell have been modified in some way (Table 9). Ten percent of the Accretion Shoreforms had modified backshore areas, and 25.2% had modifications that extended down to mean high water. Forty-one percent of the Accretion Shoreforms in this cell had modifications that extended into the foreshore or intertidal zone, including at Point Vashon. Historic – Results of historic conditions analysis indicated that all sediment sources in KI-11-2 are currently intact, resulting in no loss of sediment sources. Historic Accretion Shoreform mapping indicated that prior to development 27% of this cell was accretionary in nature (Map 14, Appendix 2; Table 12). Historic AS(es) consisted of 9% depositional open beach and 19% longshore lagoon (Table 13). Compared to current conditions, these results indicate that a 10% loss of Accretion Shoreform has occurred in this drift cell, possibly due to anthropogenic nearshore alternations that have reduced nearshore sediment supply. KI-11-1 This very short cell measures only 0.22 miles (1,168 ft) and exhibits westward transport. Schwartz et al. (1991) describes this cell as a zone of high wave energy that prevents the depositional beach at Point Vashon from further northward development onto a wave-cut clay platform along the north shore of Vashon Island. A single Feeder Bluff is found at the eastern end of this cell, representing 12.7% of the drift cell (Table 8, Map 7, Appendix 2). The large majority of the cell is bulkheaded, but much of this area was interpreted as Accretion Shoreform. Accretion Shoreforms were the dominant shore type in KI-11-1, consisting of 87.3% of the short cell (Table 9). These Accretion Shoreforms are densely developed and armored into the intertidal zone. Historic – Results of historic conditions analysis indicated that all sediment sources in KI-11-2 are currently intact, resulting in no loss of sediment sources.

Final WRIA 8 &9 Beach Feeding Sources and Accretion Areas: Current and Historical Conditions Report COASTAL GEOLOGIC SERVICES, INC.
70
Historic Accretion Shoreform mapping indicated that there was no historic AS in this cell (Map 14, Appendix 2). When compared with current conditions mapping it appears that a substantial increase in Accretion Shoreform has taken place since pre-development conditions. The most likely reason for this is the lack of detailed historic resources that enable accurate identification of depositional open beaches. Air photo analysis is particularly challenging on north facing slopes, such as those in KI-11-1.
Southeast Maury Island
The Southeast Maury Island extends from Point Robinson south to the mouth of Quartermaster Harbor, between Rosehilla and Piner Point. Exceptionally high bluffs and moderate exposure to predominant wind and wave conditions, distinguishes this sub-area from others in the study area. Additionally, it has a unique history, which has been of great influence to coastal geomorphic processes. The Southeast Maury Island subarea includes only one drift cell KI-14-2, which is described in detail below. KI-14-2 KI-14-2 extends 5.6 miles along the entire southeastern shore of Maury Island. It originates at a south-facing divergence zone located between Rosehilla and Piner Point and terminates at Point Robinson. This segment is characterized by high bluffs that have been subject to intensive aggregate mining since the 1920s or earlier. Bluffs are composed mostly of thick deposits of advance outwash with abundant coarse sediment (that is most beneficial for the beach) at higher elevations and fine sediment at lower elevations (Booth 1991). Sediment supply in this drift cell appears to have been substantially augmented due to “loose” handling and spillage of mined aggregates, based on review of historic air photos. This has resulted in substantial nourishment of adjacent beaches, which has likely lead to wider, more fine-grained beaches than were likely present prior to mine development. CGS field mapping treated these large, low gradient, wide beaches as Accretion Shoreforms despite their apparent anthropogenic origin (result of gravel mining). For example Sandy Shores, Shore Acres, and Gold Beach were mapped by CGS as Accretion Shoreforms, however for many decades they contained gravel mine waste material. Modified shorelines were mapped along 20.1% of the KI-14-2 shoreline, and were most frequently observed in the southern portion of the drift cell (Table 8, Map 7, Appendix 2). These modifications are at the base of high bluffs of up to 400 ft in elevation. Currently, 54% of the drift cell shoreline is actively contributing sediment to the nearshore. Feeder Bluff Exceptional units were mapped along 15.8% of the shoreline. Feeder Bluffs, those that periodically deliver sediment to the nearshore encompassed 28.4% of the drift cell. Sediment sources were dispersed throughout the length of the drift cell, with slightly greater frequency of Feeder Bluff Exceptional units mapped in the southern portion of the cell. Transport zones made up 7.0% of the drift cell. Accretion Shoreforms were mapped along 27.3% of the cell (Table 9). As previously mentioned, several of these beaches have been anthropogenically nourished with sediment derived from the aggregate mines along adjacent shores. Additional modifications to Accretion Shoreforms were noted during field mapping. Thirty-seven-percent of the Accretion Shoreforms had modified backshore areas, while 25% of the Accretion Shoreforms had modifications (bulkheads and groins) that reached into the intertidal. Historic – Along the drift cell from southwest to northeast, comparisons between the 1877 T-sheet conditions and present conditions follow. In 1877, low elevation land was completely absent at Sandy Shores and at the former mine site located 1 mile southwest of Gold Beach. Much of the Gold Beach gently sloping area was present in 1877. This area may have been formed through deposition of large volumes of landslide debris, however, the shoreline was in a more landward position in 1877 than it is today. The Glacier Northwest gravel mine site was mapped as what
Final WRIA 8 &9 Beach Feeding Sources and Accretion Areas: Current and Historical Conditions Report COASTAL GEOLOGIC SERVICES, INC.
71
appears to have been an Accretion Shoreform in 1877. This feature was slightly over half the length of the current area mapped as Accretion Shoreform, and the shoreline there is now in a more waterward position (generally 50-125 ft). The Accretion Shoreform located approximately 1 mile northeast of the Glacier Northwest site was not present in 1877. KI-14-2 was historically comprised of 50.6% sediment sources (Map 7, Appendix 2; Tables 10 and 11). Results of HSSI scoring indicated that prior to modifications 17% of the cell was Exceptional Feeder Bluff, while 34% were Feeder Bluffs. Another 8% of the shore scored as Potential Feeder Bluffs. When compared with current conditions, this equates to a 12.7% loss of sediment sources in the cell KI-14-2. Historic Accretion Shoreform mapping of SE Maury Island indicated that prior to modifications of the KI-14-2 nearshore 4% of the cell was historically accretionary in nature (Map 14, Appendix 2). This natural historic Accretion Shoreform is the longshore lagoon at Point Robinson. When these results are compared with current conditions mapping, it becomes apparent that a net increase in AS has occurred in this cell. As previously mentioned, Maury Island’s southeast shoreline is unique in that four large artificial beaches have been created by aggregate mining. These beaches are similar in character to natural Accretion Shoreforms; however, sediment was not derived from wave energy and these beaches are not in naturally accreting areas. Therefore, the likelihood of long-term maintenance of these features without armoring is small because natural landscape processes do not support their existence.
Quartermaster Harbor
The Quartermaster Harbor sub-area extends from Piner Point on southeast Maury Island north into the Harbor, and then south to Neill Point located at the western entrance to the harbor on southeastern Vashon Island. Shores within Quartermaster Harbor are generally high bank along the more exposed southern reaches of the Harbor, and gradually reduce in grade to lower bank shores in the northern harbor, where exposure is least. Several streams flow into Quartermaster Harbor, creating valuable estuarine habitat for native flora and fauna. Shoreline development varies in density, but is greatest in the northern portion of the harbor. The Quartermaster Harbor sub-area consists of 13 drift cells (KI-13-8, KI-13-9, KI-13-10, KI-13-11, KI-13-12, KI-13-13, KI-13-14, KI-13-15, KI-13-16NE, KI-13-16SW, KI-13-17, KI-13-18, KI-13-19 and KI-13-20) and one region of negligible drift (KI-13-10/13-11-NAD) or the interior shore of Raab’s Lagoon. As explained in the Methods section (under the Uncertainty sub-heading), historic mapping of Feeder Bluffs in the protected shores of inner Quartermaster Harbor, resulted is some cells without mapped HFB. This is a direct result of the approach for the Historic Sediment Source Index (HSSI) and the data used to score modified units. The use of the highest scoring modified segments in each drift cell (Table 18) provides an alternative way to determine key historic sediment source areas for these short, low energy drift cells. KI-13-8 This cell exhibits northward net shore-drift from east of Rosehilla into Quartermaster Harbor. Predominant and prevailing southerly waves enter Quartermaster Harbor, causing northward net shore-drift up to Dockton. Waves refract around the Dockton headland, evident by an eastern recurved spit at the point. Because of the wave shadow effect caused by the headland near Dockton, substantial sediment is deposited in the intertidal and low tide terrace at the point and does not get transported further into the bay due to the relative low energy in the bay. The drift cell terminates at the bayhead beach near the Dockton Park boat ramp. This drift cell measures 3.4 miles, 46% of which had been modified (Table 8, Map 7, Appendix 2). High elevation bluffs with little residential development that slowly grades to lower bank shores with more dense development characterize this shore segment. Feeder Bluff was mapped along 27.8 % of the KI-13-8 shoreline. Sediment sources were predominantly observed in the southern half of the drift cell, which is to be expected given the greater exposure of these beaches to the south. Active landslides were noted along 6.7% of the

Final WRIA 8 &9 Beach Feeding Sources and Accretion Areas: Current and Historical Conditions Report COASTAL GEOLOGIC SERVICES, INC.
72
drift cell, exclusively located near the drift cell origin and divergent zone, east of Rosehilla (Maps 8 and 9). Toe erosion was mapped along 5.7% of the cell, and was most frequently observed along the western shore of Maury Island, north of Manzanita. Accretion Shoreforms encompassed 21.6% of the KI-13-8 shoreline (Table 8). Consisting of four beaches, these shoreforms were found north of Manzanita, at Dockton Head and at the drift cell terminus at the Dockton Park. Modifications were abundant along Accretion Shoreforms in KI-13-8. Accretion Shoreforms with modified backshores represented 10.3% (of Accretion Shoreform shorelines), however modifications that reached into the intertidal encompassed 56.5% of Accretion Shoreforms. Historic – Results of historic conditions analysis indicated that prior to development, 56.4% of this drift cell was comprised of sediment sources (Tables 10 and 11). Nineteen percent of the cell was Exceptional Feeder Bluff while 37% was Feeder Bluff. Another 5% were Potential Feeder Bluffs. When compared with current conditions, this results in at least a 50.6% loss of sediment sources (Figure 31). Historic Accretion Shoreform mapping indicated that 24% of the KI-13-8 shore was Accretion Shoreform prior to anthropogenic alteration of the nearshore. In total, 8 AS(es) were identified including: 2 delta lagoons (7%), 4 depositional open beaches (14%) and 2 stream mouths (4%). Two of the AS(es) were similar to the multiple stream/tidal delta complex described in cell 13-4, the largest being at Docton Park where two streams converged at a drowned valley with associated tidal channel marshes. When compared with current conditions, these results reveal a 12% loss of AS in the drift cell.
Figure 31. Dockton, no date. UW Special Collections Libraries, Negative no. VAN198. KI-13-9 Drift cell 13-9 is in a wave shadow from the local prevailing and predominant southerly waves, resulting in southward net shore-drift. The cell measures 0.5 mile and terminates at the bayhead beach in Dockton Park. Low energy, a muddy foreshore, and (deciduous) forested upland characterize this drift cell. Modifications were found along 26.1% of the drift cell (Table 8, Map 7, Appendix 2). Sediment sources were mapped along 51.9% of the KI-13-9 shoreline, with minor recent toe erosion taking place along 53.4% of the cell (Maps 8 and 9, Appendix 2). Feeder Bluffs were typically located in the northern portion of the cell. No transport zones were observed in this drift cell. Accretion Shoreforms made up 22.0% of the shoreline in KI-13-9 (Table 8). Accretion Shoreforms were exclusively mapped near the drift cell terminus in close vicinity to the Dockton Park boat ramp. This depositional beach had modifications that reached into the intertidal.
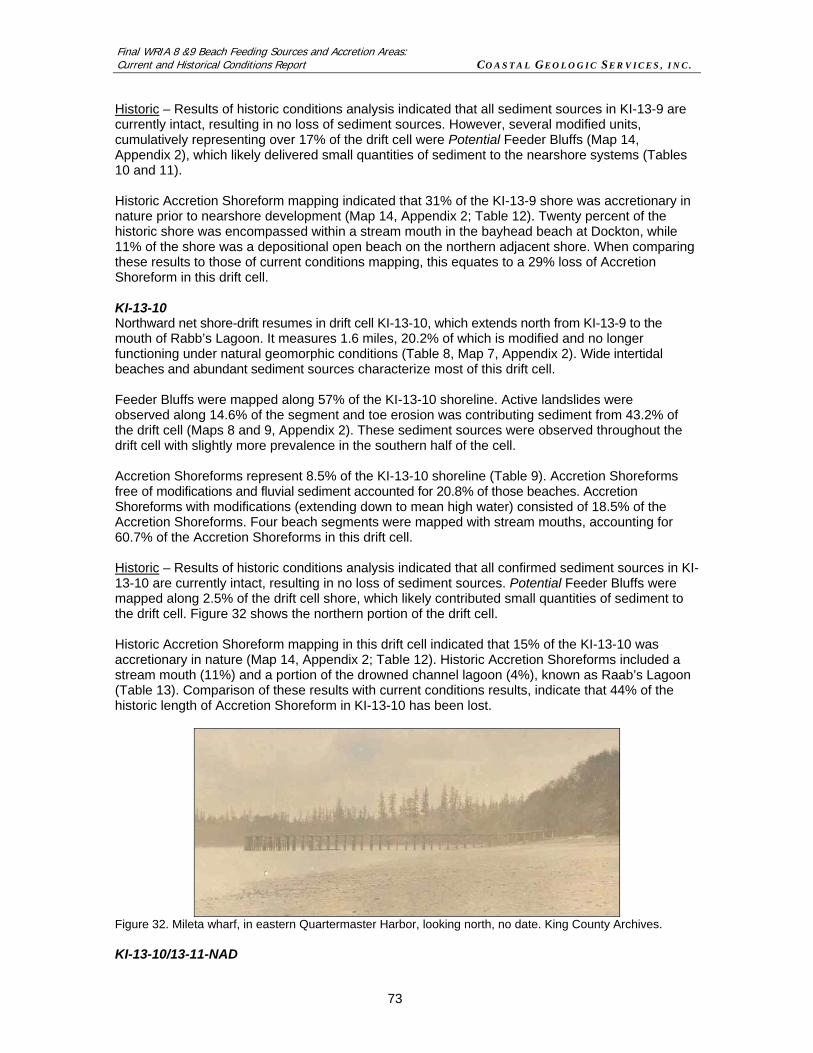
Final WRIA 8 &9 Beach Feeding Sources and Accretion Areas: Current and Historical Conditions Report COASTAL GEOLOGIC SERVICES, INC.
73
Historic – Results of historic conditions analysis indicated that all sediment sources in KI-13-9 are currently intact, resulting in no loss of sediment sources. However, several modified units, cumulatively representing over 17% of the drift cell were Potential Feeder Bluffs (Map 14, Appendix 2), which likely delivered small quantities of sediment to the nearshore systems (Tables 10 and 11). Historic Accretion Shoreform mapping indicated that 31% of the KI-13-9 shore was accretionary in nature prior to nearshore development (Map 14, Appendix 2; Table 12). Twenty percent of the historic shore was encompassed within a stream mouth in the bayhead beach at Dockton, while 11% of the shore was a depositional open beach on the northern adjacent shore. When comparing these results to those of current conditions mapping, this equates to a 29% loss of Accretion Shoreform in this drift cell. KI-13-10 Northward net shore-drift resumes in drift cell KI-13-10, which extends north from KI-13-9 to the mouth of Rabb’s Lagoon. It measures 1.6 miles, 20.2% of which is modified and no longer functioning under natural geomorphic conditions (Table 8, Map 7, Appendix 2). Wide intertidal beaches and abundant sediment sources characterize most of this drift cell. Feeder Bluffs were mapped along 57% of the KI-13-10 shoreline. Active landslides were observed along 14.6% of the segment and toe erosion was contributing sediment from 43.2% of the drift cell (Maps 8 and 9, Appendix 2). These sediment sources were observed throughout the drift cell with slightly more prevalence in the southern half of the cell. Accretion Shoreforms represent 8.5% of the KI-13-10 shoreline (Table 9). Accretion Shoreforms free of modifications and fluvial sediment accounted for 20.8% of those beaches. Accretion Shoreforms with modifications (extending down to mean high water) consisted of 18.5% of the Accretion Shoreforms. Four beach segments were mapped with stream mouths, accounting for 60.7% of the Accretion Shoreforms in this drift cell. Historic – Results of historic conditions analysis indicated that all confirmed sediment sources in KI-13-10 are currently intact, resulting in no loss of sediment sources. Potential Feeder Bluffs were mapped along 2.5% of the drift cell shore, which likely contributed small quantities of sediment to the drift cell. Figure 32 shows the northern portion of the drift cell. Historic Accretion Shoreform mapping in this drift cell indicated that 15% of the KI-13-10 was accretionary in nature (Map 14, Appendix 2; Table 12). Historic Accretion Shoreforms included a stream mouth (11%) and a portion of the drowned channel lagoon (4%), known as Raab’s Lagoon (Table 13). Comparison of these results with current conditions results, indicate that 44% of the historic length of Accretion Shoreform in KI-13-10 has been lost.
Figure 32. Mileta wharf, in eastern Quartermaster Harbor, looking north, no date. King County Archives. KI-13-10/13-11-NAD

Final WRIA 8 &9 Beach Feeding Sources and Accretion Areas: Current and Historical Conditions Report COASTAL GEOLOGIC SERVICES, INC.
74
This reach represents the shore within protected Raab’s Lagoon. Negligible drift takes place within the lagoon, which has a flood-tide delta and rockery that restricts tidal flow. The historic T-sheet (Figure 33) shows the original relatively wide lagoon opening prior to development. Historic Accretion Shoreform mapping identified this area as exclusively accretionary in nature and a drowned channel lagoon with a barrier spit on the southwestern shore (which falls within cell KI-13-11).
Figure 33. Pre-development condition of the Raabs lagoon entrance (T-sheet 1452b, 1876-77). KI-13-11 Drift cell KI-13-11 exhibits eastward net shore-drift and terminates at the entrance to Rabb’s Lagoon. This short drift cell measures only 0.1 mile (587 ft), 31.4% of which is modified and no longer able to contribute sediment to the nearshore (Table 8, Map 7, Appendix 2). Sediment sources were mapped by CGS along 68.6% of the KI-13-11 shore. Active toe erosion was observed throughout 53.4% of the cell (Maps 8 and 9, Appendix 2). Sediment sources were predominantly located in the western portion of the cell near the drift cell origin. No Accretion Shoreforms or transport zones were observed in this drift cell. Historic – Results of historic conditions analysis indicated that all sediment sources in KI-13-11 are currently intact, resulting in no loss of sediment sources. Historic mapping and aerial photography (T-sheet 1452b, US Coast and Geodetic Survey, 1936 and 1977 air photos) indicated that the Rabb’s Lagoon opening has undergone several modifications. Its pre-development form entailed a slightly recurved barrier spit that extended from the western shore over halfway across the lagoon opening (Figure 33). It has been modified several times and is currently consists of a narrow channel in the center of the Lagoon, with a small flood-tidal delta. Historic Accretion Shoreform mapping indicated that 44% of this drift cell was once accretionary in nature, all of which was encompassed within the drowned channel lagoon, or Raab’s Lagoon (Map 14, Appendix 2; Tables 12 and 13). Because this feature has been considerably modified (several times over) and does not currently function as an Accretion Shoreform, a 100% loss of AS(es) has occurred in this drift cell. KI-13-12 Cell KI-13-12 extends 1.0 mile from the divergence zone west of KI-13-11, north to the bayhead beach near Portage. This drift cell is characterized by northward drift across low bank, moderately dense residential development. Modified shores make up 73.6% of the drift cell (Table 8, Map 7, Appendix 2). Feeder Bluffs represent 15.8% of KI-13-12. Feeder Bluffs were observed near the cell origin and terminus. A single recent landslide was observed in the northern portion of the cell, representing 1.6% of the drift cell. Toe erosion was clustered in the southern portion of the cell within close vicinity of the divergence zone (Maps 8 and 9, Appendix 2). Cumulatively, toe erosion was mapped along 5.7% of the drift cell.

Final WRIA 8 &9 Beach Feeding Sources and Accretion Areas: Current and Historical Conditions Report COASTAL GEOLOGIC SERVICES, INC.
75
Two very small segments of transport zone were mapped, representing 1.8% of the cell. A single Accretion Shoreform was mapped at the drift cell terminus near Portage. This beach is composed of sand with moderate pebble and is modified down to mean high water. It represents 8.8% of the KI-13-12 shoreline (Table 9). Historic – Prior to development, 30% of the in KI-13-12 shore was comprised of Feeder Bluffs (Tables 10 and 11). Another 3% of the shore scored high enough on the HSSI to be Potential Feeder Bluffs, which likely contributed some sediment to the nearshore. When compared with current conditions mapping, this equates to a 47.6% loss of sediment sources in this drift cell. Results of historic Accretion Shoreform mapping indicated that 8% of the KI-13-12 shore was accretionary prior to development, all of which was encompassed within a longshore lagoon at Portage (Map 14, Appendix 2; Tables 12 and 13). A slight, 1% (59 ft) discrepancy between historic and current conditions exists in this drift cell, which is likely due to an accuracy issue with the historic resources. In summary, when comparing current and historic AS(es) in KI-13-12 the difference is negligible. KI-13-13 Northeastward net shore-drift transports sediment from the headland at Quartermaster into the bayhead beach near Portage. During very recent geologic time this depositional pattern has built the low isthmus that connects Vashon and Maury Islands (Schwartz et al. 1991). This drift cell measures 0.6 miles, 52.5% of which is modified and no longer contributes sediment to the nearshore (Table 8, Map 7, Appendix 2). Sediment sources are completely absent from this drift cell, which is now exclusively composed of modifications, Accretion Shoreforms and transport zones. Transport zones, areas of neither appreciable sediment gain nor loss, represent 7.1% of the shoreline. Accretion Shoreforms comprise the remaining 40.4% of the KI-13-13 shoreline (Table 9). Ten percent (10.6%) of the Accretion Shoreforms encompass a stream mouth. Forty-one percent of the Accretion Shoreforms have modified backshores, and 48.3 percent have modifications that extend down to mean high water. Historic – Results of historic conditions analysis indicated that no considerable sediment sources in KI-13-13 were present in the drift cell. However 38% of the drift cell was a Potential Feeder Bluff, which likely delivered some quantity of sediment to the nearshore (Tables 10 and 11). Historic Accretion Shoreform mapping indicated that 43% of the KI-13-13 shore was accretionary in nature prior to modification (Map 14, Appendix 2, Tables 12 and 13). The historic AS(es) identified within this cell include a depositional open beach (11%), a stream mouth (12%) and the northwestern portion of the longshore lagoon at Portage (19%), described in KI-13-12. Comparison of these results with those from current conditions mapping equates to a 5% loss of AS in this drift cell. KI-13-14 KI-13-14 exhibits northwestward net shore-drift from the headland at Quartermaster to the drift cell terminus at Tsugwalla’s Creek stream mouth. This cell measures 0.2 miles (1,023 ft) and is completely modified, precluding natural geomorphic processes and beach characteristics (Table 8, Map 7, Appendix 2). Historic – Results of historic conditions analysis indicated that no considerable sediment sources were present in KI-13-14. However 67% of the drift cell was a Potential Feeder Bluff, which likely delivered some sediment to the nearshore infrequently (Tables 10 and 11). Historic Accretion Shoreform mapping in KI-13-14 indicated that 15% of the cell was accretionary in nature, all of which was associated with the Tsugwalla’s Creek stream mouth at the drift cell terminus (Tables 12 and 13). Comparison of these results with those from current conditions mapping equates to a 100% loss of the historic AS in this short drift cell.

Final WRIA 8 &9 Beach Feeding Sources and Accretion Areas: Current and Historical Conditions Report COASTAL GEOLOGIC SERVICES, INC.
76
KI-13-15 Northeastward net shore-drift resumes in cell KI-13-15, which terminates in convergence with KI-13-14 at Tsugwalla’s Creek’s mouth. KI-13-15 measures 0.5 miles and is heavily modified by continuous residential bulkheading (Table 8, Map 7, Appendix 2). In total 96.8% of the KI-13-14 shoreline is modified, concealing its natural geomorphic character. The remaining 3.2% of shoreline was mapped as transport zone as it exhibited negligible net gain or loss of sediment. Historic – Results of historic conditions analysis indicated that pre-development condition banks did not score as Feeder Bluff, indicating that no significant sediment sources were lost as a result of bulkheading in KI-13-15. However, the limited sediment input from the low bank is now lost. Historic Accretion Shoreform mapping found no discrepancy between historic and current conditions in this drift cell. KI-13-16-NE This short cell exhibits northward transport into the Judd Creek estuary. The cell terminates 614 ft upstream, at the limit of marine influence on nearshore sedimentation. Thirteen percent (13.3%) of the cell is modified by residential bulkheading (Table 8, Map 7, Appendix 2). The adjacent unmodified shoreline is exclusively accretionary in nature (86.7%) (Table 9). Historic – Results of historic conditions analysis indicated that, similar to KI-13-15, no quantifiable sediment sources were present in pre-development conditions. Historic Accretion Shoreform mapping indicated that 86% of KI-16-NE was historically accretionary in nature, as part of the Judd Creek estuary or stream mouth (Map 14, Appendix 2; Tables 12 and 13). When compared with current conditions mapping, there appeared to be a slight 1% (5 ft) discrepancy between historic and current conditions in this drift cell, likely due to accuracy issues with historic data sets. KI-13-16-SW Cell KI-13-16-SW is located along the southwest shore of the Judd Creek estuary. It measures 0.2 miles (901 ft) and exhibits northwestward drift into the estuary. Fifty-three (53.1%) of the shoreline is modified by residential bulkheads (Table 8, Map 7, Appendix 2). Bulkheaded shorelines were mapped along the shores south of the Judd Creek mouth. The shoreline within the creek was mapped as accretionary and represented 46.9% of the cell. A small area of toe erosion was noted near the upstream limit of CGS mapping, encompassing 6.4% of the length of this drift cell (Map 9, Appendix 2). It is likely that the bank erosion taking place was caused by bank undercutting that likely took place during high water events (high tides that coincide with high flows in the creek). Historic – Prior to development sediment sources comprised 53.1% of the KI-13-16-SW shore (Figures 34 and 35). Data comparison indicated that the historic sediment sources in the southern half of the cell (outside the narrow estuary) in KI-13-11 are now bulkheaded, resulting in a 100% loss of sediment sources (Tables 10 and 11). Historic Accretion Shoreform mapping found no discrepancy between historic and current conditions in this drift cell.

Final WRIA 8 &9 Beach Feeding Sources and Accretion Areas: Current and Historical Conditions Report COASTAL GEOLOGIC SERVICES, INC.
77
Figure 34. Judd Creek estuary looking upstream, 1892. UW Special Collections Libraries, Order no. VAN411
Figure 35. Judd Creek estuary looking downstream. UW Special Collections Libraries, Negative no. UW19099.
KI-13-17 Southward net shore-drift in this cell results from northeasterly fetch. Cell KI-13-17 extends south from the Judd Creek estuary 0.75 miles, and terminates at micro-spit complex southeast of the Burton Marina. A moderate amount of residential development along the bank, muddy, low energy beaches and several docks and marinas characterize this cell. Modified shorelines are found along 85.7% of the cell (Table 8, Map 7, Appendix 2). No active sediment sources were mapped in the cell. Two transport zones were mapped, accounting for 6.9% of the cell. Four Accretion Shoreforms comprised another 7.4% of the KI-13-17 shoreline (Table 9). Two of the Accretion Shoreforms were dominated by stream-derived sediment. Historic – Results of historic conditions analysis indicated that 28.2% of KI-13-17 was Feeder Bluff prior to residential bulkheading and marina development in the nearshore (Tables 10 and 11). Another 23% of the KI-13-17 shoreline scored high enough on the HSSI index to be Potential Feeder Bluffs. When compared with current conditions mapping, which has no current sediment sources, there has been a complete (100%) loss of sediment sources in the drift cell. Historic Accretion Shoreform mapping indicated that 9% of the KI-13-17 shore was historically accretionary in nature (Map 14, Appendix 2; Tables 12 and 13), all of which was encompassed within a longshore lagoon that extends into adjacent cell KI-13-18. Comparison of these results with those from current conditions mapping indicates that 14% of the historic AS(es) in this drift cell have been lost. KI-13-18 KI-13-18 exhibits westward net shore-drift due to northeast fetch across Quartermaster Harbor and exposure to northeast winds crossing the topographic low at Portage. The cell extends from a divergence zone on the northeast shore of the Burton Peninsula, west to its terminus at a muddy sand spit and prograded beach along the south shore of the inner embayment (Schwartz et al. 1991). It measures just under a mile in length (0.96 miles, 5,083 ft), 67.7% of which is modified (Table 8, Map 7, Appendix 2). A single sediment source located north of Burton Acres Park remains in this drift cell, accounting for 6.4% of the shoreline. No toe erosion or active landslides were documented. Transport zones were mapped along 6 unmodified beaches in the cell, totaling 22% of the drift-cell. An accretion beach and small spit have formed at the cell terminus, representing 3.9% of the drift cell.
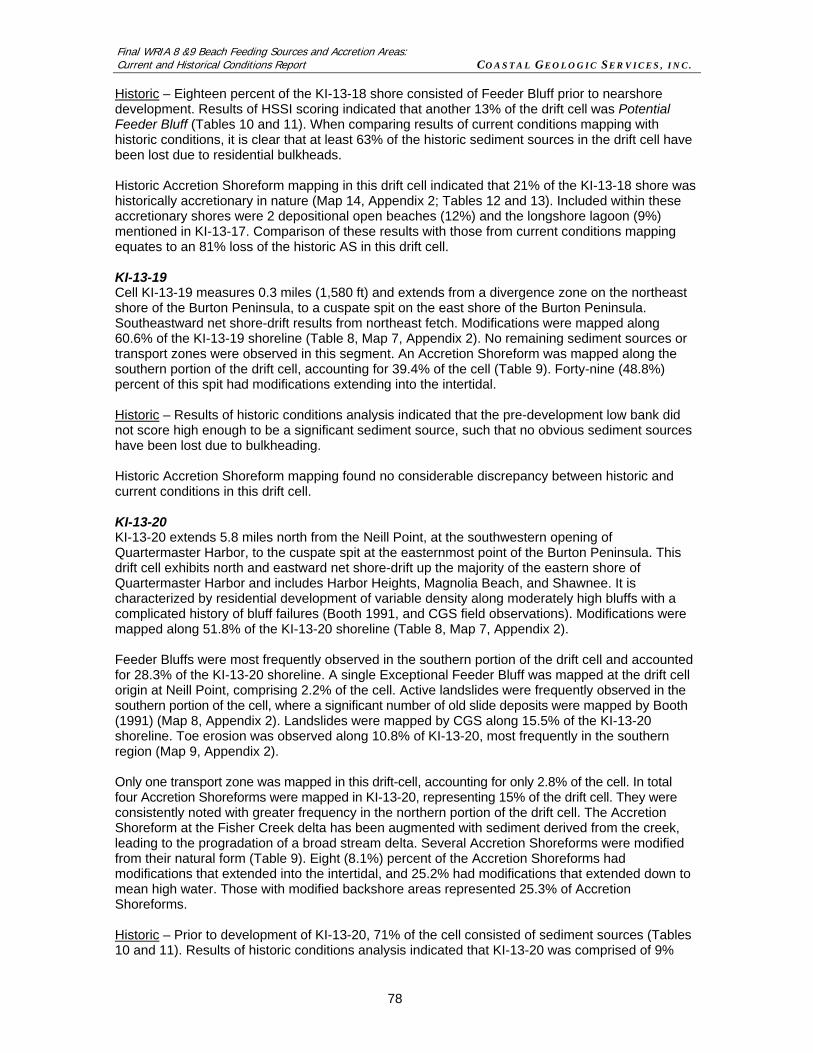
Final WRIA 8 &9 Beach Feeding Sources and Accretion Areas: Current and Historical Conditions Report COASTAL GEOLOGIC SERVICES, INC.
78
Historic – Eighteen percent of the KI-13-18 shore consisted of Feeder Bluff prior to nearshore development. Results of HSSI scoring indicated that another 13% of the drift cell was Potential Feeder Bluff (Tables 10 and 11). When comparing results of current conditions mapping with historic conditions, it is clear that at least 63% of the historic sediment sources in the drift cell have been lost due to residential bulkheads. Historic Accretion Shoreform mapping in this drift cell indicated that 21% of the KI-13-18 shore was historically accretionary in nature (Map 14, Appendix 2; Tables 12 and 13). Included within these accretionary shores were 2 depositional open beaches (12%) and the longshore lagoon (9%) mentioned in KI-13-17. Comparison of these results with those from current conditions mapping equates to an 81% loss of the historic AS in this drift cell. KI-13-19 Cell KI-13-19 measures 0.3 miles (1,580 ft) and extends from a divergence zone on the northeast shore of the Burton Peninsula, to a cuspate spit on the east shore of the Burton Peninsula. Southeastward net shore-drift results from northeast fetch. Modifications were mapped along 60.6% of the KI-13-19 shoreline (Table 8, Map 7, Appendix 2). No remaining sediment sources or transport zones were observed in this segment. An Accretion Shoreform was mapped along the southern portion of the drift cell, accounting for 39.4% of the cell (Table 9). Forty-nine (48.8%) percent of this spit had modifications extending into the intertidal. Historic – Results of historic conditions analysis indicated that the pre-development low bank did not score high enough to be a significant sediment source, such that no obvious sediment sources have been lost due to bulkheading. Historic Accretion Shoreform mapping found no considerable discrepancy between historic and current conditions in this drift cell. KI-13-20 KI-13-20 extends 5.8 miles north from the Neill Point, at the southwestern opening of Quartermaster Harbor, to the cuspate spit at the easternmost point of the Burton Peninsula. This drift cell exhibits north and eastward net shore-drift up the majority of the eastern shore of Quartermaster Harbor and includes Harbor Heights, Magnolia Beach, and Shawnee. It is characterized by residential development of variable density along moderately high bluffs with a complicated history of bluff failures (Booth 1991, and CGS field observations). Modifications were mapped along 51.8% of the KI-13-20 shoreline (Table 8, Map 7, Appendix 2). Feeder Bluffs were most frequently observed in the southern portion of the drift cell and accounted for 28.3% of the KI-13-20 shoreline. A single Exceptional Feeder Bluff was mapped at the drift cell origin at Neill Point, comprising 2.2% of the cell. Active landslides were frequently observed in the southern portion of the cell, where a significant number of old slide deposits were mapped by Booth (1991) (Map 8, Appendix 2). Landslides were mapped by CGS along 15.5% of the KI-13-20 shoreline. Toe erosion was observed along 10.8% of KI-13-20, most frequently in the southern region (Map 9, Appendix 2). Only one transport zone was mapped in this drift-cell, accounting for only 2.8% of the cell. In total four Accretion Shoreforms were mapped in KI-13-20, representing 15% of the drift cell. They were consistently noted with greater frequency in the northern portion of the drift cell. The Accretion Shoreform at the Fisher Creek delta has been augmented with sediment derived from the creek, leading to the progradation of a broad stream delta. Several Accretion Shoreforms were modified from their natural form (Table 9). Eight (8.1%) percent of the Accretion Shoreforms had modifications that extended into the intertidal, and 25.2% had modifications that extended down to mean high water. Those with modified backshore areas represented 25.3% of Accretion Shoreforms. Historic – Prior to development of KI-13-20, 71% of the cell consisted of sediment sources (Tables 10 and 11). Results of historic conditions analysis indicated that KI-13-20 was comprised of 9%
Final WRIA 8 &9 Beach Feeding Sources and Accretion Areas: Current and Historical Conditions Report COASTAL GEOLOGIC SERVICES, INC.
79
Feeder Bluff Exceptional and 62% Feeder Bluff. This included long reaches of unstable high bank Feeder Bluff and Feeder Bluff Exceptional units (12,446 ft-cumulative length) that “fed” long reaches of down-drift beaches. The northeast end of the cell contained mostly forested low banks that did not score as Feeder Bluff (Figure 36). When compared with current conditions mapping this represents a 57.2% loss in sediment source length in the drift cell. Results of historic Accretion Shoreform mapping indicated that the length of AS in this cell has apparently increased (+ 280 ft) since pre-development conditions. Historic mapping resulted in accretionary beaches encompassing 14% of the drift cell, while current conditions mapping mapped 15% of the cell as AS (Table 12). A likely explanation for this discrepancy is the lack of detailed historic data sources enabling accurate identification of depositional open beaches and other AS types, as well as the presence of several large historic landslides in the drift cell. The frequency of landsliding very likely increased after the slopes were logged, causing deposition of considerable colluvium that possibly augmented Accretion Shoreforms.
Figure 36. Southside of Burton Head, 1892. Property of MSCUA, UW Special Collections, Neg. no. 19278.
SUMMARY AND DISCUSSION
Current Conditions Feeder Bluff and Accretion Shoreform Mapping Overview Mapping of the current geomorphic nature of the shore of the study area will be valuable for a wide variety of applications, such as restoration and conservation planning for nearshore areas, modeling of biological or ecological processes and change over time, land use planning, and management of potential development. This mapping represents the first systematic characterization and analysis of the entire study area shore in terms of sediment sources for nearshore habitats and the detailed geomorphic characterization of the nearshore environment. It also provides a comprehensive dataset of recent landslides, areas of toe erosion, stream mouths, and major outfalls at the coast. Prior to this study, there was a data gap of detailed historic mapping information of erosional bluffs in the study area. The most detailed primary data source was the T-sheet maps produced in the late 1800s. However, when examined in detail, this map set only showed areas that were the most obviously erosional as such, and showed only limited lengths of bluffs as erosional. Also, the T-sheets are quite inconsistent from one sheet to the next in this regard, making their use further limited. Therefore, efforts to recreate historic bluff conditions in a large area that depend heavily on T-sheets without the integration of other existing map and data sets (which are all less informative) would not produce reliable results. As discussed in the Methods sections of this report, current conditions mapping was primarily a field-based process that focused on geomorphic evidence of coastal processes. The methods employed were an outgrowth of the now well-accepted net shore-drift mapping, which also employed a field-based, geomorphic approach. The use of geomorphic evidence from reconnaissance of the entire study area shore revealed information on bluff erosion processes, bluff stratigraphy in places, current development impacts, and beach characteristics, which were data that were generally not obtainable any other way. Also, the opportunity to observe these parameters in an integrated fashion in the field allowed for a well-informed field mapping process. These methods produced results that utilized the wealth of new information collected in the field and would likely differ from results obtained from a GIS modeling process using only pre-existing

Final WRIA 8 &9 Beach Feeding Sources and Accretion Areas: Current and Historical Conditions Report COASTAL GEOLOGIC SERVICES, INC.
80
data sets. It is our opinion that the results of the current conditions mapping supercedes previous work on the physical characterization of nearshore geomorphic processes. Conversely, due to the lack of long-term observations and measurements, the results of current conditions mapping may not accurately reflect the geomorphic nature of shore in all areas, as the infrequent nature of bluff failures in some areas and the fact that most sites were only visited once may have introduced error. The Feeder Bluff and Accretion Shoreform field mapping was described in the Results of Current and Historic Conditions Mapping section and was summarized in Tables 8-9 and Maps 3-9 (Appendix 2). Over the entire study area of WRIA 8 and 9, current conditions mapping delineated 858 individual units alongshore (Table 15a). Mapping was performed at 1:24,000 scale, and mapping units had average lengths on the order of 300-700 ft. The greatest number of mapped units was modified (bulkheads, breakwaters, fill, etc.), followed by Accretion Shoreform. Units were mapped in the field based on direct observation of shoretypes or structures. The unit length varied and the total length of modified shore was far greater than any other unit, representing 45.6% of the total study area length. In addition, the BNSF railway line north of the Shilshole area was built behind a large seawall. This structure was the dominant feature of the WRIA 8 portion of the study area with long expanses of seawall without other shoretypes present (Figures 37 and 38). Modified-by BNSF RR was mapped separately from modified. The modified-by BNSF RR shoretype represented 13.4% of the entire study area shore. Shoretype occurrence is shown graphically for each sub-area in Figures 38-45. Additional modified shores include modified Accretion Shoreforms, which accounted for 9.9% of the study area. Modifications along Accretion Shoreforms, however, do not generally interfere with sediment supply for drift cells, but often have site-specific impacts. Cumulatively, modified shores (including those along Accretion Shoreforms, and those caused by the BNSF railway) represented 69% of the study area. Only 3 drift cells in the study are remained unmodified. Table 15a. CGS current conditions mapping summary for entire study area. Shoretype Number of Units Min Length (ft) Max Length (ft) Mean Length (ft) % of Study AreaFeeder Bluff Exceptional 29 61 2,861 709 3.3% Feeder Bluff 184 23 3,560 517 15.1% Transport Zone 95 19 1,808 274 4.1% Accretion Shoreform 247 5 2,930 473 18.5% Modified 287 21 29,986 1,004 45.6% Modified - RR 16 829 17,247 5,293 13.4% Sum 858 100.0% Feeder Bluff Exceptional units (highest sediment input into the nearshore) were mapped in only 29 individual units. These occurred in 10 drift cells under current conditions mapping. Feeder Bluff Exceptional units were located at the Magnolia Bluffs, north of Saltwater State Park, Maury Island, and southwest Vashon Island. Feeder Bluff units were mapped along 15.1% of the study area shore cumulatively, in 184 units. These shoretypes occurred in most drift cells (Table 15a). However, 22 drift cells (of 61 total cells and NAD areas mapped) had no intact sediment sources, due to modifications of very low sediment input conditions. This represented a substantial number of drift cells that could clearly be considered as not properly functioning. Feeder Bluffs were more prevalent at Vashon and Maury islands, where modifications were not as common (Figures 37-45). Transport zone units were mapped along 4.1% of the study area shore in 95 units (Table 15a). This shoretype was uncommon, likely due to the overall sediment-starved nature of most drift cells (due to bulkheads as well as naturally limited sediment input in Puget Sound). The cumulative impacts of the substantial degree of bulkheading in the study area has likely led to widespread

Final WRIA 8 &9 Beach Feeding Sources and Accretion Areas: Current and Historical Conditions Report COASTAL GEOLOGIC SERVICES, INC.
81
beach erosion as the inputs to the net shore-drift system have been reduced. This in turn has likely led to enhanced bluff toe erosion by wave attack, landsliding, and the likely conversion of some former transport zones into Feeder Bluffs. Accretion Shoreform units were typically shorter in length than all other shoretypes (except transport zones; Table 15a), as many of these features were at small stream mouths and a good number of individual accretion shores were divided into smaller units based on the average elevation of the toe of bulkheads present. Note that Accretion Shoreforms were the only shoretype mapped where modifications were present, but since they did not affect the nature of the mapped feature they were mapped as an Accretion Shoreform, with the modification mapped as ancillary data. Otherwise the shore was mapped as modified where bulkheads or other modification were present. Lesser numbers of long Accretion Shoreforms did occur at areas such as Point Wells, West Point, Alki Beach, Three Tree Point, and Point Heyer. Much more detail is found in drift cell summaries and Table 9. Recent Landslides Landslides were mapped in the field where the bluff failures appeared to occur within the last 2-3 years. The distribution of landslides was not evenly distributed throughout the study area. Recent landslides occurred most commonly along Vashon and Maury Islands and in several smaller areas on the mainland (Map 8, Appendix 2). One of the main reasons for this was the great extent of bulkheads and fill along much of the mainland shore. However, the cluster of recent slides between Mukilteo and Picnic Point was within the BNSF railroad revetment area, indicating that bluffs remain unstable and are subject to mass wasting, even though the bluffs have been armored for approximately 110 years. Slides occasionally occurred at other bulkheaded areas also, with colluvium (slide debris) that extended over the bulkhead and onto the beach in some cases. The Magnolia sub-area contained several long reaches of recent landslides, along the unmodified south shore as well as north of the West Point Metro plant. Besides several isolated slide areas along the mostly modified South Seattle to Three Tree Point, a cluster of recent landslides occurred between Normandy Park and Des Moines (Map 8, Appendix 2). This occurred at one of the largest unbulkheaded areas north of Redondo that also has a moderately long fetch. A smaller cluster of recent slides was located north of Saltwater State Park. Several reaches of recent slides were mapped west of Redondo and substantially longer reaches were mapped west of Dumas Bay to Dash Point State Park in silt and clay-rich banks with a long fetch from the north. Recent landslide clusters were most prevalent on Vashon and Maury Islands (Map 8, Appendix 2). The topography of the banks and uplands of the islands clearly shows the extensive history of large landslide scarps and ravines. Mapped historic landslides were also common on the islands (Booth 1991). The areas with fewer mapped slides were at north Vashon and inner Quartermaster Harbor. Otherwise, slides were fairly common where the bluffs were not bulkheaded. This was particularly true along north Maury, south Vashon, and shorter reaches of the central west side of Vashon Island. Recent Toe Erosion Bluff toe erosion was mapped in the field where wave attack caused erosion or scarping of the base of the bluff and appeared to have occurred over the previous 2-3 years. Toe erosion can lead to landslides over a period of years as bluffs become gradually undermined and mass wasting events (landslides) are triggered by extreme precipitation or uplands development practices. By definition, toe erosion did not occur and was not mapped at bulkheaded sites, except in the rare cases where very low or failing bulkheads allowed toe erosion to occur.