
WATER - NIWA
123
-Æ WATER & SOIL No. 38 Physical and Chemical Methods for Water Quality Analysis rssN o110-4705 Water & soil miscellaneous publication no. 38 (1982)
Transcript of WATER - NIWA

-Æ
WATER & SOIL
No. 38
Physical and Chemical Methodsfor
Water Quality Analysis
rssN o110-4705Water & soil miscellaneous publication no. 38 (1982)

_+¿ _+¿ \.ì
WATER & SOIL MISCELLAI\EOUS PUBLICATION NO. 3E
d
Physical and Chemical Methods
Water Quality Analysis
D. C, SMITIIWater and Soil Division
Ministry of Works and DevelopmentHead OfficeWellington
C. D. STEVENSONChemistry Division
DSIRPetone
J. B. MACASKILL\4ater and Soil Science Centre
Hamilton
W, H. L. EDGERLEYChemistry Division
DSIRPetone
WELLINGTON 1982
Water & soil miscellaneous publication no. 38 (1982)

Physical and Chemical Methods for rffater Quality Analysis
Edired by D. G. Smith, Water and Soil Division, Ministry of Works and Development, WellingtonWater and Soil Miscellaneous Publication No.38, 1982, 119 p. ISSN 0110-4705
This manual contains reference analytical methods for ammonia, biochemical oxygen demand,chemical oxygen demand, dissolved oxygen, pH, nitrate and nitrite, reactive dissolved phosphorus,total phosphorus, and non-filterable residue (suspended solids) contained in natural waters and\r/astewaters.
Procedures to be used in routine analytical quality control, and in analytical quality control forsuspended solids and dissolved oxygen analysis, are also presented.
The analytical methods and quality control procedures have been developed for use by regionalwater board laboratories and other laboratories engaged in water quality analysis.
National Library of New Zealandcataloguing- in-PubI ication data
PHYSICAL and chemical methods for water qualityanalysis ,/ edited by D,G. Smith ... [et aI.]. -Wellington, N.Z. : trater and Soil Divisionlrinistry of Works and Development for theNational water and Soil Conservation organisation,1992. - f v. - (Water c soiL miscellaneouspublication, IssN 0110-4705 t no. 38)
628.L6II. water quality--Measurement. I. smith, D. G.
(David clynn) , !944- Ir. series.
@ Crown Copyrlght 1982
Published for the National Water and Soil Conservation Organisation by the Vy'ater and SoilDivision, Ministry of Works and Development, P.O. Box 72-04I, Wellington, New Zealand.
Water & soil miscellaneous publication no. 38 (1982)

CONTENTS
Foreword
IntroductionRoutine Analytical Quality Control...
Analytical Quality Control Tests for Dissolved Oxygen Analysis.. .
Analytical Quatity Control Test for Precision and Bias in Suspended SolidsAnalyses
Methods1. Determination
orimetry2. Determination3. Determination4. Determination5. Determination6. Determination7. Determination8. Determination9. Determination
Page
4
5
7
11
T3
of Ammonia Nitrogen by Indophenol-blue Col-
of Biochemical Oxygen Demand (BOD)of Chemical Oxygen Demand (COD)of Dissolved Oxygen by Membrane Electrodeof Nitrate and Nitriteof pHof Reactive Dissolved Phosphorus (RDP)of Total PhosphorusÆotal Dissolved Phosphorusof Total Non-filterable Residue (Suspended Solids)
Water & soil miscellaneous publication no. 38 (1982)

FORE\ryORD
There is a growing need to measure the concentrations of m?.ny substances inn provide evidence in legal proceedings or for otherp ie that laboratories are capable of producing resultso cision. The use of the methods and quality controlprocedures presented in this handbook will help in the achievement of these aims.
The National \Mater and Soil Conservation Organisation has adopted thesemethods as reference analytical methods. Laboratories are recommended toincorporate both the metñods and the quality control procedures in theirprogrãmmes. The methods can be used either routinely or as references againstwhich other methods can be calibrated.
M. J. Conway, Chairman, 'Water Resources Council.
Water & soil miscellaneous publication no. 38 (1982)

INTRODUCTION
e one section of a three-part work, providestical methods and analyiical quality controlboard laboratories and other laboratories
fhe methods have been carefully developed for
activery invorved with the anarysis "ii'"f,,fftï'"t'r3?tiotËirttll"i:
tffi: åfåîå:tååi
generally be applied to a variety of water types ranging from pristine to polluted._.In the development of the methods the following re{uiremênts were cônsidered.The methods should be:
{acy'SIS.
servative (mercuric chloride) if chemical
The metllods initially published are for some of the physical and chemicaldeterminands with which water laboratories are most likelyio'Ue concerned. Theyhave been developed by collaboration of scientists from Water and Soil Division",Ministry of Works andDevelopm_ent, and Chemistry Division, Department ofScientific and Industrial Research. It is expected that this part of the månual will beadded to in due course. by other physical-and chemical methods, and periodicallyupdated as required. Biological methods will be published as a separatê part of thêcomplete manual.
The similar to that developed ancl used by the U.K.Depart , National 'Water Couricil Standing Committee ofAnalys is the introductory section of eacñ method whichdetails cteristics. This --uy include brief statistical
information such as the range of application, the natûre of the calibration curve,standard deviations for different cõncenlinterferences, time taken for analysis
Use of these reference analyticalprocedures, should enable reliable resrobtained. If an analyst prefers to use differetagainst these reference methods will enhance the confidence which the analyst hasin the preferred methods.-Widespread use of these methods and analytical {ualitycont¡ol procedures should ensurè valid inter-laboratory comparison bf anaiyticálresults.
1fr{a_1uq!.on Analytical Qrrality Qonlroì for rhe Warer Indusrry, R. V, Cheeseman, A. L. Wilson,U.K. Water Research Centre Technical Report TR66, Janúary 1978.
Water & soil miscellaneous publication no. 38 (1982)

rtE
c'l1.2
co=fõøE t.loEcoU'
oE t'o
IoLo5 o.gItc3oc.9Ë o.8L
(l'(tco(J
Upper oclion limit (+gs)
Upper worning limit (+ 2s)
Expecled concenlrolion (s = O'lO g ./m3)
Lower worning limil (-2s)
Lower oction limit ( -3s)
Dote of onolYsis
FIGURE I. EXAMPLE OF A CONTROL CHART FOR A STANDARD SOLUTION
Water & soil miscellaneous publication no. 38 (1982)

ROUTINE ANALYTICAL QUALITY CONTROL
IntroductionAll analytical determinations are subject to error. Many studies have shown that
these errors are often large. Results which are subject to large errors restrict theability of a laboratory to draw valid conclusions, and may lead to false ormisleading conclusions. The sorts of problems which might arise are when:
l.Results are to be compared between laboratories; and2. Results are to be used to decide if the conditions of a water right have been
infringed.The use of analytical quality control (AOC) techniques, whilst not necessarily
reducing errors involved in a determination, enable a laboratory to be aware of itscapabilities and ensure that certain standards are maintained as an on-goingactivity. It has been suggested that 10-20Vo of. the effort available for routineanalysìs is required foi quality controll. For many laboratories this may beconsidered impractical. Nonetheless it is preferable to perform a limited amount ofquality control than none at all, and to produce somewhat fewer results of knownaccuracy rather than more with unknown accuracy.
AQC in the laboratory consists of three facets:1.The use of analytical methods whose performance characteristics under
rigorous conditions are acceptable.2. Routine analysis on a regular basis of a control sample(s) at the same time that
unknown samples are being analysed.3. Confirmation of the ability of a laboratory to produce acceptable results by the
analysis of reference samples.There are exhaustive preliminary AQC tests available for most physical ancl
chernical analytical determinations. These tests have been used in the compilationof the Performance Characteristics of each of the analytical methods contained inthis publication. If a laboratory wishes to carry out such tests and obtain its ownperformance characteristics, details ancl assistance should be obtained from theaddress given at the end of each analytical method.
Continuing checks on analytical errors are still required though, since manyfactors can cause departures from acceptable analytical performance. The use ofcontrol charts provides a simple means of checking analytical performanceroutinely. Four different ways of using control charts are described here. They aremainly applicable to colorimetric, titrimetric, and atomic absorption/emissiontechniques. Analytical quality control techniques for other types of analysis, €.9.,pH, dissolved oxygen, will be covered either within the analytical method itself orissued separately.
The analysis, by a laboratory, of reference samples will be accomplished withinChemistry Division's "Chemaqua" programme.
Control Charts
(a) Analysis o/ a Standard SolutionA standard solution of known concentration (similar to the concentration of
samples being analysed) is analysed at least twelve times on different days. Fromthe results, the mean value, *, and the standard deviation, s, can be determined.An aliquot of the same solution is then analysed with every batch of unknownsamples. Assuming that the analytical results for the standard solution follow thenormal distribution, then only O.3Vo of all results will fall outside the limits of l3sfrom the mean. Thus, individual results should so seldom fall outside these limits,that such an event would justify the assumption that a real change in accuracy hasoccurred and hence that remedial action is necessary.
The control chart (see figure L) is drawn up with linei corresponding to the meanand the limits +3s (called the "action limits"). The day to day analysis of thestandard is then entered sequentially on the chart. If the value is outside the +3slimits, remedial action must be taken.
Water & soil miscellaneous publication no. 38 (1982)

It is also useful to insert the t2s lines on the chart. These are called the "warninglimits". Statisticallv ,-iVo o¡ all results if only o-ne
dav's results ut" oúitì¿; ih.* limits, results fallouiside the wanting limits too frequ
(i) A systematic at onlY the
upper or(ii) The iätt¿o- limits are
crossed hthe characteristics of the method have changed is when
se fall on the same side of the mean value. This would
in ffect occurring.
SETTING UP AND MAINTAINING THE CONTROL CHART
When the chart is set uP, theonly twelve results. The limits conly preliminarY estimates. Thcheckèd-none of the analYtical5O7o of. the results should be within t1s oresults should be within this range).
As each batch of analyses is done, morare performed and these can be used toand^standard deviation. So after 25,50results should be pooled with the initideviation recalcuiatãd. The control chart should then be adjusted accordingly.
(b) Analysis o/ Duplicate Solutions
sd:
where z is the number of duplicates.
The problem with this control test is 1 to vary
*iih coîcentration and if the concentrati then non of theapplied
rations so that the same value of so isuld be necessary to construct severalnarrow concentration ranges and the
results from samples entered on the appropriate charts.
(c) Analyses of Spiked SamPles
Control tests (a) and (b) provide nonatural samples. To check for this, s
samples and the observed recoveriestheoretical recovery as the expectedadded of the sa
spiked of the ithtñe val ted on thvalue is l\OVo. The relevant standard
8
)d,'- (2d,)2/z
Water & soil miscellaneous publication no. 38 (1982)

2ai2 - (2at)2/zS,:
where a, - 100 d,/ô and z : the number of samples in which the recovery test hasbeen made.
Whereas a result outside the control limits for tests (a) or (b) indicate somemistake in following the method, crossing a control limit in the spiking recovery testsuggests an interfeìence caused by a particular sample or_sample type.
Ãs in type (b) tests, the interþretátion of the retults from recovery tests iscomplicated if the standard deviation oSimilar approaches to those in type (b)
The prõþortion of samples whiðh can u I
depend on experience with the particulalúVo or even)OVo of samples análysed may be appropriate, whereas spiking ?t 1%(with particular attention to new sámple types) may be adequate if an accumulationof results indicates the general reliabilily of the method.
(d) Recording the Blank ValuesIt is also useful to plot the values of the blank determination on a sequential chart
to aid the detectión of abnormal values. This chart cannot necessarily beinterpreted in the same way as (a) to (c) because variations in the blank from onebatch of analyses to anothér may have no effect on the errors in analytical results.Thus there ii no need to insert warning, action and mean lines on this chart'
NOTES
1. Each laboratory should use whichever AQC technique, or cotnbination oftechniques, it finds áppropriate. Guidance on the use of the various control chartscan be^ obtained frorii thê address given at the end of each analytical method.
2. The results of analysis should only be reported if the control tests aresatisfactory. If the contról tests indicats something is amiss, the fault must berectified befor
3. In all the samPles as normalsamples to avo precision. Ideally a
second person ith the analYst notknowing which was which.
REFERENCESlManual on Analytical Quality Control for the Waler Industry, R. V. Cheeseman, A. L. Wilson,U.K. Water Research Centre Technical Report TR66, January 1978'2cel,ls/Water Operational Guide, Chaptei IV, Analytical Qu_alrjy^ C^ontrol. UNEP/WHO/UNESCO/W-MO'Project on Global Water Quality Monitoring' WHO 1978'
Water & soil miscellaneous publication no. 38 (1982)

Water & soil miscellaneous publication no. 38 (1982)

ANALYTICAL QUALITY CONTROL TESTS FOR DISSOLVEDOXYGEN ANALYSIS
The AQC test involves comparison of results obtained for an air-saturated waterwith the expected concentration read from standard tables. Where laboratories areequipped with dissolved oxygen meters, cross-checks between meter determina-tions and those using the Winkler procedure are also recommended.
Air-saturated Water TestHalf fill each of two appropriately sized bottles with tap water or natural water. If
necessary, add mercuriô chloride (40 g/m3 HgCl2) to eliminate any biologicaluptake (high BOD) or release (heavy algal growth) of oxygen.
Shake both bottles vigorously for 1-2 minutes.Replace the air above the water by pouring the contents of one bottle into the
other to fill it, and then pouring the contents of the full bottle back into the emptybottle to fill it.
Divide the water equally between the two bottles and shake both again for3 minutes.
Measure and record the temperature of the shaken water with a thermometer.Determine the dissolved oxygen concentration in the shaken water, using either
a dissolved oxygen meter or the Winkler procedure, and record the result.If the dissolved oxygen probe in use is not equipped with a stirrer, a flow past the
membrane may be created by tipping the air-saturated water into a small bucket orbeaker and stirring the contents.
Read off the saturation concentration of dissolved oxygen corresponding to thetemperature and salinity of the shaken water, from the solubility table for oxygen inwater attached to the dissolved oxygen method.
A correction for barometric pressúies differing from 760 mm of mercury may benecessary particularly at altitudes significantly above sea level.
The résúlt obtaineä for the air-satrfrated water should be within 0.2-0.3 glm3 of.the saturation concentration.
Comparison of Dissolved Oxygen Meter and Winkler Procedure ResultsThe air-saturated test will give no indication of errors introduced by sample
aeration during handling. Comparison of results obtained by the Winklerprocedure and dissolved oxygen meters may indicate such errors, if waterscontaining low concentrations of dissolved oxygen are examined. Such comparisonsmay also indicate other analytical faults, such as poor calibration of meters orstandardisation of titrant.
Comparison tests may be conducted either in the field or in the laboratory. Fieldtests will often be more realistic since normal field procedures for dissolved oxygenmeasurement and collection of samples for Winkler analysis can be followed.
If samples for Winkler analysis are not analysed on site, one of the followingprocedures must be used:
(i) Proceed with the Winkler analysis to completion of the iodine liberation(acidification) stage. Chill the acidified sample, store in the dark andtitrate in the laboratory as soon as convenient.
(ii) Fill a BOD incubation bottle with sample, as for the Winkler procedure,and add 0.5 ml of 2Vo m/V mercuric chloride solution (to giveapproximately 40 glm3 HgClr) immediately before stoppering thebottle. The full Winkler procedure may be undertaken subsequently, inthe laboratory.
The results obtained by m_eter and the Winkler procedure for the same watershould agree within 0.3 g/m3. Day to day barometric pressure variations at anyaltitude are likely to produce discreparcies of up to about 0.15 g/m'dissolvedoxygen between the two analytical methods, unless allowance for the variationfrom 760 mm mercury is made at the time of calibrating the dissolved oxygen meterand analysing the check sample(s).
11Water & soil miscellaneous publication no. 38 (1982)

Some waste waters (notably pulp mill effluents) and receiving waters containconstituents which interfere ln- thè Winkler analysis. The occurrence of suchinterference can be checked for particular waters by preparing an air-saturatedsample of water, and comparing the result obtained with the expected. saturationconðentration, as in the aiì-saturated water test. If the result differs significantlyfrom the expected value for air-saturated water, and clean air-saturated waters givethe expected values, interference is occurring.
Control ChartsResults obtained in either the air-saturated water test or the comparison between
Winkler and meter determinations should, at least, be recorded permanently withthe experimental or survey results, to indicate the reliability of the data. Controlcharts
-for dissolved oxygen may be maintained by expressing the concentration
found as a percentage citltre expected value in the air-saturated water test and themeter resúlt as a-percentage of the V/inkler result in the meter-Winklercomparisons.
Aóceptable results will lie between 95Vo and l05Vo.
t2 Water & soil miscellaneous publication no. 38 (1982)

ANALYTICAL QUALITY CONTROL TEST FOR PRECISIOÌ.{ ANDBIAS IN SUSPENDED SOLIDS ANALYSES
Assessment of Sub-sampling TechniqueThe prime objective of this test is to demonstrate whether sub-sampling
techniques used are adequate for all sample types handled by a laboratory. If thetest indicates the absence of significant bias for sample types most likely subject tosub-sampling problems (because of floatable or rapid-sinking particulate material)the test need be repeated very infrequently, or when there is a change of analyst ortechnique used. If unacceptable bias is evident, the sub-sampling technique shouldbe improved if possible, to eliminate the bias. If this is not possible, an attemptshould be made to identify the sample types most likely to give problems, so thatthis uncertainty can be indicated on analysis reports.
The test depends on repetitive sub-sampling from a sample bottle, using theroutine laboratory sub-sampling techniques. Comparison of first and intermediatesub-sample results with an estimate of the true whole-sample result indicates themagnitude of any bias introduced by the sub-sampling technique. The intermediatesub-samples give a measure of the overall precision of sub-sampling and analysis.
If the routine practice is to collect a sample which is used in toto (includingrinsing of the sample bottle) for suspended solids analysis, bias in sub-samplingcannot normally occur and this test is inapplicable.
EXPERIMENTFrom each sample collected for the test:
(i) Remove the first sub-sample using the routine laboratory sub-samplingtechnique and determine the suspended solids concentration in the sub-sample.
(ii) Remove additional sub-samples from the sample bottle, always using theroutine sub-sampling technique. Determine the suspended solidsconcentrations in the five or six sub-samples bracketing the half emptypoint in the sample bottle.
(iii) Continue to remove additional sub-samples from the sample bottle, usingthe routine sub-sampling technique, until there is sufficient sample leftin the sample bottle for only one suspended solids estimation.
(iv) Vigorously agitate the last sub-sample in the sample bottle and pour itdirectly into the filter holder. Determine the volume of sub-sample bymeasuring the volume of filtrate collected in the filtration flask, Rinseany residue remaining in the sample bottle into the filter holder, usingdistilled water. Exclude the rinse water volume from the estimate ofsub-sample volume.
(v) Determine the suspended solids concentration in the final sub-sample.(vi) Sub-samples not used for suspended solids determinations may be
discarded or used for determination of other constituents.
ASSESSMENT OF RESULTS
Calculate the mean concentration and standard deviation for the central set offive or six sub-samples. If a calculator with statistical functions is not available, usethe following formulae:
)*i,\_
n
13Water & soil miscellaneous publication no. 38 (1982)

wherei is the mean concentrationi, ii,. i" . . . i.'l aie the individual results for suspended solids determinationsn' ìs'íhé numbër of results in the set (5 or 6)'SD is the standard deviation
An estimate of the true whole-sample suspended solids concentration is given by:
x"Vu + i(V, - V. - Vr) *xrY.Xt:
vt
an indication of detection limit.It will probably be useful to estimate
examined, since precision is likely tosuspended material as by the analyticalinclude, for example:
Conventional sewage effluentOxidation pond effluent
wherext : suspended solids concentration in whole sample before any sub-samplingVt : total volume of sample before sub-samplingx", xz : suspended solid-s concentrations in first and last sub-samples,
respectivelyV", V. : volumes of first and last sub-samples, respectivelyi -: mean suspended solids concentration in intermediate samples
The most appropriate comparison forpractice in the laboratory. If the firssolids analysis, compare the result x"analysis is usually taken after other subwith x,. If the difference between x. andthat the sub-sampling technique is introdxr of bias.
mined by the accuracy requiredof and analysis. A relatively smallbi of sub-samPling and analYsis isvery good, but be of little practical importance.
Routine Analytical Quality Assurance Tests for Suspended Solids Analyses
Useful r sub-samPby analys duPlicate,duplicate describedob'tained low concentrations of suspended solids give
precision separately for each water type-be influenced as much by the tYPe oftechnique. rù/ater types considered might
Silt-laden streamsDairy shed effluent
Spiking recovery tests are not considered useful because,.of likely differencesbetùeenlhe natuie of spiking materials and suspended solids in samples.
t4Water & soil miscellaneous publication no. 38 (1982)

DETERMINATION OF A¡4I'1ONIA NITROGEN BY INDOPHENOL-BLTIE
CoLoRTMETRY (1981)
Note: Throughout Èhis method ammonia nitrogen is expressed as N'
I. performance 1.1 Substance Anmronia nltrogen.Characteristícs deÈerminedof the Method
L.2 IYpe of sample Fresh, saline or waste waters'
l.3BasisofAmmoniaisreactedwithchlorineandphenolmethodandtheresultingindophenol.bluedetermined
color imetr i cal1Y.
1.4 Range of UP to 1000 mgrlm3
application
I
I.5 Calibration Linear up to 1000 mg/m'curve (See Section 11)
1.6 Standard Ammonia-N Standard Deviation' (Preserveddeviation concentration and unpreserved samples)
(mglm3) 1mg,/m3)
g3253
2oo 4
900 5.5
I.8 sensitivity 500 mgrlm3 ammonía-N gives an absorbance ofapproximately 0.6 for unPreserved samplesand 0.55 for samples preserved with mer-curic chloride.
1.g Bias No evidence of bias in spike recovery tests.
1.10 Interferences See Section 3.
L.7 Limit of I0 mgrlm3 ammonia-N for unpreserved samples'detection and 12 ng/m3 a¡runonia-N for preserved samples.
1.ll Tine required The ana1Ytícat time for 25 samples isfor anaiysis about 2l¡ hours of whlch lL hours Ís colour
develo¡ment time.
1.12 Volume required t0 mI for each determination'for analysis
Water & soil miscellaneous publication no. 38 (1982)

2. Principle
3. Interferences
4. Hazards
Alû,r,/2
2.L A¡nnonia reacts with chlorine at high pH to formmonochloramine, which reacts vrith phenol in the presence ofsodium nitroprusside to form indophenol-brue. The precipi-tation of calcitm or magnesium salts is prevenEed by theaddition of sodiun citrate.
2.2 The opÈimum reaction pH values for unpreserved sanples andsamples preserved with mercuric chloride are different.Accordingly, two dÍfferent phenate,/ciÈrate reagent com-posiÈions are given for Èhe different sanple t1pes.
2.3 Both versions of the method appear satisfactory for seawaters, although the actual reaetion pH values differsubstantiarly frcn Èhose for fresh water, and Èhe absorbancevarues are decreased by about 20t. splke recoveries aregenerally in the range 95-100C.
with the except.ion of bicarbonate (see below) constituenÈs nor-nalry present in relativeJ.y un¡nrluted waters do not interfere.A number of constituents likely to be present in industriarwastewaters interfere, including nitrite, thiocyanaÈe, cyanide,copper and silver (see Reference 2).
Mercury salts at concentrations corrnonly used for sampre preser-vation interfere in the method for unpreserved samples,decreaèing absorbances by about 50t.
The analytical response of the method for preserved samples isunaffected by mercuric chloride concentration variations in therange 2O-2OO g/n3.
Bicarbonate alkatinities up to at reast 500 g/n3 (as caco3) donot interfere ín the analysis of unpreserved samples.
Bicarbonate atkarinities up to at least so} g/n3 (as caco3) giveabsorbance decreases of ress than 5t for preserved sampteã iianarysed immediately after mercurÍc chroride addition. onstanding, ammonía recoveríes decrease in samples containing morethan 250 mglm3 NH3-N preserved with mercuric chroride only, wheremoderate or high arkalinities are present. Good recoveries areobtained when the acid,/mercurlc chloride preservation techniqueis used (see section 7.4, sampre collection and preservationi.
Mercuric chloride, used as a preservative (see sections ? and 9),ls toxÍc. consunpÈion of r0 mr of a preserved solution (40g¡n3 ngCl2l or 0. 02 mt of preservativã soluÈion l2t n/vl isequivalent to the W.H.O. Tolerable Weekly Intake of 0.3 mgmercury. Reasonable care, particutarry in washing hands beforeeating, should be exercised.
Addition of concentrated sulphurie acÍd (d2g r.94) to water mustbe carried out slowly with genÈle stirring.- Never add water tothe acid.
Water & soil miscellaneous publication no. 38 (1982)

AIr{M/3
The phenol,/ethanol (5.4) , sodir¡m nÍtroprussíde (5.5) , sodiumhydroxide (5.6), phenater/citrate (5.8), and buffer,/chlorine (5.9)solutions are all either toxic or caustic and none should bepipetted by mouth. Phenol can be absorbed through Èhe skÍn andany drops or splashes must be washed off immediately.
5. Reagents 5.1 E:<cepÈ where otherwise stated, analytical reagent grade che-micals are Eo be used. Reagents may be stored in eitherglass or polyethylene crontainers.
5.2 lrlater
Distitled water should be used for reagent solutions and,except where otherwise stated, standards and blanks. If theamnonia concent.ratlon in the distilled water is unacceptablyhigh it may be necessary to pass the water through a
strongly acidic cation exchange resÍn prior to usÍng it'
sea water containing very lor¡ anmonia concentration may beproduced by storing in the dark without preservative forseveral days after collection.
5.3 Ammonia stock solution
Dissolve 0.472 + 0.001 g of amnonium sulphate in 1000 + I mIof water to givã a concentration of I00 g7m3 HH3-H. This isstable for at least one Year.
It is c-onvenient to prepare, daily, a r^¡orking stock solutionof. 5 g/m3 NH¡-N by diluting 50 + 0.2 ml of the concentratedstock to 1000 + I mI.
If standards are preserved wíth mercuric chloride (40 g/n3'1,the calibration curve standards and blank may be retainedfor at least 3 monEhs.
5.4 Phenol/ethanol solution
Díssolve 62.5 + 0.5 g of phenol in 34 + 0.5 I of absoluteethanol. New¡ uncoloured crystatline phenol is adequate,but if any díscolouration is apparent it must be freshlydistilleil, collecting the fraction distilling between I78and I840c. The solution must be stored in the refrigeratorin the dark and replaced if blank values Íncrease substan-tially. Any preclpitate formatíon usually indicates impurephenol.
5.5 It m,/v Sodium nÍtroprussíde solution
This solution should be stored in a dark bottle in therefrigerator and be prepared fresh each month or if blankvalues rÍse.
Water & soil miscellaneous publication no. 38 (1982)

¡,J'4fi,,/4
5.6 6 M Sodium hydroxide solution
Dissolve I20 + I g of sodíum hydroxide in about 700 ml ofwater. Boil off about 250 mI to remove ammoniacontaminatÍon, cover wiÈh a clock glass, cool and then makeup to 500 + I ml.
5.7 Sodium citrate solution
Dissolve 2OO + l0 g of sodium citrate in about 700 ml ofwaÈer. Boil off about 250 ml to remove anunoniacontarnination, cover wÍth a clock glass, cool and then makeup to 500 + 10 ¡nl. The solution is stable for severalweeks.
5.8 Phenate/citrate solutions
(i) Unpreserved samples: mÍx 3.0 + 0.1 ml of lt sodiumnitropruãside solution, 5.0 + 0.1 mfìf phenol,/ethanolsolution, 6.5 + 0.1 ml of 6M sodium hydroxide solution and50 ml of sodium citrate solution.
(ii) Mercuric chloride preserved samples: mix 3.0 + 0.I mlof lt sodium nítroprusside solution, 5.0 + 0.I ml ofphenol/ethanol solution, 4.7 + 0.1 ml 6M sodíum hydroxidesolution and 50 ml of sodÍum ãitrate solution. If thesanples have been acidified, increase the volume of 6Msodium hydroxide soÌution by 0.04 ¡nl for each I g sulphuricacid added to 100 mI of the preservative solution (see 7.4).
The phenate/citrate solutions can be stored in a refrigera-tor for 2-3 days, but the blank absorbances will rises1ightly. Prepare fresh solution every 2-3 days.
5.9 2l n/V Mercuric chloride preservative solution
Dissolve 2 + 0.1 g mercurlc chloride ln 100 ml distilledwater. The solution nay be conveniently stored in a 100 ml-plastic bottle with a 2 nl plastlc syringe fiÈted into ahole ln the cap to act as a dispenser.
5.I0 Buffer,/chlorine solutÍon
Díssolve 12.5 + 0.1 g of anhydrous sodium carbonate and 0.8+ 0.05 g of soclium bicarbonate fn about 100 ml of distilledwater. Add 34 + I ml of commercial 3t sodium hypochloritesolution (e.g. Janola, 3t sodium hypochloríte) ãna mafe upto 200 ml. Allow I hour before use for removal of ammoniacontamination by the high chlorine concentration. The solu-tion Ís sÈable if left in a tightly-stoppered bottle in Èhedark. Check the free chlorine concenÈration of the reagentinitialty and at weekly intervals. Dilute I.0 + 0.05 nI ofbuffer/chlorine solution to approximately SO mtìitt¡
Water & soil miscellaneous publication no. 38 (1982)

6. Apparatus 6.1
7. SampleCollectionandPreservation
6.2
Attt4/5
dístilled water. Add about I g of potassir.rm íodide crystalsand 3 drops of concentrated sulphuric acid (cl2g 1'84)'swirl Èo dÍssolve the potassium iodicle and tÍtrate with0.025[t standardised sodium thiosulphate solution, usingstarch as the end-¡nint indicator. The titre should be 5.6ml, but the reagent is still satisfactory provlded the titreexceeds 4.5 mt. If the tiÈre ls lower than 4.5 ml' addi-tional 3t sodium hypochlorite solutÍon must be added to thereagent.
check that when 1.0 mt of the phenate/cit,rate solution and
0.4 ml of the chlorine/buffer solution are added to l0 ml ofdistilled water, the füI is in the range II.4 - I1'8(unpreserved sample reagent) or I0.7 - 11.0 (preserved
".tnþt" reagent). Add additional 6.OM sodium hydroxide solu-
tion to the phenate/citrate solutíon if necessary'
A spectrophotoneÈer, preferably havÍng a precision of+ 0.001 for absorbance measurements at 630 nm in a l0 mn
þath-Iength cell.
Glassware and volunetrÍc apparatus
25 ml glass test tubes with ground glass stoppers, Prê-ferably in a rack, f.or colour develo¡xnent.
Automatic dispensers (eg Oxford Pípettor or NichiroAccupenser), two of 0.1 - I.0 ml delivery.
Automatic Èransfer pipette, l0 ml size (e'9' OxfordMacroset) for sample aliguotting.
6.3 Cleanliness
contamination of apparatus and solutions from laboratoryatmospheres can be a major problem. concentrated ammonia
solutions should not be handled and smoking should be prohi-bíted in the laboratory used for ammonia analyses. Even
with these precautions contamÍnation is not uncommon.
Apparatus "ñd
r""g"nt. bottles should be reserved for ammonia
anàfysis only and should be kept closed exceph during solu-tion transfers. Colour develo¡xnent tubes should be leftwith the analysis resÍdues in them unÈil inmediaEely beforethe next batch of analyses, when they should be rinsed withdistÍtled water¡ and restoPpered immediately'
7.L Glass or ¡nlyethylene sample containers are satisfactory.
Unpreserved samPles
7.2 Anunonia concentrations are particularly susceptible to rapidconcentration changes associated wÍth biological acÈivity,unless a preservative is used. unfiltered sanples should be
Water & soil miscellaneous publication no. 38 (1982)

8. Salçle pre-trea tnen t
9. Cleaning ofSarçleBottles
Aynq/6
refrigeratcd and/or analysed as eoon as possíble aftercollection. The period for which anrpnia concentrations aresubstantially unchanged n¿ìy vary from one hour or less toseveral days and must be established for each type of sampleinvolved. SalçIes which have been filtered inÈo sterílisedbottles (see Cleanfng of SalçIe Bottles, 9.2) on collection,using 0.5 um membrane filters can ofÈen be retained withoutrefrigeraÈion for several days before analysis. As above,stability of anurpnfa concentrations must be established foreaeh tlpe of sanple.
Preserved samples
7.3 Sanples likely to contaÍn less than 250 ¡rg/n3 anrpnia nitro-gen can be preserved by addition of. 2 ! 0.5 ml of a 2l solu-tion of nercurie chlorlde to each litre of salçIe, giving aconcentration of 40 g/¡3 HgCL2. Such salçles are expectedto be stable for aÈ least a nrcnth.
7.4 l{here amnonia nit,rogen concentraÈions exceed 25O ng/n3, soÍìesamples give a precipitaÈe in Èhe presence of mercuricchloride, particularly when Èhe alkalinity is nroderate orhigh (50 g/n3 as CaCO3 or nore). Ttre preeipitate decreasesarm¡pnia concentrations in solutÍon and gives low recoveriesin the analysis. Aciclifícation of sanples to a pH below 5.0elimínates the precipÍÈat.ion and convenienÈ preservation maybe aehieved by adding sufficient acld to Èhe preservativesolution to t,itrate the hÍghest expected sarple atkalinity.To 100 ml of 2t mercuric chloride solution add 1 g of analy-tical grade sulphuric acitl (d2g 1.84) for every 2O g/n3 (asCaCO3) of expected sanple alkalinity. Use this aeidÍfiedpreservative for all samples, plus the btanks and standardsused in the analysis. Sarples wíth lower alkalinities willeonÈain soÍìe excess acid but this does noÈ affect the pre-servation or analysis. Àt the analysis stage, the sulphuricaeid is neutralisecl by increasÍng the amount of sodiumhydroxÍde in the phenate/citrate solution (5.8).
7.5 A note should be nade on the sanple label of any preser-vatlve added.
7.6 There has been doubt expressed in the liÈerature about theabillty of HgCl2 to preserve seawater salçIes forNH3 analysis. An alÈernative 1s to freeze unpreservedsarçles for Iater analysls.
The buffer capacity of the reagents ls adequate for sampleshaving bicarbonate alkallnlty up to 500 g,/m3 (as CaCO3). SarçIeshaving higher bicarbonabe alkalfnftfes or hlgh actdlÈy should betitrated wlÈh sodium hydroxide to a pH of 10.0-10.7.
Acfd cleaninq procedure
9.1 Rínse bottles with tap water and then fill with Llt V/Vhydrochloric acid and soak overnight or longer. Rinse atIeasÈ 3 times using about lOt of the bottle volurne ofdisti[ed $rater for each rinse. Tt¡e acid used for soakingnay be reused. Store the clean botÈles closed.
Water & soil miscellaneous publication no. 38 (1982)

10. AnalyticalProcedur e
A},ri,/7
Cleaning and sterÍIising procedure
9.2 Rinse bottles with tap water and then fill wíth tap ordistilled water to which 0.lt V/V hydrochloric acid and 40g/n3 mercuric chloride has been added. Allow to stand for2 days. Retain the fllling solution for reuse. Rinse thebottles once wÍth distilled water and store closed.
Unpreserved samples
9.3 Use either the acid cleaning procedure or the cleaning andsterilising procedure. The latter is like1y to give bettersample sEability, es¡recially in filtered samples. Discardany bottles not visually clean.
Preserved sa¡nples
9.4 tnpty bottles and rinse once with distilled water. Ifbottles are visually clean at this stage they are satisfac-tory for reuse. Store closed. If deposits are visibleeither discard tne Uottñfuse the acid cleaníng orcleaning and sterilising procedure.
READ SECTION 4 ON HAZARDS BEFORE STARTING THIS PROCEDURE
Step Þ<perimental Procedure Notes
10. I
Standard and Blank Solution
fnclude appropriate blanks andstandards wlth each batch ofsamples analysed. (See note a,and Section 11. )
Reagent blank
10.2 Add 0.4 mI of buffer/chlorinereagent to 10 nl of blank solutionin a sÈoppered test tube. Mix andstand for L hour before adding I mlof phenate/citrate reagent. SÈandfor lt hours.
(a) Blank and standard solutionsmust be similar Èo the samplesbeing analysed. For analysisof mercuric chloride - preservedand acidÍfied samples, the blankand standard solutlons musÈ con-tain the same concentrations ofnercuric chloride and acid. Uselow-am¡nonia sea water when seawaters are being analysed.
Water & soil miscellaneous publication no. 38 (1982)

À¡o,f/8
Colour development
I0.3 Place 10.0 + 0.1 ml aliquoÈs of samples,blanks and standards in test tubes.Remove and replace each stopperimmediately before and after alÍ-quotting Ínto each tube.
10. 4 For each aliquot, remove thestopper, add 1.0 + 0.I ml ofphenate/citrate rãagent., follov¡edínmedíately by 0.4 + 0.05 ml ofbuffer,/chtorine rea-gent. Replacethe sEopper and mix the tube contents immediaÈely after reagentaddition. Stand for ll¡ hours (note
Measure the absorbances of thereagent blank, blank, standard andsample solutions in a l0 nm cell atwavelength of 630 nm.
Calculation of results
b).
10.6 Subtract the blank absorbance fromeach absorbance for the standardsand plot a calibration curve ofnett absorbances against concentration
Subtract the reagent blankabsorbance (see 10.2) from eachsanple absorbance and readoff the csncentratíon corres¡nnd-ing to the nett sample absorbancefrom the calibration graph (10.6).
10. 7
The oolour, once developed isstable for at least 24 hours forunpreserved sanples. Withmercur lc chloride-preservedsamples, the cplour fades slowlyafter 2-3 hours in samples con-taining nore than 500 mg,/m3a¡rmonia nitrogen.
(b)
10. 5
11. CheckingLinearity oftheCal ibr aÈ ionCurve
The calibration curves for unpreserved solutions are generallyIinear. Periodically, a series of standards containing 0, 25,tOO, 250 and 1000 m9/n3 ¡¡tl3-l¡ should be used to check linearity.ff linear curves are obtained consistently standards containing100 and 1000 mglm3 r¡n3-l¡ for each batch of^sanples shouldsuffíce. ff concentrãtions below I00 mgl¡¡3 are of particularinterest, standards of 10 and I00 mg/m3 NH3-N should be used.
The calibration curves for mercuric chloride-preserved sanplesare quite often slightly non-linear, exhibiting a slight slopechange at about 100 mg/m3 NHg-N. If the curve is assumed to belinear and the líne is drawn through the higher concentrationpoints, errors of up to about 20t can arise at sample con-centrations of about 100 mg/m3 NH3-N. Use 0, 25r 50, I00, 250,500, 1000 ng/m3 standards wit.h eaóh batch, but if linear curvesare obtained consistently, the standard concentrations specifiedfor unpreserved samples may be used.
Water & soil miscellaneous publication no. 38 (1982)

À¡.rMl9
12. Change of Samples containing npre than 1000 mglm3 NH3-N should be dilutedConcentraLion with the sane water used for preparation of the blanks andRange of the standards in the batch, including any preservative. TheMethod absorbances for the diluted samples should be corrected to nett
absorbances by subtracting (x - 1)/x times the blank absorbanceand l/x times the reagent blank absorbance, where x is thedilution. The concentration in the diluted sample is then readfrqn the calibration curve (10.6) and the concentration in theoriginal sample is obtained by multiptying this by x.
13. References 1. Solarzano, L. (1969). Limnol. Oceanog. Le, 799.
2. Zadorojny, C, Saxton, S and Finger, R. (f973). J. WaterPollut. Control Fed. 45, 905.
3. Patton, C J and Crouch, S R. (1977). Anal. Chem. 49, 464.
4. Scheiner, D. (1976). l{ater Research l0r 3I.
Address for However thoroughly a meÈhod may be tested, there is always theCorrespon- possibility of a user discovering a hÍtherto unknown problem.dence users wÍÈh information on this method are requested to write to -
The DirectorWater and SoiI ConservationMinistry of Works and Develo¡xnentP O Box 12-041WELLINGTON Iü3RTH
ATTB{fION: Manager, !{ater Qua1ity, Research and Surveys
Water & soil miscellaneous publication no. 38 (1982)

Water & soil miscellaneous publication no. 38 (1982)

DETERMINATION OF BIOCHHVIICAI, OXYGEN DEMAND (NON¡
BOTTLE/INCUBÀTION METHOD - DESIGNED FOR USE WITH DTSSOLVED
OXYGEN II1ETER
( 1e81)
1. performance 1.I Substance Biodegradable substrate expressed as 9/m3Characteristics deÈermined BOD eguivalent. A disÈinction may be made
of the Method between carbonaceous and nitrogenousxygen de¡nand
L.2 Ilpe of sanple Freshwaters or rìrastewasters.
1.3 Basis of ltleasurement of oxygen depletion in aMethod sample over a 5 day incubation period at
20t in the dark.
I.4 Range of For an undiluted sample, and withoutApplication periodic re-aeration, the range is 0-7
g7m3 noo. The range is readity extendedby sanple dilution.
1.5 Standard Not determined.Deviation
1.5 Limit of Not determined.Detection
L.7 Interferences Chlorine, toxic wastes, high and low pH;oil, grease, elecÈrooxidisible gases. SeeSection 3.
1.8 Time Required Five days for incubation. Actual operatorfor analysis time is up to 15 minutes per sample
depending on pretreatment and proceduraloptions required plus about 10-20 mins toset up and calibrate the dissolved oxygen(DO) and p[I meters before and afterIncubation.
Water & soil miscellaneous publication no. 38 (1982)

BOD/2
2. Pr inoiple 2.L Carbonaceous anrl nitrogenous substrate is oxidised by bac-teria (either naturally present or introduced as a seed) inan airtight boÈtte, and dissolved oxygen contained in thesample iã consumed in the process. A measure is made of theoxygen consumed and this quantity is expressed as 97m3 eoo'
3. Interferences 3.1 Negative interferences Íe. subsÈances which ínhibit biolo-gical activitY.
4. Reagents
3.I.1 Chtorine Atlow the sample to stand in an open beakerf.or t7houESr with stirring, to allow the chlorineto dissiPate.
3.L.2 l,letals eg Copper above 0.01 9/m3' If presencesuspected, mininise possible inhibitory effects by
samPle dllutlon.
3.1.3 pH extrenes. rf the pH of the sample lies outside6-8 pH units then adjust to within thís range priorto incubation. Use 0.5M H2SO4 or It{ NaOII asnecessary.
3.2 Detergent traces in the BoD botÈIes. These may lead tofalseíy high BOD results. Remove by thorough rinsing prÍorto use.
3.3 Interference with the Do ^"t", due to high oil or greasecontent in Èhe sample, presence of electrooxidisible gases,and saline waters or waÈer havÍng a high ionic sÈrength.For further details refer to the ¡nethod for the deter-mination of Do bY meter.
All chemicals to be Laboratory Reagent Grade or better'solutíons to be prepared using copper-free distilled water.Discard solutions 4.1 to 4.6 if signs of biological growth appearduring storage.
4.1 Phosphate Buffer Solution. Dissolve 8'5 g ¡ntassiumdihyãrogen phosphals, KH2PO4r 2¡-.75 I dipotassium hydrogenpholphate, x2Heoa, 33.4 I disoaium hydrogen phosphateñeptãnyaratei najnñ4.7H2Ot and 1.7 g ammonium chloride'lln4Cf, in about 6OO ä3 ãistilled water and make up to 1000
nfl Ttre pH of this buffer should be 7.2 without furtheradjustment. Store in the dark aÈ room temperature'NB Storage at 4oC wíll cause crystallization'
4.2 Magnesium sulphate solution. Dissolve 22'5 g M9SO4 '7H7oin distilled water and make up to l-000 mI. store at 4oc.
4.3 Calcium Chloritle solution. Dissolve 27.5 g anhydrouscacL2 in distilled water and make up to 1000 ml. store at40C.
Water & soil miscellaneous publication no. 38 (1982)

BOD/3
4.4 Ferric chloride solution. Dissolve 0.25 I FeCl3.6H2O indistilled vtater and make uP to 1000 ml. Store at 4oc.
4.5 AIIyI-thiourea (ATU) solution - (nitrification ínhibitor).Dissolve 0.500 g a11y1-thiourea in 1000 ml distilled water.Add 0.3 ml per 300 ml BOD bottle only if nitrification inhi-bition is required.
4.6 Dilutíon Water
4.6.I Use disÈílled water which has a DO concentration of8-9 g/n3 (aerate or de-aerate as necessary by shakingdistilled water in a large container - half full -for several minutes, with the water at a temPeraturebetween 20o and 25oC).
I¡nnediately prior to use add 1.0 ml each of 4.I, 4.24.3 and 4.4 per liÈre of dÍstilled water.
NB 5 litre plastic containers are convenient forholding the dilution water.
4.7 Acid and alkali solutions (for neutralísation of sampleswhere necessary). Use 0.5M H2SO4 and Lt"1 NaOH solutionsrespecÈively.
4.8 Glucose - Glutamic Acid standard. Weigh ouÈ 0.150 g each ofglucose and glutamic acid which have been dried at 103oC forI hour. Ditute to 1000 ml with dÍstilled water in a volu-metric flask.
NOTE¡ The solution is unstable and should be prepared just priorto use. It is advantageous to have sealed vials of com-bined pre-weighed dry compounds at hand for instant use.
4.9 Seed
Use fresh effluent from a source where the bacteriologicalcontent is known to be high' but the BoD is less than 1000g/n3 e.g. meat works effluent, or suPernatant from sewagewhich has been allowed to settle f.or 24-36 hours.Especiatly adapted seed may be required for effluents whichcontain organíc matter not readily amenable to normal biolo-gical oxidation.
NOTE: A full discussion of seeding, its pur¡nse and applicationsis given in APHA(I).
5.I Incubation bottles' 300 ml glass bottles wÍth flared necksand ground glass stoppers. (DO or BOD bottles.)
5.2 Air incubator, thermostatically controlled at 2Oo+loc. Al1light should be excluded to PrevenÈ production of Do by pho-toslmthetic or ganisms.
5. Apparatus
Water & soil miscellaneous publication no. 38 (1982)

6. SampleCollection e
Preservation
Sample Pre-treatment
AnalyticalProcedure
BOD/4
5.3 Dissolved oxygen meter, with self stirring BOD probedesigned to fit in a 300 ml ÐD bottle.
5.4 pH meter
5.5 Parafilm sealing material.
Samples not requÍring dilution should be collected in clean BOD
bottles. If innediate processing ís not possible¡ samples shouldbe stored chilled to 4oC for not mre than 24 hours.
Refer Section 3 on Interferences before com¡nencing ÀnalyticalProcedure.
Itleally the DO coneentration of tbe sample prior to íncubationshould be beÈween 6.0 and 9.L g/n3 (oxygen saturation at 20oCincubation tenperature is 9.L g/nll while the D() concentrationafter 5 days iñcubation should not be less than 2.0 g/n3. Use
the following table as a guide to determine for each sample theparticular option to be followed t¡ ensure that these conditionsare met.
7.
8.
DirectIncubation
PriorDe-aeration
PriorAeration
Pr iorDilution
Known field DO > 6.0 but ( 9.1 > 9.1 ( 6.0 NA
AntícipatedBOD
< 7.2 at 9.1 DO(4at6.0DO
( 6.0 ( 6.0 ) 6.0
Notes Refer 8.3onwards
Initial DO shouldnot exceed 9.1g/m3 as excess Dowill diffuse out ofsolution duringincubatlon le afalsely high BOD
may be obtainedRefer 8.1 then 8.3onwards.
Set initial DO
to between 8-9g/n3
Refer 8.1 then8.3 onwards
Refer 8.2onwards
Water & soil miscellaneous publication no. 38 (1982)

BOD/5
Sfep Experimental Procedure Notes
8.1 De-aeratlon or Aeration: Pour (a)sufficíent sample (600 ml forduplicate analyses) lnto a 2 litreflaskr wârft to between 20o and 25aCand swirl the contents vigorouslyfor 30 seconds. Pour contents Ínto300 ¡nI BOD bottle.
Dilution Technique
8.2.1 Direct Dilution: Dis¡rense (b)desÍred quanÈity of sampleinto a 300 ml BOD boÈtleusing a measuring cylinderor a pipette with a wldebore tip. FiIl the BOD
bottle to the neck withdilution water.
8.2.2 Indirect DÍluÈion: Dispense (c)desired quantity of sample íntoa 1000 nl volumetric flask usinga measuring cylinder or a pipettewith a wide bore típ and make upto the nark with dilution water.Mix thoroughly and dispense intoa 300 ¡nl BOD bottle.
The DO concentration should nowbe between 8-9 g/n3.
Do not use direct dilutiontechnique for dilutions greaterthan 1 in 30 or where largeparÈicles are encounteredbecause representative sub-sampling may noÈ be achieved.
Large partieles nay be encoun-tered in the sample. If theseare to be included in theanalysis, as ar¡ aid torepresentaÈive subsampling theywill have to be broken down orproportionally present in thesubsanples. Breaking down maybe achieved by vÍgorous shakingof Èhe original sample or, lesssatisfactoríly, by maceratingusing a blender. Preferably alarge subsample (f00-200 ml)should be Èaken and diluted nomore than tenfold. It will nor-mally be found that thissolution, when shaken, is homo-geneous and further subsamplingwill pose no problem.
Prepare secondary or even ter-tiary dilutions, if required' toextend dilution range. No onedilution step should exceed I in50.
A number of flnal dilutionsshould be prepared to cover theexpected BOD range of the samPle
8.2
(d)
(e)
Water & soil miscellaneous publication no. 38 (1982)

Nitrification Inhibitíon: Ifinhibition ís required, then0.3 m1 of stock AtU solutíoneach 300 ¡nl BOD bottle.
(usually 3 dilutions foreffluenÈs) and it ís recorunendedthat for each dilution two BOD
bottles be fílled¡ i.ê.duplícates.
A rough guide for dÍlutions isas follows:
Heavily polluted receivingwaters - up to I in 10
Effluents eg Freezing works -Dairy factories - fro¡n I in 50to I ln 500
Verv strong vrastes eg Piggeryeffluent - greater Èhan I in 500
tf nitrogenous oxygen demand isto be calculated' then retain a
fraction of the sample for ammo-nía determination.
Seeding is only necessary forsamples depleted in ¡niero-organisms eg chlorinated sêvtâ9êrsamples having extreme pH orhigh temperaturê, or whereblanks and standards arerequired for Quality Controlpurposes.
The seed itself will exert a BoDand should be added at astrength estimated to consume0.5 - I.0 g/m3 Do ie seedsource nay require dilutionprior to injection into thesample bottle.
Seed Controls. To determine anactual seed correction value setup seed controls using the dilu-tíon technique (Section 8.2).Calculate the c.orrection valueas shown in Section 8.I0.
Blanks and Standards need onlYbe prepared if it is desired tocheck the quality of the dilu-
BOD/6
(g)ínjectinto
(f)
8.3
8.4 Seeding: If seeding is required, (h)then inject 1.0 ml of appropriaÈe seedmaterial into each 300 ml BOD bottle.Set up Seed Controls - see note (j).
(j)
Qualitv control B1anks and Standards
8.5.1 Blanks: Fill two BoD bottles (k)wíth ililution water.
( i)
8.s
tWater & soil miscellaneous publication no. 38 (1982)

8.6
BOD/7
8.5.2 Standards: Dispense 5.00 mIglucose-Slutamic acid solutioninto each of 3 BOD bottles.Add 1.0 nl of aPProPriate seedmaterial to each bottle and fillto the neck with dilution u¡aÈer'
(1)
Initiat DO Measurement: lleasure and (m)
neco-rd the-SlEial oo concentrationin each BOD bottle using a DO meterequipped with a self stirring BOD
probe.
Bottle Handlinq Procedure: Checkthat the bottles to be incubatedare free of traPPed air bubblesbefore replacing the toPs (taPthe sides of each bottle sharPlYwith the top to disloclge adheringair bubbles. Slope the bottle whiledoing this to facilitate movement ofthe air bubbles). Place a groundglass stopper gentlY into the neckof each bottle, ensuring that a
water seal is formed in the flaredneck of the bottle. Use distilledwater to make up small volume incre-ments if necessary. Cover the wholeneck of each bottle with parafiÙn toprevent evaporation of the water seal(otherwise atmospheric oxygen canrcreepr Past the stoPPer into thesample cturing incubation) .
tion water (eg for inhibitorYeffects) and the effecÈivenessof the seed. A BOD of. 220 + 20
g/n3 for the sLandards indica-tes satisfactorY Performance.
The blanks are not seeded as themeÈhod for determining Èhe
proper seed correction value isoutllned in note (i).
Allow DO meter 5 minutes vtarm uP
time before using. Checkcalibration Prior to, during andafÈer DO measurements to guardagainst meter drift.
If DO concentrations greaÈerthan 9.L g/n3 or less than 6.0g/m3 are encountered at thisstage ln any of the BOD bottles,then carry out de-aeration oraeration as dírecÈed in Section8.1.
To facilitate handling of largesample numbers and/or multiPledilutions, it is advisable tonumber the BOD bottles in a
recognisable order (with a
marker Pen) rather than recordthe original ingrained bottlenumbers. Also, a laboratorYworksheet should be constructedwhich records in adjacentcolumns the following: Briefsample site descriPtioni datecoltectedr field bottle iden-tification; fieldl DO; assignedBoD bottle number or indentifi-cation¡ procedural oPtion(whether aerated, dilutedrseeded etc); dilution factoriinítia1 DOi 5 daY Do; initiatminus 5 day DO¡ seed and/ordilution water correction valueiBOD, mean BOD (if rePlicateswere nade of one samPle at onedilution) i notês.
AIl light must be excluded fromthe incubator.
(n)
(o)8.7
Incubation procedure: Place bhe BOD (p)
ffibator for fivei lr days.
8.8
Water & soil miscellaneous publication no. 38 (1982)

BOD/8
5 davs DO measurement: After 5 + t (r)days incubation measure the DO con-centration in each BOD bottle usinga DO meter equipped with a selfstirring BOD probe.
A dark cupboard nay be used asan incubator providing that thetemperature range is not outside20 + 2%,.
Check the BOD bottles for bubblefornation under the stoppers.If all precautions have beentaken Èhen no bubbles should bepresent.
Allow DO meter 5 minutes to ltarmup before using. Check calibra-tion prior tor during and afterDO measurements to guard againstmeter drift.
Dilutíon-water blanks (ifincluded) should have a BOD notgreater than 0.2 g/n3 and thisfigure is not to be used Íncalculating BOD of dilutedsamples. If dilution waÈerbfanf is greater than 0.2 g/n3,proper correction for thíseffecÈ is difficult and allresults should be regarded assuspect.
llhere multiple dilutions havebeen employed accept the resultsof tt¡ose dilutions which haveconsumed at least 2.0 g/n3 aoand have at least 2.0 g/mJ ooremaining. If two or more setsof dílutÍons fall within theselimits, results should agree.If not, accept the dilutíon withconsr.unption nearest to 50t ofinitial DO.
If a'sample has become fullydepleÈed ln oxygen during ineu-bation and it is desired to gainsome idea of the fuII BOD, thenreaerate the sample (referSection 8.1) and incubate afurther 5 days. Check the DO
concentratlon daily and aerateagain if the Do concenÈrationfalls below 2.0 g/n3.
The cumulative results obtainedmay be an overesttimate of a 5
day BOD.
(s)
8.9
(s)
(r)
(u)
(v)
Water & soil miscellaneous publication no. 38 (1982)

I .10
BOD/9
Calculation of Results
8.10.1 BOD (Bottle):
(i) Without dilution or seeding (w)g7m3 aoo = Dr - D2.
(ii) WÍth dilutionr but withoutseeding grlm3 AOo =(D1 - D2) x DF (x)
(iii) with both dilutíon and seedingg,/m3 goP = (Dl - DZ - S/ors) x DF
whe re
DI = Inítial DO of sampleD2 = 5 daY Do of samPleDF = Dilution factorS = BOD of Seed lfaterial
calculated as in 8.10.I (ii)DFs is the seed dilution factor
usuallY = 300.
8.10.2 BoDl¡ru)
If nitrogenous oxygen demand issuppressed by addition of ATU and isto be included by calculation then
BoD (ATU) = BoD(BotrIe) + (4.33 x [wHa-Ht¡
AII concentrations expressed as g/m3.
The results obtained are termed5 day BODs (aoD5) if theY havebeen incubated for 5 daYs.
llean the results of duPlicates.
If reaeration has been requiredincubation the BOD equals thesun of the quantit,ies of oxYgenconsumed x dilution factor.
No proper incubation time can beassigned.
Ammonia exerts a nitrogenousoxygen dernand according to thereaction
NH4+ + 202 -l N3- + 2H+ + H2o
This reaction carried out bycertaÍn bacteria, is regarded asbeing complete under real(field) conditions, but willproceed to varying stages undercondítions of the BOD test. Itis recommended then that suchnitrogenous oxygen demand becompletely inhibited under testconditions and calculated fronrÈhe measured NH4-N concentrationin the sanple.
The factor for conversion ofNH4-N to oxygen demand frøt thestoichiometry of the aboveeguation is 64/u = 4.57 butconfirmatory experinents yield afigure 4.33, so lt is recorn-mended that NiÈrogenous OxygenDemand (NOD) be calculated asg/n3 tiþD = 4.33 x t¡tH¿-M.
(y)
Water & soil miscellaneous publication no. 38 (1982)

9. Sources of Error
Reference
Address forCorres¡nndence
BOD/I0
This flgure, when added to theexperimental BOD obt.ained whenniÈrogenous oxygen demand hasbeen lnhibÍtecl gives an estimateof the oxygen demand of the realwater systen.
For laboratorÍes unable toarrange for NH4-N analyses,nitrogenous oxygen demand shouldnot be tnhíbited.
(z) A figure of 0.5 g/n3 has beenquoted as a li¡nit below whichNH4-N need not be measured andNOD not be calculated. However,the ratio NH4-NþOD is morerelevant. Thus if NH4-NþoD)0.02 an underestimate of atleast lOt for total BOD may becaused by not determining NOD.
See sections on Interferences formost of the likely error sources.
The presence of decaying algae willcause BOD values to be high. Theerror due to Èhis source cannot bereadÍly estimated.
Sources of error inherent in theneasurement of DO are listed in themethod for dissolved oxygen bymembrane electrode.
APHA, Standard Methods for the Examination of Waterand Vlastewater, 14th Ed, 543-550, L976.
However thorougly a method may be tested, there is alwaysthe ¡nssibilíty of a user discovering a hitherto unknownproblem. Users with Ínformation on this method arerequested to wrÍte to:
The Director!{ater and SoiI ConservationItlinistry of Works and Develo¡mentP O Box 12-041WELLINETqI\¡ IIORTH
ATTENTION: Manager, lrlater Quallty, Research and Surveys
10. (r)
Water & soil miscellaneous publication no. 38 (1982)

APPE¡¡DIX
Nitrif ication Inhibitors
There are two chenicals suitable as nitrificaÈÍon inhibitors:
I. Allyl-thiourea. (ATU). Addition of thÍs conpound to the level of 0.5 mg,/1 inthe test solIEion wiII inhibit nitrificaÈion for 7-9 days. Altyl-thiourea issufficiently soluble to allow preparation of a stock solution of 0.5 S/t. Thismay then be added at 0.3 nI/SOO bot.tle to give the desired level of 0.5 mg,/l ínfiña1 solution. Alternatively dilution water nay be dosed with erU stock (0.5g/Ll at I nl,/litre of ditution water. If dilutions are less than x 10 furtherATU will need to be added to the BoD bottle.
Carbonaceous oxygen demand is not affected by the presence of AIU. This isconsistent with the fact that ATU is only slowly biodegradable and shows thatsuppression of nitrification does not alter the rate of metabolism of car-bonaceous naterÍaI.
ATU can interfere with the Alsterberg modificaÈion of the Winkler oxygentitration. ATU reacts with the sodium azide in the presence of acidified KI toliberate iodine. The effect is proportional to ATU concentraÈion and at thelevel of 0.5 ng/L ATU leads to an apparent increase in the level of dissolvedoxygen of 0.25 g/n3. This effect can be minimised by titration inunediatelyaflãr acidification to liberate iodine and by ensuring that ATU is added tosample used for measurement of initial dissolved oxygen. With the Pomeroy-Kirãchman-Nsterberg modification the possible error is reduced to a negligible0.07 g/n3.
ATU is manufacEured bY:
(I) Hopkins and Williams. Called Allyl thiourea (or thiosinamine)Cat. No.120400
(21 J T Baker. Called 1-Atlyl-2-thioureaCaÈ. No. 4562
(3) l,terck. Called N-AllylthíoureaCat. No. 808158
2. TCÞlP or 2-chloro-6- (trichloromethyl) pvridine
The recommended level of TCI{P is 10 mg,/I in the test solution and at this levelnitrification is inhibitect for up to 20 days. TC¡|P has the disadvantage ofbeing only slightly (and slowly) soluble - 40 ng/L in water at 20oC. Thisprecludes dosíng of test solution or ditution water with small volumes of a
concentrated stock solution. TCI"IP must therefore be weighed into BOD bottlesor into dilution water to give a level about l0 mg/l. DO l{OT DISSOLVE MATffi.IÀL
IN At¡ ORGN{IC SOLVENT to prepare a stock solution because the solvent may exertits ov¡n oxygen demand.
TCMP does not significantly affect carþnaceous oxygen demand.
TCMp - also known as N-Serve- is manufactured by the Dow Chemical Co. It ismarketed by the Hach Chemical Co. as rNitrification Inhibitor Formula 2533",Hach Cat. No. 2533. Iocal agents for Hach qre Selby-Wilton Scientific.
Water & soil miscellaneous publication no. 38 (1982)

Water & soil miscellaneous publication no. 38 (1982)

DETERT'IINATION OF CHEqICAÍ OXYGEN DEMÀND (COD) (1981)
t. Performance 1.1 Substances Almost all tlpes of organic compounds andCharacteristics determined inorganic reducing agenÈsof Èhe ltet.hod
L.2 I)pe of Fresh waters or nastewaÈerssample
1.3 BasÍs of Organic natter is oxidised by a hot nix-meÈhod ture of ehromic and sulphurie acids and
the excess dichromate deÈermlnedphotometr ically.
1.4 Range of Up to I00 g,/m3 coo.applfcation
1.5 Calibratlon Linear to 100 g,/m3 cop.curve
I.6 Standard COD SÈandard DeviationdeviaÈlon g/n3 g/n3
5 1.890 1.4
L.7 Límit of detecÈion 6 g/n3
r.8 sensitlvlty 10 grlm3 coD gives a drop in absorbanceof 0.020 aÈ 350 nm with a I cm cell.
1.9 Bfas No evidence of bias ín spÍke recoverytests.
1.10 Interferences See Section 3
1.11 Tirne required Typical e.nalysis time for 25 samples Ísfor analysis 4!¡ hours. crf which IN hours is operator
tlme, 2 hours Ís for the digestion stageand the samples are allowed to stand forI hour before thelr absorbance ls read.
l.12 \lr1ume required 3 ml for each determinationfor analysis
Water & soil miscellaneous publication no. 38 (1982)

2. Principle
3. Interferences
4. Hazards
5. Reagents
3.3
3.4
3.5
coD/2
Organic matter in a salçle is oxidised by a hot mixÈure of chro-mic and sulphuric acid, with silver sulphate as caÈa1yst. Theexcess dichromate is determined photometrically and the resultexpressed as the oxygen equivalent.
3.1 Traces of organlc material from the glassware or atmospheremay cause a gross positive error. Glassware should be con-díÈioned by lnit,ially washing with a hot chromic acld-sulphuric acid mixture, and thereafter with distilled waterlnunedlately prlor to each analysls.
3.2 Chloride is oxldised under these conditions and eontributesa positive interference. Tt¡is may be eliminated by theadditlon of H9SO4 in the ratlo of 10 ng H9SO4:I mg C1-: Inthis tnethod enough H9SO4 ls added to corçlex I00 g/mJ of.chlor Ide.
Nitrite exerts a posltive lnterference of 1.1 rg COD per mg
niÈriÈe-Nr and may be overcoÍìe by the addition of sulphamicacld (I0 ng/mS nlt.rite-N). Nitrite concentrations inpolluted waters rarely exceed L g/n3 and the possibility ofnftrit,e lnterference is usually ignored.
Interference due to sulphur compounds such as hydrogensulphide or sulphites nay be overcome by aerat,ing the samplebefore performing the analysis.
Cleanliness
This determinatíon ls especially susceptible to con-ta¡ninatlon by organic matter in the laboratory envÍronnent.The chromic acid mixÈure should be retalned in the flasksbetween deÈerminations, and then rinsed out wÍth distilledwater immediately prior Èo the next run.
High local telçeraÈures may be generated during the acid addítionstage with conseguent bumping of the reaeÈive mixture. Thesulphuric acid-sÍIver sulphate solution should therefore be addedslowlyr âDd the flask eontainÍng the reaction mixture swirledgently to ensure thorough nixing of the reagents before thedlgestfon stage.
5.I Water
The water used for blank deÈerminations and for preparingreagents and standard solutlons should have a COD less thanL g/nt. l{ater distilled from all glass apparatus iscufÈable. For aecurate determinations lees than 5 g/n3 Cooit ls advisable to use water distilled out of alkalinepotasslum pernanganate.
Water & soil miscellaneous publication no. 38 (1982)

6. Apparatus
coD/3
5.2 Potassium dÍchromate solution
Dissolve in distilled water L.2259 g potassium dichromate'primary standard grade, previously dried at l03oC for 2
hoursr ând dilute to 1000 ml with distÍlled water. See
Section 10.
5.3 Mercuric sulphate (Powdered)
5.4 Sulphuric acíd reagent
Adil 7.5 g of silver sulphate to 4 kg of sulphuric acid(d29 1.84) and allow 1-2 days for dissolution.
5.5 Potassium hydrogen phthalate (PHP) standard
Thís reagent is chosen as the standard material because itis quantitativelY oxidised:
2KHCgH404 + 2H+ + 1502 = 6H20+2K++I6CO2
A stock solution having a theoretical COD of 500 g/m3 ismade by dissolvinS 4?5.1 mg PHP in 1000 ml of disÈilledwater (havíng 40 g/nJ of mercuric chloride, aspreservative). Other standards are made by dituting thisstock solution, and nay also be preserved by the addiEion ofrnercuric chloride (aO g,/m3) .
5.6 2l n/V mercuric chloride preservative solution. Dissol-ve 2+
0.1 g mercuric chloride in 100 nt distilled water. May be
eonveniently stored ín a 100 ml plastic bottle with a 2 mlplastic syringe fitted into a hole in Èhe cap to act as
dispenser.
6.1 A UV - vÍsible spectrophotometer fitted with a I cm-pathIength sipper cell for dealing with large numbers ofsamples.
6.2 The digestion vessels are 50 ml volumetric flasks (withstoppers) made of heat resistant glass.
6.3 Digestion is carried out in an oven large enough to hold allthe digestion flasks.
6.4 Burette caps, made by cutting the ends off standard testÈubes.
6.5 Automatic dlspensers (eg Oxford Pipettor or NichiroAccupenser), two of 1.0-10.0 ml delivery for reagent addi-tion.
Water & soil miscellaneous publication no. 38 (1982)

coD/4
7. Sanp1e Sanples should be collected in acid washed glass boÈtles, ifCollecÈion ¡ posslbler ând preserved by the addltlon of ¡nercurlc chlorldePreservation (40 g/m3).
8. SanplePretreatment
9. Analytfcal Procedure
Unstable samples, or those with volaÈile conponents, should betested wlthout delayr and sanples containfng settleable solidsshould be honngenised or shaken sufficiently to allow represen-taÈlve sarçIing.
READ SECTION ¿ ON HAZARDS BEFORE STARTING THIS PROCEDURE
Step Exper imental Procedure Notes
9.r To each dlgestion flask add in Èhe (a)followlng order: 3 ml of salçle¡standard or distilled water blank,and then 3 mg of mercurlc sulphate.Àdd 2 ml of the potassium diehromatereagent by neans of a ealibrateddispenser, followed by approxinaÈely5-6 mI of the sulphuric aeÍd-silversulphate mixture, added slowlv (note a).
Diqestion staqe
Àfter the reagents are addedr the (b)unstoppered flasks are looselyfitted with buretÈe caps andplaced in a pre-heated oven at148+ 5oC for 2 hours. The flasksare then rerrcved from the oven, (c)cooled slowly Èo roon telçerature,and distilled waÈer added so thatthe final volume ln each flask is50 ml. The flasks are stoppered,shaken genÈly (note b) , and allowedto stand for at least I hour (note c).These solutlons are stable for atleast 30 days
9.2
9.3 Tt¡e absorbance of each supernatanÈ (d)solution ls neasured aÈ 350 nm (noÈed) and the unknown COD values obtainedby Interpolation from the llnearrelation between standardsr abgorbanceand COD (note e).
Considerable heat may be evolvedduring the dilution stage andcare should be taken to avoidbunplng of the solution.
In eone eases a slight turbiditymay be evidenÈ. This nay be dueeÍther to lnsoluble matter (suchas silica) or silver chloridefrom salçles having highchlor ide concentrations.
350 nm ls chosen because of thebroad naximum ln the dlchro¡rnteabsorption spectrum at thiswavelengÈhr and because of itsrelatively higher absorbltlvitythan the corunonly preferredmaxLmum of ¡140 n¡n. Because Cr(III) does not absorb aÈ 350 nm,a correction for this ion is notnecessary.
If the sarçlesubstanees ftto chi.ll theacid addiÈion
contalns volatilemay be necessary
flask during thestage.
Water & soil miscellaneous publication no. 38 (1982)
9.4
coD/s
Calculatlon of results
(t) CoD may be reail ilirectly from aplot of Absorbanee against g,/rn3
COD of stanilards. Thie plot shouldbe lLnear wlth a negatLve slope andthe intercept on the y (Absorbance)axis havLng a value very close tothe averaged absorbance value ofthe blanks.
(fi) Slnce the p)-ot of Absorbance (f)agal-nst g7m3 coo is linear, a
least squares flt of Absorbance(v) agal-nst g,/m3 coo (x) wlllgtve the equatlon of the IlneAs=Ab+KtCOD(g/m3)l
lrtrus coD( s/n3') = (o¡=i o")
where Às is the absorbance ofetandarils or samPles
A5 ls the lntercePt on Y
axls anct shoul¿l eloselYapproxÍmate the Absorbanceof the blanks. (Seetfon 10)
K ls the sloPe of the leastsquarea llne. (Sectlon 10)
(e) Beeause of the vl-seosity of theehromlc acldl solutions' theremay be some ml-xing of samPleswlthln the absorbance cell ofthe epeetroPhotometer. Thleproblem ls avoldect by lncreasLngthe apPlted vacuum of Èhe elPPercell andl bY eucking aLr throughthe cell between eamPles.
Most calculatore with therequired leasÈ squares facílitYwlll provLde values of x1 (coD)for lnput of y1 (As) after theeoefflclents of the straightll-ne (45, K) have been comPleted
10. Checklng theLinearityof theCallbratLoneurve
strlctly, this method does not requi-re the exact strengÈh ofpotassl.um dLehromate, nor the volume of lt adde<l to eachsampte, be known. However, potasslum dl-ehromate l-s a prJ'-mary st.an<lard and lf the soluÈlon eoneentratl-on Le known, a
useful eheek on spectrophotometer performance is obtal-ned.It ls crucl_al though that the amount added be the same foreach sample.
The callbratlon curve derl-veil fron the stanilards shouldalways be linear, and any devlatlon from llnearJ'ty or
Water & soil miscellaneous publication no. 38 (1982)

11.
'12.
13. Ref ere¡rces
Change ofConcentratlonRange of theMethod
Sources ofError
/\cl11¡ress fotîCorrespondence
coD/6
excesglve scatLerLng of resulte may Lndllcate organie eon-taml,ntlon or varlablono ln the amounto of reagento added.The reagents and procetiure deserLbed above (sectlon 5 and9.1-9.4) shoul<t ytelct a straLght llne havlng a elope andlntereept. of approx!.rnately -2.45x10⁻³ absorbance unJ-ts per9,/m3 and 0.330 abeorbance unl-ts (45) reepectlvely.
Samples havlng a COD greater than 100g,/m3 ean be aecom-moilated elther by cllluttng them or by l-ncreagl-ng thepotasslum dl-chromate concentratlon.
ContamLnatlon (note 3.1 and 5.1)
Tt¡e COD determlnatlon at levels below 20 g/n3 Ls par-tlcularly sensl"tl-ve to atmospherlc contamlnatl.on, and shouldbe carrl-ed out in an envlronment free of ll-kelycontamlnants, such as organlc Bolvent vapoura.
Because of the eensl-tlvLty of the method to the volumes ofreagents added and the dlgestion condltlons, a ne¡r callbra-tlon curve should be constructed for each batch of analyses
( 1 ) Canelll E, Mitchell D c and Pauge R !il, I{aterResearch, 10, 35 1-355 ( 1976) .
(21 APII¡\, Standard Methods for bhe Examinatlon of Waterand lVastewater, 14th Ed, 550-554,. 1976.
Ilowever thoroughly a metho<l may be tesheil . There ts alwaysthe possJ.billty of a user dl-scoverlng a hlÈherto unknownproblem. Users wlth lnformatlon on thls methoil arerequesÈ.etl Èo wrl,te to -
The Dlrectorllater and Sol-1 Conservatlonl1lnlsÈ.ry of l{orks anil DevelopmentP O Box 12-041WELLINGÎON NORTH
ÀTTENTION: Manager, Water QuallÈy, Research and Surveys
Water & soil miscellaneous publication no. 38 (1982)

DETERMINATIOIT OE' DISSOLVED O)ffGEN BY MEMBRANE ELEETRODE (1981)
1. Performanee I.1 Substance Dissolved o:rygen in g/m3Characteristlcs determlnedof the Method
L.2 rlpe of sample Fresh and saline natural waters, ândeffluents
1.3 Basis of Electro-reduction of dlssolved oxygen thatmethod has ¡nssed through a gas-IÞrmeable
nenbr ane.
1.4 Range of Typically up to 20 g/n3.appl lcaÈlon
1.5 Standard Dissolveddeviations o)rygen
(s,/m3)
0
510
Approximatestandard
deviation *(g/n3l
0.20.20.2
* Preliminary estlmates only
1.6 Limit of 0.5 g/n3 (prelÍminary estimaÈe only)detection
L.7 Bias Approximately +0.2 g/n2 over the rangeO-7 g/n3, and *0 .L g/m3 at 10 g/m3 whencom¡nred with a l{inkler deternination.
1.8 Interferences O11, grease, electreoxidlsable gases(see Section 3)
1.9 Analysis time About 20 mínutes to set-up and calibratethe lnsÈrunent, and thereafter about l-2mÍnutes per deter¡nÍnatlon.
Water & soil miscellaneous publication no. 38 (1982)

DO/2
2. Principle 2.L DÍssolved oxygen diffuses through a gas-permeable membraneand is reduced at a metal eleetrode in an electrolytemedium, in which silver/silver chlorÍde is the anode.
2.2 PotenÈlometric systems ¡neasure the e.m.f . produced by thereactlon, while polarographic sensor systems apply apolarlsing voltage and ¡neasure the resulting current,which is proportfonal to the dissolved oxygen activity.
3. Interferences 3.1 Wastewater havlng a high oil or grease content nay coatthe nenbrane and cause unreliable result,s.
3.2 Some electro-oxidisable gases, notably hydrogen sulphide'can reacÈ wlth the sÍlver anode and give rise to erroneousresults.
3.3 Saline vraters or waters having a high ionic strength havea "saltlng-out" effect. on dissolved oxygen. A correctionmusÈ be made if the instrument has been calibrated usingfresh water, either directly or by the air calibrationprocedure (see Section 7).
4. Apparatus 4.1 Dissolved oxygen meter, electrode and cable.
4.2 A separate stirrer may be necessary, where the sensor issome distance from the meter, or in a confined space.
4.3 For field use it is important, to have available a supplyof membranes and electrolyte solution, and tables ofsaturation dissolved oxygen concentraÈion variation withtemperature and salinity (appended to this ¡nethod).
4.4 Baromet,er, if accuracy requirements dictate pressurecorrections.
5. Sample 5.1 Where a surface sample is collecÈed for later analysis, itColleetion and should fÍrst be collected in a large bucket with as littlePreservation aeratlon as possible. The test water should then be
siphoned into the sample bottle, and at least two volurnesallowed to flush through before retaining the sample. Thesarnple should be preserved by the addiÈion of mercuriechloride (40 g/n3 final concenÈration), to inhibit miero-bial activity. The sample bottle should be nade of glassand not permiÈ aÍr to mix with or be lost from the sample(e.g. a 300 ml BoD bottle).
5.2 For deep-water sanples a depth-calibrated cable should be r
used, or alternatlvely, a sanple nay be collected using aspecial deep-water sampling boÈÈle and then siphoned fromthls into a tall-form beaker until two volumes have beendlsplaced. Care must be Èaken to minimise turbulence and- bubble formation.
Water & soil miscellaneous publication no. 38 (1982)

6. Choice ofInstrument
7. AnalyticalProcedure
6.1
Do/3
InstrumenÈs based on either the polarographic or thegalvanic principle work egually well¡ although the formeris rpre popular wÍth manufacturers.
For field use the lnstrument must be of rugged construc-tíon and, if possible, waÈer proof. It¡e sensor designshould make it easy to change nembranes and electrolytesoluÈlon in the field.
Automatic temperature compensation ls preferred to manualadjusÈment,.
6.2
6.3
Step Exper inental Procedure Notes
7.1
7-2
Prelininarv Testfnq of Apparatus
Ttre nreter thermometer rnode should becalibrated agalnst a standardlaboratory thermometer, over therange 0-30oc (note a).
The time taken to reach thermalequilibrium should be estimated byfirst placing the probe in ice-waterand then in water at 20oC, and notinghow long it takes to give a stabletemperature reading. The processshould be reversed, and an average ofthe two times used for esÈimatingthermal equilibrium in fieldsituations.
The Èlme taken to reaeh thermalequílibrium in air should beestimated by first placing the probein ice-water and then placing it ínwaÈer-saturated air at a temperaEureabove 10oC. Note how long it takesfor stable temperature and dlssolvedoxygen readings to be obtained. fhisinformatÍon is necessary to ensureaccuraÈe air callbratlons.
The instrument's response at lowlevels of dissolved oxygen can bemeasured by placing the sensor probein a saÈurated solutlon of sodiumsulphite and timing the response toequilibrium (note b).
(a) The temperature coefficient forsaÈurated solutions ís 0.24 g/n3per oc at l2oc, so that the meterthermometer should be accurateto +0.5oC.
(b) The manuals often do not statethe time taken to equilibrateat low levels of dissolvedoxygen, even though these areoften the concentrations ofgreaÈest interest.
7.3
7.4
Water & soil miscellaneous publication no. 38 (1982)

ñ/4
Calfbration
7.5 Three procedures are available : aír (c) For most situations, the aircalibration, alr saturated þrater cali- calibrat.ion procedure isbration and callbraÈion agalnst the reco¡nmended, so that air-VÍinkler procedure (note c).
Only the first two procedures aredescribed here.
Aír Calibration Procedure
7.6.I Set the instrument up accordíng to themanufacturer's instructÍonsr lncludingany zero or otÌ¡er adjustments.
7.6.2 Place the sensor in an atmosphere ofwater-saturated alr, such as a plasticbag containing a few drops of waterr andallow a period for temperatureequi libration.
7.6.3 Determine the air temperaÈure at theprobe using either the ¡neter temp-erature read-out or a Èhermometer.
7.6.4 If the npter does not provide auto-matic temperature cornpensaÈion, setthe temperature compensaÈlon controlto the Èemperature determined in 7.6.3.
7.6.5 When a stable DO readíng ls obtainedset the neter reading to the DO
saturation concentration approprÍateto the air temperature and pressuretand water salinity (see Secttön 7.9).If the percent saturaÈion npde is to beused, set the ¡rnter reading Èo I00t.
saturated water Èests andcomparisons between the ¡neterand Winkler resultg can be usedas analytlcal quallty conÈrol(AQC) checke, (see iAnalyÈicalQuallty Control Tests forDissolved o:<ygen AnalysIsi) .The only disadvantage with aircalibratlon appears to be therelatively slow temperatureequillbraElon of the probe lnair, conpared wlth water.Since calibration is normallyperformed before the electrodeis i¡nmersed in water fortneasurements, there is normallyadequate tlme for temperaÈureequilibratlon durÍng transport.
Water & soil miscellaneous publication no. 38 (1982)

Do/s
Air-saturated Water CalibratÍon Procedure
7 .7.L
7 .7.2
7.7.3
7 .1.4
7 .7.5
7 .7.6
7 .7.7
7 .7.8
7 .7.9
Set the ínstrument up according Èo themanufacturerts instructions, lncludingany zero or other adjustments.
Half fill each of two aPpropriately (d)sized botÈIes with taP water ornatural water (note d).
Shake both bottles vigorouslY forI-2 ninutes.
Replace the air above the water bY
pouring the contents of one bottleinto the other to fill itr thenpouring the eontents of the fullbotÈle back into the enPtY botÈleto fill Ít.
Divide the water equally between thetwo bottles and shake both again for2-3 minutes.
Immerse the Probe in the water deePenough for the ¡ræmbrane and therm-fstor Èo be fullY submerged, andcause a flow of the water Past themembrane by stirring gentlY withthe probe or bY some other neans.(Notes e and f) .
Measure the tenPerature of theshaken water using eit'her themeter temPerature read-out or a
thermometer.
If the ¡rcter does not Provideautomatic temPerature comPen-sation, set the temPeraturecompensatlon control to thetenperaÈure determined in 7.7.7.
When a sÈabte DO reading isobtained set the neter readingto the DO saturatlon concen-Èration aPProPriate to thebarometric Pressure, andcallbratlon water temPeratureand salinitY. (See Section 7.9).If the Percent saturation rPdels to be used set the ¡teterreading to 100t.
If necessarY add nPrcuricchlorÍde (409/ns HgCI2 finalconcentraÈ1on) Èo eliminate anybiologlcal uptake (high BoD) orrelease of oxYgen (heavy algalgrowth)
(e) In the field' it is oftenconvenient to Pour the shakenwater into a large beaker orsmall Ptastic bucket for thissteP.
(f) Ì¡þst manufaeturers recommenda stirring rate of about3Ocm/sec to avoid excessivelocal oxygen consumPtion, andconsequent low ¡neter readings.
Water & soil miscellaneous publication no. 38 (1982)

7.8.1
7.8.2
7.8.3
DO/6
MeasuremenÈ of Dissolved o:<vgen
Freshwaters
Inunerse the probe ln the waterdeep enough for the ne¡nbrane andthernisÈor to be fully submergedand cause a flow of water pastÈhe nembrane by gently stirrlngwith the probe or by sone otìerneans. (Note f).
If the neter does not provide auÈo-matic temperature compensation,neasure the water temperature andset the temperature conpensatloncontrol to this tenperature.
Note the DO reading when the neterreading stabllises. (Note g).
7 .8.4
Saline Waters
If dissolved oxygen ¡reasurementsare to be nade in salÍne orbrackish waters, the influenceof salinity on the solubtlftyof oxygen in water must beallowed for.
If the salinlÈy at all samplingpoints is known and does not varyby rnre than 2 g/kg, aír calfbrationmay be used and the ¡reter shouldbe set, to the DO saturatÍon con-centration for the known salfnity.
If the salinlty varies by nore than2 S/kS between samplfng ¡nints and isknown (e.9. by direct. in siÈusallnity measurements) and the DO
meEer has a sallnity conpensationcontrol, air calibraÈion nay beused, the neter befng set Èo thefreshwaster dissolved oxygensaturation value with thesallnlty control set Èo zero.
Alternatively, the rEter shouldbe set to the DO saturation valuecorresponding to the salfnltyconÈrol setÈing. At each slte
7.8. 5
Thls typically^takes 30 sec forvalues of Lg/nJ or greater andI-2 nln for lower levels.\ëry long equillbration periodsmay be required for levels belowL g/m3.
(s)
Water & soil miscellaneous publication no. 38 (1982)

7.8.6
Do/7
of DO neasurement, the salínityconÈrol ls set to the measuredsalinity, wiÈhout altering thecalibration.
If the salinity varies by rore (h)-than 2 g/kg ancl elther the reter hasno salfnity compensation c'ontrolor on-slÈe salinlty tneasurementsare noE avaÍlable, lt w111 usuallybe ¡nosE convenient to work wlththe neter in Èhe t saturationmode, the nreter being set to l00tln air. (NoÈe h) .
If on-slte salinfty measurementsare recorded or lf samples arecolleeted from each site for sub-seguent salinity deÈerninations,this salinity information can beused subsequently to convert thet saÈuration values to concen-tratlons lf required.
Selection of DO Saturation Concentrat,lonfor Calibrations.
Table I glves saturation concen- (f)trations for DO in fresh water andwater of varyíng sallníty, for anaÈmospheric pressure of I0l3milllbars. (Note l).
Atnrospheric pressure var iationscause saturaÈion concentrationsto faII below the values of1013 nillibars by up to about4t and rise aborre them by about21. Barometric pressure alsodecreases by about 12 nlllibarsfor each l00m increase Ln altítudeabor¡e sea level.
Use of the values aÈ 1013millfbars wÍthout correctlon forcalibratíon will cause neasuredDO values to be up to about 4thigh or 2t low (i.e: up to 0.40g,/m3 t¡ign at 10 s/m3 Do) at sealevel, and considerably greaÈererrors wllI result aÈ altltudesabor¡e 300m.
SaturaÈion eoncentratlons for DO canbe corrected for variations inatmospheric pressure uslng thefollowing equation:
Calculation of DC, concentrationsfrom $ eaÈuration readings alsorequlres neasurement andrecording of the tenPerature ateach slte and (for accuratework) neasurenent and recordingof baro¡reÈric pressure.
1013 mlllibars =101.3 kPa = 760nm Hg.Table I is based on an assess-ment by lgg1ss(3) of availabledata. Ttrls conpilaÈion has theadvantage of belng consisÈentwlth the current best estimateof oxygen solubility at zerosallnity. Solubilities aregiven to 2 declmal places forease of interpolatlonr resultsshould be given to I decfmalplace only.
7.9
Water & soil miscellaneous publication no. 38 (1982)

ñ/8
S = S'P/LDL3.]
where S = DO tn grlm3 at pressure p (nlllibars)
Sr = DO Ln g/¡3 at l0l3 mllllbars
P = atnospherlc pressure (mlUibars) attlme and place of callbratlon.
If errors up to about 4t are acceptable,the table values for 1013 mllllbarspressure can be used dlrectly forcallbraÈlon, although lt wlll beneeessary to correct for pressurechanges wlth altltude by uslng theabove equatlon wlth the value
P = (f013) - (0.12 x H) mlltibars
where H is èhe altltude ln netres.
For more aecurate work, the barometricpressure must be determlned at each timeof callbratlon and the eorrected satur-ation concentratlon calculated as above.
Calculat,ion of Results
7.10 Results are usually expressed as g/m3,or S saturatlon c.oncentratlon.
8. Sources of Error
8.1 Aeratlon of sample
Thls is the commonest source of error, and particular care should be takento mlnimise agÍtatlon of the sample or contact with afr, durlng samplecollectlon (see Sectlon 5). Care should be taken ln the collecÈlon of deepwaÈer samples or sanples aE lower than amblent Èemperatures, as degassÍngmay occur lf the Pressure is suddenly reduced or the temperature raised.
8.2 Gas bubbles under the membrane can lnterfere and glve erroneous readings.When a new membrane is lnstalled the probe should be connected and turnedon for 20-30 mfnutes to ensure that any dlssolved oxygen ln the electrolyteIs consuned, before lt ls used for any determÍnat,lons.
8.3 Low values wlll be recordecl if stlrrlng ls lnadequaÈe.
8.4 ResPonse wfll be slugglsh If the membrane ls clirty. It may be necessary tocarry a wash bottle containlng dist,llled water to wash the sensor membranetf ft has been l¡mersed in dlrty water.
Water & soil miscellaneous publication no. 38 (1982)

DO/9
9. Reference 1. Standard Methods for the ExaminaÈion of Water and lfastewater,APHA, 14th ed., 450-454 , L976.
2. Dissolved Oxygen in Natural and Waste l{ater, L979. UK DeparÈmentof the Environment/ttational Water Council Standing Comrnittee ofAnalysts HMSO London.
3. R F weiss, DeeP Sea Research !2, 72L, L970.
Address for However thoroughly a tethod may be tested, Èhere is always theCorrespon- posslbillty of a user dlscoveríng a hitherto unknown problem.denee Users with informatlon on this ¡nethod are requested to write to:
The Directorwater and Soll @nservationMinistry of Works and DeveloPmentP O Box L2-04LIÍELLINGTON NORlÏt
ATTEI.¡TION: t'lanager, Water Quality, Research and Surveys
Water & soil miscellaneous publication no. 38 (1982)
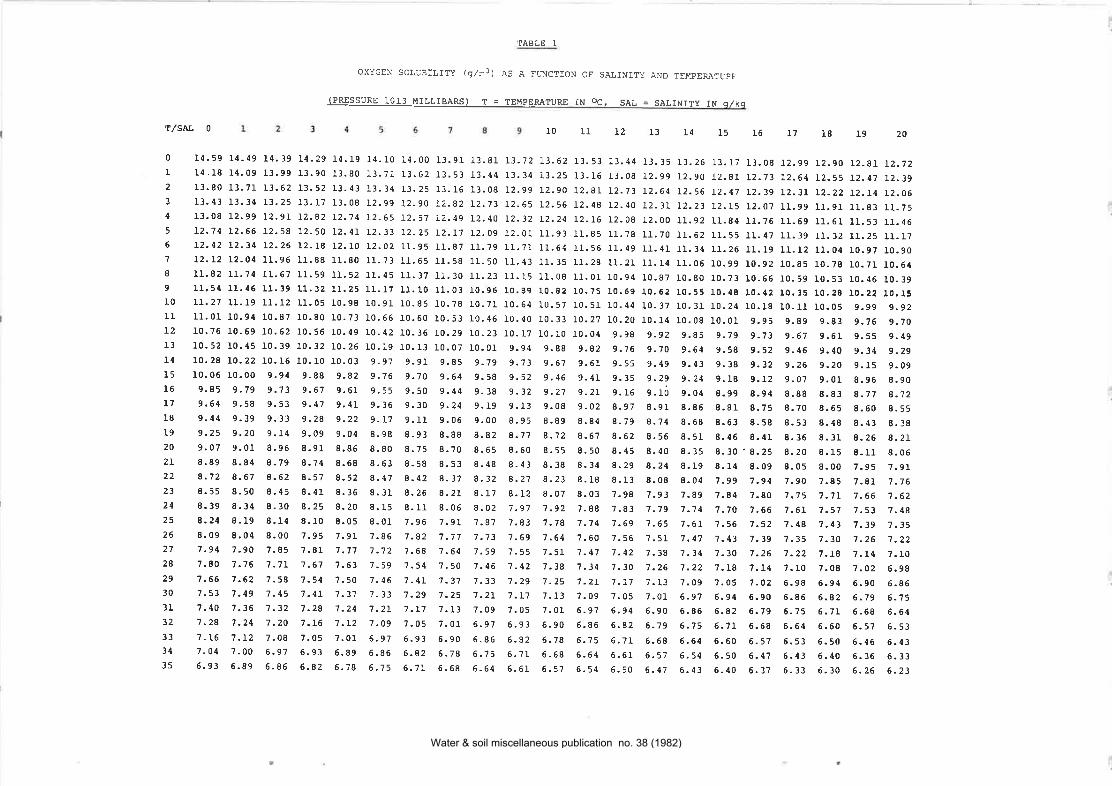
'TABLE I
OXYGEN SOIUBÍLITY (9/m3) Às À FUNCTIoI{ oF SAIINITY ÄND TEI!:PERÀTUPF
(PREssuRE r0r3 MTLLTBÀRS) T = TEMPERÀTURE IN oc, sÀL = sÀLtNrry IN a./kq
T/SN. 020I9I8I7I6I5L413L2IIIO
0
I2
3
4
5
6
7
I9
l0ITL2
I3I4I5l6L7
18
I920
2L
22
23
24
25
z6
27
28
29
30
3I32
33
34
35
14.59 L4-49 l4'39 L4-29 ]-4.19 14.10 14.00 13.9r J.3.8r L3-72 L3.62 13.53 13.44 t3.35 r1.26 13.t7 t3.08 r2.99 L2.sO L2.8r L2.72r4'18 r4.09 13.99 13.e0 13.80 r3.71 13.62 I3,53 13.44 r3.34 13.25 r3.r6 r3,08 12.99 r2.90 12.8t L2-73 L2.64 L2.5s L2.47 L2.3913.80 13.7L L3.62 13-s2 13.43 13.34 13.25 13.16 t3.08 L2.gg Lz.so L2.8L L2.73 L2.64 L2.56 L2.47 L2.39 L2.3L L2-22 L2.L4 L2.0613.43 13.34 L3.25 13.17 13-08 12-99 L2.90 12.82 L2.'13 L2.65 12.56 L2.48 L2.40 12.ll L2.23 L2.15 12.07 rr,99 tt.9t rr.83 11.7513.08 12.99 L2,9r L2-82 !2.74 L2.65 L2.57 L2-4s L2.40 L2.32 L2.24 L2.L6 L2.08 r2.OO rr.92 rt.84 1r.76 11.69 r1.6r rr.s3 1r.46L2-74 L2.66 12.58 L2-50 L2-41 l2-33 12-25 L2.17 12.09 r2.Ol r1.93 11.85 1r.78 tl.7o 1r.62 11.55 1r.47 rr.39 lL.l2 rr.25 rt.17L2-42 L2-34 L2.26 L2-r8 L2-LO L2-02 11.95 11.87 t1.79 rr.7t 1t-.64 r1.56 11.49 rr.41 rr.34 r1.26 11.19 11.12 lt.o4 r0.97 ro.9oL2-L2 L2-04 rr.96 rr.88 1r.80 rt.73 11.65 tr.58 ll.50 r1.43 11.35 rr.28 rr.2l r1.14 rl.06 r0.99 r0.92 10.85 lO-78 lO.7r r0.641r.82 11.74 lr-67 r1.59 lt.52 11.45 rr.37 rr.30 lr.z3 ll.I5 rr.o8 Ll.or 10.94 r0.87 10.80 10,73 r0.66 r0.59 r0.53 r0.46 t0.39r1.54 1r.46 11.39 11.32 11.25 11.17 rl.10 11.03 r0.96 t0.89 10.82 r0.75 10.69 r0.62 t0.55 10.48 10.42 10.35 lo,ZE r0.22 10.15I1.27 ll.19 1I.I2 lr-0s 10.98 r0.9r r0.85 10.78 to.7I I0.64 I0.57 r0.5I 10.44 I0.37 IO,3I r0.24 lO.I8 tO.rl lo.0s 9-g9 9.92lr.0l 10.94 l0-87 r0-80 10.73 r0.66 r0.60 t0.53 r0.46 10,40 10.33 r0.27 r0.20 10.14 r0.08 r0.01 9.95 9.89 9.83 9.76 g.7o10.76 r0-69 r0.62 r0.s6 r0.49 r0.42 10.36 r0.29 r0.23 ro.17 ro,ro r0.04 9.98 g.92 9.8s g.79 9.73 9.67 9,6r 9.55 9.4910.52 r0.45 10.19 r0-32 l0'26 ro.19 r0.13 10.07 10.01 9.94 9.88 g.82 9.76 g.7o g.64 9.58 g.52 9.46 9.40 9.34 9.2910.28 r0.22 LO-L6 l0-r0 10.03 9.97 9.91 9.85 g-79 9.73 9.67 9.6t 9.55 g.49 9.43 9.38 g.32 g.26 g.20 9.15 9.09l0'06 r0-00 9.94 9-88 9.82 9.76 9.70 9.64 9.s8 g.s2 9.46 9.41 9.35 g.29 g.24 9.18 g.L2 9.07 9.Or 8.96 8.909.85 9.79 9-13 9.67 9.Gr 9.55 9.50 9.44 9.38 g.32 g.2j g-2L 9.16 g.ró 9.04 8.99 8.94 8.gB B.B3 g-77 g.i29.64 9.58 9.s3 9.47 9,4L 9-36 9.30 9.24 9.19 9.t3 9.08 9.02 8.91 8.91 8.86 8.8t 8.75 8.70 8.65 8.60 8.559.44 9.39 9.33 9.28 9.22 9.17 9.rr 9.06 9.OO 8.95 8.89 8.84 8.7g 8.74 8.68 8.63 8_58 8.53 8.48 8.43 8.389-25 9.20 9.r4 9.09 9.04 8.98 8.93 8.88 8.82 8.77 8.12 8.67 8.62 8.56 8.51 8.46 8.41 8.36 8.31 g.26 8.219.07 9.01 8-96 8.91 8.85 8.80 8.75 8.70 8.65 8.60 8.55 8.sO 8.45 8.40 8.35 8.30.8.25 5.20 8.15 8-rr 8.068.89 8.84 B-79 A-74 8.68 8.63 8.58 8.s3 8.48 8.43 8.38 8.34 8.29 8.24 8.19 E.14 8.09 8.Os 8-oo 7.gs 7-sr8.72 8-67 8-62 8-s7 8.52 s.47 A-42 8.37 8.32 8.27 8.23 8.18 8.13 8-08 8.04 7.gg 7.s4 7.go 7.85 7.8r 7.768-55 8.50 8'4s 8-41 8.36 8.31 8.26 8.21 8.1? 8.12 8.07 8.03 7.98 7.93 7-89 7.A4 7.80 7.75 7.7L 7.66 7-628.39 8.34 8.30 8.25 8.20 8.15 8.lr 8.06 8.02 7.97 7.92 7.88 7.83 7.79 7.74 7.70 7.66 7.6L 7.57 7.53 7.488-24 8-19 8.14 8.r0 8.05 8.01 7-96 7.sL 1.87 7.83 7.78 7.74 7.6s 7.65 7.6L 7.56 7.52 7.4A 7.43 7.39 7.358-09 8.04 8.00 7.95 7.9L 7.86 7.82 7.77 7.73 7.69 7.64 7.60 7.56 7.s1 7.47 7.43 7.39 7.35 7.30 7.26 7.227-94 7-90 7.85 7.8r 7.77 1.72 1.68 7.64 7.59 7-55 7.51 7.47 7.42 7.38 7.14 7.30 7.26 7.22 7.18 7-L4 7.rO7.80 7-76 7.7L 7.67 7.63 7-59 7.54 7.sO 7.46 7.42 7.38 7.34 7.30 7.26 7.2? ?.r8 7.L4 7.lO 7.08 7.O2 6.987-66 7-62 7.58 7-54 7.50 7.46 7.41'1.37 ?.33 7.29 7.25 7-2L 7.t7 7.13 7.09 7.05 7-O2 6.98 6-s4 6.90 6.867-53 7.49 7-45 7.41 7.37 ?.33 7.29 7-25 7.2L 7.r7 7.13 7.Os 7.05 7.0r 6.s7 6.g4 6.90 6.86 6.A2 6.7g 6.157-,10 7.36 7.32 7.28 7-24 7.2L 7.L7 7.13 7.09 7.Os 7.Ol 6.97 6.g4 6.90 6.86 6.82 6.7g 6-75 5.7r 6_68 6.647-2A 7.24 7.20 7.16 7.L2 7.09 7,05 7.Or 6.97 6.93 6.90 6.86 6.52 6.7g 6.75 6.71 6.68 6.64 6.60 6.57 6.537'L6 7'L2 7-08 7'05 7.01 6.97 6-93 6.90 6.86 6-82 6.78 6.75 6.7L 6.58 6.64 6.60 6.57 6.53 6.50 5.46 6.¡t37-04 7.00 6.9-l 6.93 6.89 6.86 6.82 6.78 6.75 6.-tL 6.68 6.64 6.5r 6.57 6.54 6.50 6.47 6.43 6.40 6.36 6.336.93 6.89 6.86 6.82 6.78 6.75 6.7L 6.68 6-64 5.61 6.51 6.54 6.50 6.41 6.43 6.40 6.37 6.33 6.30 6.26 6-23
Water & soil miscellaneous publication no. 38 (1982)

f/sAL 2L 22 23 24 25 26 21 28 29 30 31 32 33 34 35 36 37 38 39 40
0 L2.64 L2.55 L2.47 L2.78 L2.30 L2-2r L2.L3 12.05 1I.97 11.88 1I.80 tI.72 1I.64 II.s6 1I.49 II.41 11.33 rI-25 lt.18 11.10
1 12.30 L2.22 12.L4 L2.05 II.97 r1.89 lI.8l II.73 rr.5s tI.57 rl.s0 1I.42 11.34 rI.26 1I.19 II.II 1l-04 10.96 10.89 l0-812 I1.98 rr.90 11.82 II.74 1r.66 11.58 tr.5r 1r.43 1r.35 1t.28 11.20 1r.I3 1r.05 10.98 r0.90 I0.83 r0.76 10.68 10.61 10.54
3 It.67 I1.60 II.52 LL.44 rt.37 11.29 Lr.2L lr.14 tI.07 r.0.99 10.92 10.85 10.77 r0.70 10.63 I0.55 I0.49 L0.42 I0.35 I0.284 11.38 I1.30 rr.23 I1.I5 It.08 ll.Ol t0.94 I0.86 r0.79 L0.72 I0.65 r0.58 10.5I 10.44 10.37 10.30 I0.23 10.17 10.10 I0.035 Ir.ro rt.o3 10.95 r0.88 to.8l 10.74 LO-67 r0.60 10.53 10.46 r0.39 r0.32 LO.26 10.19 r0.12 I0,05 9.99 9.92 9.86 9.79
6 10.81 10.76 I0.69 LO.62 lO.s5 10.48 lO.41 10.34 I0,28 r0-2L 10.14 I0.08 I0.01 9.95 9.88 9.82 9.75 9.69 9.63 9.56
7 I0.57 I0.50 rO-44 10.37 IO.3o 10.23 rO.17 lO,rO 10.04 9.97 9.91 9.84 9.7A 9.72 9.65 9.59 9.53 9-47 9.4L 9.34
8 I0.32 rO.25 lO.19 I0.13 lO.06 10.00 9.93 9-A7 9.81 9.74 9.68 9.62 9.56 9.49 9.43 9.3't 9-31 9.25 9.19 9.13
9 10.09 10.02 9.96 9.90 9.83 9-17 9.71 9.65 9.58 9.52 9.46 9.40 9.34 9-28 9.22 9.16 9-11 9.05 8.99 8.93
l0 9.86 9.80 9.74 9.67 9.61 9.s5 9.49 9-43 9.37 9.31 9.2s 9.19 9.14 9.08 9.02 8.96 8.91 8.8s 8.79 8.74
tI 9.64 9.58 9-52 9.46 9.40 9.34 9.28 9.22 9.17 9.II 9.0s 9.00 8.94 8.88 8.83 A.77 8.72 8-66 8.61 8.55
L2 9.43 9-37 9.31 9-26 9.20 9.14 9.08 9.03 8.97 8.9I 8.86 8.80 8.75 8.69 8.64 8.59 8.53 8.48 8.43 8-37
13 9-23 9.17 9.L2 9.06 9.00 8.9s 8.89 8.84 8.78 8.73 8.67 8.62 S-57 8.sl 8.46 8.41 8.36 8.30 8.25 8.20
t4 9. 03 8.98 8.92 8.87 8.8 r 8.76 8.71 8.65 8.60 8. s 5 8. 49 8 - 44 8. 39 8. 34 8.29 5.24 8. 19 8. 14 8.09 8.04
15 8.8s 8.79 8-74 8.69 8.63 8.58 8.53 8.48 8.43 8-37 8.32 8.27 8.22 8.17 8-L2 8.07 8.02 7.97 7.92 7.88
16 8.67 8-62 8.56 8.51 8.46 8.41 8.36 8.31 8.26 8.2L 8.16 8.11 8.06 8.01 7.96 7.9r 7.86 7.82 7.77 7.72
L7 8.49 8.44 8.39 8.34 8.29 8.24 8.19 8.14 8.09 8.05 8-00 7.95 7.90 7.85 7.8I 7.76 7.7L 7-67 7.62 7.57
l8 8.33 9.28 8.23 8.18 8.13 8.08 8.03 7.99 7.94 7-89 7.84 7,80 7.15 1.70 7-66 7.6L 7.57 7.52 7.44 7.43
t9 8.17 8.L2 8.07 8.02 7.97 7.93 7.88 7.83 7.79 7.74 1.69 7.65 7.60 7.56 7.5I 7.47 7.42 7-38 7.34 7.29
20 8.Or 7.96 7.92 1.87 7.82 7.78 7.73 7-69 7.64 7.60 7.55 7.51 7.46 7.42 7.38 7.33 7.29 7.25 7-20 7.16
2L 7.86 7.81 't.77 7.72 7.68 7.63 7-59 7.54 7.50 7.46 1.4L 1.37 7.33 7.28 7.24 7.20 7.16 7.11 7.07 7.03
22 7.72 7.67 7.63 ?.58 7-54 7.49 7.45 7.4L 7.36 7-32 7.28 1.24 7.19 7-15 7.11 7.07 7.03 6.99 6.95 6.9123 ?.58 7.53 1-49 7.45 7.40 7.36 7.32 7.27 7-23 7.19 7.15 7.rt 7.O7 7.03 6.99 6.95 6.91 6.87 6.83 6.79
24 7.44 7.40 7.35 7.3t 7.27 7.23 7-L9 7.Is 7.II 7-O7 7.O2 6.98. 6.94 6.91 6.57 6.83 6.79 6.75 6.7L 6.6'l25 7.31 7.27 7.23 7.18 7.I4 7.t0 7.06 7.02 6.98 6.94 6.90 6.86 6.83 6.79 6.15 5-71 6.67 6.63 5.60 6.56
26 7.18 7.L4 7.10 7.06 7-02 6,98 5.94 6.90 6.86 6.83 6.19 6.75 6.7t 6.67 6.63 6.60 6.56 6.52 6.49 6.4527 7.06 7.O2 6.98 6.94 6.90 5.86 6.82 6.79 6.75 6.7L 6.67 6,6¡1 6.60 6.56 6.53 6.49 6.45 6.42 6.38 6.3428 6.94 6.90 6.86 6.82 6.79 6.75 6.7L 6-67 6.64 6.60 6.s6 6.s3 6.49 6.45.6.42 6.38 6.35 6.31 6.28 6.2429 6-82 6.79 6.75 6.71 6-67 6.64 6.60 6.56 6.53 6.49 6.46 6.42 6.39 6.35 6.32 6.28 6.25 6.2L 6.18 6.1430 6.71 6.68 6.64 6.60 6-5't 6.53 6.49 6.46 6.42 6.39 6.3s 6.32 6.28 6.25 6.22 6.r8 6.15 6.rr 6.08 6.0531 6.60 6.57 6.53 6.50 6.46 6.43 6.39 6.36 6.32 6.29 6.25 6.22 6.r8 6.rs 6.12 6.08 6.05 6.02 5.99 5.9532 6.50 6.46 5.43 6.39 6.36 6.32 6.29 6.26 6.22 6.19 6.16 6.L2 6.09 6.06 6.OZ 5.99 5,96 5.93 5.89 5.8633 6.40 5.36 6.33 6.?9 6.26 6.23 6.19 6.16 6.13 6.09 6.06 6.03 6.00 s.96 5.93 5.90 5.87 s.84 5.81 5.7734 6.30 6.26 6.23 6.20 6.16 6.13 6.10 6.06 6.03 6.00 5.97 5.94 5.91 5.87 5.84 5.81 5.78 5.75 5.72 5.6935 6.20 6.r7 5.13 6.10 6.07 6.04 6.00 5.97 5.94 5.91 5.88 5.8s 5.82 5.79 5.16 5.73 5.70 5,66 5.63 5.61
Water & soil miscellaneous publication no. 38 (1982)

Water & soil miscellaneous publication no. 38 (1982)

DETER!{INATION OF NTTRÀTE AND NITRITE (1981)
Note: ThroughouÈ thie method nltrate and nLÈrlte are expressed as N
1. Perfornance 1.I Substance Nitrate and nltrlte nitrogenCharaeteristics deEerminedof the Method
L.2 Type of sample Ground and surface waters, effluents,brackish and seawaÈer.
1.3 Basls of Reduetlon of nitrate to nitrlte by passagemethod through a caönlum column. Nltrite ls then
determlned c.olorlmetrlcally by reactionwlth sulphanllamlde and N- (l-naphthyf) -ethylenedl amlne dihydrochlor i de.
I.4 Range of. Up to 500 mglm3applrcaEron
I.5 Calibration Linear to I50 mg/m3curve
1.6 Standard lIOr-N Standard Devlationdeviatlon (ms7*3) (mslm3)
25 0.5225 1.8
L.7 Llmit of I mgln3detecÈion
1.8 SensiÈlvlty 100 mg,/m3 lfoZ-N gives an absorbanee ofapproximately 0.35 ln a I0 mm cell.
1.9 Blas No evidence of blas ls spike recovery tests.
t. l0 Interferences See Section 3
I. ll Tlme requlred Àpproximately 60 samples plus blanks canfor analysis be analysed by a ctmpetent analyst per
day.
1.12 Volune reqlred 50 ml for each determlnatíonfor analysis
Water & soil miscellaneous publication no. 38 (1982)

2. Principle 2.r
3. Interferences 3.I
4. Hazards
2.3
Nrr/2
2.2
The nethod is basically that of Strickland and parsons (f)which was developed originally for use on sea-water. Thework of Nydahl (21 is useful in relating the behaviour ofthe reduction column to such factors as the ttpe of cadmiumused, its preparation, the ptl in the column, and the flowrate through it.
After addition of a¡r¡nonÍum chloride and sodium bicarbonate,the sanple is passed through the cadmium column. À mid-stream aliquot of the column effluent is collecÈed and thenitrite in the sample, plus that generated by reductíon ofnitrate, is reacted with sutphanilamide and thenN- (l-naphthyf)-ethylenedÍamine dihydrochloride (NÐD) . Theresulting red colour is measured spectrophoÈometrically.
The anrnonium chloride complexes cadmium sufficiently tominÍnise precipitation of cadmium salts in the column. Italso slovrs reduction of nitrite. sodium bicarbonaÈe buffersthe sanple to about pH 8.3, high enough to give reliablereduction over a range of flow-rates and low enough to mini-mise precipitation of cadmium salts.
Suspended solids in samples will gradually clog the columnand should be removed by filtration before analysis. Checkfilters to ensure that they do not add niÈrate to thefiltered samples (see "sampling of Surface l{atersr, yÍaterand Soil Technical Publication No. 2, p.I3).
Oil and grease will coat the surface of the cadmium.samples containing visible oits and grease must be extractedwith an organic solvent before analysis.
3.3 Sulphides up to at least 0.5 g/n3 do not interfere in theestimation of nitrate prus nitrite after copperised cadmiumreduction.
Strong oxidising or reducing agents at high concentrations(but as lovr as 0.06 g/mj for sulphide) interfere withnitrite estimations wiÈhout column reduction.
Cadmium is a toxic meEal. Care should be taken in handlingthe cadmiu¡n, especially in the sieving operatíon. Note thatthe effluent from the column contains cadmium, even when thesample being passed through it contains no nitrate (2). Tl.¡ecadmium is oxidised to a soluble form in reducing dissolvedo¡(ygen and nítrate in the sample.
Sulphanilamide: Toxic. Stains the hands.
N- (t-naphthyl) -ethylenedianine dihydrochtoride (NÐD) .CAUTION. Treat as though carcinogenic, although oneauthority states that nthere appears to be no evÍdence ofcarcinogenic activity" (3) .
3.2
3.4
4.1
4.2
4.3
Water & soil miscellaneous publication no. 38 (1982)

Nrr,/3
4.4 A1ways wash the hands thoroughly after nitrater/nitriteanalysis.
5. Reagents 5.1 Except where otherwise st,ated, analytical reagent grade che-micals are to be used. Reagents may be stored in eitherglass or polyethylene containers.
5.2 Water
Deionised or distilled water. The water may becone con-taminated with nitrate if there is heavy nitric acid use inthe room where the analysis is performed (eg digestions orglassware cleaning for heavy netal analysis). If the waÈersupply to the laboratory still is very high in nitrate,double distillation, or deionisation, may be necessary.SingIe distillatíon is ususally sufficient. The watershould be fed from the still directly into eg 5 litreplastic bottles and stored with the cap tight.
5.3 Cadmium
5.3.1 Use Merck 'coarse ¡nwder for reduction columnsn cad-mium (Cat. No. 2001) or equivalent. If planning touse any other type of cadmium first check with ananalyst experienced in this method. The size of thegranules and any impurities in the metal affect therate of reduction in the cplumn and hence the optimumcolumn size and flow rate.
5.3.2 IÈ is possible to use flakes of cadmium filed from asolid ball with a Surform plane. However, this isnot recomnended, because of the danger of inhalingcadmium dust and contaminating the workshop withcadmium. If this method is to be used, see referenceI for the preparation of the cadmium and for thecolumn dimensions.
5.4 2t n/Y copper sulphate pentahydrate:
DÍssolve I0 g copper sulphate pentahydrate in distilledwater and make up to 500 ml in a stoppered measuringcylinder.
5.5 5t v/v hydrochloric acid:
Add 5 mI hydrochloric acid (d20 1.I8) to 95 mI distilledwater and mix.
5.6 Ammonium chloride
5.6.1 Ammonium chloride solution: Weigh out I25 g ammoniumchloride and dilute to 500 ml. Add 2.5 g sodiumbicarbonate and dissolve. The reagent can be con-veniently made up in the bottle in which it is to bestored.
Water & soil miscellaneous publication no. 38 (1982)

5.7
5.8
NrT/4
5.6.2 Dilute a¡unonium chloride solution: Dilute 10 mlanunonium chlorÍde solution to 500 ml in a stopperedmeasuring cylinder.
Sulphanilamide soluÈion: Dissolve 5 g of sulphanilamÍde ina mixture of 50 ¡nl concentrated hydrochtoric acid (d2g 1.18)and about 300 mI distitled water. Dilute to 500 mI wÍthwater.
NEDD Solution: Dissolve 0.50 g N-(I-naphthyl)-ethylene-diamine dihydrochloride in 500 ml wat.er. Store in a darkbottle. Renew when a strong brown colouration develops.
5.9 Standard nitrate soÌutions:
5.9.1 Dry potassiun nitrate or sodium nitrate at 105-U0oCfor I hour. Dissolve 0.722 g of dry potassiumnítrate (or 0.606 g of dry sodium nitrate) indistilled water. Add 2 mL 2S m,/V mercuric chloridesolution and dilute to I lltre. I mI contains I00 ugof nitrate-nitrogen and the solution Ís stable.
5.9.2 Use stock to prepare working standards covering therange of concentrations of soutions to be passedthrough the colu¡nns. ff preserved with mercuricchloride (40 g/¡3¡, these workÍng standards will lastat least several months if care is taken not to con-taminate them. Keep tighÈty stoppered.
5.9.3 A suitable range of standards for routine use are 0('zero' nitrate standard), 100, 250, 350, 500g/m3 nitrate-N.
5.10 Standard nitrite soluÈÍons:
5.10.1 Dry sodium nitrite at 105-1I0oC for t hour. Dissolve0.493 g in distilled waCer. Add 2 mL 2l m,/V nercuricchloride solution and diluÈe to I litre. I ml con-tains I00 ug of nitrite-nitrogen. The solutionshould be prepared fresh every 2 nonths.
5.10.2 Use this stock to prepare working standards preservedas in Section 5.9. Preserved nitrite working stan-dards have a lífe of I week. Use the same nitrogenconcentrations as used in the nitrate standards(Section 5.9.3).
5.11 2t m,/v mercuric chloride solution: Dissolve 2 g mercuricchloride in 100 ¡nI distilled water. May convenientty bestored in a 100 ml plastic bottle with a 2 nl plasticsyringe fitted into a hole in the cap to act as a dispenser.
6.1 A spectrophotomeÈer able to operate at 543 nm with I0 ¡nnpath-length cells and meter or digital read-out.
6. Apparatus
Water & soil miscellaneous publication no. 38 (1982)

Nrr,/5
6.2 Special apparatus. Reduction column as illustrabed. The
geometry of this column design suits the Merck cadmium spe-óifie¿ (Section 5.3.f). Caûnium of a different size and,/orcomposition will require a different bed volume or flowrate.
7 . Sample 7.L Collect and store samples in plastic bottles that have been
corlection and thoroughly washed with 50t v'lv hyclrochloric acid'Preservation
7.2 Preserve samples with 40 grlm3 mercuric chloride' use 2 mr
2l n/v mercuric chloríde (section 5.11) per litre of sample.
8. Column Preparation
(READ SECTION 4 ON HAZARDS BEFORE BEGINNING TITIS SECTION)
Step Experimental Procedure Notes
This procedure is for PreParingapproximatelY 25 g of cadmium,sufficient for one reduction column.
g.l Sieve the cadmium granules and (a) A few pieces larger than 2 nun
collect the fracÈion passing through do no harmr but fine materiala sieve with 2 nrn openings but must be removed as it will clogretained on a sieve wÍth 0.5 nrn the column. Remember thatopenings (note a). cadmium is very toxic.
8.2 If there is any possibility of an oilfitn on the cadmium granules' coverthe granules with P troleum ether(BP 60-80oC) and agitate for a fewminutes. Drain off the petroleum etherand cover the granules with acetone.Drain off the acetone and rinse thegranules several Èimes with distilledwater.
g.3 Add sufficienÈ hydrochloric acid (b) Rinsing is complete when the pH
(5t V/v) to cover the cadmium and of the rinse water exceeds pH 4.
agitate gently f.or L'2 minutes.Drain off the acid and rinse severaltimes with distilled water agitatingwell (note b).
g.4 Stir the granules with I20 ml 2\ n/Y (c) See Section 8.5 before coÍmen-copper sulphate solution until the cÍng this step. Have theblue colour has almost teft the diluted an¡monium chloride readysolution and semi-colloidal copper so hat no time is wasted.particles begin to aPPear in theSupernatant liquid (note c).
Water & soil miscellaneous publication no. 38 (1982)

8.5
8.6
8.7
NrT,/6
fmmediately decant off the supernatanÈIiquid and wash the cadmiun well withdiluted anunonium chloride, syrirling toflush away any fines. Keep cadniumcovered with diluted anunonium chloride -iÈ can be left thus until required forcolumn f iUing.
Fit a snugly-fitting fine copper gauzedisc, or a plug of copper or glass wool,into the bottom of the column.
FiIl the c'olumn with diluted anunoniumchloride and add a slurry of the (d)granules in diluted arunonium chloridea little at a time, tapping the columnafter each addition (note d).Continue unÈil the column is filledto a depth of 0.2 sn below the levelof the outlet.
Flush the c.olumn with 50 nI aliquotsof diluted anunonir¡n chloride. 50 mlof solution should take 4-6 min toflow completely through the column.Either loosen column packing or restrictthe outleÈ to adjust the flow rate tothe correct range.
Secure the cadnium in the colunn byputting on top of the cadmium:
a tightly fitting copper gauze disca plug of glass woolsufficient glass beads (2.5 -3.5 nun dia.) to fiII thecolumn to about 0.5 sn abovethe level of the outlet (note e).
The colunn is complete, but will (f)reguire conditÍoning before use(Sections 9.L2 - 9.15). CondiÈion-ing involves passing a large volume(up to 5 liÈres) of diluted anrnoniumchloride Èhrough the cplumn (note f).
Although some authors statethat contact with air should beavoided, no special precautionsare necessary so long as thecaùnium is kept moist and no airbubbles are entrained in thecolumn. The cadmium level isbelow that of the outleÈ so thatthe colunn cannot run dry.
The glass beads are especiallyreccn¡mended for Èhis purposebecause they hold the cadnium inplace¡ minimise dead rrolumeabove the column, are readilywettabler ând do not trap airbubbles.
Before conditioning, thecadnium-copper surface is tooactive, and rapidly destroysnitrite by reduction. Con-ditioning with dilute anmoniumchloride partially passÍvatesthe surface of the granules, sothat nitraÈe is reduced tonitrite without significantover-reduction.
8.8
8.9 (e)
(a)or (b)or (c)
8.10
Water & soil miscellaneous publication no. 38 (1982)

8.11
Nrr/7
Regeneration of column
8.I1.1 After several rrcnths of usea column may shovr decreasingefficiency. The flov¡ rate wiIIhave decreasedr some of thecadmir¡n pieces will be coveredwith a white coatíng and therewill be visible breakdown ofthe cadmium to a fine sludge.
8.I1.2 To regenerate the cadmiumr emptythe granules from the column ontothe 0.5 nm sieve and wash awaY thefines. Keep the material retainedon the sieve and add sufficienÈcadmium to ensure that there issufficient to refill the column.then proceed from Sectíon 8.3 on.
9. Analytical Procedure
(READ SECTION 4 ON HAZARDS BtrORE STARTTNG ÎHIS PROCÐURE)
Step Exper imental Procedure Notes
Reduction and Colour Development (general procedurefor all solutions passed through column).
Add I ml amnonium chloride to a 50 mIsample or aliguot of standard. !fix.
9.r
9.2
9.3
9.4
Pour a few mI of solution to bereduced into the column reservoirand allow to run to waste (note g).
Pour remainder of solution into columnreservoir.
Allow 25-30 ml to run to waste and cpllectthe next 10 + 0.5 ml in a stoppered cylinderfor colour development. Stopper thecylinder.
Repeat steps 9.I - 9.4 for all solutionsto be reduced.
(g) This reduces ¡nixing of sampleswÍth the residue on top of thecolumn fron the last solutionpassed through it. There isalways sqne solution on top ofthe column because colurnn MUST
NOT be allowed to run dry.
9.5
Water & soil miscellaneous publication no. 38 (1982)

9.6
9.7
9.8
9.9
Nrr/8
Before finishing work for the day, flushthe colunn with 50 ml of diluÈed ammoniumchloride.
Within I hour of conpleting reduction, add0.2 nI sulphanilamide solution. Mix. Al1or¿to stand for 2-8 min.
Add 0.2 mI of NEDD solution and mix.
After 10 min - 2 hrs after completing 9.8,measure absorbance at the absorptionmaximum near 543 nm.
Colour development. without column reduction
Add 0.2 rnl of arrnonium chLoride solution to10 ml aliquots of solution and mix.
Develop colour as Ín Section 9.7 - 9.9.
Conditioning of Columns
New reduction columns perform poortyuntil a substantial volume of water haspassed through them (See Section B.I0).It ís convenient to use a standardsolution c.ontainÍng 0.1 - 0.5 g/m3nitrate-nitrogen so that the yield ofnitrite frqn the colunn can be easilychecked during the concliÈioning.
Prepare 5 litres of colunn-condiÈioningwater c.onÈaining O.l - 0.5 g/n3nitrate-nÍtrogen and 100 ml anunoniumchloride soluÈion.
Pass through the column continuouslyat a rate of about 10 nlr/min (aclrlp-feed reservoir is convenient) .Collect I0 ml alÍquoÈs of thecolumn effluent at half-hourlylntervals and develop colour asin sectlons 9.7 - 9.9.
Compare the absorbances obÈainedfor successíve cplr¡nn effluentaliquoÈs and cease conditioningwhen the absorbance increases byless than 2t over t hour.
. Do not begÍn
Reduce and develop colour (Sections9.7 - 9.91 in an aliquoÈ of
9. r0
9.1r
9.t2
9. t3
9 .14
9. r5
9 .16
Water & soil miscellaneous publication no. 38 (1982)

Nrr,/9
distilled water and a 0.25 g/n3nitr ite-nitrogen standard.
g.L7 Develop the colour without reduction(Sections 9.10 - 9.1I) in an aliquotof distilled water and a 0.25 9/n3nitr ite-nitrogen standard.
9.18 Subtract the absorbances for the (h) The nitrÍte standards must be
distilled water blank from that for fresh. If the nitrite standardthe nitrite standard in each case. has become partially oxidised toThis gives the net reduced nitrite nitrate, the reduced nitriteabsorbance (9.16) and the nett absorbance may exceed theunreduced nitrite absorbance (9.17). unreduced nitrite absorbance -If the nett reduced nitrite an apparent efficiency ofabsorbance ís greater than 95.0t greater than l00tlof the nett unreduced nitriteabsorbance, the column performanceis satisfactory - proceed toSection 9.20 (note h).
9.I9 If the nett reduced nitrite (i) This will not occur if theabsorbance is too low to satisfy correct amount of the specifiedthis críterion, remove sorne of the tlpe of cadmium is used at thecopperised cadmium from Lhe c.olumn specified flow rate.and repeat Section 9.16 onwards(note i).
g.2O Reduce and develop colour (Sections (j) After making up the nitraLe9.f - 9.9) in aliquots of distillecl standards keep sorne of thewater ("zero" standard - note j) and dilution water (at least twicea series of nitrate standards (at the volume of any nitrateleast 2 and preferably 3 or 4) standard) r preserve withspanning the concentration range mercuric chloride and keep as a
of interest. standard - 'zeron standard.
9.2L Develop colour without reduction(SecÈions 9.10 - 9.lf) in aliquotsof distilled water and a series ofnitrite standards containing the same
nitrogen concentrations as thenitrate solutions ín SecÈion 9.20.
9.22 For each series of solutions (9.20and 9.21) subtract the resPectivedistilled water blank ('zero' standard)from the absorbance for each standard.
9.23 Calculate the column efficiency for eachnitrate standard:-
nett absorbance for reduced nitrate standardColumn efficiency =
nett absorbance for unreduced nítrite standardx 100t
Water & soil miscellaneous publication no. 38 (1982)

9.24
9.25
9.26
9.27
9.28
9.29
NrT,/10
A good column gives an efficiency ofgreaÈer than 95t up to 0.25 g/n3nitrate N, and over 90t at 0.5 g/n3nitrate N. If the efficiencv fallsbelow about 93S at 0.25 9/m3 n or85t at 0.5 g/m3 N, Èhe column shouldbe reconditÍoned or replaced.
Construct a calibration eurve for eachcolumn by plotting the nett absorbãñFesfor the reduced standards againsÈ thenitrate concentr ations.
If sea or brackish waters are to be (k)analysed, a series of standards shouldbe prepared using lo¡-nitrate seawater or 0.5 !1 sodium chloridesolution to dilute the stock standardsolution, and the efficiency checkrepeated according Èo Sectíons 9.20 -9.23. The low-nitrate sea water orsodium chloride solution is thentreated as the 'zeron standard inSection 9.20 (note k).
If there is a significant differencein reduction efficiency between high-chloride and low-chloride standards,different calibration curves must beused, depending on sample saliniÈy.
If the column is to be used mainly forsea-water, it should be optimised(Section 9.6 - 9.I9) using sea waterrather than distilled water.
Analysis of Sanples
t¡itrite is seldom present in naturalwaters at significant concentraÈions.Therefore (nitrate plus nitrite)determinations generally approximateclosely to the nitrate concentrationand are adequate for most purposes.
DeterminaÈion of Nitrate plus NiÈrite
With each batch of samples analysed,include aÈ least one distllled waterblank and one nitrate standard at thehighest concentration of the workingrange for each column to be used. ftis useful to include an additionalniÈraÈe standard for each column, atthe expected upper limÍt of Èhe linear
This blank will be comparativelyhigh because of the nitrate inlop-nÍtrate sea water or in thesodíum chloride used to make up0.5 M sodium chlorides. However,this ext¡a c.ontribution cancel-sout when the saline nitrateblank is subtracted.
Water & soil miscellaneous publication no. 38 (1982)

9.30
9.3r
9.32
9.33
9. 34
9.3s
Nrr/II
reqion of the calibraÈion curve(250 g/nr') .
For large sample batches it is usefulalso to run one standard (Per colunn)mi&way through the batch and one atthe end of the batch.
If sqne samples reguire dilution,include an aliquot of dilution water(This will be used to calculate thesample dilutíon blank. See Section 9.47).
Reduce and develop the colour in all (f)samples, standards as above, andblanks (nzeron standard and sampledilution blank), noting which columnis used for each solution (note I).Use the procedure of Sections 9.I -9.8
Measure absorbance at 543 mm as isSection 9.9.
Subtraet the nitrate reagent blankand, if appropriate, the sanP1edilution blank, from the absorbancesfor all samples, and diluted samples(See Section 9.47 f.ot dilutioncalculation) .
Read off the nitrate- plus nitrite-niÈrogenconcentrations corresPonding to theresulting nett absorbances from thecalíbration curve for the column usedfor each solution.
Multiply the concentrations found fordiluted sample aliquots by the dilutionfactors, to give the nitrate- Plusnitrite-nitrogen concentrations in theundÍluted samPles.
At this stage, the analYst cansee whether the samPle dilutionblank is the same as the "zero'standard which t{as Prepared atthe same time as the sÈandardsand kept under identical con-ditions. After several monthsof using the method, the analYstcan get so¡ne feeling for thevariations in the nitrate c'on-tent of this dilution water - Ifthe quality of the dilutionwater renains constant, the ana-Iyst may decÍde simPlY to run a
distÍIled water blank on eachoccasion of use and assign thisvalue to bot,h nzero' standardand dilution blank, sosimplifying the calculation.
Water & soil miscellaneous publication no. 38 (1982)

9.36
9.37
9. 38
9. 39
9.40
9.41
9.42
NIT,/12
Determination of NitrÍte
Construct a calibration curve fornitrite using the nett absorbancesfor niÈrite standards obtained atSection 9.21 and 9.22.
With each batch of sanples include onealiquot of distilled water prepared asin Section 9.I0r âDd one nitrltestandard near the upper limit of theconcentration range of interest.
Prepare sanples and develop the colourin all samples, distilled water andstandard aliquots.
Subtract the absorbance obtained for thedistíIled water aliquot from eachstandard and sample absorbance. ff anysamples are coloured, subtract colour/turbidiÈy blanks also. Check that thenett absorbance for the standard iswiÈhín 2 percent of the appropriateabsorbance on the nitrite calibra!Íoncur ve.
Read off the nitrite-nitrogen croncen-tratíons for each sanple from thecalibration curve.
Calculation of nltrate-nitrogen
Subtract the nitrite-nitrogen foundfrom the nÍtrate- plus nitrite-nitrogenfor each sanple.
Blank corrections
The absorbances of the followÍngsolutions, with colour developed,are used to estinate the blanks usedabove:-
U : NitraÈe-free distí1Ied water,colour develo¡nd without reducÈion.
R : Nitrate-free dístilled water, colourdeveloped after reduction.
H : NÍtrate-free distilled water, as inU e R but ha!!-s'!reng!þ am¡noniumchtoride/sõãium Uicar ¡onate additionmade instead of full strengt.h. Colourdevelo¡æd after reduction as in R.
Water & soil miscellaneous publication no. 38 (1982)

9 .43
9.44
9.45
Nrr,/13
N : 'zero" nitrate standard (See Section5.9.3). Water use to prepare nitratestandards. Colour developed aftercolumn reduction. May be identicalto U.
hl : Sample dilution water. Colourdeveloped after colu¡nn reduction.
If Èhe same batch of reagents Ís usedtU remains constant. If the same waterand reagents are usedr R, N and l{ areidentical. UsualIY R and W will beídentical and, together with H, aredetermined using the distilled wateravailable on the daY of analYsis. N,the "zero" nitrate standard isdetermined by the quality of water onthe day when the sÈandards were made up.
'zero' nitrate standard : N
'zero" nitrite standard : U
Colour and turbidity blanks :
9.46 nitrate reagent blank : B
OnIy required for verY lownitrate/nitrite c.oncentrations or verydiscolouredr/turbid samples. Acidifyan aliquot of 50 mI samPle with 0.1 m
concentraÈed hydrochloric acid (dZO
1.I8) and measure absorbance at 543 nm.
Used to separate the contribution of thewater from that of the anmonium chloride/sodium bicarbonate reagent.
The centribution from nitrate in thereagent is
2(R - H)
therefore the total nitrate reagent blank:
B = U + 2(R - H)
This is the blank thaÈ is subtracted frontthe absorbances of all samples, while N
is Èhe blank subtracted frqn aII standards.
B) This is the absorbance of the sampledilution water W minus the contributíonfrom the ammoniu¡n chloride/sodÍumbicarbonate.
9.47 Sample dilution blank : (W -
Water & soil miscellaneous publication no. 38 (1982)

10. Checking theLinearÍt.yof theCal ibr ationCurve
L2. Sources ofError
11. Change of 11.1 The maximun concentration for undiluted samples is 500 mg/m3Concentration nitrate-nitrogen.Range of the[tethod 11.2 For samples above this concentration, dilution is necessary
to bring the sanple aliguot into the concent¡ation range ofthe method. The sample dilution must be recorded, and analiquot of the dilution water passed through the column togive Èhe dilution blank (Section 9.471.
NIT,/1{
Correct absorbances for dilutetl sample ali-guots by subtracting
x-1 (vr-B)x
Where X Ís the dilution factor
I0.1 The calibration curve is linear up to about 250 g/n3 N andand becomes progressively nore non-Iinear beyond this point.
I0.2 The non-linearity increases when the column begins to fail.
10.3 AÈ least one of the nitrate standards run in a particularbatch should be higher than any of the samples in Èhe batch.
12.I The nethod of calculation described in this nethod involvesconstructing a calibration line for each column which takesinto accounÈ the effÍciency of the column ie the yield ofnitrite obtained from tt¡e cplumn. During most of theworking Iife of the column, the calibration curve remainsthe same and does not need to be re-constructed on eachoccasion of use.
L2.2 one possible source of error is contamination of a sample inthe column by the residue of a previous sample, that had notbeen completely flushed through. It has been found in prac-tice that an absolute mini¡num oî. 2O ml of sanple must flowthrougÌr the column before ttle fO ml aliquot is collected foranalysis. Further, the maximum volume that should be letflo+¡ before collecting the l0 ml alÍquot is 30 mI, to ensurethat the sample/standard is flovring aÈ a nearly constantrate while the aliquot ís collected. Should the flow ratebe too slow (as near the end of the 50 ml) niÈrite will beexcessively reduced in the column. The anrmoniun chloride/sodium bicarbonate reagent concentrations haye been chosento allow as wide as possible a range of flow rates throughthe c.olumn, and the analyst may find that it is permÍssibleto allov¡ more than 30 ml to pass before collecting the I0 mlaliquot.
L2,3 If. the sanple volume must be less than 50 nl, so that suf-ficient sample cannot-Fused to flush out the columns, usethe following procedures:-
(a) Flush colums through with 30 ml dilute ammoniumchloride,/sodium bicarbonate solution (Section 5.6.2)to flush out prevÍous sample,/standard.
Water & soil miscellaneous publication no. 38 (1982)

13. Checking theAccuracy ofAnalyticalResults
14. References
Nrr/15
(b) Pour 30 ml of next sample into column, begincollecting inmediately, and collect the first 20 mlthrough the colunn (the absolute minimum volume ofsanple Èo use is 25 ml, collect'ing the fÍrst 20 ml).
(c) This procedure is less precise than the usual proce-dure using a 50 ml sample. Also, the column must beconpletely re-calibrated, using this method, with30 ml washes between standards. The special calibra-tion is necessary because the absorbances obtainedwÍth tþis procedure are substantially lcr¡er thanthose obtained with the standard procedure, becauseof the dilution of the sanple whÍIe in the column.
12.4 Analysts who are interested in the effects of differentflov¡-rates and different cadmiun surface preparaÈÍons shouldread reference (21. However, in examining Nydahlrs data,bear in mind that his data relate to freshly - preparedcolumns. Thus, his optimum flcn¡ rate for a copperised cad-mir¡n column is about four times that specified in this pre-sent method.
12.5 The presence of nitrate in the distilled water, and nitrateplus nitrite in the reagents has been allowed for in theblank calculation procedure.
13.1 The consistency of recoveries of nitrite from the column ischecked by the standard procedure described by running onestandard before a series of samplesr one after the series ofsamples, and one in the middle of the batch. If the stan-dard is accurate, Èhis procedure is a good guarantee ofr eproducibili ty.
13.2 IÈ is also useful to take a sample with concentration withinthe range of interest and Preserve a large volume of it sothat it can be analysed on every occasíon Èhat the column isused. The results are plotted on a quality control chart,which will ¡nonitor both the reproductibility of theanalysis, and the efficiency of the preservation procedureused.
(I) Strickland JDH, and Parsons, TD' "A Practical Handbook ofSeawater Analysisn Fisheries Research Board of Canada'Bulletin 167' 3ll ppr 1968.
(21 Nydahl, F, On tlre OpÈimum Conditions for the Reduction ofNitrate to Nitrite by Caùnium. Talantar 23r 349-357 (1976).
(3) Standing Co¡nmÍttee of Analysts to Review Standard methodsfor Quality Control of the Water Cyc1e, First RePort May1973-January L977. Standard Technical Committee reportsNo. 7. Depart¡nent of the Environment, London.
Water & soil miscellaneous publication no. 38 (1982)

Nrr/16
Address for However thoroughly a method may be tested, there is always ÈheCorres¡nndence possibility of a user dlscovering a hitherto unknorn problem.
Users with informatlon on this method are requested to wrlte to:
The DirectorWater andl Soil ConservationMinistry of liforks and Develo¡mentP O Box 12-04IT{ELIJINGTOI NORTH
ATTEIiITION: llanager, lrlaEer Quality, Research and Surveys
VJ
Water & soil miscellaneous publication no. 38 (1982)

plostic or gloss funnel
plostic jointing sleeve
lOmm groduoied pipettewith top constriclion rernoved.gloss beods, go.rze disc,copper wool or gloss wool.
liquid level must not droPbelow codmium level.
copperised codmium(- 7'Oml )
copper gouze disc, copperwool or gloss wool
| - 2 mm l. D. plostic tube
-
CADMIUM COLUMN FOR NITRATE REDUCTION
Water & soil miscellaneous publication no. 38 (1982)

Water & soil miscellaneous publication no. 38 (1982)

DETER¡,iINATION OE PIr (1981)
t. Performanee I.1 Determinand pfl (-logfg hydrogen ion activity)Characteristicsof the l,tethod
L.2 Ilrpe of sanple Most waÈer t14ns (see Section 3)
1.3 Basis of Glass electrode and pH meter!lethod
I.4 Range of pH 0-14 (see Section 3.3)application
1.5 Standard 19 New Zealand laboratories using glassdeviation electrode methods (but not identical with
that described here) obtalned thefollowing results in a collaborative studyusing slmthetic inaturali waters
Mean StandardValue Deviation
(ps units) (pH units)
7 .09 0. 147.35 0. rr
L.7 Interferences oil, greaser fatsr sulphide, sodiun ions(at high pH) (see Sectíon 3)
1.g Time required l0 ninutes for fult calibration 2-5 minu-for analysis tes ¡nr samP1e.
1.9 Volume required counonly field analysis. In laboratoryrfor analysis measurements in sanple botÈle ofEen
satisfactory.Otherwise, aPProx. 10 ¡nl or more
Water & soil miscellaneous publication no. 38 (1982)

PE/2
2. Principle A glass elecÈrode,/¡neter cqnbinaEÍon is calibrated using twobuffers, and the calibratlon and electrode performance arechecked in a third buffer and a dilute "natural water" buffer.
3. InÈerferences 3.1 OiI, grease or fats im¡nir ¡nrformance of the electrode bycoating the sensltive membrane. I{here these materials arepresent a satisfactory sub-sanple may be obtained bysiphonlng a small volume frcrn below the surface of aquiescent sanple.
3.2 Sulphide poisons the calcmel or silver/silver chloridereference electrodes. Special salt bridges are required formeasurements in the presence of sulphide.
3.3 At pn values above I0 many electrodes res¡nnd to alkalÍrnetal ions as well as the hydrogen ion. Electrode manufaeturers provide information on the appropriate correctionsand special low sodiun error electrodes are available forvery high pH measurernents.
4. Hazards Scrne of the solutions used are preserved with toxíc mercuricchloride. Consr.rnption of 10 ml of a preserved solutlon (40g¡n3 ugcL2) or 0.02 mI of preservative concentrate (21 n/v HgCl2)is equivalent to the W.H.O. Tolerable l{eekly Intake of 0.3 mgmercury. Reasonable carer particularly in washing hands beforeeatingr should be exercised.
5. Reagents AII reagents should be kept in ¡nlyethylene, ¡nlypropylene, poly-carbonate or ¡nlystyrene containers. Ànalytical reagent gradechemÍcals are suitable unless otÌ¡erwise stated.
Renew buffer solutions at intervals not greater than 2 monthsr orif any growths are observed in them. Renew the carbonate orphosphate buffers if rpre than 40 aliquots have been ¡nured frcntthe stock containerr or if Èhe contaíner is half ernpty.
5.1 PhÈhalate buffer (pE 4.00 at 20qC)
Díssolve 10.1 + 0.1 g of ¡ntassir.un hydrogen phthalate indistilled water, add 2 ml of 2l n/V mercuric chlorlde solu-tion a¡rd make up to 1000 + 5 ml.
5.2 Phosphate buffer (pH 6.88 at 20oC)
Dissolve 3.39 + 0.03 g of potassiun dlhydrogen ortho-phosphate, 3.53 + 0.03 g of di-sodiun hydrogen ortho-phosphate ln distilled water and make up to 1000 + 5 ml.
5.3 Carbonate buffer (pH 10.06 at 20cb)
Dissolve 2.09 + 0.02 g of sodit¡n hydrogen carbonate and 7.13+ 0.05 g of sodiun carbonate decahydrate in freshly boiledand c.ooled distÍlled water and make up to 1000 + 5 mI.
Water & soil miscellaneous publication no. 38 (1982)

PH/3
5.4 "Natural waÈer' buffer
Dissolve 0.084 + 0.001 I of sodiun hydrogen carbonate indistilled waterT add 2 mI of 2t n/V mercuric chloride and
0.15 + 0.0I g of ¡ntassir¡n brcmider and make up to 1000 + 5
mI.
5.5 2l n/v mercuric chloride preservative solutÍon
Dissolve 2 + O.l g mercuric chloride in 100 ¡nt distilledwater. May-be conveniently stored in a 100 mI plasticbottte with a 2 nI ptastic syringe fitted into a hole in thecap to act as dis¡nnser.
6. Apparatus 5.1 pH neterr glass electrode and reference electrode
ccrnbined glass/reference elecÈrodes are usually most con-venient and are referred to here as the nelectrode" 'Thernometerr 0-4OoC, graduated to loC.
Plastic bottle of 2-5 litre volume.
6.2 For laboratory determinations
Àpproximately 20 ml plastic beaker to contain sub-samplesduring measurements (oPtional) .
Approximately I0 ml plastlc beakers to contain buffersduring calibration.
6.3 For field determinations
plastic beaker of volume 200 ml or more, or plastic bucket,to contain samPle.
Sealable 1O-25 mI plastic containers for buffers'
sealable 100-200 mI plastic container for "natural Y¡ater'buffer.
Container to allow trans¡rort of electrode with the membrane
im¡nersed in water.
6.4 CleanlÍness
À11 contaÍners must be rinsed wlth distilled water im¡ne-
diately after use. Each buffer container should be reservedfor use wiÈh one buffer only. Great care must be exercisedto avoid transferring traces of buffer solution frcrn one
buffer to another, or to samples. The method includesrinsing steps to ¡ninimise this transfer'
should sample or buffer containers becqne visibly dirtyrthey may be washed with detergent¡ but should be rinsedthoroughly (5-6 times) with distilled waÈer before reuse.
Water & soil miscellaneous publication no. 38 (1982)

PH/4
7. Sample In general, samples should be collected by procedures suÍtableCollection & for determination of dissolved gases (see Section 5.1 ofPreservation reference 2).
For sampling$f surface waters, a bucket or beaker can usually be
used to collect a sample with little agitation and negligíbleaeration.
pH determlnaÈions should be c-onducted in the field whereverpossib1e.Ifsamp1esmustbetransferredtothe1aboratoryfor>analysis, the sample bottle should be filled cottpletely' andchilted Èo minimise biological activity. sanples should be
allowed to warm in the laboratory before analysis, to within 5oC
of their origínal temperature.
rf sulphides, ferrous or manganous ions are presenÈ, field analy-sis is essential. In general, these constÍÈuents wiII be presentonty íf the dissolved oxygen concenÈration Ís very low (e.9.below 2 g/n31.
8. AnalyÈical Procedure
Step Þ(perimental Procedure Notes
Handling and maintenance of electrodes
8.f lrûnerse the tip of the elctrode intrnatural water' buffer when not inuse or during trans¡nrt.
8.2 The filling port on t.he reference (a) FoIIow the electrodeelectrode reservoir must be open at manufacturerrs instructíonsall times wtren the electrode tip is about ccrnposition of theimmersed, and Ehe level of potassium Potassiun chloridechloride solution nust be above Ehe solution.level to whÍch the electrode islm¡nersed. Top up if necessary (notea).
8.3 Electrodes should not be wi¡nd withtissues or any ottrer material. Bufferor sarnple residues should be rinsed offthe electrode with a stream of dlstilledwater and large drops of distilled watershould be removed eíther by touchlng theelectrode tip gently to the containersider by gentle shaklng' or by touchingthe drop with a Èiaoue.
Water & soil miscellaneous publication no. 38 (1982)

8.4
PH/s
Calibratlon procedure
Bring the electrode and all buffersolutions Èo within 2oC of thetem¡ærature of the water to beexamined. In the field, this isdone mosÈ convenlently by placingthe electrode in the water body andinmersing L0-20 ml aliquots of thephosphate, earbonate and phthalatebuffers, a¡rd 100-120 mI of the"natural water" buffer in the waterbody in sealed containers.
Determine the temperature of thebuffers, ar¡d read Èhe true PE ofeach frcrn Figure 1.
If the meter has independent"TEMPERATURE" and TSLOPE' contTolsset the ITEIIiPERATUREi control to thebuffer temperaÈure.
If the meter has "fSOPH" control,set this c'ontrol to fÈI of Èhephosphate buffer.
Rinsewater
electrode with distilleclimmerse Èhe tip in phosphate
8.5
8.6
8.7
theand
8.8
8.9
buffer. Swirl the solution gently toremove residual distilled water frcrnthe electrode surface.
Allow Èhe electrode to stand in the (b)quiescent. solution until the meterreading has stabilised (note b) andthen adjust the "BUFFER AÀlusTì4ENT'|(or "CÀLIBRATE") control (seenote d) to set the meter reading (c)to the true buffer Ël (steP 8.5).
Rínse the electrode and place it lnthe carbonate buffer. Swirl thesolution gently and allow Èo stand.
When the meter reading has stabilised'adjust the "SLOPE' or ITEMPERATUREI
(if no I'SLOPEi) control to set thereading to the Èrue buffer PH.
Usualty occurs within 0.5-Ininute.
In some meters, e.g. TRIAC DP¡t-lthe "ISoPûri conErol should beregarded as the 'BUFFERAÀIUSTMENT (or ¡CÀLIBRATEI)
control.
I.r0
I .11
Water & soil miscellaneous publication no. 38 (1982)

PH/6
Check procedu-fg
8.1? Rinse the electrode and plaee it inthe phthalate buffer. Swirl thesolution gently and allow to stand.
8.13 Check thaÈ the stable neter reading (d) Failure to meeÈ this condftionis within 0.1 unit of Èhe true buffer indicaÈes unsatisfactorypH (note d) and recortl the reading electrode or meter ¡nrfornance,and Èhe buffer temperature (note e). or íncorrect buffer preparation. ,
(e) This provides a record for ana-lytical quality assurance. (seeSectÍon 10. )
8.14 Fill a 2-5 L plastic bottle with tap (f) If the alkalÍnity exceeds 100or natural water of pH in the range g,/m3 as H@3-, the pH should be7.5-9.5 (note f, 91. In the open in the range 9.2-9.5.air (outside buildings), carefullypour the water out of Èhe bottte in (g) If necessary, adjust the pH witha snpoth flowr avoiding bubblíng in 5t m,/v sodit¡n hydroxÍdethe neck. Shake out ¡nost adhering solutÍon.waÈer droplets and cap the bottlenote h) . (h) Do r¡ot breath into or near the
o¡nn bottle.
8.I5 Pour 100-120 nI of "natural water'buffer inÈo the bottle, cap and shakevigorously for 2 mínutes.
8.16 Pour the "natural nater' buffer intoa plasÈic beaker or back into thecontainer used aÈ step 8.4r andrepeaE steps 8.I4 and 8.15 using thesame rnatural water" buffer aliquoÈ.
8.L7 Rinse the electrode thoroughly torenove any traces of concentraÈedbuffer solution, and place it in theair equilibrated trnatural wateri buffer.Swirl the solution and allow to stand.
8.I8 l{hen the meter reading has stablished (i) StabilisaÈion may Èake a few(note i), snirl the solution again minutes. Streaning ¡ntenÈiaI,and allow to stand. Repeat this pro- resulting frqn move¡nent ofcedure until successÍve meÈer readings solution past the elecÈrode will
À
are wíthin 0.05 unit. ccrnmonly decrease the pH readingby up to 0.2 unit.
8.19 Cheek that the sÈable meter readÍng (j) Fallure to meet this conditionls within 0.I5 unit of the pH read Índicates unsaÈisfactoryfrcm Figure I (note j) and record electrode performance.the reading and temperature (note k).
Water & soil miscellaneous publication no. 38 (1982)

PH/7
(k)
pH measurements
8.20 Rinse the electrode and place it (1)either in a samPle aliquot in aplastic beaker (notes t, m) or directlyin the sample bottle. Swirl thesanple and allow to stand.
(m)
Analytical quality assurancer ecord.
In the field' a samPle must be
rernoved frqn the water bodY toensure that measurements aremade under quiescenÈ condítions.
The alÍquot for pH measurenentshould be the first taken frqnthe bottler and care must betaken Èo avoid aeration.
Nunerous repetitlons will eausepH changes resulting frcrn carbondioxide loss or gain, for somesamples.
I .21
8.22
8.23
8.24
8.25
8 .26
I .27
llhen the meter reading has (n)stabilisedr swirl the solution againand allow to stand. Repeat this pro-cedure until successive meter readingsare wÍÈhin 0.05 unit (note n) .
Record the stable reading.
pH measurements at dÍfferent temperatures
rf sample temperatures are within 5oCof the calibration tem¡reraÈure,measurements following steps 8.2O-8 -22witl give values with systematic errorsof less than + 0.05 unit ín Èhe pH range4 -10.
If sample temperatures differ frcrnthe calibration tem¡ærature by more than5oC, the change in electrode resPonsewith temperature change must be com-pensated, and the accuracy of the ccrn-pensaEion shoutd be checkedr followingsteps 8.25-29.
Bring the electrode and PhosPhate,carbonate and phthalate buffers towithin 2oC of the tem¡nrature of thenew sample.
Read the true pH of the buffers atthe new temperaÈure frcrn Figure I.
Adjust the iTEMPERATUREI control tothe new temperaÈure (If the calibra-tion temperature at SteP 8.6 was theoriginal sett.ing) or change the setting
Water & soil miscellaneous publication no. 38 (1982)

I .28
8.29
PH/8
by the sane Émount as the dífferencebetween the new sample tem¡nrature andthe calibration temperature.
Read and record the pH and temperaÈurefor each of the phosphater carbonateand phthalate buffers, follovring theprocedure of sÈeps 8.12 ancl 8.13.
If the pH reading is wíthin 0.1 unit (o)for each of the buffers, proceed withpH measurements follovring steps 8.20-8.22 (note o).
If experience shows that the'TEì¡IPERATURE' control gives con-sistently accur ate cun¡nnsation'steps 8.24-8.29 need be repeatedonly at relaÈively infrequentintervals (say monthly). Innormal o¡nrations, ten¡nratureccrn¡nnsatÍon of electroderesponse is then undertakenfollonÍng step 8.27.
9. Sources ofError
10. AnalyticalQualÍ tyAssurance
I1. References
Gradual deterioration of glass elecÈrode membranes leads to slowand decreased voltage changes for any ¡nrtieular pII change. SIowresponse problems appear fírst ín measurements in waters of lowionic strength and buffer capacity, such as naÈural waÈers. IfappropriaÈe res¡nnses are obtained after reasonably short t,imesin both the phthalate buffer and nnatural water" buffer checks,there is a good assurance of the absence of eleetrode deteriora-tion proble¡ns. Fouling of the electrode by oils, fats, etc, maycause rapid deterioration of performance. If c.ontaninated watersare being exanined, the pH of air equllibrated nnatural water"buffer should be measured at intervals throughout the analyticalrun as a check on fouling.
A quality control chart should be prepared by plotting thedeviations of Èhe acÈual readings obtained at steps 8.13 and 8.19frcm the corresponding expected pH values. Where calibration andmeasurernents are performed at temperatues differÍng by more than59C, a record of the actual readings obtained at step 8.28 shouldbe cunpared with the corres¡nnding expected pH values.
(1) Barnes I.r Field Measurement of Alkalinity and pH. U.S.Geological Survey l{ater-Supply Paper 1535-H. Unitecl StatesGovernment Printing Office, Washington, 1964.
(21 Kingsford, M., Neilsen, if. S., Pritchard, A. D. andStevenson, C. D., Satnpling of Surface Waters. tfater andSoiI Tecbnical Publication No. 2. Water and SoíI DivÍsion,Ministry of t{orks and Develo¡rnent' L977 .
Water & soil miscellaneous publication no. 38 (1982)

_4t
PH/9
Address for llowever Èhorougttly a meÈhod may be tested, there ls always theCorres¡nndence ¡nsslbillty of a user diseoverlng a hitherto unknown problern.
Users with informatlon on Èhis method are requested to nrite to -
The DirectorTfater and Soll ConservatLonMinístry of lforks and Develo¡mentP O Box 12-041T|ELLINGTON NORTH
ÀTTE{TION: Manager¡ filaÈer Quality, Research and Surveys
Water & soil miscellaneous publication no. 38 (1982)

7.O
ã o.e
8-8
olo 20Temperalure oC
PHOSPHATE BUFFER
10.3
10.2
E 10.1ê
10.0
e.ó
0 ro 20Temperature oC
CARBONATE BUFFER
o102030Temperalure oC
PHTHALATE BUFFER
8.4
8.3
Eo8.2
8.1
oro2030Tomperature oG
.NATURAL WATER' BUFFER
.4.t
ã /t-o
3.9
F¡GURE 1
VARIATION OF BUFFER pH WITH TEMPERATUREWater & soil miscellaneous publication no. 38 (1982)

DETERI,IINATION OF REÀCTTVE DISSOLVED PHOSPHORUS (RDP) (1981)
1. PerformancesChar acte ri st i csof the ltethod
1.1 Substancedetermined
Reactive dissolved phosphorus i.e. ortho-phosphate plus all forms of phosphorus thatare hydrotysed to orthophosphate under theconditions of the test. Results areex¡rressed in terms of. g/m3 v.
L.2 fype of sanple Ground and surface waters, effluents,seawater.
1.3 Basis of method orthophosphaÈe reacts with molybdate underacid conditions to form phosphomolybdaÈewhich is reduced to Èhe intensely bluenmolybdenum blue" by ascorbic acid withantimony.
A prelimÍnary thiosulphate reduction stepeIíminates interference by arsenic byreducing it to the trivalent state. TheÈhiosulphate also conplexes ltlêrcur!renabling mercuric chloride to be used as asample preservative.
I.4 Range ofapplication
Up to 4 g/n3
1.5 CalibrationCurve
Straiqht line to at least q s/n3' rnþractÍce the upper linit of [.he method isdetermined by thespectrophotcrneter
performance of theat high absorbances.
1.6 Standarddeviation
P (mg,/m3)
5
100
Standard Deviation (mg/m3)
0.2 (a)0.7 (a)
504s0
2 (b)s (b)
(a) Using I00 mm cells(b) Using l0 mm cells
The pairs of results are from separatelaboratories.
L.7 Limit ofde tection
0.4 ng/m3 with 100 nm cells
Water & soil miscellaneous publication no. 38 (1982)

1.8 Sensitivlty
HDP/2
40 g/n3 gives an0.160 in a 100 mm
880 n¡n) .
absorbance of approxlmatelYcell at 710 run (0.24 at
1.9 Blas No evldence of blas ln spike recovery test's.
1.10 Interferences Sillca gives a(Sectlon 3. I) .g/m3 As and atSectlon 10.5).
small posÍtlve lnterferenceThe nethod tolerates I
Ieast 400 g/n3 H9C12 (See
1.11 Tfne foranalys ls
l. 12 Volune requiredfor analysls
The total analytlcal a¡rtt operator tlmes arethe same except for the acld soaklng. AItanalytical apparatus that comes lnto contactwith the sample or llquid reagents (flasks,bottlesr beakers, plpettes etc) must bethoroughly acid-soaked. This adds con-siderably to the Eime required to set-up theanalysis, but adds liÈtle to operator Èimewhen the analysls ls performed on subseguenÈoccasions if apparatus is set aside Per-manently for thís analysis. À good o¡nratorshould be able to ¡nrform at least 60 deter-minations in a working day using procedure(A) wíth a I0 mm cell.
Depends on procedure adopted for colourdevelo¡rnent (see Sectlon 8.3). Normally Iml and 40 ml per determlnaÈion using a 10 ¡nm
cell and 100 ¡rm cell respecElvely. 100 mlis requlred for the extractlon procedure.
2. Princlple 2.L The method is baslcally that of Murphy e Riley (1) with theaddition of a prelimlnary reductlon step first suggested byvan Schouwenburg and l{alinga (2') .
2.2 Molybdate reacts rather slowly with ¡nntavalent arsenic toproduce an arsenomolybdater whlch is reduced by ascorbicacid to produce a blue product, similar to that producedfron phosphorus. Thls interference is removed in the pre-sent method by using a reductant of acidifÍed sodir¡mthlosulphate to reduce all pentavalent arsenlc to theunreactive trivalent form. The thiosulphate is itselfunstable in acid solutionr tendlng to disproportlonate tosulphur and sulphur dioxide. Thls side reaction Issuppresaed by the adctÍtlon of a large excess of sulphurdioxicle as ¡netablsulphite.
Water & soil miscellaneous publication no. 38 (1982)

RDP/3
2.3 After the preliminary reduction, the actual colour reagent(ammonium nolybdate, antimony potassium tartrate, sulphuricacid, ascorbic acid) is added. orthophosphate reacts withthe molybdate to produce a (pale-yellow) phosphcmolybdate'which is rapidly reduced to the intensely blue "molybdenumbluen by ascorbic acid with antimony ¡ntassium tartrate.The method measures naturally occurring orthophosphater butalso generates orthophosphate from labíle phosphorus com-pounds in the sample as a result of hydrolysis caused by thesulphuric acid. Hence the name of the analysis "REACTIVEDISSOLVED PHOSPHORUS' - phosphorus reactive wíth molybdatein the presence of sulphuric acid.
2.4 It is an inherent property of thiosulphate-reductionphosphorus methods that the acidity must be higher than thatused in molyMenum blue methods without the preliminaryreductíon. Insufficient acid produces an instability whichshows itself as an increase in the slope of theabsorbance,/concentration Iine with timer after the inítialplateau is reached.
3. Interferences 3.I Silica causes a slight ¡nsitive interference. This hasbeen estimated as 1.5 ng/n3 per I0 g/m3 of reactive silica.
3.2 Mercury used as a preservative at 40 g,/m3 does noÈ inter-fere. (See Section 10.5.)
3.3 Arsenic interference is minimised by the thiosulphate reduc-tion step.
4. Hazards 4.I The main dangers are in the acid-washing of the apparatus.Wear eye protection and guard against splashes of acid onclothi ng .
4.2 The reductant solution (Section 8.1) generates sulphurdioxide, an irritant and toxic gas. PrePare and store thereductant in a fume cupboard. The reductant,/reagent addi-tions and the absorbance measurenents should be made in a
well ventilated or air-conditioned room.
4.3 Mercuric choride and antimony ¡ntassium tartrate are highlytoxic.
5. Reagents 5. I Analytical reagent grade chemicals are suitable unlessotherwise specified. The two chemical reagents that aremost. likely to be contaminated with phosphorus are thesulphuric acid (d20 f.84) and the sodium metabisulphite. Inmeasuring trace amounts of phosphorus the blank should be
about 1 mg/m3. The reagents should be kept only forphosphorus determination, the apparatus MUST by kept onJ-yfor this purpose. The advice of an analyst experienced inlow level phosphorus analysis is useful in selecting brandsof reagents. Keep the sulphuric acid for this analysls
Water & soil miscellaneous publication no. 38 (1982)

NDP/4
onlyr and be careful not to contamlnate lt. Before pro-ceeding further read Section 6.4 on cleaning of apparatus.
5.2 lilater
Dlstllled or de-ionlsed waÈer contalning negliglblephosphorus. Às phosphorus is generally not an abundant ele-ment in publlc water supplies, slngle dlstlllation lsusually sufflcient (See Section 10.3) .
5.3 Acld-nolybdate solutlon
To about 250 nl dÍstilled water in a 500 ml volunetricflask add 71 ! I ml concentrated sulphuric acld (d2O 1.84)(Caution t), mlx and cool. Diesolve 6.4 + 0.1 I ammoniumrnolybdate in I00 mI of distllled water¡ with warming' andcool. Àdd the nolybdate solutfon to the acidr nlx anddílute to 500 nl. The solution le stable for severalmonths.
5.4 Antimony solution
Dissolve 0.44 + 0.02 g antlmony Potassiun tart¡ate indistilled water and nake up to 100 ml. Stable for aboutI week.
5.5 Sodium metablsulphlte
Weigh out as the solld in preparing the reductant. SeeSection 5.1 regarding the purity of this material.
5.6 2l n/v Sodium thiosulphate
Dissolve 2.0 + 0.1 g sodiu¡n thiosulphate in 100 nI water.
5.7 Àscorblc acid
Weigh out as the solfd in preparing the reagenÈ. Reagentgrade may be found saÈisfactory.
5.8 2.5M Sulphurlc acid
To 900 mI water add 141 + 2 rnl sulphuric acid (d2g 1.84)(Caution l), mix and cool. See Sectlon 5.1 regarding thepurtty of the sulphuric acld. Keep a bottle of sulphuricacid especlally for this and the Total Phosphorus/totalDissolved Phosphorus method.
5.9 Standard phosphate solutions
Dry potassium hydrogen orthophosphate at 100-105oC anddissolve 1.098 + 0.001 g of the driect salt In dÍstiiledwater. Àdd 0.5 + 0.1 nl of. 2* mercuric chlorlde solutlon
Water & soil miscellaneous publication no. 38 (1982)
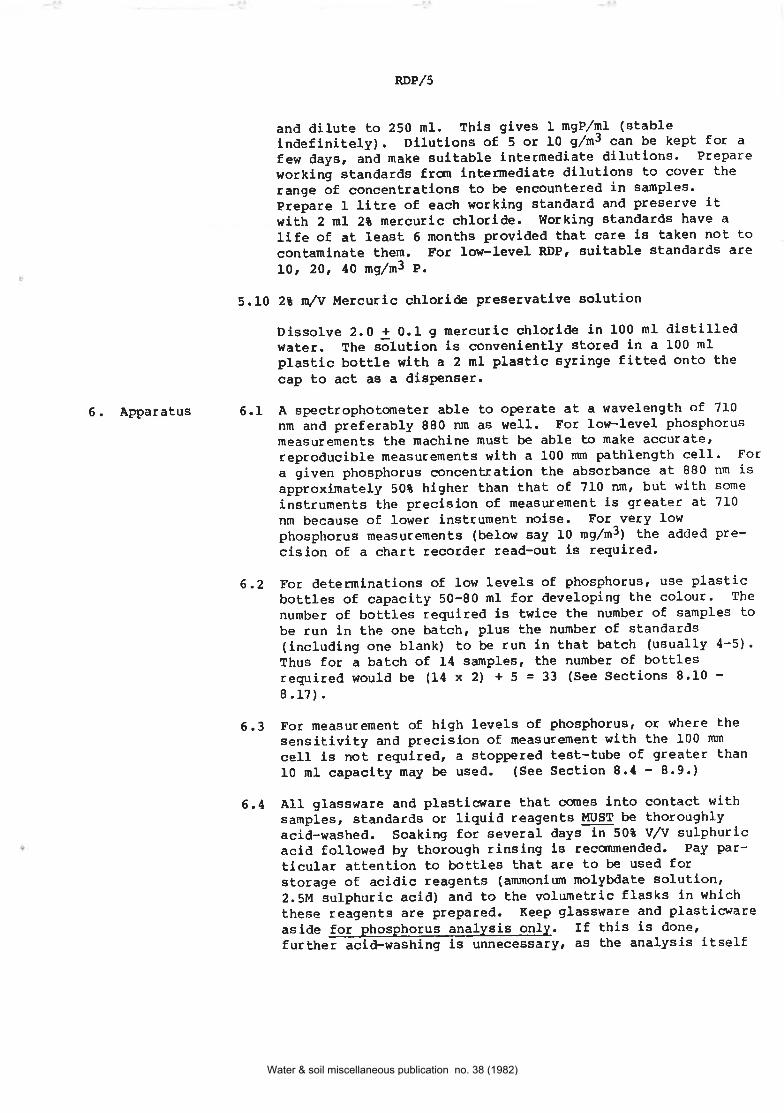
6. Apparatus
RDPr/5
and dilute to 250 mI. Thls gives L mgPlml (stablelndefinitely). Dllutlons of 5 or I0 g,/ms can be kepÈ for a
few daysr and make sultable tntermecliate dilutions. PrePareworking standards frqn lntermediate dilutions to cover therange of concentratlons to be encountered in samples'erelare I lltre of each working standard and preserve itwith 2 nl 2t mercurlc chloride. I{orking standards have a
life of at least 6 months provlded that care ls taken not tocontamlnate them. For low-level RDP, suitable standards are10, 20, 40 mglm3 e.
5.I0 2t lq,/V Mercurlc chlorl& preservatlve soluÈion
Dlssolve 2.0 + 0.1 g mercuric chlorlde in 100 ml distilledwater. rhe sõlution is convenlently stored in a 100 mlplastic bottle with a 2 mI plastlc syringe fltted onto thecap to act as a dis¡nnser.
6.1 A spectrophotorneter able Èo o¡nrate at a wavelength of 710nm and preferably g80 nm as weIl. For low-level phosphorusmeasurements the machine nust be able to make accuraterreproducible measurements with a 100 mm pathlength cell. For. given phosphorus eoneentratlon the absorbance at 880 nm isapproximately 50t hlgher than that of 710 nmr but with soneinstruments the precfsion of measurement is greater at 7I0nm beeause of lower instrument noise. For very lowphosphorus measurements (below say I0 m9,/m3¡ the added pre-cision of a chart recorder read-out is required.
6.2 For determinatíons of low Ievels of phosphorus, use plasticbottles of capacity 50-80 ml for developing the colour. Thenumber of bottles requlred is twice the number of samples tobe run in the one batch, plus the nunber of standards(Íncludfng one blank) to be run ín that batch (usually 4-5)'Thus for a batch of t4 samplesr the number of bottlesrequired would be (L4 x 2l + 5 = 33 (See Sections 8.10 -8.17).
6.3 For measuremenÈ of hlgh levels of phosphorus, or where thesensitívity and precislon of meagurenent wlth the 100 mn
cell is not requlred, a stoppered test-tube of greater than10 ml capaclÈy may be used. (See Section 8.{ - 8.9.)
6.4 AIl glassware and plastictrare that cornes into contact withsamples¡ standards or liquicl reagents MUST be thoroughlyacid-washed. Soaking for several days in 50t V/V sulphuricacid followeil by Èhorough rinslng ls reccrnmended, Pay par-tlcular attention to botttes that are to be used forstorage of acidic reagents (arunonirm molybdate solution,2.5M sulphuric aclcl) and to the volwnetric flasks in whichEhese reagents are prepared. Keep glassnare and plasticçareasíde for phosphorus analysis on1y. If thls is done¡further acid-wasfiiìg is unnecessartr as the analysis itself
Water & soil miscellaneous publication no. 38 (1982)

RDP/6
conscltutest ¿¡n effectlve acid-strlPplng Process. Pipettesand auto-pípette tips may convenÍently be stored in acid andrinsed before use. The anatyst must regard the cleanllnessand acld-washing of the equipment as an integral part of theanalysis and be personally accountable for sane. Even thespecÈrophotcmeter cell must be phosphorus-frees con-taminatlon here produces a rlslng absorbance.
7. Sample To measure reaetlve diesolved phosphorus (RDP), the sample lsCollection ¡ flttered inmedlately after collectlon through a 0.45 pn plasticPreservation me¡nbrane filter. If total reactive phosphorus ls requlred, the
sample 1s not flltered.
7.1 The filter (0.{5 pm, Sartorius, l,lillíPore or sinllar) lsheld ln a isufnnex' * filter holderr ând Èhe sanple forcedthrough the filter with a 30-50 nl plastic syringe. Thesyringe plunger is rernoved before the filter is attached tothe syringe and¡ lf nrore than one syringe voltrne is to befllteredr the fÍlter holder must be removed beforewithdrawing the plunger agaln, to avoÍd rupÈuring thenembrane by back pressure.
7.2 The membranes may be either eellulose nitrate or celluloseaceÈate, and are cleaned afÈer mounÈing in the fÍlter holderby forcing 100 ¡nl distilled water Èhrough them.
7.3 After filtratlon the sample ls preserved wíth mercurÍcchloride. Add 2 ml 2t m,/v mercuric chloride (Section 5.10)per litre of sample.
7.4 Sample bottles should be of polyethytene and may be cleanedby soaking Lor several days In 50C vÆ hydrochloric acid andwell rinsed.
8. EXPERIMENTAL PROCEDURE (READ SECIION 4 ON HAZATDS BEFORE BEGTNNING THrS SECTTON
Step Ð<perlmental Procedure Notes
8.1 Reductant solution.daíly. Weigh 8.0 +metablsulphite intõ
Prepare fresh0.2 g of sodiuna 100 nl
Trade tlark of Milli¡nre Filter Cor¡nration
Water & soil miscellaneous publication no. 38 (1982)

8.2
8.3
RDP/7
stoppered measuring cYlinder.Dissolve ln distllled water andmake up to 40 nl. Add 40 + 0.5 mIof. 2l rn/v sodium thiosulPhatesolution. l,tlx. Add 20 + 0.5 mI2 . 5l,t sulphur I c acld (CAtrTroN:sulphur dioxÍde 1s evolved).Invert cautlously to mlx, releaslngexcess pressure by loosening stopperwhen cryllnder ls uPright.
Reagent solution. PrePare freshdalIy. Mix 25 + 0.5 ml antlmonYsolutlon ancl 50 + 0.5 mI acíd-rnolybdate soluttãn in a 100 mIstoppered cYtInder. Welgh 0'85 +
0.0ã 9 ascorbic acÍd directlY intothe q¡Iinder on top-loadlng balance'Make up to 100 mI- Shake untilccnrpletely dissolved.
The reductant solution (Section 8'1)and reagent solution (Sectlon 8'2)nay be used in any one of threeprocedures descrlbed below:
(A) Direct Proeedure (I0 mn cell):The quickest method' but leastsensltive and not Precise forIær-level estimation. SanPlealiquot 8 ml.
(B) Direct Procedure (I00 mm cell):Slower but aecuracY and Pre-cislon much better at lowlevels. SamPle allquot2x40nI.
(C) Þrtractlon Procedure (10 nun
cell): Slovrer still.AccuracY and Preclsion asfor B. The method of choicefor sensitlve work onIY lfthe s¡nctroPhotaneter can-not Perform satlsfactorilYwlth a 100 ¡nn cell (See
Section I0-6). SdnPIeallquot 100 ml.
Water & soil miscellaneous publication no. 38 (1982)

8.4
8.5
8.6
8.7
8.8
8.9
RDPr/8
(A) Direct procedure (10 mm cell)
Þleasure aliquots of up to 8 mlof samples, standards and dlstflledwater (for reagenL blank) ln 10 nlstop¡æred test-Èubes (NoÈe a). l,lakeup to I + 0.2 ml tf necessary. SeeSectlons 11.1 and tl.2.
Add 1.0 nl of reductant to eaehtest-tube ¡nfx and let stand for5 mlnutes. (Note b).
Àdd I.0 mI of reagent to each test-tube and ¡nlx. (Note b. )
12 minutes to 2 hours after conpletionof Section 8.6r measure the absorbancesof the soluÈions ln a l0 nun eeIl atelther 880 nm or 710 nm. 880 nm ismore sensiÈive but see Sect,lon 6.1.
Subtract the reagent blank absorbancefron the standard and sample absor-bances, and plot the correctedstandard absorbanees agalnst concentra-tion. Read off the sanple coneentrationsfrcrn the graph.
A general colot¡r blank correctlon hasnot been s¡ncified above for thlsmethod as it is necessary only if thesample ls obviously discoloured and/ortu¡bid to the eye. To galn experlencein judging this, perform a few colourblanks on any susplclously crolouredsamples. Use the procedure of Section8.13, adjusÈing the rrolumes asnecessary (ie, Èake I ml sample plus0.7 mI 2.5M H2SO4 plus I.3 nI water).
(a) A 5-10 nl auÈopipettor(eg Oxford) ls useful andrapid. The t1p ls hydrophobicand does not reguire rlnsingbetween sanples.
(b) Use I ml þ¡nndorf pi¡ntte ors lmllar.
Water & soil miscellaneous publication no. 38 (1982)

sDP/9
(B) Direct procedure (100 mm cell). -Before attempting thls procedure see
$õEIõn r0. 6 on s¡nctrophotcmeÈrlc measurements'
8.10 Measure allquoÈs of up Èo 40 ml (b)of samples, standards and distilledlwater (for reagent blank) In 50-80 ¡nlplastic bottles (Preferably) or 50 mlvolumetrlc flasks (Note b). llake upto 40 I 0.5 nI. See Sections Il.1and lI.2
If plastlc botlles are used, theeanple may be ¡nured fnto a
bottle on a to¡>Ioader balance.
Use 10 rnl graduated Pi¡ntte or5 nl autopiPettor eg Oxford.
In thls procedurer all samPlesmust be run wlth a c'olour b1ank.If this is not doner theapparenÈIy htgh Preclsion of theresult will be nisleading.
I.11
I.12
I .13
I.r4
8 .15
I .16
I .17
Àdd 5.0 + 0.1 ¡nl of reductant to (c)eaeh, mlx and let stand for 5 ¡nin.(NoÈe c)
Àdd 5.0 1 0.1 nl of reagent to eachand rnlx (Note c) .
Prepare a colour blank for each (d)sample (Note d) bY ¡nurlng thesame sized alfquot as used inSection 8.10 into a bottle or flaskmaking up to 40 nl, and then adding6.4 nl distilled water and 3.6 ¡nl2.5t'1 sulphuric acld' These colourblank allquots maY be PrePared atthe same time as the sample aliguotsof Section 8.I0.
12 minutes to 2 hours after ccrnpletionof Seetlon 8.12, measure the absorbancesof the solutions in a I00 mm cell atelther 880 nm or 710 run. 800 nn ls more
sensltlve but see Sectlon 10.6 (j).
Correct the standard absorbances bysubtractlng the reagent blank absor-bances frcnt each, and PIot thecorrected absorbances agalnst concen-tration.
Correcb t,he sample absorbances by sub-tracting both the reagenE blank and Ehe
correaponding colour/ÈurbldlÈy blankf rc¡n each.
Read the phosphorus concentrations lnthe samples frcrn Èhe callbratlon graphof Section 8.L5.
Water & soil miscellaneous publication no. 38 (1982)

8.18
8.19
8 .20
I .2I
8.22
8.23
8.24
8.25
8.26
RDP,/I0
(C) Extractlon Procedure (10 mm cell)
Prepare allquoÈs of sample contaír (e)lng up to 50 pg P in volr¡nes up to100 m]. tn voltrnetrlc flasks of 200or 250 mI (Note e).
Prelare standards (100 mI volune) anddlstl1led water for a reagent blankln flasks as ln Sectlon 8.18. SeeSectLons 1I. I and LL.2.
Add dlsttlled water to bring voltnesln a1l flasks to 100 j 5 ml.
Add I0 ! O.2 nI of reductanÈ to aIIflasks, nix and let stand for 5 mins.
Add I0 ! 0.2 mI of reagent to aIIflasks, and mlx.
Prepare c.olot¡r blanks for sanpleslf requfred. Thls will be neeessaryif sample ls obvlously dlscoloured,and should be carried ouÈ occaslonallyon normal samples to ensure that thecorrectlon ls negliglble. Take analiquot of sample as in Sections 8.18and 8.20, and add 7.2 nl of 2.5Msulphuric acld.
After 12 minutes and before 2 hoursaf ter canrpleting Section 8.22, add6.0 + 0.1 ml of hexan-l-ol to eachflask and shake vlgorously for2 minutes.
Allow the phases to se¡nrate (Note f) (f)
Float the organic phase lnto the narrowneck of the flask by adding dÍstllledwater frcrn a wash boÈtle. This nay bedone concurrently wlth Section 8.25.
voluneÈric flasks are nore suit-able than se¡nrating funnels, asÈhe organic layer floats Èo thetoP.
A few hexan-l-ol droplets maystick to the sldes of theflasks, and these cannot bedÍslodgecl by tapping or shaklng.They may be collected lnto thenaln organlc layer by tilÈfngthe flask and rotating slowly,before the extract Ís floatedlnto the neck.
8.27 Draw off Èhe organlc phase wlth aclean' clry pl¡ntte¡ takÍng care toexclude waterr and transfer lt to acleanr dry 5 nI st,oppered flask orcyllnder.
Water & soil miscellaneous publication no. 38 (1982)

I .28
8.29
I .30
8 .31
Add 0.5 ml absoluteflask to brlng anylets lnto solution
RDP,/I1
ethanol Èo each (g)s¡nall water dro¡r(Note g) .
Thfs volune of absolute ethanolwlll díssolve 0.1 ml water inthe hexan-l-ol. 9llth care, theanount of nater entrafned ln thehexan-I-ol should be ¡tuch lessthan thls.
Check that extract ls clear andbubble-freer and then measure theabsorbances at 690 run ln a l0 nm
cell, uslng the blank as reference(le to set zero absorbance).
Make a callbraÈlon graph¡ plottlngabsorbance against concentratlon of thestandards.
Correct sample absorbanees wt¡erenecessary by subtracting colour blankabsorbances and read the phosphorusconcentratíons frcrn tÌ¡e graPh.
9. Change ofConcentr atlonRange of theMeÈhod
Sources ofError
9.1 The method aS descrlbeil above covers a wlde range of con-centr ations.
g.2 procedure (A) permite analysls of concent¡aÈions of up to4 g/n3 P in an I ml aliguot. For higher concentrationsuse a small allquot and make up to I tnl tÙith dístilledwater. If hlgh precision ls requiretl at high con-centrations, the analyst may prefer to use the volumesspecified Ín Procedure (B) (ie up to {0 ml of sample plus5 ml of reductant and of reagent) anil measure in a I0 rmn
cell.
9.3 MuIÈiply result obtalned frcrn callbraÈion graph (sectlon8.g) by the dilutlon used in making up the sample allquot(eg ti ¿ mf sample is made up to I nl, dllutlon is 2) '
10.1 Às emphaslsed earlÍerr all aPParatus nusL be free frqnphospñorus. Failure to clean rigorously wl11 cause highabsorbance readings. Reaction flasks, test-tubes orbotLles nusb be kePt stoP¡nred.
I0.2 Htgh reagent blanks are undeslrable because:
(a) Preclsion ls reduced and
(b) They may htde the presence of a large dlsEllled waterbfank which would cause a bias to the results.
With careful selection of reagents' the total blankshould be about I mg,/m3 (0.00¿À ln a t00 nun ce11).
10.
Water & soil miscellaneous publication no. 38 (1982)
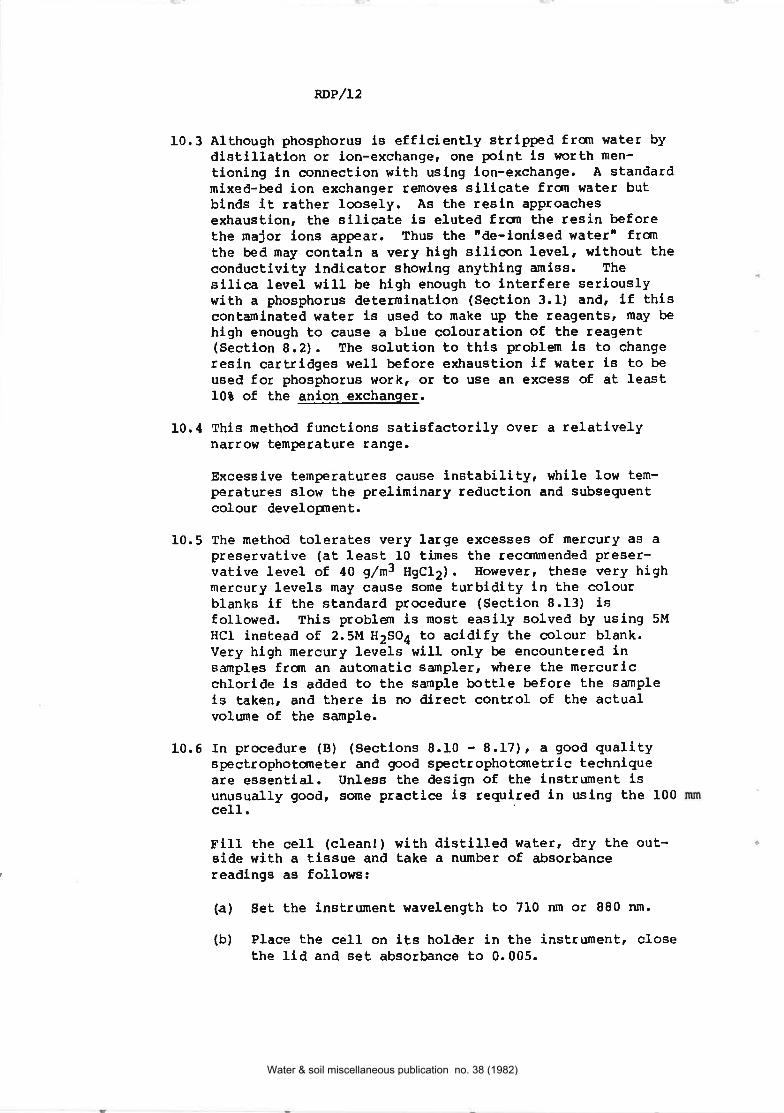
Þ
HDP/L2
10.3 Although phosphorus ls effleiently strlppecl frcrn water bydlstlllatlon or ion-exehange, one pofnt ls worth nen-tlonlng ln connection with uslng lon-exchange. À standardnixed-bed ion exchanger removes slllcate frcrn water butblnds lt rather loosely. As the resin approachesexhaustlon, the silicate ls elut,ed frcrn the resin beforethe najor lons appear. Thus the "de-lonlsed waÈer' frcmthe bed may contatn a very htgh sillcon level' wlthout theconduetlvlty lndlcator showing anythlng aniss. Thesilica level will be high enough to lnterfere serlouslywith a phosphorus determinatlon (Sectlon 3.1) and, lf thiscontamlnated water ls used to nake up the reagents' may behlgh enough Èo cause a blue colouratlon of the reagent(Section 8.2r. The solution to this problem is to changeresin cartridges well before exhaustion if water is to beused for phosphorus workr or to use an excess of at least101 of the anion exchanger.
I0.4 Thts method functlons satisfactorlly over a relativelynarrolr temperature range.
Excessive temperatures cause lnstabiliÈy, while low tem-peratures slow the preliminary reduction and subsequentcolour develo¡ment.
10.5 The method tolerates very large excesses of mercury as apreservative (at least I0 tines the reccrnmended preser-vative level of 40 g7m3 n9c12). Horùever, these very híghmercury levels may cause sone turbidity ín the colourblanks If the standard procedure (section 8.13) isfollowed. This problsn is nost easlly solved by using 5M
HCI instead of 2.5t1 H2SO4 to acfdify the colour blank.Very hlgh mercury levels wltl only be encountered insamples frc¡n an automatic sampler, wl¡ere the mercuricchloride is added to the sample bottle before the sampleis taken, and there ls no dlrect cont¡ol of the actualvolr¡ne of Èhe sample.
10.6 In procedure (B) (sections 8.I0 - 8.I7)¡ a good qualitys¡nctrophotcmeter and good s¡nctrophotcrnetric techniqueare esaential. Unless the desigrn of the instrr¡nent lsunusually good¡ some pracÈice ls required in uslng the 100cell.
Fill the cell (cleanl ) wlth dlstllled waÈer' dry the out-sfde with a tissue and take a number of absorbancereadlngs as follows:
(a) Set the lnstrunent wavelength to 710 nm or 880
(b) Place the cell on lts holder in the instrunentrt,he lid and set absorbance to 0.005.
n¡n.
close
Water & soil miscellaneous publication no. 38 (1982)

RDP,/I3
(c) Re¡îove the cell and replace ln lts holder. Close the1td.
(d) Read the absorbance and noEe. Use chart-PaPer read-out lf avallable.
(e) RepeaÈ (c) and (d) Eeveral tlnes.
(f) Determlne the effect of reverslng the cell.
(g) Determtne the effect of dtfferent ¡nsitions of thecell ln the cell holder.
(h) Frcm (f ) and (g), decldle what restralnts arenecessary on the posltlon of the cell ln lts holderle how much care ls necessary ln placfng the cell ÍnIte holder to obÈaln a reproduclble absorbancer eading.
(i) Test ¡our experlmental procedure by re¡naEing (c) and(d) 20 tfunes uslng lour best technlque.
(j) Practlce until the variabtltty of the results of arun of measurements (1) ls satisfacÈory. Bear inmlnd that at 710 nmr 0.004 A = I mg/m3 P and at880 nm, 0.006 A = I rngrlm3 n.
The nolse of the lnstrunent (le random varlations inread-out) nay be so hlgh that measurement at 710 nm
glves better precieion. Thls nay be true even forvery elaborate spectrophotcmeters.
lI. Checklng the I1. I Run a full set of standards (at least one blank and threeÀccuracy of standards) spanning the concentration range of interest.AnalyÈícal If preserved the same standards may be kept for at least 6
Results months. Running three standards safeguards against con-tamination of a standardr and confirms Èhe linearity ofthe spectrophoÈotreter over the range of absorbancesmeasured.
11.2 When lt has been established that a straight Ilne res¡nnsels obtained over the concent¡ation range of lnterest' theanalyst nay prefer to run two blanks and duplfcates of onestandard near the top of Èhe concentration range.Calculation of results ls made easierr but a full set ofetandarde should still be run occaelonally.
12. References (1) Murphy, J. and Riley¡ J.P. Anal. Chlm. Actar 27 (L96213r-36
(21 van Schouwenburg, J.C. and $lalingar I- Ànal- Chlm. Acta 37(1967) 27L-274.
Water & soil miscellaneous publication no. 38 (1982)

RDP/L4
(3) Harwood' J.E., van Steendern, R.À. and Kuhnr À.L. ÍfaterResearch 3 (1969) 4L7-423.
Address for Hovrever thoroughly a method lay be tested' there ls always theCorres¡nndence posslblllby of a user disca\rerlng a hftherto unknown problem.
Ueers wlth lnformaÈlon on tbls nethod are reguested to wriÈetoc
The DirectorWater and Soll Conservatlonüinlstry of Ìforks and llevelo¡mentP O Box 12041WELLINGTON }TCRMI
ÀTTE\ITION: Managerr lrlater Quality, Research and Surveys
Water & soil miscellaneous publication no. 38 (1982)

DETER¡,IINATION OF TOTAT PTTOSPHORUS/TOTAL DISSOLVED PHOSPHORUS ( 1981)
I. performance 1.1 Substance Total phosphorus ie orthophosphate plusCharaeteristics determlned lnorganic condensed phosphates plus organieof the l{ethod phosphorus c.om¡nunds. ResulÈs are
expressed in tãrms of' g/n3 e.
L.2 fYpe of sample Ground and eurface watersr effluents'seawater.
1.3 Basis of Method sample ls heated under acld conditions to12OoC with potasslu¡n ¡nrsulphate (potassiunperoxodlsulphaÈe). After dlgestion, tÌ¡eorthophosphate contålned In the sample isreacted with molybdate under acld conditionsÈo form phosphonolybdate which ls reduced tothe intensely blue 'rmlybdenun bluei byasc.orblc acld wlth antlmony.
A prellmlnary thiosulphate reduction stepellminates interference by arsenic byreducing lt to the trlvalent staÈe. Thethlosulphate also conplexes mêlcurtrenabllng mercurlc chloride to be used as asample preservative.
I.4 Range of Up to 4 g/¡3Appllcation
1.5 Callbratlon Straight line to at least 4 g/n3. In prac-curve t.ice the upper limít of the meÈhod is
determlned by the performance of thes¡nctrophotcmeter at high absorbances.
1.6 standard P (mg,/m3) standard Devlation (mg/m3)
Deviations0 2 (a)
¡¡s0 5 (a)(a) uslng I0 ¡un cells
L.7 Llmit of About 2 ng/n3 using a 100 rnn cells anddetectlon 4'5 mg,/m3 using 10 ¡run cerrs'
I.8 Sensitivity 40 ng/m3 gives an absorbance of approxima-tely 0.160 ln a 100 mm cell at 710 nm (0.24at 880 nm).
Water & soil miscellaneous publication no. 38 (1982)

rP/2
1.9 Blas No evidence of biaa ln spike recovery tests.
I.10 InÈerferences Sllica glves a small ¡nsitive lnterferencebut ls probably less than in the ReactiveDissolved Phosphorus (RDP) method. Themethod tolerates L g/¡3 As and at least 400g/n3 H9CI2 (see Sectlon 10.5). Colour andturblcliÈy do not inÈerfere.
1.1I TIme foranalysis
DigesÈion blme (30 nlnuEes).
The total analytlcal and operator Èimes arethe same except for the acid soaking. ÀI1analytfcal apparaÈus that cqnes lnto contactwÍth the samples or liquid reagents (flasks,botÈIes, beakers, pipettes etc.) must bethoroughly acid-soaked. This adds con-siderably to the time required to set-up theanalysisr but adtls llttle to operator tlmewhen the analysls is ¡nrformed on subsequentoccasions If apparatus is set aside per-manently for this analysis.
A good operator should be able to performat least 60 deÈermÍnations in a working dayusing procedure (A) wiÈh a 10 ¡mn cell.
1.12 Volune requiredfor analysis
Depends on procedure adopted for colourdevelopment (See Section 8). Normally 7 mIand 35 nI per determination using a 10 rrncell and 100 nun cell respectively. 90 ml isrequired for the exEractÍon procedure.
2. Prínciple 2.L The sample is heated to l20oC in a presure cooker orautoclave with sulphuric acÍd and potassium persulphate(potassitrn peroxodlsulphate). The persulphate oxidisesorganic maEería1 and converts organic phosphorus conpoundsto reactive dissolved phosphorus (RDP). The hob acidhydrolyses condensed phosphates Èo RDP. The digesÈ issubsequently analysed for RDP to measure all forms ofphosphorus presenE Ín the sample. The Procedure ls thes¿rme as ln the separate RDP nethod (q.v.) but the reduc-tant is sllghtly modifled (see 2.5).
I{hlle this dlgootlon proce66 ls not the mosb rigorousavallable, it ls rapld, easily mastered, and Èhere is nodanger of the RDP revertlng to condensed phosphates byoverheating.
2.2
Water & soil miscellaneous publication no. 38 (1982)

2.3
2.4
2.5
2.6
2.7
2.8
rP/3
The reference method for total phosphorus Is the hydrogenperoxlde,/sulphurle acld procedure descrl'bed elsewhere ( 6) 'Horo..r.. the hydrogen peroxtde/sulphuric acid methotl tends
to mobilise more phosphorus from any seclJ'rnent Ln thesample than coulö reasonably be regariled as potenttallyblologlcally avallable. Therefore bhe lower yleld ofphosphorus obtalned wlth the persulphate cllgestion can be
ratLonallsed as belng more represenÈatLve of the trophicstatus of the water.
The yteld of phosphorus obtal-ned from samples contalningmuch organLc materl-al may be low because the oxldlsingcapacltyofthepersulphatel.spartlallyexhausteillnreactlng wlth oxidisable material. The coD (chenicaloxygen Demand) of the sample ls the determinancl that willbest. predlct thts tendencY.
After dJ-gestion, the procedure followecl fs the same as inthe RDP method except that the reductant is maile up tovoÌume with 20 ¡nl distllled water l-nsÈead of. 20 ml 2.5M
sulphurlc acid. A sltghtly longer colour development timeis alloweil because of the sllghtLy hlgher acl-d con-centraÈlon of the digesL.
The colour development parb of the method is baslcallythab of Murphy c Ritey ( 1 ) with the adtlition of a prelimi-nary reduction step first suggested by van Schouwenburg
and Walinga (2).
Molybdate reacts rather slowly witl'r pentavalent arsenic toproduce an arsenomolybdabe, whLch is reduced by ascorbicãctd to prorluce a blue producÈ, similar to that producedf rom phosphorus. This interference ls removed -l-n the pre-senb methorl by usl-ng a reductant of acidifie<1 soiliumthiosulphate to reduce all pentavalent arsenLc to theunreaetl-ve trivalent form. The thiosulphate is ltselfunstable in ael-d solution, tendlng to dlsproportlonate tosulphur anit sulphur dioxide. This slde reactlon lssuppresseit by the addltlon of a large excess of sulphurdloxlite as metablsulPhlte.
After the prelJ.mlnary reiluctlon, the actual colour reagent(ammonl-um molybdate, antlmony potasslum tartrate,sulphurlc acid, aseorbLc actd) is added. orthophosphatereacbs wlth the molybdabe to proiluee a (pale-yellow)phosphomolybctaÈe, whJ.ch is rapiclly reduceil to the lntenselytlue ,,molybdenum blue', by ascorbic acid with antimonypoÈassJ-um tartrate.
It is an inherent property of thlosutphate-reiluctl-onphosphorus methods thab the aciiltty must be higher thanthat used ln molybdenum blue rnethods wlthout the prell-m1-nary reduction. Insufflcient acl-il produces an instabtltty
2.9
Water & soil miscellaneous publication no. 38 (1982)

rP/4
which ehons ltself as an increase ln the slope of theabsorbance,/concentrat,lon llne wlth tlne, after the lnltlalplateau is reached.
3. Interferenees 3.I Sitlca causes a sllght ¡nsltÍve lnÈerference. Thls wlllprobably be small (and certalnly lese than Ln the RDP
nethod) slnce the dlgestlon step tends to ¡nl¡rmeriseslllear naklng 1t unreactlve to molybdate.
3.2 Mercury uged as a preservatlve ab 40 g,/rn3 does not lnter-fere. (See Section 10.5).
3.3 Arsenlc lnterference ls nlnimlsed by the thl.osulphatereductlon etep.
4. Hazards 4.1 The maln dangers are ln the acld-washlng of the apparatus.I{ear eye protectÍon and guard against splashes of acld onclothlng. Àlso, tÌ¡e hoÈ-acfd-washlng necessary for thedigestlon tubes is dangerousr because of the ¡nssibllityof splllage of the hot acld. The safest procedure is pro-bably to fill the tubes wlth acld and stand the¡n in asturdy beaker of hot water, the beaker belng heated gentlyon a hot plate (See Section 6.7).
4.2 The potassh.un ¡nrsulphate is a very strong oxidisingagenÈ, and should be treated yríth care. Keep ln a coolplace in an alr-tlght bottler as it decom¡nses slowly inthe presence of ¡ttoisture.
4.3 Follow the nanufacturerrs lnsÈructions in using theautoclave or pressure cooker. Àt operaÈíng tenperature,the Ínternal pressure is two atmospheres. Remernber thatsr4terheated steam can eause serlous burns. Always wearthick rubber gloves when handling the hot pressure cookeror when the hands are near the safety valve.
4.4 The neutral reductant solution (Section 8.1) generatessulphur dioxlde, an lrritant and .toxic aas, on additlon tothe acid digests. The reductany'reagenÈ additions and theabsorbance measurements should be made in a well vent-ilated or alr-condltloned roqn.
4.5 Mercuric chloride and antimony potassiu¡n tartrate arehtghly toxic.
5. Reagents 5.1 Analytlcal reagent grade chemlcals are sultable unlessotherwlse s¡nclfieil. The two chemical reagents that aremost llkely to be contamlnated with phosphorus are thesulphurlc acld (d2g 1.84) and the sodium metablsulphite.In neasuring trace anounts of phosphorus the blank shouldbe t-2 mg/¡3. The reagent,s should be kept only forphosphorus deÈerminatlon, the apparatus MUST be kept onlyfor thls purpose. The advlce of an analyst experienced in
Water & soil miscellaneous publication no. 38 (1982)

5.2
rP/s
low level phosphorus analysis ls useful ln selectingbrands of reagents. Keep the sulphurlc acld for this ana-lysis on1y, and be careful not to contamínate lt. Beforeproceeding further read Sectlon 6.7 on cleaning ofapparatus.
I{ater
Distilled or de-lonlsed water contalning negllglblephosphorus. As phosphorus ls generally not an abundantãf"tnãnt in public water supplles, slngle distillation isusually sufficlent (See Sectlon 10.3).
5.3.I 7.51 n/v Potassiu¡n persulphate reagent. Weigh 7.0+ 0.2 g potassíun persulphate into a 100 ml stopperedmeasuring cyllnder. Make up to 90 nl with dlstllledwater. Add 5 mI concentrated sulphuric acld (d2g 1.84) 'Make up to 100 ml wfth distilled water, stopperr ând shake
to dissolve the poÈasslun persulphate. Gentle warming'eg in warn waterr may be necessary to dissolve the per-sutptat" ccnpletely. Use wlÈhln one hour of preparation.
5.3.2 If it ls found subsequently (section 8.16) that thepersulphate used ls contributing too high a phosphorusblankr the procedure of Nydahl (7) can be used to purifythe material. As recrystalllsation ls time-consuming andwasteful, some effort should be made to obtaln a Purerccrnmercial potass iun ¡nr suÌphate.
5.3.3 Keep a bottle of ¡ntassiun persulphate especiallyfor this analysis and keep cool and tightly stoppered'
Concentrated sulphuric acid (d2g I.84). Use in the pre-paration of. 7.5t m,/v Potasslun ¡nrsulphate reagent'
See Section 5.1 regarding Èhe purity of the sulphuricacld. Keep a bottte of sulphurÍc acid especially for thisand the RDP method.
Neutral reductanÈ solution
Weigh 9.0 + 0.2 g sodÍun metabisuphite into a 100 mI stop-pered measuring cyllnder and make up to 40 ml. DLssolve.Add 40 mI 2t m,/V godlr¡n thiosulphate solution, mLx, andmake up to 100 nl with distilled water. Prepare freshdaily.
Acid-rnolybdate solution
To about 250 mI distltled water in a 500 ml volr¡netricflask add 71 + t ml concentrated sulphuric acid (d29 1.84)(Cautiont¡, mÍx and cool. Dissolve 6.4 + 0'l g ammonium
molybdate in 100 nI of distiued waterr with warmÍng, and
5.3
5.4
5.5
5.6
Water & soil miscellaneous publication no. 38 (1982)

TP/6
cool. Àdd Èhe molybdaÈe solutlon to the acid, mix anddllute to 500 nI. The solutlon ls stable for severalnontt¡s.
5.7 Antlmony solution
Dlssolve 0.¿4 + 0.02 g antlmony potasslun tartrate lndletllled water and make up to 100 ml. Stable for about Iweek.
5.8 Sodl¡¡n metablsulphite
t{elgh out as the solld in preparlng the reductant. SeeSectlon 5.1 regarding the purity of this material.
5.9 2l Ír/v Sodfr¡n thlosulphate
Dlssolve 2.0 ! 0.1 g sodÍr¡n thlosulphate Ín 100 ¡nI water.
5. I0 Ascorbic acid
Weighed out as the solfcl in preparlng bhe reagent.Reagent grade may be found satlsfactory.
5.11 2.5M Sulphurlc acld
To 900 ml water acld I4l +. 2 ml sulphuric acid (d26 f.84)(CautÍont), nix and cooll see Section 5.t regarãing thepurity of the sulphurie acid.
5.L2 Standard phosphate solutions
Dry potassiun hydrogen orürophosphate at 100-15OoC anddissolve 1.098 + 0.001 g of the dried salt ín distilledwater. Add 0.5 + 0.1 ml of 2t mercuric chloríde solutionand dilute Èo 25õ nl. Thls gives I mge,/n1 (sÈableindefinitely). Dílutions of 5 or 10 g/¡3 can be kept fora few days, and make suitable intermediate dÍlutions.Prepare working standards frcnr lntermediate dilutions tocover the range of concentrations to be encountered insamples. Prepare I litre of each working standard andpreserve lt wÍth 2 ml 2l mercuric chloride. Working sÈan-dards have a life of at least 6 rnonths provided that carels taken not to c.ontaminate the¡n. For low*level Psamples, sultable standards are I0, 20, 40 mgrlm3 e.
5.I3 2l n/V Mercuric chlorlde preservatÍve solution
Dlssolve 2.0 + 0.1.g mercuric chloride in 100 nI dÍsbilledwaÈer. The solution ls conveniently stored in a 100 mlplastlc bottle with a 2 ml plastic syringe fitted onto thecap to acE as a dis¡nnser.
Water & soil miscellaneous publication no. 38 (1982)

5. 14
5.15
5. 16
TP/7
Eexan-l-ol
Ethanol
Considerable variation wlll be fotrnd between manufacturersin the phosphorus leve1s of boÈh sulphuric acíd andpotass irrû ¡nrsulphate.
An autoclave or pressure c.ooker able to operate at I20oC.This corres¡nnds to an lnternal pressure of I atmosphere(f5 psl) above ambient. A pressure cooker regulres a
source of heatr such as a gas ring or a large electrichot-plate.
6.2.L Glass test-tubes, stoppered, of capacity greaterthan 10 mI, if procedure (A) ls to be followed.
6.2.2 Glass Èest-tubes stoppered, of capaciÈy greaterthan 50 ml lf procedure (B) is to be followed.
6.2.3 See SectÍon 8.3 (C) for suggested glassr'{are if pro-cedure (C) is to be followed.
Heat-proof racks to hold the test-tubes in theautoclave/pressure cooker. Ensure that the racks cannottip over when Ehe water in the autoclave,/pressure cookerís bollíng.
Alrrniniun foil to cover the test-tubes durlng thedigestion.
Pipettes, pipettors or dispensers for the reagents' An
aulomatíc dispenser (eg Oxford or Nichiryo) is useful forthe 50t VÆ sulphuric acld.
A spectrophotometer able to operate aÈ a wavelength of 710
nm and preferably 880 nm as well. For lor*-levelphosphorus measurements the instrument must be able tomake accurâtêr reproducible ¡neasurements with a I00 rur¡
pathlength celt. For a given phosphorus coneentration theabsorbance aÈ 880 nm is approximatety 501 higher than thatof 710 run, but with some insÈruments the precision ofmeasurement ls greater at 710 nm because of lower instru-ment noise. For very low phosphorus measurenents (belowsay 10 mg/m3) the added preclsion of a chart recorderread-out ls required.
A1I glassware and plastlcware that cofnes into contact withsamples, standards or liquld reagents MUST be thoroughlyacid-washed. Soaklng for several days in 50t vÆsulphurlc acid followed by thorough rinslng ls recc¡tt-mended. Pay ¡nrticular attention to botÈIes that are tobe used for storage of acidic reagents (ammoniun nolybdate
6. Apparatus 6.1
6.2
6.3
6.4
6.5
6.6
6.7
Water & soil miscellaneous publication no. 38 (1982)

7. SanpleCollection e
Preservation
rP/8
solutlonr 2.51t sulphurfc acld¡ and to the rroluretricflasks ln whlch these reagents are prepared. Keepglassware and plasticsare aslde for phosphorus analvsisonlv. If thls is done, further acld-washlng is urìne-cessaryr as the analysis itself constitutes an effectiveacld-stripplng process. Pipettes and auto-pipette tipsmay convenlently be stored In acid and rinsed before use.The analyst must regard the cleanllness and acld-washingof the eErl¡ment as an integral part of the analysis andbe personally accountabÌe for sarne. Even the spectropho-tqneter ceII must be phosphorus-free: contamination hereproduces a rislng absorbance.
The digestion test-tubes reçlre hoe aclcl-washing beforebeing used for the first tLme. The safest procedure isthat outlined in SeetÍon 4.1 under Hazards. It is nrostunlikely that a heavy beaker will dÍsintegrate cunpletely.It ls more likely to crackr spilling hot water but r¡ot thehot acid in the test-tubes. Àdjust the hot-plate so thatthe water simmers at about 90oc. The cleanliness of thetubes can be tested by running disÈilled water blanks(mfnus ¡nrsulphate) through the whole procedure.
7.1 If the sample is flltered (see Sectlon 7.3 below) thedigestion will yield the TOIAL DISSOLVED PIIOSPHORUS.
7.2 If the sample is not filtered, the digestlon wlll yieldTqTAT PHOSPHORUS.
7.3 The filter (0.45 pm¡ Sartorlus' Millipore or sinilar) isheld in a "Swlnnex" i filter holder, and the sample forcedthrough the filter with a 30-50 ml plastic syrfnge. Thesyringe plunger is removed before the fÍlter is attachedto the syringe and¡ if ¡mre than one syringe volune ls tobe filtered, the filter holder nusE be removed beforewithdrawing Èhe plunger agaln, to avoid rupturing themembrane by back pressure.
7.4 The membranes may be elther cellulose niÈrate or celluloseacetate, and are cleaned after mounting ln the filterholder by forclng 100 ml distilled water through them.
7.5 After flltrat.lon the sample ls preserved with mercuricchlorlde. Add 2 ml 2t m,/v mercuric chloride (Section5.13) ¡nr litre of sample.
7 "6 Sample bottles should be of polyethylene and may becleaned by soaking for several days ln 501 VN hydroch-lorlc acld and well rlnsed.
* Trade Mark of Mllll¡nre Filter Cor¡nratlon.
Water & soil miscellaneous publication no. 38 (1982)

rP/9
g. Analytlcal procedure (Reacl Sectlon 4 on Hazarde before beginning thls section)
Step Þ<perlmental Procedure Notes
8.r
8.2
8.3
Neutral reductant solutlon. (a) I'tade up as ln Section 5'5'Prepare fresh dallY.
Reagent solutlon. Pre¡nre freshda[ly.
Mix 25 + 0.5 mI antlmony solution and50 + 0.6 mf acicl-molybdate solution ina fOO mI etoppered cylinder. t{eigh0-85 + 0.02 g ascorblc acld dlrectlyinto Èhe cyllnder on a to¡:-loadingbalance. Make uP to 100 ml. ShakeunÈi1 ccmpletely dlssolved.
Tl¡e neutral reductant (Sectlon 8.I) andreagent (Section 8.2) may be used afterthe digestion stage in any one of threeprocedures dessibedl below:
(À) Direct Procedure (10 mm cell):The quíckesÈ meEhodr but leastsensiÈive and not Precise for low-level estimatlon. SamPle allquot7 mI.
(B) Direct procedure (100 ¡nm cell) :Sfærer Uut accuraqÍ and Precislonmuch better at low levels- SanPleallquot, 35 nI.
(C) Extraction procèdure (I0 m¡n cell): .
sfower stiIl. Aceuracy and precisionas for B. The method of choice forsensltive work only lf the s¡nctro-photoneter cannot perform satisfac-torily wíth a 100 r¡n cell (See
Section 10.6). A suftable samPlevolume would be 90 mI PIus I0 ml7.51 m/v potasslun persulphate reagent.
To avold havlng to transfer the cligestto a rrolurnetric flask lt would beposslble to make a stoPPered test-tube of caPacitY about 150 mlr wltha narrow neck for the subsequenÈse¡nratlon of the extractant-
Water & soil miscellaneous publication no. 38 (1982)

-i
I
I
I
rP/LO
(A) Direct procedure (10 nm cell)
8.4 Measure 7.0 1 0.2 nl aliquots of (b)sample into clean (See Section 6.7)test-tubes. Pre¡nre 2 disÈllled water
. blanks (Notes b and c) and a serl.esof standards (see Section 5.12)s¡nnning the concenÈratlon range oflnteresE, putting 7.0 + 0.2 nlallquot ln test-tubes, as for (c)samples. See Sections 11.I and I1.2.
8.5 Ileat the autoclaver/presstrre cooker, (d)so that lt contaíns the amount ofwater reccmmended by the manufacturerat near to boiling ¡nint. The waterlevel should be high enough to beable to efficlently heaÈ the digesÈorÈubes by dlrect contact (Note dl).
8.6 To each tube add I.0 nI 7.51 rVV (e)potassltm persulphate reagent(llote e¡.
Cover the test-t,ubes wíth alwnlniun (f)foll-keep the stoppers (Note f).
8.7
8.8
As Èhe dlstllled water blank(really a reagenÈ blank) mayglve a high absorbance lt iBdeslrable that lt be run lndupllcate to give sorüe guaranteeof lts accuracy.
A 5-I0 mI autopi¡nttor(eg Oxforcl) ls useful and rapid.The tlp is hydlrophobic and doesnot requlre rinslng betweensanples.
Àt least 3 <¡n of the tubesshould be f¡¡mersed ln the water.If the autoclave/pressure cookeris kept hot' several batches ofsanples can be digesÈed with
very Ìittle ;turn-around" tlme.
UBe Eppendorf plpette or sùnllar
The sÈoppers are not used duringthe digestion because they wouldbe ex¡nlled as the sanples riseln tetnperature or jan as theycool. The stop¡nrs nay be keptimmersed ln dlstllled water in abeaker untll required.
CAUTfON: ÀIIow to cool untlliniEe ,ot pressÌ¡re cooker ls atatmospheric pressure bef orereleaslng aafety valve or 1ld.Sudden release of pressurecauses bolttng over of samples.
8.9
I .10
Ioad the test-tubes into theautoclaver/pressure cookerr seal,and take the temperaÈure up to 120oCas¡ soon as ¡nsslble.
Keep the tem¡rerature at 120qC for 30 ¡nin.
Release pressure and remove the test-t.ubes, again follonfng the manufae-turerrs lnsÈructlons. Beware ofburns frcnr the steamt lrfear thickrubber gloves.
After the test-tubes have cooled tonear roqî tem¡nrature, remove thealumlnlr¡n foil and re-stopper thetesE-Èubes.
8 .11
Water & soil miscellaneous publication no. 38 (1982)

TP/LL
8.12 If there ls a preclpltate of elllca (g)in any of Èhe test-tubesr atlovr ltto settle and carefully decant' thesupernatanÈ into anoÈher Eest-tube(r¡ote g) .
If turbidity does not seÈtle' itmay be removed bY filtering dÍ9-est uslng the Procedure
desslbed for filterlng samPles.Howeverr clean the fllterme¡nbrane before uee bY Paeslng100 ¡oI of lot v,/v aulPhurlc acidand 100 nl diEtllled water tor lnse.
The absorbance for blank wlII behlgher than that obtained forthe RDP method because of thephosphorus c'ontrlbutlon f rcrnthe persulphate.
I .13
I .14
I.15
I .16
Add I.0 ml of neutral reductantsolutlon to each test-tube, nI'xand leÈ stand for 5 minutes (Note e).
Àd¿l 1.0 nI of reagent solutlon to eachtesÈ-tube and mlx. (Note e).
12 mlnutes to 2 hours after conpletlonof Sectlon 8.14, measure the absorbancesof the solutions in a 10 mm cell abelÈher 880 nm or 710 nm. 880 nm lsmore sensltive but see Sectlon 6.6.
Subtract the digestion blank (which (h)was run in duplicate) frcrn thestandard and samPle absorbances.Plot the corrected sÈandardabsorbances agalnst cpncenEration(Note h).
Read the sample concentratlons frc¡nthe graph.
Water & soil miscellaneous publication no. 38 (1982)

'rP/L2
(B) DirecÈ procedure (100 nun cè11). Before attenptÍng this procedure seeSection 10.6 on s¡nctrophotcmetric measurements.
8.I7 ttleasure 35 ml allquots of sanplelnto elean (See Sectlon 6.7)test-tubes. Prepare 2 dllstilledwater blanks and a series ofstandards (see Sectlon 5.12) span-nlng the concenÈration range ofinterest, puttlng 35 I 0.5 mlal.lquote in test-tubes as forsanples. See SectÍon 11.1 andLL.2,
8.I8 Prepare the autoclave as inSectlon 8.5.
8.19 To each tesÈ-tube actd 5.0 I 0.I ml (f) Use Oxford pipetÈor or gi¡nÍlar.7.51 n/V potasslum persulphatereagent (llote f).
8.20 Cover the tubes wlth aluninfun foil, CAUTIO& Allovr to cool untilkeeping the stoppers separate; load l¡lilae of pressure cooker is atÈhe autoclaver/pressure cooker and atmos¡ùeric pressure beforedigest for 30 min. at 120oC as in releaslng safety valve or lid.Sections 8.8 - 8.L2. Beware of bu¡ns Sudden release of pressurefrsn the steaml Wear thick rubber causes boiling over of samples.gloves.
8.21 Add 5.0 + 0.1 mI of reductant to (j) Use 10nl graduated plpetÈe oreach ÈesÈ tube, nix and let stand 5 ml autopi¡nttor eg Oxford.for 5 min. (Note j).
8.22 Add 5.0 + 0.1nl of reagent to each,and mlx (Note j).
8.23 12 rninutes to 2 hours af ter ccrnpleÈionof Section 8.22t measure the absorbancesof the solutlons ln a 100 mm cell ateither 880 nm or 710 nm. 880 nm ismore sengitlve but see Section I0.6 (j).
8.24 Subtract the digestion blank (whlch (k) The absorbance for the blankwas run ln dupllcate) frcm the wlll be higher than thaÈsEandard and sample absorbances. obtalned for the RDP methodPlot the corrected standard absorb- because of the phosphorus con-ances againsÈ concentration. (Note k). t¡lbution frcrn Èhe ¡nrsulphate.Read the sanple concentrat,Ions frcmthe graph.
Water & soil miscellaneous publication no. 38 (1982)

8.25
8.26
8.27
8.28
s.29
8 .30
I .31
I .32
8.33
8 .34
TP/L3
(C) Þ<tractlon Procedgre (10 ¡nm ceIl)
l4easure 90 ¡nI aliquots of sample (1)(contaínlng up to 50 ug P) lnto elean(see Sectlon 6.7) test-tubes (SeeSection 8.3 (c)). PrePare 2 distllledwater blanks (NoÈe 1) and a series ofappropriate standards. See Sectlons1I.I and LL.2.
Prepare the autoclave as ln Section 8.5.
To each tube add 10 nl 7.51 n/v (m)
¡ntasslun ¡nrsulphate reagent(Note n).
Cover the tubes with alr¡ninlr¡n foll'keeplng the stoppers se¡nrate¡ loadthe autocLave/pressure cooker anddigest for 30 nin at 120oC as inSections 8.8-12. Beware of burnsf rcrn the steanl $lear thick rubbergloves.
Add I0 + 0.2 ml of reductant to allflasks, mix and let stand for 5 min.
Add 10 + 0.2 nl of reagent to aIIflasks, and mix.
After 12 minutes and before 2 hoursafter cunpleting Sectlon 8.30' add6.0 + 0.1 nl of hexan-l-ol to eachflask and shake vigorously for 2 mins.
Allow Èhe phases Eo separate (n)(Note n) .
Float the organlc phase lnto thenarrow neck of Èhe flask by adldlngdlstlllecl water frqn a wash bottle.Thls may be done concurrentlY wlthSectlon 8.32.
Draw off the organie phase wlth aclean dry plpetter takfng care toexclude water, and transfer lt toa clean, dry 5 mI stopPered flaskor cyllnder.
Add 0.5 ml absolute ethanol to each (o)flask to bring any snall water dro¡>
Às the dist,illed water blank(realIy a reagent blank) mayglve a hlgh absorbance lt lsdesirable that it, be run indupllcate to glve some guaranteeof its accuracy.
Use Oxford plpetÈe or simllar.
CÀUTION: Àltow to cool untilGFe of pressure cooker ls ataLmospherlc pressure beforereleasÍng safeÈy valve or Iid.Sudden release of pressurecauses boiting over of eamples.
A few hexan-l-ol droPlets maystlck to the sides of the flasks'and these cannot be cllslodged bY
tapping or shaking. They maY be
collected lnto the maln organiclayer by tlltlng the flask androtatlng slow1y, before theexÈracE ls ftoated lnto theneck.
Thls volune of absolute ethanolwlll dissolve 0.1 ml water fn
I .35
Water & soil miscellaneous publication no. 38 (1982)

TP/L4
lets lnto soluÈlon (Note o). the hexan-l-ol. l{iÈh care' t}¡ethe a¡nount of rater entralned lnthe hexan-I-ol strould be muchless than this.
8.36 Check that extract is clear and (p) The absorbance for the blank willbubble-free, and then neasure the be higher than that obbalned forabsorbances at 690 nm ln a I0 mm the RDP meÈhod because of theceIl, uslng the blank as reference phosphorus contributlon frcrn(le to set zero absorbance) the gersulphate.(Note p) .
8.37 Make a catlbraÈlon graph¡ plottlngabsorbance agalnst concentratlon ofthe standards.
8.38 Read the phosphorus concentrationsfrqt tìe graph.
9. Change of 9.I The ¡nethod as descrlbed above cþvers a wide range ofConcentration concent¡atlons.Range of theMethod e'2
;iff"u;':"'l'rïï*:Ti*Î3ii""åå,"lriÏÏ"5"::li:.i:':n,:: :srnall aliguot and make up to 7 nl with tlistilled water. Ifhigh precision ls requlred at high concentrationsr the ana-lyst may pref er to use the riolr¡res s¡æclfíed in procedure(B) (ie up to 35 ml of sample plus 5 mI of reductant and ofreagent) and measure ln a l0 nun cell.
9.3 Multipty result obtained frcrn calibration graph (Section3.16) by the dilutlon used in making up the sanple allquot(eg if 2 ml sanple ís made to 7 ml, dilutlon ls 35).
I0. Sources of 10.1 As emphasised earLlerr atl apparaÈus must be free fromError phosphorus. Failure to clean rigorously will eause high
absorbance readings. ReacÈion flasks, test-tubes or boEtlesmust be kept, stoppered.
10.2 HÍgh reagent blanks are undesirable because:
(a) Preclslon ls reduced and
(b) They may hide the Presence of a large clistl[ed waterblank whlch would cause a blas to the results.
With careful selection of reagents, the total blankshould be about 2 mg/m3 (0.0084 ln a 100 ¡run ce11).
10.3 Although phosphorus is efficiently strippetl frcrn water bydistlltatlon or lon-exchange, one polnt ls worth mentioningin connection with using ion-exchange. À standard mixed-bedion exchanger renoves sillcaÈe frc¡n water but blntls it
Water & soil miscellaneous publication no. 38 (1982)

TP/ts
rather loosely. As the resln approaches exhaustlon, thesllicate ls etuted frc¡n the resln before the major fonsappear. Thus the "de-lonlsed water" frcrn the bed may con-tain a very hlgh silicon level, wlthout the conductlvltyíndicator áhowlng anythlng anlse. The sillca level wfll be
high enough to interfere wlth a phosphorus determination(Sèction 3.1) and, if thls contamlnated water is used tomake up the reagents, may be hfgh enough to cause a bluecolouratlon of the reagent solution (sectlon 8.2). The
solution to thls problem ís to change resln cartridges wellbefore exl¡austion ff water ls to be used for phosphoruswork, or to use an er(ceBs of aE least 10t of the anlonexchanger.
10.4 This met.hod functlons satlsfacÈorlIy over a relativelynarrovt tem¡nrabure range.
Excesslve tem¡nratures cause instabillty, whlle low teIll-peratures slow the prelimlnary reduction and subsequentcolour develo¡ment.
10.5 The method tolerates very large excesses of mercury as a
preservative (at least 10 times the recqnmended preservativelevel of 40 g¡n3 AgcL2). Very high mercury levels will onlybe eneoun¡ered tn samþles frcrn an autonatic sampler, wherethe mercuric chloride is added to the sample bottle beforethe sample is taken, and there is no direct control of theactual volume of the samPle.
10.6 In procedure (B) (sections 8.17 - 8.24) ¡ a good qualityspe-trophotcmeter and good specErophotcrnetric technique areeÀsential. Unless the design of the instrunent is unusuallygood, sofne practice ls requíred in uslng Èhe I00 mm cell.
Fitl the cell (cleant) with distilled water, dry the outsldewlth a tlssue and take a number of absorbance readings as
follcns:
(a) Set the instrunent wavelength of 710 nm or 880 nm'
(b) place the cell In lts holder in the instrunent, closethe lfd and seÈ absorbance to 0.005.
(c) Re¡nove the cell and replace in lts holder. close the1t d.
(d) Read the absorbance and note. use chart-Paper read-outif available.
(e) Re¡nat (c) and (d) several tlmes.
(f) Determlne the effect of reveraing the celI'
Water & soil miscellaneous publication no. 38 (1982)

TP/L6
(S) Determlne the effecÈ of cllfferent ¡nslÈlons of the cellln the cell holder.
(h) Fron (f) and (g), declde what restralnts are necessaryon Èhe posltton of the cell in iÈs holder le how muchcare le necessary ln placlng the cell in lts holder toobtaln a reproduclble absorbance reading.
(i) Test your experlmental procedure by re¡nating (c) and(d) 20 Èlmes using lour best technique.
(j) Practlse untll the varlabllity of the results of a runof measure¡nents (f) is satlsfactory. Bear ln nlnd thatat 7I0 nm, 0.004 A = I mg/¡n3 P andat 880 nm, 0. 006 A = I rngrlm3 f
The noise of the lnstrúnent (ie randm varlatlons lnread-out) may be so high that measurenent at 7I0 nm
glves better preclsion. Thls may be true even for veryelaboraEe sPectr oPhotcmeter s.
10.7 In measuring TCIIAL PEOSPHORUS as distinct frcrn TOIALDISSOLVED PHOSPHORUS (See SecEion 7.21 , lt is essentlal thatthe allquot taken be represenÈative of the sample. Shakewell before withdrawlng the aliquot.
10.8 The method may give a low yiel.d for sdne samples with highlevels of oxldlsable material eg effluents (see section2.4).
IO.9 Minimlse the ¡nssibllit.y of cross-contaminatlon beÈweensamples in the autoclave/pressrrre cooker by splashfng byensuring that, there is adequaÈe head-sPace above the samplesin thelr tesÈ-Èubes, and that the test-tubes are adequaLelycovered,
11. Checking the 1I. I Run a full set of standards (at leasÈ two blanks and threeAecuracy of standards) s¡nnning the croncentratlon range of lnterest. IfAnalytlèa1 preserved the same same standards may be kept for aÈ least 6
Results months. Runnlng three standards safeguards against con-tamfnation of a sEandardr and conflrms the llnearity of thespectrophotcmeEer over Èhe range of absorbances measured.
11.2 l{hen lt has been establlshed that a sEralght llne responseis obtalned over the concentratlon range of interest, theanalyst may prefer to run two blanks and dupllcates of onestandard near the Èop of the concentration range.Calculatlon of results ls made easler, but a full set ofstandards should stlll be run occaslonally.
12, References (I) Murphyr il.r âDd Rlleyr J.P.: Ànal. Chln. Acta' 27 (L9621
31-36.
Water & soil miscellaneous publication no. 38 (1982)

TP/L7
(21 van Schowenburg, J.C. and Wallnga, I.: Anal. Chirn. Acta 37
(1967) 27L-274.
(3) Harwood, J.8., van steendern, R.A. and Kuhn, A.L.: !{aterResearch 3 (1969) 4L7-423-
(4)GalesrM.E.Jr.rJulianrE'C'râhdKroner'R'C'(1966):trtethod for quantitative determination of total phosphorus inwater. J. Am. vlat. Ass- , 58, 1363-1368.
(5) Ilarwood, J.E., van Steendorn, R.À. and Kuhn, À.L. (1969): À
cønparlson of some methods for total phosphate analyses.Water Research, 3, 425-432.
(6) Stevenson, C.D. Kíngsford, M. and Edgerley' W.H.I,. (1975):collaborative Tests of t{ater Analysis (The chemaqua
Programme) II. Nitrate Nitrogen, ReactÍve DÍssolvednhoiphorus and Tota1 Phosphorus. ChenÍstry Division' Re¡nrtSerles No. CD2206.
(7) Nydahl, F (Ig78): On the Peroxodisulphate oxidation offótal Nítrogen in t{aters to Nitrate. Water Research, 12,1123-1130.
Address for However thoroughly a method may be testedr there is always thecorres¡nndence ¡nssibillty of a user discovering a hitherto unknown problem.
U6ers witn information on thls nethod are requested to write to:
The Directorlrlater and Soil ConservabionMinistry of lrlorks and Develo¡mentP o Box 12041WELLINGTON I\þRTH
ATTB¡TION: Manager, water Quallty, Research and surveys
Water & soil miscellaneous publication no. 38 (1982)

Water & soil miscellaneous publication no. 38 (1982)

DETERMINATION OF TOTAL NON-FILTERABLE RESIDUE (SUSPENDED SOLIDS) (1981)
1. Performance 1.1 Substance Total residue retaÍned on Whatman GF/C orCharacteristics determined equivalent filter.of the Method
L.2 Type of Generally applicable to fresh or salinesample waters or wastesraters.
I.3 Basis of Gravi¡netric determination of driedmethod residue.
1.4 Range of Subject to sample size: tlpically LO g/n3application (for I lltre sample) to 201000 9,/m3 (for
20 ¡nl eample) .
1.5 Standard The nature of the suspended material anddeviation the representaÈiveness of sampling and
sub-sampllng wiII determine precision inmany cases.
Suspended StandardSolids Deviation(g/n3) (g/n3l
15 5 (a)242 24 (a)
1707 13 (a)
1.6 Limit of Approximately 5 g/m3 for a I litre sample.detection
1.7 Bias The method depends on arbitrary definitionof filter tlpe and drying temperature.The bias of the method cannot therefore bedeÈermined.
1.8 Interferences Large anounÈs of oil or grease(see SecÈion 3)
1.9 Time required Variable, depending on number of filtra-for analysis tíon units available, size of filters
used, size and nunber of dessicators andsize of oven. One set of samples can beprocessed per day.
1.10 Sample volume 20 - 1000 mI
(a) DaÈa frcrn APHÀ-AI{!{A-WPCF nstandard Methods for theExamination of Water and glastewater' 14th Edition, I975.Estímates based on 4 sets of l0 replicates, each analysedby two analysts.
Water & soil miscellaneous publication no. 38 (1982)

2. Principle 2.I
Inter ferences
ApparaÈus
3.
{.
3.1
4.r
ss/2
A well mixed sample is filtered through a standard glass-fibre filter, and the resídue reEained on the filter isdried to constant weight at, I03-105oC.
The presence of readily visÍble amounts of oil or grease maypreclude drying to constant weight in a reasonable time.
Whatnan cF/C filters of diameter appropriate to filterholder (e.g. 2.5r 4.7r 9 or Il qn).
Filter holder: membrane filter funnel, Gooch crucibles andadapters. For waters containing semi-colloidal or floc-culenÈ material which clogs filters rapidly, the use oflarge-diameter filters (e.g. 9 or I1 cm) is advantageous togive adequate residue weights after reasonable fíltrationtímes. A suitable fÍlter holder is the Whatman 3 pieceFilter Funnel catalogue No. 1950 009. This funnel takes a 9
cm fílter paper.
Buchner flasks approprÍate to sample size (e.9., 250, 500 or1000 ml).
Tap vacuum filter pump and manifold.
Individually nunbered aluminiun or staÍnless steelplanchettes, slightly larger than filter paper diameter(Not reguired if Gooch crucíbles are used).
Light and convenient aluminiun planchettes may be made bycutting appropriately sized squares frqn moderately heavyaluminium foil and folding each of the four corners up andslightly inwards. The corners then retain the filter paperand allow stacking of planchettes ín an oven or dessicator.
Dessicator with self-indicating dessicant.
Analytical balance: 200 g capacity capable of weighing to0.0001 9.
Calibrated drying oven known to operate within the tem-perature range I03-105oC t,hroughout the working volune.
MagnetÍc stirrer and followers.
Tvteezers.
Cleanliness
Eilter holders should be cleaned immediately after filtra-tlon of each sample. This will often be achieved by thedistÍIled water rinse procedure included in the method, butif adherent material is visible on the holder, cleaning byrubbing wÍth a stiff brush and detergent may be necessary.
4.2
Water & soil miscellaneous publication no. 38 (1982)

5. SanpleCollection &
Preservation
6. AnalyticalProcedur e
ss/3
Planchettes should be cleaned after each seÈ of analyses, byrubbing with a stiff brush in water containing detergent andthen rinsing thoroughly with dístilled water. Dry in thedrying oven and store in a desiccator. If filtrates or resi-dues are to be analysed for other constiÈuents, such asphosphorus¡ check that. the washing procedure does not causecontamination.
5.1 Requirements for collection of representatÍve samples frcrnwaters or waste streams for determination of total non-filterable residue are not discussed here. References 2, 3
and 4 give information on this topic.
5.2 A number of different biological physical and chemical pro-cesses may change Èhe concentrations of total non-filterableresidue in samples after collection and these processesoccur at greatly different rates in dífferent tlpes ofsample. In general, where residues are predcminantlyorganic, samples are Iikely to be unstable, whereas con-centrations of predominantly inorganic non-filterable resi-dues may be quite stable for long ¡æríods. If samples areto be held for more than a few hours (with chilling), preli-mínary checks should be undertaken to establish the stabi-lity of the sample t1pe.
Filtration and weighing of residues
6.1 Dry, numbered GF,/C filter papers aÈ t05oC. If filter papersare to be handled on numbered planchettes or Gooch crucibles,the dried weight of filter paper plus numbered plancheÈte(or crucible) should be recorded. This is weight a.
trOTE: cF/C filter papers lose weight on initial drying atf05oC. lests have shown that GF,/C filter papers donot lose weight on rinsing but this should beverified to each operators sat,isfaction.
6.2 Place a weighed filter ín a filter holder, or a Gooch cru-cible and filÈer in an adaptorr wêt the filter withdistilled water and apply suctÍon.
6.3 EstimaÈe the rrolume of sample required to give a residue ofat least l0 mg and not more than 10 ngrlon2 of filter area.
6.4 If samples are to be sub-sampled, use one of the followingprocedures:
6.4.1 Shake and ¡nur method. If the sample bottle is fuII,shake the sample briefly and ¡nur about IOt of thebottle volu¡ne to waste. Recap the bottle and shakeit vigorously for 15-30 seconds, immediately uncapthe bottle and, as quickly as possible, ¡rour approxi-mately the sub-sample volume required into a gra-duaÈed cylinder. Record the sub-sample volume.
Water & soil miscellaneous publication no. 38 (1982)

ss/4
ThefastesttransferandmostrepresentatiYesub-samplingisobtainedifscrewcaPsonsamplebottlesure t"pÍ"ced by rubber or plastic bungs for the agi-tation stage.
6.4.2 t'tagnetic stirrer and pipette nethod' Place a cleanmagnetic follower in the sanple bottle and stir thesampleonthemagneEicstirreratfullspeed.tfiththe stirrer o¡nrating, wiÈhdraw a suitably-sized sub-sanple by drawing iÈ rapidly into a syringe or largepipette having an orifice no smaller than 3 run'
The magnetic follower may be removed convenientlyfrcmthesamplebottlewithasecondfollaer,heldin a short lengÈh of plastic tubing which is slidover the end of a glass rod.
6.5 Filter the sanple or sub-sample and rinse any remainingresidue fro¡n the sanple bottle, sub-samplin9 device orintermediate sub-sample container into the filter reservoir,usÍng distilled waÈer. Rínse any residue adherÍng to theside of Èhe filter holder or Gooch crucible onto the filter.
6.6 Wash the residue on the filter with distilled water.
6.7 Record the volume of sample (exclusive of rinsings)filtered. If rpre convenient, the weight of sanple fílteredis a satísfactory approxination to volu¡ne'
6.g carefulty transfer the filter paper and residue (usingtweezers) to its appropriate planchette or, if using aGooch crucible, remove it from its adaptor'
6.9 when all samples have been filtered, place in the 103 -I05OC drying oven, as a batch. Dry for one hour or more(according to exPerience) .
6.I0 Transfer the batch of samples frcm the oven to &ssicator(s)and allow to cool for half an hour or more'
6.It !{eigh and record the weÍghts of each fÍtter (or filter PIusplanchette or filÈer plus crucible).
6.I2 Repeat the drying, cooling and weighing cycle unÈil a
consÈanÈ weight is attained or until weight loss on suc-cessive weigñings is less than 0.0005 9. This is weight b.
galculation of results
6.13 Total non-filterable residue = weight of residue = (b - a)
sus¡nnded solids (g/m3) = weight of resigue in ¡ng
samP1e volume in litres
Water & soil miscellaneous publication no. 38 (1982)

ss/5
7. References (I) APITA-AWWA-WPCF Standard Methods for the nxaminaÈion of water
and Vlastewater, I4th Edition, 1975
(2)HuibregtsêrK.R.andMoserJ.H.lHandbookforSamplíngandSarnple Preservation of Water and Wastewater'EpA-600/4-76-049, September 1976. Available throughNaEional TechnÍcal Information Service' Springfield'Virginia 2216Ir USA.
(3) Griffiths, G. 4., Estimation of Sediment Yielit in NZ Riversand Streams, (Ín PreP) '
(4)GuylH.P.andNormanv.w.Field,MethodsforMeasurementofFluvialsediment,TechniguesforWater.ResourcesInvestigationsoftheUnitedstatesGeologicalsurvey'Chapter C2, Book 3 ' L976
Address for However thoroughly a method may be tested' there is always the
corres[Þndence ¡nssiblity of á u=.t discovering a hitherto unknown problem'
Users wíth information on this method are reçJuested to write to -
The Directorwater and Soit ConservationMinistrY of Works and Develo¡mentP O Box 12-041WELLINGTON IPRTH
ATTB{TION:ManagerrYÍaterQuality'ResearchandSurvey
P D HASSELBERC, GOVERNMTNI PRINTTR, WILI-INCTON, NIW ZTALAND-198528491t --100 book!/12l84PTWater & soil miscellaneous publication no. 38 (1982)

b
Water & soil miscellaneous publication no. 38 (1982)

WATER & SOIL MISCELLANEOUS PUBLICATIONS
4. Synthetic detergents working party report. ($1)5. Water quality control committee report. ($1)6. Suggestions for developing flow recommendations for in-stream uses of N.Z. streams. ($1)B. Water rights for the Clyde Dam, Clutha hydro power development. ($1.50)
12. Catchment register for New Zealand, Volum ) 1. ($8)13. New Zealand recreational river survey. Pt 'l: lntroduction. ($5)14. New Zealand recreational river survey. Pt 2: North lsland rivers. ($5)15. New Zealand recreational river survey. Pt 3: South lsland rivers. ($12)17. Hawke's Bay area planning study: Urban capability assessment. ($4)19. Rakaia water use and irrigation development. ($3)22. Ba.seline water quality of the Manawatu warer region 1977-75. (ç3)23. Effects of land use on water quality-a revie v. ($5)24. Summaries of water quality and mass transport for Lake Taupo catchment, New Zealand. ($5)25. The report of the water quality criteria working party. ($3)26. Handbook on mixing in rivers. ($8)28. Bibliography of oceanography and sedimentology for the Northland-Auckland coast. ($3)29. Aquatic oxygen seminar proceedings. Hamilton, November 19S0. ($10)30. Future groundwater research and survey in New Zealand. ($3)3'1. Land and water resource surveys of New Zealand: map coverage and reference lists. ($10)32. A procedure for characterising river channels. ($8)33. The USEPA 1980 ambient water quality criteria: a compilation for use in New Zealand. ($5)36. New Zealand river temperature regimes. ($B)37. Landslip and flooding haza_rds.in. Eastbourne Borough-a guide for planning. ($g)38. Physical and chemical methods for water quality analysis. ($5)39. A guide to the common freshwater algae in New Zealand. ($5)40. Peatlands policy study; reports and recommendations. (95)42. A draft for a national inventory of wild and scenic rivers: Part 1, nationally important rivers. ($2)43. A review of. land potential in the Bay of Plenty-Volcanic Plateau reg¡on. (glò)44. An approach to stormwater management planning. ($5)45. Catchment management for optimum use of land and water resources: Documents from an ESCAp
seminar. Part 1-lntroductory and country statements. ($10)
197819781978197919811981198119811 9801 98019801981198119811981198119821982198219821982198219821982198219821982198219821982
46. Catchment management for optimum use of land and water resources: Documents from an ESCAp 1gB2seminar. Part 2-New Zealand contributions. ($10)
47. River low flows: Conflicts of water use. ($3)48. Catchment control in New Zealand. ($15)49. River and estuary mixing workshop; Hamilton. (gB)50. Directory. of activities at the Water and Soil Science Centres: 1983. (93)51. Handbook oh estimating dissolved oxygen depletion in pclluted rivers. 1gg)52. Remote sensing for soil conservation. ($12)53. Review of water and soil conservation research 1981. ($8)54. Biological methods for water quality surveys. ($5)56. Deepwater waves off Hicks Bay and the North-east coast, North lsland (g5)57. Regional flood estimation-a design procedure ($3)58. Wetlands-a diminishing resource. ($10)59. shelter research needs in relation to primary production. The report of the
Working Party. ($10)60. Nutrient processing and biomass prodr-rction in New Zealand estuaries. ($5)61. C.ommissioning and maintaining a water well in New Zealand. ($3)62. Plant materials and management options for soil conservation on the Port Hills, Christchurch.
($+¡63. Design of water quality surveys. ($B)64. Hydrologists safety handbook. ($8)65. Directory of water quality and liquid and waterborne wastes research in New Zealand, 1983. (96)66. Construction and operat¡on of a sea sled for seabed surveying. ($2)67. lndex to hydrological recording sites in New Zealand, 1984. (95)68. A national inventory of wild and scenic rivers. (92)69. Land treatment of wastes: Proceedings of seminar. Part 'l70. Land treatment of wastes: Proceedings of seminar. Part 271. Bibliography of hydrological and sedimentological studies in Manukau and Waitemara Harbours,
Auckland. ($3)72. fhe New Zealand Land Resource lnventory rock type classification. Part l: North lsland. 198573. The New Zealand Land Resource lnventory rock type classification. Part ll: South lsland. 19857!. \nd use capability classification of the Southern Hawke's Bay-Wairarapa region. 198575. Correlation of North. lsla.nd regional LUC units from the New Zealand iand É"rour." lnventory. 198576. Ocean Outfall Handbook. 19g5
198219821 9831 98319831 9831 9831 9831 9831 9831984
National Shelter 1984
1 98419841984
19841 9841984198419841 9841 9851 9851984
Water & soil miscellaneous publication no. 38 (1982)

1.2.3.5.
9.11.12.13.
WATER & SOII TECHNICAT PUBTICATIONS
Liquid and waterborne wastes research in New Zealand, 1976 (91)Sampling of surface waters. ($1)Water quality research in New Zealand 1976. ($1)Late Quaternary sedim.entary processes at Ohiwa Harbour, eastern Bay of Plenty with specialreference to property loss on Ohíwa. ($1)Research and Survey annual review 1977. ($2)The Waikato River: A water resources study. ($12)A review of the habitat requirements of fish in New Zealand rivers. ($3)The Ruahine Range: A situation review and proposals for integrated management of the RuahineRange and the rivers affected by it. ($5)A Survey of New Zealand peat resources.($10)Effects of urban land use on water quant¡ty and quality: an annotated bibliography. (g5)Research and Survey annual review 197S. (92)lnvestigations into the use of the bacterial species Bacillus stearothermophilus and Escherichia coli(HrS positive) as tracers of groundwater movement. ($1.50)A review of some biological methods for the assessment of water quality with special referenceto New Zealand. Part 1. ($3)
llVdroloeV of the catchments draining to rhe pauatahanui lnlet. (g3)Potential for contamination of the Heretaunga Plains aquifers ($10)Revised checklist of freshwater algae of New Zealand. part l. (glOiRevised checklist of freshwater algae of New Zealand. part Z. (glOi
't977
197719771978
14.'15.
16,17.
18.
19.20.21.
1.
2.5.6.7.B.
9.
'1978
197919791978
1978198019791980
1979
22.
23.24.25.26.
The frequ-ency of high intensity rainfalls in New Zealand, Part I. A. l. Tomlinson ($5) 1980Regional flood estimation in New Zealand. (98) 1gg2Coastal hazard -mapping as a planning technique for Waiapu County, East Coast, North lsland, 19g1New Zealand. ($5)A review of some biological methods for the assessment of water quality with special reference 19g1to New Zealand. Part 2. ($4)
1981198219841984
WATER & SOIL MANAGEMENT PUBLICAT|ONS
Regional planning and development. (91)Wetlands. ($1)Forest operations guideline. ($2)A guideline for the construction of access tracks and firebreaks. ($2)A guideline to skifield development. (92)A wetlands guideline. (95)A water and soil guideline for mining. (910)
1975197519781980198019821 983
a
Water & soil miscellaneous publication no. 38 (1982)