WATER-ENERGY NEXUS OF WATER AND WASTEWATER …
53
WATER-ENERGY NEXUS OF WATER AND WASTEWATER SERVICES IN LEBANON SOCIO-ECONOMIC ASSESSMENT OF THE WATER-ENERGY NEXUS
Transcript of WATER-ENERGY NEXUS OF WATER AND WASTEWATER …
WATER-ENERGYNEXUS OF WATERAND WASTEWATER SERVICESIN LEBANON
SOCIO-ECONOMIC ASSESSMENT OF THE WATER-ENERGY NEXUS
This document has been produced with the financial assistance of the European Union. The contents of this document are the sole responsibility of the authors and do not necessarily reflect the views of Oxfam, IFI and can under no circumstances be regarded as reflecting the position of the European Union.
This research report was produced through the combined efforts of the IFI team (Nadim Farajalla, Rana El Hajj, Marc Ayoub, Lea Zgheib, Abed Hajj Chehadeh, Francis Hanna and Nay Karam) and the Oxfam team.
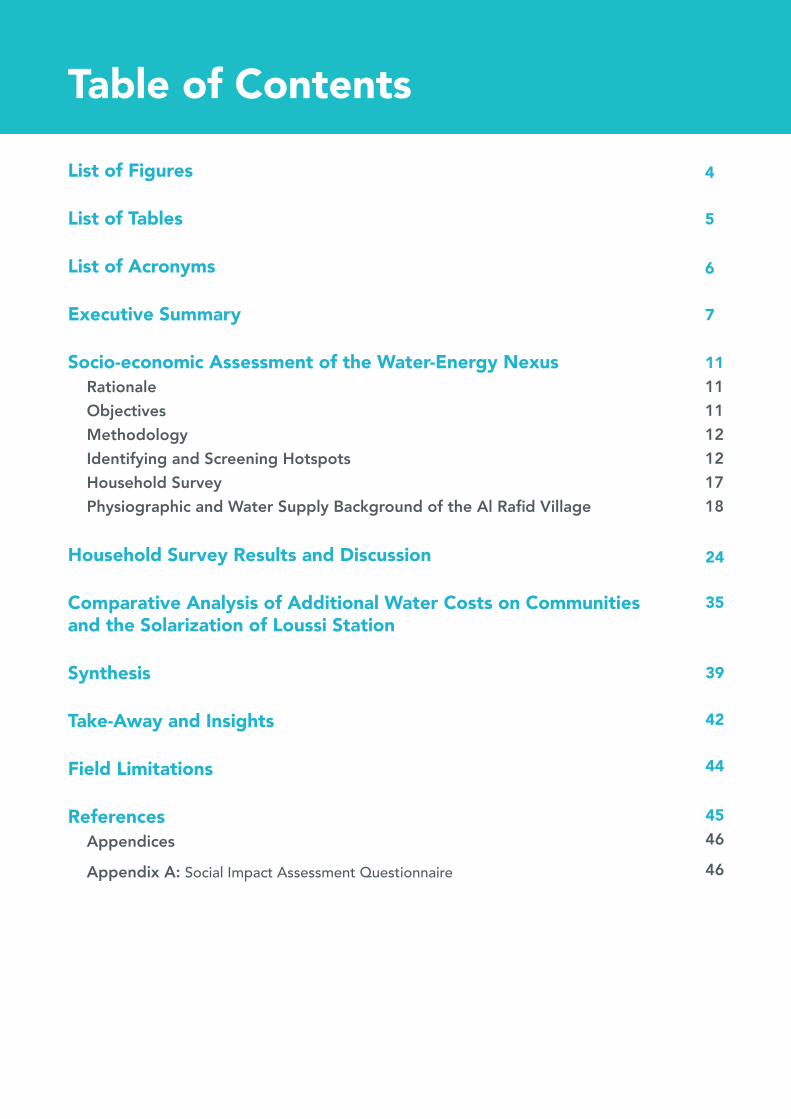
List of Figures
List of Tables
List of Acronyms
Executive Summary
Socio-economic Assessment of the Water-Energy Nexus Rationale Objectives Methodology Identifying and Screening Hotspots Household Survey Physiographic and Water Supply Background of the Al Rafid Village
Household Survey Results and Discussion
Comparative Analysis of Additional Water Costs on Communitiesand the Solarization of Loussi Station
Synthesis
Take-Away and Insights
Field Limitations
ReferencesAppendices
Appendix A: Social Impact Assessment Questionnaire
4
5
6
7
11111112121718
24
35
39
42
44
4546
46
Table of Contents
Volume V: Socio-Economic Assessment of the Water-Energy Nexus 4
17
19
20
23
24
25
26
27
27
28
29
30
30
31
32
33
33
37
Figure 1. Map of villages serviced by Loussi station
Figure 2. Rashaya district (blue area in the inset map) and Al-Rafid village selected case study area
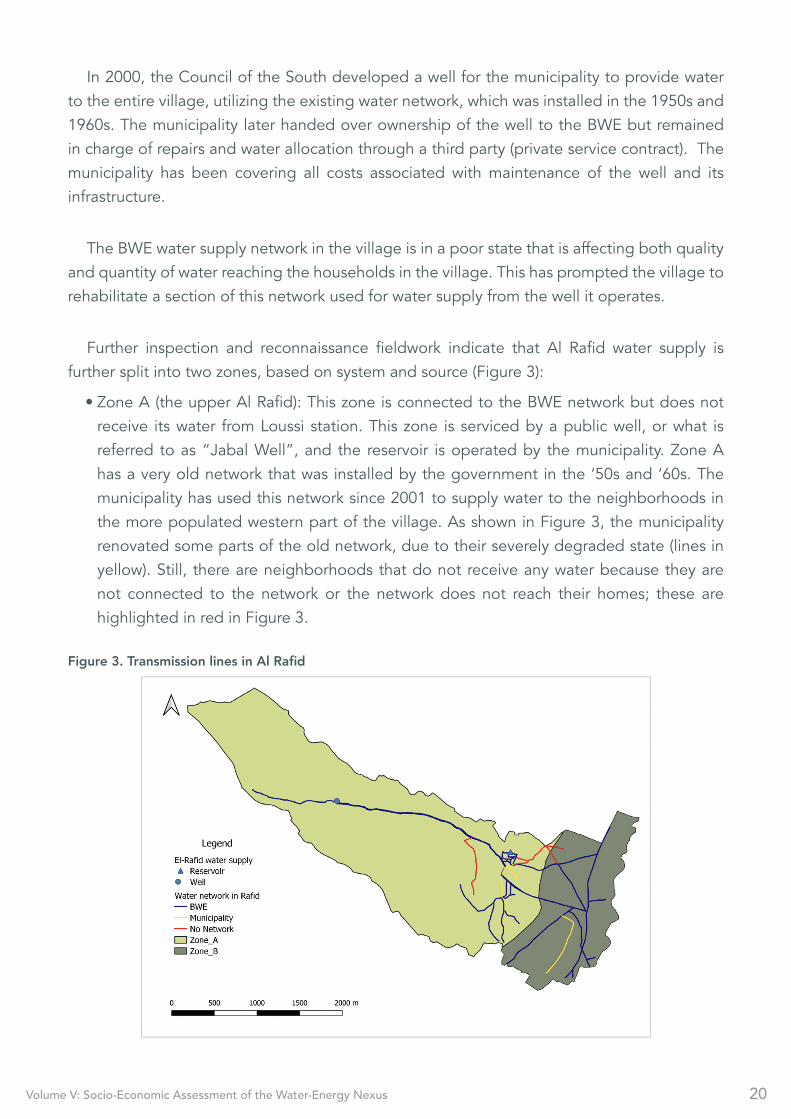
Figure 3. Transmission lines in Al Rafid
Figure 4. Map showing the digitized building, and the water supply infrastructure in the Al Rafid area
Figure 5. Field reconnaissance with the president of the Al-Rafid municipality
Figure 6. Reasons for household water shortages in summer and winter in zones A and B
Figure 7. Perception regarding linkages between water and electricity availability in Al Rafid
Figure 8. Reliance on water reservoirs and associated capacities in Zone A and B
Figure 9. Income distribution in Al Rafid per household
Figure 10. Income to expenditure per household
Figure 11. Perception on water quality in Zone A and Zone B of Al Rafid
Figure 12. Household water use in Al Rafid
Figure 13. Alternative sources for drinking/cooking water in Zone B
Figure 14. Subscription and collection rate to BWE in both zones of Al Rafid
Figure 15. Water affordability in Zone A and Zone B of Al Rafid taking into consideration bottled water and trucking water costs as well as BWE fees.
Figure 16. Water affordability in Zone A and Zone B of Al Rafid taking into consideration the BWE subscription fees
Figure 17. Preferred institution that respondents are willing to pay water bills or more to in Al Rafid
Figure 18. Responsibility and satisfaction with water provisioning service
List of Figures
Volume V: Socio-Economic Assessment of the Water-Energy Nexus 5
14
14
15
18
23
32
36
41
Table 1. First Level Screening for the NLWE
Table 2. List of Top Ten Energy Consuming Stations in Akkar
Table 3. List of the Ten Selected Pumping Stations in 2016
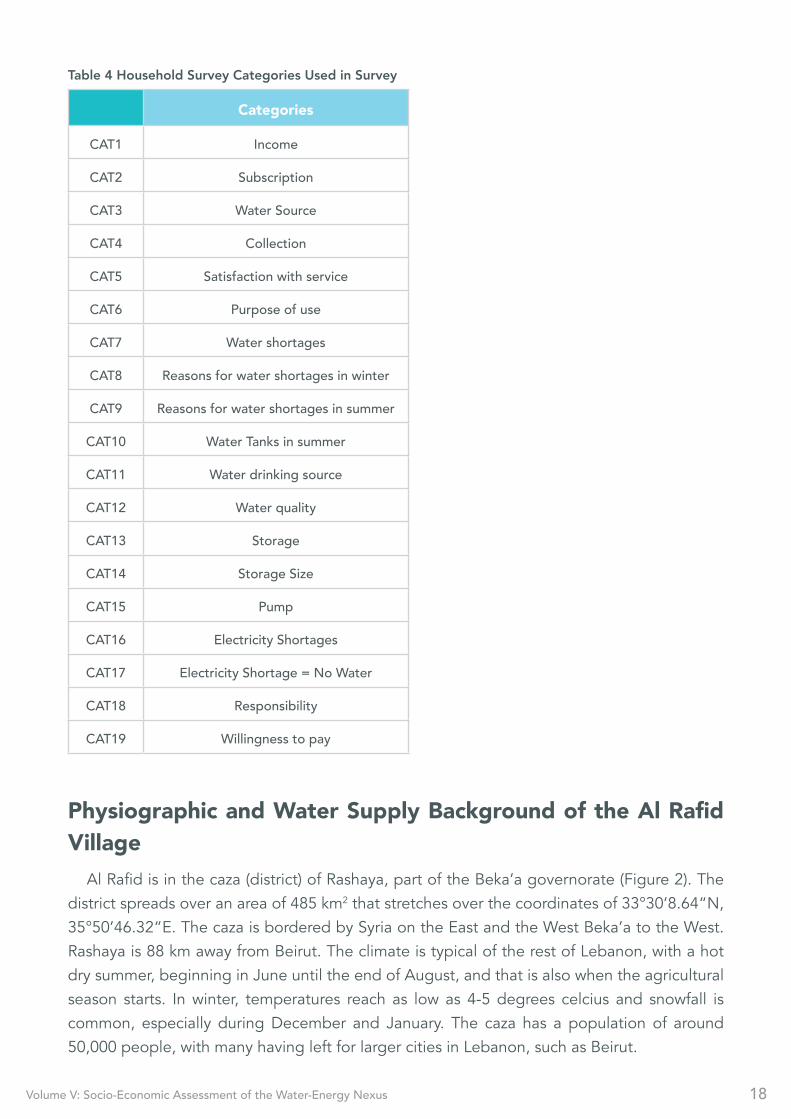
Table 4. Household Survey Categories Used in Survey
Table 5. The Total Number of Buildings in each Zone of Al Rafid, and the Sample Size for each Zone Calculated at a 95% Confidence Level and 10% Confidence Interval
Table 6. Scores for Percentages Range of Expenditure on Water Resources as Percentage of Total Income
Table 7. Simulation results when considering a 130 kWp system, with and without storage, or a diesel generator of 120 kWp capacity
Table 8. Comparative Summary of the Al-Rafid Case Study
List of Tables
Volume V: Socio-Economic Assessment of the Water-Energy Nexus 6
SIA Social Impact Assessment
BMLWE Beirut and Mount Lebanon Water Establishment
BWE Bekaa Water Establishment
WE Water Establishment
EDL Electricité du Liban
RWE Regional Water Establishment
WEF Water Energy Food
ILO International Labour Organization
LL Lebanese Lira
USAID United States Agency for International Development
CAS Central Administration of Statistics
List of Acronyms
Volume V: Socio-Economic Assessment of the Water-Energy Nexus 7
Social and economic impact assessments are used by governments, institutions, companies, academia, and communities to identify, assess, or manage the impacts of a project, a disaster, or a public policy (or absence of). An impact assessment is a way of structuring both the analysis and the underlying information, for policy-makers, of intended and unintended social consequences, of planned or unplanned interventions, or any social change processes, on affected communities from the earliest stages of the planning process (ex-ante) to effects after occurrence (ex-post). Considering the close interlinkages between energy (electricity) and water service provision in Lebanon, and the absence of any assessments that examine the impact of this nexus from a socio-economic dimension, this work examines the impacts of the water-energy nexus (and the absence of an integrated policy) and its related challenges and effects on the end-users at the municipal and household level. The aim is to provide policy-makers with a deeper understanding of the social dimensions of the interlinkages between water and energy in water service provision. The provided novel information will serve as insight for policy-makers to act on policy reforms to reduce any social dysfunctionality and inequalities arising from W-E nexus. This approach is a form of evaluation research, and looks at a set of economic and social aspects to specifically evaluate how households, particularly the poor and vulnerable, are affected by water distribution, more importantly the energy aspect (availability, cost, type, etc.) at the water distribution level (Räikkönen et al., 2016).
This is a two- stage assessment study that first underwent a methodological approach to select a case study area and then apply a household survey within the selected area. The first stage included a two-level screening exercise: the first level implemented at establishments level and the second level at the stations level, in order to identify hotspots in Lebanon where energy presents challenges to water supply at the utility level. This first level identified energy intensive water stations (pumping and/or treatment), based on the highest electricity bills taken with regards to the number of subscribers. The second level screening was based on selected criteria at station levels to identify the case study village. This was important to ensure that the nexus challenges are accounted for intrinsically in the selected case study. Once the case study area was identified, stratified sampling helped in selecting the households for the survey.
This methodology was applied to BWE and NLWE jurisdiction for the following reasons:
recent findings by ILO and CAS (2020), “Labour Force and Household Living Conditions Survey in Lebanon”, found that reliance on the water network as a primary source of drinking water is the highest in the Bekaa and North Lebanon. In parallel, residents within Bekaa and North Lebanon Water Establishments heavily rely on private wells, which are associated with additional energy costs, along with other features, such as more extensive agricultural activities, high number of refugees, high poverty rates, and humanitarian needs.
Executive Summary
Volume V: Socio-Economic Assessment of the Water-Energy Nexus 8
After the first-level screening, it was not possible to conduct the second-level screening for NWLE region due to a lack in data. Conducting the two-level screening at BWE resulted in the selection of Al Rafid village, Rashaya, serviced by Loussi water station, as the case study area.
A survey of 156 households was then conducted in Al Rafid (total of 787 households) to assess:
• Water availability at the household-level and associated challenges, especially in relation
to electricity.
• Water quality, social inequality, and energy linkages.
• Water-Energy nexus, water affordability, and willingness to pay.
Water availability at the household level in Al Rafid is dependent on various sources: Loussi station operated by BWE, and a municipality operated-well that pumps to a 5,000 m3 reservoir. The study area was divided into two zones, both of which have major water allocation problems. Zone A, which is provided for by the municipality operated well (Jabal), and Zone B, which is supplied by the BWE, more specifically by Loussi station. The BWE water supply network in the village had deteriorated, affecting both quality and quantity of water reaching the serviced households. This has prompted the municipality to rehabilitate the section of the network used to provide water from the Jabal Well.
Survey results show high occurrence of water shortages/unavailability all year round in all of Al Rafid households, in general, but indicate a significant inequity associated with water availability and quality between both zones with households in Zone A (serviced by Jabal Well), faring better than those in Zone B. Respondents, however, in Zone A were better able to identify the linkages between electricity availability and water shortages. In Zone A, respondents identified electricity availability as one of the “technical” issues related to water shortage, as water provision by the Jabal Well fail; the pump is unable to operate due to power outages by EDL. Respondents in Zone B on the other hand, in their majority, were not able to identify such a link. Being recipients of water from Loussi stations, they were unaware of the electricity-water challenges at the level of the utility.
Water shortages/unavailability, coupled with poor water quality, especially in Zone B serviced by the Loussi station, has resulted in additional burden on households and further inequity. Respondents from households in Zone B described the supplied water as poor-quality water because of its strong chlorine odor. Therefore, most refrain from using the provided water for drinking or cooking, with only 6.4% of respondents use it for drinking/cooking. Thus the majority of the households must resort to alternative sources of water, such as bottled water and water trucks. Even though, most respondents in Zone A use the water that reaches their households for drinking and cooking (88%), they also resort to alternative water sources, especially during the summer during peak water shortages. In the absence of any water treatment, the direct link between poor water quality and energy is not evident
Volume V: Socio-Economic Assessment of the Water-Energy Nexus 9
in our case study. However, it is worth mentioning that water-trucking and bottled water costs both embed energy-associated costs that are covered by households, resulting in an additional burden on the predominantly low-income households of Al Rafid.
Most of the people interviewed in this study stated that with the current economic climate, they have not occupied a job in more than six months. The surveyed sample shows that, with or without taking additional water-costs into consideration, more than 50% are not able to meet expenditures.
Total household expenditure on water in Al Rafid includes subscription to BWE (242,000 LL/year), payment for delivery of water by tankers, and bottled-water purchases. Thus, water affordability calculation for sampled households in Al Rafid shows that more than 50% of households in both zones (Zone A and Zone B) are faring poorly to very poorly, with Zone A households being slightly better off. This indicates that households spend more than 5%, and some up to more than 10%, of their income on water, compared to the recommended benchmark of less than 5%. Assuming a scenario where Al Rafid does not experience water shortages and the BWE subscription being the only household water expense, water affordability improves significantly with less than 10 % of the respondents paying more than 5% of their income on water. Despite the financial burdens of low income and an economic downturn in households, respondents were still willing to pay more for water service provision (or even pay their subscription fees for those who do not currently do that) as long as there was an improvement in quantity and quality delivered. Most respondents in both Zone A and Zone B stated that they prefer to pay the municipality for such a service, due to its proven record in better service provision and their mistrust in BWE performance. The case of Al Rafid is just one of many cases in Lebanon where electricity shortages and quality contribute to poor water service provision in households. Such interlinkages are present at different levels, starting with water pumping stations at the utility level, to water pumping from wells at the village level, and imbedded water-trucking and bottled-water costs at the household level. Eventhough electricity availability at the household level, in the case of Al Rafid, is not a prominent challenge for water availability, this would enter the picture in urban settings with high-level buildings.
This case study brings forward the role that municipalities are defacto playing in water-service provision, and some of the associated tension that this might lead to with the RWEs. The interlinkages between electricity and water availability at establishment level, as depicted in this case study, have been shown to perculate down to the household level, translated into inequalities, an additional financial burden, and socio-economic challenges. However, the main issue remains at a higher level of planning with electricity challenges, at utility levels, chronically ignored. Improved integrated planning between electricity service providers and water service providers (both under the same ministry) would help in partially solving the problem.
Volume V: Socio-Economic Assessment of the Water-Energy Nexus 10
•
• o º
o º
To further elaborate the link between water and energy at several levels, the following points are listed:
The first level of interlinkages can be seen through the screening process, which identified the Loussi station as one of the stations with the highest electricity bills, and one which affects a multitude of villages (and their households), once pumping is arrested due to lack of electricity.
The second level of interlinkages can be seen in the results of the study at Al Rafid:
At the town level: In Zone A, water is directly pumped into the network from the Jabal Well, whenever EDL power is available; thus whenever there are power outages, and because there are no backup generators, water is not pumped into the water supply network, leading to water shortages.
At the station level: If there are power outages at the Loussi station, and because there are no backup generators, no water is provided by the station to the village, especially Zone B.
It is true that some components of water supply, such as water quality, cannot be directly linked, in the case of Al Rafid, to the lack of electricity; water availability and water affordability can be readily and directly linked to energy and water management at the utility level. With respect to the former, as was shown above, power outage at Loussi means there is no water at Al Rafid. As for the latter, it is reflected in the management of when to pump water by the municipality—i.e. pumping to the reservoir when there is electricity.
Volume V: Socio-Economic Assessment of the Water-Energy Nexus 11
Social and economic impact assessment is used by governments, institutions, companies, academia, and communities to identify, assess or manage the impacts of a project, a disaster, or a public policy (Smyth & Vanclay, 2017). The socio-economic impact is best understood as the process of analyzing, monitoring, and informing on the advantages and disadvantages of a policy (or absence of policy) or project on society, as a whole or on specific groups. An impact assessment is a way of structuring both the analysis and the underlying information for policy-makers of intended and unintended social consequences, of planned or unplanned interventions, or any social change processes, on affected communities, from the earliest stages of the planning process (ex-ante) to effects after occurrence (ex-post) (Arce-Gomez, Donovan, & Bedggood, 2015).
RationaleThere is a very close interlinkage between energy (electricity) and water-service provision,
especially in Lebanon. A key impact of this interlinkage is the socio-economic impact, and there are no local studies of this impact; hence, the need for such a study arises. This work examines the impact of the water-energy nexus and the related challenges on end-users at the municipal and household level; it also addresses the absence of a policy integrating energy and water. The aim is to provide policy-makers with a deeper understanding of the social dimensions of the interlinkages between water and energy in water service provisioning. The novel information generated by this study will provide policy-makers with an insight into social dysfunctionality and inequality that might arise from any imbalance in the water-energy nexus. The approach that will be followed is a form of evaluation research, and looks at a set of economic and social aspects to specifically evaluate how households, particularly the poor and vulnerable, are affected by water distribution, and the impact of energy on them.
ObjectivesThere are four main objectives for the study:
• Identify the interlinkages between water availability at the household level and electricity outages.
• Determine the social inequalities that might arise due to imbalances in these interlinkages.
• Shed light on the “alternatives” adopted by households, as adaptation measures account for electricity associated water shortages, and determine whether such measures reflect on a household’s socio-economic condition.
• Reveal how electricity-associated water shortages reflect on water affordability.
Socio-economic Assessment of the Water-Energy Nexus
Volume V: Socio-Economic Assessment of the Water-Energy Nexus 12
MethodologyIdeally gauging the socio-economic impact of the water-energy nexus, actual case studies
would be reviewed and supported by field surveys; however, as stated earlier, there are no references to such studies in the literature. Furthermore, conducting supporting fieldwork in a multitude of areas was not possible, due to time constraints, especially after the turmoil in the country post-October 2019. Thus, it was decided to conduct the fieldwork/survey in one area. The research team understands that working with one case study has its limitations, as it cannot be generalized; however, it gives important insight into the possible socio-economic repercussions in the absence of an integrated approach to water-energy planning.
In order to choose a case study and meet the study objectives, two main steps were followed. The first step included three screening levels: a country level screening; a second screening at the water station level; and a third screening to identify the case study village. The second step comprised of the selection of the sampling method that would help select the households to be interviewed. A random sampling method was adopted to ensure that all conditions that may be encountered, and all water supply scenarios, were considered in the analysis. Data collection was achieved through desktop analysis and review, and also through the execution of a field questionnaire in the selected village for the appropriate water establishment. The questionnaire for the latter was done through phone interviews and face-to-face meetings.
The sections that follow describes the main steps that followed in meeting the study’s objectives.
Identifying and Screening HotspotsZooming in on a case study area required the identification of hotspots in Lebanon, where
energy presents challenges to water supply at the utility level. This approach would ensure that the nexus challenges are accounted for intrinsically in the selected case study.
This process is comprised of a three-level screening process that is detailed in the following sub-sections.
Level 1: A country-level screening processThe first screening process consisted of identifying hotspots within each water establishment
where energy consumption is most intensive, in terms of water service provision. For that purpose, the water stations (pumping and/or treatment) with the highest electricity bills were compared according to the number of subscribers served. Such a comparison categorized the areas according to the cost of electricity for water provision per paying subscribed household. The serviced “cluster of villages” with the highest electricity bill for water provision per paying subscribed household was identified as hotspots and was tagged for further examination.
Volume V: Socio-Economic Assessment of the Water-Energy Nexus 13
Level 2: Screening at the utility levelThe villages serviced by the station that ranked highest in terms of “cost of electricity for
water provision per paying subscribed household” were identified and the charges validated with the operator, and mapped. Subsequently, the mayors of the identified villages were contacted to collect further information such as:
• The number of subscribed households in the town.
• Collection rate (indicating dependency level on the WE for water distribution).
• The number of private wells and reservoirs, in addition to the water provided by the WE.
• Cost of energy consumption and water distribution that is covered by the subscribers, in addition to the yearly subscription fee.
• Distribution or maintenance problems to the network that provides water from the NLWE.
• Problems with the water network distribution and storage.
It should be noted that the Level-2 screening process was limited to the BWE and NLWE, primarily due to findings by a recent ILO and CAS (2020) study, “Labour Force and Household Living Conditions Survey in Lebanon”, which determined that reliance on the public water network as a primary source of drinking water as the highest in the Beka’a and North Lebanon. The study determined that this reliance in Baalbek-Hermel mouhafaza represents 51.6% of households, 34.1% in the Beka’a mouhafaza, 33.3% in Akkar mouhafaza, 29.1% in the North Lebanon mouhafaza, while it drops to less than 20% in Nabatieh, South Lebanon and Mount Lebanon, and reaches only 7.7% in Beirut; the opposite trend is found for reliance/use of bottled-water. Furthermore, residents within the Beka’a and North Lebanon Water Establishments were found to be heavily reliant on private wells as a primary source for service water1: Akkar with 41.2% of its households, followed by Baalbek-Hermel with 27.1%, Beka’a with 22.7%, and North Lebanon at 22.2%.
Another reason for limiting the hotspot screening to the NLWE and BWE was, in addition to the combination of reliance on public networks and private sources (thus additional energy costs), the presence of other features such as:
• All economic sectors are represented in these regions, with agriculture dominating;
• The presence of the highest rates of refugees, poverty, and humanitarian needs;
• The availability and/or readiness to share data by the water establishments.
North Lebanon Water EstablishmentThe North Lebanon Water Establishment (NLWE) currently serves an estimated 126,000
households.2 In Tripoli alone, there are around 10,000 illegal subscribers. According to data acquired from the NLWE, the water bill collection rate is around 60%. All seven directorates within the NLWE were analyzed: the number of subscribers for 2017 and 2018, the electricity bills for all water stations (Table 1), and the collection rates for 2017 and 2018. Even though
1 Service water is all water that is not used for drinking or cooking.2 Based on personal communication with the financial manager at the NLWE.
Volume V: Socio-Economic Assessment of the Water-Energy Nexus 14
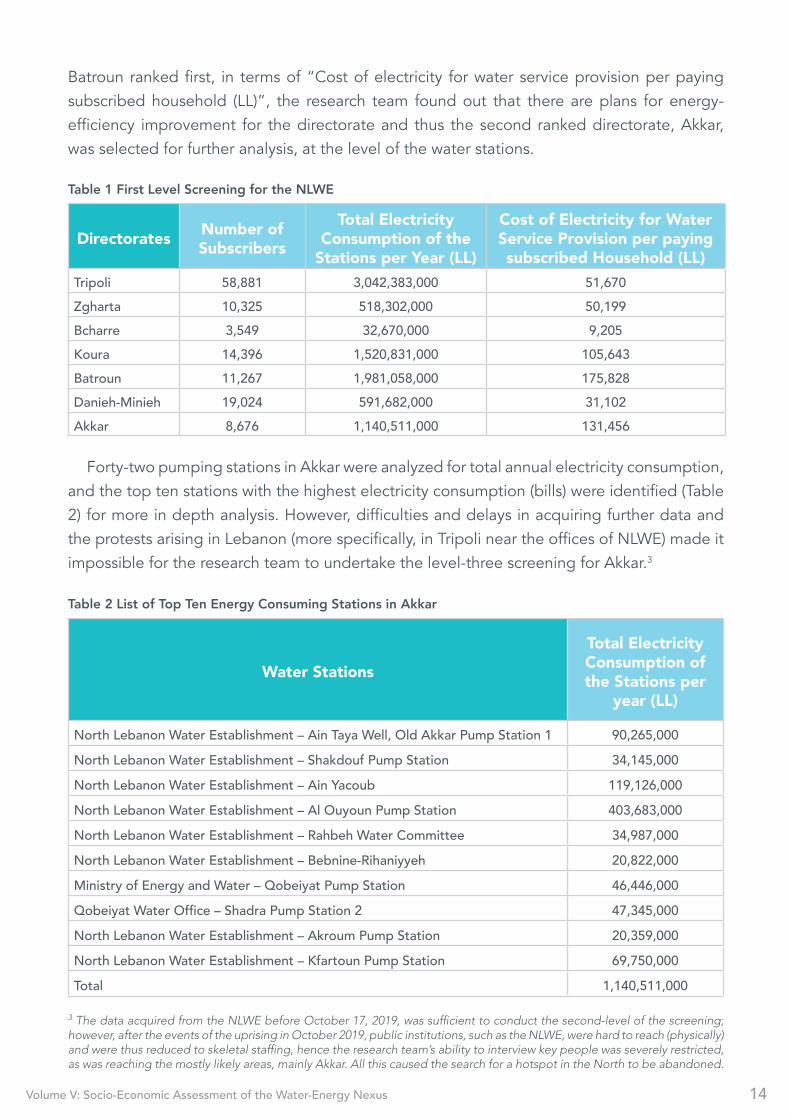
Batroun ranked first, in terms of “Cost of electricity for water service provision per paying subscribed household (LL)”, the research team found out that there are plans for energy-efficiency improvement for the directorate and thus the second ranked directorate, Akkar, was selected for further analysis, at the level of the water stations.
Forty-two pumping stations in Akkar were analyzed for total annual electricity consumption, and the top ten stations with the highest electricity consumption (bills) were identified (Table 2) for more in depth analysis. However, difficulties and delays in acquiring further data and the protests arising in Lebanon (more specifically, in Tripoli near the offices of NLWE) made it impossible for the research team to undertake the level-three screening for Akkar.3
Directorates Number of Subscribers
Total Electricity Consumption of the
Stations per Year (LL)
Cost of Electricity for Water Service Provision per paying subscribed Household (LL)
Tripoli 58,881 3,042,383,000 51,670Zgharta 10,325 518,302,000 50,199Bcharre 3,549 32,670,000 9,205Koura 14,396 1,520,831,000 105,643Batroun 11,267 1,981,058,000 175,828Danieh-Minieh 19,024 591,682,000 31,102Akkar 8,676 1,140,511,000 131,456
Water Stations
Total Electricity Consumption of the Stations per
year (LL)
North Lebanon Water Establishment – Ain Taya Well, Old Akkar Pump Station 1 90,265,000North Lebanon Water Establishment – Shakdouf Pump Station 34,145,000North Lebanon Water Establishment – Ain Yacoub 119,126,000North Lebanon Water Establishment – Al Ouyoun Pump Station 403,683,000North Lebanon Water Establishment – Rahbeh Water Committee 34,987,000North Lebanon Water Establishment – Bebnine-Rihaniyyeh 20,822,000Ministry of Energy and Water – Qobeiyat Pump Station 46,446,000Qobeiyat Water Office – Shadra Pump Station 2 47,345,000North Lebanon Water Establishment – Akroum Pump Station 20,359,000North Lebanon Water Establishment – Kfartoun Pump Station 69,750,000Total 1,140,511,000
Table 1 First Level Screening for the NLWE
Table 2 List of Top Ten Energy Consuming Stations in Akkar
3 The data acquired from the NLWE before October 17, 2019, was sufficient to conduct the second-level of the screening; however, after the events of the uprising in October 2019, public institutions, such as the NLWE, were hard to reach (physically) and were thus reduced to skeletal staffing, hence the research team’s ability to interview key people was severely restricted, as was reaching the mostly likely areas, mainly Akkar. All this caused the search for a hotspot in the North to be abandoned.
Volume V: Socio-Economic Assessment of the Water-Energy Nexus 15
Beka’a Water EstablishmentBefore the Syrian crisis, the Beka’a Water Establishment (BWE) served an estimated
population of 525,066 people, with limited irrigation services in the areas of Yammouneh and Deir Al Ahmar. The population officially registered as “customers” of the Establishment, and receiving water supply service (service coverage), represents approximately 69% of the estimated total population within the service area of BWE (USAID, 2015). Currently, BWE serves a geographic area of approximately 4,000 square kilometers that is organized, for service and management purposes, into eleven water supply branches.
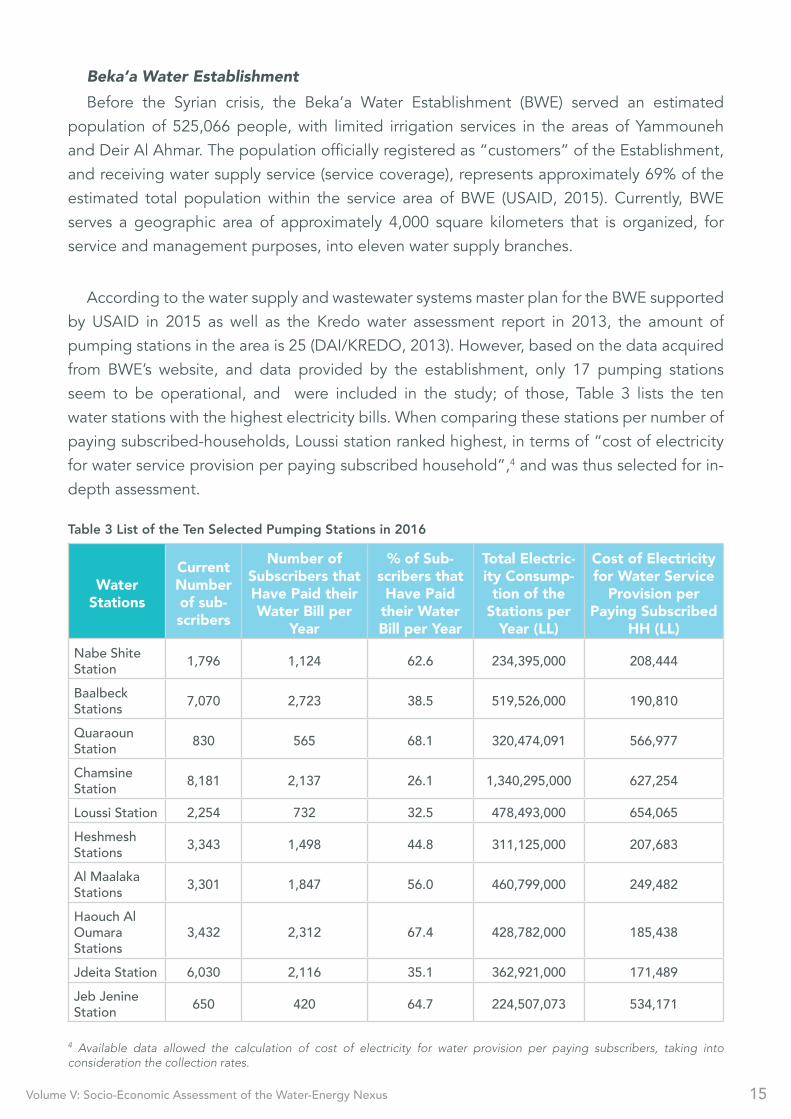
According to the water supply and wastewater systems master plan for the BWE supported by USAID in 2015 as well as the Kredo water assessment report in 2013, the amount of pumping stations in the area is 25 (DAI/KREDO, 2013). However, based on the data acquired from BWE’s website, and data provided by the establishment, only 17 pumping stations seem to be operational, and were included in the study; of those, Table 3 lists the ten water stations with the highest electricity bills. When comparing these stations per number of paying subscribed-households, Loussi station ranked highest, in terms of “cost of electricity for water service provision per paying subscribed household”,4 and was thus selected for in-depth assessment.
4 Available data allowed the calculation of cost of electricity for water provision per paying subscribers, taking into consideration the collection rates.
WaterStations
Current Number of sub-scribers
Number of Subscribers that Have Paid their Water Bill per
Year
% of Sub-scribers that Have Paid
their Water Bill per Year
Total Electric-ity Consump-
tion of the Stations per
Year (LL)
Cost of Electricity for Water Service
Provision per Paying Subscribed
HH (LL)Nabe Shite Station 1,796 1,124 62.6 234,395,000 208,444
Baalbeck Stations 7,070 2,723 38.5 519,526,000 190,810
Quaraoun Station 830 565 68.1 320,474,091 566,977
Chamsine Station 8,181 2,137 26.1 1,340,295,000 627,254
Loussi Station 2,254 732 32.5 478,493,000 654,065Heshmesh Stations 3,343 1,498 44.8 311,125,000 207,683
Al Maalaka Stations 3,301 1,847 56.0 460,799,000 249,482
Haouch Al Oumara Stations
3,432 2,312 67.4 428,782,000 185,438
Jdeita Station 6,030 2,116 35.1 362,921,000 171,489Jeb Jenine Station 650 420 64.7 224,507,073 534,171
Table 3 List of the Ten Selected Pumping Stations in 2016
Volume V: Socio-Economic Assessment of the Water-Energy Nexus 16
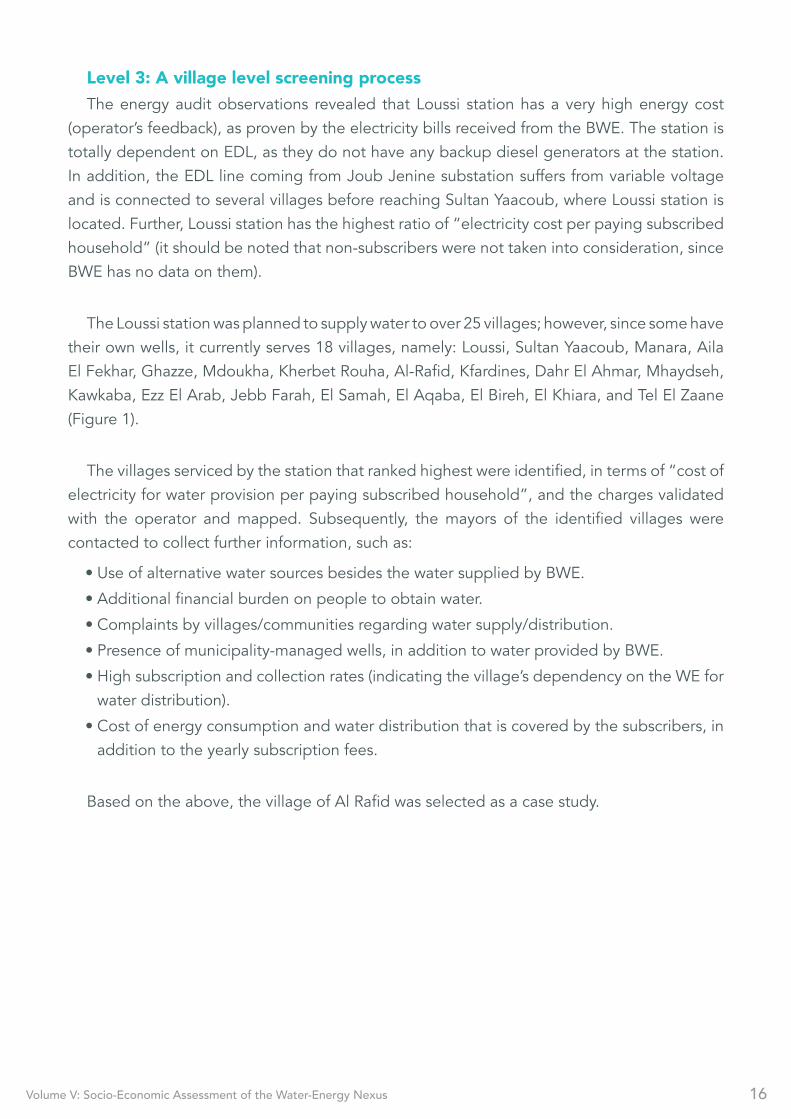
Level 3: A village level screening processThe energy audit observations revealed that Loussi station has a very high energy cost
(operator’s feedback), as proven by the electricity bills received from the BWE. The station is totally dependent on EDL, as they do not have any backup diesel generators at the station. In addition, the EDL line coming from Joub Jenine substation suffers from variable voltage and is connected to several villages before reaching Sultan Yaacoub, where Loussi station is located. Further, Loussi station has the highest ratio of “electricity cost per paying subscribed household” (it should be noted that non-subscribers were not taken into consideration, since BWE has no data on them).
The Loussi station was planned to supply water to over 25 villages; however, since some have their own wells, it currently serves 18 villages, namely: Loussi, Sultan Yaacoub, Manara, Aila El Fekhar, Ghazze, Mdoukha, Kherbet Rouha, Al-Rafid, Kfardines, Dahr El Ahmar, Mhaydseh, Kawkaba, Ezz El Arab, Jebb Farah, El Samah, El Aqaba, El Bireh, El Khiara, and Tel El Zaane (Figure 1).
The villages serviced by the station that ranked highest were identified, in terms of “cost of electricity for water provision per paying subscribed household”, and the charges validated with the operator and mapped. Subsequently, the mayors of the identified villages were contacted to collect further information, such as:
• Use of alternative water sources besides the water supplied by BWE.
• Additional financial burden on people to obtain water.
• Complaints by villages/communities regarding water supply/distribution.
• Presence of municipality-managed wells, in addition to water provided by BWE.
• High subscription and collection rates (indicating the village’s dependency on the WE for water distribution).
• Cost of energy consumption and water distribution that is covered by the subscribers, in addition to the yearly subscription fees.
Based on the above, the village of Al Rafid was selected as a case study.
Volume V: Socio-Economic Assessment of the Water-Energy Nexus 17
Figure 1. Map of villages serviced by Loussi station
Household SurveyAfter selection of the case study area, the second phase of the assessment consisted of
a household survey and qualitative interviews conducted with the municipality, in order to elicit a better understanding of the water-energy linkage problem facing the residents of the village of Al Rafid.
A semi-structured questionnaire (presented in Appendix A) was used to gauge the impact of the water-energy nexus at the household level. Households to be interviewed were selected through a random sampling process, where random sampling points were generated (using an algorithm) from a list of households (Al-Rafid village), supplied by the municipality.
The survey aimed to acquire information on key socio-economic categories (Table 4) that would shed light on the impact of the water-energy nexus on households.
Volume V: Socio-Economic Assessment of the Water-Energy Nexus 18
Categories
CAT1 Income
CAT2 Subscription
CAT3 Water Source
CAT4 Collection
CAT5 Satisfaction with service
CAT6 Purpose of use
CAT7 Water shortages
CAT8 Reasons for water shortages in winter
CAT9 Reasons for water shortages in summer
CAT10 Water Tanks in summer
CAT11 Water drinking source
CAT12 Water quality
CAT13 Storage
CAT14 Storage Size
CAT15 Pump
CAT16 Electricity Shortages
CAT17 Electricity Shortage = No Water
CAT18 Responsibility
CAT19 Willingness to pay
Table 4 Household Survey Categories Used in Survey
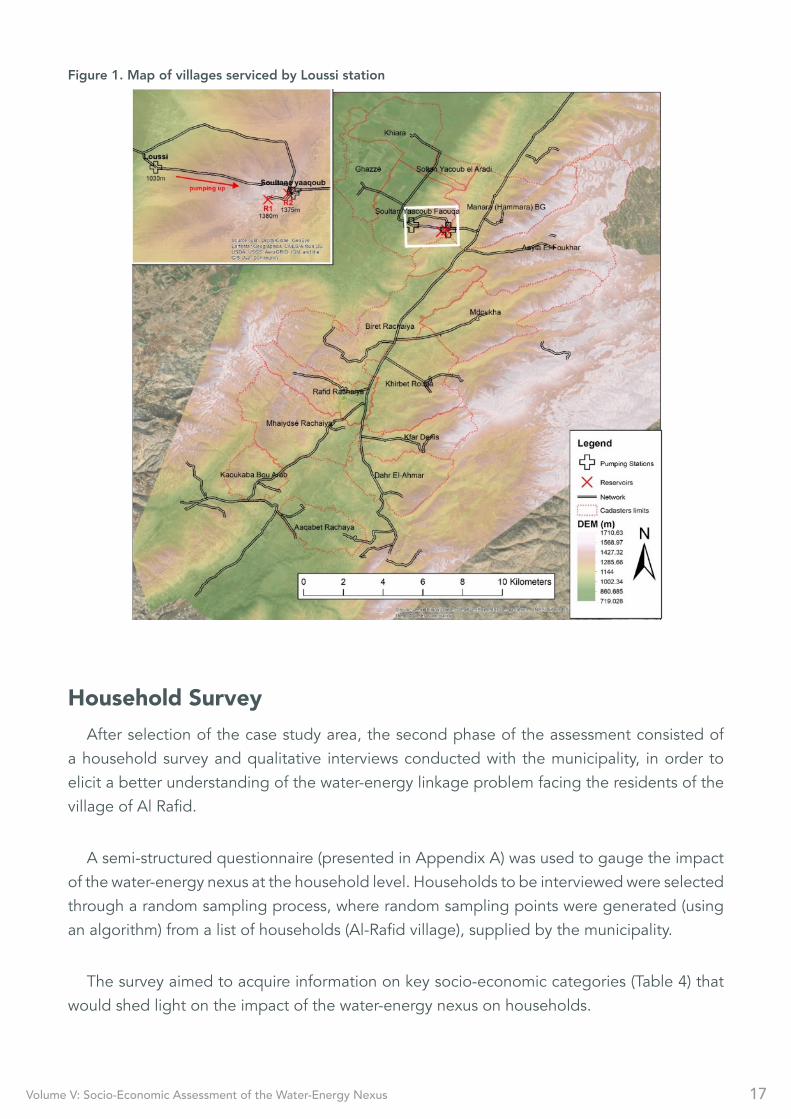
Physiographic and Water Supply Background of the Al Rafid Village
Al Rafid is in the caza (district) of Rashaya, part of the Beka’a governorate (Figure 2). The district spreads over an area of 485 km2 that stretches over the coordinates of 33°30’8.64“N, 35°50’46.32“E. The caza is bordered by Syria on the East and the West Beka’a to the West. Rashaya is 88 km away from Beirut. The climate is typical of the rest of Lebanon, with a hot dry summer, beginning in June until the end of August, and that is also when the agricultural season starts. In winter, temperatures reach as low as 4-5 degrees celcius and snowfall is common, especially during December and January. The caza has a population of around 50,000 people, with many having left for larger cities in Lebanon, such as Beirut.
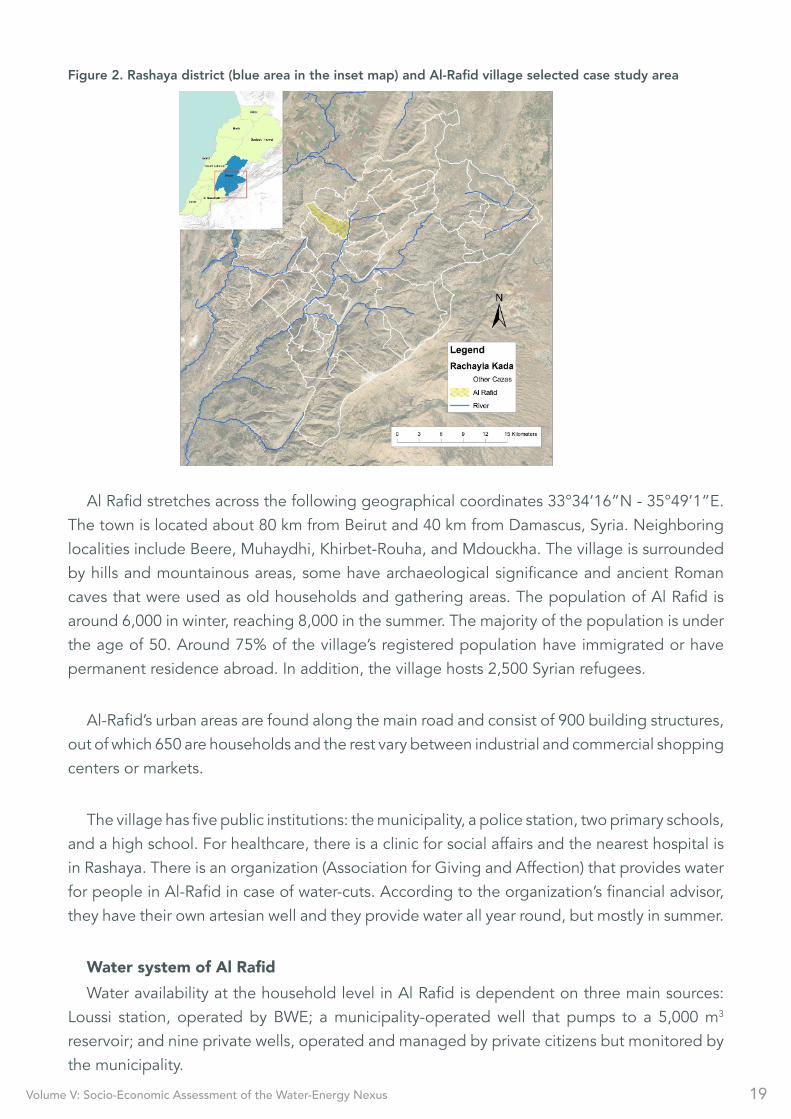
Volume V: Socio-Economic Assessment of the Water-Energy Nexus 19
Figure 2. Rashaya district (blue area in the inset map) and Al-Rafid village selected case study area
Al Rafid stretches across the following geographical coordinates 33°34’16”N - 35°49’1”E. The town is located about 80 km from Beirut and 40 km from Damascus, Syria. Neighboring localities include Beere, Muhaydhi, Khirbet-Rouha, and Mdouckha. The village is surrounded by hills and mountainous areas, some have archaeological significance and ancient Roman caves that were used as old households and gathering areas. The population of Al Rafid is around 6,000 in winter, reaching 8,000 in the summer. The majority of the population is under the age of 50. Around 75% of the village’s registered population have immigrated or have permanent residence abroad. In addition, the village hosts 2,500 Syrian refugees.
Al-Rafid’s urban areas are found along the main road and consist of 900 building structures, out of which 650 are households and the rest vary between industrial and commercial shopping centers or markets.
The village has five public institutions: the municipality, a police station, two primary schools, and a high school. For healthcare, there is a clinic for social affairs and the nearest hospital is in Rashaya. There is an organization (Association for Giving and Affection) that provides water for people in Al-Rafid in case of water-cuts. According to the organization’s financial advisor, they have their own artesian well and they provide water all year round, but mostly in summer.
Water system of Al RafidWater availability at the household level in Al Rafid is dependent on three main sources:
Loussi station, operated by BWE; a municipality-operated well that pumps to a 5,000 m3 reservoir; and nine private wells, operated and managed by private citizens but monitored by the municipality.
Volume V: Socio-Economic Assessment of the Water-Energy Nexus 20
In 2000, the Council of the South developed a well for the municipality to provide water to the entire village, utilizing the existing water network, which was installed in the 1950s and 1960s. The municipality later handed over ownership of the well to the BWE but remained in charge of repairs and water allocation through a third party (private service contract). The municipality has been covering all costs associated with maintenance of the well and its infrastructure.
The BWE water supply network in the village is in a poor state that is affecting both quality and quantity of water reaching the households in the village. This has prompted the village to rehabilitate a section of this network used for water supply from the well it operates.
Further inspection and reconnaissance fieldwork indicate that Al Rafid water supply is further split into two zones, based on system and source (Figure 3):
• Zone A (the upper Al Rafid): This zone is connected to the BWE network but does not receive its water from Loussi station. This zone is serviced by a public well, or what is referred to as “Jabal Well”, and the reservoir is operated by the municipality. Zone A has a very old network that was installed by the government in the ‘50s and ‘60s. The municipality has used this network since 2001 to supply water to the neighborhoods in the more populated western part of the village. As shown in Figure 3, the municipality renovated some parts of the old network, due to their severely degraded state (lines in yellow). Still, there are neighborhoods that do not receive any water because they are not connected to the network or the network does not reach their homes; these are highlighted in red in Figure 3.
Figure 3. Transmission lines in Al Rafid
Volume V: Socio-Economic Assessment of the Water-Energy Nexus 21
• Zone B (the lower Al Rafid): This zone is connected to the water supply infrastructure operated by BWE (Figure 3), and receives no water from the public well that supplies Zone A. This entire zone receives its water from Loussi station. According to the interviews conducted, this area suffers from intermittent, poor quality water supply. The pipes in the Zone B network date back to the ‘50s and ‘60s, and are in a very bad state. The municipality is currently working on a pipeline that is supposed to deliver water to some parts of Zone B that are not connected to the network; however, due to a lack of funds, the progress on this project has been slow.
The village lacks a sewage network and wastewater treatment station, with houses relying on their own septic tanks.
The Loussi StationLocated in the Sultan Yaacoub El Tahta, the Loussi facility was built in 1954, and has
undergone several maintenance and rehabilitation activities over the past years (change of main pumps, and well maintenance).
The station pumps out of two main wells:
• Sultan Yaacoub, which pumps 190-200 m3/hour, utilizes 180 hp pumps. The well is 148 m deep, and the pump is at 114 m.
• Ghazze, which pumps 120 m3/hour, utilizes 120 hp pumps. The well is 135 m deep, and the pump is at 96 m.
There are three booster pumps, 250 hp and 290 m3/h capacity each, that pump to a reservoir of 3,000 m3 capacity, which is located at an elevation of 500 meters.
Electricity supply is poor; the station receives 15 hours per day, which they get from EDL Joub Jennine, along with several other villages, benefiting from the same transmission line.
Operation of this station faces several challenges that have hindered proper water service provision. The two main challenges are:
ElectricityThe problems are represented by fluctuations in the supplied voltage, and frequent
unscheduled interruptions for maintenance along the lines and at the substation as well. The station operators try to provide water during the night, as the electricity is more reliable at that time; but this too, depends on the availability of electricity at the serviced villages as well, in order to pump to and within them.
Volume V: Socio-Economic Assessment of the Water-Energy Nexus 22
Unlike some other water facilities, Loussi does not have diesel generators to make up for the electricity outages, making it impossible to supply water to the serviced villages during EDL electricity outages. This electricity problem is of particular importance in this case, as water is pumped to a reservoir at higher elevation. The complete filling of the reservoir requires around 15 hours of pumping, and if this operation is interrupted by loss of electricity, not enough water would be available for the households served by the reservoir.
Human ResourcesThe station is understaffed. While ideally the station should have five employees on
alternating shifts (24h, every 72h), only three employees currently operated it. The operators are therefore undertaking double-shifts in order to supply water to the villages and manage the pumping and distribution. This difficulty is further compounded by the existing intermittent electricity schedule. Furthermore, operators were found to have limited technical knowledge related to O&M, which hinders their ability to react in a timely manner to some problems when they arise, forcing them to wait for BWE and/or other sub-contractors to come and fix the problems.
Sampling for household survey in Al RafidThe available Al Rafid municipal data for 2004 were obtained in the form of AutoCAD
files, which comprised of housing units, roads, plots, and other landmarks. Housing units included in the dataset were for those built with municipal permits only. This information was converted into ArcMap-compatible shape files, and households were digitized as points, formatted and assigned their corresponding cadastral identification numbers. Available satellite imagery was then used to digitize the remaining buildings/structures that were not included in the municipal data. The coordinates of the buildings are determined on ArcMap, and a table listing of the digitized units was generated for use in the sampling exercise. Figure 4 represents the results of this effort.
Most of the people of the village reside in Zone A, the older part of the village. Over the years, the village expanded along the main road, forming Zone B, which is mostly rented out commercial spaces; however, there are new and upcoming residential neighborhoods that are being built and occupied.
Volume V: Socio-Economic Assessment of the Water-Energy Nexus 23
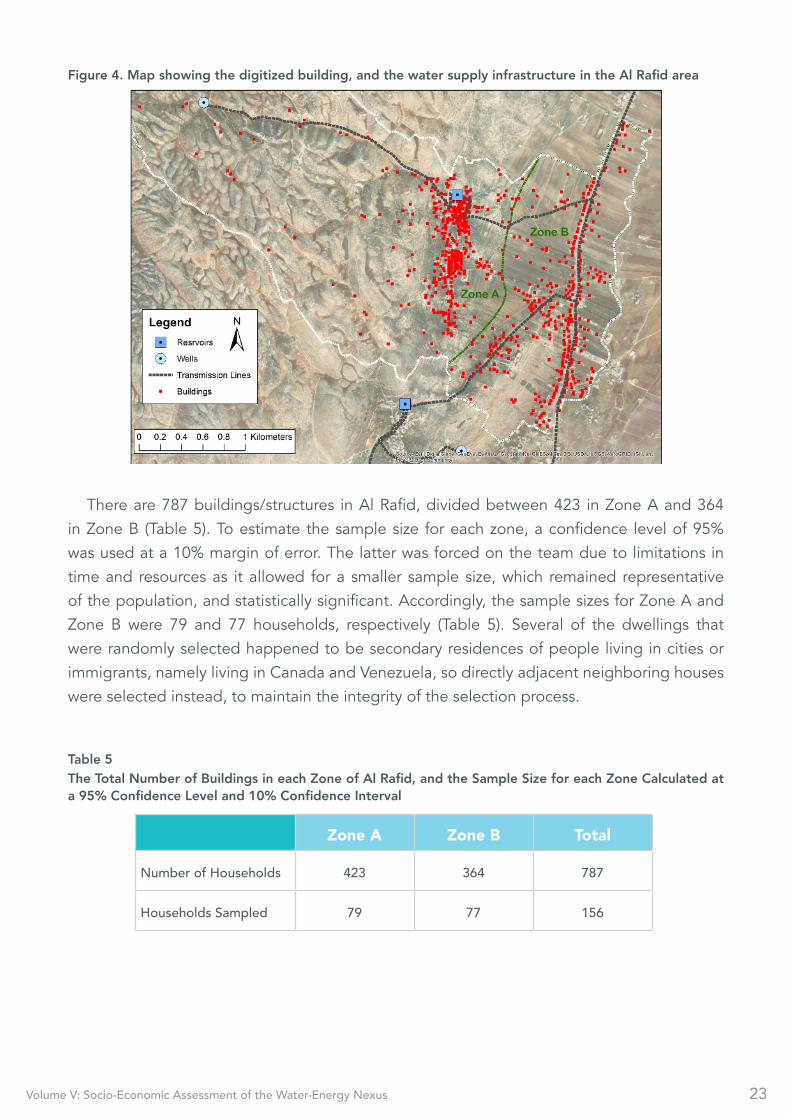
Figure 4. Map showing the digitized building, and the water supply infrastructure in the Al Rafid area
Table 5 The Total Number of Buildings in each Zone of Al Rafid, and the Sample Size for each Zone Calculated at a 95% Confidence Level and 10% Confidence Interval
There are 787 buildings/structures in Al Rafid, divided between 423 in Zone A and 364 in Zone B (Table 5). To estimate the sample size for each zone, a confidence level of 95% was used at a 10% margin of error. The latter was forced on the team due to limitations in time and resources as it allowed for a smaller sample size, which remained representative of the population, and statistically significant. Accordingly, the sample sizes for Zone A and Zone B were 79 and 77 households, respectively (Table 5). Several of the dwellings that were randomly selected happened to be secondary residences of people living in cities or immigrants, namely living in Canada and Venezuela, so directly adjacent neighboring houses were selected instead, to maintain the integrity of the selection process.
Zone A Zone B Total
Number of Households 423 364 787
Households Sampled 79 77 156
Volume V: Socio-Economic Assessment of the Water-Energy Nexus 24
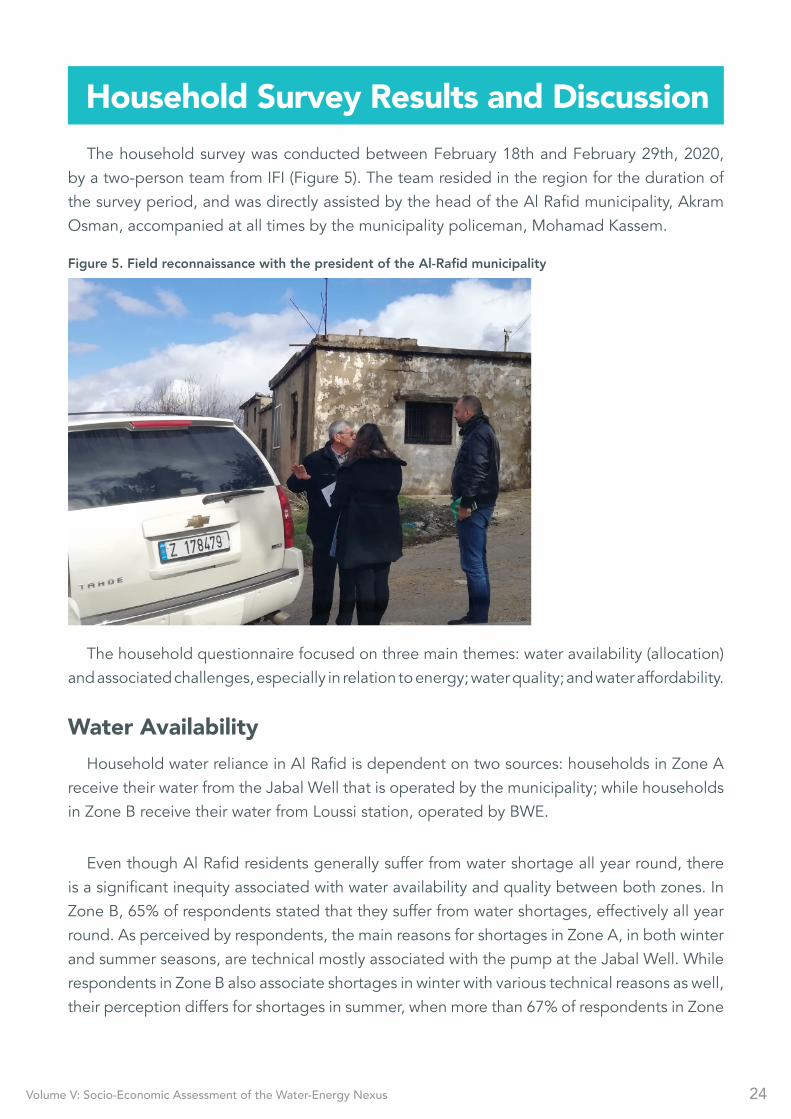
The household survey was conducted between February 18th and February 29th, 2020, by a two-person team from IFI (Figure 5). The team resided in the region for the duration of the survey period, and was directly assisted by the head of the Al Rafid municipality, Akram Osman, accompanied at all times by the municipality policeman, Mohamad Kassem.
The household questionnaire focused on three main themes: water availability (allocation) and associated challenges, especially in relation to energy; water quality; and water affordability.
Water Availability
Household water reliance in Al Rafid is dependent on two sources: households in Zone A receive their water from the Jabal Well that is operated by the municipality; while households in Zone B receive their water from Loussi station, operated by BWE.
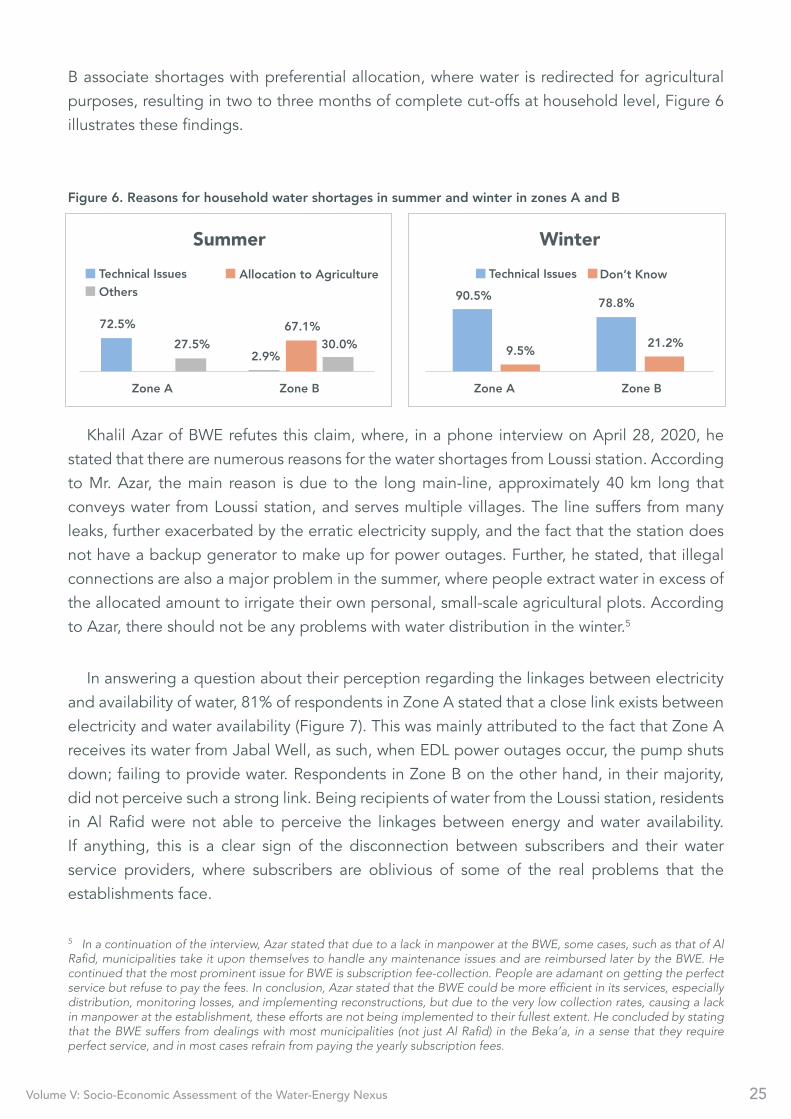
Even though Al Rafid residents generally suffer from water shortage all year round, there is a significant inequity associated with water availability and quality between both zones. In Zone B, 65% of respondents stated that they suffer from water shortages, effectively all year round. As perceived by respondents, the main reasons for shortages in Zone A, in both winter and summer seasons, are technical mostly associated with the pump at the Jabal Well. While respondents in Zone B also associate shortages in winter with various technical reasons as well, their perception differs for shortages in summer, when more than 67% of respondents in Zone
Household Survey Results and Discussion
Figure 5. Field reconnaissance with the president of the Al-Rafid municipality
Volume V: Socio-Economic Assessment of the Water-Energy Nexus 25
Figure 6. Reasons for household water shortages in summer and winter in zones A and B
SummerTechnical Issues Technical IssuesOthers
Zone A
72.5%
90.5%
9.5%
78.8%
21.2%27.5% 30.0%2.9%
67.1%
Zone B Zone A Zone B
Allocation to Agriculture Don’t Know
Winter
Khalil Azar of BWE refutes this claim, where, in a phone interview on April 28, 2020, he stated that there are numerous reasons for the water shortages from Loussi station. According to Mr. Azar, the main reason is due to the long main-line, approximately 40 km long that conveys water from Loussi station, and serves multiple villages. The line suffers from many leaks, further exacerbated by the erratic electricity supply, and the fact that the station does not have a backup generator to make up for power outages. Further, he stated, that illegal connections are also a major problem in the summer, where people extract water in excess of the allocated amount to irrigate their own personal, small-scale agricultural plots. According to Azar, there should not be any problems with water distribution in the winter.5
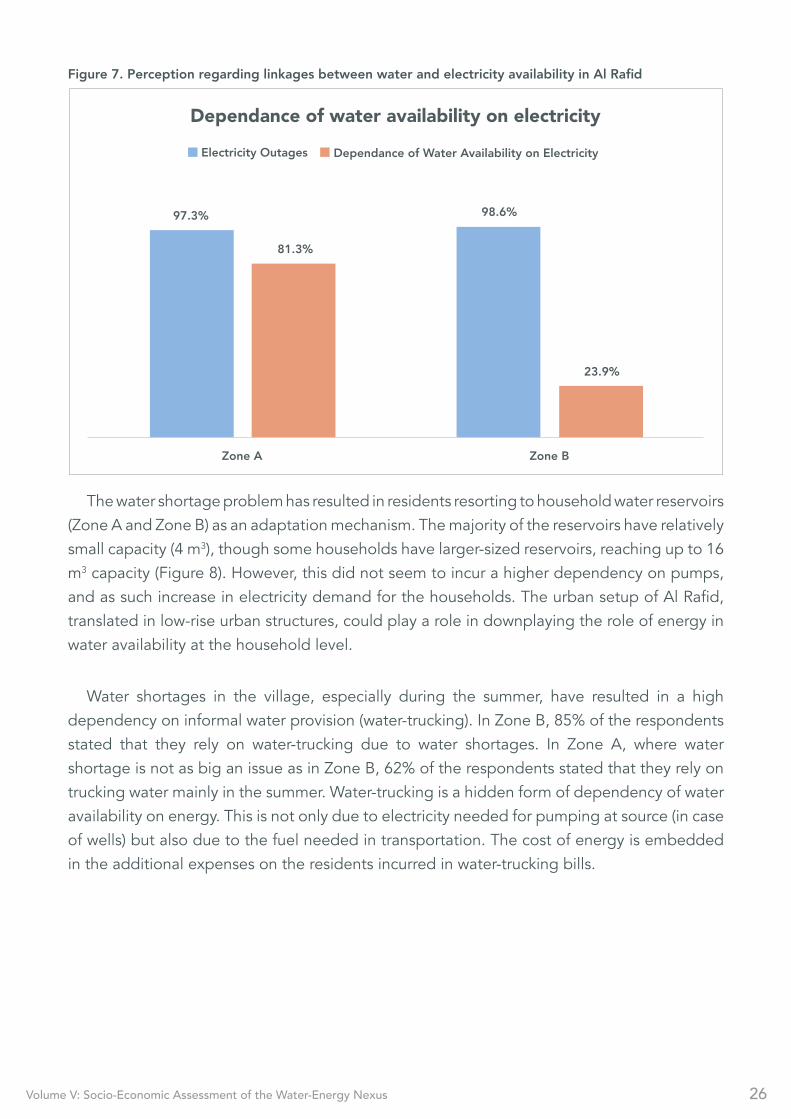
In answering a question about their perception regarding the linkages between electricity and availability of water, 81% of respondents in Zone A stated that a close link exists between electricity and water availability (Figure 7). This was mainly attributed to the fact that Zone A receives its water from Jabal Well, as such, when EDL power outages occur, the pump shuts down; failing to provide water. Respondents in Zone B on the other hand, in their majority, did not perceive such a strong link. Being recipients of water from the Loussi station, residents in Al Rafid were not able to perceive the linkages between energy and water availability. If anything, this is a clear sign of the disconnection between subscribers and their water service providers, where subscribers are oblivious of some of the real problems that the establishments face.
5 In a continuation of the interview, Azar stated that due to a lack in manpower at the BWE, some cases, such as that of Al Rafid, municipalities take it upon themselves to handle any maintenance issues and are reimbursed later by the BWE. He continued that the most prominent issue for BWE is subscription fee-collection. People are adamant on getting the perfect service but refuse to pay the fees. In conclusion, Azar stated that the BWE could be more efficient in its services, especially distribution, monitoring losses, and implementing reconstructions, but due to the very low collection rates, causing a lack in manpower at the establishment, these efforts are not being implemented to their fullest extent. He concluded by stating that the BWE suffers from dealings with most municipalities (not just Al Rafid) in the Beka’a, in a sense that they require perfect service, and in most cases refrain from paying the yearly subscription fees.
B associate shortages with preferential allocation, where water is redirected for agricultural purposes, resulting in two to three months of complete cut-offs at household level, Figure 6 illustrates these findings.
Volume V: Socio-Economic Assessment of the Water-Energy Nexus 26
Dependance of water availability on electricity
97.3%
81.3%
98.6%
23.9%
Zone A Zone B
Electricity Outages Dependance of Water Availability on Electricity
Figure 7. Perception regarding linkages between water and electricity availability in Al Rafid
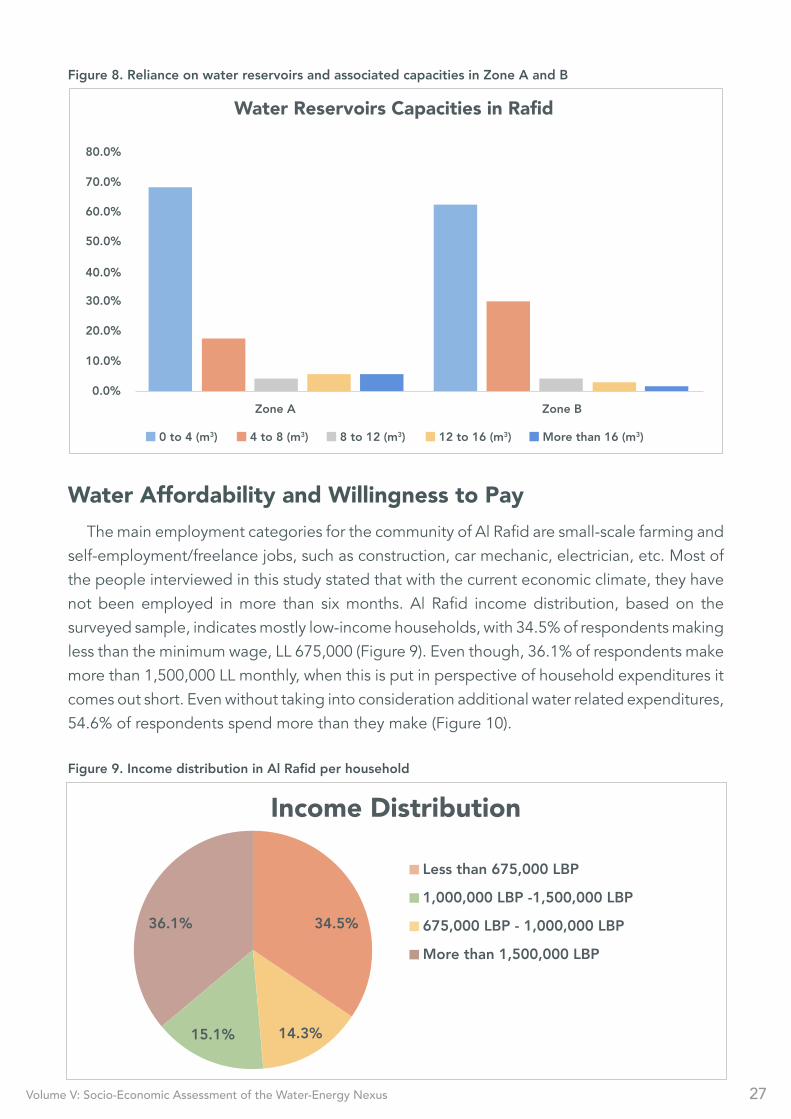
The water shortage problem has resulted in residents resorting to household water reservoirs (Zone A and Zone B) as an adaptation mechanism. The majority of the reservoirs have relatively small capacity (4 m3), though some households have larger-sized reservoirs, reaching up to 16 m3 capacity (Figure 8). However, this did not seem to incur a higher dependency on pumps, and as such increase in electricity demand for the households. The urban setup of Al Rafid, translated in low-rise urban structures, could play a role in downplaying the role of energy in water availability at the household level.
Water shortages in the village, especially during the summer, have resulted in a high dependency on informal water provision (water-trucking). In Zone B, 85% of the respondents stated that they rely on water-trucking due to water shortages. In Zone A, where water shortage is not as big an issue as in Zone B, 62% of the respondents stated that they rely on trucking water mainly in the summer. Water-trucking is a hidden form of dependency of water availability on energy. This is not only due to electricity needed for pumping at source (in case of wells) but also due to the fuel needed in transportation. The cost of energy is embedded in the additional expenses on the residents incurred in water-trucking bills.
Volume V: Socio-Economic Assessment of the Water-Energy Nexus 27
Water Reservoirs Capacities in Rafid
80.0%
70.0%
60.0%
50.0%
40.0%
30.0%
20.0%
10.0%
0.0%Zone A Zone B
0 to 4 (m3) 4 to 8 (m3) 8 to 12 (m3) 12 to 16 (m3) More than 16 (m3)
Water Affordability and Willingness to PayThe main employment categories for the community of Al Rafid are small-scale farming and
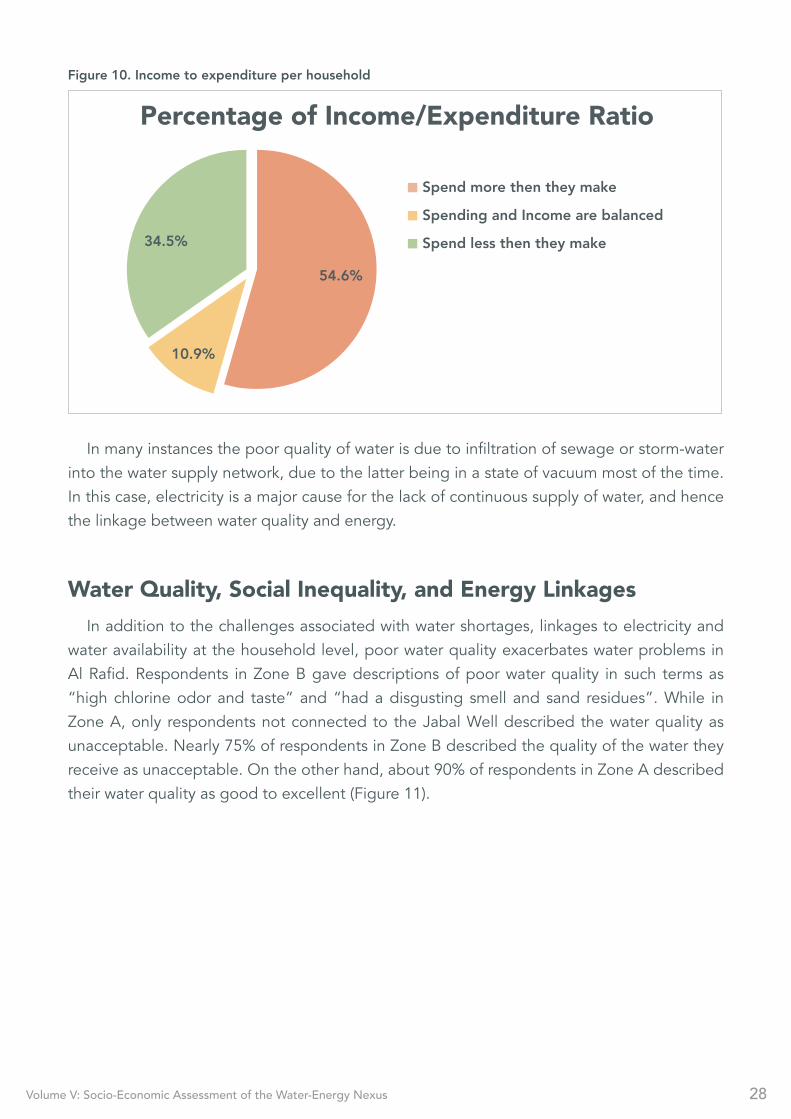
self-employment/freelance jobs, such as construction, car mechanic, electrician, etc. Most of the people interviewed in this study stated that with the current economic climate, they have not been employed in more than six months. Al Rafid income distribution, based on the surveyed sample, indicates mostly low-income households, with 34.5% of respondents making less than the minimum wage, LL 675,000 (Figure 9). Even though, 36.1% of respondents make more than 1,500,000 LL monthly, when this is put in perspective of household expenditures it comes out short. Even without taking into consideration additional water related expenditures, 54.6% of respondents spend more than they make (Figure 10).
Figure 8. Reliance on water reservoirs and associated capacities in Zone A and B
Income Distribution
Less than 675,000 LBP
675,000 LBP - 1,000,000 LBP
1,000,000 LBP -1,500,000 LBP
More than 1,500,000 LBP
34.5%
14.3%15.1%
36.1%
Figure 9. Income distribution in Al Rafid per household
Volume V: Socio-Economic Assessment of the Water-Energy Nexus 28
Percentage of Income/Expenditure Ratio
Spend more then they make
Spend less then they make
Spending and Income are balanced
54.6%
34.5%
10.9%
Figure 10. Income to expenditure per household
In many instances the poor quality of water is due to infiltration of sewage or storm-water into the water supply network, due to the latter being in a state of vacuum most of the time. In this case, electricity is a major cause for the lack of continuous supply of water, and hence the linkage between water quality and energy.
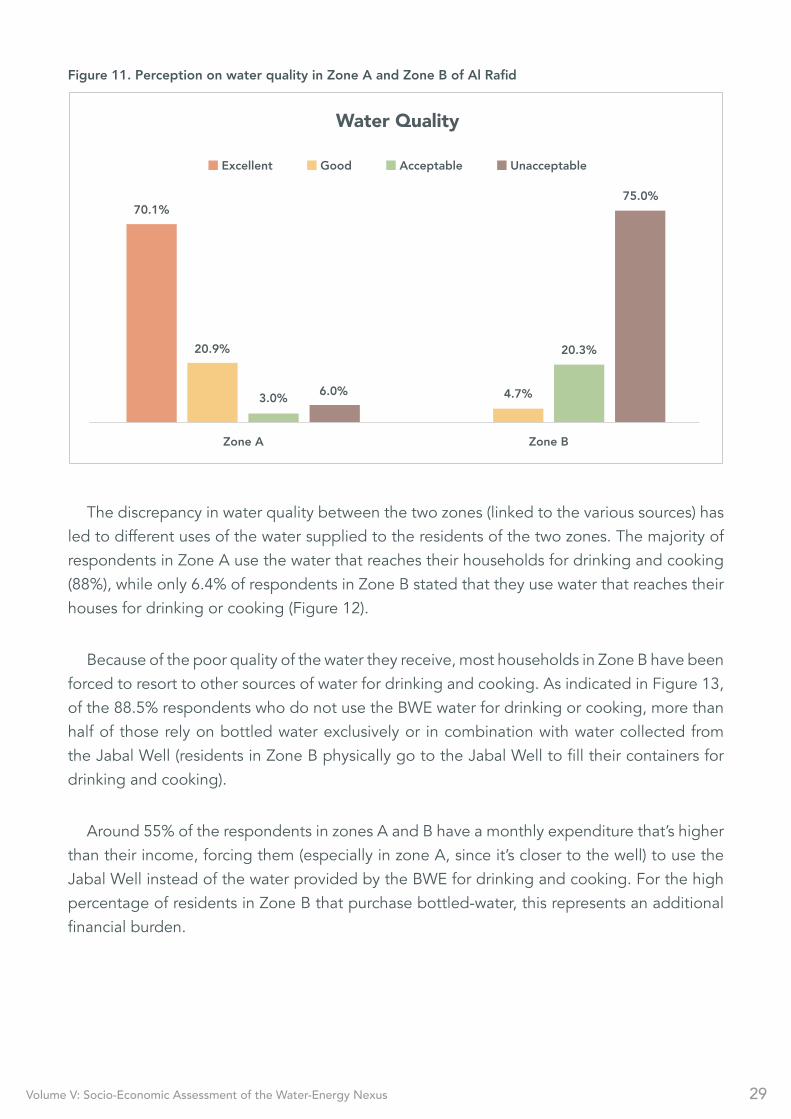
Water Quality, Social Inequality, and Energy LinkagesIn addition to the challenges associated with water shortages, linkages to electricity and
water availability at the household level, poor water quality exacerbates water problems in Al Rafid. Respondents in Zone B gave descriptions of poor water quality in such terms as “high chlorine odor and taste” and “had a disgusting smell and sand residues”. While in Zone A, only respondents not connected to the Jabal Well described the water quality as unacceptable. Nearly 75% of respondents in Zone B described the quality of the water they receive as unacceptable. On the other hand, about 90% of respondents in Zone A described their water quality as good to excellent (Figure 11).
Volume V: Socio-Economic Assessment of the Water-Energy Nexus 29
Water Quality
70.1%
20.9%
3.0% 6.0% 4.7%
20.3%
75.0%
Zone A Zone B
Excellent Good Acceptable Unacceptable
Figure 11. Perception on water quality in Zone A and Zone B of Al Rafid
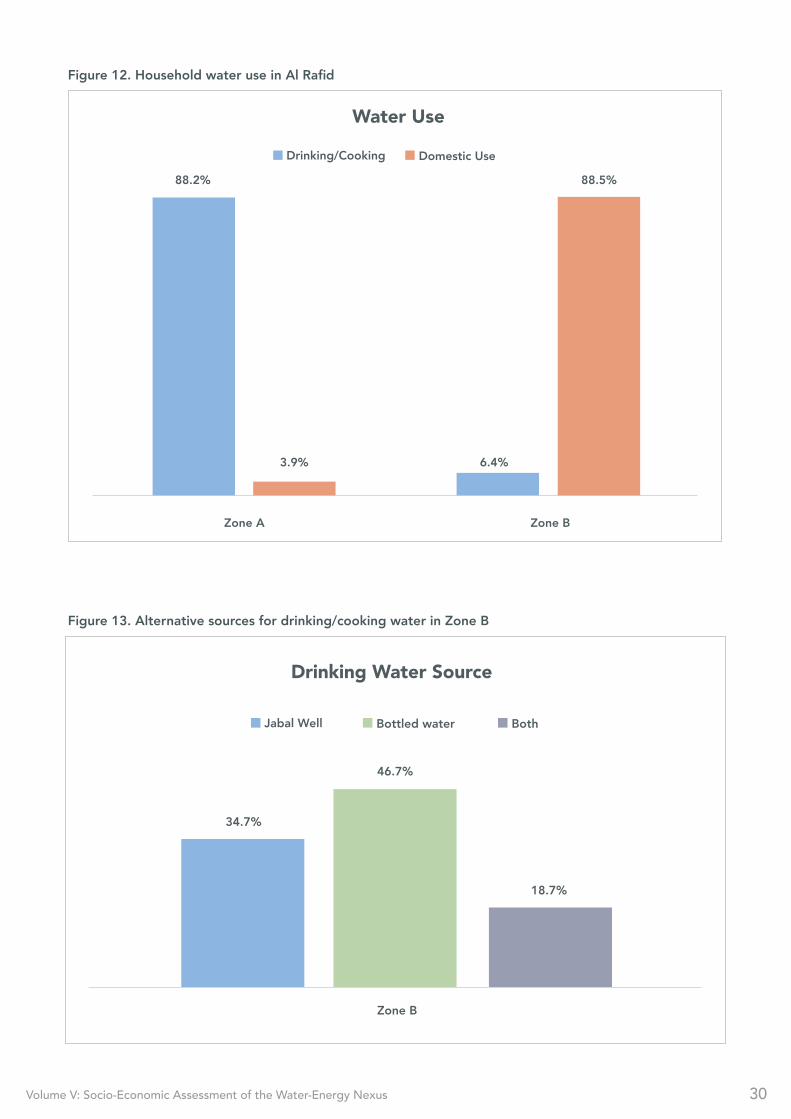
The discrepancy in water quality between the two zones (linked to the various sources) has led to different uses of the water supplied to the residents of the two zones. The majority of respondents in Zone A use the water that reaches their households for drinking and cooking (88%), while only 6.4% of respondents in Zone B stated that they use water that reaches their houses for drinking or cooking (Figure 12).
Because of the poor quality of the water they receive, most households in Zone B have been forced to resort to other sources of water for drinking and cooking. As indicated in Figure 13, of the 88.5% respondents who do not use the BWE water for drinking or cooking, more than half of those rely on bottled water exclusively or in combination with water collected from the Jabal Well (residents in Zone B physically go to the Jabal Well to fill their containers for drinking and cooking).
Around 55% of the respondents in zones A and B have a monthly expenditure that’s higher than their income, forcing them (especially in zone A, since it’s closer to the well) to use the Jabal Well instead of the water provided by the BWE for drinking and cooking. For the high percentage of residents in Zone B that purchase bottled-water, this represents an additional financial burden.
Volume V: Socio-Economic Assessment of the Water-Energy Nexus 30
Figure 12. Household water use in Al Rafid
Figure 13. Alternative sources for drinking/cooking water in Zone B
Water Use
88.2% 88.5%
3.9% 6.4%
Zone A Zone B
Drinking/Cooking Domestic Use
Drinking Water Source
34.7%
46.7%
18.7%
Zone B
Jabal Well Bottled water Both
Volume V: Socio-Economic Assessment of the Water-Energy Nexus 31
Even though the interlinkages between water quality and energy/electricity are not explicit in this case, the poor quality of water results is an additional economic burden for the households of Al Rafid. It is well worth noting that more than 50% of households in zones A and B fall below the poverty rate—as shown in the water affordability analysis conducted in the study. Here again, it is worth mentioning that bottled-water production and purchase does imbed “energy cost” that is reflected in the cost.
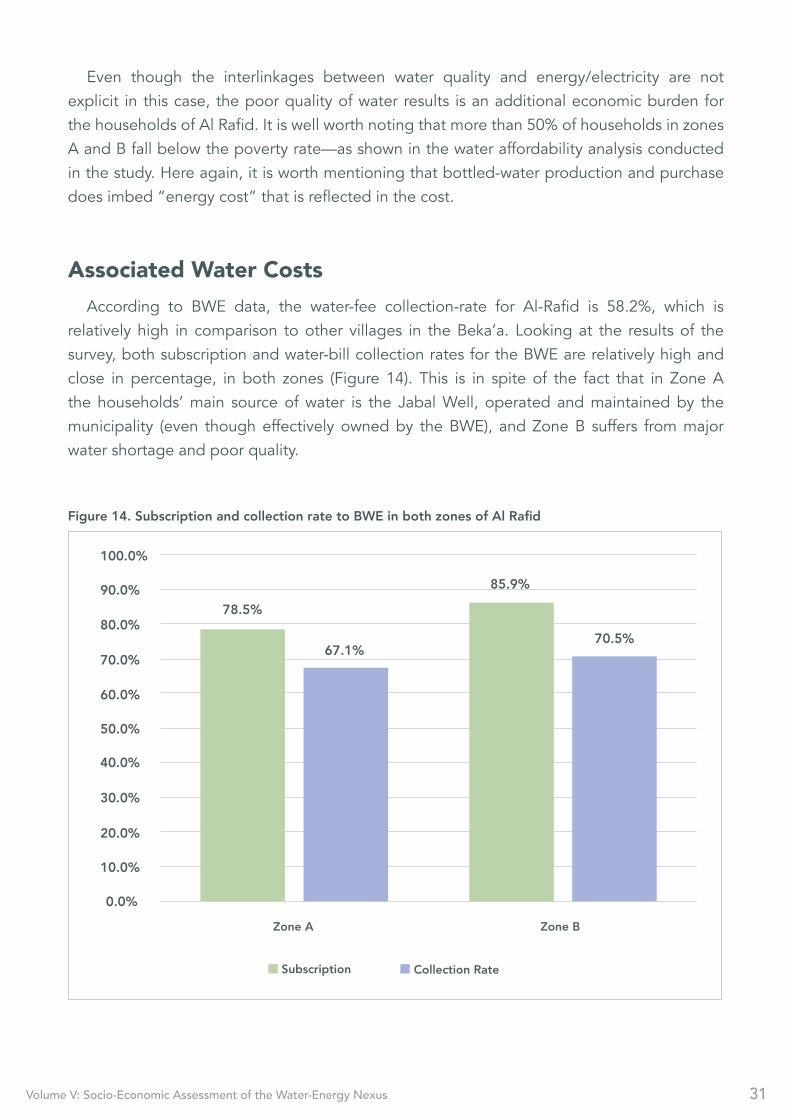
Associated Water CostsAccording to BWE data, the water-fee collection-rate for Al-Rafid is 58.2%, which is
relatively high in comparison to other villages in the Beka’a. Looking at the results of the survey, both subscription and water-bill collection rates for the BWE are relatively high and close in percentage, in both zones (Figure 14). This is in spite of the fact that in Zone A the households’ main source of water is the Jabal Well, operated and maintained by the municipality (even though effectively owned by the BWE), and Zone B suffers from major water shortage and poor quality.
Figure 14. Subscription and collection rate to BWE in both zones of Al Rafid
0.0%
10.0%
20.0%
30.0%
40.0%
50.0%
60.0%
70.0%
80.0%78.5%
67.1%
85.9%
70.5%
90.0%
100.0%
Zone A Zone B
Subscription Collection Rate
Volume V: Socio-Economic Assessment of the Water-Energy Nexus 32
6 LWP (2017). Water Security Analysis for Regional Water Establishments (RWE) AND Litani River Authority (LRA) - DELIVERABLE 6- Draft Water Security Assessment
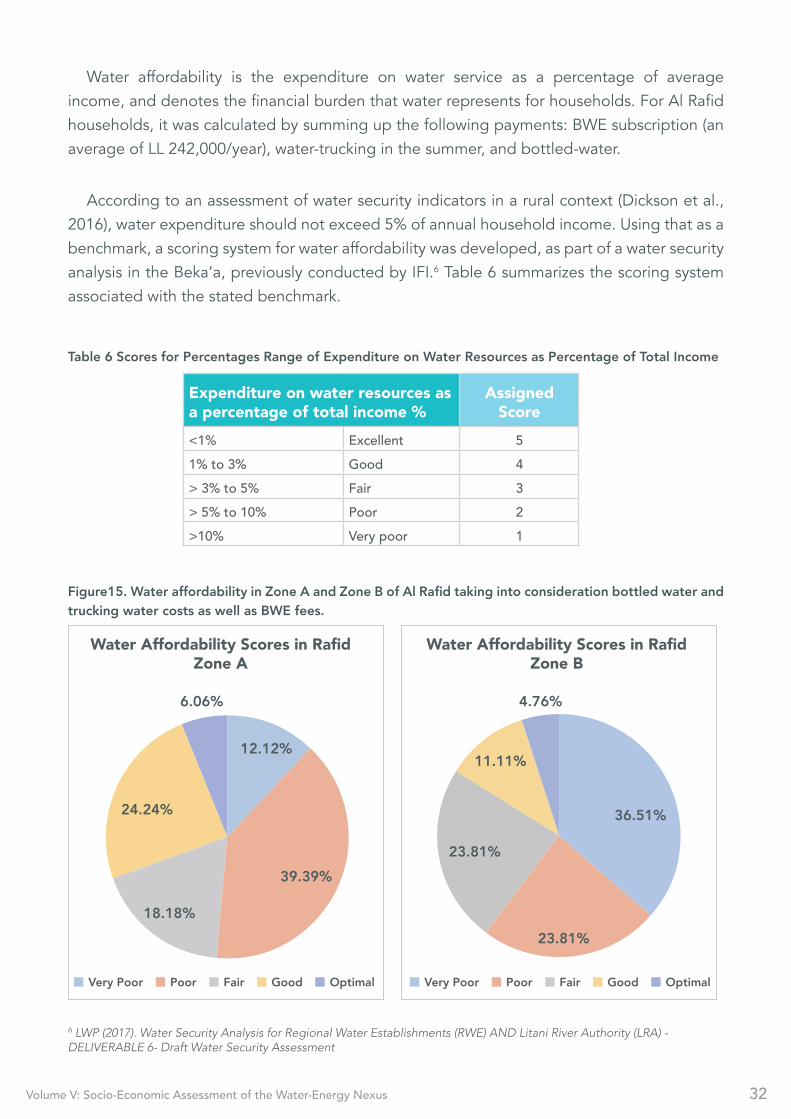
Water affordability is the expenditure on water service as a percentage of average income, and denotes the financial burden that water represents for households. For Al Rafid households, it was calculated by summing up the following payments: BWE subscription (an average of LL 242,000/year), water-trucking in the summer, and bottled-water.
According to an assessment of water security indicators in a rural context (Dickson et al., 2016), water expenditure should not exceed 5% of annual household income. Using that as a benchmark, a scoring system for water affordability was developed, as part of a water security analysis in the Beka’a, previously conducted by IFI.6 Table 6 summarizes the scoring system associated with the stated benchmark.
Expenditure on water resources as a percentage of total income %
Assigned Score
<1% Excellent 51% to 3% Good 4> 3% to 5% Fair 3> 5% to 10% Poor 2>10% Very poor 1
Table 6 Scores for Percentages Range of Expenditure on Water Resources as Percentage of Total Income
Water Affordability Scores in RafidZone A
Water Affordability Scores in RafidZone B
Very Poor FairPoor OptimalGood Very Poor FairPoor OptimalGood
39.39%
18.18%
24.24%
6.06%
12.12%
36.51%
23.81%
23.81%
11.11%
4.76%
Figure15. Water affordability in Zone A and Zone B of Al Rafid taking into consideration bottled water and trucking water costs as well as BWE fees.
Volume V: Socio-Economic Assessment of the Water-Energy Nexus 33
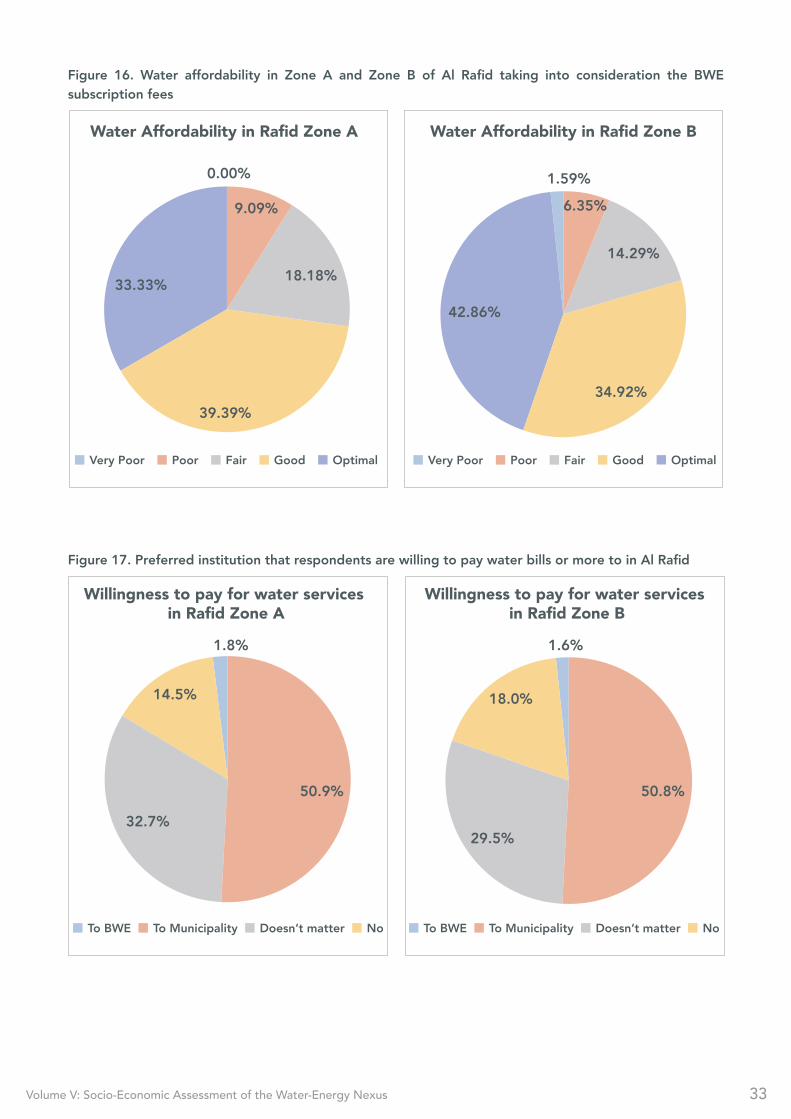
Figure 16. Water affordability in Zone A and Zone B of Al Rafid taking into consideration the BWE subscription fees
Figure 17. Preferred institution that respondents are willing to pay water bills or more to in Al Rafid
Very Poor FairPoor OptimalGood Very Poor FairPoor OptimalGood
39.39%
18.18%
9.09%
33.33%
42.86%
6.35%
1.59%0.00%
14.29%
34.92%
Water Affordability in Rafid Zone A Water Affordability in Rafid Zone B
To BWE Doesn’t matterTo Municipality No To BWE Doesn’t matterTo Municipality No
Willingness to pay for water services in Rafid Zone A
Willingness to pay for water services in Rafid Zone B
50.9% 50.8%
29.5%
18.0%
32.7%
14.5%
1.8% 1.6%
Volume V: Socio-Economic Assessment of the Water-Energy Nexus 34
Water affordibility for both Zone A and Zone B in Al Rafid was shown to be poor, scoring 2, which means that, on avearge, households spend more than the recommended 5% of their income on water. As indicated in Figure 15, in Zone A close to 40% of households spend more than 5% of their income on water, with 36% in Zone B spending more than 10% on water, and close to 24% spending more than 5% to 10%. However, if the subscription fees were the only water related expenditures by households in the Al Rafid, then the water affordability would improve dramatically with less than 10% of respondents would be paying more than 5% from their income on water (Figure 16). Thus the poor water quality and interrupted water supply are imposing needless additional expenditures on the residents of Al Rafid. The majority of respondents (nearly 90% in each zone) stated that they prefer to pay for improved water services; however, the municipality was identified as the preferred authority to conduct this improved service by 50% of the households, whereas less than 2% of the residents chose BWE (Figure 17).
Volume V: Socio-Economic Assessment of the Water-Energy Nexus 35
Comparative Analysis of Additional Water Costs on Communities and the Solarization of Loussi StationIn addition to the water affordability analysis, a comparative analysis was conducted to
compare the additional cost people pay for water in Al Rafid (such as bottled-water and water-trucking), and the cost it would require to run Loussi station on solar power.
The energy audit results and walk-through analysis based on the BWE’s electricity bills revealed that Loussi station has a yearly electricity consumption of around 180,021 kWh/year. Yet, the station receives around 12-15 hours of low-voltage daily supply, and is not equipped with a backup diesel generator.
Therefore, its ability to pump water is limited during such periods when the current is poor or there is no electricty supply. This exacerbates the financial burden at the supplied villages whose citizens are required to get water from other private sources (bottled-water, water-trucking).
This yearly electricity consumption could be supplied through a 130 kWp solar system at an average specific yield of 1,401.6 kWh/year/kWp, assuming there is enough land around the station in Soltan Yaacoub to install such systems; around 1,500 sq. meters are needed for a system of such scale. Considering storage solutions (batteries), despite being capital intensive, would allow EDL to offset its supply and to fully rely on solar energy production, while installing solar without storage would enable the coverage of the demand when solar power is available, while continuing to rely on EDL.
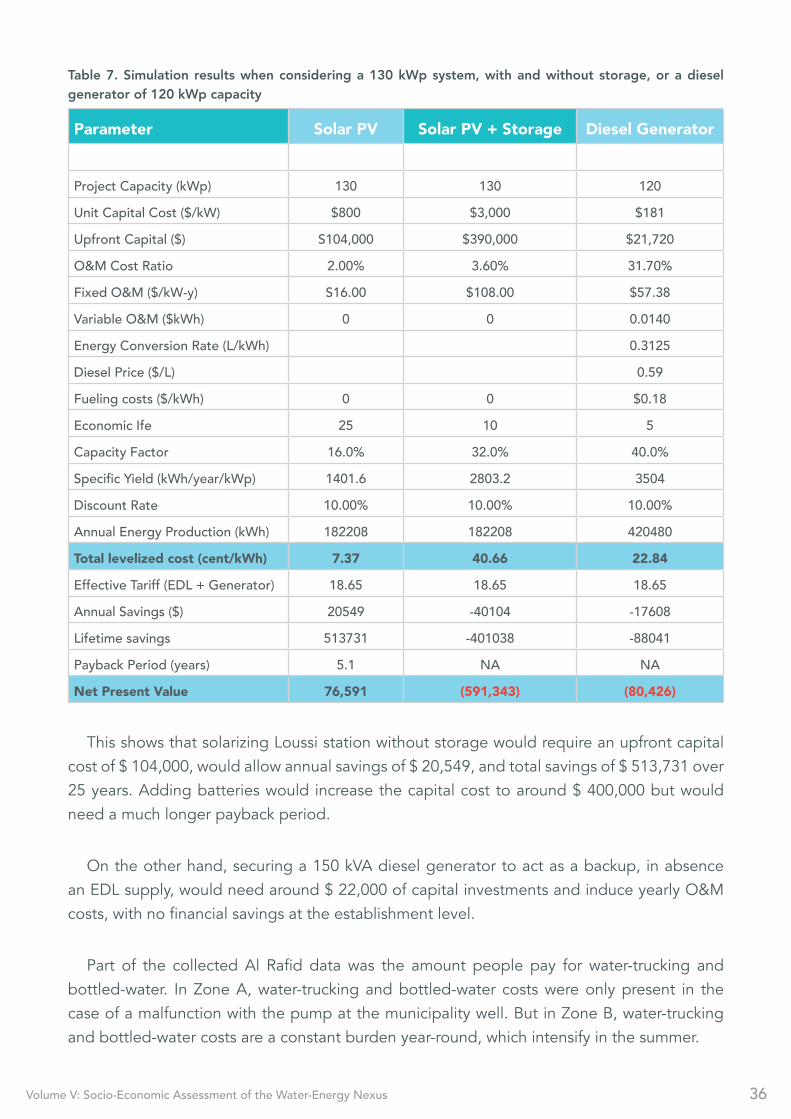
The table below summarizes the simulation results when considering a 130 kWp system with and without storage, or a diesel generator of 120 kWp capacity (150 kVA generator):
Volume V: Socio-Economic Assessment of the Water-Energy Nexus 36
Parameter Solar PV Solar PV + Storage Diesel Generator
Project Capacity (kWp) 130 130 120Unit Capital Cost ($/kW) $800 $3,000 $181Upfront Capital ($) S104,000 $390,000 $21,720O&M Cost Ratio 2.00% 3.60% 31.70%Fixed O&M ($/kW-y) S16.00 $108.00 $57.38Variable O&M ($kWh) 0 0 0.0140Energy Conversion Rate (L/kWh) 0.3125Diesel Price ($/L) 0.59Fueling costs ($/kWh) 0 0 $0.18Economic Ife 25 10 5Capacity Factor 16.0% 32.0% 40.0%Specific Yield (kWh/year/kWp) 1401.6 2803.2 3504Discount Rate 10.00% 10.00% 10.00%Annual Energy Production (kWh) 182208 182208 420480Total levelized cost (cent/kWh) 7.37 40.66 22.84
Effective Tariff (EDL + Generator) 18.65 18.65 18.65Annual Savings ($) 20549 -40104 -17608Lifetime savings 513731 -401038 -88041Payback Period (years) 5.1 NA NANet Present Value 76,591 (591,343) (80,426)
Table 7. Simulation results when considering a 130 kWp system, with and without storage, or a diesel generator of 120 kWp capacity
This shows that solarizing Loussi station without storage would require an upfront capital cost of $ 104,000, would allow annual savings of $ 20,549, and total savings of $ 513,731 over 25 years. Adding batteries would increase the capital cost to around $ 400,000 but would need a much longer payback period.
On the other hand, securing a 150 kVA diesel generator to act as a backup, in absence an EDL supply, would need around $ 22,000 of capital investments and induce yearly O&M costs, with no financial savings at the establishment level.
Part of the collected Al Rafid data was the amount people pay for water-trucking and bottled-water. In Zone A, water-trucking and bottled-water costs were only present in the case of a malfunction with the pump at the municipality well. But in Zone B, water-trucking and bottled-water costs are a constant burden year-round, which intensify in the summer.
Volume V: Socio-Economic Assessment of the Water-Energy Nexus 37
Data showed that people in Al Rafid pay: $ 78,030 for water-trucking, and $ 23,032 for bottled-water, adding to a total of $ 101,062 yearly cost. All of these costs can be avoided if water is supplied properly to Al Rafid.
In comparison to the solarization potential, previously discussed at Sultan Yaacoub, which would supply Loussi station with constant power, communities in Al Rafid would be saving up to $ 2,526,550 over the span of 25 years. Shifting to solar power would cost the government a capital upfront cost of $ 104,000, meanwhile, not doing so (or installing generators), will cost communities almost as much. Thus, water costs on people can be reduced if electricity is provided to the station continuously, highlighting the direct connection between energy and water availability as well as cost.
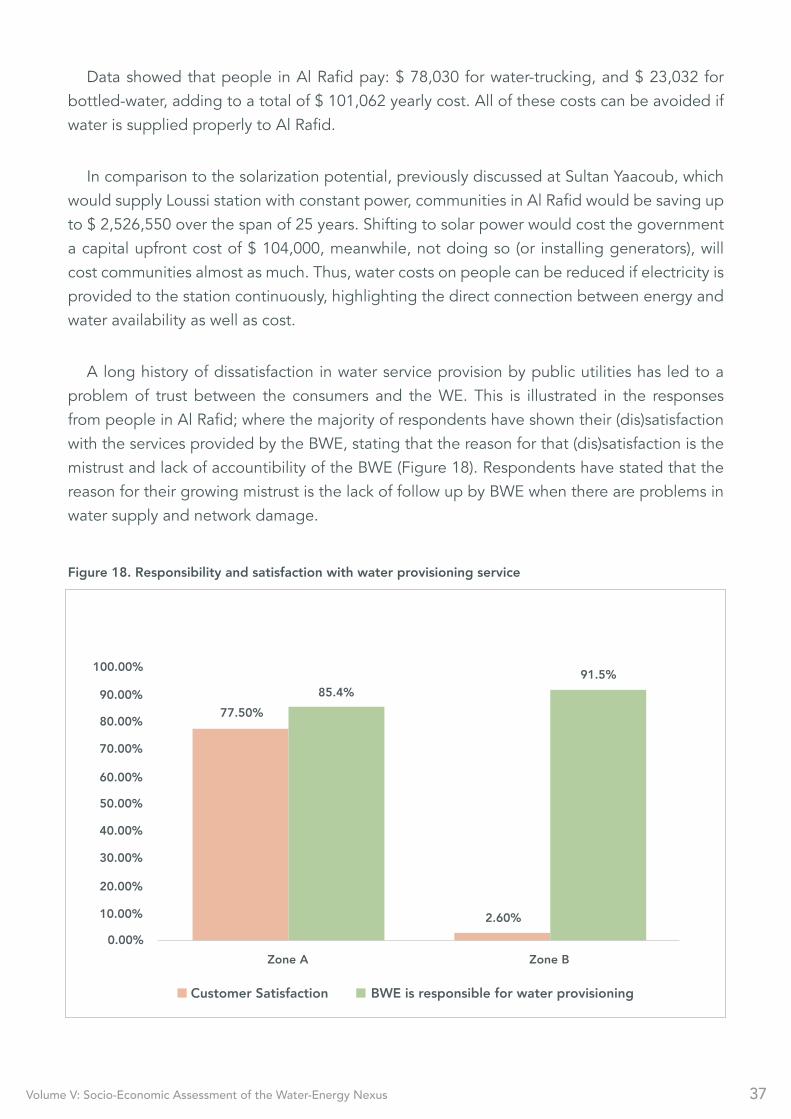
A long history of dissatisfaction in water service provision by public utilities has led to a problem of trust between the consumers and the WE. This is illustrated in the responses from people in Al Rafid; where the majority of respondents have shown their (dis)satisfaction with the services provided by the BWE, stating that the reason for that (dis)satisfaction is the mistrust and lack of accountibility of the BWE (Figure 18). Respondents have stated that the reason for their growing mistrust is the lack of follow up by BWE when there are problems in water supply and network damage.
0.00%
10.00%
20.00%
30.00%
40.00%
50.00%
60.00%
70.00%
80.00%
90.00%77.50%
85.4%
2.60%
91.5%100.00%
Zone A
Customer Satisfaction BWE is responsible for water provisioning
Zone B
Figure 18. Responsibility and satisfaction with water provisioning service
Volume V: Socio-Economic Assessment of the Water-Energy Nexus 38
Respondents expressed various levels of (dis)satisfaction with the water services thay are receiving. Loussi station serviced, Zone A residents of Al Rafid were mainly dissatisified with the serivce of BWE, with only 2.6% satisfied with the service (Figure 18). Respondents in Zone B, on the other hand, expressed a much higher satisafaction level (77.5%), which is understandable considering the significantly fewer shortages and better water quality (Figure 18). The majority of the dissatified respondents in both zones attribute the poor service to issues related to BWE’s performance, blaming the utility for the water challenges the village is facing. A determinant factor in why respondents prefer to pay to the municipality is that, in their opinion, there is more room for better accountability at that level of governance, in addition to a proven record in better water service provision for Zone A.
Volume V: Socio-Economic Assessment of the Water-Energy Nexus 39
The interlinkages between electricity and water are present at different levels starting with the water-pumping stations at the utility level, to water-pumping from wells at the village level, and the imbedded in water-trucking and bottled-water costs at the household level. The unbalance or breakdown in the water-energy nexus at the establishment level, as depicted in this case study, has been shown to perculate down to towns and villages, all the way to the household level. It is translated into inequalities, additional financial burdens and socio-economic challenges. In Al Rafid, as in many towns and villages in Lebanon, electricity shortages and uneven current have led to poor water service provision, forcing people to pay for water services two and in some cases three times: the BWE yearly fees, bottled-drinking water, and water-trucking fees, in cases of water shortages, which are frequent, in the case of Al Rafid.
The mistrust in public utilities, as with all public institutions in the country, has created a vicious cycle where people do not pay their water bills (or even subscribe to the service), which results in high non-revenue water—the inability of the utility to recover its cost of operating and maintaining its network, and so paying for its electricity bills—thereby directly leading to poor service. This calls on WE to have “gaining the trust of users” as one of their most prominent strategic priorities. The fact that citizens, in this case study, are willing to pay their subscription fees or even pay more for an improved and proper water service presents a positive outlook for a change in tarrif. However, this will have to be preceded by improved performance by the WEs, through demostrated improved water availability and quality.
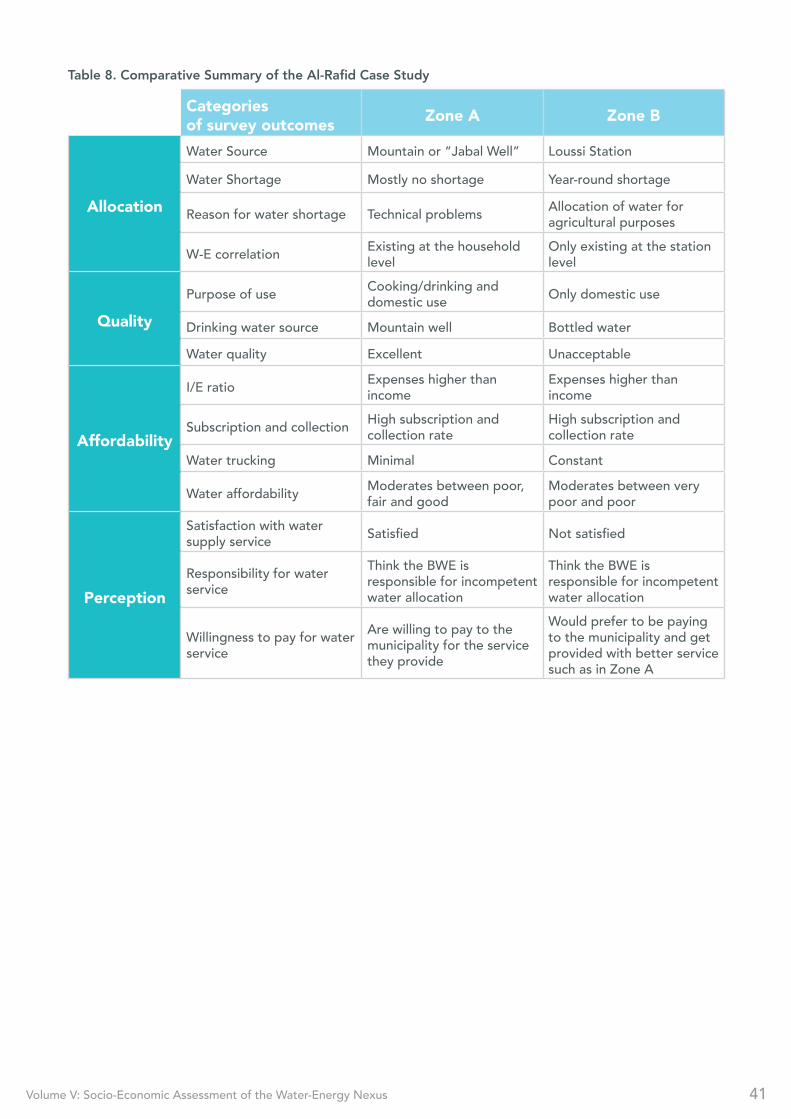
A key element of the study was to investigate and highlight how energy affects water availability and affordability. The vertical flux of impacts of energy (either lack of electricity or its poor quality) from the establishment level to the village/household level on water availability is what is unique about this study, and has not been tackled by other studies. This case study (summarized in Table 8) brings forward two issues that are of significant importance to the water sector in Lebanon: the role of municipalities and the lack of integrated water-energy planning. This case study clearly showed that municipalities are defacto deeply involved in water service porvision. Such a reality often results in conflict between municipalties and water establishments, especially in the Beka’a. Law 2217 did not realize any role or responsibilities for municipalities in water provision, and as such municipalities are not prepared to play such a role, especially considering their limited financial resources and technical know-how. This
Synthesis
7 Law 221 promulgated in 2000, merged the twenty-two existing water authorities and 209 water committees into the four regional water establishments with managerial independence, financial stability, and technical empowerment. It was envisioned that the RWEs would be able to recruit qualified staff and their corporatization would allow a soft transition to private participation in their management. Law 221 gave the new RWEs a high degree of autonomy, enabling them to work and to manage water resources more efficiently, and took away any role that municipalities had in the management of the water sector.

Volume V: Socio-Economic Assessment of the Water-Energy Nexus 40
results in an additional burden on municipalities and liability, where liability is not due. In the case of Al Rafid, the municipality was not charging the households any additional fees for services rendered for water service provision and network maintenance (costs are being covered by donations from the mayor and emigrants); however, in other cases, such expenses might eventually be carried by the residents further adding to their water expenses. One of the main findings of the study is that energy plays a large role in water distribution at the station level and at the village level (especially in the case of Al Rafid). Hence it also plays a role in water shortages and the frequent cuts that occur. A better integration between water and energy at the policy level and the water establishment level would allow for better water-supply service to reduce or eliminate unnecessary water costs on people.
At a higher level of planning the challenges faced by utilities, due to interrupted electricity, has not been addressed, rather operators have been left to fend for themselves in trying to overcome these challenges. Improved integrated planning between the electricity service provider and water service providers (both under the same ministry) would help in partially solving the problem. Issues such as transmission lines should be tackled. Considering the electricity problems faced by the water establishments, water utilities should be based on presidential lines8 in order to align the hours of electricity provisioning and their schedule with the needs of their subscribers. Reservoir capacity at the water estbalishment level has proven to be ineffective when combined with the power cuts the stations are facing. All of which adds another cost on people, where, in addition to water expenses, they have to account for reservoir costs.
This case study also brings forward the issue of water allocation and priority users. Even though this issue is not directly linked to interlinkages between electricity and water, it is, however, another example of the importance of integrated planning between water, energy, and food production.
8 Presidential lines are electricity transmission lines that never or rarely experience outages.
Volume V: Socio-Economic Assessment of the Water-Energy Nexus 41
Categoriesof survey outcomes Zone A Zone B
Allocation
Water Source Mountain or “Jabal Well” Loussi Station
Water Shortage Mostly no shortage Year-round shortage
Reason for water shortage Technical problems Allocation of water for agricultural purposes
W-E correlation Existing at the household level
Only existing at the station level
QualityPurpose of use Cooking/drinking and
domestic use Only domestic use
Drinking water source Mountain well Bottled waterWater quality Excellent Unacceptable
Affordability
I/E ratio Expenses higher than income
Expenses higher than income
Subscription and collection High subscription and collection rate
High subscription and collection rate
Water trucking Minimal Constant
Water affordability Moderates between poor, fair and good
Moderates between very poor and poor
Perception
Satisfaction with water supply service Satisfied Not satisfied
Responsibility for water service
Think the BWE is responsible for incompetent water allocation
Think the BWE is responsible for incompetent water allocation
Willingness to pay for water service
Are willing to pay to the municipality for the service they provide
Would prefer to be paying to the municipality and get provided with better service such as in Zone A
Table 8. Comparative Summary of the Al-Rafid Case Study
Volume V: Socio-Economic Assessment of the Water-Energy Nexus 42
Throughout the screening process, a large number of municipalities were contacted in the Beka’a and in the North, and based on the information they provided, it was clear that the problems facing Al Rafid are common for the majority of villages. There is a need for change in management at the WE level to lessen the socio-economic impacts at the household level in these villages. This case study provided insights as to what problems are faced at the household level, which can be fixed at the water supply level.
From this case study, fundamental objectives were identified to help improve water services in general, which include:
Update and expand network coverageThere is a need to improve the outdated network installed and to extend its coverage to
include households that are not connected. The physical network is too old and in very bad condition.
Improve water delivery and qualityThe water allocated from the WE is either not delivered or arrives at very low pressure. Water
should be allocated to cover basic needs at appropriate pressure, and in adequate quality. In order to reduce the cost of water expenditure and the amount paid for water purchases, whether it is for domestic use or for drinking purposes, there is a need to improve the quality of the supplied water. Water plans should target a continuous service provisioning of drinking water, relieving households’ budget from off-network alternatives, notably bottled-water and water-trucking.
Rethinking the tariff system currently implemented by the BWEAccording to the case study, households are already paying two, and in some cases,
three times for water; once for the WE fee and another for alternative sources. According to the results, people are willing to pay more for an efficient service, changing the tariff collection pattern or paying system from annually to quarterly may prove less impactful on the economic condition of the households. Throughout the survey, people have repeatedly stated that paying once a year (especially with the collection process being so erratic) has become a burden, and they would not be opposed to a new tariff system; in fact, one of the respondents blatantly suggested this.
Increase WE revenues to provide better serviceTo increase WE revenues, collection must be more efficient, but that goes hand in hand
with providing better service, better water quality, and minimal-to-no existing water-supply
Take-Away and Insights
Volume V: Socio-Economic Assessment of the Water-Energy Nexus 43
disruptions. This means better management on BWE’s behalf and internal monitoring to avoid problems with water allocation.
Better cooperation between the municipalities and the WEsThere is a gap in communication between the municipality of Al Rafid and the BWE. In the
case of the BWE, there is a shortage of employees to cover all the responsibilities that the WE undertakes; however, an agreement with the municipality to work together on collecting tariffs, on managing the water sources, or renewing the network can prove beneficial to all parties involved, especially the Al Rafid community. This form of agreement can be an adaptation to Law 221, which since its inception has not been fully implemented by the WEs.
Investing in renewable energy at utilities levelThis might not have been proven to be, currently, as the best business case in terms of
electricty bills (refer to Volume IV: Renewable Energy Potential And Market Assessment); however, other factors, such as inequalities and unwarranted household financial burdens due to electricty-related water shortages, could prove to be a convincing case for BWE to invest in RE in key locations to compensate for any power interruptions.
These reforms are the first of many steps in order to reach a sustainable water provisioning mechanism, which would be beneficial for the WE and its communities.
Volume V: Socio-Economic Assessment of the Water-Energy Nexus 44
During the field survey, surveyors faced the following limitations:
• Due to the political and economic instability in the country during the time of the survey,
the surveyors had to constantly realign the discussions with the objectives at hand, as
residents were more interested in discussing the economic crisis observed as a “bigger”
problem at the time.
• Reluctance to discuss the topic at hand, which is the water and electricity issue, as it is a
redundant “lost case” for many of the respondents surveyed.
Field Limitations
Volume V: Socio-Economic Assessment of the Water-Energy Nexus 45
Arce-Gomez, A., Donovan, J. D., & Bedggood, R. E. (2015). Social impact assessments: Developing a consolidated conceptual framework. Environmental Impact Assessment Review, 50, 85–94. doi: 10.1016/j.eiar.2014.08.006
DAI/KREDO. (2013). Water supply and wastewater systems master plan for the BWE. Retrieved from https://www.pseau.org/outils/ouvrages/dai_kredo_usaid_master_plan_for_the_bekaa_water_establishment_wastewater_capital_investment_plan_priority_action_plan_2015.pdf
Räikkönen, M., Kunttu, S., Uusitalo, T., Takala, J., Shakeel, S. R., Tilabi, S., Forss, T., Koivunen, J. (2016). A framework for assessing the social and economic impact of sustainable investments. Management and Production Engineering Review, 7(3), 79–86. doi: 10.1515/mper-2016-0027
Smyth, E., & Vanclay, F. (2017). The social framework for projects: A conceptual but practical model to assist in assessing, planning and managing the social impacts of projects. Impact Assessment and Project Appraisal, 35(1), 65–80. doi: 10.1080/14615517.2016.1271539
USAID. (2015). Lebanon water and wastewater sector support program: Water supply and wastewater systems master plan for the Bekaa water establishment. Retrieved from https://www.pseau.org/outils/ouvrages/Bekaa_Water_Establishment_Master_Plan_2015.pdf
References
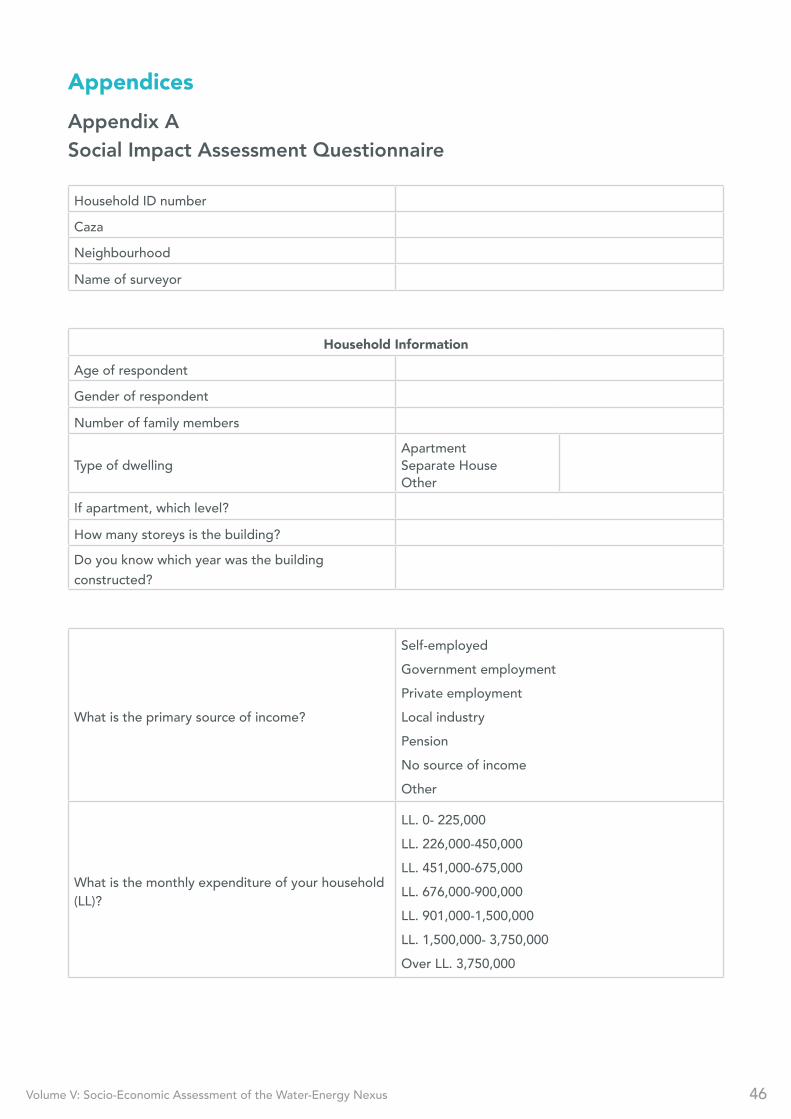
Volume V: Socio-Economic Assessment of the Water-Energy Nexus 46
Appendix ASocial Impact Assessment Questionnaire
Appendices
Household ID numberCazaNeighbourhoodName of surveyor
Household Information
Age of respondentGender of respondentNumber of family members
Type of dwellingApartmentSeparate HouseOther
If apartment, which level?How many storeys is the building?Do you know which year was the building constructed?
What is the primary source of income?
Self-employedGovernment employmentPrivate employmentLocal industryPensionNo source of incomeOther
What is the monthly expenditure of your household (LL)?
LL. 0- 225,000LL. 226,000-450,000LL. 451,000-675,000LL. 676,000-900,000LL. 901,000-1,500,000LL. 1,500,000- 3,750,000Over LL. 3,750,000
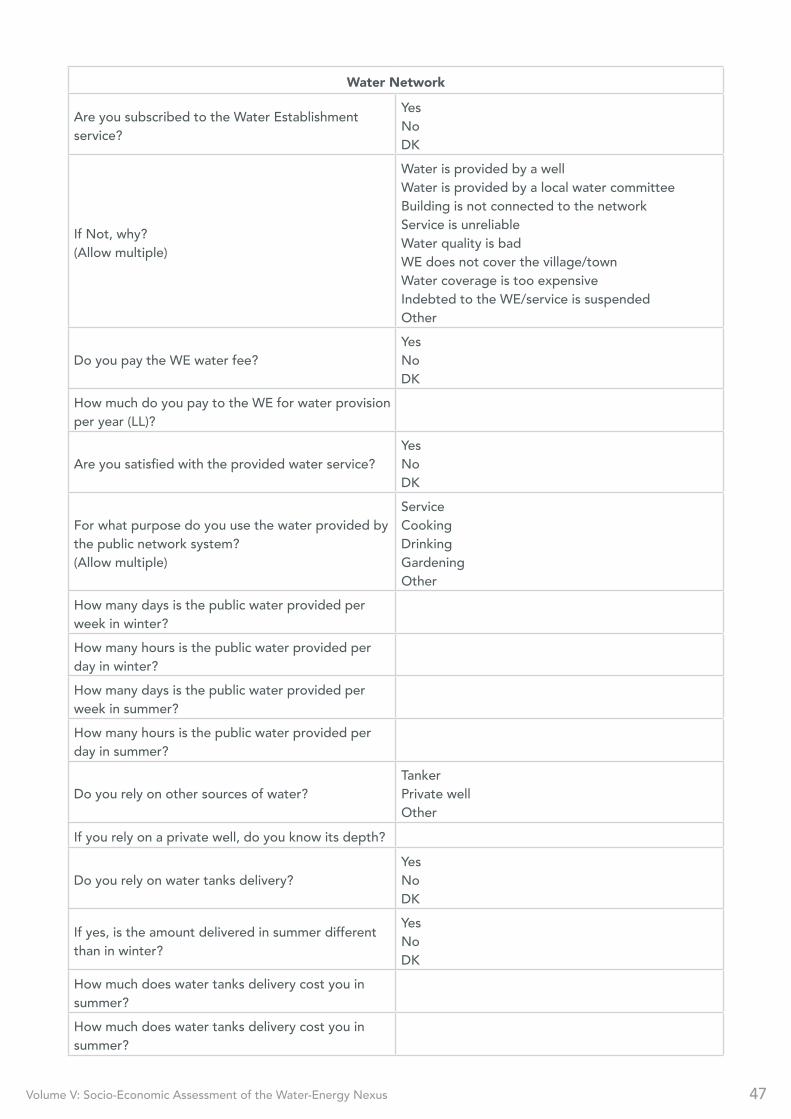
Volume V: Socio-Economic Assessment of the Water-Energy Nexus 47
Water Network
Are you subscribed to the Water Establishment service?
YesNoDK
If Not, why?(Allow multiple)
Water is provided by a wellWater is provided by a local water committeeBuilding is not connected to the networkService is unreliableWater quality is badWE does not cover the village/townWater coverage is too expensiveIndebted to the WE/service is suspendedOther
Do you pay the WE water fee?YesNoDK
How much do you pay to the WE for water provision per year (LL)?
Are you satisfied with the provided water service?YesNoDK
For what purpose do you use the water provided by the public network system?(Allow multiple)
ServiceCookingDrinkingGardeningOther
How many days is the public water provided per week in winter?How many hours is the public water provided per day in winter?How many days is the public water provided per week in summer?How many hours is the public water provided per day in summer?
Do you rely on other sources of water?TankerPrivate wellOther
If you rely on a private well, do you know its depth?
Do you rely on water tanks delivery?YesNoDK
If yes, is the amount delivered in summer different than in winter?
YesNoDK
How much does water tanks delivery cost you in summer?How much does water tanks delivery cost you in summer?
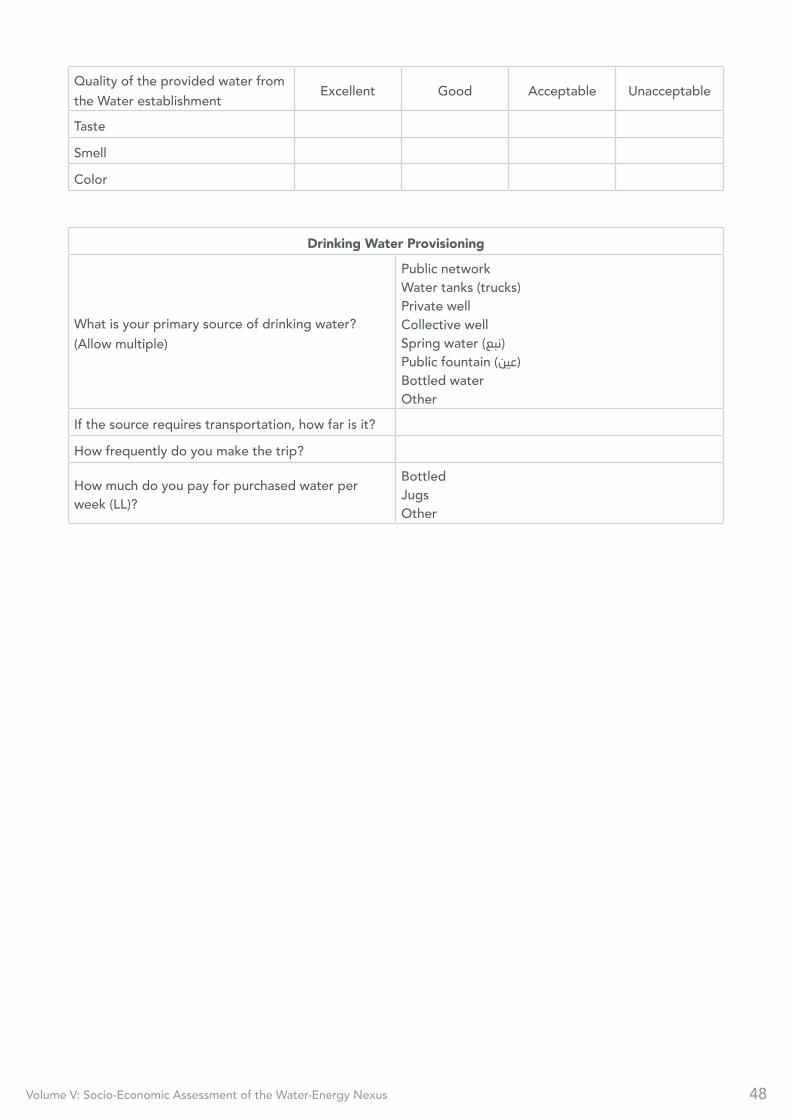
Volume V: Socio-Economic Assessment of the Water-Energy Nexus 48
Quality of the provided water from the Water establishment Excellent Good Acceptable Unacceptable
TasteSmellColor
Drinking Water Provisioning
What is your primary source of drinking water?(Allow multiple)
Public networkWater tanks (trucks)Private wellCollective wellSpring water (نبع)Public fountain (عين)Bottled waterOther
If the source requires transportation, how far is it?How frequently do you make the trip?
How much do you pay for purchased water per week (LL)?
BottledJugsOther
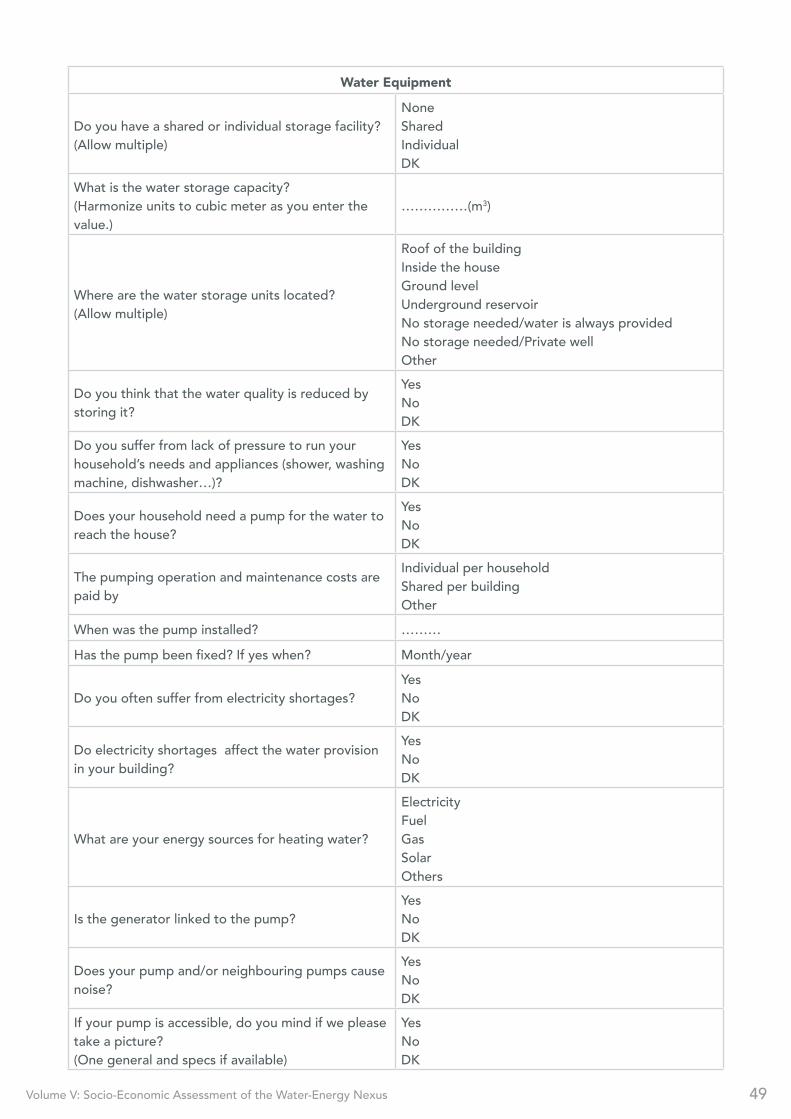
Volume V: Socio-Economic Assessment of the Water-Energy Nexus 49
Water Equipment
Do you have a shared or individual storage facility? (Allow multiple)
NoneSharedIndividualDK
What is the water storage capacity?(Harmonize units to cubic meter as you enter the value.)
……………(m3)
Where are the water storage units located?(Allow multiple)
Roof of the buildingInside the houseGround levelUnderground reservoirNo storage needed/water is always providedNo storage needed/Private wellOther
Do you think that the water quality is reduced by storing it?
YesNoDK
Do you suffer from lack of pressure to run your household’s needs and appliances (shower, washing machine, dishwasher…)?
YesNoDK
Does your household need a pump for the water to reach the house?
YesNoDK
The pumping operation and maintenance costs are paid by
Individual per householdShared per buildingOther
When was the pump installed? ……… Has the pump been fixed? If yes when? Month/year
Do you often suffer from electricity shortages?YesNoDK
Do electricity shortages affect the water provision in your building?
YesNoDK
What are your energy sources for heating water?
ElectricityFuelGasSolarOthers
Is the generator linked to the pump?YesNoDK
Does your pump and/or neighbouring pumps cause noise?
YesNoDK
If your pump is accessible, do you mind if we please take a picture?(One general and specs if available)
YesNoDK
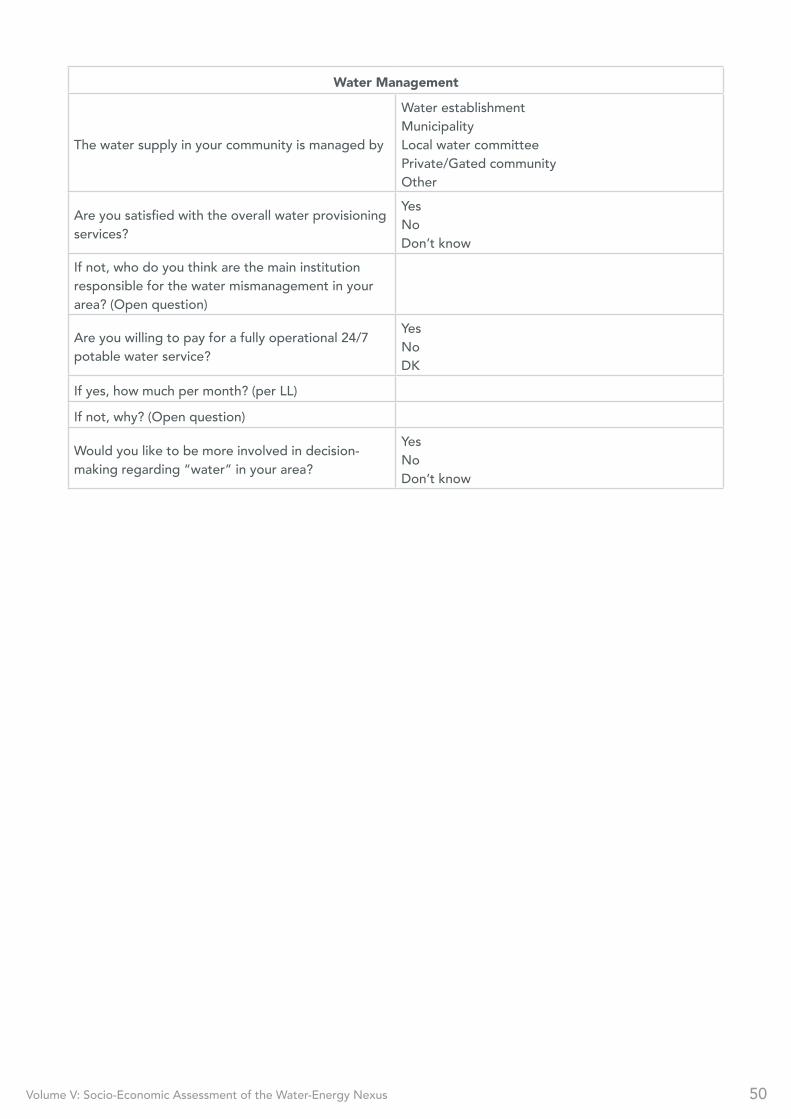
Volume V: Socio-Economic Assessment of the Water-Energy Nexus 50
Water Management
The water supply in your community is managed by
Water establishmentMunicipalityLocal water committeePrivate/Gated communityOther
Are you satisfied with the overall water provisioning services?
YesNoDon’t know
If not, who do you think are the main institution responsible for the water mismanagement in your area? (Open question)
Are you willing to pay for a fully operational 24/7 potable water service?
YesNoDK
If yes, how much per month? (per LL)If not, why? (Open question)
Would you like to be more involved in decision-making regarding “water” in your area?
YesNoDon’t know

Volume V: Socio-Economic Assessment of the Water-Energy Nexus 51
copyright:
© June 2021- Oxfam. All rights reserved. Licensed to the European Union under conditions
This publication is copyright but the text may be used free of charge for the purposes of advocacy, campaigning, education, and research, provided that the source is acknowledged in full. The copyright holder requests that all such use be registered with them for impact assessment purposes. For copying in any other circumstances, or for re-use in other publications, or for translation or adaptation, permission must be secured and a fee may be charged.Please contact Oxfam for more information. email:[email protected].
The information in this publication is correct at the time of going to press.
Oxfam has been working in Lebanon since 1993. We provide humanitarian assistance to vulnerable people affected by conflict, and we promote economic development, promotion of good governance at a local and national level, and women’s rights through our work with our partners. Oxfam also works with local partners to contribute to the protection and empowerment of marginalized women and men.
Volume V: Socio-Economic Assessment of the Water-Energy Nexus 52
THE ISSAM FARES INSTITUTE FOR PUBLIC POLICY AND INTERNATIONAL AFFAIRS
Inaugurated in 2006, the Issam Fares Institute for Public Policy and International Affairs (IFI) at the American University of Beirut (AUB) is an independent, research-based, policy-oriented institute. It aims to initiate and develop policy-relevant research in and about the Arab world. The Institute aims at bridging the gap between academia and policymaking by conducting high quality research on the complex issues and challenges faced by Lebanese and Arab societies within shifting international and global contexts, by generating evidence-based policy recommendations and solutions for Lebanon and the Arab world, and by creating an intellectual space for an interdisciplinary exchange of ideas among researchers, scholars, civil society actors, media, and policy makers.
CLIMATE CHANGE AND ENVIRONMENT PROGRAM
The Climate Change and Environment program was launched in 2008 as part of IFI’s strategy of utilizing the AUB’s significant research and analytical capabilities to inform and guide public policymaking of Lebanon and the Arab world. The program’s strategic objective is to generate, and influence policy related to climate change and environmental issues.
Volume V: Socio-Economic Assessment of the Water-Energy Nexus 53
WATER-ENERGY NEXUS OF WATER
AND WASTEWATER SERVICESIN LEBANON
Volume II.
www.oxfam.org/lebanon Oxfam in Lebanon
SOCIAL NETWORK ANALYSIS