Water and Nutrient Research: In-field and Offsite...
18
Annual Report Water and Nutrient Research: In-field and Offsite Strategies Matthew Helmers Associate Professor William Crumpton Professor Carl Pederson Research Associate Greg Stenback Associate Scientist January 1, 2013 – December 31, 2013 Submitted to Iowa Department of Agriculture and Land Stewardship Submitted by Department of Agricultural and Biosystems Engineering Department of Ecology, Evolution and Organismal Biology Iowa State University, Ames
Transcript of Water and Nutrient Research: In-field and Offsite...
Annual Report
Water and Nutrient Research: In-field and
Offsite Strategies
Matthew Helmers Associate Professor
William Crumpton Professor
Carl Pederson Research Associate
Greg Stenback Associate Scientist
January 1, 2013 – December 31, 2013
Submitted to
Iowa Department of Agriculture and Land Stewardship
Submitted by
Department of Agricultural and Biosystems Engineering
Department of Ecology, Evolution and Organismal Biology
Iowa State University, Ames
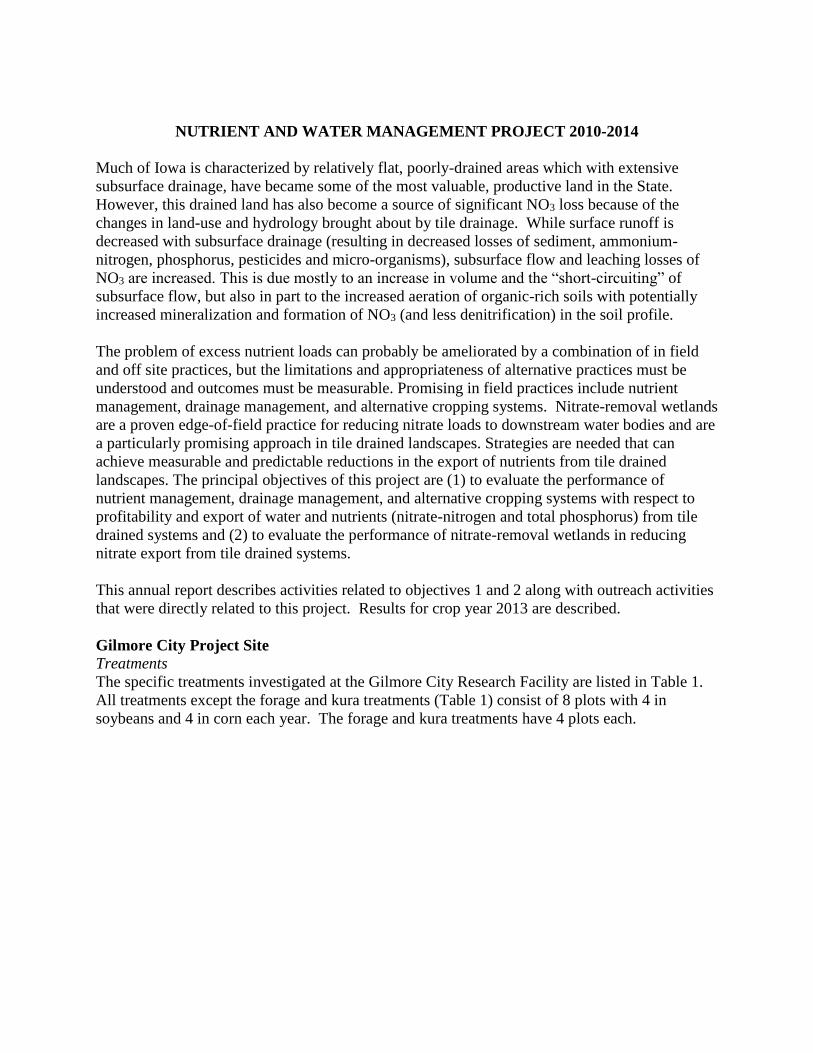
NUTRIENT AND WATER MANAGEMENT PROJECT 2010-2014
Much of Iowa is characterized by relatively flat, poorly-drained areas which with extensive
subsurface drainage, have became some of the most valuable, productive land in the State.
However, this drained land has also become a source of significant NO3 loss because of the
changes in land-use and hydrology brought about by tile drainage. While surface runoff is
decreased with subsurface drainage (resulting in decreased losses of sediment, ammonium-
nitrogen, phosphorus, pesticides and micro-organisms), subsurface flow and leaching losses of
NO3 are increased. This is due mostly to an increase in volume and the “short-circuiting” of
subsurface flow, but also in part to the increased aeration of organic-rich soils with potentially
increased mineralization and formation of NO3 (and less denitrification) in the soil profile.
The problem of excess nutrient loads can probably be ameliorated by a combination of in field
and off site practices, but the limitations and appropriateness of alternative practices must be
understood and outcomes must be measurable. Promising in field practices include nutrient
management, drainage management, and alternative cropping systems. Nitrate-removal wetlands
are a proven edge-of-field practice for reducing nitrate loads to downstream water bodies and are
a particularly promising approach in tile drained landscapes. Strategies are needed that can
achieve measurable and predictable reductions in the export of nutrients from tile drained
landscapes. The principal objectives of this project are (1) to evaluate the performance of
nutrient management, drainage management, and alternative cropping systems with respect to
profitability and export of water and nutrients (nitrate-nitrogen and total phosphorus) from tile
drained systems and (2) to evaluate the performance of nitrate-removal wetlands in reducing
nitrate export from tile drained systems.
This annual report describes activities related to objectives 1 and 2 along with outreach activities
that were directly related to this project. Results for crop year 2013 are described.
Gilmore City Project Site
Treatments
The specific treatments investigated at the Gilmore City Research Facility are listed in Table 1.
All treatments except the forage and kura treatments (Table 1) consist of 8 plots with 4 in
soybeans and 4 in corn each year. The forage and kura treatments have 4 plots each.
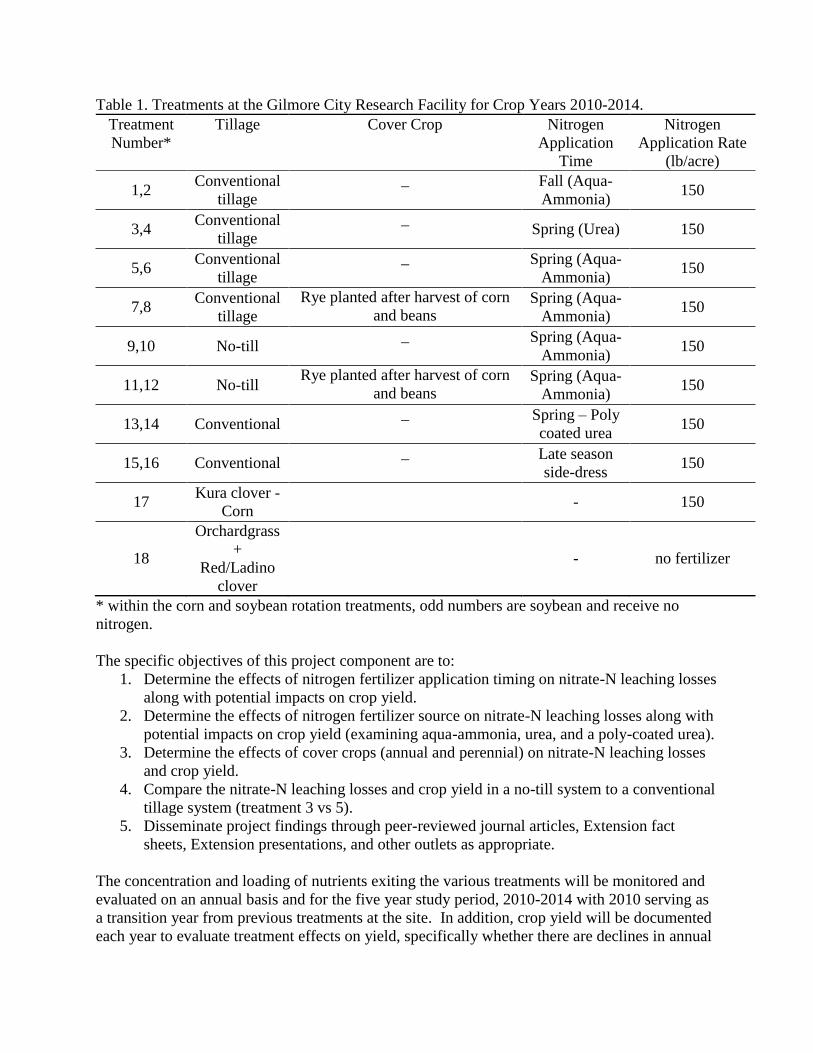
Table 1. Treatments at the Gilmore City Research Facility for Crop Years 2010-2014.
Treatment
Number*
Tillage Cover Crop Nitrogen
Application
Time
Nitrogen
Application Rate
(lb/acre)
1,2 Conventional
tillage
_ Fall (Aqua-
Ammonia) 150
3,4 Conventional
tillage
_ Spring (Urea) 150
5,6 Conventional
tillage
_ Spring (Aqua-
Ammonia) 150
7,8 Conventional
tillage
Rye planted after harvest of corn
and beans Spring (Aqua-
Ammonia) 150
9,10 No-till _ Spring (Aqua-
Ammonia) 150
11,12 No-till Rye planted after harvest of corn
and beans Spring (Aqua-
Ammonia) 150
13,14 Conventional _ Spring – Poly
coated urea 150
15,16 Conventional _ Late season
side-dress 150
17 Kura clover -
Corn
- 150
18
Orchardgrass
+
Red/Ladino
clover
- no fertilizer
* within the corn and soybean rotation treatments, odd numbers are soybean and receive no
nitrogen.
The specific objectives of this project component are to:
1. Determine the effects of nitrogen fertilizer application timing on nitrate-N leaching losses
along with potential impacts on crop yield.
2. Determine the effects of nitrogen fertilizer source on nitrate-N leaching losses along with
potential impacts on crop yield (examining aqua-ammonia, urea, and a poly-coated urea).
3. Determine the effects of cover crops (annual and perennial) on nitrate-N leaching losses
and crop yield.
4. Compare the nitrate-N leaching losses and crop yield in a no-till system to a conventional
tillage system (treatment 3 vs 5).
5. Disseminate project findings through peer-reviewed journal articles, Extension fact
sheets, Extension presentations, and other outlets as appropriate.
The concentration and loading of nutrients exiting the various treatments will be monitored and
evaluated on an annual basis and for the five year study period, 2010-2014 with 2010 serving as
a transition year from previous treatments at the site. In addition, crop yield will be documented
each year to evaluate treatment effects on yield, specifically whether there are declines in annual
yield at the lower nitrogen rate applications. The evaluation of the treatment effects will be for
the study period but each year will be analyzed to evaluate treatment effects on a yearly basis
and after the completion of this phase of the research study. It is understood that climatic
variability plays a significant role in the leaching of nutrients in the tile drained landscape. Based
on this, it is important to have numerous years of leaching data to evaluate the treatment effects
both from a production (crop yield) perspective and a nutrient leaching perspective. The
multiple years of data allows for evaluating how the treatments respond under varying climatic
conditions and after subsequent years with similar cropping practices. Also, these multiple years
of data allow for additional characterization of tile flow under varied precipitation conditions and
allow for further understanding of the hydrology of the site.
Agronomic Activities
Cereal rye for 2013 was seeded on October 8, 2012. Fall fertilization was completed on
November 16, 2012. Chisel plowing was performed on November 13, 2012.
Agronomic field activities in 2013 were delayed due to excessive precipitation and colder
temperatures earlier in the crop season. Rye cover crop in corn plots was sprayed to terminate
rye on April 25. Urea and ESN was applied and incorporated on May 13. Seedbed preparation
for corn and soybean was completed on May 13, 2013. Corn was planted on May 14 and
soybean planting was finished on June 7. Soybean rye cover crop plots were sprayed to eliminate
rye on May 23. Aqua-ammonia was side-dress applied on June 13. Soybean harvest was started
on October 10 and delayed due to rain. Soybean harvest was completed on October 21, 2013.
Corn was harvested on October 29, 2013.
Weed Control
Glyphosate resistant crops were used at the site. SureStart and Touchdown were used for post
weed control and were broadcast on June 1. Application of Authority herbicide was on June 7 for
soybean. Row cultivation for weed control was not incorporated into the weed management
system in 2013.
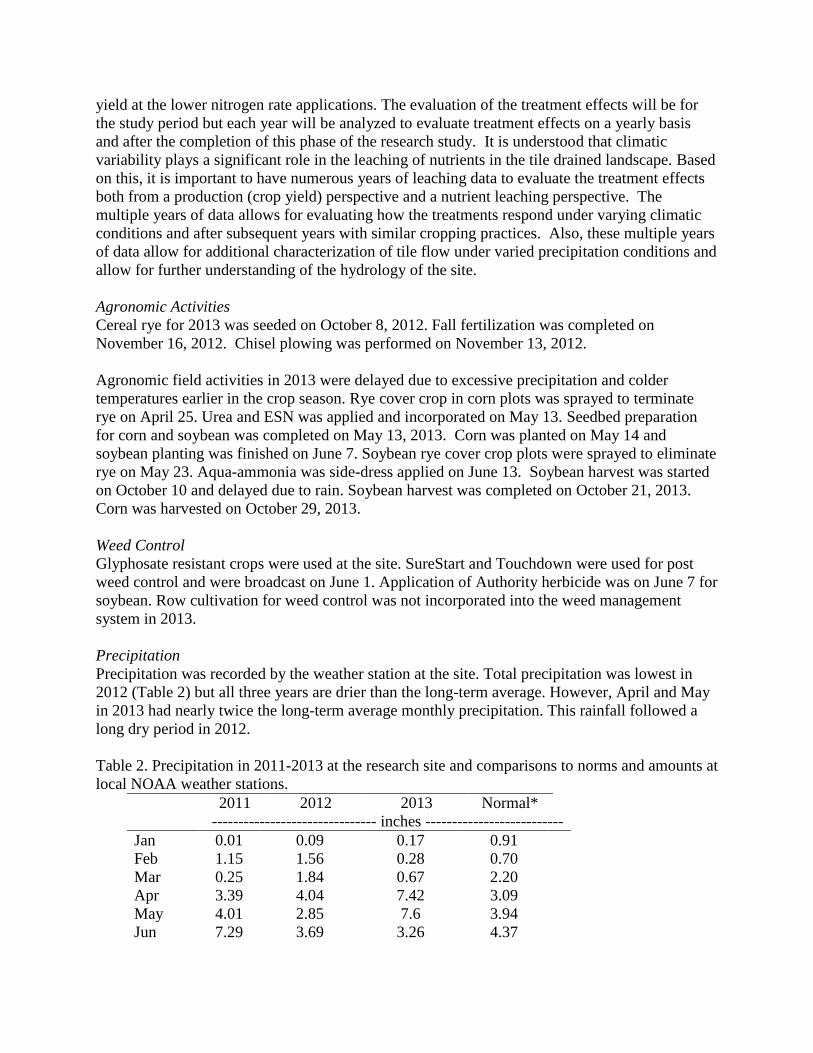
Precipitation
Precipitation was recorded by the weather station at the site. Total precipitation was lowest in
2012 (Table 2) but all three years are drier than the long-term average. However, April and May
in 2013 had nearly twice the long-term average monthly precipitation. This rainfall followed a
long dry period in 2012.
Table 2. Precipitation in 2011-2013 at the research site and comparisons to norms and amounts at
local NOAA weather stations.
2011 2012 2013 Normal*
------------------------------- inches --------------------------
Jan 0.01 0.09 0.17 0.91
Feb 1.15 1.56 0.28 0.70
Mar 0.25 1.84 0.67 2.20
Apr 3.39 4.04 7.42 3.09
May 4.01 2.85 7.6 3.94
Jun 7.29 3.69 3.26 4.37
Jul 2.89 1.16 1.83 4.37
Aug 0.86 0.98 1.3 4.60
Sep 0.93 2.05 0.55 3.16
Oct 0.17 1.52 2.1 2.17
Nov 0.30 0.47 1.41 1.86
Dec 1.00 0.56 0.02 1.37
Total 22.25 20.81 26.61 32.74 * From: Climatological Data for Iowa, National Climate Data Center for Pocahontas Iowa 1971-00.
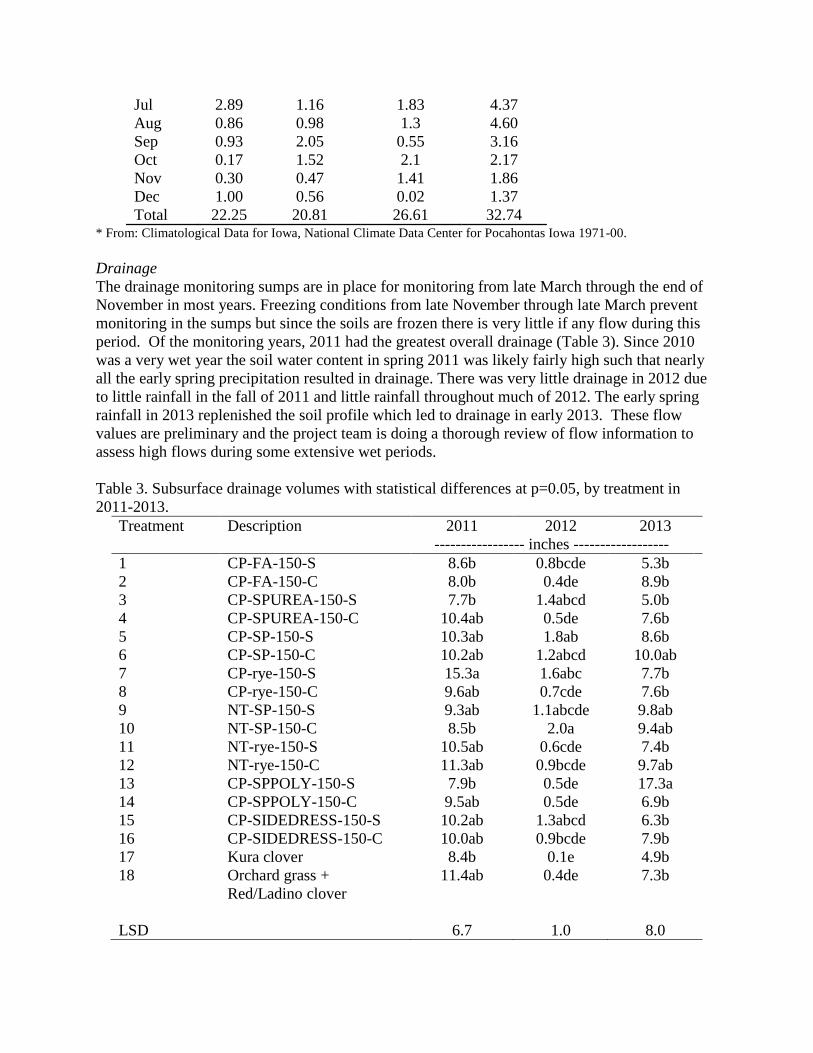
Drainage
The drainage monitoring sumps are in place for monitoring from late March through the end of
November in most years. Freezing conditions from late November through late March prevent
monitoring in the sumps but since the soils are frozen there is very little if any flow during this
period. Of the monitoring years, 2011 had the greatest overall drainage (Table 3). Since 2010
was a very wet year the soil water content in spring 2011 was likely fairly high such that nearly
all the early spring precipitation resulted in drainage. There was very little drainage in 2012 due
to little rainfall in the fall of 2011 and little rainfall throughout much of 2012. The early spring
rainfall in 2013 replenished the soil profile which led to drainage in early 2013. These flow
values are preliminary and the project team is doing a thorough review of flow information to
assess high flows during some extensive wet periods.
Table 3. Subsurface drainage volumes with statistical differences at p=0.05, by treatment in
2011-2013.
Treatment Description 2011 2012 2013
----------------- inches ------------------
1 CP-FA-150-S 8.6b 0.8bcde 5.3b
2 CP-FA-150-C 8.0b 0.4de 8.9b
3 CP-SPUREA-150-S 7.7b 1.4abcd 5.0b
4 CP-SPUREA-150-C 10.4ab 0.5de 7.6b
5 CP-SP-150-S 10.3ab 1.8ab 8.6b
6 CP-SP-150-C 10.2ab 1.2abcd 10.0ab
7 CP-rye-150-S 15.3a 1.6abc 7.7b
8 CP-rye-150-C 9.6ab 0.7cde 7.6b
9 NT-SP-150-S 9.3ab 1.1abcde 9.8ab
10 NT-SP-150-C 8.5b 2.0a 9.4ab
11 NT-rye-150-S 10.5ab 0.6cde 7.4b
12 NT-rye-150-C 11.3ab 0.9bcde 9.7ab
13 CP-SPPOLY-150-S 7.9b 0.5de 17.3a
14 CP-SPPOLY-150-C 9.5ab 0.5de 6.9b
15 CP-SIDEDRESS-150-S 10.2ab 1.3abcd 6.3b
16 CP-SIDEDRESS-150-C 10.0ab 0.9bcde 7.9b
17 Kura clover 8.4b 0.1e 4.9b
18 Orchard grass +
Red/Ladino clover
11.4ab 0.4de 7.3b
LSD 6.7 1.0 8.0

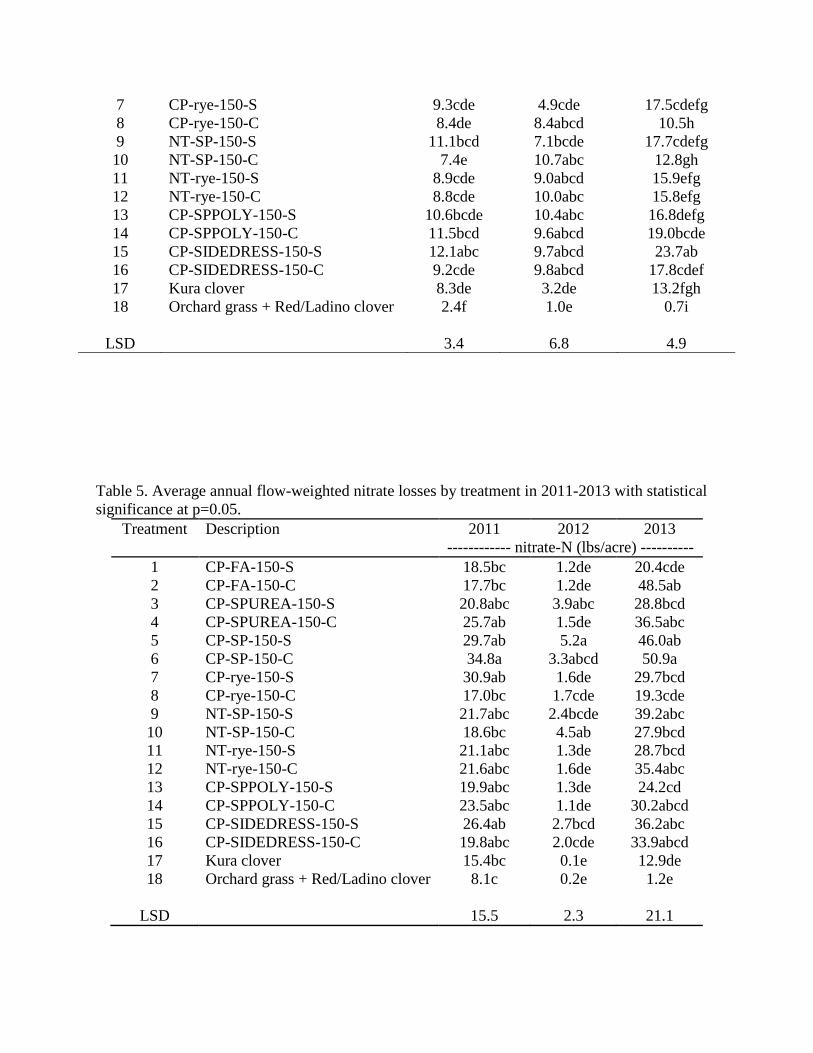
Nitrate Concentrations and Losses
In general, nitrate-N concentrations exceeded 10 mg/L in all years from systems where corn and
soybeans are grown without cover crops (Table 4). While no nitrogen is applied in the soybean
year the nitrate-N concentration is near the concentration from the corn phase of the treatment.
Overall during the three years studied to date there is little difference due to the source of
nitrogen fertilizer (aqua-ammonia, urea, or poly-coated urea). However, perennial or annual
cover crop show the potential to reduce nitrate-N concentration due to lower nitrate-N
concentrations than the similar treatment without cover crops. Also, the no-till systems have
nitrate-N concentrations that are trending lower than the conventional tillage systems.
Table 5 shows NO3-N losses by treatment in 2013. Losses were calculated by multiplying
subsurface drainage effluent concentration by drainage volume. Due to plot-to-plot flow
variability, in general there are few significant differences in nitrate-N losses between the
treatments and flow-weighted nitrate-N concentrations are likely a better measure of treatment
performance. Also, the loads are subject to change as the project team continues to review the
drainage flow.
Reactive Phosphorus Concentrations and Losses
Total reactive phosphorus (TRP) concentrations were measured in tile drainage samples that
were also tested for NO3-N. Table 6 lists flow-weighted TRP concentrations for each treatment.
Table 7 lists loss by year and treatment in grams per acre. The measured TRP includes both
dissolved and suspended orthophosphate. This test measures the form most available to plants
and is a useful indicator of potential water quality impacts such as algae blooms and weed
growth in surface waters. Overall, the levels of phosphorus leaving the plots and limits were low,
ranging from 4.6- 127.0 µg L-1 (Table 6). Due to the large variation among plots there was no
significant difference in TRP concentrations among the treatments. The loads are subject to
change as the project team continues to review the drainage flow.
Stalk Nitrate Test
Corn stalk nitrate test sampling protocols were followed to determine nitrate-N concentrations in
corn stalk tissue from each plot. Results are listed in Table 8. Stalk nitrate values can be divided
into four categories: low (less than 250 mg/L-N), marginal (250-700), optimal (700 and 2000
mg/L-N), and excess (greater than 2000 mg/L-N). In general all samples have been in the
optimal range with some samples in the marginal range and one treatment in the low range in
2011.
Table 4. Average annual flow-weighted nitrate concentrations by treatment in 2011-2013 with
statistical significance at p=0.05.
Treatment Description 2011 2012 2013
-------------- nitrate N (mg/L) ------------
1 CP-FA-150-S 10.1bcde 9.2abcd 15.8efg
2 CP-FA-150-C 11.4bcd 10.7abc 25.5a
3 CP-SPUREA-150-S 12.1abc 13.0ab 23.1ab
4 CP-SPUREA-150-C 11.7bcd 10.8abc 19.6bcde
5 CP-SP-150-S 12.7ab 14.9a 21.9abc
6 CP-SP-150-C 15.4a 14.3a 21.3abcd
7 CP-rye-150-S 9.3cde 4.9cde 17.5cdefg
8 CP-rye-150-C 8.4de 8.4abcd 10.5h
9 NT-SP-150-S 11.1bcd 7.1bcde 17.7cdefg
10 NT-SP-150-C 7.4e 10.7abc 12.8gh
11 NT-rye-150-S 8.9cde 9.0abcd 15.9efg
12 NT-rye-150-C 8.8cde 10.0abc 15.8efg
13 CP-SPPOLY-150-S 10.6bcde 10.4abc 16.8defg
14 CP-SPPOLY-150-C 11.5bcd 9.6abcd 19.0bcde
15 CP-SIDEDRESS-150-S 12.1abc 9.7abcd 23.7ab
16 CP-SIDEDRESS-150-C 9.2cde 9.8abcd 17.8cdef
17 Kura clover 8.3de 3.2de 13.2fgh
18 Orchard grass + Red/Ladino clover 2.4f 1.0e 0.7i
LSD 3.4 6.8 4.9
Table 5. Average annual flow-weighted nitrate losses by treatment in 2011-2013 with statistical
significance at p=0.05.
Treatment Description 2011 2012 2013
------------ nitrate-N (lbs/acre) ----------
1 CP-FA-150-S 18.5bc 1.2de 20.4cde
2 CP-FA-150-C 17.7bc 1.2de 48.5ab
3 CP-SPUREA-150-S 20.8abc 3.9abc 28.8bcd
4 CP-SPUREA-150-C 25.7ab 1.5de 36.5abc
5 CP-SP-150-S 29.7ab 5.2a 46.0ab
6 CP-SP-150-C 34.8a 3.3abcd 50.9a
7 CP-rye-150-S 30.9ab 1.6de 29.7bcd
8 CP-rye-150-C 17.0bc 1.7cde 19.3cde
9 NT-SP-150-S 21.7abc 2.4bcde 39.2abc
10 NT-SP-150-C 18.6bc 4.5ab 27.9bcd
11 NT-rye-150-S 21.1abc 1.3de 28.7bcd
12 NT-rye-150-C 21.6abc 1.6de 35.4abc
13 CP-SPPOLY-150-S 19.9abc 1.3de 24.2cd
14 CP-SPPOLY-150-C 23.5abc 1.1de 30.2abcd
15 CP-SIDEDRESS-150-S 26.4ab 2.7bcd 36.2abc
16 CP-SIDEDRESS-150-C 19.8abc 2.0cde 33.9abcd
17 Kura clover 15.4bc 0.1e 12.9de
18 Orchard grass + Red/Ladino clover 8.1c 0.2e 1.2e
LSD 15.5 2.3 21.1
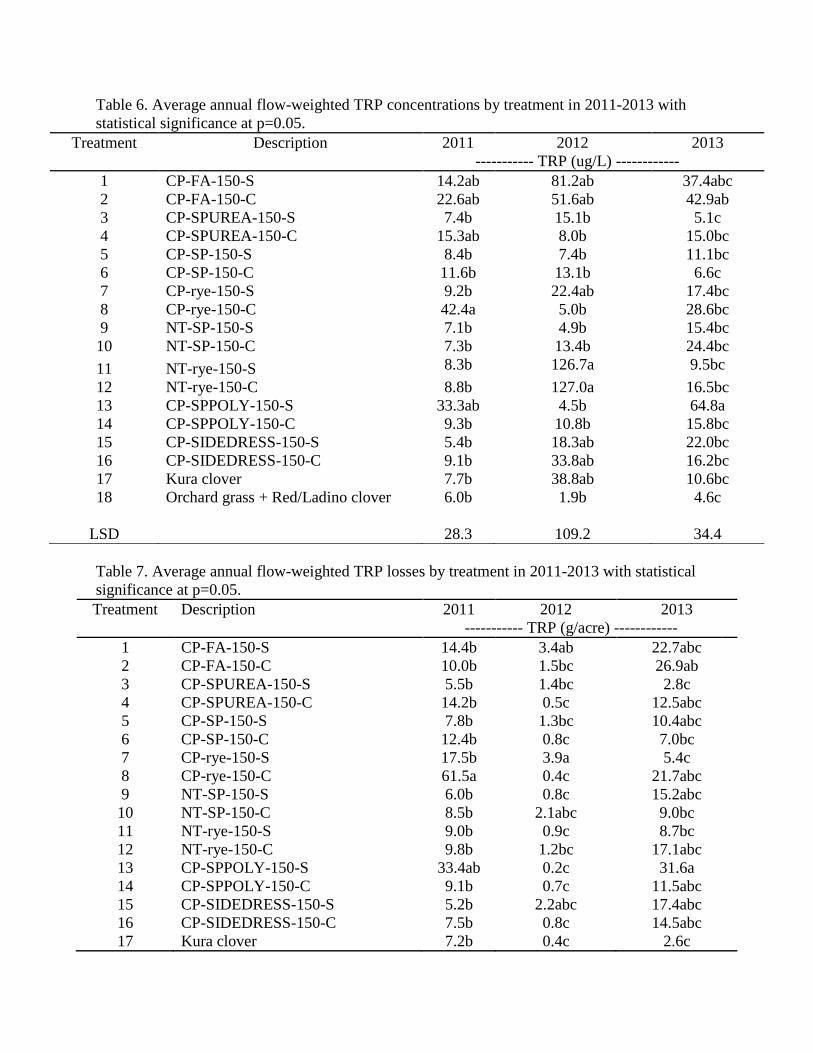
Table 6. Average annual flow-weighted TRP concentrations by treatment in 2011-2013 with
statistical significance at p=0.05.
Treatment Description 2011 2012 2013
----------- TRP (ug/L) ------------
1 CP-FA-150-S 14.2ab 81.2ab 37.4abc
2 CP-FA-150-C 22.6ab 51.6ab 42.9ab
3 CP-SPUREA-150-S 7.4b 15.1b 5.1c
4 CP-SPUREA-150-C 15.3ab 8.0b 15.0bc
5 CP-SP-150-S 8.4b 7.4b 11.1bc
6 CP-SP-150-C 11.6b 13.1b 6.6c
7 CP-rye-150-S 9.2b 22.4ab 17.4bc
8 CP-rye-150-C 42.4a 5.0b 28.6bc
9 NT-SP-150-S 7.1b 4.9b 15.4bc
10 NT-SP-150-C 7.3b 13.4b 24.4bc
11 NT-rye-150-S 8.3b 126.7a 9.5bc
12 NT-rye-150-C 8.8b 127.0a 16.5bc
13 CP-SPPOLY-150-S 33.3ab 4.5b 64.8a
14 CP-SPPOLY-150-C 9.3b 10.8b 15.8bc
15 CP-SIDEDRESS-150-S 5.4b 18.3ab 22.0bc
16 CP-SIDEDRESS-150-C 9.1b 33.8ab 16.2bc
17 Kura clover 7.7b 38.8ab 10.6bc
18 Orchard grass + Red/Ladino clover 6.0b 1.9b 4.6c
LSD 28.3 109.2 34.4
Table 7. Average annual flow-weighted TRP losses by treatment in 2011-2013 with statistical
significance at p=0.05.
Treatment Description 2011 2012 2013
----------- TRP (g/acre) ------------
1 CP-FA-150-S 14.4b 3.4ab 22.7abc
2 CP-FA-150-C 10.0b 1.5bc 26.9ab
3 CP-SPUREA-150-S 5.5b 1.4bc 2.8c
4 CP-SPUREA-150-C 14.2b 0.5c 12.5abc
5 CP-SP-150-S 7.8b 1.3bc 10.4abc
6 CP-SP-150-C 12.4b 0.8c 7.0bc
7 CP-rye-150-S 17.5b 3.9a 5.4c
8 CP-rye-150-C 61.5a 0.4c 21.7abc
9 NT-SP-150-S 6.0b 0.8c 15.2abc
10 NT-SP-150-C 8.5b 2.1abc 9.0bc
11 NT-rye-150-S 9.0b 0.9c 8.7bc
12 NT-rye-150-C 9.8b 1.2bc 17.1abc
13 CP-SPPOLY-150-S 33.4ab 0.2c 31.6a
14 CP-SPPOLY-150-C 9.1b 0.7c 11.5abc
15 CP-SIDEDRESS-150-S 5.2b 2.2abc 17.4abc
16 CP-SIDEDRESS-150-C 7.5b 0.8c 14.5abc
17 Kura clover 7.2b 0.4c 2.6c
18 Orchard grass + Red/Ladino clover 6.7b 0.1c 3.7c
LSD 39.5 2.4 21.3
Table 8. Stalk nitrate test concentrations in 2011-2013.
Treatment Description 2011 2012 2013
--------- nitrate-N* (mg/kg) -----
----
2 CP-FA-150-C 199 1694 410
4 CP-SPUREA-150-C 1092 1262 1780
6 CP-SP-150-C 671 384 443
8 CP-rye-150-C 623 1161 765
10 NT-SP-150-C 614 1222 1064
12 NT-rye-150-C 411 891 451
14 CP-SPPOLY-150-C 1146 716 1276
16 CP-SIDEDRESS-150-C 225 646 452
17 Kura 424 1629 410
* low (less than 250 mg/L-N) marginal (250-700) optimal (700-2000 mg/L-N).
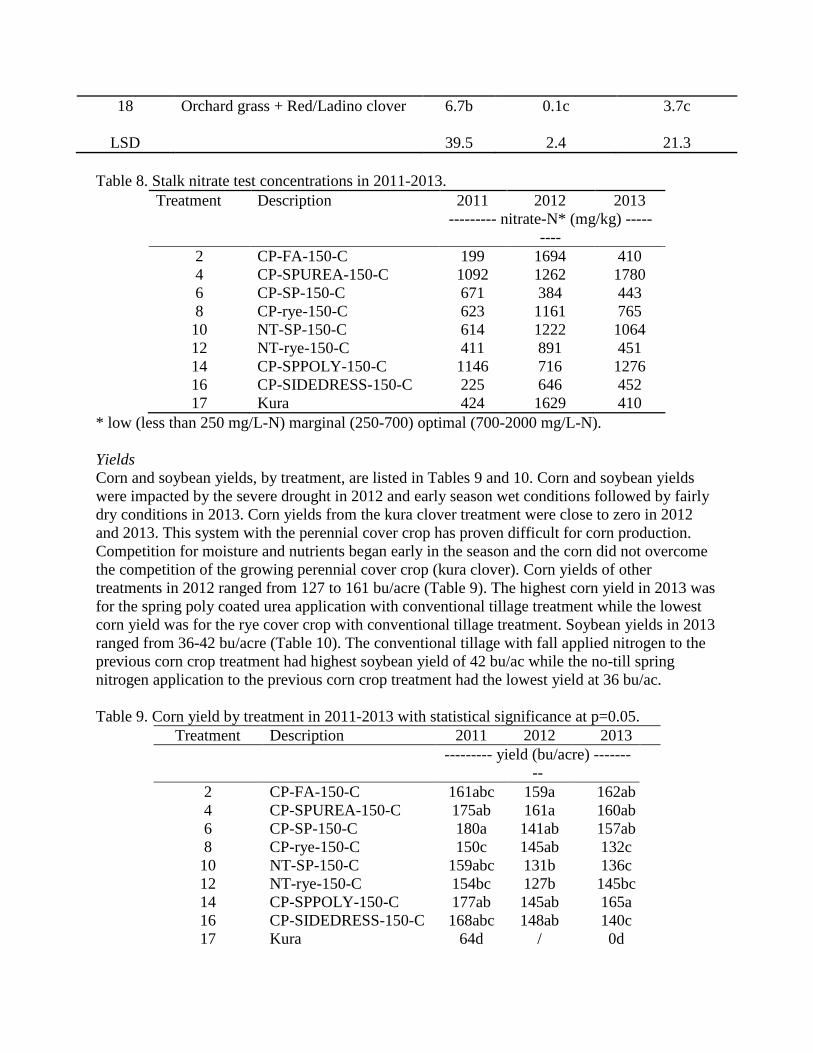
Yields
Corn and soybean yields, by treatment, are listed in Tables 9 and 10. Corn and soybean yields
were impacted by the severe drought in 2012 and early season wet conditions followed by fairly
dry conditions in 2013. Corn yields from the kura clover treatment were close to zero in 2012
and 2013. This system with the perennial cover crop has proven difficult for corn production.
Competition for moisture and nutrients began early in the season and the corn did not overcome
the competition of the growing perennial cover crop (kura clover). Corn yields of other
treatments in 2012 ranged from 127 to 161 bu/acre (Table 9). The highest corn yield in 2013 was
for the spring poly coated urea application with conventional tillage treatment while the lowest
corn yield was for the rye cover crop with conventional tillage treatment. Soybean yields in 2013
ranged from 36-42 bu/acre (Table 10). The conventional tillage with fall applied nitrogen to the
previous corn crop treatment had highest soybean yield of 42 bu/ac while the no-till spring
nitrogen application to the previous corn crop treatment had the lowest yield at 36 bu/ac.
Table 9. Corn yield by treatment in 2011-2013 with statistical significance at p=0.05.
Treatment Description 2011 2012 2013
--------- yield (bu/acre) -------
--
2 CP-FA-150-C 161abc 159a 162ab
4 CP-SPUREA-150-C 175ab 161a 160ab
6 CP-SP-150-C 180a 141ab 157ab
8 CP-rye-150-C 150c 145ab 132c
10 NT-SP-150-C 159abc 131b 136c
12 NT-rye-150-C 154bc 127b 145bc
14 CP-SPPOLY-150-C 177ab 145ab 165a
16 CP-SIDEDRESS-150-C 168abc 148ab 140c
17 Kura 64d / 0d

LSD 25 25 17
Table 10. Soybean yield by treatment in 2011-2013 with statistical significance at p=0.05.
Treatment Description 2011 2012 2013
--------- yield (bu/acre) ---------
-
1 CP-FA-150-S 45a 24b 42a
3 CP-SPUREA-150-S 42abc 31ab 38ab
5 CP-SP-150-S 42abc 33ab 39ab
7 CP-rye-150-S 42abc 24ab 41ab
9 NT-SP-150-S 37c 27ab 36b
11 NT-rye-150-S 37bc 28ab 37ab
13 CP-SPPOLY-150-S 45a 36ab 39ab
15 CP-SIDEDRESS-150-S 43ab 39a 41ab
LSD 7 14 6
Summary
The total precipitation during 2011-2013 has been lower than the long-term average with
particularly dry conditions in 2012. While 2013 had lower than average annual precipitation the
early season was quite wet which delayed crop planting at the site. Overall, the nitrate-N
concentrations generally exceeded the drinking water standard of 10 mg/L under the treatments
with corn and soybean production without a cover crop. This was especially evident in 2013
which was a wet spring that was preceded by an extremely dry year in 2012. The use of the
winter cereal rye cover crop showed potential to reduce nitrate-N concentrations in the
subsurface drainage. Also, the nitrate-N concentrations tended lower in the no-till systems. Of
note is that nitrate-N concentrations are similar between the corn and soybean phase of the corn-
soybean rotation at the nitrogen application rates used in this study. Overall the total reactive
phosphorus concentrations in the subsurface drainage were fairly low with concentrations
ranging from 4.6- 127.0 µg L-1. Overall, corn yields were generally better on the chisel plow
treatments without rye cover crop. The corn yields were nearly 17 bushels less on the no-till corn
plots averaged over the three years. Average soybean yields in the no-till treatments were
decreased by over 5 bu./ac. Part of the yield drag in the no-till plots on both crops may be due to
increased herbicide resistance weed pressure. Changes in herbicide management are ongoing to
eliminate this variable.
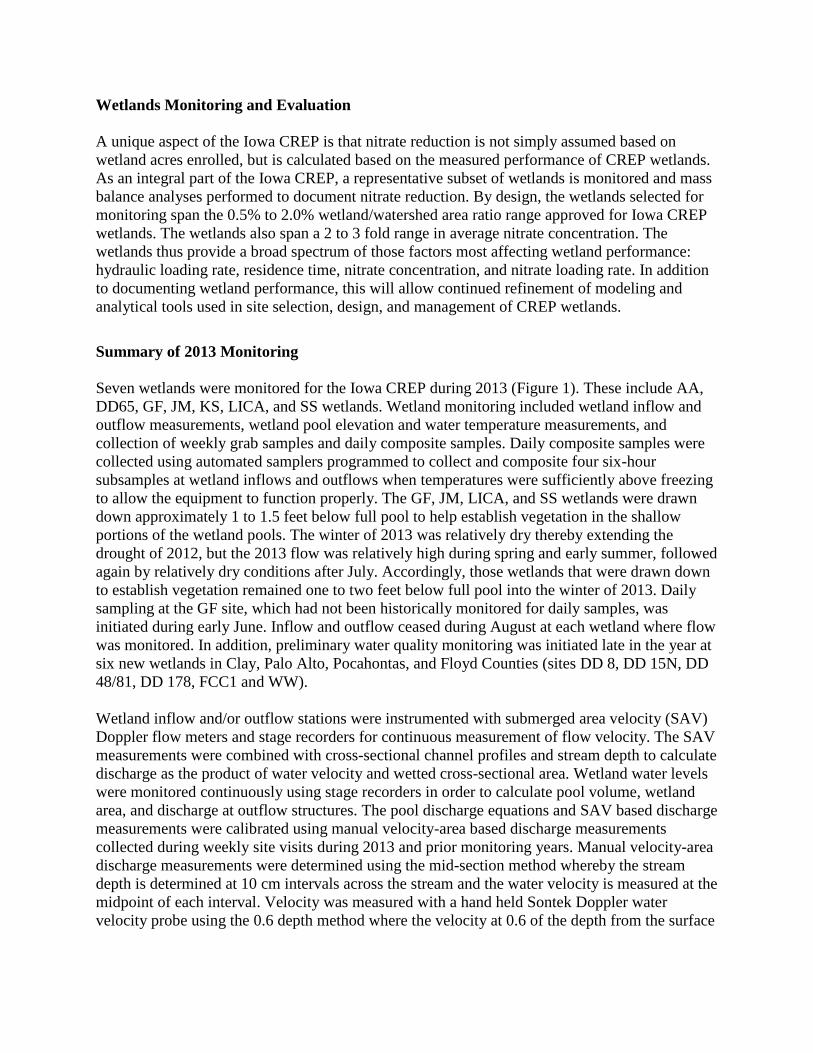
Wetlands Monitoring and Evaluation
A unique aspect of the Iowa CREP is that nitrate reduction is not simply assumed based on
wetland acres enrolled, but is calculated based on the measured performance of CREP wetlands.
As an integral part of the Iowa CREP, a representative subset of wetlands is monitored and mass
balance analyses performed to document nitrate reduction. By design, the wetlands selected for
monitoring span the 0.5% to 2.0% wetland/watershed area ratio range approved for Iowa CREP
wetlands. The wetlands also span a 2 to 3 fold range in average nitrate concentration. The
wetlands thus provide a broad spectrum of those factors most affecting wetland performance:
hydraulic loading rate, residence time, nitrate concentration, and nitrate loading rate. In addition
to documenting wetland performance, this will allow continued refinement of modeling and
analytical tools used in site selection, design, and management of CREP wetlands.
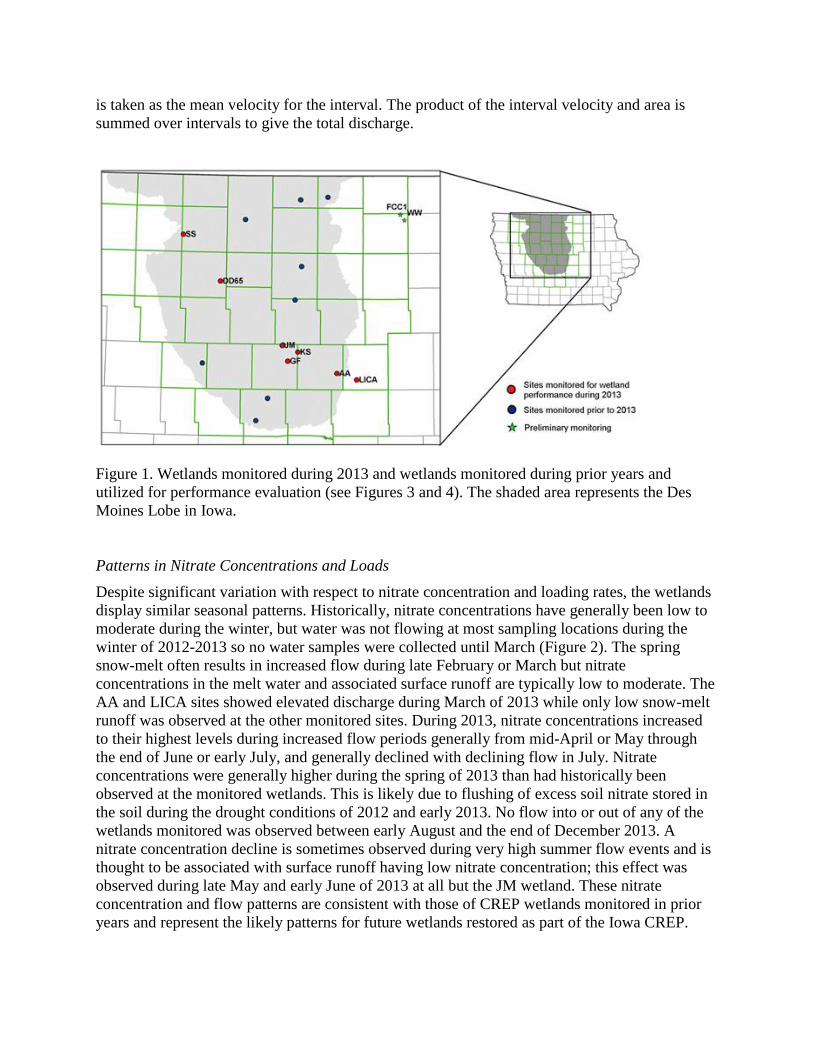
Summary of 2013 Monitoring
Seven wetlands were monitored for the Iowa CREP during 2013 (Figure 1). These include AA,
DD65, GF, JM, KS, LICA, and SS wetlands. Wetland monitoring included wetland inflow and
outflow measurements, wetland pool elevation and water temperature measurements, and
collection of weekly grab samples and daily composite samples. Daily composite samples were
collected using automated samplers programmed to collect and composite four six-hour
subsamples at wetland inflows and outflows when temperatures were sufficiently above freezing
to allow the equipment to function properly. The GF, JM, LICA, and SS wetlands were drawn
down approximately 1 to 1.5 feet below full pool to help establish vegetation in the shallow
portions of the wetland pools. The winter of 2013 was relatively dry thereby extending the
drought of 2012, but the 2013 flow was relatively high during spring and early summer, followed
again by relatively dry conditions after July. Accordingly, those wetlands that were drawn down
to establish vegetation remained one to two feet below full pool into the winter of 2013. Daily
sampling at the GF site, which had not been historically monitored for daily samples, was
initiated during early June. Inflow and outflow ceased during August at each wetland where flow
was monitored. In addition, preliminary water quality monitoring was initiated late in the year at
six new wetlands in Clay, Palo Alto, Pocahontas, and Floyd Counties (sites DD 8, DD 15N, DD
48/81, DD 178, FCC1 and WW).
Wetland inflow and/or outflow stations were instrumented with submerged area velocity (SAV)
Doppler flow meters and stage recorders for continuous measurement of flow velocity. The SAV
measurements were combined with cross-sectional channel profiles and stream depth to calculate
discharge as the product of water velocity and wetted cross-sectional area. Wetland water levels
were monitored continuously using stage recorders in order to calculate pool volume, wetland
area, and discharge at outflow structures. The pool discharge equations and SAV based discharge
measurements were calibrated using manual velocity-area based discharge measurements
collected during weekly site visits during 2013 and prior monitoring years. Manual velocity-area
discharge measurements were determined using the mid-section method whereby the stream
depth is determined at 10 cm intervals across the stream and the water velocity is measured at the
midpoint of each interval. Velocity was measured with a hand held Sontek Doppler water
velocity probe using the 0.6 depth method where the velocity at 0.6 of the depth from the surface
is taken as the mean velocity for the interval. The product of the interval velocity and area is
summed over intervals to give the total discharge.
Figure 1. Wetlands monitored during 2013 and wetlands monitored during prior years and
utilized for performance evaluation (see Figures 3 and 4). The shaded area represents the Des
Moines Lobe in Iowa.
Patterns in Nitrate Concentrations and Loads
Despite significant variation with respect to nitrate concentration and loading rates, the wetlands
display similar seasonal patterns. Historically, nitrate concentrations have generally been low to
moderate during the winter, but water was not flowing at most sampling locations during the
winter of 2012-2013 so no water samples were collected until March (Figure 2). The spring
snow-melt often results in increased flow during late February or March but nitrate
concentrations in the melt water and associated surface runoff are typically low to moderate. The
AA and LICA sites showed elevated discharge during March of 2013 while only low snow-melt
runoff was observed at the other monitored sites. During 2013, nitrate concentrations increased
to their highest levels during increased flow periods generally from mid-April or May through
the end of June or early July, and generally declined with declining flow in July. Nitrate
concentrations were generally higher during the spring of 2013 than had historically been
observed at the monitored wetlands. This is likely due to flushing of excess soil nitrate stored in
the soil during the drought conditions of 2012 and early 2013. No flow into or out of any of the
wetlands monitored was observed between early August and the end of December 2013. A
nitrate concentration decline is sometimes observed during very high summer flow events and is
thought to be associated with surface runoff having low nitrate concentration; this effect was
observed during late May and early June of 2013 at all but the JM wetland. These nitrate
concentration and flow patterns are consistent with those of CREP wetlands monitored in prior
years and represent the likely patterns for future wetlands restored as part of the Iowa CREP.

Figure 2. Measured and modeled nitrate concentrations and flows for wetlands monitored during 2013.
0
5
10
15
20
25
30
Nit
rate
-N (
mg
L-1)
0
40000
80000
120000
160000
200000
Infl
ow
(m
3 d
-1)
Jan Feb Mar Apr May Jun Jul Aug Sep Oct Nov Dec
AA Wetland
2013
0
5
10
15
20
25
30
35
Nit
rate
-N (
mg
L-1)
0
40000
80000
120000
160000
Infl
ow
(m
3 d
-1)
Jan Feb Mar Apr May Jun Jul Aug Sep Oct Nov Dec
DD65 Wetland
2013
0
5
10
15
20
25
30
Nit
rate
-N (
mg
L-1)
0
20000
40000
60000
80000
Infl
ow
(m
3 d
-1)
Jan Feb Mar Apr May Jun Jul Aug Sep Oct Nov Dec
GF Wetland2013
0
5
10
15
20
25
30
Nit
rate
-N (
mg
L-1)
0
20000
40000
60000
80000
100000
Infl
ow
(m
3 d
-1)
Jan Feb Mar Apr May Jun Jul Aug Sep Oct Nov Dec
JM Wetland
2013
05
10152025303540455055
Nit
rate
-N (
mg
L-1)
0
20000
40000
60000
80000
Infl
ow
(m
3 d
-1)
Jan Feb Mar Apr May Jun Jul Aug Sep Oct Nov Dec
KS Wetland2013
0
5
10
15
20
25
30
Nit
rate
-N (
mg L
-1)
0
40000
80000
120000
160000
Infl
ow
(m
3 d
-1)
Jan Feb Mar Apr May Jun Jul Aug Sep Oct Nov Dec
LICA Wetland2013
Flow mostly estimated from USGS
Timber Creek gage in Marshall County
0
5
10
15
20
25
30
35
40
Nit
rate
-N (
mg
L-1)
0
20000
40000
60000
Infl
ow
(m
3 d
-1)
Jan Feb Mar Apr May Jun Jul Aug Sep Oct Nov Dec
SS Wetland2013
Observed nitrate-N inflow (mg/L)
Observed nitrate-N outflow (mg/L)
Model expected outflow nitrate range
Inflow

Patterns in Nitrate Loss from Wetlands
Wetland performance is a function of hydraulic loading rate, hydraulic efficiency, nitrate
concentration, temperature, and wetland condition. Of these, hydraulic loading rate and
nitrate concentration are especially important for CREP wetlands. The range in hydraulic
loading rates expected for CREP wetlands is significantly greater than would be expected
based on just the four fold range in wetland/watershed area ratio approved for the Iowa
CREP. In addition to spatial variation in precipitation (average precipitation declines
from southeast to northwest across Iowa), there is tremendous annual variation in
precipitation and even greater annual variation in water yield. The combined effect of
these factors means that annual loading rates to CREP wetlands can be expected to vary
by more than an order of magnitude, and will to a large extent determine nitrate loss rates
for individual wetlands.
Mass balance analysis and modeling were used to calculate observed and predicted
nitrate removal for each wetland. Wetland bathymetry data were used to characterize
wetland volume and area as functions of wetland depth. Wetland bathymetry for wetlands
which had not previously been monitored by ISU was determined by ISU on the basis of
wetland construction plans. These bathymetric relationships were used in numeric
modeling of water budgets and nitrate mass balances to calculate nitrate loss, hydraulic
loading, and residence times. Wetland water depth and temperatures were recorded at
five minute intervals for numerical modeling of nitrate loss.
The monitored wetlands generally performed as expected with respect to nitrate removal
efficiency (percent removal) and mass nitrate removal (expressed as kg N ha-1 year-1). In
addition to measured inflow and outflow nitrate concentrations, Figure 2 shows the range
of outflow concentrations predicted for these wetlands by mass balance modeling using
2013 water budget, wetland water temperature, and nitrate concentration as model inputs.
Variability in wetland performance is in part due to differences in wetland characteristics
and condition and partly due to differences in loading rates and patterns. At a given HLR,
differences in wetland condition and in patterns of load can result in significant
differences in performance. Mass balance analysis and modeling was also used to
examine the long term variability in performance of CREP wetlands including the effects
of spatial and temporal variability in temperature and loading patterns. In addition to the
calculating the percent mass removal observed for wetlands monitored from 2004
through 2013, the percent nitrate removal expected for CREP wetlands was estimated
based on hindcast modeling over the period from 1980 through 2005. The results
illustrate reasonably good correspondence between observed and modeled performance
and demonstrate that HLR is clearly a major determinant of wetland performance (Figure
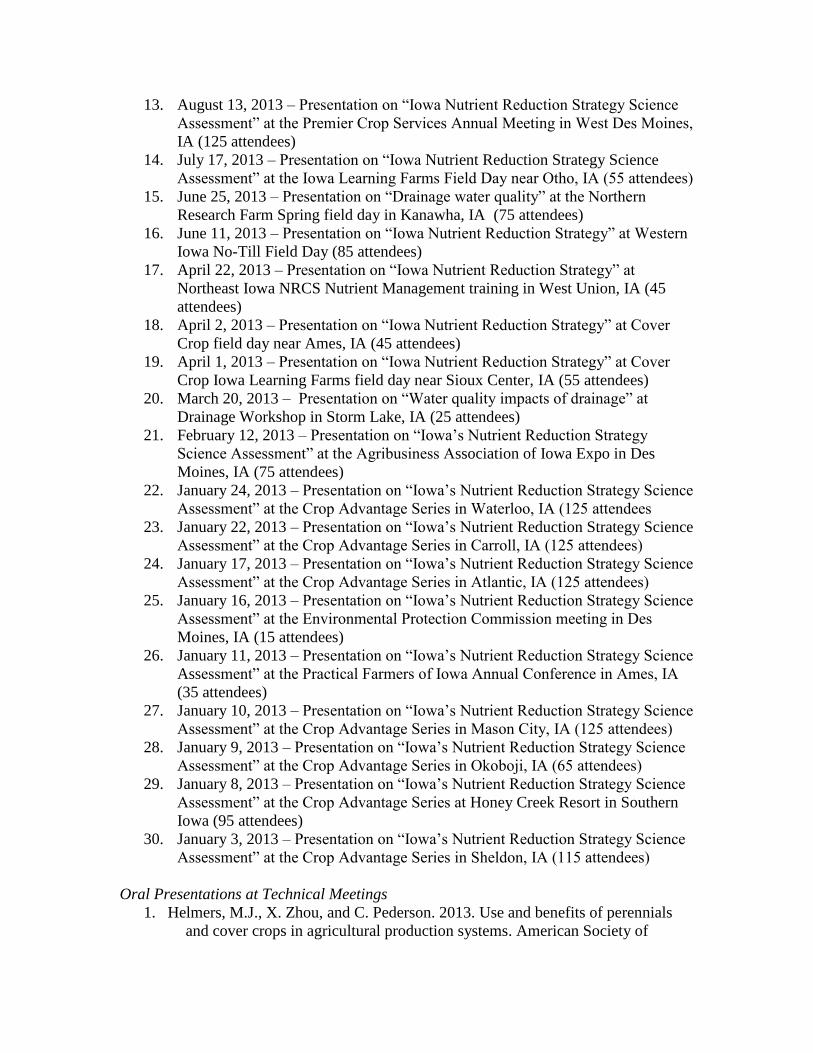
3). Further analysis of the performance of wetlands monitored from 2004 through 2013
illustrates the combined effect of HLR and temperature and clearly shows the decline in
percent nitrate loss with increasing hydraulic loading rate and the increase in percent loss
when loading occurs during warmer periods (Figure 4).
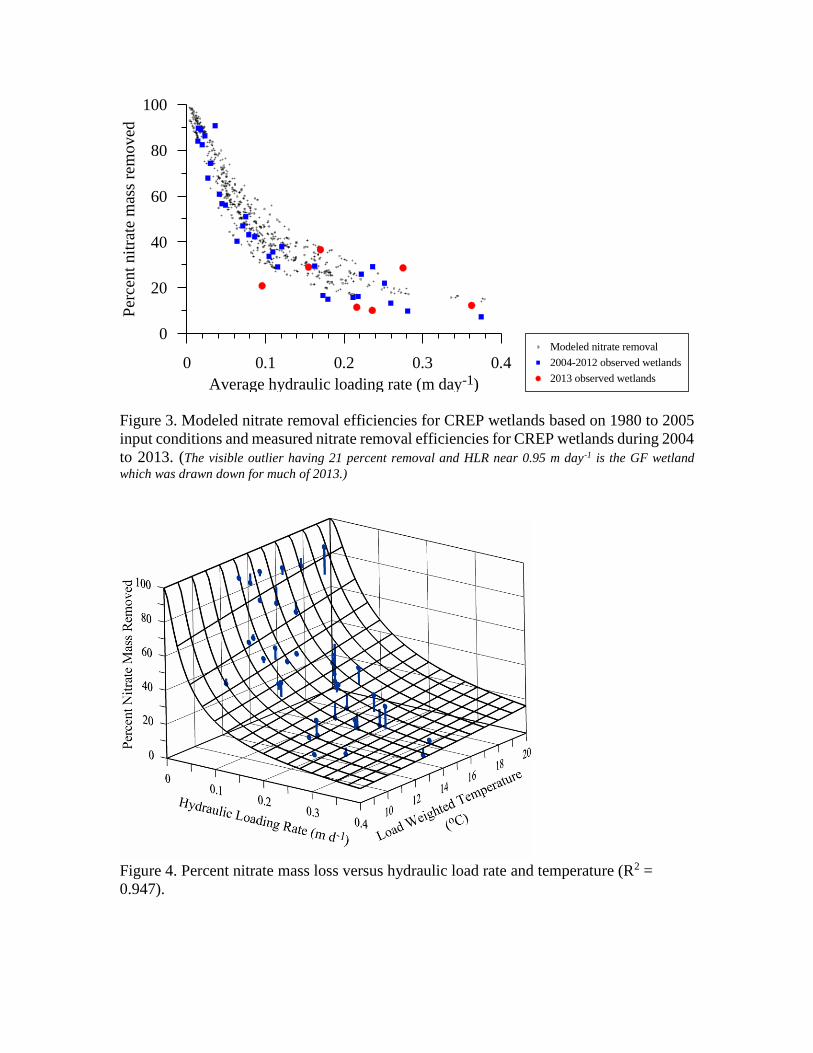
Figure 3. Modeled nitrate removal efficiencies for CREP wetlands based on 1980 to 2005
input conditions and measured nitrate removal efficiencies for CREP wetlands during 2004
to 2013. (The visible outlier having 21 percent removal and HLR near 0.95 m day-1 is the GF wetland
which was drawn down for much of 2013.)
Figure 4. Percent nitrate mass loss versus hydraulic load rate and temperature (R2 =
0.947).
0 0.1 0.2 0.3 0.4
Average hydraulic loading rate (m day-1)
0
20
40
60
80
100
Per
cent
nit
rate
mas
s re
mo
ved
Modeled nitrate removal
2004-2012 observed wetlands
2013 observed wetlands

Outreach Activities
In addition to the evaluation that is taking place at the project site in Gilmore City we
have an active outreach program associated with this project. This includes presentations
at technical and Extension related meetings. The activities and publications that are
directly associated with the outreach component of this project are described below.
Many of the presentations in 2013 were related to the Iowa Nutrient Reduction Strategy
Science Assessment but data generated from Gilmore City and the Wetlands element
were shared as part of these presentations.
Oral Presentations at Extension Related Meetings
1. December 11, 2013 – Presentation on “Iowa Nutrient Reduction Strategy
Science Assessment” at Farmers Coop Society Elite Crop regional meeting in
Sioux City, IA (85 attendees)
2. December 10, 2013 – Presentation on “Iowa Nutrient Reduction Strategy
Science Assessment” at Golden Furrow regional meeting in Fairfield, IA (55
attendees)
3. December 5, 2013 – Presentation on “Iowa Nutrient Reduction Strategy Science
Assessment: One Farm Many Practices” at the Integrated Crop Management
Conference in Ames, IA (375 attendees)
4. December 4, 2013 – Presentation on “Iowa Nutrient Reduction Strategy Science
Assessment” at the Iowa Farm News Expo in Fort Dodge, IA (85 attendees)
5. November 12, 2013 – Presentation on “Iowa Nutrient Reduction Strategy
Science Assessment” at the Iowa Learning Farms Field Day near Plainfield, IA
(65 attendees)
6. November 8, 2013 – Presentation on “Iowa Nutrient Reduction Strategy: Science
Assessment” at Lunch and Learn at Pioneer in Johnston, IA (45 attendees)
7. November 6, 2013 – Presentation on “Iowa Nutrient Reduction Strategy: Science
Assessment” at Hypoxia Lunch and Learn at the Crops Science Society of
America, Soil Science Society of America, and Agronomy Society Annual
meeting in Tampa, FL (65 attendees)
8. September 27, 2013 – Presentation on “Iowa Nutrient Reduction Strategy
Science Assessment” at the Nature Conservancy and John Deere meeting in Fort
Dodge, IA (20 attendees)
9. September 25, 2013 – Presentation on “Iowa Nutrient Reduction Strategy
Science Assessment” at the NRCS Regional Training near Greenfield, IA (40
attendees)
10. September 24, 2013 – Presentation on “Iowa Nutrient Reduction Strategy
Science Assessment” at the NRCS Regional Training near Armstrong, IA (45
attendees)
11. September 12, 2013 – Presentation on “Iowa Nutrient Reduction Strategy
Science Assessment” at the Lake Rathbun Watershed Association Annual
Meeting (150 attendees)
12. September 5, 2013 – Presentation on “Iowa Nutrient Reduction Strategy Science
Assessment: One Farm Many Practices” at the Conservation Districts of Iowa
Annual Meeting in West Des Moines, IA (45 attendees)
13. August 13, 2013 – Presentation on “Iowa Nutrient Reduction Strategy Science
Assessment” at the Premier Crop Services Annual Meeting in West Des Moines,
IA (125 attendees)
14. July 17, 2013 – Presentation on “Iowa Nutrient Reduction Strategy Science
Assessment” at the Iowa Learning Farms Field Day near Otho, IA (55 attendees)
15. June 25, 2013 – Presentation on “Drainage water quality” at the Northern
Research Farm Spring field day in Kanawha, IA (75 attendees)
16. June 11, 2013 – Presentation on “Iowa Nutrient Reduction Strategy” at Western
Iowa No-Till Field Day (85 attendees)
17. April 22, 2013 – Presentation on “Iowa Nutrient Reduction Strategy” at
Northeast Iowa NRCS Nutrient Management training in West Union, IA (45
attendees)
18. April 2, 2013 – Presentation on “Iowa Nutrient Reduction Strategy” at Cover
Crop field day near Ames, IA (45 attendees)
19. April 1, 2013 – Presentation on “Iowa Nutrient Reduction Strategy” at Cover
Crop Iowa Learning Farms field day near Sioux Center, IA (55 attendees)
20. March 20, 2013 – Presentation on “Water quality impacts of drainage” at
Drainage Workshop in Storm Lake, IA (25 attendees)
21. February 12, 2013 – Presentation on “Iowa’s Nutrient Reduction Strategy
Science Assessment” at the Agribusiness Association of Iowa Expo in Des
Moines, IA (75 attendees)
22. January 24, 2013 – Presentation on “Iowa’s Nutrient Reduction Strategy Science
Assessment” at the Crop Advantage Series in Waterloo, IA (125 attendees
23. January 22, 2013 – Presentation on “Iowa’s Nutrient Reduction Strategy Science
Assessment” at the Crop Advantage Series in Carroll, IA (125 attendees)
24. January 17, 2013 – Presentation on “Iowa’s Nutrient Reduction Strategy Science
Assessment” at the Crop Advantage Series in Atlantic, IA (125 attendees)
25. January 16, 2013 – Presentation on “Iowa’s Nutrient Reduction Strategy Science
Assessment” at the Environmental Protection Commission meeting in Des
Moines, IA (15 attendees)
26. January 11, 2013 – Presentation on “Iowa’s Nutrient Reduction Strategy Science
Assessment” at the Practical Farmers of Iowa Annual Conference in Ames, IA
(35 attendees)
27. January 10, 2013 – Presentation on “Iowa’s Nutrient Reduction Strategy Science
Assessment” at the Crop Advantage Series in Mason City, IA (125 attendees)
28. January 9, 2013 – Presentation on “Iowa’s Nutrient Reduction Strategy Science
Assessment” at the Crop Advantage Series in Okoboji, IA (65 attendees)
29. January 8, 2013 – Presentation on “Iowa’s Nutrient Reduction Strategy Science
Assessment” at the Crop Advantage Series at Honey Creek Resort in Southern
Iowa (95 attendees)
30. January 3, 2013 – Presentation on “Iowa’s Nutrient Reduction Strategy Science
Assessment” at the Crop Advantage Series in Sheldon, IA (115 attendees)
Oral Presentations at Technical Meetings
1. Helmers, M.J., X. Zhou, and C. Pederson. 2013. Use and benefits of perennials
and cover crops in agricultural production systems. American Society of

Agricultural and Biological Engineers (ASABE) 2013 Annual International
Meeting. Kansas City, MO. July 21-24, 2013. [Oral presentation – Helmers]
2. Crumpton, W.G. 2013. Potential of Wetlands as Nutrient Sinks in Agricultural
Landscapes of the Upper Midwest. Society of Wetland Scientists Annual
Meeting, Duluth, MN, June 2013. Invited presentation.
3. Crumpton, W.G. 2013. Water Quality Performance of Wetlands Receiving
Nonpoint Source Loads: Nitrate Removal Efficiency and Mass Load
Reductions Using Targeted Wetland Restorations. Soil and Water
Conservation Society Annual Conference. Reno, NV, July 2013. Poster
Presentation.
4. Crumpton, W.G. 2013. Potential Impact of Targeted Wetland Restoration on
Nitrate Loads to Mississippi River Subbasins: Performance Forecast Modeling
of Loads and Load Reductions. Soil and Water Conservation Society Annual
Conference. Reno, NV, July 2013. Poster Presentation.
Extension Events Organized
1. 14th Annual IA-MN-SD Drainage Research Forum
November 24, 2013 – Coordinated with Dr. Gary Sands from the University
of Minnesota and Chris Hay from South Dakota State University the forum in
Waseca, MN. There were 75 attendees consisting of producers, contractors,
and agency
2. Drainage Water Quality Field Day
September 10, 2013 – Organized a field day at the Gilmore City Drainage
Research and Demonstration project site. There were 25 attendees consisting
of producers and agency representatives.
Publications:
1. Zhou, X., M.J. Helmers, and Z. Qi. 2013. Field scale modeling of subsurface tile
drainage using MIKE SHE. Applied Engineering in Agriculture 29(6): 865-873.
2. Goeken, R., X. Zhou, and M.J. Helmers. In review. Comparison of timing and
volume of subsurface drainage under perennial forage and row crops in a tile-
drained field in Iowa. Submitted to Trans. ASABE.
3. Daigh, A.L., M.J. Helmers, E. Kladivko, X. Zhou, R. Goeken, J. Cavadini, D.
Barker, and J. Sawyer. In press. Soil water during the drought of 2012 as affected
by rye cover crop in fields in Iowa and Indiana. Journal of Soil and Water
Conservation.