
Development of a probabilistic methodology for slope stability and seismic assessments of
Waste rock characterisation and stability assessments for
feasibility level studies
D Dwumfour Fortescue Metals Group Ltd, Australia
J Dixon Fortescue Metals Group Ltd, Australia
J Mylvaganam SRK Consulting, Australia
Abstract
Regulatory approval frameworks, such as that of the Department of Mines, Industry, Regulation and Safety
(DMIRS) in Western Australia Mining Proposal approval process, require detailed design reports for waste
rock dumps for mining projects.
Determination of waste rock shear strength parameters for waste rock dump design at a feasibility project
level is often challenging as a result of factors such as spatial variation, lack of representative data and limited
knowledge of waste rock movement schedules. Trial open pits or blasted representative material are rarely
available.
A practical approach to derive design material parameters using the Barton–Kjaernsli criterion (Barton &
Kjaernsli 1981; Barton 2008) is provided, based on available site-specific feasibility level geotechnical data for
a case study site in the Pilbara region of Western Australia. Stability assessments for various scenarios
including for possible unfavourable conditions such as earthquake and storm events expected in the long-
term are required to demonstrate that safe operational conditions and effective mine closure designs can be
facilitated.
Keywords: material classification, waste rock dumps, slope stability analysis
1 Introduction
As discussed within the Guidelines for Mine Waste Dump and Stockpile Design (Hawley & Cunning 2017), the
physical properties of the various material types and their relative distributions within waste rock dumps will
influence, or potentially control, overall stability.
As part of the Department of Mines, Industry, Regulation and Safety (DMIRS) Mining Proposal Approval
Framework, a detailed design report for waste rock dumps (WRD) is required. Geotechnical parameters must
be defined, and stability analysis outcomes presented, for both operating and closure scenarios, the closure
scenarios being an input into the mine closure plan (MCP). It is the expectation of the assessing body that
adequate studies have been completed to provide confidence that there is limited risk through operations
and into closure as a result of poor waste rock dump performance.
At the approval phase of a project, feasibility level data, at best, is all that is available presenting a significant
challenge in demonstrating waste rock dump performance. This data may include field mapping of exposures,
geotechnical logging data from feasibility studies for the open pits, and in some cases trial open pits.
Representative blasted material is rarely available; however, in the case study presented, blasted material
from a trial pit was available to validate outcomes of the empirical assessment to some extent.
Operational requirements are typically governed by maximum allowable tipping height determined on an
operational safety-based criterion. Closure requirements are governed by closure criteria set out in the site
MCP encompassing safety, environmental (including erosional stability) and end land use. Slope profiles to
achieve erosional stability typically result in low overall slopes and hence becomes the key design criteria as
opposed to overall stability.
Slope Stability 2020 - PM Dight (ed.)© Australian Centre for Geomechanics, Perth, ISBN 978-0-9876389-7-7
Slope Stability 2020 677
doi:10.36487/ACG_repo/2025_43

This paper outlines an approach adopted for a case study site to derive geotechnical shear strength models
for waste rock dump design assessment, and the slope stability scenarios and sensitivity assessments to
demonstrate geotechnical stability for operational and closure conditions.
2 Iron Bridge Magnetite Project
2.1 Location and resource
The Iron Bridge Magnetite Project is located 145 km south of Port Hedland in the Pilbara Region of Western
Australia. The project holds Australia’s largest magnetite resource prepared in accordance with the Joint Ore
Reserves Committee (JORC) code resulting in a significant mine life. The project is anticipated to produce
22 million tonne per annum (Mtpa) of high-grade 67% Fe magnetite concentrate product, with first ore on
ship scheduled from mid-2022.
The Iron Bridge site currently includes a site access road, camp, trial open pit of shallow depth, small
temporary ore stockpiles, waste rock dump, pilot plant and tailings storage facility. Further development of
the project will consist of several deposits that will be mined over the life-of-mine over a north–south strike
length exceeding 12 km, these deposits are named North Star, Eastern Limb and Glacier Valley. The Eastern
Limb deposit is sub-divided into Eastern Limb North, Eastern Limb Central and Eastern Limb South mine areas,
this was based on the geological and geotechnical differences between the three zones of this deposit.
2.2 Geological setting
The details of the Iron Bridge geological setting and deposit have previously been published by Simpson
(2017). The deposit host geology is a steeply dipping banded iron formation (BIF) of the Pincunah Member
(Gore Creek Group) containing iron-rich deposits that deformed and metamorphosed over geological time.
The Kangaroo Caves Formation (Sulphur Springs Group) and Corboy Formation (Gore Creek Group) form the
western and eastern bounds of mineralisation respectively. The weathering profile is typically 40–60 m from
the surface, forming an oxidised (weaker strength) caprock (Figure 1). The transition between oxide and fresh
material is clearly distinguishable in diamond core.
Figure 1 Block diagram of the Iron Bridge deposits (Simpson 2017); BIF – banded iron formation;
KCS – Kangaroo Caves Formation Shale
The Kangaroo Caves Formation (KCF) consists of massive to pillow-brecciated andesitic volcanic rocks, with
variable amounts of cherts and shales increasing towards the top of the sequence that is conformably
overlain by the Pincunah Member. The Pincunah Member is dominated by cherty silicate BIF with minor
(locally dominant) siltstone and trace sandstone. Five periods of structural deformation are recognised with
the larger faults through the deposits thought to have occurred during the D3 deformation event
(c. 2,940 M Ma). Although identical host stratigraphy, dislocated by several faults, each deposit has been
variably deformed and altered resulting in unique material differences (Simpson 2017).
Waste rock characterisation and stability assessments for feasibility level studies D Dwumfour et al.
678 Slope Stability 2020

3 Material characterisation
Determination of the shear strength of waste rock is considered difficult due to several factors such as spatial
variations and limitations in obtaining representative data, material placement methods and associated
segregation, particle crushing under loading and time-dependent consolidation. At a project feasibility stage,
there is typically no practical method to derive shear strength of an in situ sample and hence empirical
strength models, based on site-specific data as available, have been adopted. In this case, the Barton–
Kjaernsli criterion (Barton & Kjaernsli 1981; Barton 2008) has been adopted to develop non-linear shear
strength parameters of the waste rock materials. The relationship and input parameters are outlined:
� = �� tan( log�
��+ �ℎ��) (1)
where:
�� = Effective normal stress.
R = Equivalent roughness, which is a function of the particle roundness and the porosity (n) of
the dumped waste.
S = Size-dependent equivalent strength of the blasted particles, based on the unconfined
compressive strength (UCS) and the typical rock waste particle size at 50% passing (D50).
Phir = Residual friction angle on the sawn surface of rock.
Application of Barton–Kjaernsli criterion will require a number of waste rock characteristic parameters to be
derived. Representative data for a blasted waste material are limited and hence the characterisations are
based on the blasted oxide waste rock material from the trial pit, the diamond core logging data from the pit
slope geotechnical feasibility study, and the data collected for foundation and construction material
assessments for the detailed design of the tailings storage facilities and access road cut.
In addition to the parameters required for the Barton–Kjaernsli criterion, other parameters relevant to the
geotechnical assessment of the waste rock dump such as durability and permeability were also assessed and
defined. Material characterisations were performed for most representative waste rock materials based on
lithology and weathering.
3.1 Particle size distribution
The particle size distribution (PSD) of a waste rock material will be naturally variable due to spatial variation
in the material properties and drill and blast practices. The challenge at a feasibility level study stage is that
there is typically no blasted waste rock available and hence PSD testing on actual materials is not possible. In
these scenarios, blasting fragmentation empirical assessments and site benchmarking are required to be
adopted. The PSD for design purposes should be adopted with an appreciation of the data collection method,
prediction techniques and associated limitations. During data collection, a representative number of samples
are required to be collected and assessed to account for material variability. The reliability of the data source
should be reflected in the values. Several data sources are typically considered to assess a representative
D50 value; the adopted order of priority for the data source is presented here:
1. Large-scale bulk sampling and laboratory PSD (i.e. sample size > 1 t).
2. Spilt desktop analysis of waste rock dump, fill embankment and existing stockpile material if
available.
3. Small-scale laboratory sampling with an estimate of oversize during sampling.
4. Blasting fragmentation empirical assessment based on known site-specific material properties and
a typical blast design pattern.
5. Benchmark against a similar site.
Processing of geotechnical data and limit design
Slope Stability 2020 679

The data sources available for this study included Split desktop fragmentation analyses on materials collected
from a starter pit and access road cut and a small-scale PSD assessment of waste rock samples.
The Split desktop process derives an estimated PSD from a digital image of a waste rock dump or muck pile.
A reasonable output estimate of the PSD can be obtained using a good representative image, good
judgement of the percentage of fines content in the sample and a combination of the use of the automatic
and manual editing functions of the software. A typical output of Split desktop analyses is shown in Figure 2.
Figure 2 Typical Split desktop processing and output
The PSD data assessed from these sources were plotted along with the PSD results of fragmentation blasting
studies that produced a minimum and mean blasting target (Figure 3). To understand the influence of
variability, appropriate design and sensitivity PSD scenarios were adopted in the assessments. The selected
ranges of PSDs and D50 values are presented in Table 1.
Figure 3 Particle size distribution curves for oxide banded iron formation
Waste rock characterisation and stability assessments for feasibility level studies D Dwumfour et al.
680 Slope Stability 2020
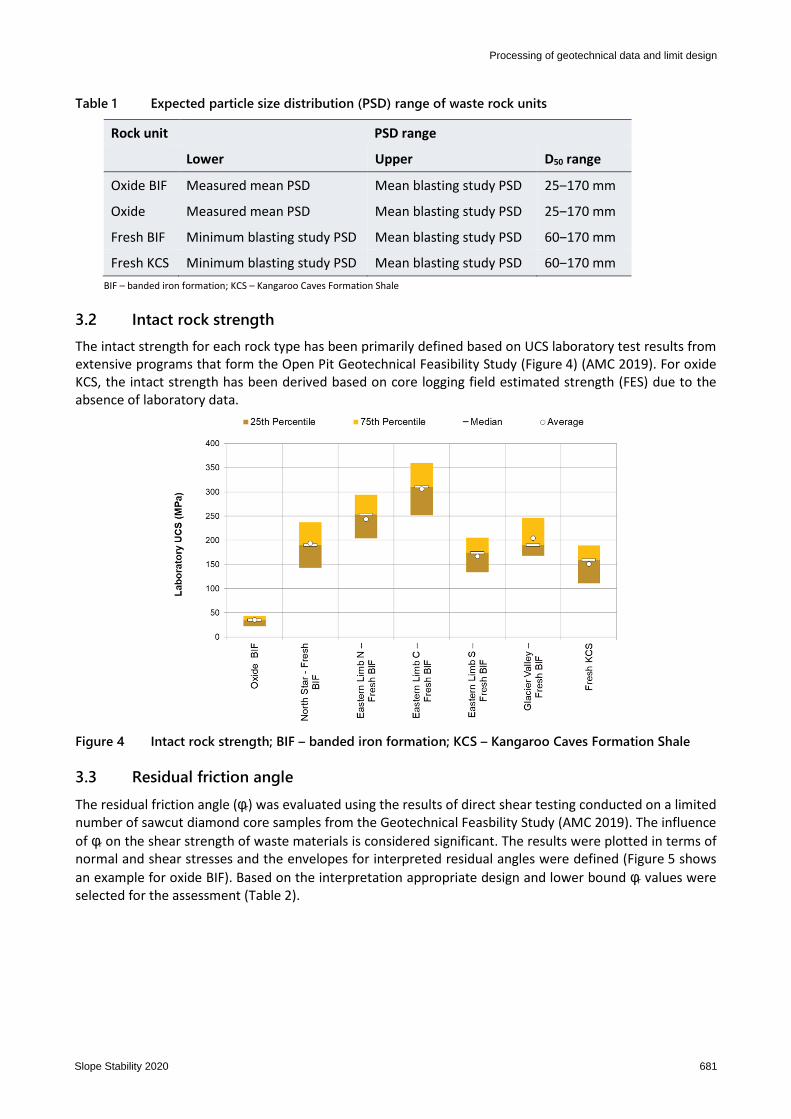
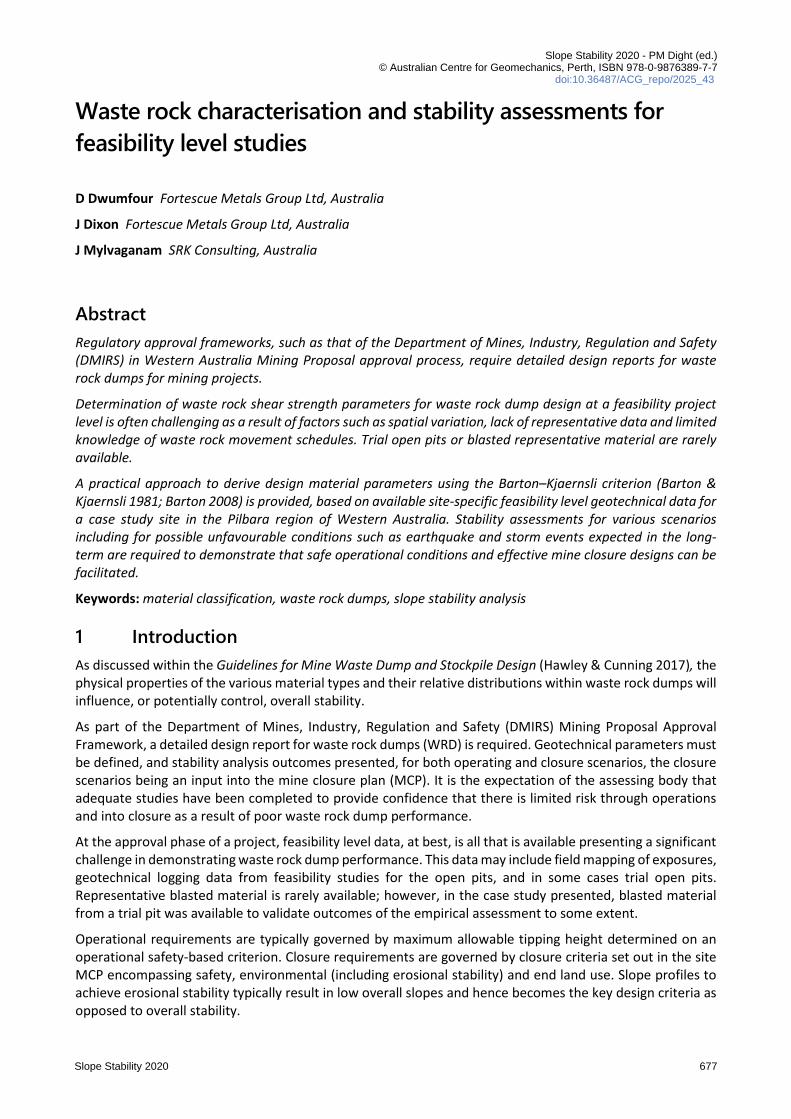
Table 1 Expected particle size distribution (PSD) range of waste rock units
Rock unit PSD range
Lower Upper D50 range
Oxide BIF Measured mean PSD Mean blasting study PSD 25‒170 mm
Oxide Measured mean PSD Mean blasting study PSD 25‒170 mm
Fresh BIF Minimum blasting study PSD Mean blasting study PSD 60‒170 mm
Fresh KCS Minimum blasting study PSD Mean blasting study PSD 60‒170 mm
BIF – banded iron formation; KCS – Kangaroo Caves Formation Shale
3.2 Intact rock strength
The intact strength for each rock type has been primarily defined based on UCS laboratory test results from
extensive programs that form the Open Pit Geotechnical Feasibility Study (Figure 4) (AMC 2019). For oxide
KCS, the intact strength has been derived based on core logging field estimated strength (FES) due to the
absence of laboratory data.
Figure 4 Intact rock strength; BIF – banded iron formation; KCS – Kangaroo Caves Formation Shale
3.3 Residual friction angle
The residual friction angle (φr) was evaluated using the results of direct shear testing conducted on a limited
number of sawcut diamond core samples from the Geotechnical Feasbility Study (AMC 2019). The influence
of φr on the shear strength of waste materials is considered significant. The results were plotted in terms of
normal and shear stresses and the envelopes for interpreted residual angles were defined (Figure 5 shows
an example for oxide BIF). Based on the interpretation appropriate design and lower bound φr values were
selected for the assessment (Table 2).
Processing of geotechnical data and limit design
Slope Stability 2020 681

Figure 5 Sawcut test results for oxide banded iron formation
Table 2 Summary of residual friction angles
Rock unit Residual friction angle (°)
Design Lower bound
Oxide BIF 28 26
Fresh BIF 26 –
Fresh KCS 23 22
BIF – banded iron formation; KCS – Kangaroo Caves Formation Shale
3.4 Equivalent roughness
Equivalent roughness is a function of the particle roundness and surface roughness of waste rock and the
‘as-dumped’ porosity and is derived from an empirical assessment.
3.4.1 Porosity and dump density
The waste rock volume will expand during blasting and excavation, and with a large range in particle size, this
is typically represented as a percentage increase from the undisturbed in situ volume. Segregation is also
typical on dump faces during construction and material consolidation within increased loading conditions
will increase density and decrease the void ratio. These factors result in difficulty in the determination of void
ratio, with limited benchmark data available.
In situ assessment of the dump density for this case study was not practical. A porosity value of 25% was
assumed based on the experience gained from past studies (SRK Consulting 2014). Figure 6 illustrates the
on-site measurement of dump density using the weight of waste rock dumped by truck and survey
reconciliation of the rock pile for volume assessment. The dumped density was estimated using rock
fragment densities derived from laboratory testing of relevant pit geotechnical studies and the dump porosity
adopted. The resulting dump densities are summarised in Table 3. It is suggested that both porosity and
dump density values be refined during the mining stage as part of the validation and reconciliation process
by in situ measurements.
Waste rock characterisation and stability assessments for feasibility level studies D Dwumfour et al.
682 Slope Stability 2020

Figure 6 Reconciliation of weight and volume of dumped waste rock
Table 3 Rock type dump density
Unit Rock fragment
density (kN/m3) Porosity
Dump density
(kN/m3)
Oxide BIF 31 0.25 23
Oxide KCS 31 0.25 23
North Star – fresh BIF 33 0.25 25
Eastern Limb N – fresh BIF 32 0.25 24
Eastern Limb C – fresh BIF 34 0.25 26
Eastern Limb S – fresh BIF 32 0.25 24
Glacier Valley – fresh BIF 34 0.25 26
Fresh KCS 28 0.25 21
BIF – banded iron formation; KCS – Kangaroo Caves Formation Shale.
3.4.2 Particle shape
The angularity of the blasted waste rock will influence in situ density, void ratio and shear strength of the
material. The angularity will be strongly influenced by blasting and excavation processes, followed by
secondary processes due to the influence of loading and changed stress conditions. Weathering and
geochemical processes can also influence block shape in the long-term. An assessment of the existing waste
material and stockpile (Figure 7) indicates that particles are partly angular or angular with a planar smooth
surface.
Figure 7 Representative oxide banded iron formation materials
Processing of geotechnical data and limit design
Slope Stability 2020 683

Considering the rock particle conservatively as partly angular with smooth surface and the waste porosity of
25%, the empirical scheme developed by Barton & Kjaernsli (1981) provided likely equivalent roughness (R)
values in the range between 6.0 and 7.0. Design R values 6.5 and 6.0 were adopted for fresh BIF/KCF and
oxide material respectively as presented in Figure 8.
Figure 8 Empirical assessment of equivalent roughness parameters (modified after Barton & Kjaernsli
1981)
3.5 Equivalent strength
The size-dependent equivalent strength is based on the waste rock UCS values and the D50. For rock surface
strength, mean laboratory UCS values have been adopted for design, and half the mean value was
conservatively adopted for the sensitivity assessment in each case to account for long-term closure
conditions (weathering and degradation). The S values were assessed based on the strength assessment
scheme proposed by Barton & Kjaernsli (1981) (Figure 9) which shows an S interpretation for a D50 of 100 mm
as an example). The selected design and lower bound D50 and UCS values are shown in Table 5 with estimated
S values.
Figure 9 Equivalent strength (S) for a D50 of 100 mm (modified after Barton & Kjaernsli 1981)
Waste rock characterisation and stability assessments for feasibility level studies D Dwumfour et al.
684 Slope Stability 2020

3.6 Durability
Slake durability laboratory testing was undertaken on selected representative samples to evaluate resistance
to deterioration under weathering conditions. The slake durability index (DI) provides a quantitative measure
of durability. Based on slake durability index classification (Franklin & Chandra 1972), oxide and Pincunah
fresh BIF had a very high to extremely high durability, whereas KCS has a high to very high durability. This
indicates that long-term degradation for closure consideration is minimal.
3.7 Permeability
Permeability of waste rock materials will generally be influenced by many factors such as blasting practices,
PSDs, the proportion of fines, porosity (degree of densification or consolidation) and fluid viscosity), which
will, in turn, affect seepage and runoff rates. Permeability values considering the finer and coarser limits of
the PSDs were assessed for saturated conditions using various empirical methods. However, the
Kozeny-Carmen method was considered for the final interpretations. The summary of the lower and upper
bound permeabilities using the Kozeny-Carmen method are in Table 4.
Table 4 Estimated estimated order of magnitude permeabilities
Rock unit Permeability (m/s)
Lower Upper
Oxide BIF ~1 × 10⁻²
1‒4 Oxide KCS ~1 × 10⁻³
Fresh BIF ~2 × 10⁻²
BIF – banded iron formation; KCS – Kangaroo Caves Formation Shale
4 Strength models
Derived input parameters for the non-linear shear strength models are shown in Table 5. Lower bound (LB)
strength envelopes are defined using lower bound φr and S values with the design R values.
Processing of geotechnical data and limit design
Slope Stability 2020 685
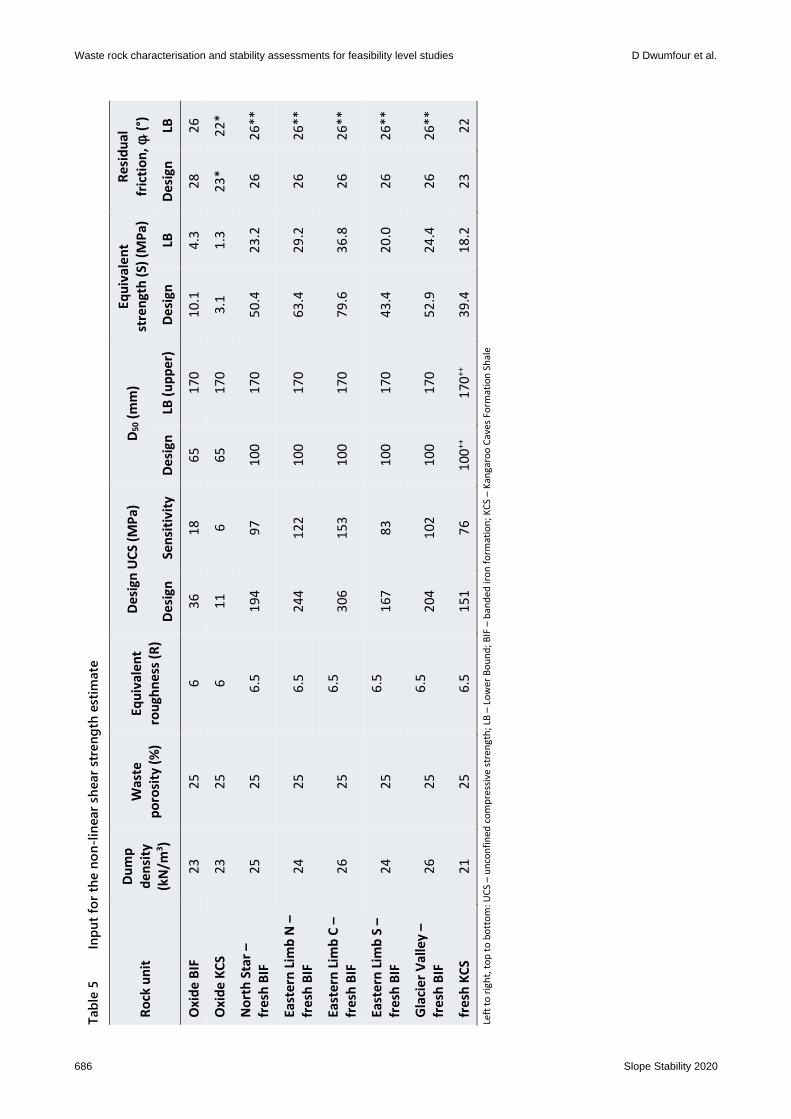
Tab
le 5
In
pu
t fo
r th
e n
on
-lin
ear
shear
stre
ng
th e
stim
ate
Ro
ck u
nit
Du
mp
de
nsi
ty
(kN
/m3)
Wa
ste
po
rosi
ty (
%)
Eq
uiv
ale
nt
rou
gh
ne
ss (
R)
De
sig
n U
CS
(M
Pa
) D
50 (
mm
) E
qu
iva
len
t
stre
ng
th (
S)
(MP
a)
Re
sid
ua
l
fric
tio
n, φ r
(°)
De
sig
n
Se
nsi
tiv
ity
D
esi
gn
LB
(u
pp
er)
D
esi
gn
LB
D
esi
gn
LB
Ox
ide
BIF
2
3
25
6
3
6
18
6
5
17
0
10
.1
4.3
2
8
26
Ox
ide
KC
S
23
2
5
6
11
6
6
5
17
0
3.1
1
.3
23
*
22
*
No
rth
Sta
r –
fre
sh B
IF
25
2
5
6.5
1
94
9
7
10
0
17
0
50
.4
23
.2
26
2
6*
*
Ea
ste
rn L
imb
N –
fre
sh B
IF
24
2
5
6.5
2
44
1
22
1
00
1
70
6
3.4
2
9.2
2
6
26
**
Ea
ste
rn L
imb
C –
fre
sh B
IF
26
2
5
6.5
3
06
1
53
1
00
1
70
7
9.6
3
6.8
2
6
26
**
Ea
ste
rn L
imb
S –
fre
sh B
IF
24
2
5
6.5
1
67
8
3
10
0
17
0
43
.4
20
.0
26
2
6*
*
Gla
cie
r V
all
ey
–
fre
sh B
IF
26
2
5
6.5
2
04
1
02
1
00
1
70
5
2.9
2
4.4
2
6
26
**
fre
sh K
CS
2
1
25
6
.5
15
1
76
1
00
++
17
0+
+
39
.4
18
.2
23
2
2
Left
to
rig
ht,
to
p t
o b
ott
om
: U
CS
– u
nco
nfi
ne
d c
om
pre
ssiv
e s
tre
ng
th;
LB –
Lo
we
r B
ou
nd
; B
IF –
ba
nd
ed
iro
n f
orm
ati
on
; K
CS
– K
an
ga
roo
Ca
ve
s F
orm
ati
on
Sh
ale
Waste rock characterisation and stability assessments for feasibility level studies D Dwumfour et al.
686 Slope Stability 2020
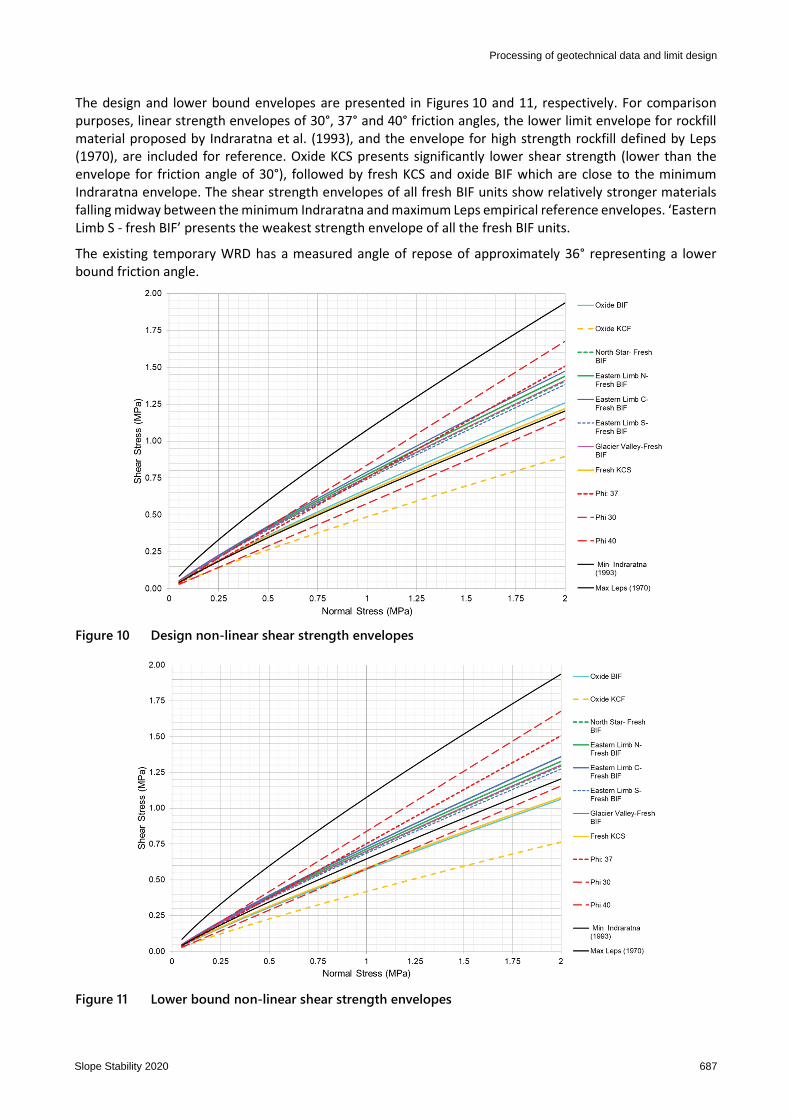
The design and lower bound envelopes are presented in Figures 10 and 11, respectively. For comparison
purposes, linear strength envelopes of 30°, 37° and 40° friction angles, the lower limit envelope for rockfill
material proposed by Indraratna et al. (1993), and the envelope for high strength rockfill defined by Leps
(1970), are included for reference. Oxide KCS presents significantly lower shear strength (lower than the
envelope for friction angle of 30°), followed by fresh KCS and oxide BIF which are close to the minimum
Indraratna envelope. The shear strength envelopes of all fresh BIF units show relatively stronger materials
falling midway between the minimum Indraratna and maximum Leps empirical reference envelopes. ‘Eastern
Limb S - fresh BIF’ presents the weakest strength envelope of all the fresh BIF units.
The existing temporary WRD has a measured angle of repose of approximately 36° representing a lower
bound friction angle.
Figure 10 Design non-linear shear strength envelopes
Figure 11 Lower bound non-linear shear strength envelopes
Processing of geotechnical data and limit design
Slope Stability 2020 687

5 Slope stability analyses
Slope stability assessments using limit equilibrium (LE) methods were undertaken for both operational tip
head dumping as well as the closure design. Field mapping during the site reconnaissance study and data
from the pit slope feasibility study was used to characterise the foundation strength. The site consists of
gently undulating terrain with small channels, predominately underlain by the Corboy Formation. This is
relatively competent with insignificant loose cover and foundation angles not posing any stability concerns.
The stability assessments were performed for various scenarios such as for static and pseudo-static loading,
and a range of storm events. Designs are required to meet different design acceptance criteria based on the
site’s management process for operations, industry guidelines (Read & Stacey 2009; Hawley & Cunning
2017), and regulatory feedback from previous design assessments. For this project, the design acceptance
criteria (Table 6) were adopted based on the consequence of failure and data confidence.
For closure design, storm events of 1:500-year 24 hr and probable maximum precipitation (PMP) 72 hr
precipitation were considered for the design and sensitivity assessments respectively. Relatively lower Factor
of Safety (FoS) requirements were accepted during operations as there are adequate management and
monitoring processes with competent geotechnical personnel present to reconcile the design assumptions.
Table 6 Fortescue acceptable design criteria
WRD slope Loading Pore pressure
(PP)
Minimum FoS
requirement
Operational profile
(short-term) Static Dry 1.1
Closure profile
(long-term)
Static
1:500-year PP ≥1.5
PMP PP 1.1
Dry ≥1.5
Fully saturated 1.1
Pseudo-static
(design event) Dry 1.15
Pseudo-static
(MCE) Dry >1.0
Left to right, top to bottom: WRD – waste rock dump; FoS – Factor of Safety;
PMP – probable maximum precipitation; MCE – maximum credible earthquake
5.1 Operational assessment
During operation, the WRD is constructed by loose dumping in successive lifts, and optimum lift heights are
defined ensuring safe mining operations while not impeding the ability to achieve final closure profile
requirements. The toe position of each successive lift is stepped in an optimal bench design distance that will
provide the required overall landform slope at closure. Truckloading is applied based on the largest site fleet
to ensure an acceptable FoS for the exposure of the truck. The design chart generated by stability analyses
(dry conditions) for assisting in the selection of operational optimum lift height is presented in Figure 12.
Waste rock characterisation and stability assessments for feasibility level studies D Dwumfour et al.
688 Slope Stability 2020
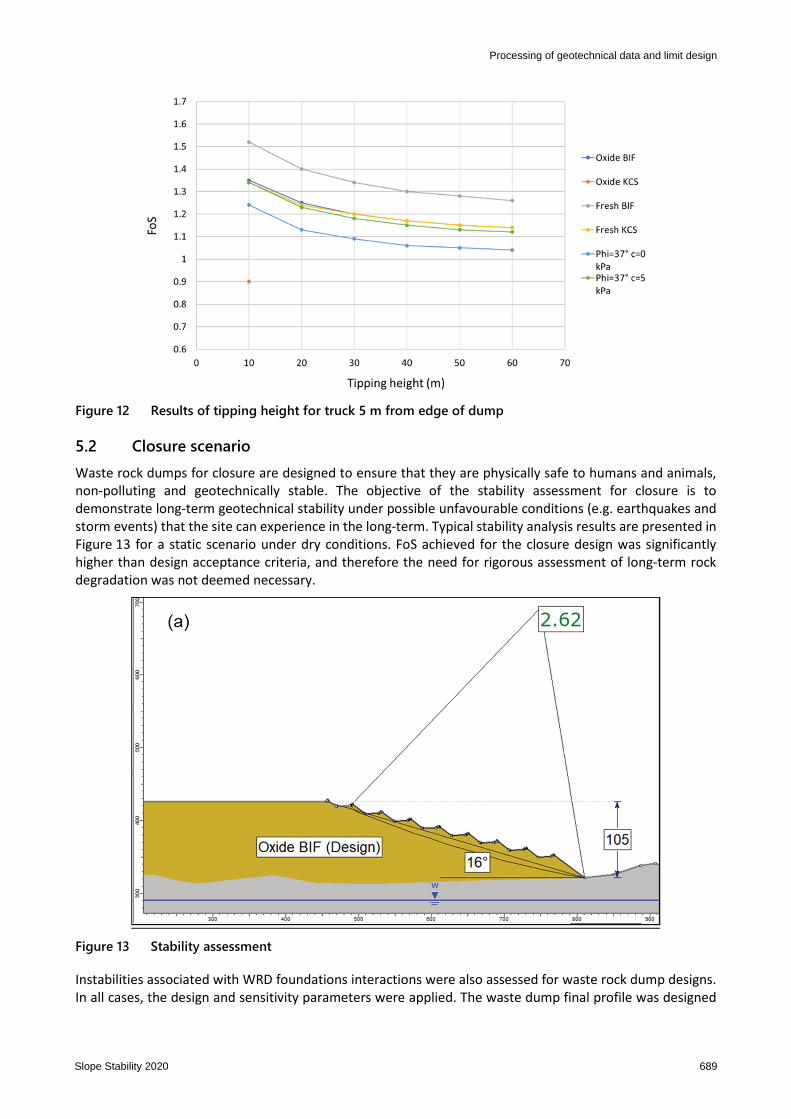
Figure 12 Results of tipping height for truck 5 m from edge of dump
5.2 Closure scenario
Waste rock dumps for closure are designed to ensure that they are physically safe to humans and animals,
non-polluting and geotechnically stable. The objective of the stability assessment for closure is to
demonstrate long-term geotechnical stability under possible unfavourable conditions (e.g. earthquakes and
storm events) that the site can experience in the long-term. Typical stability analysis results are presented in
Figure 13 for a static scenario under dry conditions. FoS achieved for the closure design was significantly
higher than design acceptance criteria, and therefore the need for rigorous assessment of long-term rock
degradation was not deemed necessary.
Figure 13 Stability assessment
Instabilities associated with WRD foundations interactions were also assessed for waste rock dump designs.
In all cases, the design and sensitivity parameters were applied. The waste dump final profile was designed
Processing of geotechnical data and limit design
Slope Stability 2020 689

such that all weak material such as the oxide KCF is not within the final structural zone of the WRD, thus it is
paddock dumped within the middle of the dump.
The final WRD was classified using the industry guidance for mine waste dump and stockpile (Hawley &
Cunning 2017) scheme. Low to Moderate Hazard level which is considered acceptable by Fortescue was
identified for the WRD using regional and foundation condition data, material characterisation data, stability
assessment results, expected rate of dump development and estimated performance based on stability
assessment and WRD performance at other sites.
6 Verification
A number of assumptions were made in the process of developing the non-linear shear strength envelopes
of various waste rock materials. Barton–Kjaernsli is typically applicable for general waste rock materials, and
potential limitations in terms of particle shapes of blasted anisotropic rock masses in this case exist. This
criterion was adopted due to practical reasons pending validation during construction. It is therefore
essential that the design parameters of waste rock materials and the stability requirements be reviewed and
updated during operations, as necessary. Performance of waste materials in the actual WRD during
operations will be used for verifying the study outcomes.
7 Conclusion
This paper outlines an approach to deriving WRD material input parameters to be adopted in the analysis of
waste rock dumps for operational and closure scenarios using representative and conservative (lower bound)
material strength parameters. The assessments using lower bound strength provided increased confidence
in the outcomes of the study, particular for closure scenarios. Reconciliation of actual performance using a
good monitoring system and site-specific testing, and if possible large-scale testing, is essential to verify
assumptions and to validate the model during operations, thereby increasing the design confidence level.
References
AMC 2019, Technical Report: Iron Bridge Geotechnical Feasibility Study, internal report, unpublished.
Barton, N & Kjaernsli, B 1981, ‘Shear strength of rock fill’, Journal of the Geotechnical Engineering Division, vol. 107, no. 7,
pp. 873–891.
Barton, N 2008, ‘Shear strength of rockfill, interfaces and rock joints, and their points of contacts in rock dumps design.’, in AB Fourie
(ed.), Proceedings of the International Seminar on the Management of Rock Dumps, Stockpiles and Heap Leach Pads,
Australian Centre for Geomechanics, Perth, pp. 3–18.
Franklin, JA & Chandra, R 1972, ‘The slake durability index’, International Journal of Rock Mechanics and Mining Sciences, vol. 9,
pp. 325‒342.
Hawley, MP & Cunning, J 2017, Guidelines for Mine Waste Dump and Stockpile Design, CSIRO Publishing, Clayton, 496 p.
Indraratna, B, Wijewardena, L & Balasubramaniam, A 1993, ‘Large-scale triaxial testing of greywacke rockfill’, Geotechnique, vol. 43,
no. 1, pp. 37–51.
Leps, T 1970, ‘Review of shearing strength of rockfill’, Journal of the Soil Mechanics and Foundations Division, Proceedings of the
American Society of Civil Engineers, vol. 96, iss. 4, pp. 1159–1170.
Read, JRL & Stacey, PF 2009, Guidelines for Open Pit Slope Design, CSIRO Publishing, Clayton, 496 p.
Simpson, C 2017, ‘The Iron Bridge magnetite deposits’, Proceedings Iron Ore 2017, The Australasian Institute of Mining and
Metallurgy, Melbourne, pp. 287–294.
SRK Consulting 2014, Technical report: Solomon Mine – Geotechnical Characterisation of Coarse-Grained Wastes, internal report,
unpublished.
Waste rock characterisation and stability assessments for feasibility level studies D Dwumfour et al.
690 Slope Stability 2020


![Characterisation of Large Disturbance Rotor Angle and Voltage … · Stability studies presented in [11] argued that transient and voltage stability improved by high voltage network](https://static.fdocuments.in/doc/165x107/60c67244766c713781605937/characterisation-of-large-disturbance-rotor-angle-and-voltage-stability-studies.jpg)


