POWER SYSTEM STABILITY ASSESSMENTS - SINTEF · PDF file1 POWER SYSTEM STABILITY ASSESSMENTS...
26
1 POWER SYSTEM STABILITY ASSESSMENTS Application of modal analysis to the Finnish transmission system SINTEF ENERGY RESEARCH HELSINKI UNIVERSITY OF TECHNOLOGY Study made for Fingrid Oyj, Helsinki Stefan Elenius, Kjetil Uhlen Ole Bjørn Gjøsæter, Ian Norheim Workshop at Trondheim 30-31.2002
Transcript of POWER SYSTEM STABILITY ASSESSMENTS - SINTEF · PDF file1 POWER SYSTEM STABILITY ASSESSMENTS...

1
POWER SYSTEM STABILITY ASSESSMENTSApplication of modal analysis to the Finnish transmission system
SINTEF ENERGY RESEARCH
HELSINKI UNIVERSITY OF TECHNOLOGY
Study made for Fingrid Oyj, Helsinki
Stefan Elenius, Kjetil Uhlen
Ole Bjørn Gjøsæter, Ian Norheim
Workshop at
Trondheim 30-31.2002

Trondheim workshop 30-31.2002 2
CONTENTS
1. Introduction slide 3
2. Analysis slide 6
3. Stabilizer design for generators slide 17
4. Influence of stabilizers slide 18
5. Fennoskan slide 19
6. Concluding remarks slide 25
7. Further research work slide 26

Trondheim workshop 30-31.2002 3
1. Introduction
• Project on power system stability with emphasis on the Finnish transmission grid.
• A main objective and motivation for the project has been to introduce the program system PacDyn for small signal stability analysis.
• The aim of the stability analysis has been to identify possible low damped system modes, and assess the observability and controllability of these modes as a basis for later investigations on design of power system stabilizers for generators, HVDC links and FACTS devices.
• Another aim of the project has been to establish a co-operation between Fingrid, Helsinki University of Technology (HUT) and SINTEF on power system stability assessment and control.

Trondheim workshop 30-31.2002 4
1.1 Software tools
• PSS/E
- The PSS/E system models can be referred to as the ‘truth’ models. The modelling is detailed including non-linearities. The effects of non-linearities are included in the simulations.
- Non-linear controllers can be modeled and developed with the PSS/E.
• PacDyn
- The PacDyn sofware makes initially a linearisation of the PSS/E load flow and dynamic models.
- The linearisation makes it possible to take advantage of the sophisticated methods from the control theory for analysis of linear systems.
Trondheim workshop 30-31.2002 5
1.2 Configuration and implementation of the Finnish system model (Nordic model) in Pacdyn
• High (winter) load condition with moderate export of power from Finland to Sweden. Number of online generators 1132. Load in Finland 12200 MW.
• Low (summer) load condition with high export from Finland to Sweden. Number of online generators 784. Load in Finland 7266 MW.
• PacDyn recognizes the PSS/E load flow and the majority of the dynamic declarations in PSS/E format.
• Dynamic models in PSS/E format, that PacDyn do not recognize, have been replaced with other models or have just been removed.
• Models removed are supplementary signals for static var compensators, frequency dependent load models, and current compounding for voltage regulators.
• Initially all HVDC models were replaced with constant power loads.

Trondheim workshop 30-31.2002 6
2. Analysis
Main findings from the stability assessments. The following is described.
• Main load flow data of the two study cases (winter and summer load).
• Eigenvalues (Frequency and damping of low damped inter-area modes (0.3 Hz, 0.5 Hz) and some local modes with low damping).
• “Mode shapes” for the most interesting eigenvaluesidentified.
• Transfer function residues for controllability assessment (identify most efficient units for installation/retuning of power system stabilisers).
• Transfer functions to illustrate the design of power system stabilisers (frequency response)
Trondheim workshop 30-31.2002 7
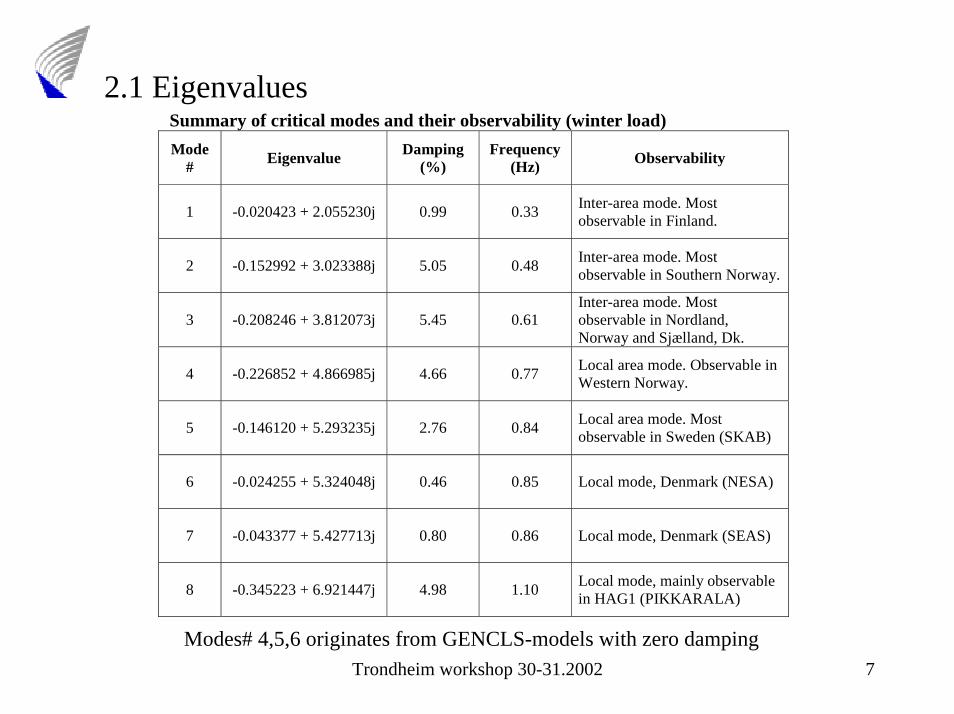
2.1 Eigenvalues Summary of critical modes and their observability (winter load)Mode
# Eigenvalue Damping(%)
Frequency(Hz) Observability
1 -0.020423 + 2.055230j 0.99 0.33 Inter-area mode. Mostobservable in Finland.
2 -0.152992 + 3.023388j 5.05 0.48 Inter-area mode. Mostobservable in Southern Norway.
3 -0.208246 + 3.812073j 5.45 0.61Inter-area mode. Mostobservable in Nordland,Norway and Sjælland, Dk.
4 -0.226852 + 4.866985j 4.66 0.77 Local area mode. Observable inWestern Norway.
5 -0.146120 + 5.293235j 2.76 0.84 Local area mode. Mostobservable in Sweden (SKAB)
6 -0.024255 + 5.324048j 0.46 0.85 Local mode, Denmark (NESA)
7 -0.043377 + 5.427713j 0.80 0.86 Local mode, Denmark (SEAS)
8 -0.345223 + 6.921447j 4.98 1.10 Local mode, mainly observablein HAG1 (PIKKARALA)
Modes# 4,5,6 originates from GENCLS-models with zero damping

Trondheim workshop 30-31.2002 8
Figure 4.1. Mode # 1: Inter-area mode, 0.33 Hz. Mode-shape with respect to generator speed (ww). Generators in Finland oscillate in phase against the rest of the system. Most observable in Finland.
2.2 Mode-shapes

Trondheim workshop 30-31.2002 9
Table 4.2. Mode # 1: Inter-area mode, 0.33 Hz. Mode-shape with respect to generator terminal power (PT). Generators in Finland oscillate in phase against the rest of the system. Largest power oscillations observable in Olkiluoto and Meripori generators.

Trondheim workshop 30-31.2002 10
Figure 4.3. Mode # 2: Inter-area mode, 0.48 Hz. Mode-shape with respect to generator speed (ww). Generators in Southern Norway (and Finland) oscillate in phase against the rest of the system. Speed variations most observable in Southern Norway

Trondheim workshop 30-31.2002 11
Table 4.4. Mode # 2: Inter-area mode, 0.48 Hz. Mode-shape with respect to generator terminal power (PT). Generators in Southern Norway (and Finland) oscillate in phase against the rest of the system. Power oscillations are observable in most of the largest generators in Nordel.

Trondheim workshop 30-31.2002 12
2.3 Transfer function residues
Table 4.4. Summary of the transfer function residue computations
Mode#
Damping(%)
Frequency(Hz) Description:
1 0.99 0.33Inter-area mode. Highestcontrollability in Meripori andOlkiluoto.
2 5.05 0.48
Inter-area mode. Highestcontrollability in Forsmark,Oskarshamn, Ringhals andgenerators in Southwest ofNorway.
4 4.66 0.77Local area mode. Highestcontrollability in WesternNorway.

Trondheim workshop 30-31.2002 13
2.4 Frequency response computation
Figure 4.30 Transfer function frequency response for the VuosaariVSRKT1 generator with the generator voltage reference as input and generator electrical power as output.
Trondheim workshop 30-31.2002 14
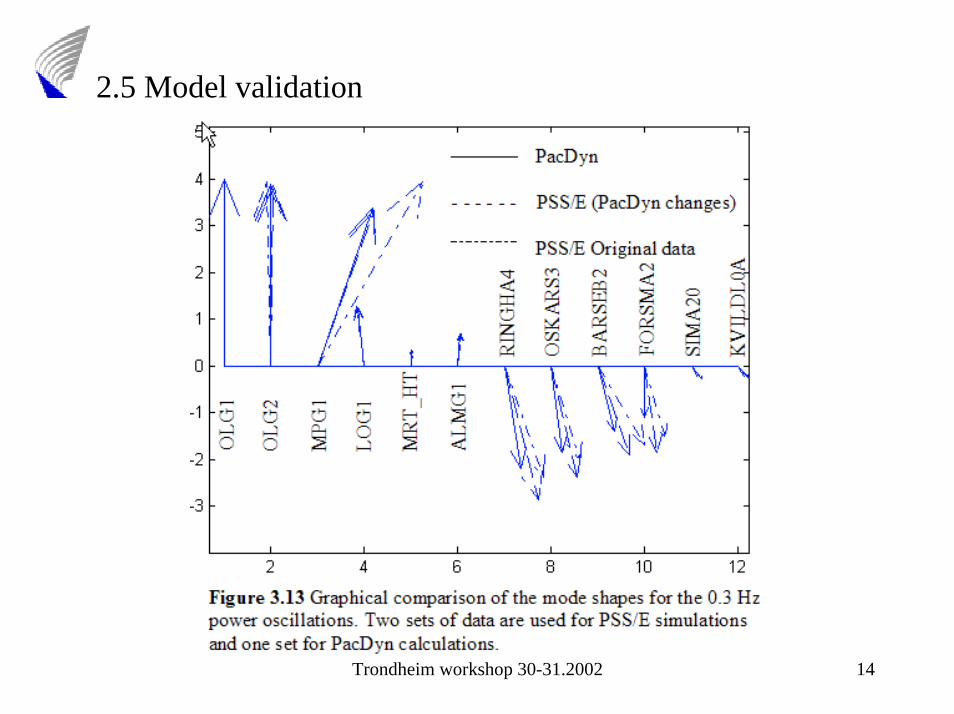
2.5 Model validation
Trondheim workshop 30-31.2002 15
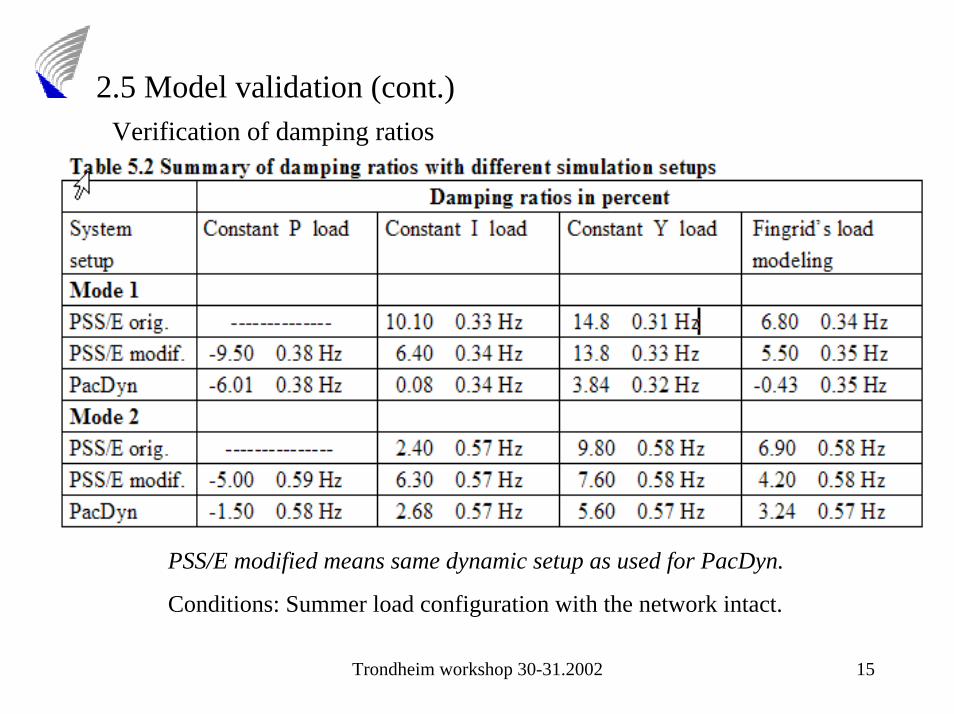
2.5 Model validation (cont.)
PSS/E modified means same dynamic setup as used for PacDyn.
Conditions: Summer load configuration with the network intact.
Verification of damping ratios
Trondheim workshop 30-31.2002 16
2.5 Model validation (cont.)
• The mode shapes from PacDyn calculations and those obtained by PSS/E modal analysis are quite close.
• The modal frequencies are very close.
• PacDyn generally shows lower damping ratios thanthe PSS/E simulations.

Trondheim workshop 30-31.2002 17
3. Stabilizer design for generators
• Transfer function frequency response from the generator voltage reference to generator terminal power used to determine the characteristics for stabilizers using generator active power as input signal.
• Stabilizer which has a gain of 1 p.u. and a good phase compensation at the inter-area oscillation frequency (2 rad/s), while maintaining a gain of 0.5 p.u. and a reasonable phase shift at the generator characteristic oscillation frequency.
• The stabilizer has low gain in the turbine resonance frequency range.
Gain
Phase
Design criteria

Trondheim workshop 30-31.2002 18
4. Influence of stabilizers• Stabilizers on strategic generators may improve the inter-area transfer
capacity
• With small signal analysis in PacDyn the damping of dominant oscillation modes were calculated as a function of the export from Northern Finland to Sweden in a typical summer load situation
• The export between Northern Finland and Sweden was calculated inPSS-E and controlled by complementary changing the production in Sweden and Finland
• The flow in the Fennoskan link was constant
• The case including new stabilizers on certain generators in Finland was computed and showed large improvement in the damping of the 0.35Hz oscillation mode and significant improvement in the damping of the 0.57 Hz oscillation mode.

Trondheim workshop 30-31.2002 19
4.1 Influence of new stabilizers at Olkiluoto and Loviisa
6 0 0 7 0 0 8 0 0 9 0 0 1 0 0 0 1 1 0 0 1 2 0 0-1
0
1
2
3
4
5
6
F lo w F I-S E (MW )
Dam
ping
(%)
0.35 Hz modeExisting PSSs
0.35 Hz modeNew PSSs
0.57 Hz mode

Trondheim workshop 30-31.2002 20
5. Fennoskan
• The Fennoskan HVDC link has a power system stabilizer installed.
• The inputs to the stabilizer are the bus frequencies from both converter stations.
Fennoskan’s PSS/E HVDC stabilizer model:
• The frequency difference between the stations is calculated and band-pass filtered with a center frequency at 3 rad/s.
• When the frequency difference after the band-pass filtering varies more than ± 25 mHz, the the stabilizer output is activated.
• The stabilizer works as a bang-bang controller with the output limited to ± 100 MW. The control action is pulse width modulated.
Trondheim workshop 30-31.2002 21
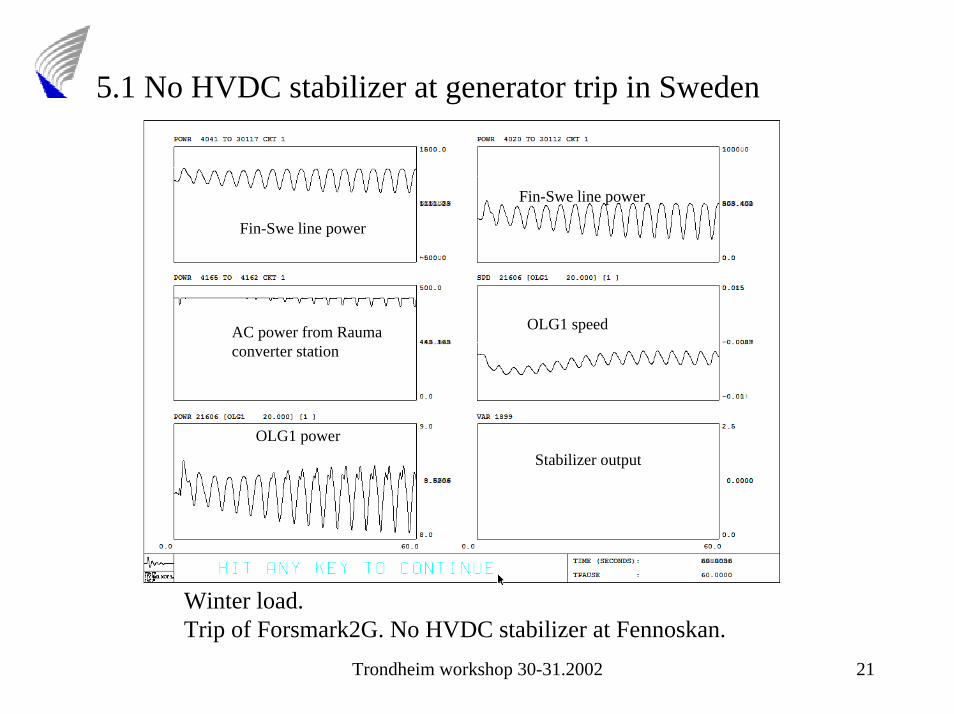
5.1 No HVDC stabilizer at generator trip in Sweden
Winter load. Trip of Forsmark2G. No HVDC stabilizer at Fennoskan.
Fin-Swe line power
Fin-Swe line power
OLG1 speedAC power from Rauma converter station
Stabilizer outputOLG1 power
Trondheim workshop 30-31.2002 22
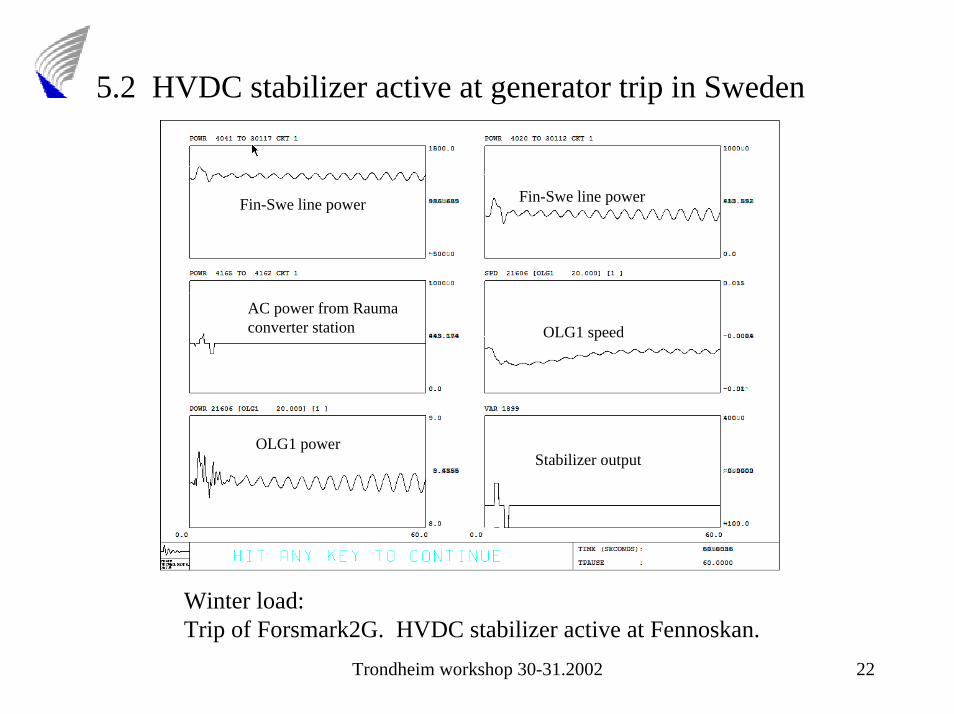
5.2 HVDC stabilizer active at generator trip in Sweden
Stabilizer outputOLG1 power
OLG1 speed
Fin-Swe line powerFin-Swe line power
AC power from Rauma converter station
Winter load: Trip of Forsmark2G. HVDC stabilizer active at Fennoskan.

Trondheim workshop 30-31.2002 23
5.3 Transfer function, bus angle difference/DC current order
rad/s
rad/s
Gain(dB)
Phase
TETA = Angles at Rauma and Dannebo converter AC buses
Trondheim workshop 30-31.2002 24
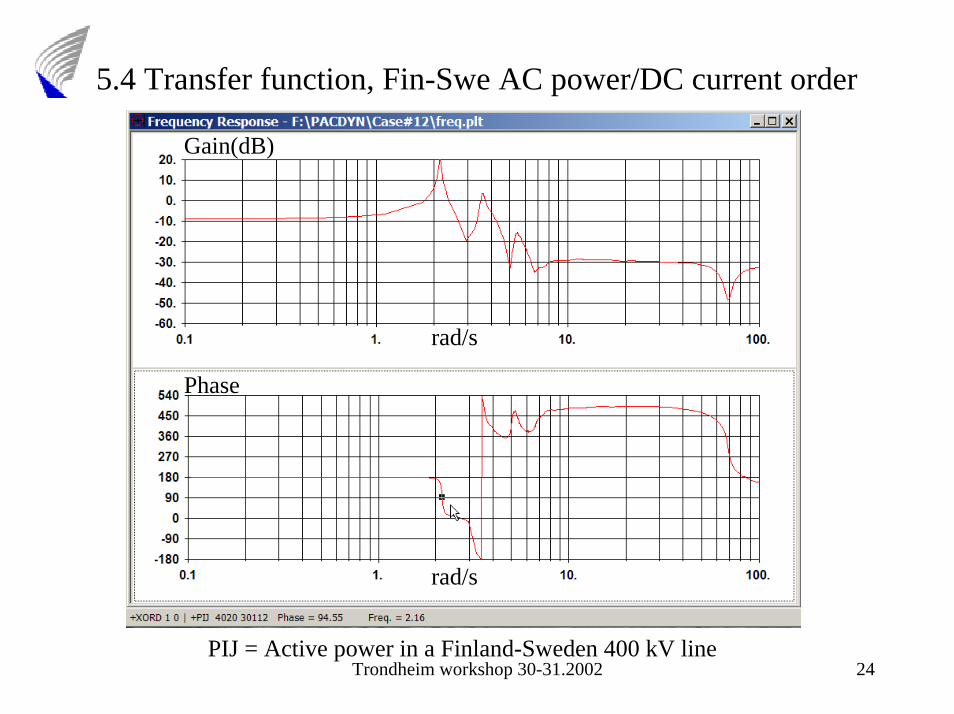
5.4 Transfer function, Fin-Swe AC power/DC current order
rad/s
rad/s
Gain(dB)
Phase
PIJ = Active power in a Finland-Sweden 400 kV line

Trondheim workshop 30-31.2002 25
6. Concluding remarks• Linear analysis software is a powerful tool to use in parallel with
standard nonlinear power system simulation programs.
• The PacDyn computations and PSS/E simulations with modal analysis show almost identical modal frequencies. Mode shapes also agree quite well.
• There is a larger difference between the damping ratios obtainedby PacDyn computations and PSS/E simulations/modal analysis. PacDyn generally gives lower damping ratios the the PSS/E for the lowest oscillation modes.
• Power system stabilizer redesign and retuning at generating stations and converter stations can be a cost effective way to increase the transfer capacity of existing AC interconnections.
• Computations show that new stabilizers that will be taken into service at Olkiluoto and Loviisa in Finland, have a strong impact on the damping of the 0.35 Hz mode and a moderate impact on the 0.57 Hz mode.
Trondheim workshop 30-31.2002 26
7. Further research work
• The studies related to stabilizers on HVDC will continue.
• An international paper about the application of modal analysis to the Finnish transmission system will be written.
• Identify good locations for potential FACTS devices.
• Find control concepts for FACTS devices.
• Interactions between FACTS, HVDC and generator controllers.
• An international paper about the findings from our FACTS research.