Warm Welcome To Presentation On Natural Gas …. GAIL.pdfOutline 2 GAIL : Journey So Far Natural Gas...
44
Warm Welcome To Presentation On Natural Gas Scenario & its Uses Delhi 29.09.2012 Spreading the Green Energy
Transcript of Warm Welcome To Presentation On Natural Gas …. GAIL.pdfOutline 2 GAIL : Journey So Far Natural Gas...

Warm Welcome
To
Presentation
On
Natural Gas
Scenario & its Uses
Delhi 29.09.2012
Spreading the Green Energy
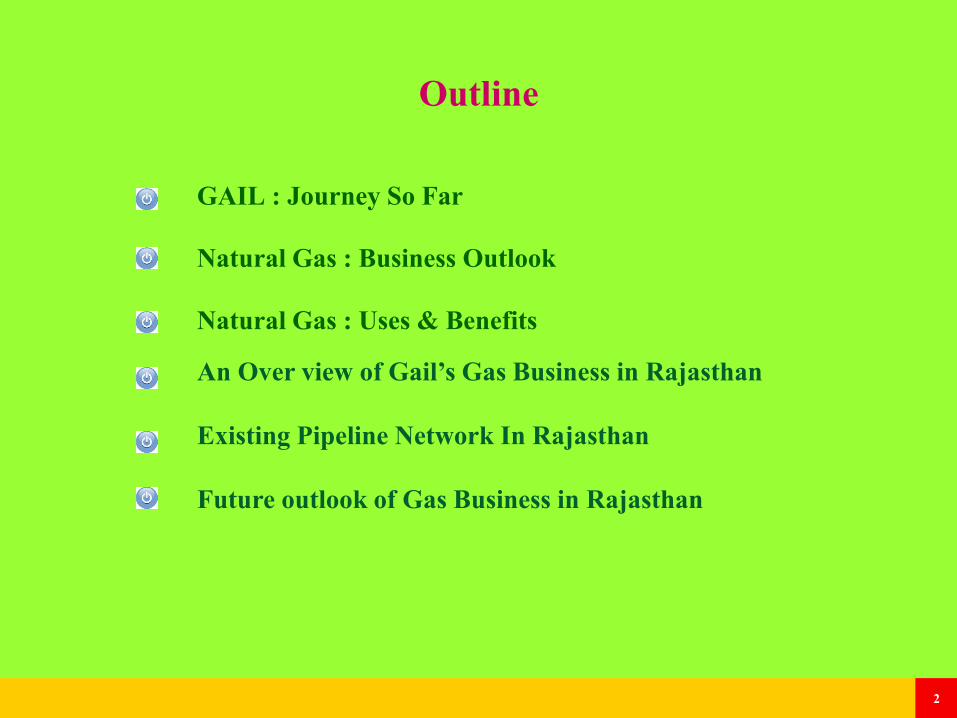
Outline
2
GAIL : Journey So Far
Natural Gas : Business Outlook
Natural Gas : Uses & Benefits
An Over view of Gail’s Gas Business in Rajasthan
Existing Pipeline Network In Rajasthan
Future outlook of Gas Business in Rajasthan

3 3
GAIL : Journey so far..
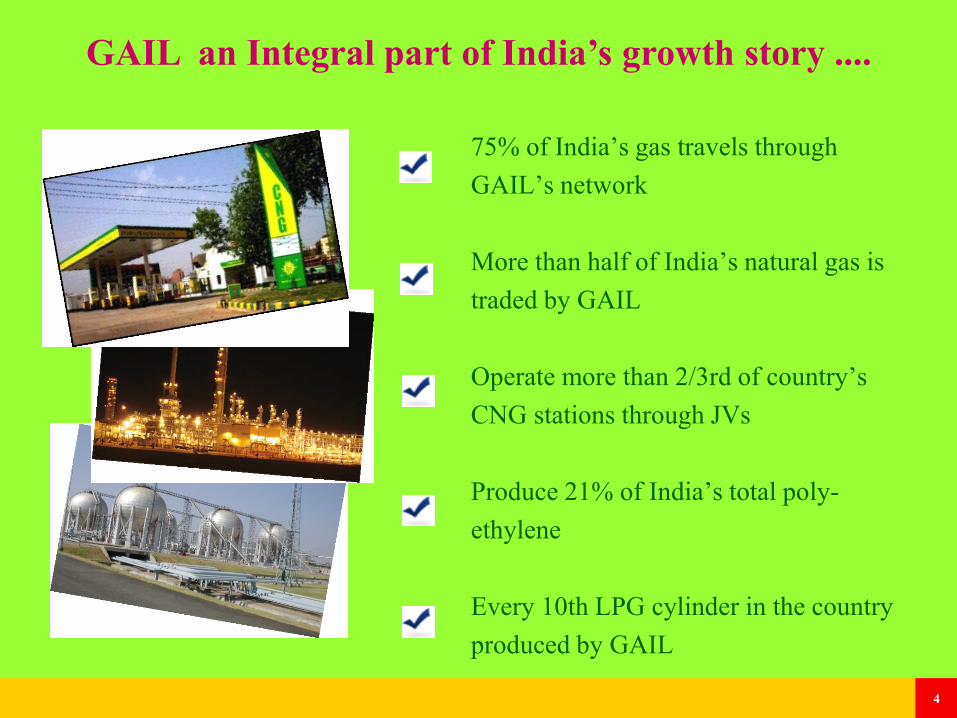
GAIL an Integral part of India’s growth story ....
75% of India’s gas travels through
GAIL’s network
More than half of India’s natural gas is
traded by GAIL
Operate more than 2/3rd of country’s
CNG stations through JVs
Produce 21% of India’s total poly-
ethylene
Every 10th LPG cylinder in the country
produced by GAIL
4
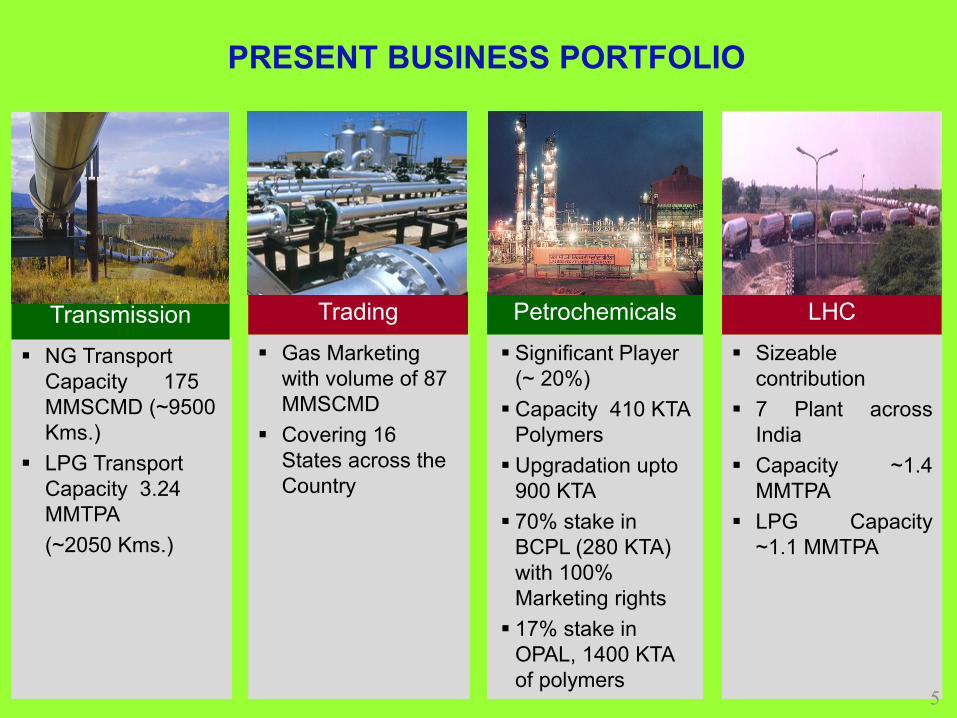
Sizeable
contribution
7 Plant across
India
Capacity ~1.4
MMTPA
LPG Capacity
~1.1 MMTPA
LHC
Significant Player
(~ 20%)
Capacity 410 KTA
Polymers
Upgradation upto
900 KTA
70% stake in
BCPL (280 KTA)
with 100%
Marketing rights
17% stake in
OPAL, 1400 KTA
of polymers
Petrochemicals
Gas Marketing
with volume of 87
MMSCMD
Covering 16
States across the
Country
Trading
NG Transport
Capacity 175
MMSCMD (~9500
Kms.)
LPG Transport
Capacity 3.24
MMTPA
(~2050 Kms.)
Transmission
PRESENT BUSINESS PORTFOLIO
5
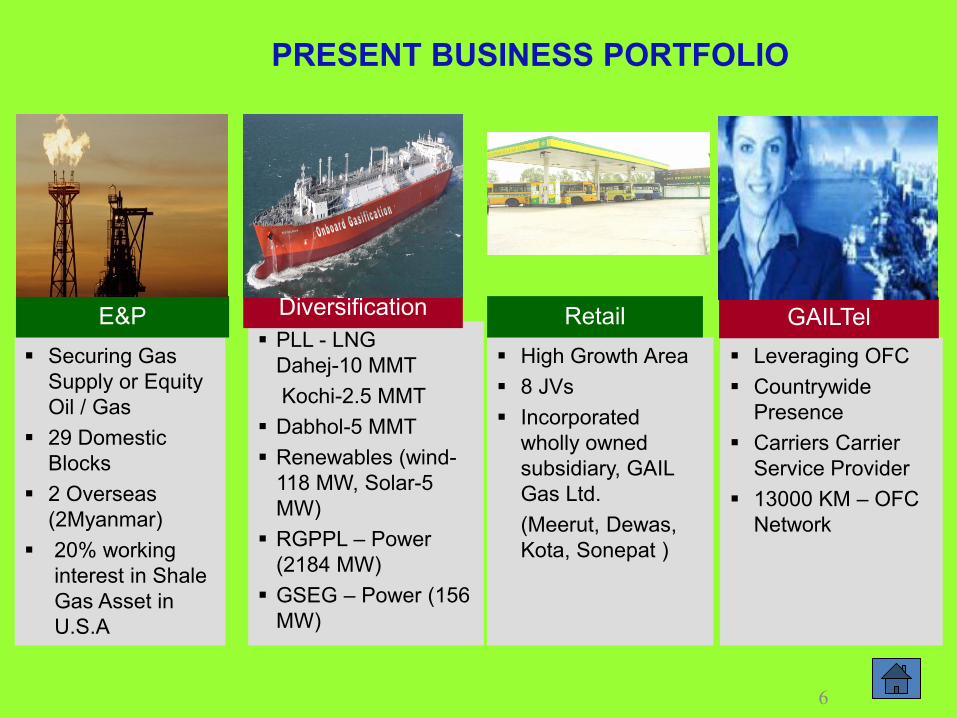
Leveraging OFC
Countrywide
Presence
Carriers Carrier
Service Provider
13000 KM – OFC
Network
GAILTel
Securing Gas
Supply or Equity
Oil / Gas
29 Domestic
Blocks
2 Overseas
(2Myanmar)
20% working
interest in Shale
Gas Asset in
U.S.A
E&P
High Growth Area
8 JVs
Incorporated
wholly owned
subsidiary, GAIL
Gas Ltd.
(Meerut, Dewas,
Kota, Sonepat )
Retail PLL - LNG
Dahej-10 MMT
Kochi-2.5 MMT
Dabhol-5 MMT
Renewables (wind-
118 MW, Solar-5
MW)
RGPPL – Power
(2184 MW)
GSEG – Power (156
MW)
Diversification
PRESENT BUSINESS PORTFOLIO
6
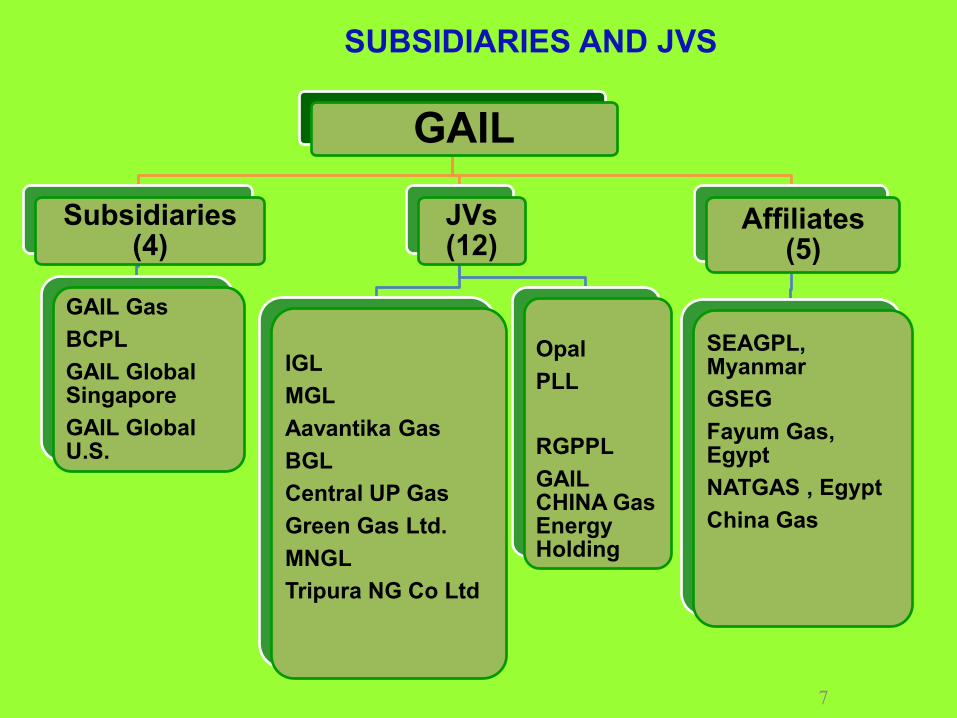
GAIL
Subsidiaries (4)
GAIL Gas
BCPL
GAIL Global Singapore
GAIL Global U.S.
JVs (12)
IGL
MGL
Aavantika Gas
BGL
Central UP Gas
Green Gas Ltd.
MNGL
Tripura NG Co Ltd
Opal
PLL
RGPPL
GAIL CHINA Gas Energy Holding
Affiliates (5)
SEAGPL, Myanmar
GSEG
Fayum Gas, Egypt
NATGAS , Egypt
China Gas
7
SUBSIDIARIES AND JVS
... having Subsidiaries & Joint Ventures ...
8
GAIL Global Singapore Pte. Ltd
South East Asia Gas Pipeline Company Ltd

GLOBAL FOOTPRINTS
Egypt Equity in 2 Retail Gas Companies
Myanmar
Partner in A1, A3 E&P Blocks
Participation in Myanmar-China Gas
Pipeline
United States of America
GAIL Global U.S. holds 20% stake in
producing Shale Asset in Eagle ford
China Equity Partner in China Gas (Retail
Gas Company)
50:50 JV With China Gas Singapore 100% Subsidiary – GAIL Global
(Singapore) Pte. Limited –
Overseas investment & Trading /
Sourcing arm 9

ENERGY OUTLOOK
10
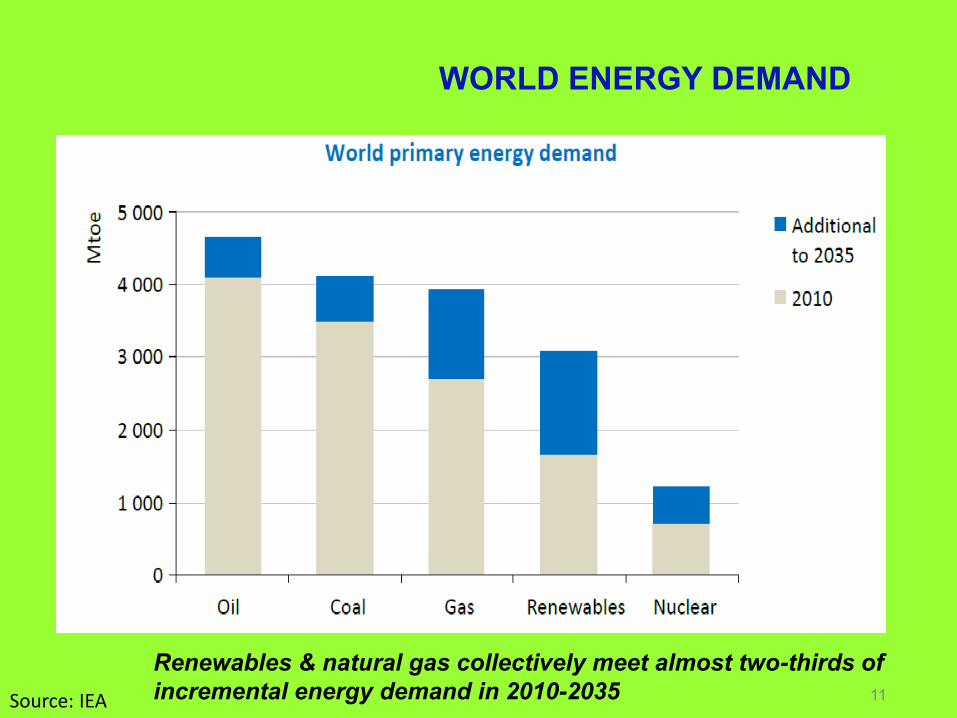
WORLD ENERGY DEMAND
Renewables & natural gas collectively meet almost two-thirds of
incremental energy demand in 2010-2035 Source: IEA 11
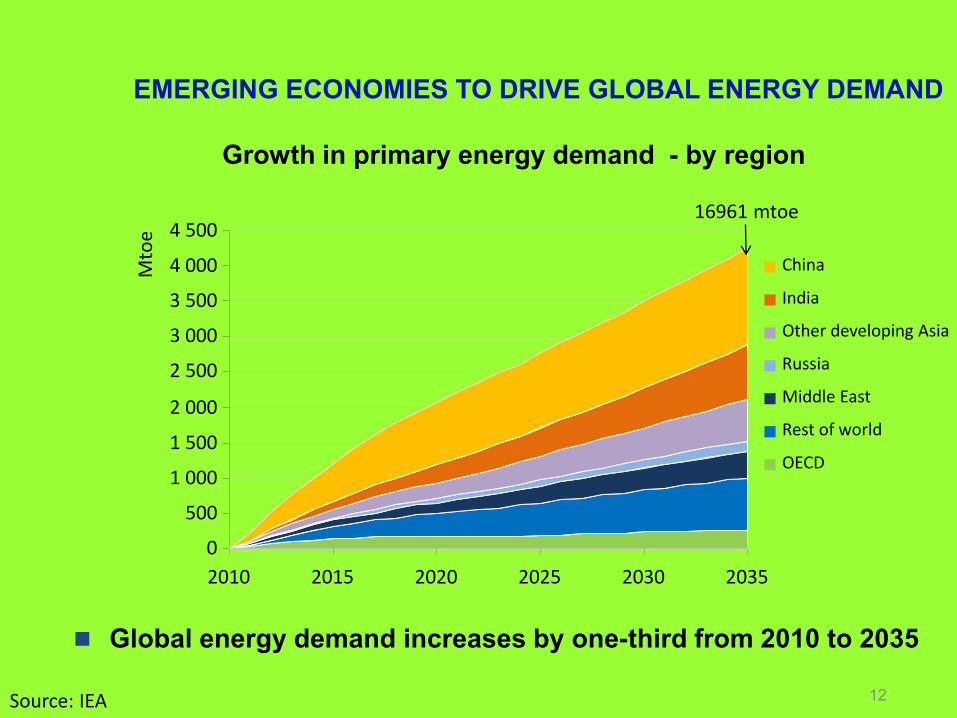
EMERGING ECONOMIES TO DRIVE GLOBAL ENERGY DEMAND
12
Growth in primary energy demand - by region
Global energy demand increases by one-third from 2010 to 2035
0
500
1 000
1 500
2 000
2 500
3 000
3 500
4 000
4 500
2010 2015 2020 2025 2030 2035
Mto
e
China
India
Other developing Asia
Russia
Middle East
Rest of world
OECD
16961 mtoe
Source: IEA
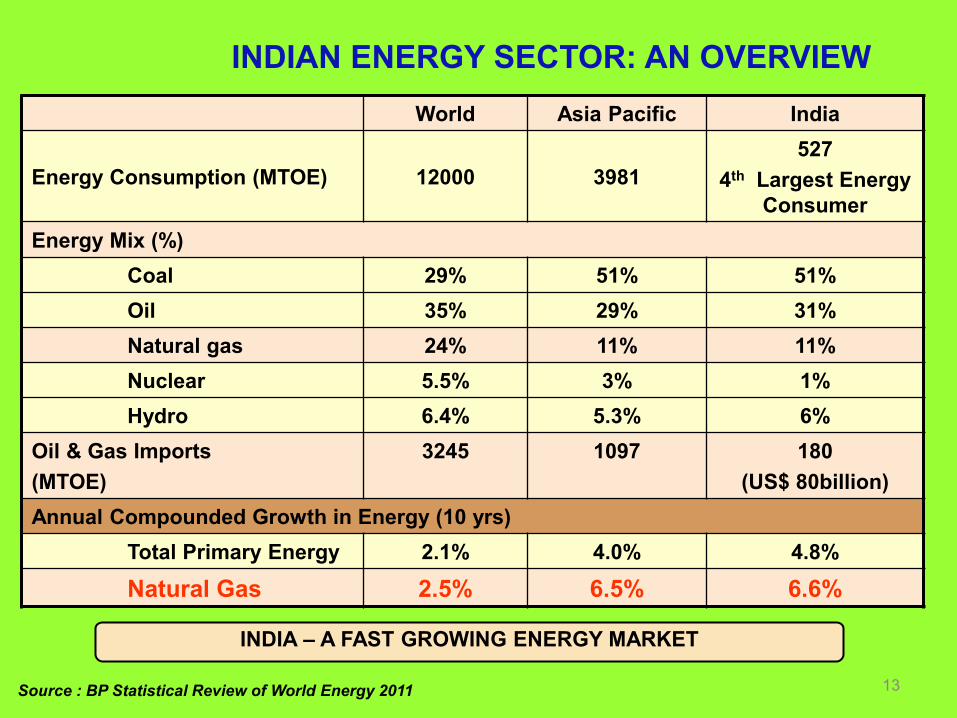
INDIA – A FAST GROWING ENERGY MARKET
INDIAN ENERGY SECTOR: AN OVERVIEW
Source : BP Statistical Review of World Energy 2011 13
World Asia Pacific India
Energy Consumption (MTOE) 12000 3981
527
4th Largest Energy
Consumer
Energy Mix (%)
Coal 29% 51% 51%
Oil 35% 29% 31%
Natural gas 24% 11% 11%
Nuclear 5.5% 3% 1%
Hydro 6.4% 5.3% 6%
Oil & Gas Imports
(MTOE)
3245 1097 180
(US$ 80billion)
Annual Compounded Growth in Energy (10 yrs)
Total Primary Energy 2.1% 4.0% 4.8%
Natural Gas 2.5% 6.5% 6.6%
14
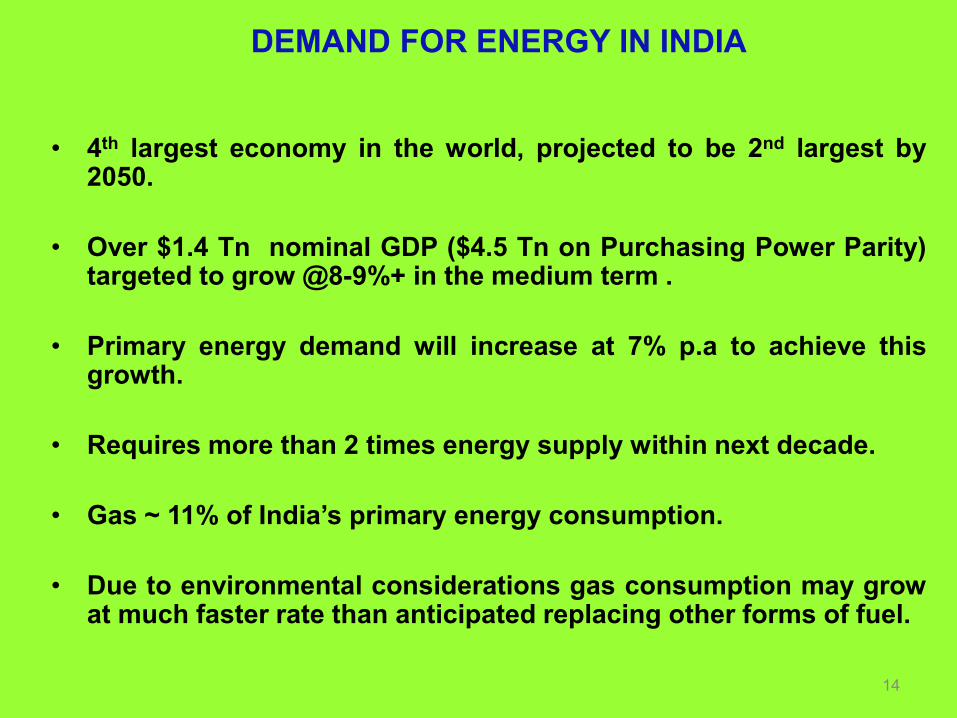
DEMAND FOR ENERGY IN INDIA
• 4th largest economy in the world, projected to be 2nd largest by 2050.
• Over $1.4 Tn nominal GDP ($4.5 Tn on Purchasing Power Parity) targeted to grow @8-9%+ in the medium term .
• Primary energy demand will increase at 7% p.a to achieve this growth.
• Requires more than 2 times energy supply within next decade.
• Gas ~ 11% of India’s primary energy consumption.
• Due to environmental considerations gas consumption may grow at much faster rate than anticipated replacing other forms of fuel.
INDIAN GAS SECTOR OVERVIEW
15
16
0
10
20
30
40
50
60
70
72
/73
74
/75
76
/77
78
/79
80
/81
82
/83
84
/85
86
/87
88
/89
90
/91
92
/93
94
/95
96
/97
98
/99
00
/01
02
/03
03
/05
03
/07
03
/11
BC
M
Years
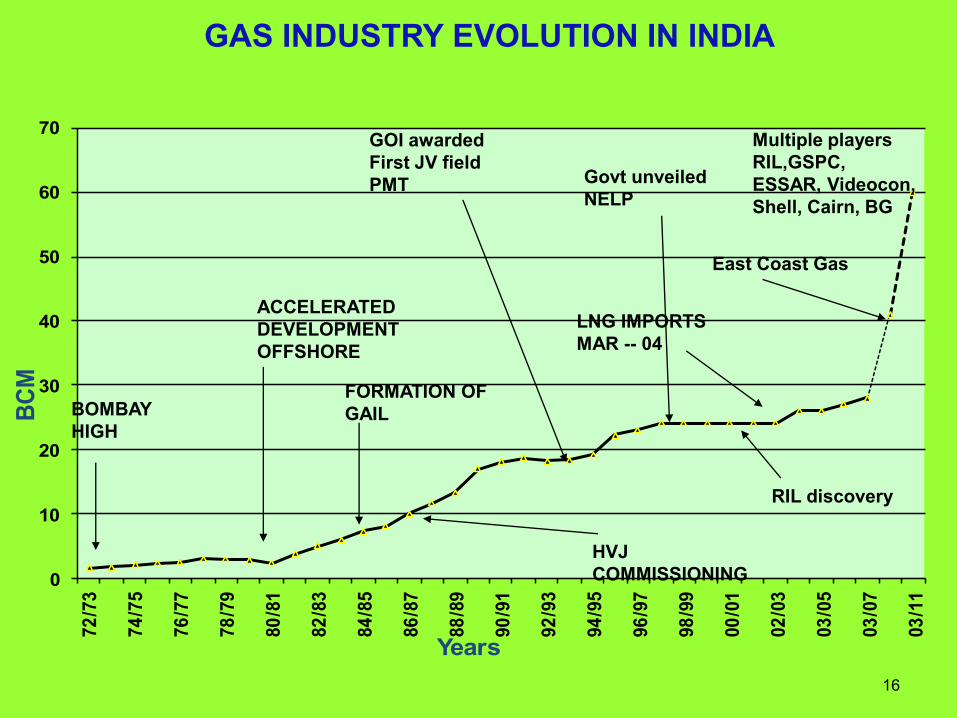
BOMBAY
HIGH
ACCELERATED
DEVELOPMENT
OFFSHORE
FORMATION OF
GAIL
HVJ
COMMISSIONING
LNG IMPORTS
MAR -- 04
GAS INDUSTRY EVOLUTION IN INDIA
East Coast Gas
Govt unveiled
NELP
GOI awarded
First JV field
PMT
RIL discovery
Multiple players
RIL,GSPC,
ESSAR, Videocon,
Shell, Cairn, BG
17
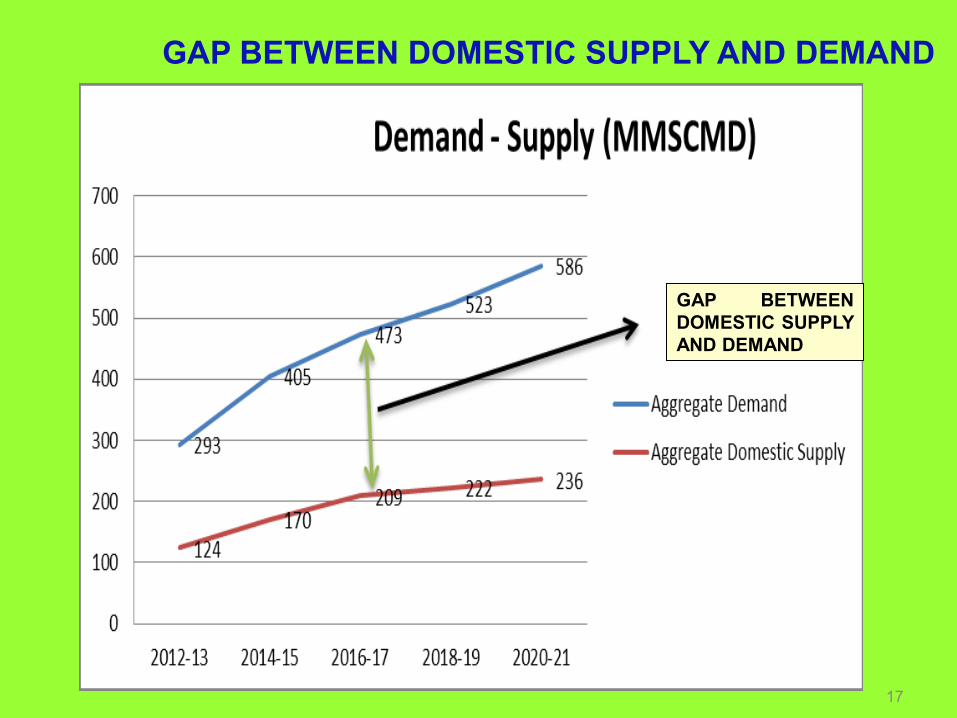
GAP BETWEEN DOMESTIC SUPPLY AND DEMAND
GAP BETWEEN
DOMESTIC SUPPLY
AND DEMAND
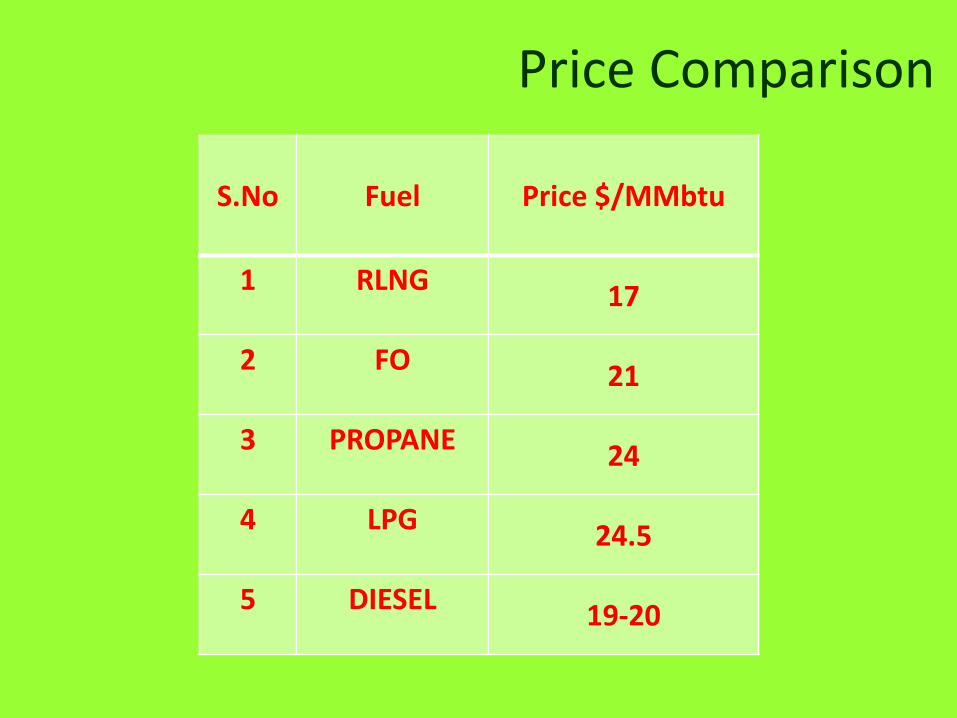
Price Comparison
S.No Fuel Price $/MMbtu
1 RLNG 17
2 FO 21
3 PROPANE 24
4 LPG 24.5
5 DIESEL 19-20

19
PLAYER
TYPE OF
NETWORK
DESIGN
CAPACITY
(MMSCMD)
Length(Kms)
including
spurline
AVG PRESENT
FLOW
(MMSCMD)
GAIL
Trunk line &
Regional 175 9,500 120
GSPL Regional 28 2000 35
AGCL/OIL Regional 8 500 5
RGTIL
EWPL
Trunkline 80
1400
-
TOTAL 291 13,400 165
EXISTING PIPELINE INFRASTRUCTURE
Source: Secondary Information
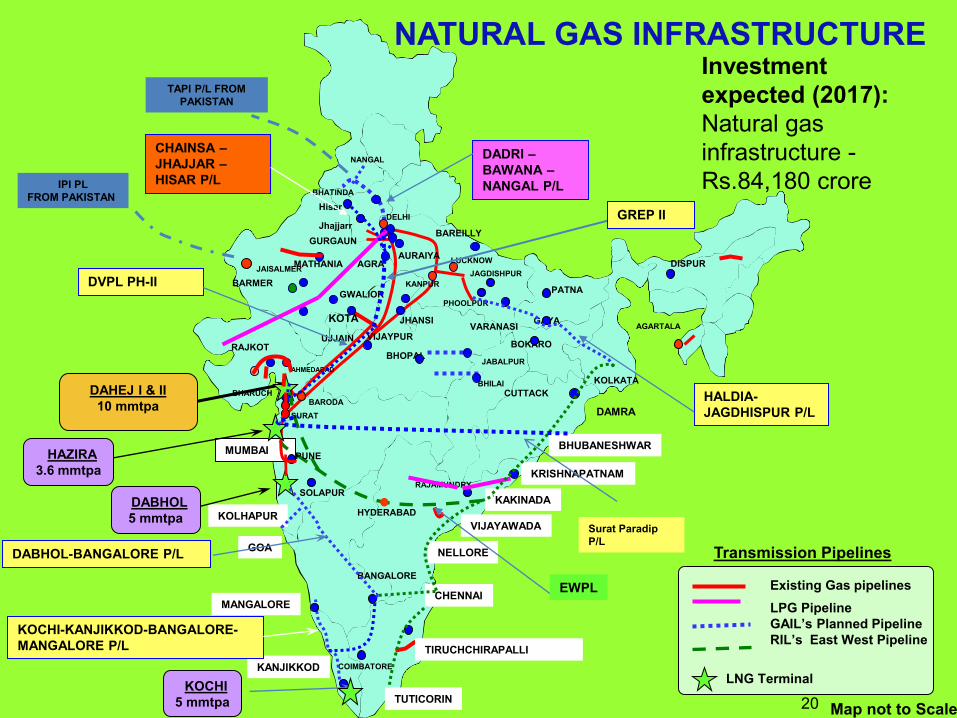
Transmission Pipelines
Existing Gas pipelines
LPG Pipeline
GAIL’s Planned Pipeline
RIL’s East West Pipeline
LNG Terminal
JAGDISHPUR
PHOOLPUR
BHATINDA
BAREILLY
DISPUR
DELHI
AGARTALA
BARODA
LUCKNOW
PATNA
AHMEDABAD
RAJKOT
KOTA
MATHANIA
GWALIOR
UJJAIN
AGRA
KOLKATA
GAYA
BOKARO
VARANASI JHANSI
DAHEJ I & II
10 mmtpa
COIMBATORE
MANGALORE
MUMBAI BHUBANESHWAR
KRISHNAPATNAM
NELLORE
BANGALORE
KOLHAPUR
SOLAPUR KAKINADA
VIJAYAWADA
DABHOL
5 mmtpa
KANJIKKOD
AURAIYA
GOA
CUTTACK
VIJAYPUR
KANPUR
NANGAL
GURGAUN
PUNE
BHARUCH
SURAT
HYDERABAD
RAJAMUNDRY
BHOPAL
BARMER
Hisar
Jhajjarr
DADRI –
BAWANA –
NANGAL P/L
CHAINSA –
JHAJJAR –
HISAR P/L
DVPL PH-II
GREP II
EWPL
KOCHI
5 mmtpa
DABHOL-BANGALORE P/L
KOCHI-KANJIKKOD-BANGALORE-
MANGALORE P/L
HALDIA-
JAGDHISPUR P/L
CHENNAI
TUTICORIN
TIRUCHCHIRAPALLI
DAMRA
JABALPUR
BHILAI
JAISALMER
IPI PL
FROM PAKISTAN
TAPI P/L FROM
PAKISTAN
Surat Paradip
P/L
20
HAZIRA
3.6 mmtpa
Map not to Scale
Investment
expected (2017):
Natural gas
infrastructure -
Rs.84,180 crore
NATURAL GAS INFRASTRUCTURE
21
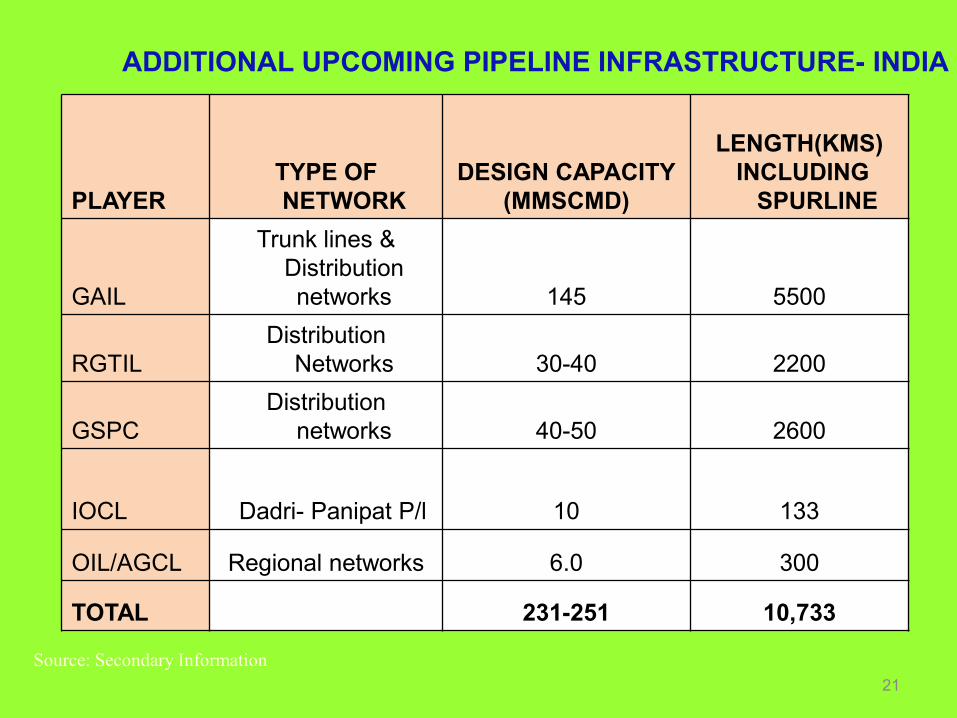
PLAYER
TYPE OF
NETWORK
DESIGN CAPACITY
(MMSCMD)
LENGTH(KMS)
INCLUDING
SPURLINE
GAIL
Trunk lines &
Distribution
networks 145 5500
RGTIL
Distribution
Networks 30-40 2200
GSPC
Distribution
networks 40-50 2600
IOCL
Dadri- Panipat P/l 10 133
OIL/AGCL Regional networks 6.0 300
TOTAL 231-251 10,733
ADDITIONAL UPCOMING PIPELINE INFRASTRUCTURE- INDIA
Source: Secondary Information

Natural Gas : Uses & Benefits

23 23
CARBON DIOXIDE (mg)900
720
380
0
200
400
600
800
1000
COAL FO GAS
NITROGEN DIOXIDE (mg)
350480600
0
500
1000
COAL FO GAS
SULPHER DIOXIDE (mg)
020
60
0
50
100
COAL FO GAS
19th CENTURY - COAL
20th CENTURY - OIL
21ST CENTURY - GAS
NATURAL GAS – THE CLEANEST FOSSIL
FUEL
SOLID PARTICULATES
COAL – VERY LARGE
FO – TRACES
GAS – NIL
24 24
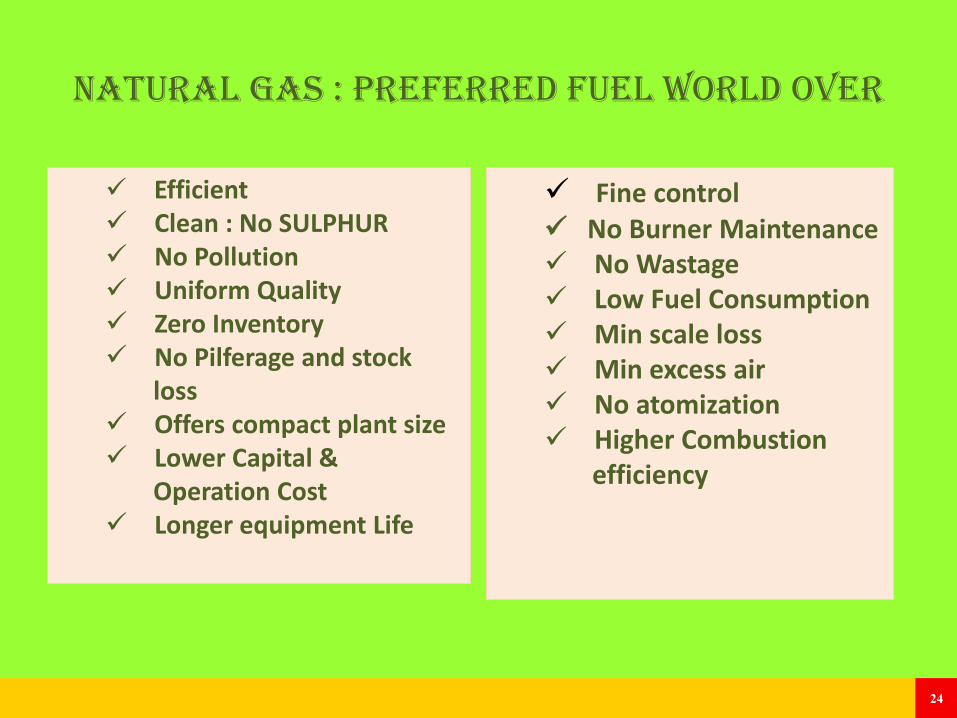
NATURAL GAS : PREFERRED FUEL World over
Efficient Clean : No SULPHUR No Pollution Uniform Quality Zero Inventory No Pilferage and stock
loss Offers compact plant size Lower Capital &
Operation Cost Longer equipment Life
Fine control No Burner Maintenance No Wastage Low Fuel Consumption Min scale loss Min excess air No atomization Higher Combustion
efficiency
25
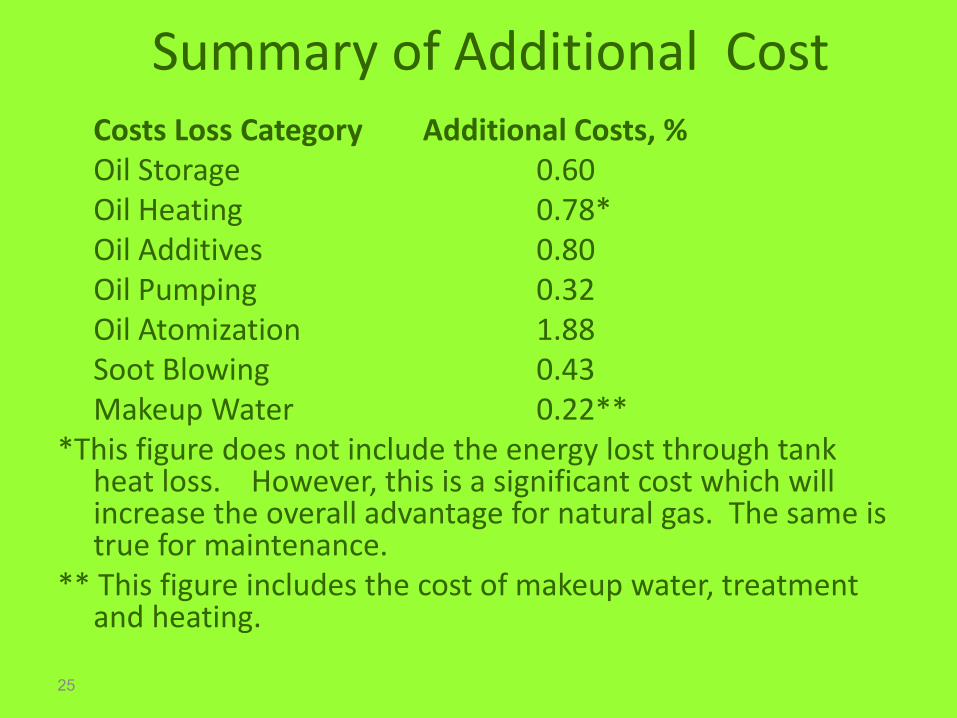
Summary of Additional Cost Costs Loss Category Additional Costs, % Oil Storage 0.60 Oil Heating 0.78* Oil Additives 0.80 Oil Pumping 0.32 Oil Atomization 1.88 Soot Blowing 0.43 Makeup Water 0.22** *This figure does not include the energy lost through tank
heat loss. However, this is a significant cost which will increase the overall advantage for natural gas. The same is true for maintenance.
** This figure includes the cost of makeup water, treatment and heating.

26
1. Registration of Customer wise Intent for
Gas Supply from GAIL through PD format
2. Assessment of Customer’s gas demand
3. Techno- Commercial Evaluation by GAIL
4. Signing of Gas Sales Agreement/Gas Transmission Agreement
ROAD MAP FOR GAS SUPPLY
27
Estimating the Gas Demand

Estimate Your Own Gas Requirement
Steps
1.Workout Daily consumption of Existing Fuel.
2.Standard Conversions for in Gas Industry
1 SCM = 9880 Kcal, 1 MMBTU = 25.5 SCM
3 Calculate the Equivalent GAS requirement in SCM /Day
• Note NCV of R-LNG is around 8500 Kcal/SCM
Daily Consumption of Fuel in kg x GCV of Fuel (kcal/kg)
GCV of R-LNG (@9880 KCAL/SCM) =
29
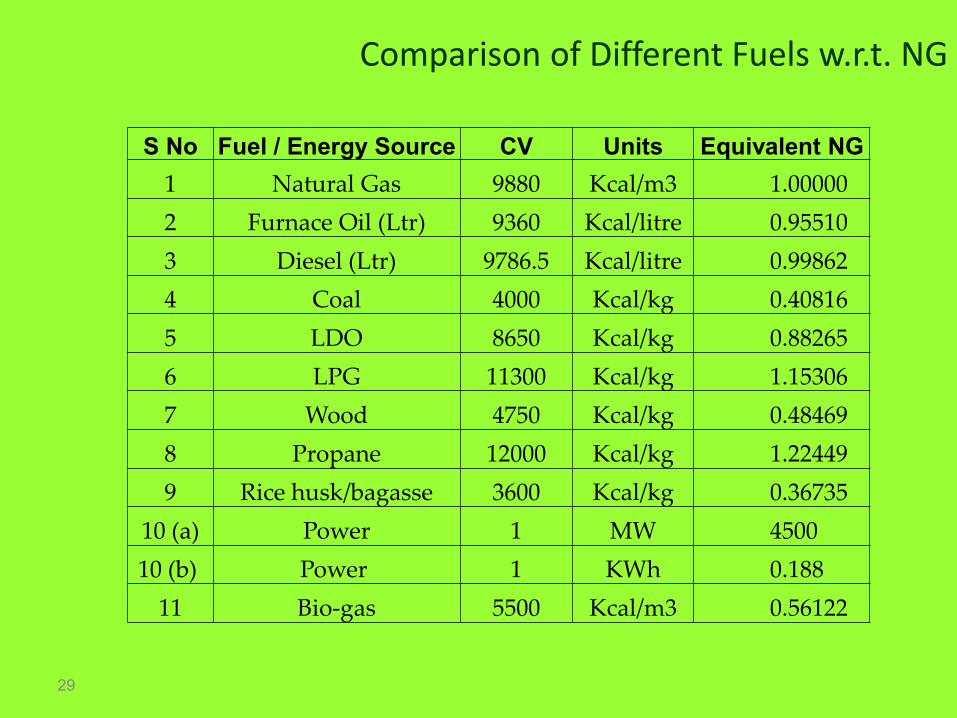
Comparison of Different Fuels w.r.t. NG
S No Fuel / Energy Source CV Units Equivalent NG
1 Natural Gas 9880 Kcal/m3 1.00000
2 Furnace Oil (Ltr) 9360 Kcal/litre 0.95510
3 Diesel (Ltr) 9786.5 Kcal/litre 0.99862
4 Coal 4000 Kcal/kg 0.40816
5 LDO 8650 Kcal/kg 0.88265
6 LPG 11300 Kcal/kg 1.15306
7 Wood 4750 Kcal/kg 0.48469
8 Propane 12000 Kcal/kg 1.22449
9 Rice husk/bagasse 3600 Kcal/kg 0.36735
10 (a) Power 1 MW 4500
10 (b) Power 1 KWh 0.188
11 Bio-gas 5500 Kcal/m3 0.56122

NATURAL GAS ESTIMATION S.No Type of Fuel Quantity of Fuel
(Per Day) Equivalent SCMD
of Natural Gas
1 FO 1000 Ltrs 1000
2 PROPANE 1000 KG 1225
3 LPG 1000 KG 1150
4 DIESEL 1000 Ltrs 9986
31
An Overview of GAIL’s Gas Business in Rajasthan
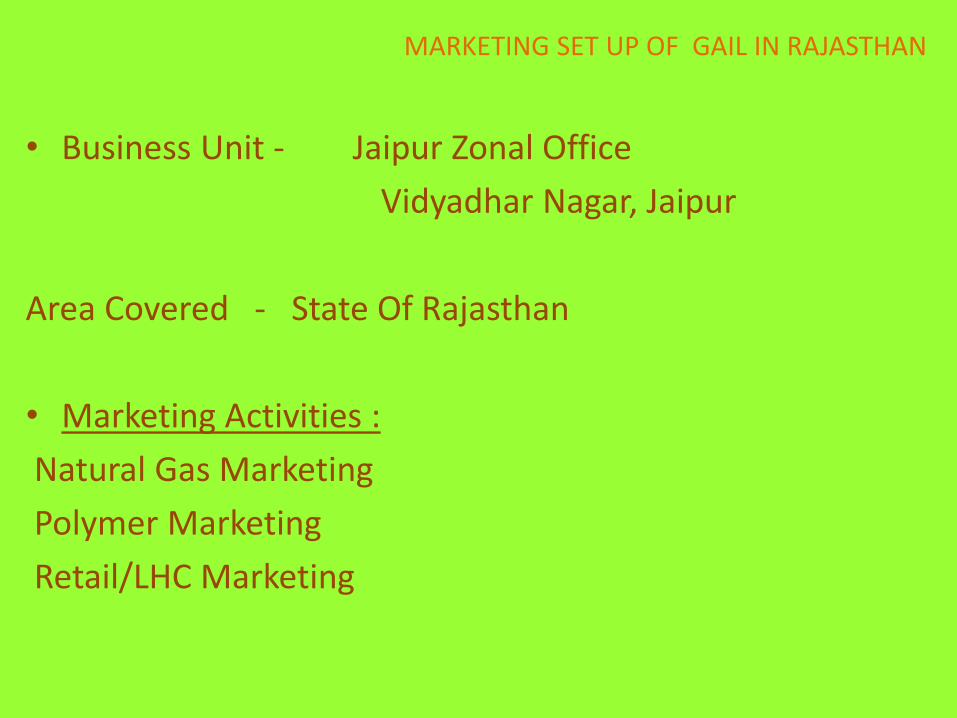
MARKETING SET UP OF GAIL IN RAJASTHAN
• Business Unit - Jaipur Zonal Office
Vidyadhar Nagar, Jaipur
Area Covered - State Of Rajasthan
• Marketing Activities :
Natural Gas Marketing
Polymer Marketing
Retail/LHC Marketing
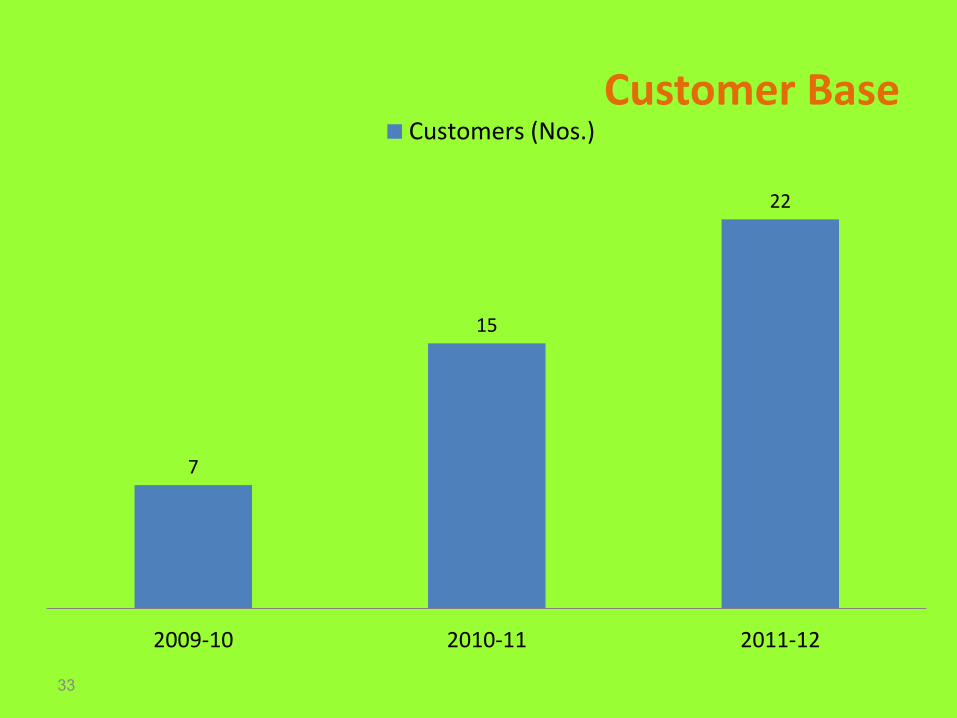
Customer Base
33
7
15
22
2009-10 2010-11 2011-12
Customers (Nos.)
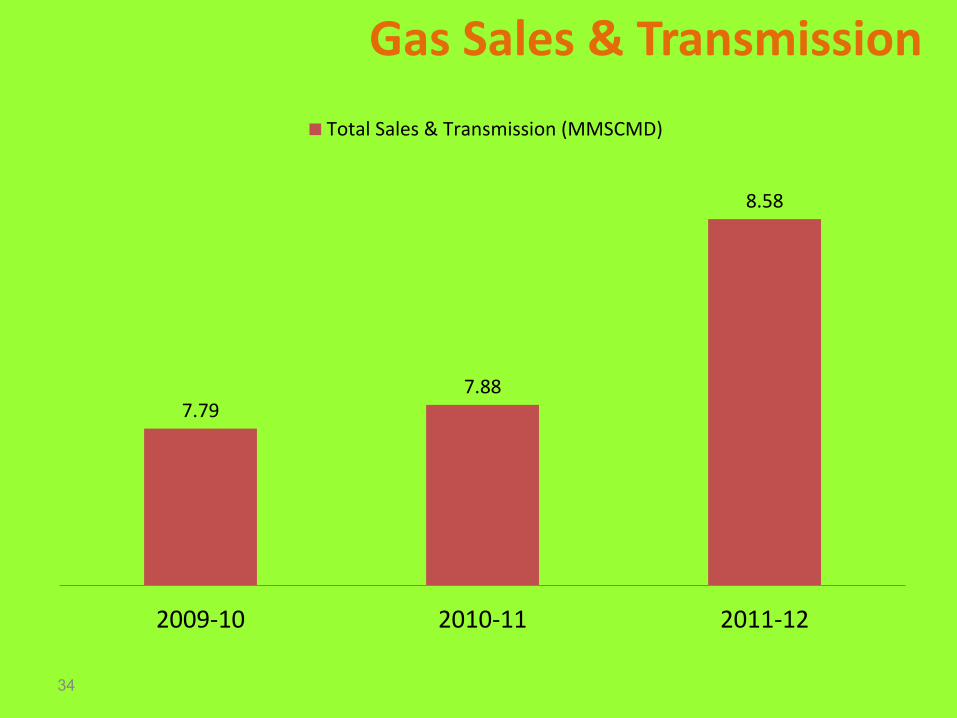
Gas Sales & Transmission
34
7.79 7.88
8.58
2009-10 2010-11 2011-12
Total Sales & Transmission (MMSCMD)

35
Existing Pipeline Network In Rajasthan
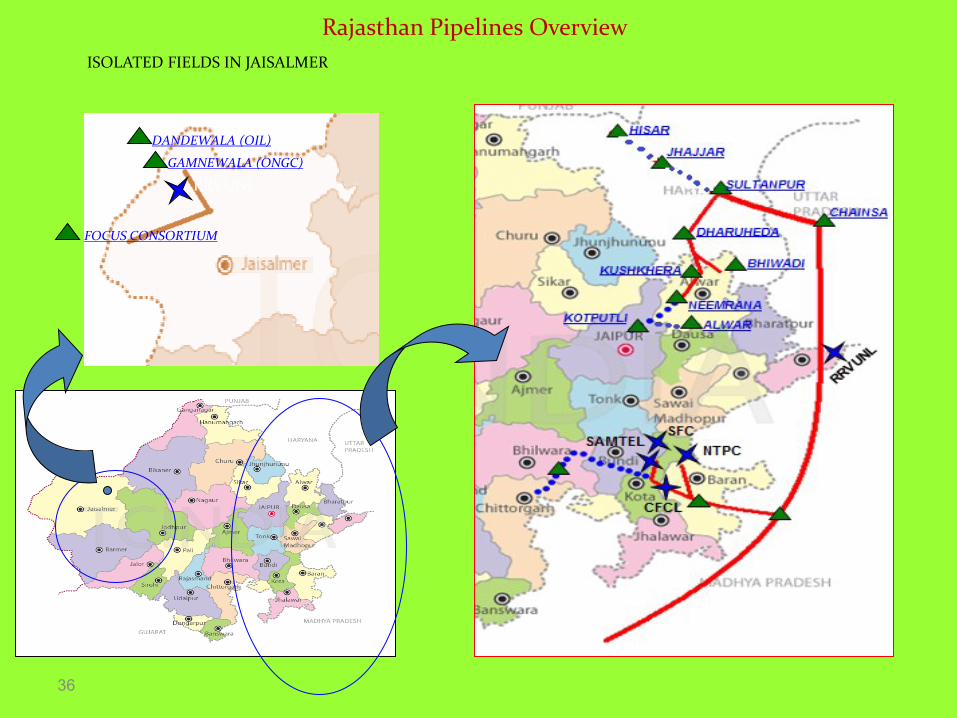
36
DANDEWALA (OIL)
ISOLATED FIELDS IN JAISALMER
RRVUNL
GAMNEWALA (ONGC)
FOCUS CONSORTIUM
Rajasthan Pipelines Overview

VIJAIPUR – KOTA P/L (VKPL)
Legends:- EXISTING P/L PROPOSED P/L
PROSPECTIVE CUSTOMER
EXSITING CUST/TERMINAL DEMAND AREA FROM TEXTILE, CEMENT ETC.
NTPC
VIJAIPUR
RRVUNL, CHABRA, 1.7 MMSCMD
SFCL
RRVUNL, KOTA, 1.7 MMSCMD
RRVUNL, KESORAIPATAN, 5.1 MMSCMD
CHAMBAL
SAMTEL
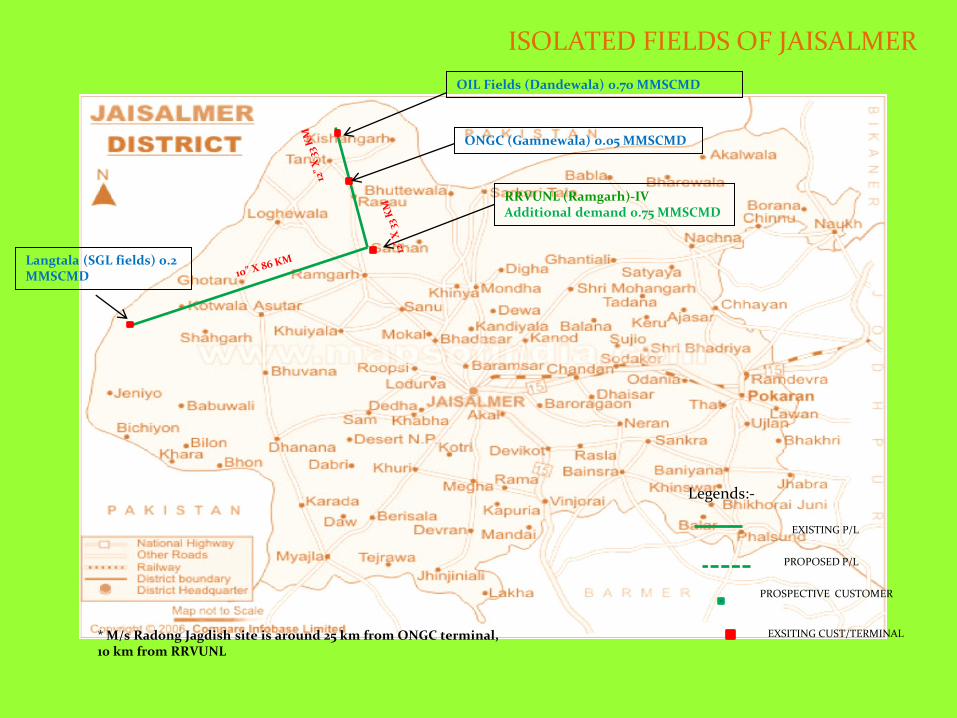
ISOLATED FIELDS OF JAISALMER
Legends:-
EXISTING P/L
PROPOSED P/L
RRVUNL (Ramgarh)-IV Additional demand 0.75 MMSCMD
ONGC (Gamnewala) 0.05 MMSCMD
OIL Fields (Dandewala) 0.70 MMSCMD
Langtala (SGL fields) 0.2 MMSCMD
PROSPECTIVE CUSTOMER
* M/s Radong Jagdish site is around 25 km from ONGC terminal, 10 km from RRVUNL
EXSITING CUST/TERMINAL

39
DADRI
CHAINSA
ROUTE MAP FOR CHAINSA-GURGAON-JHAJJAR-HISSAR PIPELINE
GURGAON
JHAJJAR
HISAR
DARUHERA
NEEMRANA
KHUSKERA
MANESAR
BHIWADI
CHAUPANKI
GREP P/L FROM
VIJAIPUR
PROPOSED
CGJH P/L
BANAULI
Size & Length: 36”x 90
Km,20”x111 Km, 18”x84 Km,
Spurline: 150 Km
Capacity: 30 MMSCMD
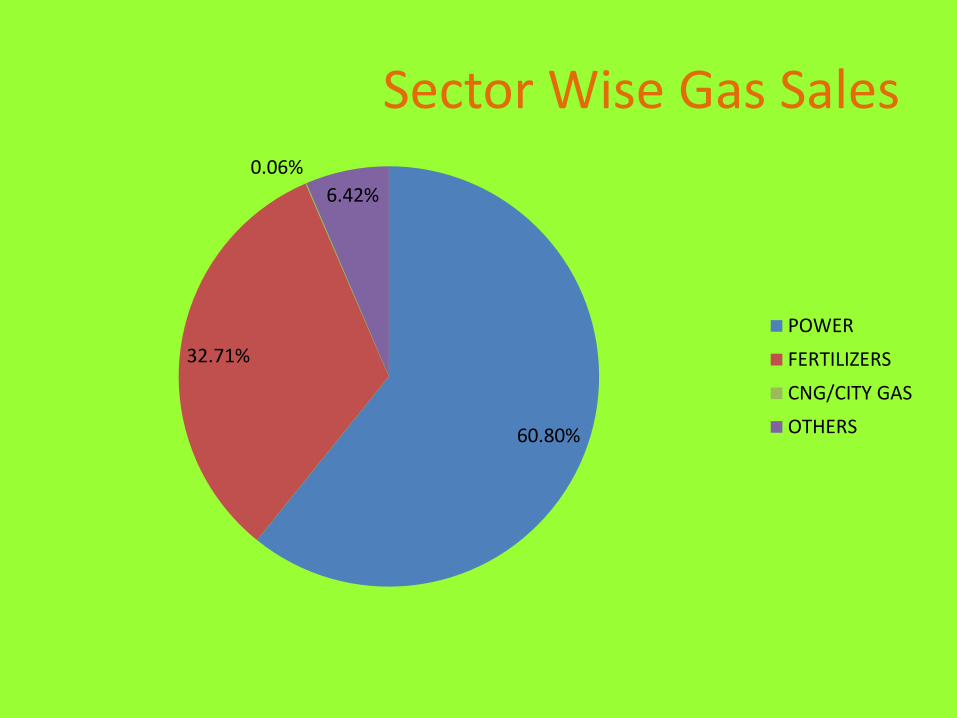
Sector Wise Gas Sales
60.80%
32.71%
0.06%
6.42%
POWER
FERTILIZERS
CNG/CITY GAS
OTHERS
41
GAIL : Future Outlook of Gas Business in Rajasthan
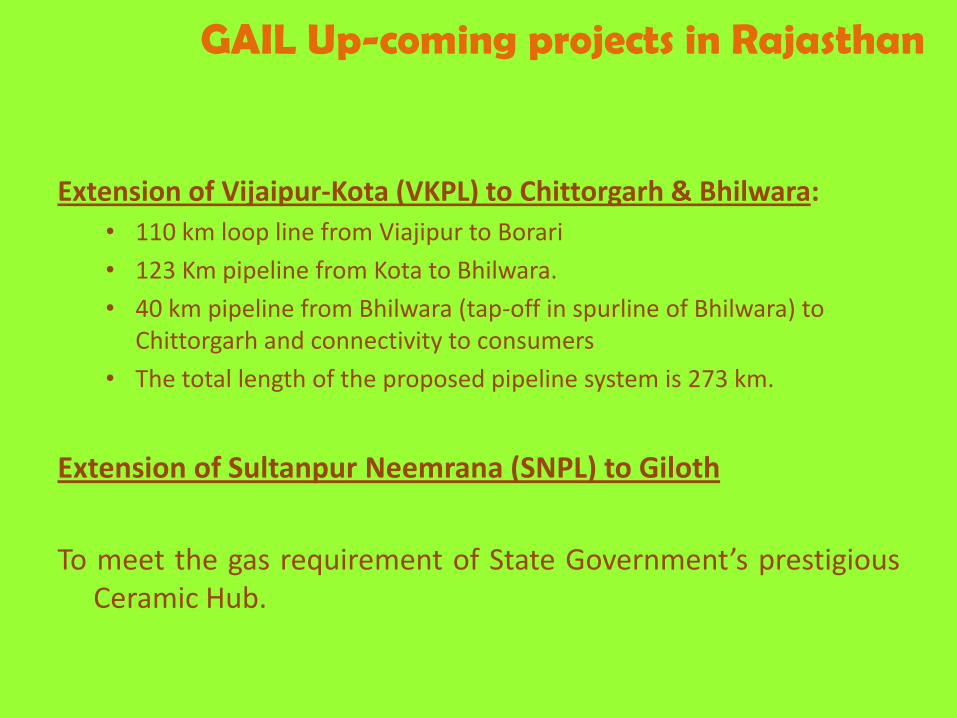
GAIL Up-coming projects in Rajasthan
Extension of Vijaipur-Kota (VKPL) to Chittorgarh & Bhilwara:
• 110 km loop line from Viajipur to Borari
• 123 Km pipeline from Kota to Bhilwara.
• 40 km pipeline from Bhilwara (tap-off in spurline of Bhilwara) to Chittorgarh and connectivity to consumers
• The total length of the proposed pipeline system is 273 km.
Extension of Sultanpur Neemrana (SNPL) to Giloth
To meet the gas requirement of State Government’s prestigious Ceramic Hub.

43
CONTACT US AT :
Sri S N Kumar, Zonal General Manager
08094839000
Sri Ranjan Dwivedi DGM(Marketing)
08094010042
Sri C S Madan Sr Mgr (Gas Mktg)
09610449518
Sri Rajesh Jain Sr Mgr (Gas Mktg)
09414059857