Wang Yao masters - TDL
62
ABSTRACT Wind-Turbine Generator for Load-Following and Its Applications to Primary Frequency Support and Small-Signal Stability Improvement Wang Yao, M.S. Mentor: Kwang Y. Lee, Ph.D. In today’s power grid, the penetration of wind energy has been increasing. Meanwhile, many relevant issues have been explored. Among them, a novel active power control strategy named load-following has been given attention recently. Conventionally, variable speed wind-turbine generators (WTGs) are controlled to work at the maximum power extraction point. However, the load-following method allows the WTGs to be de-loaded and sacrifice part of the wind power. This is meaningful in some stand-alone power systems where the energy should be limited to match the local load demand. This thesis continues to investigate a better load-following method for the wind farm. The problem of the rotor inertia of wind turbine is analyzed and solved with the Speed-Up/Down Averaging (SUDA) method. A configuration for a wind farm with improved load-following is then proposed. Based on this improved feature, two applications in terms of primary frequency support and small-signal stability support are investigated.
Transcript of Wang Yao masters - TDL

ABSTRACT Wind-Turbine Generator for Load-Following and Its Applications to Primary Frequency
Support and Small-Signal Stability Improvement
Wang Yao, M.S.
Mentor: Kwang Y. Lee, Ph.D.
In today’s power grid, the penetration of wind energy has been increasing.
Meanwhile, many relevant issues have been explored. Among them, a novel active
power control strategy named load-following has been given attention recently.
Conventionally, variable speed wind-turbine generators (WTGs) are controlled to work at
the maximum power extraction point. However, the load-following method allows the
WTGs to be de-loaded and sacrifice part of the wind power. This is meaningful in some
stand-alone power systems where the energy should be limited to match the local load
demand. This thesis continues to investigate a better load-following method for the wind
farm. The problem of the rotor inertia of wind turbine is analyzed and solved with the
Speed-Up/Down Averaging (SUDA) method. A configuration for a wind farm with
improved load-following is then proposed. Based on this improved feature, two
applications in terms of primary frequency support and small-signal stability support are
investigated.
Page bearing signatures is kept on file in the Graduate School.
Wind-Turbine Generator for Load-Following and Its Applications to Primary Frequency Support and Small-Signal Stability Improvement
by
Wang Yao, B.S.
A Thesis
Approved by the Department of Electrical and Computer Engineering
___________________________________Kwang Y. Lee, Ph.D., Chairperson
Submitted to the Graduate Faculty of Baylor University in Partial Fulfillment of the
Requirements for the Degree of
Master of Science in Electrical and Computer Engineering
Approved by the Thesis Committee
___________________________________Kwang Y. Lee, Ph.D., Chairperson
___________________________________Kenneth Van Treuren, Ph.D.
___________________________________Ian Gravagne, Ph.D.
Accepted by the Graduate School August 2011
___________________________________J. Larry Lyon, Ph.D., Dean

Copyright © 2011 by Wang Yao
All rights reserved
iii
TABLE OF CONTENTS �LIST OF FIGURES v LIST OF ABBREVIATIONS vii LIST OF TABLES viii NOMENCLATURE ix ACKNOWLEDGMENTS xi DEDICATION xii CHAPTER ONE 1�
Introduction 1 CHAPTER TWO 6�
Wind Turbine Generator Active Power Control 6�Overview 6�Conventional Active Power Control 6�Generator Side AC/DC Converter 11�DC-Link and Grid Side DC/AC Converter 11
CHAPTER THREE 14�
Wind-Farm Configuration for Improved Load-Following Control 14�Load-Following Control 14�Rotor Inertia of Wind Turbine 15�Configuration of Wind Farm with Improved Load-Following Feature 16
CHAPTER FOUR 20�
Application of the Improved Load-Following Control 20�Primary Frequency Support 20�Small-Signal Stability Support 23
CHAPTER FIVE 30�
Simulation Studies 30�Model of the Wind-Turbine Generator 30�Load-Following Test 32�Primary Frequency Support Test 37�Small-Signal Stability Analysis 40

iv
CHAPTER SIX 45�Conclusions 45
BIBLIOGRAPHY 47�

v
LIST OF FIGURES Figure 1: Year-End Installed Wind Capacity in U.S.A. [1]. 1 Figure 2: Wind Power Coefficient Curve [17]. 9 Figure 3: General Power Curve for a WTG [8]. 9 Figure 4: Maximum Power Point Tracking Scheme of the WTG. 10 Figure 5: Configuration of a WTG with a Full-Scale Converter [8]. 11 Figure 6: Schematic of Generator Operation Control. 11 Figure 7: Schematic of DC-Link Power Flow [8]. 12 Figure 8: Schematic of Grid Side PWM Control [8]. 13 Figure 9: Calculation of Rotor Speed Reference for Load-Following Mode [10]. 14 Figure 10: Power Coefficient/Tip-Speed Ratio with Pitch Angle=0 [17]. 17 Figure 11: Schematic of Speed-Up and Speed-Down Methods. 18 Figure 12: Governor with Steady-State Feedback [2]. 21 Figure 13: Schematic of Transfer Function with Steady-State Feedback [2]. 21 Figure 14: Frequency Support Scheme with Droop-Speed Control [7]. 22 Figure 15: Frequency Support Scheme with Droop-Speed Control of WTG [2]. 23 Figure 16: Schematic of a Thyristor Excitation System with PSS [2]. 24 Figure 17: Single-Machine Infinite-Bus System. 25 Figure 18: Schematic of Torque Change Followed By a Perturbation [2]. 26 Figure 19: Single-Machine Infinite-Bus System with Wind Farm. 27 Figure 20: Schematic of Frequency-Based PSS 27 Figure 21: Schematic of Torque Change with Frequency Controller. 28

vi
Figure 22: Schematic of Torque Change Combined with Frequency Controller. 29 Figure 23: Schematic of the Overall GE WTG Model. 30 Figure 24: Schematic of the Turbine/Turbine Control Model. 31 Figure 25: Schematic of the Electrical Control Model. 31 Figure 26: Schematic of the Generator/Converter Model. 32 Figure 27: Speed-Down Method Working Zone. 33 Figure 28: Load-Following Curves with Speed below the Optimal Operating Point. 34 Figure 29: Speed-Up Method Working Zone. 35 Figure 30: Load-Following Curves with Speed above the Optimal Operation Point. 35 Figure 31: Load-Following Curves of the Proposed Configuration. 36 Figure 32: Wind Farm Directly Connected to the Infinite Bus. 37 Figure 33: Frequency Support Feature with/without Controller. 38 Figure 34: IEEE 3-Machine 9-Bus System. 39 Figure 35: System’s Frequency Deviation under Different Cases. 40 Figure 36: Single-Machine Infinite-Bus System with Wind Farm. 41 Figure 37: Frequency Deviation without Frequency Controller. 42 Figure 38: Frequency Deviation with Frequency Controller. 42 Figure 39: Active Power Output of Wind Farm without Frequency Controller. 43 Figure 40: Active Power Output of Wind Farm with Frequency Controller. 43�

vii
LIST OF ABBREVIATIONS AC – Alternating Current DC – Direct Current IGBT – Insulated-gate Bipolar Transistor PI – Proportional Integral PSS – Power System Stabilizer PWM – Pulse-width Modulation SUDA – Speed Up/Down Averaging WTG – Wind Turbine Generator

viii
LIST OF TABLES Table 1: Cp Coefficients �ij [14] 7�

ix
NOMENCLATURE A – Swept area of the rotor of the wind turbine [m2] C – The capacitance of the DC-link capacitor [F] Cp – Power coefficient of the wind turbine �E – The kinetic energy released/absorbed by the rotor of the wind turbine [J] �EA-B – The total kinetic energy exchange of the wind farm [J] H – Inertia constant Pair – Power in the air flow [W] PC – Active power that goes through the capacitor [W] Pg – Active power generated by the wind turbine generator [W] Pnet – Active power transferred to the grid [W] PWTG – Active power extracted by the wind turbine [W] R – The radius to tip of rotor [m] R – Gain of droop-speed control TD – The damping torque coefficient TS – The synchronizing torque coefficient � – Air density [kg/m3] v – Wind speed at hub height upstream [m/s] VDC – The DC-link voltage [V] Wg – The energy generated by the wind turbine [J] Wl – The energy required by the load [J] � – Pitch angle of the rotor blades [degree]

x
� – Tip-speed ratio �� – The rotor angle perturbation [rad] � – Rotational speed of the rotor [rad/sec] �NL – Steady-state speed at no load [rad/sec] �FL – Steady state speed at full load [rad/sec] �0 – Rated speed [rad/sec] �� – The speed deviation [rad]

xi
ACKNOWLEDGMENTS
I would like to thank Professor Kwang Y. Lee for all the support and help he has
been giving me throughout my graduate study and research. I also would like to thank
Dr. Kenneth Van Treuren and Dr. Ian Gravagne for being my thesis committee members
and reviewing my thesis.
Many thanks to Dr. Michael Thompson for the help he has given me during my
graduate study. Many thanks to Ms. Alexine Burke, who is the international student
advisor, for the help she has given me as I am studying as an international student at
Baylor University. I also would like to thank Jack Chen, who is my PAWS partner, for
being my great friend and seeing me as his family as I am staying in the United States.
Lastly, I would like to thank the Department of Electrical and Computer Engineering and
Baylor University.

xii
DEDICATION
To my parents

1
CHAPTER ONE
Introduction
The utilization of wind energy has been increasing significantly in the past
decade. Wind energy is now playing a significant role in renewable energy production.
In the United States, the installed capacity of wind power has increased from 2,472 MW
in 1999 to 36,698 MW in 2010 [1]. The total year-end installed wind capacity in the past
twelve years is given in Figure 1.
Figure 1: Year-End Installed Wind Capacity in U.S.A. [1].
In the meantime, many challenging problems have emerged. One of these
challenges is the issue with frequency regulation with a growing wind energy penetration.
For the satisfactory operation of an AC power system, the system’s frequency should
1999 2000 2001 2002 2003 2004 2005 2006 2007 2008 2009 20100
0.5
1
1.5
2
2.5
3
3.5
4x 10⁴
Year
Win
d P
ower
Cap
acity
(MW
)
2
remain nearly constant at its nominal value. To regulate the system’s frequency at its
nominal value within an allowable range, the generation is adjusted in real time to
compensate for the load deviation [2]. However, since the wind is intermittent in nature,
the wind power varies with wind speed and consequently, the wind power is not able to
contribute to the frequency regulation. This is not an issue when the wind energy
penetration is low and frequency regulation can be regulated by other conventional power
sources. However, when the penetration increases, the limited predictability and
relatively high variations of wind power will challenge today’s operating and planning
practices [3-5]. Significant operating reserves will be required due to load and wind
power uncertainties [6]. This will directly increase the cost of power scheduling. In
addition, the frequency regulation issue becomes more important when wind power is
used on a micro-grid or a stand-alone power system [7]. In some energy limited micro-
grids, the ability of the frequency regulation of the conventional generators is limited and
the wind-turbine generators (WTGs) should only generate the power required. For a
stand-alone power system such as the Hawaii power system, there is no interconnection
with any other power grid and no additional support can be provided. Hence, this system
is more sensitive to the power imbalances, which results in lower minimum frequency
and compromises the system’s frequency stability, especially in case of a contingency
such as a loss of generation [3]. Thus, it would be helpful if the wind power can be
adjusted according to the load demand and contribute to the frequency regulation.
Conventionally, a variable-speed wind-turbine generator (WTG) is controlled to
work at the maximum power extraction point. This means the output active power varies
with the wind speed. To require frequency regulation, the output active power of WTGs

3
needs to be adjusted according to the load demand. The main principle currently
proposed is to sacrifice a fraction of the available active power to realize the load-
following. The WTG is de-loaded by operating it away from the maximum power
extraction point and then use this margin for power adjustment [7], [8]. Pitch angle
control and rotor speed control have been investigated recently to de-load the WTG and
help with frequency regulation [8], [9].
A novel load-following concept is proposed by Colson and Nehrir to control the
output active power of the WTG [10]. Instead of frequently changing pitch angle which
can cause undesirable mechanical vibrations and unnecessary mechanical maintenance of
some parts, a rotor speed control strategy is recommended. In this strategy, the pitch
angle control is only an independent safety mechanism and used to limit the power under
very high wind speed. However, since the main source of power for the WTG, the wind,
is not controllable and fluctuates with time, the performance of rotor speed control is not
as satisfactory as that of the turbine governor control used in a normal synchronous
generator system. In fact, the rotor inertia of the wind turbine becomes an issue if the
output active power needs to be controlled by manipulating the rotor speed. As the
capacity of a WTG increases, the overall dimensions increase, resulting in relatively large
rotor inertia. Large inertia will cause undesired generator response and significant energy
exchange between rotor kinetic energy and generator electric energy during operation. It
is possible that the inertia problem can be solved by using energy storage devices such as
batteries and ultra-capacitors. However, additional parts and control strategies are
required and will result in an increase in the cost.

4
The purpose of this thesis is to propose a control strategy for a wind farm to
mitigate the overall effect of the rotor inertia. The wind farm then realizes a much better
load-following performance and then is able to participate in frequency regulation. In
principle, instead of giving all WTGs in a wind farm the same rotor speed reference
obtained at the maximum power extraction point, the proposed wind farm allows
different WTGs operate at different rotor speed. Specifically, for an approximately
symmetric power coefficient curve, half of WTGs in a wind farm operate at a speed
above the maximum power speed while another half at the speed below the maximum
power speed, given the fact that the operating speed is within the allowable speed range.
This Speed-Up/Down Averaging (SUDA) method significantly improves the load-
following ability.
In addition, along with the improved load-following feature, two important
applications are proposed. First, a frequency controller can be integrated into the wind
farm to enable its primary frequency regulation. The controller introduces a
supplemental control loop, which makes the active power control of the WTGs dependent
on the grid frequency [7]. Second, in some power systems, the frequency controller can
act as a power system stabilizer, which adds more damping to the system and improves
its small-signal stability [11].
This thesis is organized as follows: Chapter Two gives an introduction to a
synchronous generator based full-scale WTG system and the conventional active power
control strategy. In Chapter Three, the load-following control is investigated and the
rotor inertia issue of the wind turbine is introduced. A control strategy for the wind farm
solving this problem is proposed. Chapter Four gives two relevant applications of the

5
improved load-following feature: a frequency controller for primary frequency support
and a power system stabilizer for small-signal stability improvement. Simulation studies
are presented in detail in Chapter Five. Finally, conclusions are given in Chapter Six.
6
CHAPTER TWO
Wind Turbine Generator Active Power Control
Overview
In the early 1990s, fixed-speed wind-turbine generators were often used because
they were electrically simple. However, since they are working at fixed speed, regardless
of wind speed, the efficiency of wind power extraction is relatively low [12], [13]. As
the size of wind turbines has become larger and the penetration of wind energy increases,
more and more researchers have focused on variable-speed wind-turbine generators
which are able to track the maximum power to improve the output efficiency. In this
thesis, the model will be based on a variable-speed wind turbine with a synchronous
generator and a full-scale power converter, which has been given more attention recently
[14], [15].
Conventional Active Power Control
In general, WTGs are controlled in a way that maximum power can be extracted
from wind. The power in the airflow is given by [8]
3
21 AvPair �� (1)
where � is the air density, A is the swept area of rotor and v is the wind speed at the hub
height [16]. However, the power transferred to wind turbine is characterized by the
power coefficient, Cp. A maximum value of Cp is defined by Betz limit, which states that
59.3% is an upper limit of power that a turbine can extract power from an air stream [8].

7
There are many approximate calculations developed for Cp. For this study, Cp is
given by [14]
��� �
�4
0
4
0,),(
i j
jijipC ����� (2)
The coefficients ji ,� are given in Table 1.
Table 1: Cp Coefficients �ij [14]
i j �ij i j �ij 4 4 4.9686e-010 2 1 -1.0996e-002 4 3 -7.1535e-008 2 0 1.5727e-002 4 2 1.6167e-006 1 4 -2.3895e-005 4 1 -9.4839e-006 1 3 1.0683e-003 4 0 1.4787e-005 1 2 -1.3934e-002 3 4 -8.9194e-008 1 1 6.0405e-002 3 3 5.9924e-006 1 0 6.7606e-002 3 2 -1.0479e-004 0 4 1.1524e-005 3 1 5.7051e-004 0 3 -1.3365e-004 3 0 -8.6018e-004 0 2 -1.2406e-002 2 4 2.7937e-006 0 1 2.1808e-001 2 3 -1.4855e-004 0 0 -4.1909e-001 2 2 2.1495e-003
Here, � is the pitch angle of rotor blades and � is the tip-speed ratio, which is
defined as [8]
vr�� � (4)
where � is the rotational speed of rotor, r is the radius to tip of rotor. Hence, it is clear
that the power the wind turbine can extract from the wind is
airpWTG PCP ),( ��� (5)

8
In practice, in order to maximize the amount of power extracted from the wind,
the control system keeps Cp at an optimal value. Figure 2 shows the power
coefficient/tip-speed ratio curves at different pitch angles [17]. The purpose of
conventional speed control strategy is to maintain the rotor speed at the optimal operating
point, which corresponds to the highest power coefficient value at a specific pitch angle.
Conventionally, for a variable speed WTG, the pitch angle is maintained at zero to get the
highest coefficient value. However, if the wind speed is too high, the pitch angle will
increase to limit the mechanical power extracted from the wind. This is important to
keep the mechanical loads on the drive train within a safety limit and, more essentially,
the rated power of the generator and converter circuit will not be exceeded.
Figure 3 shows an example of a power curve of a WTG with different wind
speeds. The cut-in wind speed, Vin, is the minimum wind speed at which the WTG will
deliver useful power. Vrated is the rated wind speed at which the rated power is generated.
For an electric generator, the rated power is generally the maximum power output. The
cut-out wind speed, Vout, is the maximum wind speed at which the WTG is allowed to
work. Generally, when the wind speed is between cut-in speed and rated speed, the WTG
is controlled to track the optimal operating point. When the wind speed is above rated
speed, the pitch angle will increase to lower the power coefficient Cp. At very high wind
speeds which are above the cut-out speed, the WTG is then shut down [8].

9
Figure 2: Wind Power Coefficient Curve [17].
Figure 3: General Power Curve for a WTG [8].

10
Figure 4 shows the maximum power point tracking scheme of the WTG. For a
given wind speed, there is a unique wind-turbine speed corresponding to the maximum
power output. If the wind speed changes, the wind-turbine will be controlled to reach the
corresponding optimal speed, in which case the maximum power output is assured. As
Figure 4 shows, if the wind speed increases from v1 to v2, the rotor will be controlled to
speed up from �1 to �2. The maximum output power then increases from P1 to P2. A
similar process applies if the wind speed decreases from v3 to v2, in which case the
maximum output power decreases from P3 to P2.
Figure 4: Maximum Power Point Tracking Scheme of the WTG.
A WTG with a full-scale converter is shown in Figure 5. This WTG system
consists of a wind turbine, a synchronous generator connected to a full-scale power
conditioning system (PCS). The PCS consists of a diode rectifier, a DC-DC IGBT-based
PWM boost converter and a DC/AC IGBT-based PWM converter. The control strategy
is realized by modification of a controller proposed by several studies in [8], [14], [18].

11
Figure 5: Configuration of a WTG with a Full-Scale Converter [8].
Generator Side AC/DC Converter
The DC-DC boost is used to control the operation of generator as shown in
Figure. 5. The rotor speed, �, is measured and compared with the reference value �ref,
which is obtained at the optimal operation point. The speed difference passes through a
PI controller and a PWM generator, which produces a duty-ratio signal. The duty-ratio
signal controls the output power of the boost converter, which ultimately transfers the
power to the DC-link.
Figure 6: Schematic of Generator Operation Control.
DC-Link and Grid Side DC/AC Converter
Figure 6 shows the power balance at the DC-link [8]. It is noted that the power
transferred to the grid, Pnet, can be express as follows

12
Cgnet PPP � (6)
where PC is the power that goes through the capacitor and Pg is the active power
generated by the WTG. PC is given as [8]
dtdVCVP DC
DCC � (7)
where C is the capacitance of the DC-link capacitor and VDC is the DC-link voltage. By
maintaining VDC at a reference value, it is assured that most active power generated by
the WTG will be delivered to the grid (with a small part of the energy stored in the
capacitor).
Figure 7: Schematic of DC-Link Power Flow [8].
The network-side converter is a DC/AC IGBT-based PWM converter. In
principle, the converter is controlled to maintain the DC-link voltage. In addition, it is
also designed to allow the exchange of reactive power between the converter and the grid
to regulate the grid-side voltage. Figure 7 shows the grid side converter control scheme
in the dq-frame [8].

13
Figure 8: Schematic of Grid Side PWM Control [8].
The DC-link voltage is maintained by controlling the q-axis current and the grid-
side voltage is controlled in the d-axis. Current error signals pass through PI controllers
and then decoupling components, associtated with Xnet, are added to eliminate the
coupling effect between the two axes. Then dq components of the grid-side voltage are
added to generate the required voltage components at the terminals of the grid-side.
Some relevant references introducing this control strategy in detail can be found in [8].

14
CHAPTER THREE
Wind-Farm Configuration for Improved Load-Following Control
Load-Following Control
A novel way to implement the WTG load-following is by controlling the rotor
speed. An idea has been proposed and investigated in detail by Colson and Nehrir [10].
Instead of always extracting the maximum power from wind, a margin is reserved for
power adjustment by operating the WTG away from the optimal operating point. In the
conventional control strategy, the rotor speed reference is obtained by the power
coefficient/tip-speed ratio curve. However, in this load-following mode, depending on
how much power the load needs, the WTG is allowed to set different power coefficients
to enable the rotor to operate at different set points. Consequently, the rotor speed will be
operating at the desired set point and the output power can be changed accordingly. This
load-following mode allows the output power of a WTG to meet the load demand, as
long as it does not exceed the maximum power available from wind. Figure 8 shows the
determination of the reference rotor speed.
air
load
PP
Figure 9: Calculation of Rotor Speed Reference for Load-Following Mode [10].

15
The load demand, Pload, is compared with the power available in the wind, which
is denoted as Pair in (1). The new power coefficient value Cp then can be calculated
according to (5). With a given pitch angle, wind speed and radius, a rotor speed
reference �ref can be obtained according to Figure 8. The WTG is then controlled to
operate at the speed reference value in steady state. It is worth noticing that the pitch
angle control becomes an independent safety mechanism. The pitch angle is maintained
at zero unless the wind speed is very high and the mechanical power input should be
limited.
Rotor Inertia of Wind Turbine
However, this load-following mode will cause problems related to the rotor inertia
of wind turbines since it manipulates the rotor speed according to load demand. Suppose
the rotor speed changes from �1 to �2. If �1 > �2, the rotor slows down and the kinetic
energy stored in the rotor needs to be released with an amount
22
21 2
121 �� JJE � (8)
where J is the wind turbine rotational inertia [19], [20]. If �1 < �2, the rotor speeds up
and needs to absorb energy, with an amount -�E. In fact, considering an arbitrary load
demand curve P(t) with time duration from t1 to t2, the total energy required by load is
�� 2
1
)(t
tl dttPW (9)
By taking into account of the rotor inertia of wind turbine, the total energy
generated by the WTG will be

16
EdttPWt
tg �� �2
1
)( (10)
As Equation (10) shows, the energy exchange between rotor kinetic energy and
generator electric energy will cause the power imbalance during a rotor speed adjustment
process. For large size wind turbines (usually on MW level), the rotational inertia is
relatively large and the inertia effect has to be taken into account. As investigated in
[21], the kinetic energy could take up to 10% of the total energy generated when there is
a 40% rotor speed adjustment.
Configuration of Wind Farm with Improved Load-Following Feature
As mentioned above, there is always an energy exchange when the rotor speed
changes. This undesired energy exchange will be transferred into the grid since the DC
link voltage is controlled at a reference value to assure the power transfer. As discussed
by Colson and Nehrir [10], the output active power of a WTG can be adjusted either by
pitch angle control or rotor speed control. Since changing pitch angle too frequently will
result in mechanical vibrations and unnecessary mechanical maintenance, an alternate
approach of dealing with rotor speed is unavoidable if it is desired to adjust output active
power.
The proposed wind farm configuration takes into account the fact that the power
coefficient/tip-speed ratio function is not monotonic. In fact, it is approximately
symmetric with respect to the optimal operation point as shown in Figure 9. It means that
a given power coefficient value corresponds to two different tip-speed ratios, thus there
are two different rotor-speed references available. Consequently, the WTG can then be

17
de-loaded in two different ways, either by decreasing or increasing rotor speed from the
speed at the optimal operating point.
Specifically, the configuration options are analyzed in detail as three methods in
terms of Speed-Down method, Speed-Up method and Speed-Up/Down Averaging
(SUDA) method. The wind farm is assumed to consist of two WTGs which are equally
loaded. They are initially de-loaded to Cp = Cp1, then a load increase sigal comes and
they are required to increase the power coefficient to Cp = Cp2. The wind speed is kept as
constant in the analysis.
Figure 10: Power Coefficient/Tip-Speed Ratio with Pitch Angle=0 [17].
In the Speed Down method, the WTGs are de-loaded in such a way that the rotor
speed reference value is below the optimal operation point. As Figure 10 shows, the two

18
WTGs are de-loaded to point A, where �= �1 = �1r/v. If a load increase signal comes and
the WTGs are required to operate at point B, where �= �2= �2r/v, the rotor will speed up
from �1 to �2. During this speed adjustment process, the kinetic energy absorbed by
each rotor is given by
21
22 2
121 �� JJE BA � (11)
Figure 11: Schematic of Speed-Up and Speed-Down Methods.
The second option is Speed-Up method. In this method, the WTG is de-loaded in
such a way that the rotor speed reference value is above optimal operation point. As
Figure 10 shows, the two WTGs are de-loaded to point D, where �= �4 =�4r/v. If a load
increase signal comes and the WTGs are required to operate at point C, where � = �3

19
=�3r/v, the rotor will slow down from �4 to �3. During this speed adjustment process,
the kinetic energy released by each rotor is
23
24 2
121 �� JJE CD � (12)
From the analysis above it is noted that either Speed-Down method or Speed-Up
method will cause a kinetic energy change in the rotor, which affects the electric power
output of the WTG. Based on these two methods, a Speed Up/Down Averaging (SUDA)
method is proposed here. In this method, one of the WTGs uses Speed-Up method and
the other WTG uses Speed-Down method. During the speed adjustment process, the total
kinetic energy exchange of the wind farm becomes
CDBAWF EEE � (13)
Considering that the power coefficient curve is approximately symmetric with
respect to the optimal operating point, the value of �EWF is small, which means the net
effect of the rotor inertia of wind turbine can be greatly mitigated during speed
adjustment process. Thus, a better load-following curve can be achieved.
It is worth noticing that the SUDA method will be compromised if the wind
turbine has a relatively low rotor speed limit, which directly affects the operation margin
of those WTGs working in Speed Up method. However, more and more wind power
generation systems with are equipped with low-speed direct-drive WTG, whose operation
margin is greater than that of a generation system with a gearbox. With a full-scale
power converter, the scope of operating speed can be expanded to 0-150% of rated speed.
Goldwind Science and Technology Co. Ltd of China has developed 1.2-1.5 MW direct-
drive wind turbines and achieved great success in the practice [22].

20
CHAPTER FOUR
Application of the Improved Load-Following Control
Primary Frequency Support
For the satisfactory operation of an AC power system, the system’s frequency
should remain nearly constant at its nominal value. It requires a relatively close control
of the frequency to ensure constancy of the speed of induction and synchronous motors in
the system. In addition, a considerable drop in frequency could result in high
magnetizing currents in induction motors and transformers [2].
The system’s frequency deviation is a direct indication of an active power
imbalance between generation and load. To maintain the system’s frequency at its
nominal value within an allowable range, the generation is adjusted in real time to
compensate for the load deviation. There are two frequency control stages in power
systems: primary control at the generating units and secondary control at the dispatch
centers [2] [3]. Primary control in a power system is used to immediately react to an
active power imbalance. Figure 11 shows the schematic of a turbine with a speed
governor.
In Figure 11, Y is the Valve/Gate position and �r is rotor speed. The speed
governor will sense the rotor speed deviation. The speed deviation passes through an
amplifier with a gain of K and integrated to produce a control signal �Y, which adjusts
the power output by changing the valve/gate position. The steady-state feedback loop
with a gain of R is used to realize the speed-droop characteristic. The transfer function of
the governor is shown in Figure 12.

21
Figure 12: Governor with Steady-State Feedback [2].
GsT�11
R1
Figure 13: Schematic of Transfer Function with Steady-State Feedback [2].
In Figure 12, TG=1/KR. This proportional controller has a gain of 1/R. R is
expressed in percent as
%1000
���
����
� �
��� FLNLR (14)
where �NL is steady-state speed at no load, �FL is steady-state speed at full load and �0 is
nominal or rated speed.
The droop characteristic provides a stable operating point by driving the
generators to an off-nominal frequency in the absence of secondary control. The
secondary control, which is also referred to as load-frequency control or automatic
generation control, will drive the system frequency to its nominal value [3].
The variable-speed wind-turbine generator is isolated from the power grid
because the power converter decouples the network electrical frequency from the rotor

22
mechanical frequency. Thus, the WTG gives nearly no reaction to the system’s
frequency deviation. As the penetration of wind energy increases, the primary frequency
control performed by conventional generators, which take less proportion consequently,
will be adversely influenced. In fact, since wind power varies with wind, it requires more
compensation and control effort to maintain a given frequency than when only load
deviation exists. The improved load-following ability of the proposed wind farm
provides a possible way to support primary frequency control since a margin is reserved
for active power adjustment. More importantly, the wind farm is able to respond quickly
and accurately as the rotor inertia effect is mitigated.
The schematic of a primary frequency controller is shown in Figure 13 [7]. This
supplemental control loop makes the active power control of WTGs dependent on the
grid frequency. The measured system frequency, fs, is compared with a frequency
reference f0. The frequency deviation then decides the amount of output active power
that needs to be adjusted.
R1
Figure 14: Frequency Support Scheme with Droop-Speed Control [7].
With this controller implemented, WTGs are then able to respond to a system’s
frequency deviation like a conventional synchronous machine equipped with a speed
governor. The de-loaded WTGs can have a similar droop characteristic as conventional
generators as shown in Figure 14. For a conventional turbine governor, the droop

23
characteristic R is generally set to 5%, which means a 5% frequency deviation will cause
100% change in valve position or power output [2]. It is possible to set the droop
characteristic of WTG as the same with other conventional generators to let it participate
in load sharing when there is a sudden change in system load. However, it should be
noted that the power adjustment will be limited by the power output availability of wind
turbine. It depends on how much margin is reserved for power adjustment and the scope
of rotor speed.
Figure 15: Frequency Support Scheme with Droop-Speed Control of WTG [2].
Small-Signal Stability Support
As the penetration of wind energy increases, its effect on the system’s small-
signal stability becomes an issue. Small-signal stability is the ability of the power system
to maintain synchronism under small disturbances. Following a perturbation, the change
in electrical torque of a synchronous machine can be expressed as [2]
�� �� Dse TTT (15)
where �� is the rotor angle perturbation, TS is the synchronizing torque coefficient, �� is
the speed deviation and TD is the damping torque coefficient. The first component TS��
24
is referred to as the synchronizing torque and the second component TD�� is referred to
as the damping torque. Lack of sufficient synchronizing torque causes instability through
an aperiodic drift in generator’s rotor angle, while lack of sufficient damping torque
results in oscillatory instability. In today’s practical power systems, small-signal stability
is mainly a problem of insufficient damping of oscillations [2]. In power systems, the
power system stabilizer (PSS) is often equipped in the excitation system and used to
enhance the small signal stability. The excitation system provides direct current to the
synchronous machine field winding and performs control and protective functions. The
function of a PSS is to add damping to the generator rotor oscillations. Figure 15 shows
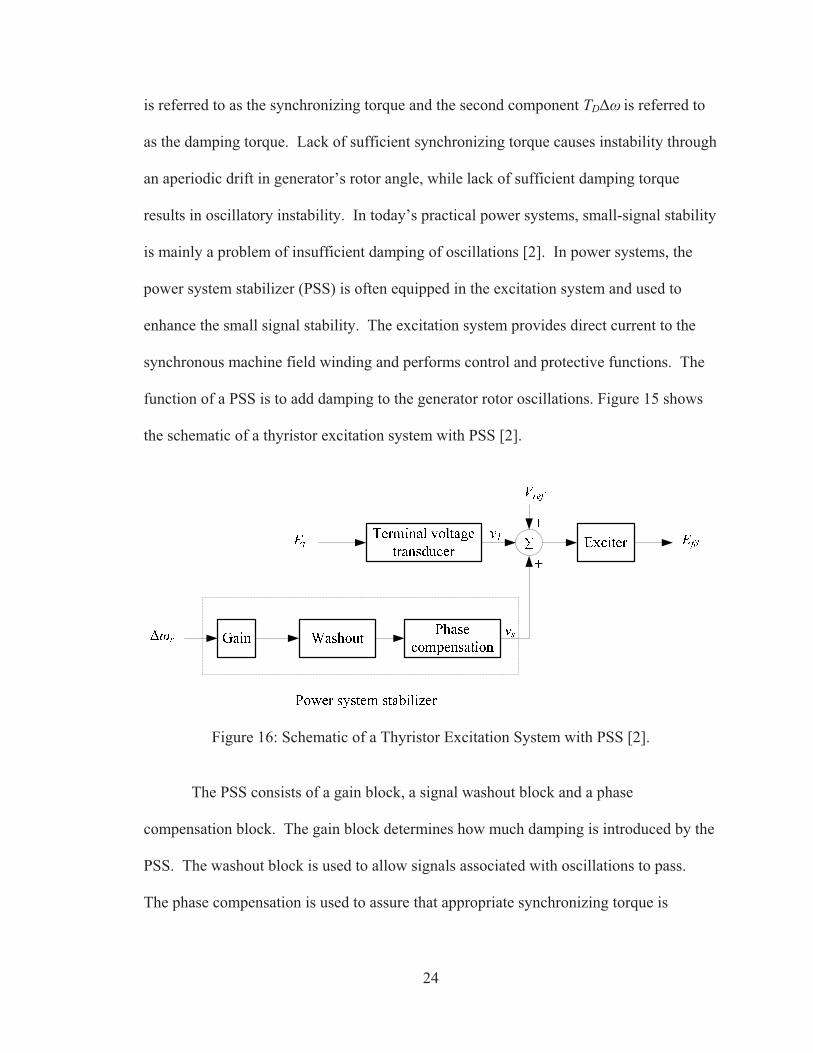
the schematic of a thyristor excitation system with PSS [2].
Figure 16: Schematic of a Thyristor Excitation System with PSS [2].
The PSS consists of a gain block, a signal washout block and a phase
compensation block. The gain block determines how much damping is introduced by the
PSS. The washout block is used to allow signals associated with oscillations to pass.
The phase compensation is used to assure that appropriate synchronizing torque is

25
generated. Consequently, the output signal of the PSS will affect the exciter and produce
a component of electrical torque in phase with the rotor speed deviations.
For a WTG system with full-scale converter, its mechanical dynamics are fully
decoupled from the electrical dynamics, which consequently compromises the system’s
electromechanical oscillations damping [23], [24]. On the other hand, the isolation also
disables the traditional PSS. To enable the WTG to contribute to small signal ability,
some other control strategy should be developed.
Small-signal stability problems may be either in local level or global level. In
today’s power systems, most encountered small-signal problems are associated with
oscillations in local level [2]. These oscillations are called local plant mode oscillations,
i.e., a single generator swing against the rest of the power system. Here, a single-
machine infinite-bus system, which can be considered as a equivalent model of a single
generator interconnected to a large power system, is investigated to analyze the
oscillation. As Figure 16 shows, a synchronous generator is connected to an infinite bus
through a transmission line. As shown in (15), following a perturbation, the change in
electrical torque of a synchronous machine, �Te, can be expressed as a combination of
two components: one component is torque change in phase with the rotor angle
perturbation, Ts��, the other is the component of torque in phase with the speed
deviation, TD��. The small-signal stability analysis is given in Figure 17 [2].
�
Figure 17: Single-Machine Infinite-Bus System.

26
In Figure 17, TS is synchronizing torque coefficient, TD is damping torque
coefficient, H is inertia constant, ��r is speed deviation, �� is rotor angle deviation and
�0 is rated speed. The damping ratio is given by [2]
0221
��
HTT
S
D� (16)
����Tm
��r
_+
_
TD
TS
Hs21
s0�
Figure 18: Schematic of Torque Change Followed By a Perturbation [2].
The proposed wind farm with a local load is added to the bus as Figure 18 shows.
The wind farm is represented by a typical single turbine, which is connected to a step-up
transformer at distribution level. The substation transformer then steps up the voltage to
transmission level.
27
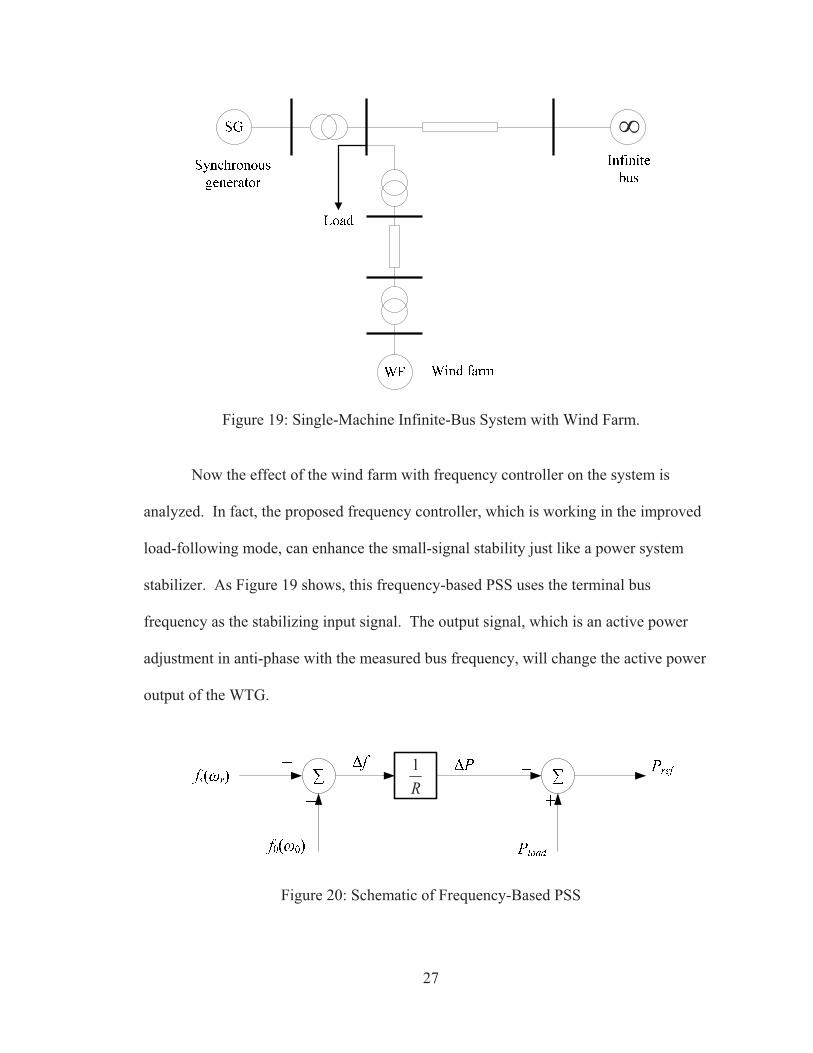
�
Figure 19: Single-Machine Infinite-Bus System with Wind Farm.
Now the effect of the wind farm with frequency controller on the system is
analyzed. In fact, the proposed frequency controller, which is working in the improved
load-following mode, can enhance the small-signal stability just like a power system
stabilizer. As Figure 19 shows, this frequency-based PSS uses the terminal bus
frequency as the stabilizing input signal. The output signal, which is an active power
adjustment in anti-phase with the measured bus frequency, will change the active power
output of the WTG.
R1
Figure 20: Schematic of Frequency-Based PSS

28
During oscillation, when the rotor of synchronous generator accelerates, the
frequency controller will decrease the output active power of WTG. Considering that the
total load remains the same, the electrical torque of the synchronous machine will
increase and tend to slow down the rotor to the rated speed. When the rotor slows down,
the frequency controller will increase the output active power of WTG, which decreases
the electrical torque of the synchronous machine and tends to speed up the rotor to the
rated speed. Hence, this process is identical to adding a feedback control loop with a gain
of TDW as shown in Figure 20 by dotted line.
Hs21
s0�
Figure 21: Schematic of Torque Change with Frequency Controller.
Consequently, this control loop can be combined with the original damping torque
component as Figure 21 shows. This leads to an increase in damping torque coefficient.

29
As Equation (16) shows, an increased damping torque coefficient will result in an
increased damping ratio. Hence, the system’s small signal stability is improved.
The concept of wind PSS was introduced in [11], which is similar to the
frequency controller proposed. It is worth noticing that a normally controlled WTG,
which works on the maximum power extraction mode, will not be able to fully respond to
this power adjustment since the power adjustment may exceed the maximum power
during the oscillation and the rotor inertia compromises the response of the WTG.
However, with the improved load-following mode, the wind farm is able to adjust its
active power output according to the power demand. Hence, it is possible to work as a
power system stabilizer and contributes to system’s small-signal stability.
Hs21
s0�
Figure 22: Schematic of Torque Change Combined with Frequency Controller.
30
CHAPTER FIVE
Simulation Studies
Model of the Wind-Turbine Generator
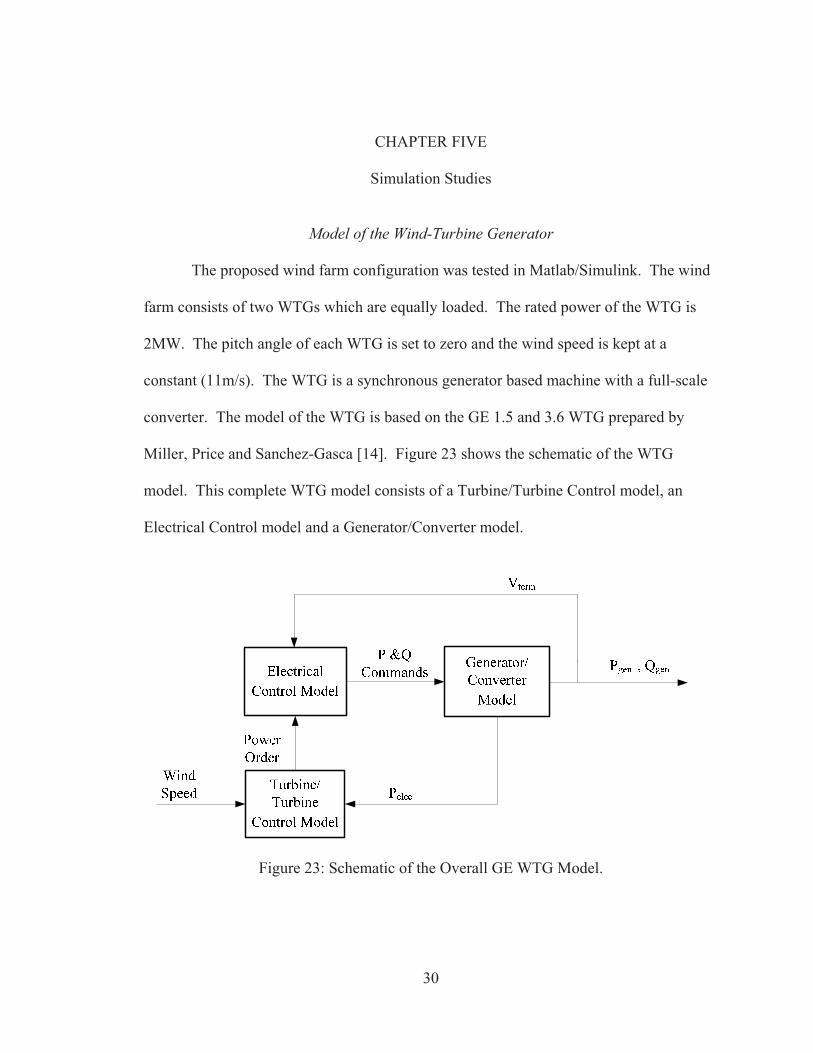
The proposed wind farm configuration was tested in Matlab/Simulink. The wind
farm consists of two WTGs which are equally loaded. The rated power of the WTG is
2MW. The pitch angle of each WTG is set to zero and the wind speed is kept at a
constant (11m/s). The WTG is a synchronous generator based machine with a full-scale
converter. The model of the WTG is based on the GE 1.5 and 3.6 WTG prepared by
Miller, Price and Sanchez-Gasca [14]. Figure 23 shows the schematic of the WTG
model. This complete WTG model consists of a Turbine/Turbine Control model, an
Electrical Control model and a Generator/Converter model.
Figure 23: Schematic of the Overall GE WTG Model.

31
The Turbine/Turbine Control model provides the active power order. As shown
in Figure 24, the electrical power signal coming from the Generator/Converter model
passes through a speed set-point block. The reference speed of the rotor is then
determined.
Figure 24: Schematic of the Turbine/Turbine Control Model.
The Electrical Control model dictates the active and reactive power to be
delivered to the network, as shown in Figure 25. The reactive power order, Qord, can
either be set to zero or come from a separate model. In the simulation, the Qord is set to
zero and no reactive power is generated by the WTG. However, the Open Loop Control
Logic will take actions whenever the terminal voltage is not within its normal range. In
this case, the WTG will generate reactive power to support the terminal voltage.
Figure 25: Schematic of the Electrical Control Model.

32
The Electrical Controller in Figure 25 monitors the generated power and terminal
voltage to compute the voltage and current commands Eq"cmd and IP cmd. These two
commands are used as input signals of the Generator/Converter Model, as Figure 26
shows. This model is the physical equivalent of the generator and provides the interface
between the WTG and the network. The model contains two small time constants (0.02
s) to represent converter action. The result of the iteration comes as a controlled current
source which computes the required injected current into the network in response to the
commands [14].
s02.011
�
s02.011
�
Figure 26: Schematic of the Generator/Converter Model.
Load-Following Test
The Speed-Down method and Speed-Up method are first tested in Case 1 and
Case 2, then the SUDA method is tested in Case 3.
Case 1: Speed-Down Method. In the first case, the WTGs are both de-loaded in
the way that the rotor speed reference value is below the optimal operating point, which
means only the left-side power coefficient curve is followed, as Figure 27 shows.
At t = 2.5s, the load demand decreases. Since we have already set pitch angle to
zero and wind speed v is kept constant, � is then proportional to the rotor speed. Hence,
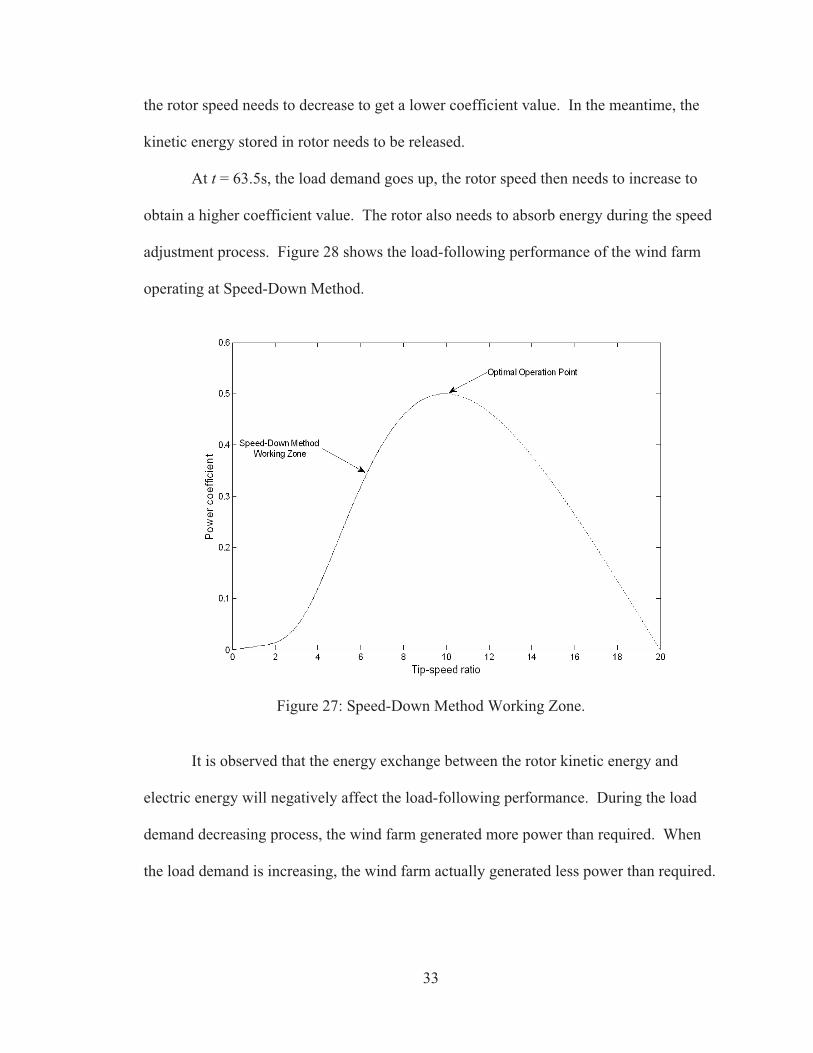
33
the rotor speed needs to decrease to get a lower coefficient value. In the meantime, the
kinetic energy stored in rotor needs to be released.
At t = 63.5s, the load demand goes up, the rotor speed then needs to increase to
obtain a higher coefficient value. The rotor also needs to absorb energy during the speed
adjustment process. Figure 28 shows the load-following performance of the wind farm
operating at Speed-Down Method.
Figure 27: Speed-Down Method Working Zone.
It is observed that the energy exchange between the rotor kinetic energy and
electric energy will negatively affect the load-following performance. During the load
demand decreasing process, the wind farm generated more power than required. When
the load demand is increasing, the wind farm actually generated less power than required.

34
Figure 28: Load-Following Curves with Speed below the Optimal Operating Point.
Case 2: Speed-Up Method. In the second case, the WTGs are both de-loaded in
the way that the rotor speed reference value is above optimal operation point, which
means only the right-side power coefficient curve is followed, as Figure 29 shows. The
same load demand curve is considered in the simulation. In this case, according to the
power coefficient curve, when the load demand decreases, the rotor speed needs to
increase to get a lower coefficient value. Meanwhile, the rotor needs to absorb energy
because of its inertia. When the load demand increases, the rotor speed then needs to
decrease to obtain a higher coefficient value. The kinetic energy stored in the rotor needs
to be released. From Figure 30 it is observed that the rotor inertia negatively affects the
load-following performance as well.

35
Figure 29: Speed-Up Method Working Zone.
Figure 30: Load-Following Curves with Speed above the Optimal Operation Point.
36
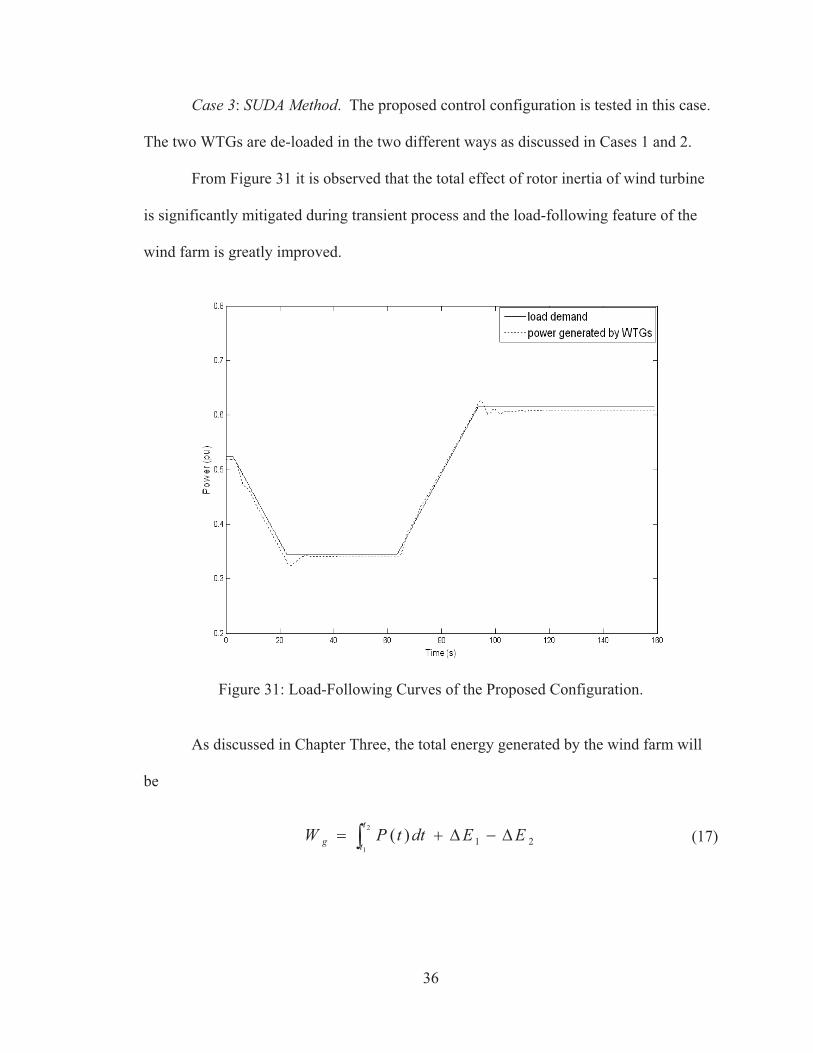
Case 3: SUDA Method. The proposed control configuration is tested in this case.
The two WTGs are de-loaded in the two different ways as discussed in Cases 1 and 2.
From Figure 31 it is observed that the total effect of rotor inertia of wind turbine
is significantly mitigated during transient process and the load-following feature of the
wind farm is greatly improved.
Figure 31: Load-Following Curves of the Proposed Configuration.
As discussed in Chapter Three, the total energy generated by the wind farm will
be
212
1
)( EEdttPWt
tg �� � (17)

37
where �E1 and �E2 are the kinetic energy released or stored by the two wind turbines,
respectively, as denoted in (6). The inertia effect will be reduced to �E1-�E2, which is
small due to the near symmetry property of the wind power coefficient curve.
Primary Frequency Support Test
The proposed wind farm, with and without frequency controller, is tested in
several cases. In the first case, the wind farm is directly connected to the grid as Figure
32 shows.
�
Figure 32: Wind Farm Directly Connected to the Infinite Bus.
At t = 1s, a frequency step �f = -0.5Hz comes from the grid, then it clears at t =
1.2s. Figure 33 shows different reactions of the wind farm, with and without the
frequency support controller.
Without the frequency control, the wind farm gives nearly no reaction to load
deviation, which is shown in solid line. With the frequency support controller, it is
observed that the WTGs can respond to system frequency deviation very quickly and
instantly release more active power during frequency sag. With the droop-speed control,
it is possible that the wind farm is able to participate in load sharing and support the
system’s frequency when the power available from wind is sufficient for power
adjustment.

38
In order to investigate the effect of the wind farm on the grid, the proposed wind
farm is connected to the IEEE 3-machine 9-bus system, which can be considered as a
stand-alone power system. It consists of three synchronous generators and nine buses.
Figure 34 shows the one-line diagram of the IEEE 3-machine 9-bus system.
Figure 33: Frequency Support Feature with/without Controller.
Case 1: This is the base case. The 3-machine 9-bus system without wind energy
penetration is tested. A capacity of 10% of system’s total load is added to cause a
frequency deviation.
Case 2: In this case, 10% wind power is penetrated to the system. The wind farm
is connected to Bus 6. In the meantime, local loads are added to consume the output
wind power. The wind farm is operating in the load-following mode without primary

39
frequency controller. A capacity of 10% of system’s total load is added to cause a
frequency deviation.
Case 3: Based on Case 2, the primary frequency controller is added to the wind
farm.
Figure 34: IEEE 3-Machine 9-Bus System.
Figure 35 shows the system’s frequency under different cases. In the first case,
the system suffers a frequency dip of 58.9 Hz when the load deviation happens. With
10% wind power penetrated to the system as in Case 2, the frequency dip is 58.8 Hz,
which is lower than the first case. Hence the system’s frequency stability is
compromised with wind energy penetration. However, with the frequency controller

40
implemented, the frequency dip increases to 59.05 Hz. This is because the wind farm is
able to participate in load sharing when the load deviation happens. Hence, the frequency
stability is improved.
Figure 35: System’s Frequency Deviation under Different Cases.
Small-Signal Stability Analysis
The contribution of the frequency controller to the system’s small-signal stability
is tested in this simulation study. As mentioned in Chapter Four, a single-machine
infinite-bus system, which can be considered as an equivalent model of a single generator
interconnected to a large power system, is tested to analyze the oscillation. The wind

41
farm is located close to the synchronous generator and local load is added, as Figure 36
shows.
�
Figure 36: Single-Machine Infinite-Bus System with Wind Farm.
The system is in steady-state initially. A fault occurs at t=5s and self-cleared in a
very short time to cause a perturbation. Figure 37 shows the frequency deviation
followed by the perturbation. It is observed that a low frequency oscillation is produced.
The amplitude of the oscillation decays slowly and lasts a relatively long time.
Then the effectiveness of the proposed frequency controller is tested. Based on
the previous case, the frequency controller is implemented and the same perturbation is
applied. Figure 38 shows the system’s frequency deviation. Figures 39 and 40 show the
different reactions of wind farm with and without the frequency controller, respectively.

42
Figure 37: Frequency Deviation without Frequency Controller.
Figure 38: Frequency Deviation with Frequency Controller.

43
Figure 39: Active Power Output of Wind Farm without Frequency Controller.
Figure 40: Active Power Output of Wind Farm with Frequency Controller.

44
It is obvious that the oscillation damps faster with the frequency controller
implemented. From Figure 38, it is observed that at t=15s, the oscillation is already very
small and the system goes back to the steady state. From Figure 40 it is observed that the
wind farm will adjust its active power output according to the oscillation, which actually
increases the damping ratio of the system. Hence it is able to contribute to the system’s
small-signal stability.�

45
CHAPTER SIX
Conclusions
It is necessary to manipulate either rotor speed or pitch angle to control the active
power output of the wind turbine generator (WTG). Since changing pitch angle
frequently causes undesirable mechanical vibration and increases the cost of mechanical
maintenance, it is more practical to control rotor speed, which raises the issue of rotor
inertia of wind turbine. The proposed configuration takes advantage of the power
coefficient/tip-speed ratio curve. By allowing WTGs to operate at different speed
references with the speed up/down averaging (SUDA) method that correspond to the
same power coefficient, the inertia effect will be mitigated and load-following control
can be better realized. This improved load-following feature of wind farms provides a
possible solution for wind utilization in some micro-grids, in which the ability of the
frequency regulation of the conventional generators is limited and the WTGs should only
generate the power required.
This improved load-following feature brings several meaningful applications.
With the frequency controller implemented, it is possible to let the wind farm contribute
to frequency regulation in terms of droop-speed control when there is a sudden frequency
deviation in the system. For a stand-alone power system such as the Hawaii power
system, there is no interconnection with any other power grid and no additional support
can be provided. The primary frequency control supported by the wind farm will
improve the system’s frequency stability. In addition, this configuration with frequency
controller is able to contribute to the system’s small-signal stability. The controlled wind

46
farm increases the damping ratio of the closely located synchronous machine and
improves the system’s inter-area oscillations.
However, it is still worth noticing that this load-following mode will be more
practical and meaningful if there is enough wind power available and it is worth it to
sacrifice some wind power to realize other purposes. In addition, since the SUDA
method requires some WTGs work on a higher rotor speed, it is more appropriate to use
this load following mode in low-speed direct-drive WTGs, whose top rotor speed can be
higher by using full-scale power converters. The pitch angle is fixed at zero in the
simulation study. However, under a very high wind speed, the pitch angle can be set at an
appropriate value to limit the input power, in which case a different power coefficient
curve will be considered and the load-following control can still apply.

47
BIBLIOGRAPHY [1] Energy Efficiency & Renewable Energy,
http://www.windpoweringamerica.gov/wind_installed_capacity.asp#current [2] P. Kunder, Power System Stability and Control, McGraw-Hill: New York, USA,
1994. [3] L. Xie, P.M.S. Carvalho, L.A.F.M. Ferreira, J. Liu, B.H. Krogh, N. Popli, and M.D.
Ilic, “Wind integration in power systems: operational challenges and possible solutions,” in Proc. of the IEEE, vol. 99, no. 1, pp. 214–232, Jan. 2011.
[4] H. Banakar, C. Luo, and B. T. Ooi, “Impacts of wind power minute-to-minute
variations on power system operation,” IEEE Trans. Power Systems, vol. 23, no. 1, pp. 150-160, Feb. 2008.
[5] Y. V. Makarov, C. Loutan, J. Ma and P. de Mello, “Operational impacts of wind
generation on California power systems,” IEEE Trans. Power Systems, vol. 24, no. 2, pp. 1039-1050, May. 2009.
[6] M.D. Ilic, Y.V. Makarov, and D.L. Hawkins, “Operation of electric power systems
with high penetration of wind power: risks and possible solutions,” in Proc. IEEE Power Engineering Society General Meeting, 2007.
[7] B. H. Chowdhury, H. T. Ma, and N. Ardeshna, “The challenge of operating wind
power plants within a microgrid framework,” in Proc. Power and Energy Conference at Illinois (PECI), 2010.
[8] O. Anaya-Lara, N. Jenkins, J. Ekanayake, P. Cartwrite, and M. Hughes. Wind energy
generation: modelling and control, John Wiley: West Sussex, UK, 2009. [9] X. Yuan, F. Wang, D. Boroyevich, Y. Li, and R. Burgos, “DC-link voltage control
of a full power converter for wind generator operating in weak-grid systems,” IEEE Trans. Power Electronics, vol. 24, no. 9, pp. 2178-2192, Sep. 2009.
[10] C. M. Colson and M. H. Nehrir, “Load-following for wind turbines with permanent
magnet synchronous generators,” in Proc. 2010 North American Power Symposium (NAPS), 2010.
[11] G. Tsourakis, B.M. Nomikos, and C.D. Vournas, “Contribution of doubly fed wind
generators to oscillation damping,” IEEE Trans. Energy Conversion, vol. 24, no. 3, pp. 783-791, 2009.

48
[12] M. Yin, G. Li, M. Zhou, and C. Zhao, “Modeling of the wind turbine with a permanent magnet synchronous generator for integration,” in IEEE Power Engineering Society General Meeting, 2007.
[13] A. Jamehbozorg and W. Gao, “A new controller design for a synchronous generator-
based variable speed wind turbine,” in Proc. 2010 North American Power Symposium (NAPS), 2010.
[14] N. W. Miller, W. W. Price, and J. J. Sanchez-Gasca, “Dynamic modeling of GE 1.5
and 3.6 wind turbine-generators,” GE-Power Systems Energy Consulting, Oct. 2003, Version 3.0.
[15] T. P. Fuglseth, “Modelling a 2.5MW direct driven wind turbine with permanent
magnet generator,” Department of Electrical Power Engineering Norwegian University of Science and Technology, NO-7491 Trondheim, Norway.
[16] J. G. Slootweg, S. W. H. De Haan, H. Polinder, and W. L. Kling, “General model for
representing variable speed wind turbines in power system dynamics simulations,” IEEE Trans. Power Systems, vol. 18, no. 1, pp. 144-151, Feb. 2003.
[17] M. Behnke, A. Ellis, Y. Kazachkov, T. McCoy, E. Muljadi, W. Price, and J.
Sanchez-Gasca, “Development and validation of WECC variable speed wind turbine dynamic models for grid integration studies,” presented at AWEA’s 2007 WindPower Conf., Los Angeles, California, 2007.
[18] F. D. Kanellos and N. D. Hatziargyriou, “Control of variable speed wind turbines
equipped with synchronous or doubly fed induction generators supplying islanded power systems,” IET Renew. Power Gener., vol. 3, no. 1, pp. 96-108, 2009.
[19] A. Abedini and A. Nasiri, “Output power smoothing for wind turbine permanent
magnet synchronous generators using rotor inertia,” Electric Power Components and Systems, vol. 37, no. 1, pp. 1-19, Jan. 2009.
[20] A. M. Howlader, N. Urasaki, A. Yona, T. Senjyu, C.-H. Kim, and A. Y. Saber,
“Output power leveling of a wind generation system using inertia of a wind turbine,” International Journal of Emerging Electric Power Systems, vol. 10, no. 4, art. 5. 2009.
[21] J. Li, D. Li, L. Hong, C. Xie and G. Chen, “A novel power-flow balance LVRT
control strategy for low-speed direct-drive PMSG wind generation system,” in Proc. of the 36th Annual Conference on IEEE Industrial Electronics Society, 2010.
[22] J. Li, Zhuying, X. He, and H. Xu, “Study on low voltage ride through characteristic
of full power direct-drive wind power system,” in Proc. of the 6th International Power Electronics and Motion Control Conference of IEEE, 2009.

49
[23] L. Meegahapola and D. Flynn, “Impact on transient and frequency stability for a power system at very high wind penetration,” in Proc. IEEE Power Engineering Society General Meeting, 2010.
[24] M. Bahramipanah, S. Afsharnia, and Z. Shahooei, “A survey on the effect of
different kinds of wind turbines on power system stability,” in Proc. of the 1st International Nuclear and Renewable Energy Conference, 2010.