Wall St. Training Courses · © Wall Street Training & Advisory, Inc. +1 (212) 537-6631 Hamilton...
25
OPEN-ENROLLMENT SEMINARS DETAILED COURSE DESCRIPTIONS TO REGISTER, GO TO: wallst.training/open-enroll +1 (212) 537-6631 +1 (212) 656-1221 (fax) [email protected] Hamilton Lin, CFA Founder & CEO
Transcript of Wall St. Training Courses · © Wall Street Training & Advisory, Inc. +1 (212) 537-6631 Hamilton...

OPEN-ENROLLMENT SEMINARS DETAILED COURSE DESCRIPTIONS
TO REGISTER, GO TO:
wallst.training/open-enroll
+1 (212) 537-6631
+1 (212) 656-1221 (fax)
Hamilton Lin, CFA Founder & CEO
© Wall Street Training & Advisory, Inc. +1 (212) 537-6631 Hamilton Lin, CFA [email protected] Founder & CEO wallst.training
2
ABOUT WALL STREET TRAINING & ADVISORY, INC.
WHY CHOOSE WST
We analyzed the current learning process in finance and Wall Street, figured out how teaching and training
should be done and then implemented our learning processes. In short, our strengths that separate us from
our competitors include:
Hands-on, interactive, practical, non-theoretical, no "b.s." approach
Training modules replicate exactly how it is done on Wall Street
Blend of real-world and effective teaching style that is more down to earth and at the audience’s level
Fast-paced learning where the goal is for participants to become experts and extremely quick and efficient
so they could spend more time on analysis of the numbers rather than pure number crunching
Learn how to completely avoid using the mouse when building financial models
Ability to translate difficult and advanced concepts into plain English while providing highly detailed
explanations and intricacies; ability to integrate a variety of disparate topics into one focused theme
Teach nuances and real-life intricacies, not just the basic how-to; we teach the rules and the exceptions!
Models that are built more cleanly, more efficiently and are meant to be self-contained reference models
Highly interactive, dynamic teaching approach – we guarantee you will learn AND have fun!
© Wall Street Training & Advisory, Inc. +1 (212) 537-6631 Hamilton Lin, CFA [email protected] Founder & CEO wallst.training
3
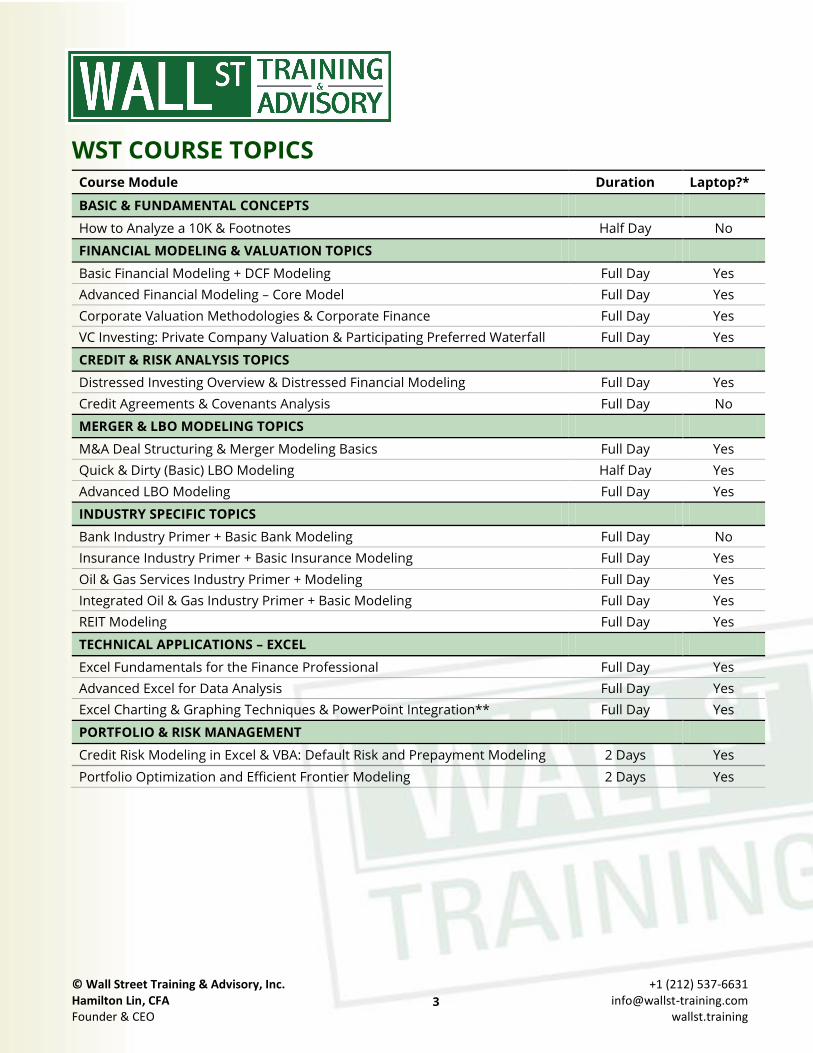
WST COURSE TOPICS Course Module Duration Laptop?*
BASIC & FUNDAMENTAL CONCEPTS
How to Analyze a 10K & Footnotes Half Day No
FINANCIAL MODELING & VALUATION TOPICS
Basic Financial Modeling + DCF Modeling Full Day Yes
Advanced Financial Modeling – Core Model Full Day Yes
Corporate Valuation Methodologies & Corporate Finance Full Day Yes
VC Investing: Private Company Valuation & Participating Preferred Waterfall Full Day Yes
CREDIT & RISK ANALYSIS TOPICS
Distressed Investing Overview & Distressed Financial Modeling Full Day Yes
Credit Agreements & Covenants Analysis Full Day No
MERGER & LBO MODELING TOPICS
M&A Deal Structuring & Merger Modeling Basics Full Day Yes
Quick & Dirty (Basic) LBO Modeling Half Day Yes
Advanced LBO Modeling Full Day Yes
INDUSTRY SPECIFIC TOPICS
Bank Industry Primer + Basic Bank Modeling Full Day No
Insurance Industry Primer + Basic Insurance Modeling Full Day Yes
Oil & Gas Services Industry Primer + Modeling Full Day Yes
Integrated Oil & Gas Industry Primer + Basic Modeling Full Day Yes
REIT Modeling Full Day Yes
TECHNICAL APPLICATIONS – EXCEL
Excel Fundamentals for the Finance Professional Full Day Yes
Advanced Excel for Data Analysis Full Day Yes
Excel Charting & Graphing Techniques & PowerPoint Integration** Full Day Yes
PORTFOLIO & RISK MANAGEMENT
Credit Risk Modeling in Excel & VBA: Default Risk and Prepayment Modeling 2 Days Yes
Portfolio Optimization and Efficient Frontier Modeling 2 Days Yes
© Wall Street Training & Advisory, Inc. +1 (212) 537-6631 Hamilton Lin, CFA [email protected] Founder & CEO wallst.training
4
WE ARE CONSTANTLY ADDING NEW DATES AND COURSES TO OUR CALENDAR. TO VIEW
CURRENT OFFERINGS, PLEASE GO TO: wallst-training/open-enroll
IMPORTANT NOTES:
* Bring a laptop with Microsoft Excel installed and a CD-ROM drive. PC laptops are highly
recommended; Mac applications will not be as effective. All versions of Excel are adequate.
Please avoid Office 2008 for Mac.
** If you must work on a Mac laptop, please run Windows and Excel for Windows via Boot Camp,
Parallels or VMWare. Be sure to consult the Mac setup and shortcuts guides on our website:
About > Resources > Technical Resources (http://wallst.training/about/resources.html).
To maximize the educational value of this program, we strongly recommend that you have an
intermediate understanding of Excel. Lack of basic Excel skills will impede your ability to effectively
acquire and implement the techniques and shortcuts that are presented in these programs.
© Wall Street Training & Advisory, Inc. +1 (212) 537-6631 Hamilton Lin, CFA [email protected] Founder & CEO wallst.training
5
PACKAGE 1: BASIC AND FUNDAMENTAL CONCEPTS
How to Analyze a 10K
Course Goals & Overview:
"How to Analyze a 10K" builds upon basic accounting and financial statements concepts to focus on the major
components of a 10K SEC filing, including the Management Discussion & Analysis, Financial Condition and Results and
how to analyze the myriad of footnotes.
It’s simply not enough to merely analyze the financial statements, but especially critical to plow through and understand
the footnotes and the management discussion & analysis, where the most of the qualitative information is contained.
The challenge is that there are a myriad of footnotes and figuring out which are the important and relevant ones is no
small feat. This course provides the overview and analysis for most major common footnotes and gives you a starting
point to plow in deeper when we build our financial models. The irony is that in the process of crunching numbers and
building numbers, reading comprehension, particularly on the 10K is probably even more important in terms of getting
the right inputs.
Course Sections:
Overview & Analysis
• What is a 10K and how is it different from an Annual Report?
• Major components of a 10K filing
• Detailed discussion on the MD&A section (Management Discussion & Analysis)
• Detailed discussion of all major footnotes and how to analyze and interpret major categories of footnotes:
- General footnotes
- Balance Sheet footnotes
- Contingencies footnotes
- Income Statement footnotes
- Capital Structure footnotes
- Other footnotes
• Brief discussion of Proxy statement and its utility
• Brief discussion and introduction to differences between US and International GAAP
Hands-on Exercise
• Interactive group project break-out to analyze, compare and contrast 10K’s of various companies
• Concentration on:
- Revenue terminology differences
- Interest and expense classification
- Balance sheet analysis
- Cash flow analysis
- Analysis and comparison of footnotes
- MD&A / Segment breakdown and discussion
Prerequisites:
• Accounting for Financial Statements Integration
• Reading comprehension
© Wall Street Training & Advisory, Inc. +1 (212) 537-6631 Hamilton Lin, CFA [email protected] Founder & CEO wallst.training
6
FINANCIAL MODELING & VALUATION TOPICS
Basic Financial Modeling + DCF Modeling
Course Goals & Overview:
This course builds upon, and implements in Excel, the fundamental financial analysis and valuation topics. Create a top-
down, five year income statement projection model and then construct a basic discounted cash flow analysis on top of
your projection model. This course provides a non-academic, real-world, hands-on primer to the quantitative and
technical aspects of financial modeling. The model could be further expanded for valuation purposes or analyzing
mergers and acquisitions – either way, you will leave the classroom with a template model that is scalable and
applicable to other companies immediately. In addition, learn about subtle nuances including the proper figure for “cash
flow” in perpetuity growth models and handling dilutive options for valuation.
** Don’t get thrown off by the world “basic” – this Basic Financial Modeling serves as the fundamental basis for all of our
additional Excel-based courses. Before you “graduate” onto our advanced modeling courses, we HIGHLY recommend
you take this course for the full background on working efficiently in Excel the way we want you to, otherwise you may
have a much steeper learning curve in our other classes. **
Course Sections:
Course Overview
• How do you construct a projection model with a five-year forecast?
• How do you begin to forecast a company’s profitability?
• What are the intricacies involved with model building?
• What are the basic methods of projecting a company’s revenues and expenses?
5-Year Income Statement Projection Model
• Input historical financial results and recast as necessary
• Calculate historical growth rates and margins which serve as the basis for your projection assumptions
• Calculate your projected profitability from revenue down to EPS
• Learn the correct way to calculate diluted shares outstanding
Discounted Cash Flow Analysis
• How is a discounted cash flow analysis actually constructed?
• Estimate unlevered free cash flow (free cash flow to firm)
• Why is amortization non-tax-deductible from a tax perspective and what are the implications on value?
• What are different proxy methods for calculating working capital?
• Terminal Value estimation: what are the differences between the EBITDA multiple and perpetuity growth approaches
and what are the implications on value?
• Learn subtle nuances including the proper figure for “cash flow” in perpetuity growth models
• Calculate from enterprise value down to equity value and ultimately down to stock price per share
Prerequisites:
• Accounting & Financial Statements Integration
• Finance 101 – Introduction to Finance
• Corporate Valuation Methodologies
• Company Overview
© Wall Street Training & Advisory, Inc. +1 (212) 537-6631 Hamilton Lin, CFA [email protected] Founder & CEO wallst.training
7
FINANCIAL MODELING & VALUATION TOPICS
Advanced Financial Modeling - Core Model
Course Goals & Overview:
Build a fully integrated financial statement projection model with income statement projections, a self-balancing
balance sheet, an automated cash flow statement, and the balancing cash flow sweep/debt schedule. While knowledge
of advanced accounting concepts is not required for this course, you should possess knowledge of basic accounting
ratios and a basic understanding of how the major financial statements are inter-related. Emphasis is placed on the
integration of the major financial statements and becoming experts in Excel. Incorporate different methodologies to
forecasting the different types of assets on the balance sheet and compare and contrast with projecting liabilities. Learn
how to balance a model utilizing the debt sweep and the revolver and not using any “plugs”. Appreciate the danger of
and properly control for circular references. Avoid messy nested “if” statements!! You will leave the classroom with a
fully constructed model that can be customized and applied to other companies. The final model is a fully scalable
model that can be added upon.
Learning Objectives:
• Build an integrated set of financials, including IS, BS & CF statements
• Learn how to balance a model utilizing debt sweep and no “plugs”
• Become super-efficient in Excel through intensive use of keyboard shortcuts
• Intensive focus on correct financial modeling approaches & best practices
Course Sections:
5-Year Financial Statement Projection Model
• How do you project a company’s Income Statement from revenues and expenses down to Net Income?
• What are the different methodologies to forecasting the different types of assets on the balance sheet and how do
they compare and contrast with projecting liabilities?
• How do you project the shareholders’ equity account?
• What is the importance of financial ratios in building the balance sheet projections?
• How do you approach building an integrated cash flow statement?
• How do you build each component of the cash flow statement and why is cash the last item to project?
Supporting Schedules
• Incorporate calculation and payment of dividends into your integrated financial model
• Emulate announced share repurchase program by estimating implied price and shares repurchased
Integration and Balancing of Financial Model
• Balance the model using the debt schedule and debt sweep logic – the most important analysis in terms of balancing
the model!!
• How does the cash actually flow through the model?
• Incorporate automatic debt payments and use cash generated to either pay down debt or build cash
• How does the revolver facility actually balance the model? Avoid messy nested “if” statements!!
• How does the balance sheet and financial statements balance by itself without the use of “plugs”?
• How are the financial statements integrated using the Interest schedule?
• What are circular references, why should they be avoided and how to get around circular references
Prerequisites:
• Accounting & Financial Statements Integration
• Company Overview
• Basic Financial Modeling
• Efficiency in Excel
© Wall Street Training & Advisory, Inc. +1 (212) 537-6631 Hamilton Lin, CFA [email protected] Founder & CEO wallst.training
8
FINANCIAL MODELING & VALUATION TOPICS
Corporate Valuation Methodologies & Corporate Finance Fundamentals
Course Goals & Overview:
How can you tell if a company is undervalued or overvalued? Is the current stock price the only measure of value? Why
would one company command a higher or lower premium than its direct competitor? This course takes a practical,
tangible, and non-theoretical approach to examining how corporations are valued and the major analytical tools that
are used. Go beyond the academic theory of financial ratios and apply fundamental analysis and real-world methods of
evaluating a company’s intrinsic value. Gain insight into relative valuation methodologies (trading comps, deal comps) to
fundamental valuation (discounted cash flow analysis, break-up / sum of the parts valuation). Coverage goes beyond the
academic theory of financial ratios to the practical application of fundamental analysis, offering alternative, real-world
methods of evaluating a company's intrinsic value. The Course includes a crucial primer to Corporate Finance and its
non-theoretical application; apply learning objectives and goals immediately to today’s environment.
Learning Objectives:
• How to value a company (trading comps, deal comps, DCF, LBO, break-up and asset valuation)
• Importance of Enterprise Value, EBITDA, capital structure, leverage and WACC
• Analyze valuation multiples and ratios; why are PE ratios sub-optimal as a valuation metric?
• Practical, non-theoretical application of introduction to corporate finance
Course Sections:
Introduction to Valuation and Corporate Finance
• How much is a company worth? Why is the current stock price not an accurate indication of value?
• How do you tell if a company is under-valued or over-valued?
• Why would one company command a higher or lower premium than its direct competitor?
• What is the importance between enterprise value and equity value?
• TEV: what is the correct treatment of minority interest and capital leases from a standalone valuation aspect vs. credit
perspective vs. change of control
• What is the relevance of capital structure and leverage on a company’s value?
• Why and how is corporate finance so critical to managing a firm’s profitability?
Ratios and Multiples Discussion
• What exactly does a multiple tell us? Learn the correct way to use P/E ratios and other multiples
• Why are P/E ratios misunderstood and what other profitability-related ratios are more important?
• What is EBITDA and why is it so important?
• Utilizing the correct numerator for multiples analysis
• Calculating implied value based on multiples analysis
Detailed Valuation Analysis
• Analysis of “football field” and reference ranges
• Detailed discussion of the major valuation methodologies, their nuances and application in the real-world
• Analyzing, comparing and contrasting trading comps, deal comps and premiums paid
• Detailed explanation of Discounted Cash Flow (DCF) valuation, its theory and application
• Discussion of why the DCF is arguable one of the most important analyses while simultaneously one of the most
academic and least practical of them all
• Review of WACC (weighted average cost of capital), CAPM (Capital Asset Pricing Model)
• How do you approach valuing a company with completely disparate businesses?
Prerequisites:
• Accounting & Financial Statements Integration, How to Analyze a 10K, Finance 101 – Introduction to Finance
© Wall Street Training & Advisory, Inc. +1 (212) 537-6631 Hamilton Lin, CFA [email protected] Founder & CEO wallst.training
9
FINANCIAL MODELING & VALUATION TOPICS
VC Investing: Private Company Valuation & Participating Preferred Securities Waterfall Modeling
Course Goals & Overview:
In the first part of this course, we discuss the complex nuances associated with analyzing and valuing emerging markets
and private companies. We dive deep into the details and concepts deeply imbedded with valuation of large publicly
traded and listed companies and take it to next level by applying it to companies and regions with very sparse publicly
available data. Learn nuances of adjusting for DCF valuation, WACC analysis when no data exists, how to select and
adjust peer comparables when no “good comp” exists. While there is certainly no magic bullet to the tough questions
and lack of information, there are techniques and best practices to get us as close as possible. Learning objectives
include: fundamental & DCF valuation nuances (adjustments to Gordon growth); WACC and cost of component capital
nuances (adjustments to cost of debt and equity and beta); review of basic valuation methodologies, focusing on relative
valuation multiples and ratios and tacking on private company discounts; emerging markets case study and real-life
valuation nuances when data simply doesn’t exist.
The second part of this course involves modeling out early stage investment securities’ waterfalls. When investing in
earlier stage companies, whether start-up, growth or mezzanine stage investing, there is a fine balance between
incentivizing the newest round of investors injecting capital and providing enough returns for earlier round investors,
while still motivating management to strive for mutual alignment of economic interests. Investors desire downside
protection while craving equity upside. Thus, the participating preference securities evolved from a blend of common
stock with equity upside & voting rights to debt with accruing interest and priority of liquidation. In this course, learn
how to structure, and model out such hybrid securities commonly used in VC and earlier stage investing.
Liquidation Waterfall Modeling:
• Modeling Preferred Equity and Multiple Class Share Positions:
Structuring returns for each equity participant and class/series of investors
• Equity Assumptions: capitalization tables, pre-money vs. post-money calculations
• Liquidation Preference: minimum return threshold based on pre-determined multiple and accrued dividends over
time provides LIFO effect of last dollar in, first dollar out
• Dividends: Cash pay vs. PIK; compounding vs. simple; cumulative vs. non-cumulative
• Participation Rights: investors shall participate on equity upside based on fully diluted ownership percentage and
allows investors to participate in upside valuation after liquidation preference protection
• Participation Caps: the crux of the analysis focuses on the capped upside of the investor and re-distribution of fully
diluted ownership percentage for remaining investors it gets complicated and that’s why it’s called a waterfall!
• Conversion: complicate the analysis by adding in a conversion option for all investors to further participate in upside
could radically change the valuation parameters based on final valuation/liquidation amount
• Management Options & Warrants: incorporate management options in allocation of final management proceeds
based on cashless converts
Please note that this is a financial modeling class, not a legal class.
Prerequisites:
• Accounting & Financial Statements Integration
• Corporate Valuation Methodologies
• Basic Financial Modeling
© Wall Street Training & Advisory, Inc. +1 (212) 537-6631 Hamilton Lin, CFA [email protected] Founder & CEO wallst.training
10
CREDIT & RISK ANALYSIS TOPICS
Distressed Investing Overview & Distressed Financial Modeling
Course Goals & Overview:
Learn how to model and value distressed companies and securities undergoing restructuring or bankruptcy process.
First, appreciate and understand the historical perspective and context of the distressed market. Then, explore various
opportunities in distressed investing from securities types to investment strategies. Properly identify and isolate the
true sources and drivers of returns from supply & demand to operational changes to market rebound to
recapitalizations. Quantify and comprehend the dramatic changes to a distressed firm’s capital structure and the
implications on the valuation process and realignment of economics. Understand the reorganization and bankruptcy
process, including DIP (debtor-in-possession) financing, Section 363 sales (stalking horse), Chapter 11 reorganization,
and Chapter 7 liquidation. Fully comprehend the key critical covenants required involved in distressed securities as well
as the entire turnaround & restructuring process by identifying key parameters for successful business plan
implementation. Wrap up by quantifying valuation impact by evaluating a basic distressed sensitivity financial model.
Learning Objectives:
• Understand distressed investing, different investment strategies & valuation and bankruptcy process
• Comprehend capital structure pre- and post-petition, significant of identifying fulcrum security
• Comprehend the complexities and nuances involved with distressed analysis
• Incorporate detailed valuation sensitivity to identify key value drivers in a distressed situation
Course Sections:
Distressed Investing Overview
• Various definitions of distressed and causes of distressed securities
• Understanding different securities types to invest in based on investment strategy
Investment Strategies & Valuation
• Understanding and taking advantage of capital structure arbitrage opportunities
• DIP (Debtor-In-Possession) financing and the controversial roll-up DIP
• Identifying all-important fulcrum security and impact on valuation and returns
Bankruptcy: Legal Aspects & Chapter 11
• Brief overview to Chapter 11 – Reorganization Process and impact on distressed investing in US
• Section 363 sales & stalking horse bidder’s impact on determining success of Chapter 11 process
Distressed Financial Modeling
• Summarize pre-petition capital structure of distressed situation & determine normalized valuation
• Construct standalone Income Statement project of distressed company
• Layer on various restructuring and turnaround scenarios
• Evaluate & analyze decision to restructure and understand financial implications on valuation
• Construct super-dynamic and flexible model to automate new vs. old cash flow capital structure
Sensitivity Analysis
• Construct robust sensitivity analysis to determine ultimate recovery to capital structure classes
• Sensitize distressed model based on leverage, valuation, new pro forma capital structure
• Analyze what constitutes a “bad” deal and its implications for the distressed investor
• Understand and appreciate various financial stakeholders and inherent conflicts of interest
• Quantify and evaluate the importance of determining the right fulcrum security
© Wall Street Training & Advisory, Inc. +1 (212) 537-6631 Hamilton Lin, CFA [email protected] Founder & CEO wallst.training
11
CREDIT & RISK ANALYSIS TRAINING
Credit Agreements and Covenants Analysis
Course Goals & Overview:
Understand the legal aspects of issuing bank debt and corporate bonds by analyzing major sections of debt agreements
and legal and financial covenants. Comprehend the major types of covenants found in credit agreements and bond
indentures: affirmative, negative and financial. In addition, delve into maintenance and incurrence covenants, reps and
warranties, indemnities. Learn objective of relevant credit agreement provisions and common related structural issues
and thoroughly analyze senior credit agreements covenants and high-yield bond covenants. Understand implications of
covenants on "events of default" and differentiate between technical defaults as well as compare and contrast "loose"
vs. "tight" covenants and covenant-light and covenant-tight agreements.
Course Sections:
Debt & Lending Overview
• Capital Structure & Implications on Loan Seniority
• Lender Concerns, Borrower Creditworthiness & Measurement & Ratings Agencies
• Bank Debt / Senior Secured Loans Overview
• Bank Debt comparison with High Yield notes
Credit Agreements
• Introduction to Credit Agreements
• Role of Covenants
• Administrative Agent
• Defaulting on Credit Agreements: Types of Default and Post-default
• Debt Tranche Interdependence: Conflicts of Interest & Cross-Defaults
• Relative importance of Bank Debt to High Yield note covenants
• Formal Sections of Credit Agreement: Introduction to Solutia Case Study
Standard & Variable Provisions of the Credit Agreement
• Explanation of standardization
• General Overview of major CA sections
• Section summary specific to Solutia
• Title Page: Importance of Legal Borrower, Corporate Structure Overview
• Table of Contents
• Recitals: Detail on Guarantors
• Definitions: Emphasize importance of definitions due to variability across CAs
• Loan Terms: Detail on amortization structures of loans, company-specific amortization preferences
• Representations & Warranties
• Conditions (to closing)
• Events of Default: Overview of cure period & amendments
• Other & Voting majority
© Wall Street Training & Advisory, Inc. +1 (212) 537-6631 Hamilton Lin, CFA [email protected] Founder & CEO wallst.training
12
CREDIT & RISK ANALYSIS TRAINING
Credit Agreements and Covenants Analysis (cont.)
Covenant Overview & Detail
• Covenant Summary
Covenants: Affirmative Covenants
• Role as reporting covenants
• 1.1 Financial Statements
• 1.2 Certificates & Other Information
- Insider Access / Information Arbitrage
- Solutia EBITDA definition to exemplify reporting complications
• 1.3 Other Events
• 1.4 Environmental Matters
• 1.5 Geography / Timeline Importance
• 1.6 Additional Collateral & Guaranties
• 1.7 Additional Affirmative Covenants
- Maintenance of Corporate Existence
- Payment of Obligations
- Maintenance of Property & Insurance
Covenants: Negative Covenants
• Role of Negative Covenants
• 2.1 Indebtedness
• 2.2 Liens
- Importance of Liens in collateral protection
- Restricted Liens
• 2.3 Investments
- Permitted Investments
• 2.4 Asset Sales
- Sale & Leaseback Transactions
• 2.5 Prepayments of Indebtedness
• 2.6 Fundamental Changes
• 2.7 Transactions with Affiliates
Covenants: Financial Covenants
• Maintenance & Incurrence Covenant Overview
• 3.1 Maintenance Covenants
• 3.2 Incurrence Covenants
- Example of Incurrence break & compliance, while within Maintenance Covenants
Covenant-Lite Credit Agreements
• Excluded Covenants
• Comparison with Traditional Loans
• Standard Credit Agreement to diluted CA to lite CA evolution
• Re-emergence
Prerequisites:
• Accounting & Financial Statements Integration
© Wall Street Training & Advisory, Inc. +1 (212) 537-6631 Hamilton Lin, CFA [email protected] Founder & CEO wallst.training
13
MERGER & LBO MODELING TOPICS
M&A Deal Structuring & Merger Modeling Basics
Course Goals & Overview:
This course focuses on the mergers and acquisitions process, the basics of deal structures, and covers the main tools
and analyses that M&A investment bankers and acquirers utilize. Learn about common structural issues, crucial merger
consequence analysis and structures and methodologies. Translate fundamentals into different modeling techniques,
including the most basic and widely used back-of-the-envelope method, Accretion / Dilution, as well as a more robust
combination analysis combining a Target and Acquiror’s Income Statement. Learn how to sensitize basic deal structures
and combination options.
Learning Objectives:
• Common structural issues in a transaction (stock vs. asset, 338(h)(10) elections)
• Merger consequence analysis including accretion / dilution and financial implications of a deal
• Build a fully functional accretion / dilution model that accounts for different transaction structures
• Learn how to sensitize financial projections and the financial impact on a transaction
Course Sections:
M&A Deal Structuring
• Review of various deal considerations and deal structuring options (cash vs. stock)
• Common structural issues in a transaction (stock vs. asset, 338(h)(10) elections)
• Buyer and seller preferences for various deal structures and rationale
• Tax implications of transactions based on deal structure and FASB 142 goodwill amortization
• Merger consequence analysis including accretion / dilution and financial implications of a deal
• Analysis of breakeven PE for both 100% stock and 100% cash considerations
• Dive deep into merger accounting for your merger model including NOL treatment and FMV step-up
Accretion Dilution Modeling
Build dynamic merger consequence analysis (accretion / dilution) incorporating the following:
• Synergies switch, cash vs. stock sensitivity
• Amortization of goodwill switch (depending on purchase price allocation)
• Common structural issues: Stock vs asset deals and 338 (h)(10) elections
• Tax implications of transactions based on deal structure and FASB 142 goodwill amortization
• Analysis of breakeven PE for both 100% stock and 100% cash considerations
• Calculate pre-tax and after-tax synergies / cushion required to breakeven
Simple Merger Modeling
Construct a merger model, a simple combination of Income Statement for target and acquiror:
• Project simple stand-alone Income Statement for both target and acquiror
• Analyze selected balance sheet figures and ratios and multiples
• Estimate target valuation and deal structure
• Calculate selected Pro Forma balance sheet items
• Combine target and acquiror’s Income Statement and estimated synergies
• Calculate cash flow for debt repayments to estimate debt repayments and cash balances
• Compute interest expense and interest income based on paydowns
• Calculate accretion / dilution and credit ratios
© Wall Street Training & Advisory, Inc. +1 (212) 537-6631 Hamilton Lin, CFA [email protected] Founder & CEO wallst.training
14
MERGER & LBO MODELING TOPICS
Quick & Dirty (Basic) LBO Modeling
Course Goals & Overview:
In the normal course of running a company, the CFO must balance capital requirements with capital sources of funds.
Changes to the capital structure are not insignificant as each component of capital has an opportunity cost. In this
course, we introduce the impact of changes in capital structure and the resulting impact on a company’s decision to
borrow vs. raise equity. We quantify the thought process and the logic that dictates one or the other by examining both
extremes of capital structure changes: from a simple small share repurchase to the opposite spectrum, the leveraged
buyout. This class examines and incorporates all the major inputs and value drivers of capital structure changes by
building a short, quick and dirty LBO analysis, providing an excellent condensed overview and introduction to LBO
modeling. As LBOs are risky and complex financial transactions, sometimes, building a full-out, complex LBO model is
not necessary or required if one just wants to quickly gauge the feasibility of an LBO.
Learning Objectives:
• Discussion on leveraged buyouts, including overview, rationale, ideal candidate and drivers of value
• Construct and sensitize a basic, quick and dirty, leveraged buyout model
• Incorporate fundamental drivers including Sources & Uses, Pro Forma, post-LBO projections, available cash flow, debt
sweep, credit ratios and IRR
Course Sections:
• Drivers of value from a financial point of view and changes in capital structure
- Comparison to share repurchases and the lack of value creation
- Counter argument of cost of capital, funding costs and opportunity costs arbitrage
- Counter-counter argument of weighted average cost of capital changes
- Final assessment of source of returns of LBOs
- We first introduce the obvious rationales, then prove why that is wrong, then disproof the proof and disprove that
and disprove that and finally agree on how corporate finance and the capital markets extract value from capital
structure arbitrage
- In short, participants might be thoroughly confused at first, but will finally understand every aspect of the value
proposition by the time we are done!
• Discussion on LBOs, including: overview of LBOs, rationale for going private, ideal LBO candidate
• Create a quick and dirty, condensed LBO model from scratch
• Build a summary Sources and Uses of Funds analysis that dictates LBO value
• Construct a Pro Forma, post-LBO Income Statement projection model incorporating LBO changes
• Calculate cash flow available to firm through simplified debt sweep pay off high debt volumes
• Create condensed IRR (internal rate of return) analysis to evaluate financial sponsor returns
- Comparison of IRR to multiple of capital as a return metric and benchmark
- Identify true source of returns, from building of equity to time value of money
- Compare and contrast returns trends based on exit multiple contraction or expansion
- Discussion on why highly levered transactions must exit within 3 to 5 years
- Analyze and partially quantify the trend towards dividends to financial sponsor as opposed to debt paydown
• Analyze basic credit and leverage statistics and equity sources that drive the LBO model
© Wall Street Training & Advisory, Inc. +1 (212) 537-6631 Hamilton Lin, CFA [email protected] Founder & CEO wallst.training
15
MERGER & LBO MODELING TOPICS
Advanced LBO Modeling
Course Goals & Overview:
This course builds upon our Share Repurchase and Quick & Dirty LBO modeling courses which quantifies changes to
capital structure and opportunity cost and our Basic, Quick & Dirty LBO modeling course. We start off by diving deeper
into the typical LBO deal structure and then expand upon the different components of the Sources & Uses analysis;
projecting selected critical Balance Sheet items; constructing more detailed Cash Flow Statement estimates and robust
Debt Sweep, as well as triangulating IRRs for dividends to equity sponsor. Learning objectives include: construct and
sensitize an advanced leveraged buyout model with many nuances and complications of our full-blown complex LBO
model; incorporate fundamental drivers including Sources & Uses, Pro Forma, post-LBO projections, available cash flow,
debt sweep, credit ratios and IRR; selected Pro Forma Balance Sheet items, Debt and Shareholder Equity accounts; Debt
Sweep: incorporate Term Loan mandatory amortization and integrating and sweeping additional new and existing debt
tranches; sensitize core IRR to equity sponsor as well as triangulate IRR.
Learning Objectives:
• Discussion on leveraged buyouts, including overview, rationale, ideal candidate and drivers of value
• Construct and sensitize an intermediate level leveraged buyout model with many nuances and complications of our
full-blown complex LBO model
• Incorporate fundamental drivers including Sources & Uses, Pro Forma, post-LBO projections, selected Pro Forma
Balance Sheet items, available cash flow, detailed debt sweep, credit ratios and IRR
Course Sections:
• Drivers of value from a financial point of view and changes in capital structure
- Comparison to share repurchases and the lack of value creation
- Counter argument of cost of capital, funding costs and opportunity costs arbitrage
- Counter-counter argument of weighted average cost of capital changes
- Final assessment of source of returns of LBOs
- We first introduce the obvious rationales, then prove why that is wrong, then disproof the proof and disprove that
and disprove that and finally agree on how corporate finance and the capital markets extract value from capital
structure arbitrage
- In short, participants might be thoroughly confused at first, but will finally understand every aspect of the value
proposition by the time we are done!
• Build an expanded Sources and Uses of Funds analysis that dictates LBO value
- Sources of Funds: inclusion of rollover equity, detailed debt structure & maximizing debt capacity
- Uses of Funds: ability to toggle refinancing of existing debt, excess cash usage, proper treatment of debt financing
fees, tender costs and transaction costs
• Construct a Pro Forma, post-LBO Income Statement projection model incorporating LBO changes
- Calculate new, Pro Forma interest expense and amortization of debt financing fees
- Calculate cash flow available to firm through expanded debt sweep pay off high debt volumes
- Constructed simulated Cash Flow Statement, including CFO, CFI and CFF
• Expanded Debt Sweep schedule to flow through various debt items
- Incorporate Term Loan mandatory amortization and dynamic pre-payment
- Integrate and sweep through additional new and existing debt tranches
• Create condensed IRR (internal rate of return) analysis to evaluate financial sponsor returns
- Comparison of IRR to multiple of capital as a return metric and benchmark
- Identify true source of returns, from building of equity to time value of money
- Compare and contrast returns trends based on exit multiple contraction or expansion
- Discussion on why highly levered transactions must exit within 3 to 5 years
- Analyze & partially quantify the trend towards dividends to financial sponsor as opposed to debt paydown
- Triangulate IRR when there are unequal cash flow returns to equity sponsor primarily through dividends
- Analyze basic credit and leverage statistics and equity sources that drive the LBO model
© Wall Street Training & Advisory, Inc. +1 (212) 537-6631 Hamilton Lin, CFA [email protected] Founder & CEO wallst.training
16
INDUSTRY-SPECIFIC TOPICS
Bank Industry Primer + Basic Bank Modeling
Course Goals & Overview:
Balance sheet based companies, such as banks, play by different rules and methodologies based on the unique nature
of their business. Focus is placed on our Commercial Banks financial statements primer which dives deep into a bank’s
unique financial statement terminology and drivers. Understand how to analyze a bank and why the standard financial
analysis and valuation methodologies that apply to most companies do not apply to industries that “use money to make
money”. Start with a brief overview of the main banking functions (commercial, investment, asset management) and
quickly turn to the quality of book of loans and analysis of net vs. gross charge-offs vs. provisions, etc. Understand the
critical credit ratios and capital adequacy analysis as well as Tier 1 and II definitions and Basel II impact. Crystallize the
impact of Interest Rates, importance of term structure and credit spreads and implications on a bank's profitability.
Examine best practices in calculating net interest income via average asset and liability balances on the income
statement. Dive into an analysis of Balance Sheet assets & liabilities and articulate the drivers of EPS growth. Wrap up by
analyzing valuation parameters: key banking valuation multiples (PE, PEG, Book Value, ROE).
Build a basic, streamlined bank financial model that builds upon the bank terminology in our Bank Industry Primer
course. Before diving deep into the complex nuances of our Advanced Bank Financial Model, really solidify your
understanding of developing the logic in loan losses and provisions and its impact on the rest of the larger bank
financial statements.
Course Sections:
Banking Industry Overview
• Overview of main banking functions (commercial, investment, asset management)
• Quality of book of loans and analysis of net charge-offs
• Critical credit ratios and capital adequacy analysis; Tier 1 and 2 definitions and Basel II impact
• Impact of Interest Rates, importance of term structure and credit spreads
Banking Financial Statement Terminology & Drivers
• Net Interest Income Margin (Interest Expense net against Revenue not COGS)
• Analysis of Balance Sheet Assets & Liabilities
• Drivers of EPS growth
• Valuation Parameters: key banking valuation multiples (PE, PEG, Book Value, ROE)
Bank Financial Modeling
• Perform quick back-of-the-envelope calculations for key Balance Sheet items
• Guestimate Interest Earning Assets and Interest Bearing Liabilities
• Calculate and estimate Net Interest Income
• Estimate and calculate capital adequacy ratios to wrap up your summary simplified bank model
© Wall Street Training & Advisory, Inc. +1 (212) 537-6631 Hamilton Lin, CFA [email protected] Founder & CEO wallst.training
17
INDUSTRY-SPECIFIC TOPICS
Insurance Industry Primer + Basic Insurance Modeling
Course Goals & Overview:
Balance sheet based companies, such as insurance companies, operate by different rules and methodologies based on
the unique nature of their business. Learn insurance financial statement terminology and drivers and the differences
between insurance and reinsurance, Property & Casualty insurance, and Life & Health insurance. Identify the major
players along the insurance spectrum including retail brokers, wholesale brokers, managing general agents, managing
general underwriters, and captive carriers. Differentiate between the different types of premiums (direct, ceded, net,
written, earned) on the Income Statement and understand loss triangles and the main differences between statutory vs.
GAAP accounting. Understand insurance valuation parameters: key insurance multiples (PE, book value,
premium/surplus.) Review key assets line items (premiums receivable, reinsurance recoverable, prepaid reinsurance
premiums) on the Balance Sheet as well as the liabilities (loss and loss adjustment expense reserve, unearned premium
reserve). Build a quick, simplified insurance model summarizing selected key items.
Course Sections:
Insurance Industry Overview
• Types of Insurance: Property & Casualty vs. Life & Health
• Insurance industry players and their functions, roles and value-add
• Modern insurance industry structure
• Reinsurance and retrocession: types (quota-share vs. XOL) and their impact on financials
Insurance Financial Statement Terminology & Drivers
• IS: Premiums: Direct vs. Ceded vs. Net and Written vs. Earned vs. UEPR
• IS: Losses Incurred and LAE Incurred (ALAE vs. ULAE) and Commissions vs. DAC
• Statutory vs. GAAP Net Income – main differences
• BS Assets: Premiums Receivable, Reinsurance Recoverable, Prepaid Reinsurance Premiums
• BS Liabilities: Loss & LAE Reserve, Unearned Premium Reserve
• Valuation Parameters: key insurance multiples (PE, Book Value, Premium/Surplus)
Insurance Financial Modeling
• Project written and earned premiums and unearned premium reserve
• Calculate Loss & LAE and reserves based on a simple two-year incurred/paid logic
• Construct basic Income Statement, distinguishing between Underwriting Income and GAAP
• Construct simplified Balance Sheet – does not incorporate all major GAAP “grossed up” line items
• Utilize short cash flow sweep to balance the mini-model
• Perform quick Statutory Adjustment from GAAP financials
© Wall Street Training & Advisory, Inc. +1 (212) 537-6631 Hamilton Lin, CFA [email protected] Founder & CEO wallst.training
18
INDUSTRY-SPECIFIC TOPICS
Oil & Gas Services Industry Primer + Modeling
Course Goals & Overview:
The energy industry impacts everyone in one way or another, from commuters to bottled water consumers. Oil and
natural gas are the world’s leading energy supply, with gas stations in every neighborhood fueling cars and trucks that
travel millions of miles a day. Supporting the entire oil & gas sector is the entire oil & gas services ecosystem.
We begin with an oil & gas services industry primer by introducing the oil & gas field development cycle and the
corresponding supporting oil services, from feasibility studies to contract drilling from onshore to offshore, marine-
based oil rigs. Drill into the drilling related service s& equipment and understand casing and completion to
infrastructure & installation and production & maintenance.
Then we focus on analyzing a leading global oil & gas services provider (Halliburton). We will build and constructing the
detailed segment build-up portion of the financial model that feeds the Income Statement of your oil & gas services
financial model. Understand various industry conventions for rig counts (SWACO and Baker Hughes).
Course Sections:
Oil & Gas Services Industry Primer:
• What exactly is oil & gas? How did oil start? Who started it?
• Products that use petroleum; different types of oil (light vs. heavy, sweet vs. sour)
• Worldwide oil benchmarks and why they matter
• Onshore well drilling and pumping; primary and secondary recovery
• Offshore drilling from start to finish, including various drilling platform types
• Mining oil sands; what is special about bitumen?
• Oil & gas Services: Learn all the services with which oil firms need assistance
• Who do they call on when they need help, tools and parts?
• Deep dive into major oil services: seismology, contract drilling, drill bits, casing & completion, infrastructure and
production & maintenance
• Understand key drivers of growth: How many oil rigs are out there today? How are they counted?
• Brief overview of oil & gas taxation and concession vs. production based contracts
Oil & Gas Services Financial Modeling:
• Quantify the readily identifiable drivers of growth for oil & gas services provider
• Understand rig counts and various footnotes to roll up to revenue figures
• Gain insight into channel checks required to properly ascertain future growth
• Roll-up segment and geographic operating data in footnotes into Income Statement
• Project from Revenue down to Net Income and Earnings per Share
• Analyze various one-time adjustments required and how to properly calculate normalize profitability
• Construct trading statistics analysis, summarize current market valuation of company
• Build fully integrated financial model (optional)
© Wall Street Training & Advisory, Inc. +1 (212) 537-6631 Hamilton Lin, CFA [email protected] Founder & CEO wallst.training
19
INDUSTRY-SPECIFIC TOPICS
Integrated Oil & Gas Industry Primer + Basic Modeling
Course Goals & Overview:
The energy industry impacts everyone in one way or another, from commuters to bottled water consumers. Oil and
natural gas are the world’s leading energy supply, with gas stations in every neighborhood fueling cars and trucks that
travel millions of miles a day. However, oil’s ubiquity should not be mistaken for simplicity; sound investment decisions
require the exploration of the many intricacies within this space.
In this abridged version of our full blown oil & gas integrated analysis, we explain the various sectors and subsectors of
an E&P company with our short introductory primer to familiarize the concepts and terminology. We then introduce and
build a basic, simplified version of our oil & gas integrated model to communicate how one should approach modeling
out the key drivers of growth and basic NAV analysis.
Course Sections:
Oil & Gas Integrated Industry Primer:
• What exactly is oil & gas? How was oil formed? What are the different worldwide benchmarks?
• Products that use petroleum; different types of oil (light vs. heavy, sweet vs. sour)
• Upstream: Onshore & offshore well drilling and pumping; primary, secondary & tertiary recovery
• Downstream: converting unusable crude oil into refined, useable various end products
• Summary review of the process of refining, distillation and cracking; transportation and petrochemicals
• Understanding Nelson complexity index for refineries and economics of crack spreads
• Brief overview of oil & gas taxation and concession vs. production based contracts
• Financial statements analysis: oil reserves (P1, P2, P3) & expense treatment (successful efforts vs. full cost)
• Operating metrics: reserves to production ratio, reserve replacement ratio, cost ratios, production curves
Oil & Gas Integrated – Segment Build-up
• Build simplified oil & gas model, highlighting the important modeling concepts for oil & gas integrateds
• Upstream segment build-up analysis: project future exploration & production revenue and EBITDA based on oil-
equivalent production volume, realized prices, % realized vs. benchmark and other key drivers of growth
• Downstream segment: project refining capacity, throughput, capacity utilization, gross vs. net refining margins, crack
spreads, realized vs. crack spreads to calculate refining & marketing revenue and EBITDA
• Petrochemicals segment: project volume, petrochemicals product price differentials to derive future revenue
• Roll-up upstream, downstream and petrochemicals segments to start Income Statement projection model
5-Year Income Statement Projection Model
• Input historical financial results and recast as necessary for one-time adjustments
• Incorporate segment build-up as the start of future projection years into Income Statement
• Calculate historical growth rates and margins which serve as the basis for your projection assumptions
• Calculate projected profitability from revenue down to EPS
NAV and PV-10 Valuation Model
• Analyze reported proven reserves footnote which serve as the starting point NAV and PV-10 analysis
• Incorporate production curve projections from larger financial model to project future total production
• Estimate realized prices and production costs per barrel from your larger model and past projection period
• Calculate revenue and costs to derive pre- and post-tax cash flows and discount for NAV and PV-10 analysis
• Include other segments (downstream and petrochemicals) to arrive at estimated Total Enterprise Value
© Wall Street Training & Advisory, Inc. +1 (212) 537-6631 Hamilton Lin, CFA [email protected] Founder & CEO wallst.training
20
INDUSTRY-SPECIFIC TOPICS
REIT Modeling
Course Goals & Overview:
Build a fully integrated, scalable, REIT financial model including detailed build-up by internal growth, acquisitions,
dispositions, and new development. Consolidate the various business assumptions with Consolidating Income
Statement which flows through to the rest of the financial statements. Integrate income statement projections with a
self-balancing balance sheet, an automated cash flow statement and the balancing cash flow sweep schedule. Learning
objectives include: build detailed, fully integrated, quarterly REIT financial projection model; model various real estate
acquisition volume scenarios; incorporate dispositions and relevant adjustments to financials; integrate new
development and construction-in-progress assumptions.
Course Sections:
REITs, REIT Terminology and REIT Market:
• Overview of REITs, terminology and legal structure (e.g., UPREIT)
• REIT profitability and performance metrics including FFO, AFFO, straight-lining and FAS 141
Acquisitions:
• Model out future quarterly projected acquisition volume based on historical trends
• Estimate revenue, expenses, margins and NOI
• Calculate associated estimated depreciation expense
Dispositions:
• Model out future quarterly projected dispositions based on historical trends
• Estimate revenue, expenses, margins and NOI
• Estimate gross proceeds, gain/loss, net book and change to accumulated depreciation
New Development:
• Model out future quarterly projected development starts and completions
• Estimate revenue, expenses, margins and NOI
• Calculate net change to development properties, construction in process and investments
Income Statement:
• Consolidate acquisitions, dispositions & development figures into Consolidating Income Statement
• Calculate revenue and NOI including rental revenue and real estate expenses
• Calculate total expenses down to EBITDA, Net Income, FFO and EPS
Balance Sheet, Cash Flow Statement and Sweep:
• Project investments, CIP, land under development and all asset and liability balances
• Calculate CFO (including working capital), CFI and CFF items specific to REITs
• Build cash flow sweep to capture any shortfalls / build-up in cash to balance the entire model
• Build interest schedule to fully integrate the model
• Incorporate capitalized interest expense estimates, convertible notes and share repurchases
• What are circular references, why should they be avoided and how to get around them
Prerequisites:
• Accounting & Financial Statements Integration
• Basic Financial Modeling
• Advanced Financial Modeling – Core Model
© Wall Street Training & Advisory, Inc. +1 (212) 537-6631 Hamilton Lin, CFA [email protected] Founder & CEO wallst.training
21
TECHNICAL APPLICATIONS – EXCEL
Excel Fundamentals for the Finance Professional
Course Goals & Overview:
This course focuses on how learning the fundamental building blocks of Excel so you can begin to take advantage and
leverage all of Excel’s true capabilities. In order to efficiently build models and crunch large data dumps in Excel, one
must master the basics before the advanced content. Learn relevant financial formulas, proper navigation, formatting of
files and worksheets, creating calculations in cells, and linking between worksheets/tabs. Functions and tools covered in
this course include: mathematical, financial, logic, date/time formulas; data manipulation; anchoring; data tables; and
building a capstone model. Emphasis will be on using shortcut keys, simplifying steps, and manipulating data. You will
leave with techniques you can use immediately, allowing you to work faster and with less effort.
Learning Goals:
• Learn basic features of Excel and how to properly navigate and format Excel files and worksheets
• Learn basic functions and creating calculations in cells and linking between tabs (worksheets)
• Introduction to basic data manipulation and realizing the power and capabilities of Excel
• Learn relevant financial formulas and functions and how to begin maximizing Excel’s abilities
Course Sections:
Fundamental Excel Functions
• Mathematical functions: SUM, MAX, AVERAGE, MEDIAN, MIN
• Financial functions: PV, FV, RATE, NPV, IRR
• Logic Functions: IF, nested IF, CHOOSE, AND, OR
• Date Functions: MONTH, DAY, YEAR, WEEKDAY, EO MONTH
• Time Functions: HOUR ,MINUTE, SECOND, TODAY, NOW
• Formatting: fills, copy formulas, paste special
Intermediate Excel Techniques
• Data Manipulation: TEXT, CONCATENATE, ROUND
• Anchoring and locking cell references
• Build simple capstone financial model that encompasses efficiencies, shortcuts and sensitivity analysis
• Shortcuts and working with Add-ins
© Wall Street Training & Advisory, Inc. +1 (212) 537-6631 Hamilton Lin, CFA [email protected] Founder & CEO wallst.training
22
TECHNICAL APPLICATIONS – EXCEL
Advanced Excel for Data Analysis
Course Goals & Overview:
This course focuses on how to effectively and efficiently utilize Microsoft Excel for data analysis. A financial analyst will
not only use Excel to build financial models, but also to crunch a large data dump. Learn how to minimize as much
manual labor as possible, thereby saving time and performing more detailed analysis quickly. Apply commonly-used
formulas in new and different ways; uncover often over-looked Excel formulas; streamline number crunching and
analysis via functions and tools including pivot tables, sumif, sum+if, transpose, working with arrays, vlook-up, subtotals,
and regression analysis; enhance your spreadsheets with drop-down boxes, data validation techniques, automation of
alternate row shading; take Excel to the next level with an introduction to building and automating simple macros and
more!
Learning Goals:
• Learn how to minimize as much manual labor as possible in data analysis
• Learn to use the most overlooked Excel formulas that will make your life easier
• Learn powerful functions built in Excel that streamline your analysis
• Learn how to build macros to automate common tasks
Course Sections:
• Learn the most useful and overlooked Excel shortcuts to make life easier!
• What are the different ways to make your Excel worksheet into a model instead of just a flat analysis? Learn different
“switches alternatives” (if, choose, offset)
• Learn data validation techniques to dummy proof your model!
• Perform basic regression analysis using least squares approach
• How do you perform one-dimension and two-dimensional sensitivity analyses using data tables?
• Utilize the vlookup function to its fullest to streamline tedious lookup jobs
• Pivot Tables: Everybody’s heard of it but who knows how to use it! Learn how to summarize and dissect large
amounts of data for analysis!
• Pivot Tables: Even better – add built-in and custom calculated fields to really use pivot tables to the max!
• Utilize the sumif formula and sum+if array functions to simplify complex conditional calculations
• Learn how to use the subtotal formula and function to minimize errors
• Combine subtotal with AutoFilter options to easily crunch all sorts of data!
• Automate alternate row shading in a table of data using complex conditional formatting
• Learn how to use the transpose array function
• Add some spice to your Excel analysis and models using drop-boxes
• Introduction to recording macros, modifying and coding macros and creating macro icons
© Wall Street Training & Advisory, Inc. +1 (212) 537-6631 Hamilton Lin, CFA [email protected] Founder & CEO wallst.training
23
TECHNICAL APPLICATIONS – EXCEL
Excel Charting & Graphing Techniques & PowerPoint Integration
Course Goals & Overview:
“A Picture is Worth a Thousand Words” – but what happens when you have the perfect image in your head but you can’t
get Excel to graph it the way you want? Ever get annoyed at constantly having to go back into “Source Data” whenever
you add an item to your data series? Or how about getting the perfect sized bar or line without resorting to using a ruler
to literally draw it on! This course builds upon our Advanced Excel for Data Analysis course and focuses advanced
charting & graphing techniques and how to properly integrate with PowerPoint. A critical, must-take course especially
for professionals that have to create graphs in their presentations, reports and slides. As usual, we emphasize and teach
all the best practices and focuses on our core Excel learning goal: automation, automation, automation! Leave nothing
to chance, there is always a way to simplify and automate your charting & graphing approach. This jam-packed session
includes: waterfall charts, football fields, dynamic ranges, and much, much more! Learn the best practices of integrating
into PowerPoint, when to embed, link (never) and copy as picture, as well as add to our Excel macros with a couple
handy PowerPoint macros.
Learning Goals:
• Translate Excel analysis into meaningful charts and graphs to visually present your work
• Master the skills necessary to create robust dynamic charts easily and effortlessly
• Learn different techniques and best practices of integrating charts into PowerPoint
• Advance beyond simple charting functions to create multi-layered graphs that combine and display multiple data sets
and ideas simultaneously
Course Sections:
• Creating Price Volume chart with call-out box annotations with perfect alignment
• Calculate and create dynamic moving average charts
• Construct Indexed Stock Price History graph with automated information box
• Build historical industry graph summarizing average, high low bars detailing valuation spreads
• Construct combination charts and graphs including precise annotations and secondary axis formatting
• Properly structure beta and volatility analysis and regression on multiple axis
• Construct historical and projected linear regression graph with automated best fit lines
• Assemble and understand logic behind “step charts” with X and Y Error bars to connect the dots
• Create dynamic charts and graphics that automatically update as additional source data is added
• Build Shares Traded at Various Prices graph with absolute perfectly sized and aligned graphs
• Create simple column and cumulative column (or bar) chart (multiple stacked chart)
• Learn how to create complex, combination charts such as double stacked charts
• Go all out by building a “football field” valuation range chart that combines triple stacked charts with XY scatter plot to
automate current stock price line
• Construct waterfall chart that graphically summarizes sum-of-parts valuation
• Learn best practices of bringing Excel charts and exhibits into PowerPoint
• Avoid the forbidden linking between files and learn when to embed vs. copy/paste as picture
• Learn the fastest and best ways to work in PowerPoint without the mouse
• Facilitate chart and graph placement in PowerPoint with our custom PPT macros
© Wall Street Training & Advisory, Inc. +1 (212) 537-6631 Hamilton Lin, CFA [email protected] Founder & CEO wallst.training
24
PORTFOLIO & RISK MANAGEMENT
Credit Risk Modeling in Excel & VBA: Default Risk and Prepayment Modeling
Course Goals & Overview:
This course provides an in-depth introduction to credit risk. Techniques for modeling credit transition matrices are
covered in great detail, while several statistical techniques for modeling default probabilities and correlations are
explored in depth. Methodologies for modeling credit portfolio risk are covered, including the asset value approach and
the structural approach. Prepayment models are developed for Mortgage-Backed Securities (MBS). All models are
developed in Excel/VBA.
Learning Objectives:
• Excel - learn several of Excel's specialized functions. Understand how to use Excel's add-in tools to implement
advanced statistical techniques, such as regression analysis. Learn how to use Solver, Excel's soptimization package.
• Visual Basic for Applications (VBA) - learn the fundamental programming structures of the VBA language, and how it
can be used to extend Excel's capabilities.
• Statistical foundations - learn to implement Monte Carlo simulation using Excel/VBA. Learn techniques for improving
the speed of convergence, including importance sampling and low-discrepancy sequences. Understand the binomial
and Poisson distributions. Learn the fundamental principles of linear regression analysis, as well as Poisson
regression. Understand the maximum likelihood and method of moments approaches to statistical estimation.
• Merton’s model – understand Merton’s model of credit risk; learn how it is related to the Black-Scholes model and
how it can be used to compute default probabilities.
• Credit ratings transition matrices - understand the structure of a transition matrix. Learn how to estimate a transition
matrix with the cohort approach and the hazard rate approach.
• Estimating default probabilities and correlations - understand how to use linear regression analysis to estimate
default probabilities. Learn how to apply Poisson regression to estimate default probabilities. Understand how the
asset value approach can be used to estimate default correlations using the method of moments approach and
maximum likelihood approach.
• Credit portfolio risk models - understand different approaches to modeling credit portfolio risk. Learn how to use
Monte Carlo and Quasi-Monte Carlo simulation to implement the asset value approach. Learn how the structural
approach is used to explain the sources of credit risk, and how it can be implemented as an extension of the Black-
Scholes option pricing model.
• Prepayment modeling – understand the structure of Mortgage-Backed Securities (MBS) and MBS derivatives, such as
Interest-Only (IO) strips and Principal-Only (PO) strips. Understand different measures of prepayment speed, such as
Single Monthly Mortality (SMM), Conditional Prepayment Rate (CPR) and Absolute Prepayment Speed (ABS). Learn
how to implement these measures in Excel.
Course Sections:
• Implement statistical foundations, including Monte Carlo simulation using built-in native Excel functions and tools
• Understand the structure of a credit ratings transition matrix and estimate using the cohort approach and the hazard
rate approach
• Estimate default probabilities and correlations, using Merton's model of credit risk, linear & Poisson regression
analysis, the asset value approach (method of moments and maximum likelihood approaches)
• Simulate and model prepayment rates, incorporating the structure of MBS & related derivatives, including IO and PO
strips
• Model different measures of prepayment speed, such as Single Monthly Mortality (SMM), Conditional Prepayment
Rate (CPR) and Absolute Prepayment Speed (ABS)
• Utilize Excel's specialized functions, including advanced statistical techniques, and Excel's built-in optimization tools
• Code in Excel VBA: learn the fundamental programming structures and how it can be used to extend Excel's
capabilities in Credit Risk Modeling
© Wall Street Training & Advisory, Inc. +1 (212) 537-6631 Hamilton Lin, CFA [email protected] Founder & CEO wallst.training
25
PORTFOLIO & RISK MANAGEMENT
Portfolio Optimization and Efficient Frontier Modeling
Course Goals & Overview:
This course provides an overview of portfolio modeling. The course reviews several key components of portfolio math,
such as standard deviation, correlation and covariance, as well as optimization techniques. Markowitz’ formula for
measuring portfolio risk is covered in detail. The equivalent matrix representation is introduced, along with Excel’s
matrix algebra functions. The Capital Asset Pricing Model (CAPM) framework is used to introduce several key concepts,
such as beta and the efficient frontier. Excel Solver is used to derive the efficient frontier from a portfolio of stocks. Beta
is estimated using linear regression analysis. The Capital Market Line and Security Market Line are derived, showing the
relationship between risk and return in equity markets. The Sharpe Ratio is introduced as a measure of relative risk.
Learning Objectives:
• Excel – Learn several advanced statistical and mathematical functions in Excel. Understand how Excel’s add-in tools
can be used for regression analysis. Learn how to use Excel's specialized matrix algebra operations. Understand how
to optimize functions using Excel’s Solver add-in.
• Portfolio math – Gain an in-depth understanding of the statistical concepts that form the foundation of portfolio
theory, including expected return, standard deviation, covariance and correlation. Learn how to calculate these
measures in Excel, and understand their economic significance. Learn how the inputs to a portfolio model can be
estimated from historical data using Excel.
• Optimization – Learn the basic principles of constrained and unconstrained optimization using Excel’s matrix algebra
functions and Solver.
• Markowitz’s model – Understand how Markowitz’s model is used to measure the risk of a portfolio. Understand the
concept of diversification and how it relates to correlation and covariance. Learn how to implement Markowitz’s
formula for multiple assets using Excel’s built-in matrix algebra functions.
• The Capital Asset Pricing Model (CAPM) – Understand the statistical foundations of the CAPM model. Understand how
beta is derived and how it is interpreted. Understand the significance of the Capital Market Line and the Security
Market Line and how they may be implemented in Excel. Learn how to compute and interpret Jensen’s alpha.
• The Efficient Frontier – Understand the properties of the efficient frontier and how it can be implemented using
optimization techniques. Learn how to construct the efficient frontier using Excel Solver. Understand how the
minimum variance portfolio and the market portfolio are constructed. Learn how to optimize the weights of the
assets in a portfolio to earn a target return given any constraints on the risk of the portfolio. Learn how the ability to
sell stocks short affects the efficient frontier. Understand how the availability of a risk-free asset impacts the efficient
frontier. Understand how portfolio rebalancing may be used to preserve a portfolio’s risk and return characteristics
over time.
Course Sections:
• Extend the fundamentals of CAPM to the foundations of portfolio math, such as standard deviation, correlation and
covariance, as well as optimization techniques
• Learn how to easily implement Markowitz's efficient frontier methodology using Excel's matrix algebra functions and
array tools to quickly calculate correlations amongst almost infinite set of securities
• Understand and quantify the concept and benefits of diversification and how risk can be reduced with a portfolio of
assets
• Start with raw return data for equity securities and construct optimal stock portfolio in Excel; then layer on different
asset classes including cash, fixed income and options
• Sensitize and quantify the effect of specific securities in the context of the overall portfolio: for instance, a stock may
optimize the stock portfolio but not the overall diversified portfolio
• Utilize Excel to optimize portfolio construction based on maximizing returns and minimum variance mix of securities,
using advanced statistical and mathematical functions


![1-Sunflower 6631 Vertical Tillage Coverpage - TNT Eq Vertic… · FEATURES AND BENEFITS SUNFLOWER 6631 SPLIT WING VERTICAL TILLAGE [200]-1 General Vertical tillage is becoming one](https://static.fdocuments.in/doc/165x107/5b01c4497f8b9a84338ea9ba/1-sunflower-6631-vertical-tillage-coverpage-tnt-eq-verticfeatures-and-benefits.jpg)