Walk Bike Dutchess Chapter 1: Introduction€¦ · Walk Bike Dutchess Chapter 1: Introduction...
9
Walk Bike Dutchess Chapter 1: Introduction Effective March 27, 2014 Chapter 1: Introduction A lot has changed since the Poughkeepsie-Dutchess County Transportation Council (PDCTC) published its first Bicycle and Pedestrian Plan in 1996. The Dutchess Rail Trail, which was discussed as a possibility in the 1996 Plan (as the Maybrook Corridor), was completed in 2013, and now includes more than 13 miles of paved shared-use trail for walking and bicycling. The Walkway Over the Hudson, which was also mentioned in the 1996 Plan (as the Poughkeepsie Railroad Bridge), was completed in 2009 and connects the Dutchess Rail Trail to the Hudson Valley Rail Trail in Ulster County. And the Harlem Valley Rail Trail, shown as proposed in the 1996 Plan, now includes over ten miles in the eastern part of Dutchess County, with additional sections planned. These trails have proven to be extremely popular, providing residents of all backgrounds with opportunities to walk and bicycle in a pleasant, traffic-free environment. At the same time, walking and bicycling for transportation have gained prominence as healthy, economical, and carbon-free alternatives to driving, and creating walkable, bikeable places is a top economic development strategy for communities looking to become more vibrant and attractive. Pedestrian and bicycle planning is changing rapidly, with new designs and facility types to serve the needs of people of various abilities and comfort levels, particularly the ‘interested but concerned’ who want to bicycle for transportation but don’t feel comfortable sharing a travel lane with motor vehicles. In Dutchess County, we now have a great opportunity to build on the popularity of the rail trails and the increasing desire for alternatives to driving by developing networks of ‘Complete The Walkway Over the Hudson had 700,000 visitors in 2013. The Dutchess Rail Trail provides recreation and transportation options. 1
Transcript of Walk Bike Dutchess Chapter 1: Introduction€¦ · Walk Bike Dutchess Chapter 1: Introduction...

Walk Bike Dutchess
Chapter 1: Introduction Effective March 27, 2014
Chapter 1: Introduction A lot has changed since the Poughkeepsie-Dutchess County Transportation Council (PDCTC) published its first Bicycle and Pedestrian Plan in 1996. The Dutchess Rail Trail, which was discussed as a possibility in the 1996 Plan (as the Maybrook Corridor), was completed in 2013, and now includes more than 13 miles of paved shared-use trail for walking and bicycling. The Walkway Over the Hudson, which was also mentioned in the 1996 Plan (as the Poughkeepsie Railroad Bridge), was completed in 2009 and connects the Dutchess Rail Trail to the Hudson Valley Rail Trail in Ulster County. And the Harlem Valley Rail Trail, shown as proposed in the 1996 Plan, now includes over ten miles in the eastern part of Dutchess County, with additional sections planned. These trails have proven to be extremely popular, providing residents of all backgrounds with opportunities to walk and bicycle in a pleasant, traffic-free environment.
At the same time, walking and bicycling for transportation have gained prominence as healthy, economical, and carbon-free alternatives to driving, and creating walkable, bikeable places is a top economic development strategy for communities looking to become more vibrant and attractive. Pedestrian and bicycle planning is changing rapidly, with new designs and facility types to serve the needs of people of various abilities and comfort levels, particularly the ‘interested but concerned’ who want to bicycle for transportation but don’t feel comfortable sharing a travel lane with motor vehicles. In Dutchess County, we now have a great opportunity to build on the popularity of the rail trails and the increasing desire for alternatives to driving by developing networks of ‘Complete
The Walkway Over the Hudson had 700,000 visitors in 2013.
The Dutchess Rail Trail provides recreation and transportation options.
1

Walk Bike Dutchess
Chapter 1: Introduction Effective March 27, 2014
Walkable centers are ideal for those with less mobility or limited access to transportation.
Streets’1
that make it possible for all of us to walk and bicycle safely to local destinations such as schools and colleges, shops and offices, parks and trails, libraries and community centers, and train stations and bus stops.
This Plan update accounts for new facilities and programs, evolving design standards and best practices, new legislation, and recent research and data. The intent of the Plan is to establish a vision for the county and serve as a resource for local municipalities. The update is also a recommendation of Moving Dutchess, the PDCTC’s Metropolitan Transportation Plan that was approved in 2011. A. Why is Walking and Bicycling for Transportation Important? The PDCTC’s mission is to provide the resources (funding) and tools (planning) necessary to build and maintain a transportation system that promotes the safe and efficient movement of people and goods in a sustainable manner. Walking and bicycling are key parts of a complete transportation system. In communities with connected networks of walking and bicycling infrastructure—sidewalks and crossings, bicycle lanes and shared-use paths, in addition to shared lanes and roadway shoulders—people can choose to walk and bike for transportation: for trips to school, work, shopping, visiting friends, and errands. Walking and bicycling become integrated into daily life, rather than solely a
1 Complete Streets is a term used to describe streets that are designed, maintained, and operated to enable safe access for all: people walking, bicycling, taking transit, and driving; people of all ages and abilities. For more information, see http://www.smartgrowthamerica.org/complete-streets and https://www.dot.ny.gov/programs/completestreets.
recreational activity. Several trends support an increased focus on walking and bicycling for transportation: • Aging population: Across the country, the number of older
adults is growing—fast. In Dutchess County, 6.4 percent of the population (almost 19,000 residents) is over age 75. This has increased from 5.0 percent (13,000 residents) in 1990 and 5.5 percent (15,000 residents) in 2000. Estimates show that county residents aged 75 and older are expected to represent 7.5 percent of the population by 2025 and almost 10 percent (over 32,000 people) by 2040.2
2 Cornell University Program on Applied Demographics:
These older adults want to live in communities that are safe and accessible by walking. In fact,
http://pad.human.cornell.edu/counties/projections.cfm
2

Walk Bike Dutchess
Chapter 1: Introduction Effective March 27, 2014
the AARP has been a leading proponent of Complete Streets policies at the national level.
• Younger adults’ decreasing interest in driving: Research shows
that the average miles driven by young people (16-35 years old) in the U.S. decreased by 23 percent between 2001 and 2009, and the share of young people without a driver’s license increased from 21 percent in 2000 to 26 percent in 2010.3
Instead of driving, young adults are increasingly walking, bicycling, and taking transit, and they are choosing communities that make it easy to do so.
• Rising obesity levels: Childhood obesity in the U.S. has more than tripled over the past 30 years. Many chronic diseases (including diabetes, heart disease, asthma and cancer) are linked to obesity and overweight. In Dutchess County, 30 percent of adults are overweight and almost 31 percent are obese; for children, about 17 percent are overweight and 19 percent are obese.4
A higher percentage of our children are overweight and obese than the national average, for both boys and girls of all ages. Regular physical activity such as walking and bicycling is critical to maintaining a healthy weight and improving health.
• Escalating fuel prices and uncertainty: Across the country, gasoline prices have increased sharply in the last decade, from an average of about $1.50 a gallon in 2000 to over $3.50 a
3 The Atlantic Cities, Place Matters: “Why Young Americans Are Driving So Much Less Than Their Parents”, Richard Florida, April 10, 2012. 4 Dutchess County Department of Health, Community Health Assessment 2010-2013
gallon in 2011.5
In the northeast, prices are even higher: currently close to $4.00 a gallon. It is unlikely that the cost of gas will go down significantly; in fact, long-term projections show it will keep climbing. Increasing costs, as well as potential interruptions in the fuel supply, whether due to natural disasters or national and international events, highlight the importance of non-motorized transportation.
• Growing centers: In every decade between 1920 and 2000, suburbs grew faster than urban centers. Recently, this trend has switched: urban areas are now growing faster than suburbs.6
This is due to many factors, including the aging population, rising fuel prices, the tightening housing market, and an increasing desire by many for the amenities of urban or village living— including the ability to walk and bike between everyday destinations.
• Increasing environmental concerns: It is clear that our transportation choices affect our natural environment, from air quality to climate change. The projected increased frequency of floods and other extreme weather events raises the importance of reducing our impact on the environment and creating resilient transportation systems that provide options, such as walking and bicycling, that don’t require fuel or power and can function even during major storms.7
5 U.S. Energy Information Administration,
http://www.eia.gov/petroleum/gasdiesel/ (accessed 11/21/12) 6 Tuckel and Milczarski, “Population Shifts and Implications for Walking in the United States”, Hunter College, 2012. 7 Managing the Risks of Extreme Events and Disasters to Advance Climate Change Adaptation- Summary for Policymakers; Intergovernmental Panel on Climate Change 2012, available at http://ipcc-wg2.gov/SREX/report/.
3

Walk Bike Dutchess
Chapter 1: Introduction Effective March 27, 2014
Protected bicycle lanes improve safety and help the local economy (source: NYC DOT, Measuring the Street: New Metrics for 21st Century Streets).
All of us want safe and convenient transportation options. Creating communities where it is safe and pleasant to walk and bicycle is a matter of social equity, because it provides options for all of us—young, old, those of us with disabilities, those without a car, and those who prefer not to drive. B. Why Invest in Walking and Bicycling? Building and maintaining walking and bicycling infrastructure bestows numerous benefits on our local economy, our communities, our health, and our environment. Economic Benefits Research has documented a number of economic benefits related to investing in walking and bicycling. First, walking and bicycling infrastructure projects create 11-14 jobs per $1 million spent, compared to 7 jobs per $1 million spent on road repair projects.8 Second, real estate is worth more in walkable communities: places with good walkability command about $7/square foot more in retail rents, $9/square foot more in office rents, and over $81/square foot more in residential sales value, compared to places with fair walkability.9
According to a survey by the National Association of Realtors, 77 percent of Americans consider having sidewalks and places to take
8 Bicycling and Walking in the United States: 2012 Benchmarking Report, Alliance for Biking and Walking. 9 Walk This Way – The Economic Promise of Walkable Places in Metropolitan Washington, D.C.; Christopher B. Leinberger and Mariela Alfonzo, Brookings Metropolitan Policy Program, May 2012.
a walk one of their top priorities when deciding where they’d like to live.10
10 Community Preference Survey, National Association of Realtors, 2011.
4

Walk Bike Dutchess
Chapter 1: Introduction Effective March 27, 2014
Walking and biking provide health, safety, and community benefits (source: activelivingresearch.org).
Third, walking and bicycling infrastructure generates tourism. Bicycling is now the second-most common form of outdoor recreation in the U.S. and the third-most popular vacation activity, with 60 million people taking over 2.6 billion bike outings per year. Americans spend more on bicycling gear and trips ($81 billion) than they do on airplane tickets and fees ($51 billion).11 Locally, the Walkway Over the Hudson has demonstrated the economic benefits of walking and bicycling projects: nearly half of the Walkway’s 700,000 annual visitors come from outside the region, and the Walkway generates more than $24 million in new economic impact each year in Dutchess and Ulster Counties.12
Community Benefits Studies show that people walking and bicycling spend more per week or month in local commercial districts compared to those who drive. This is in large part because it is easy to stop in at a local shop and make a purchase when passing by on foot or bicycle.13
Walkable and bikeable places create a sense of community: you’re more likely to greet a neighbor on the street when you’re walking or on a bicycle, rather than isolated in a car.
11 The Active Outdoor Recreation Economy: A $730 Billion Annual Contribution to the U.S. Economy, Outdoor Industry Foundation, 2010. 12 Walkway Over the Hudson, 2012. 13 East Village Shoppers Study: A Snapshot of Travel and Spending Patterns of Residents and Visitors in the East Village, Transportation Alternatives, Oct 1, 2012; Cyclists and Pedestrians Can End Up Spending More Each Month Than Drivers, The Atlantic Cities, 12/5/2012.
Health Benefits According to a report by the State Comptroller, New York spent an estimated $11.8 billion on obesity-related costs in 2011, including treatment for conditions like diabetes, asthma, and heart disease.14
14 Soaring Health Care Costs Highlight Need To Address Childhood Obesity, Office of the State Comptroller, October 2012.
The U.S. Department of Health and Human Services’
5

Walk Bike Dutchess
Chapter 1: Introduction Effective March 27, 2014
Walking reduces one’s risk of cancer, glaucoma, and osteoporosis (source: everybodywalk.org).
Physical Activity Guidelines recommend at least 2.5 hours of exercise per week (30 minutes, five times a week) for adults, and 60 minutes per day for kids.15 According to the Dutchess County Department of Health, 18.5 percent of County adults engage in no leisure-time physical activity.16
Walking and bicycling are easy, low-cost ways to increase physical activity and improve health. Walking 30 minutes a day, five days a week can halve the risk of heart disease and diabetes, and burn fat, strengthen muscles, build bone mass, lower blood pressure, improve balance, and reduce the risk of Alzheimer’s disease. Regular physical activity also improves mental health and reduces stress. Environmental Benefits Nationwide, half of all trips are three miles or shorter (less than a 20 minute bike ride), and one out of
15 http://www.health.gov/paguidelines/guidelines/summary.aspx, accessed July, 2013. 16 Dutchess County Department of Health, Community Health Assessment 2010-2013.
four trips is less than one mile (a 20 minute walk or five minute bike ride).17
C. Plan Purpose
However, most of these short trips are taken by car. If just some of these short trips were taken by foot or bicycle, traffic congestion would be lessened, air quality could improve, and our reliance on fossil fuels would be reduced.
The goal of this Plan is to provide a long-term (20-year) vision for walking and bicycling in Dutchess County. To this end, it includes an analysis of current walking and bicycling travel data, crashes, facilities, and programs, as well as specific performance measures and a series of County-wide recommendations. The Plan is also intended to be a resource for local municipalities. In order to provide detailed information at the local level, the Plan divides the county into five Planning Areas: the Upper and Lower Hudson, Upper and Lower Taconic, and Harlem Valley (see Map 1). These Planning Areas are consistent with those used in Moving Dutchess, the PDCTC’s long-range transportation plan (with one change—moving Pawling to the Harlem Valley). The Design Guidelines, Funding and Implementation, and
Planning Area chapters (which include local data and priority walking and bicycling improvements) can be used by municipalities 17 National Household Travel Survey, 2009.
6

Tivoli
NORTHEAST
MILAN PINEPLAINS
RHINEBECK
Millerton
STANFORD
Rhinebeck
CLINTON
AMENIA
HYDEPARK
WASHINGTON
PLEASANTVALLEY
Millbrook
DOVERUNIONVALE
POUGHKEEPSIE
LAGRANGEPoughkeepsie
BEEKMAN
WAPPINGER
EASTFISHKILL
PAWLING
WappingersFalls
Pawling
FISHKILL
Fishkill
Beacon
RED HOOK
Red Hook
TivoliVillage
Red HookVillage
RhinebeckVillage
SouthBroadway Rock
City
Annandale
Amenia
Wingdale
DoverPlains
MillertonVillage
TenmileStation
Wassaic
DuncanHill
Lafayetteville
FishkillVillage
HopewellJunction
WappingersFalls
Village
Hyde ParkTown Center
PawlingVillage
BeekmanTown
Center
Fairview
Manchester
La GrangeTown Center
PleasantValley
MillbrookVillage
Schultzville
Stanfordville
PinePlains
FishkillSouth
Glenham
Chelsea
CloveBranch
Red OaksMill
NewHackensack
Hughsonville
NewHamburg
SaltPointTpke.
Stormville
Holmes
Poughquag
Rochdale
Arthursburg
Billings
MooresMills
Verbank
EastPark
Hyde ParkCrossroads
Staatsburg
SaltPoint
WashingtonHollow
Mabbettsville
ClintonCorners
ClintonHollow
PleasantPlains
Bangall
Haviland
UpperRed Hook
Lagrangeville
CrownHeights
BeaconWest Main
BeaconEast Main
BeaconStation
HookerAvenue
UpperMainStreetSouth
Avenue
SmithStreet
UnionVale
Center
Poughkeepsie
Rhinecliff
FishkillPlains
ArlingtonNorth
Arlington
Brockway
St.Andrews
PoughkeepsieWaterfront /Mt. Carmel
SiloRidge
Dutchess CountyPlanning Areas & Centers
CentersEmergingExisting
Planning AreasUpper HudsonLower HudsonUpper TaconicLower TaconicHarlem Valley
±Not To Scale
This map is intended for planning purposes only.The PDCTC shall not be held liable for any misuseor misrepresentation of this information.Map contents and data are subject to change.
Map created May 20147
edozier
Typewritten Text
Map 1
Walk Bike Dutchess
Chapter 1: Introduction Effective March 27, 2014
to apply current design principles, identify funding opportunities, and implement projects. The Bicycle-Pedestrian Advisory Committee (BPAC) that assisted with the plan developed the following vision for our County:
In Dutchess County, walking and bicycling will be part of daily life, providing safe and convenient transportation and recreation. To achieve this goal, we must make walking and bicycling possible for everyone: older adults and children; those of us with mobility limitations as well as the able-bodied. Sidewalks and paths must be accessible to those in strollers and wheelchairs and those with canes or walkers. Bicycle facilities must serve the ‘interested but concerned’ who want to bicycle but also want to feel safe and comfortable.18
Sidewalks, paths, and other facilities should provide access to local destinations and enable many types of trips to be made by foot or bicycle: local shopping and errands, trips to school and work, as well as recreational outings.
D. Plan Organization The Plan is organized into seven chapters. The remaining chapters are as follows:
18 In 2005, the Portland, OR Bicycle Coordinator identified four categories of cyclists based on their attitude towards bicycling for transportation and estimated their percentage of the population: strong & fearless (0.5%); enthused & confident (7%); interested but concerned (60%); no way no how (33%). The original article is online at http://www.portlandoregon.gov/transportation/article/237507.
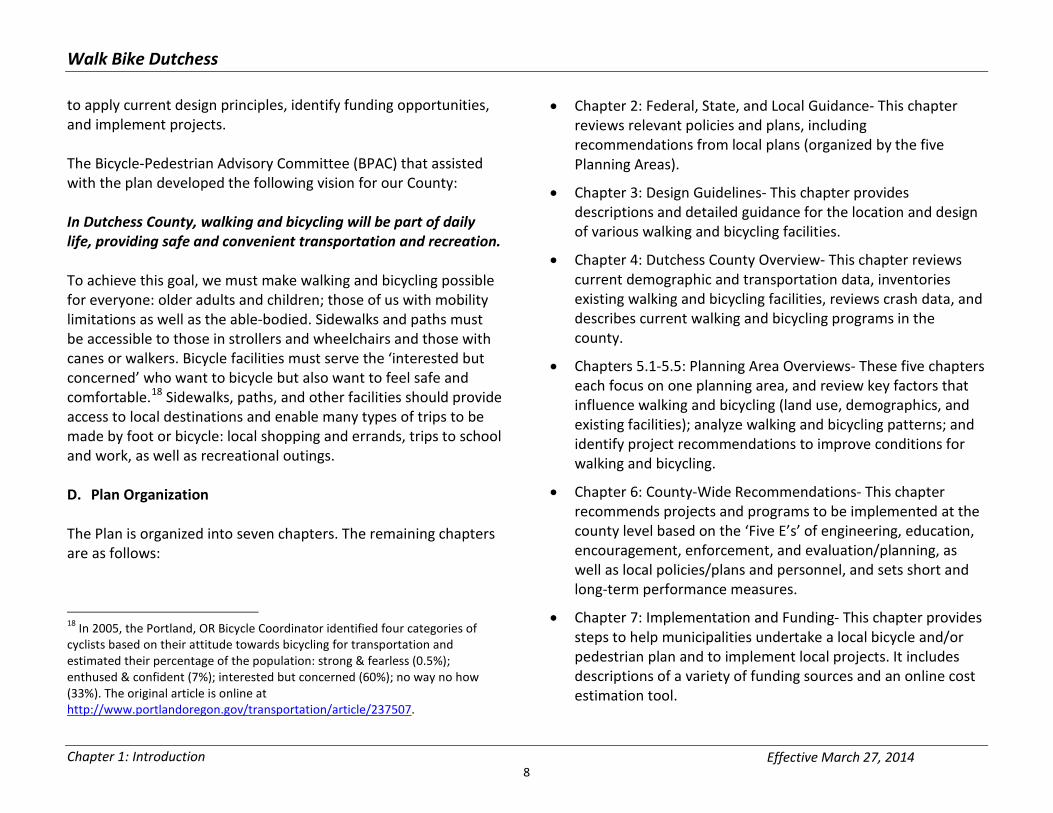
• Chapter 2: Federal, State, and Local Guidance- This chapter reviews relevant policies and plans, including recommendations from local plans (organized by the five Planning Areas).
• Chapter 3: Design Guidelines- This chapter provides descriptions and detailed guidance for the location and design of various walking and bicycling facilities.
• Chapter 4: Dutchess County Overview- This chapter reviews current demographic and transportation data, inventories existing walking and bicycling facilities, reviews crash data, and describes current walking and bicycling programs in the county.
• Chapters 5.1-5.5: Planning Area Overviews- These five chapters each focus on one planning area, and review key factors that influence walking and bicycling (land use, demographics, and existing facilities); analyze walking and bicycling patterns; and identify project recommendations to improve conditions for walking and bicycling.
• Chapter 6: County-Wide Recommendations- This chapter recommends projects and programs to be implemented at the county level based on the ‘Five E’s’ of engineering, education, encouragement, enforcement, and evaluation/planning, as well as local policies/plans and personnel, and sets short and long-term performance measures.
• Chapter 7: Implementation and Funding- This chapter provides steps to help municipalities undertake a local bicycle and/or pedestrian plan and to implement local projects. It includes descriptions of a variety of funding sources and an online cost estimation tool.
8
Walk Bike Dutchess
Chapter 1: Introduction Effective March 27, 2014
The Appendices at the end of the Plan include additional tools and resources. E. PDCTC Background
Established in 1982, the PDCTC serves as the designated Metropolitan Planning Organization (MPO) for Dutchess County. Federal regulations require that Urbanized Areas (U.S. Census defined metropolitan areas with over 50,000 people) be represented by a MPO, which is responsible for ensuring that Federal highway and transit funds are committed through a locally driven, comprehensive transportation planning process. The PDCTC includes representatives from local municipalities, the New York State Department of Transportation, and the Metropolitan Transportation Authority. More information can be found at www.dutchessny.gov/pdctc.htm.
9