WÄRTSILÄ -...
65
02 2015 Twentyfour7. WÄRTSILÄ TECHNICAL JOURNAL ENERGY Optimal reserve operation in Turkey Frequency control and non-spinning reserves 10 60 24 Wärtsilä— the total LNG solution provider Wärtsilä offers one of the most complete portfolios of LNG solutions and services on the market Wärtsilä Dynamic Positioning, Inc. There from the beginning and leading the way into the future MARINE Offshore performance permutations Engine offerings for the new Wärtsilä AHTS vessels ensure economy and adaptability 46 COVER STORY page 54 WÄRTSILÄ 31 ENGINE A new standard for efficiency
Transcript of WÄRTSILÄ -...

022015Tw
enty
four
7.
WÄRTSILÄ TECHNICAL JOURNAL
WÄRTSILÄ NETWORK
WÄRTSILÄ TECHNICAL JOURNAL | WWW.WARTSILA.COM
WÄ
RT
SIL
Ä T
EC
HN
ICA
L J
OU
RN
AL
| 02
.20
15ENERGY
Optimal reserve operation in TurkeyFrequency control and non-spinning reserves
10
60
24 Wärtsilä— the total LNG solution provider Wärtsilä offers one of the most complete portfolios of LNG solutions and services on the market
Wärtsilä Dynamic Positioning, Inc. There from the beginning and leading the way into the future
MARINE
Offshore performance permutations Engine offerings for the new Wärtsilä AHTS vessels ensure economy and adaptability
46
COVER STORY
page54WÄRTSILÄ 31
ENGINE
A new standard for efficiency
The information in this magazine contains, or may be deemed to contain “forward-looking statements”. These statements might relate to future events or our future financial performance, including, but not limited to, strategic plans, potential growth, planned operational changes, expected capital expenditures, future cash sources and requirements, liquidity and cost savings that involve known and unknown risks, uncertainties and other factors that may cause Wärtsilä Corporation’s or its businesses’ actual results, levels of activity, performance or achievements to be materially different from those expressed or implied by any forward-looking statements. In some cases, such forward-looking statements can be identified by terminology such as “may,” “will,” “could,” “would,” “should,” “expect,” “plan,” “anticipate,” “intend,” “believe,” “estimate,” “predict,” “potential,” or “continue,” or the negative of those terms or other comparable terminology. By their nature, forward-looking statements involve risks and uncertainties because they relate to events and depend on circumstances that may or may not occur in the future. Future results may vary from the results expressed in, or implied by, the following forward-looking statements, possibly to a material degree. All forward-looking statements made in this publication are based only on information presently available in relation to the articles contained in this magazine and may not be current any longer and Wärtsilä Corporation assumes no obligation to update any forward-looking statements. Nothing in this publication constitutes investment advice and this publication shall not constitute an offer to sell or the solicitation of an offer to buy any securities or otherwise to engage in any investment activity.
90°W
75°N
45°N
0°
45°S
45°W 0° 45°E 90°E 135°E

Looking at my kids on their smartphones and tablets, I marvel at the pace they amass new information. Just when I’ve learnt what the coolest game is and may even have tested it, they’ve already switched to the next big thing.
Quick turns and sudden changes are the new world order. A status quo no longer exists. Who would have thought that the oil price would be cut in half in less than a year?
This is a tough environment in which to operate, both for our customers and for us. A power plant or a ship engine can have a life span of decades, while new legislation can be introduced within 20 months. Markets can dip in a matter of weeks. Investing a lot of time in predicting what’s next doesn’t make sense; as soon as you finish your calculations, there is another sudden jolt.
So, instead of yearning for a crystal ball, we must focus on maintaining agility and flexibility and ensuring we are equipped to embrace change.
In this issue, you can read about one of our biggest launches to date, the Wärtsilä 31. Not only is it the most efficient engine in history (acknowledged by Guinness World Records, by the way), its modular design suits our fickle world. The Wärtsilä 31 is flexible when it comes to fuels – it runs smoothly on gas or oil or both – and its modularity facilitates maintenance and upgrades. So no matter what the future holds, the Wärtsilä 31 stands ready to adapt.
As for the future, the fast growth of renewables holds steady. You can read about a study in South Australia in which a state-of-the-art modelling framework shows that a Smart Power Generation (SPG) power plant can provide a significant gross margin to the utility, compared to open cycle gas turbine (OCGT) alternatives. At the same time, SPG decreases the risk exposure of the utility by reducing the volatility of annual returns. It goes to show that the inherent operational flexibility of internal combustion engine (ICE) technology, especially its ability to reach full load in less than 5 minutes, is unmatched by other options on the market.
Our Electrical & Automation Business Line gives us an even broader portfolio for catering to sophisticated vessels. With the acquisition of L-3 MSI, we warmly welcome new colleagues and outstanding ideas like Dynamic Positioning, a computer-controlled system that automatically maintains a vessel’s position and heading by using its own propellers and thrusters. Together we will be even more adept in answering our customers’ needs in this fast-changing, but undeniably fascinating, world.
I hope you enjoy your reading!
Ilari Kallio Vice President of R & D, Marine Solutions 4-Stroke Editor-in-Chief of In Detail
issue no. 02.2015 in detail
iPad
Web
Publisher: Wärtsilä Corporation, John Stenbergin ranta 2, P.O. Box 196, FIN-00531 Helsinki, Finland | Editor-in-Chief: Ilari Kallio | Managing editor and editorial office: Virva Äimälä | Editorial team: Tomas Aminoff, Marit Holmlund-Sund, Christian Hultholm, Dan Pettersson, Dinesh Subramaniam, Minna Timo, Susanne Ödahl | Layout and production: Spoon | Printed: October 2015 by PunaMusta, Joensuu, Finland ISSN 1797-0032 | Copyright © 2015 Wärtsilä Corporation | Paper: cover Lumiart Silk 250 g/m², inside pages UPM Fine 120 g/m²
E-mail and feedback: [email protected]
THIS ISSUE OF IN DETAIL is also available on iPad as a Wärtsilä iPublication app from Apple's Appstore, as well as in a browsable web version at http://indetailmagazine.com/.
ENERGY
MARINE
FUTURE
Contents
Value of Smart Power Generation for utilities in
the national electricity market of Australia . . . . . . . . . 4
Optimal reserve operation in Turkey
– frequency control and non-spinning reserves . . . . 10
Electricity market reform policy options
and impact on investments . . . . . . . . . . . . . . . . . . . . . . . 18
Wärtsilä — the total LNG solution provider . . . . . . . . .24
Creating Optimal LNG Storage Solutions . . . . . . . . . 40
Offshore performance permutations . . . . . . . . . . . . . 46
GRIP on Innovation . . . . . . . . . . . . . . . . . . . . . . . . . . . . . . 50
The new Wärtsilä 31 engine . . . . . . . . . . . . . . . . . . . . . . 54
Wärtsilä Dynamic Positioning, Inc.
– there from the beginning and leading
the way into the future . . . . . . . . . . . . . . . . . . . . . . . . . . 60
Visionary collaboration . . . . . . . . . . . . . . . . . . . . . . . . . . 64
QUICK TURNS
Wärtsilä has the expertise, experience and offering you need. Our offering covers integrated solutions*, EPC turnkey delivery**, services and products for all phases of the LNG lifecycle. Read more about what we have to offer your business at www.wartsila.com
WÄRTSILÄ – YOUR KEY TO LNGLET THE LEADER IN LNG ENABLE YOUR SMOOTH TRANSITION TO GAS

3in detail
WÄRTSILÄ TECHNICAL JOURNAL | WWW.WARTSILA.COM
MORE ON PAGE 40 MORE ON PAGE 50MORE ON PAGE 18
Case example GermanyElectricity market reform policy options
Creating OptimalLNG Storage Solutions
GRIPon Innovation
How do policy options affect the security of supply, power system costs, and incentives for investment?
Wärtsilä combines technologies to create cost-efficient storage systems for gas-fuelled vessels of every size.
Wärtsilä’s involvement in the GRIP Project provided new insights into advanced propulsion techniques – and resulted in a hit product, too.
VISIONARY COLLABORATIONWärtsilä and Aalto University team up to envision new technologies
and develop future industrial design professionals.

4 in detail
[ EN
ER
GY
/ I
N D
ET
AIL
]
[ ENERGY / IN DETAIL ]
Value of Smart Power Generation for utilities in the national electricity market of AustraliaAUTHORS: Luca Febbraio , S enior Busine s s D evelopment Mana ger, Wär t si lä Ener g y S olu t ions
Vil le Rimali , Power S ys tem A nalys t , Wär t si lä Ener g y S olu t ionsmail : luc a .febbraio @war t si la .c om , mail : vi l le . r imal i@war t si la .c om

5in detail
WÄRTSILÄ TECHNICAL JOURNAL 02.2015
In the National Electricity Market (NEM) of Australia, open cycle gas turbine (OCGT) plants have traditionally been used as peaking plants to hedge utilities against the market price volatility. A state-of-the-art modelling framework shows that a Wärtsilä Smart Power Generation (SPG) peaking power plant can provide a significant gross margin to the utility, compared to OCGT alternatives. At the same time, SPG decreases the risk exposure of the utility by reducing the volatility of annual returns. The benefits are based on the inherent operational flexibility of the internal combustion engine (ICE) technology, especially the capability to reach full load in less than 5 minutes.
Why National Electricity Market of Australia is special?The National Electricity Market (NEM) is probably the most developed and economically efficient electricity market in the whole world. The market design of the NEM is a gross mandatory pool, where all generators are obligated to sell all produced electricity to the market. Correspondingly, electricity is bought by retailers from the pool. The market aggregates all generation and simultaneously schedules generators to meet the demand. This is managed through a central dispatch process, operated by the Australian Energy Market Operator (AEMO). Based on generation offers and demand bids, AEMO defines the most cost-efficient dispatch for every 5 minutes.
The first indicative dispatch is computed a week ahead before delivery. Redispatching, based on the adjusted bids, continues until 5 minutes before the actual 5-minute dispatch interval. At the gate closure, the final dispatch and the dispatch interval prices are defined for the five NEM regions across Australia. Six consecutive 5-minute dispatch interval prices are averaged every half-hour to determine spot prices for each 30-minute trading period.
Most of the utilities in NEM are so-called gentailers (generator + retailer). They have generation assets and load to serve. One important task for gentailers is to balance their own thermal generation according to their expected retail load and intermittent renewable output. This causes active

6 in detail
[ EN
ER
GY
/ I
N D
ET
AIL
]
[ ENERGY / IN DETAIL ]
re-bidding just prior to the gate closure, occasionally creating significant price spikes.
Spot prices are highly volatile in the NEM, and market participants have to manage their exposure to risks created by the price volatility. Generators and retailers manage their market price risk by using long- and short-term financial contracts, which ensure a firm price for electricity. These contracts are so called Contracts for Differences and include swaps, caps, options and futures. In addition, the majority of gentailers own flexible peaking power plants as a physical hedge against price spikes in the market.
State-of-the-art modelling framework is required to capture the value of flexibilityWärtsilä expected that superior start time of SPG could be perfect match with 5-minute electricity dispatch on NEM. Therefore, Wärtsilä engaged Ernst & Young (EY) to study the potential of SPG power plants within a large utility portfolio in South Australia. The entire NEM is modelled in this study, but the main focus is on the South Australian (SA) market region in the fiscal year of 2020–2021. SA has the highest share of intermittent renewable generation, and historically high levels of market price volatility. The selected utility has a broad
mix of thermal and renewable generation assets, and a large retail position in the market.
The analysis has been carried out using EY’s 2-4-C market modelling software, which replicates closely the real dispatch executed by AEMO. To capture the effects of the inflexibility of the current generation assets, the entire NEM is modelled with 5-minute granularity, just as it is dispatched in real life. In the model, generation is dispatched according to the offers for meeting the demand. The dispatch is also subject to certain constraints, such as limited transmission capacity. The price of electricity for each 5-minute dispatch interval, in each NEM region, is defined by the marginal generator.
Based on historical bidding data, multiple bidding strategies are developed for each utility in the NEM. For example, a utility can bid its entire generation with the marginal cost, withhold capacity by moving bids to a higher price, or bid all its generation at the market floor price to ensure maximum generation volume after a price spike. Each utility chooses the best bidding strategy for each 5-minute dispatch interval while trying to minimize the total cost of serving the load over a 30-minute trading period. The
total cost of serving the load includes also revenues derived from frequency control ancillary services (FCAS). (Figure 1)
Each gentailer has its own load to serve. The load is based on the forecasted regional demand profile and expected market share of the utilities in the SA retail market. The retail revenues are excluded from the analysis, as they are relatively fixed. The additional risk analysis is essential to ensure that the added value of SPG was not produced at the expense of increased risk for the utility. For the assessment of a portfolio risk, 25 separate Monte Carlo simulations are conducted for the selected year. Monte Carlo simulation varies the forced outage pattern of generators and interconnectors, as well as the time series for wind, large-scale and rooftop solar PV generation. A standard deviation of the total cost to serve the load, over multiple Monte Carlo simulations, is used as a risk factor. (Figure 1)
Three different future cases of the utility portfolio are analysed separately. 200 MW of the oldest existing capacity will be demolished and replaced by either
200 MW heavy duty OCGT GE 9E plant, 200 MW aeroderivative OCGT GE
LM6000, or 200 MW SPG plant
Fig. 1 – Quantified value components of portfolio analysis.

7in detail
WÄRTSILÄ TECHNICAL JOURNAL 02.2015
SPG is capable to capture or prevent disadvantageous price spikes on the marketSPG has a higher thermal efficiency than both the OCGT solutions. This enables more profitable running hours for SPG in the market. However, when the peaking plant is running at full output, the value of operational flexibility is already being utilised. This is because flexibility derives from the capability to increase generation as quickly as possible. From a gentailer portfolio point of view, the value of additional energy is sometimes minor compared to the value of flexibility. Therefore, the utility has to accept a trade-off between flexibility (withholding capacity) and profitable generation (running the plant against the market). When comparing the three cases, SPG has superior flexibility, as well as the highest thermal efficiency. Examples of how flexibility can create added value for a gentailer are explained using the following examples.
As shown in Figure 2, in this particular 30-minute trading period, prices are high, but during the previous 30-minute period they were low. The utility does not have any generation online and is, therefore, exposed to possible high prices. In the OCGT 9E case, the plant is not capable of providing
energy during the first 5-minute dispatch interval. Hence, it is not able to prevent the price spike. After the first 5-minute interval, the OCGT 9E is brought online to maximize generation during the remainder of the 30-minute trading period. Since the trading period price is averaged at the end of the period, one 5-minute price spike increases the price of the trading period to as high as 2193 AUD/MWh. During this trading period the gentailer is strongly in a net load position, meaning that its retail load is larger than its own online generation. During the 30-minute trading period, maximized generation revenues and a hedging contract settlement cannot compensate for the high retail cost. As a result, the total cost to serve the load over this 30-minute period is as high as AUD 251,101. (Figure 2)
As Figure 2 indicates, in the SPG case the gentailer bids its capacity with a marginal cost, because price spikes would be harmful for its portfolio in a net load position. For the first 5-minute dispatch interval, a part of the SPG plant is dispatched. It is started for just 5 minutes and the price spike is prevented. For the second 5-minute interval, the price drops below the SPG plant’s short run marginal cost and the plant is shut down. The price spike is avoided,
thus resulting in significant value for the portfolio during this 30-minute trading period. Compared to the OCGT 9E case, SPG provides savings of AUD 222,830 for the portfolio during the 30-minute trading period. This is achieved as a result of the SPG plant’s capability to go from stand-by to full load in less than 5 minutes. (Figure 2)
As shown in Figure 3, for the 30-minute trading period examined here, the market price is low during the first 5-minute dispatch interval, but hits almost the price cap of 13,500 AUD/MWh during the second 5-minute interval. The OCGT 9E plant reacts to the price spike immediately, but due to its slow starting time, it can deliver only 48 MWh during the 30-minute trading period. The SPG plant also misses the price spike interval as it is offering capacity at a price that is too high. For the third 5-minute interval, the utility changes its bidding strategy. It bids the SPG plant at the market floor price and starts the plant immediately to its full 200 MW load. The SPG plant runs at full load over the remaining four 5-minute intervals. It is able to generate 133 MWh during the trading period, compared to the 48 MWh by the OCGT plant. As a result, the benefit for the selected utility in the SPG case is almost AUD 90,000 higher
Fig. 2 – SPG is able to prevent disadvantageous price spike and reduce retail cost when portfolio is net load position.
8 in detail
[ EN
ER
GY
/ I
N D
ET
AIL
]
[ ENERGY / IN DETAIL ]
than in the OCGT 9E case. (Figure 3)
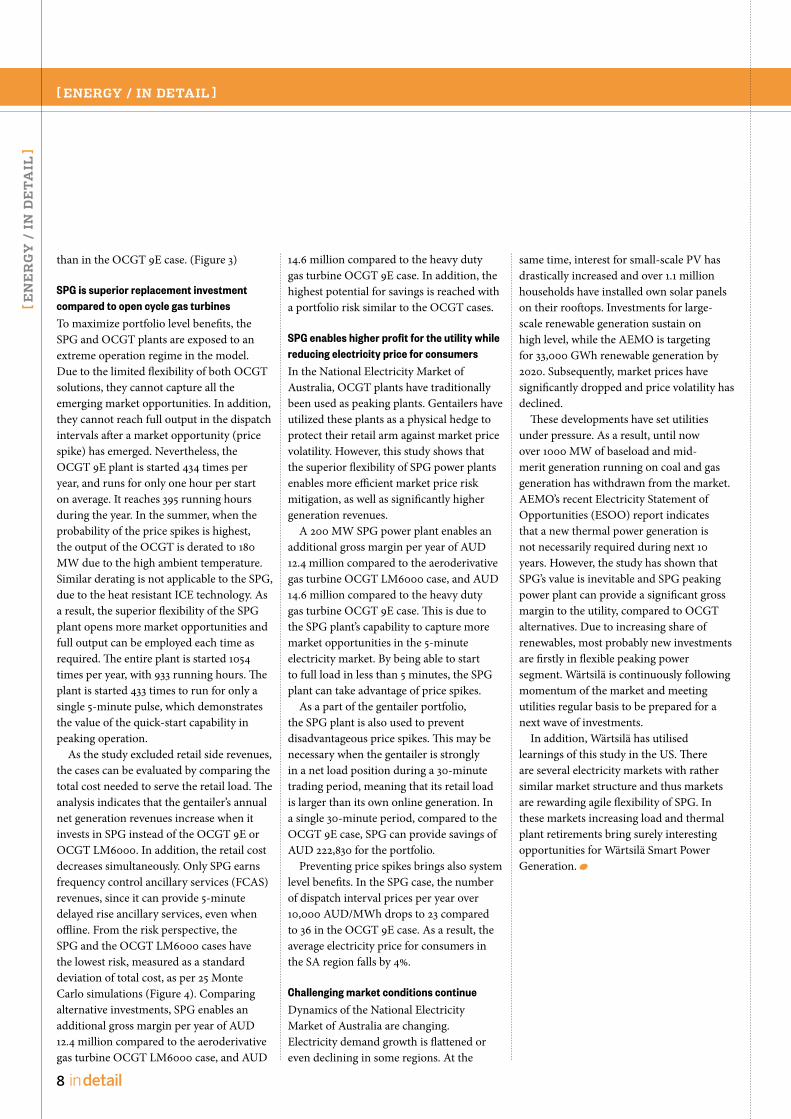
SPG is superior replacement investment compared to open cycle gas turbines To maximize portfolio level benefits, the SPG and OCGT plants are exposed to an extreme operation regime in the model. Due to the limited flexibility of both OCGT solutions, they cannot capture all the emerging market opportunities. In addition, they cannot reach full output in the dispatch intervals after a market opportunity (price spike) has emerged. Nevertheless, the OCGT 9E plant is started 434 times per year, and runs for only one hour per start on average. It reaches 395 running hours during the year. In the summer, when the probability of the price spikes is highest, the output of the OCGT is derated to 180 MW due to the high ambient temperature. Similar derating is not applicable to the SPG, due to the heat resistant ICE technology. As a result, the superior flexibility of the SPG plant opens more market opportunities and full output can be employed each time as required. The entire plant is started 1054 times per year, with 933 running hours. The plant is started 433 times to run for only a single 5-minute pulse, which demonstrates the value of the quick-start capability in peaking operation.
As the study excluded retail side revenues, the cases can be evaluated by comparing the total cost needed to serve the retail load. The analysis indicates that the gentailer’s annual net generation revenues increase when it invests in SPG instead of the OCGT 9E or OCGT LM6000. In addition, the retail cost decreases simultaneously. Only SPG earns frequency control ancillary services (FCAS) revenues, since it can provide 5-minute delayed rise ancillary services, even when offline. From the risk perspective, the SPG and the OCGT LM6000 cases have the lowest risk, measured as a standard deviation of total cost, as per 25 Monte Carlo simulations (Figure 4). Comparing alternative investments, SPG enables an additional gross margin per year of AUD 12.4 million compared to the aeroderivative gas turbine OCGT LM6000 case, and AUD
14.6 million compared to the heavy duty gas turbine OCGT 9E case. In addition, the highest potential for savings is reached with a portfolio risk similar to the OCGT cases.
SPG enables higher profit for the utility while reducing electricity price for consumersIn the National Electricity Market of Australia, OCGT plants have traditionally been used as peaking plants. Gentailers have utilized these plants as a physical hedge to protect their retail arm against market price volatility. However, this study shows that the superior flexibility of SPG power plants enables more efficient market price risk mitigation, as well as significantly higher generation revenues.
A 200 MW SPG power plant enables an additional gross margin per year of AUD 12.4 million compared to the aeroderivative gas turbine OCGT LM6000 case, and AUD 14.6 million compared to the heavy duty gas turbine OCGT 9E case. This is due to the SPG plant’s capability to capture more market opportunities in the 5-minute electricity market. By being able to start to full load in less than 5 minutes, the SPG plant can take advantage of price spikes.
As a part of the gentailer portfolio, the SPG plant is also used to prevent disadvantageous price spikes. This may be necessary when the gentailer is strongly in a net load position during a 30-minute trading period, meaning that its retail load is larger than its own online generation. In a single 30-minute period, compared to the OCGT 9E case, SPG can provide savings of AUD 222,830 for the portfolio.
Preventing price spikes brings also system level benefits. In the SPG case, the number of dispatch interval prices per year over 10,000 AUD/MWh drops to 23 compared to 36 in the OCGT 9E case. As a result, the average electricity price for consumers in the SA region falls by 4%.
Challenging market conditions continueDynamics of the National Electricity Market of Australia are changing. Electricity demand growth is flattened or even declining in some regions. At the
same time, interest for small-scale PV has drastically increased and over 1.1 million households have installed own solar panels on their rooftops. Investments for large-scale renewable generation sustain on high level, while the AEMO is targeting for 33,000 GWh renewable generation by 2020. Subsequently, market prices have significantly dropped and price volatility has declined.
These developments have set utilities under pressure. As a result, until now over 1000 MW of baseload and mid-merit generation running on coal and gas generation has withdrawn from the market. AEMO’s recent Electricity Statement of Opportunities (ESOO) report indicates that a new thermal power generation is not necessarily required during next 10 years. However, the study has shown that SPG’s value is inevitable and SPG peaking power plant can provide a significant gross margin to the utility, compared to OCGT alternatives. Due to increasing share of renewables, most probably new investments are firstly in flexible peaking power segment. Wärtsilä is continuously following momentum of the market and meeting utilities regular basis to be prepared for a next wave of investments.
In addition, Wärtsilä has utilised learnings of this study in the US. There are several electricity markets with rather similar market structure and thus markets are rewarding agile flexibility of SPG. In these markets increasing load and thermal plant retirements bring surely interesting opportunities for Wärtsilä Smart Power Generation.

Fig. 3 – SPG is able to generate more energy after the price spike and thus increases significantly the benefit for the utility during the 30-minute trading period.
Fig. 4 – Compared to the OCGT 9E and OCGT LM600 cases, Smart Power Generation enables significant added value due to the higher generation net revenue, lower retail cost and superior revenue in frequency control ancillary services.
Higher net revenue due to
lower generation costs and
capturing price spikes better
Increased FCAS due to the
capability to provide delayed
rise services from standby
SPG offers significant
added value compared to
the OCGT cases
Lower retail cost due to
affecting the market prices
Lower total cost to serve load
Marginally lower risk
9in detail
WÄRTSILÄ TECHNICAL JOURNAL 02.2015
10 in detail
[ EN
ER
GY
/ I
N D
ET
AIL
]
[ ENERGY / IN DETAIL ]
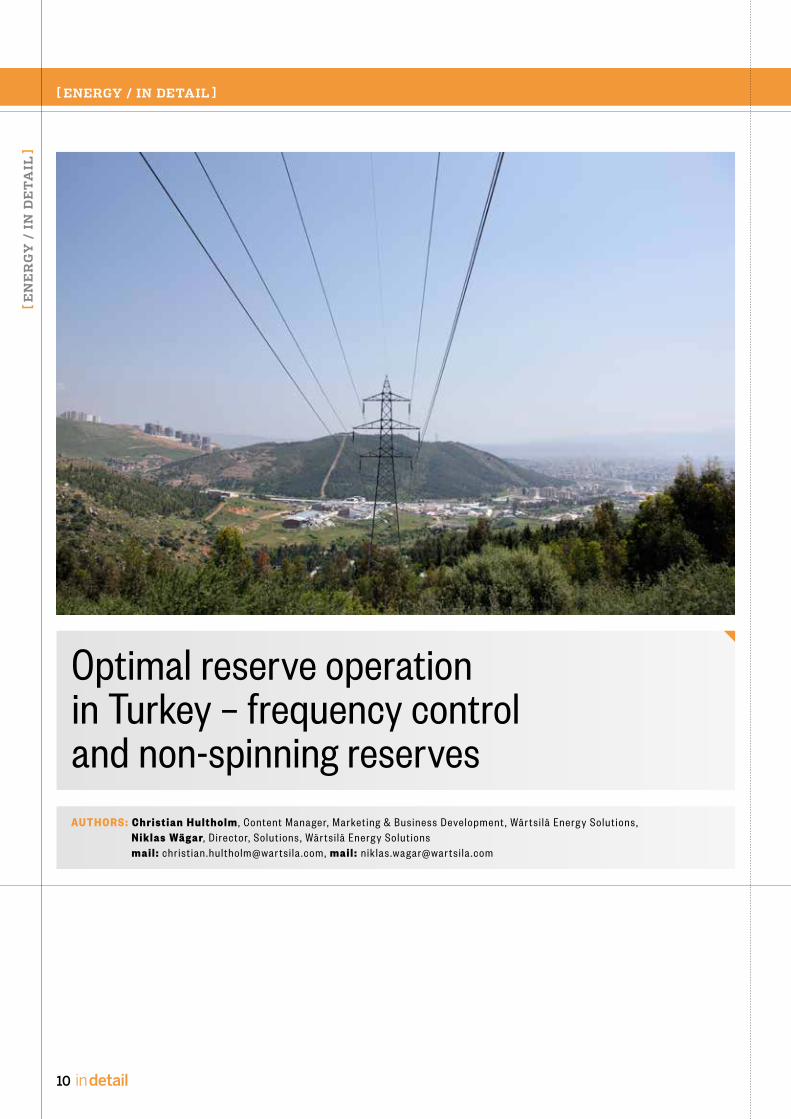
Optimal reserve operation in Turkey – frequency control and non-spinning reservesAUTHORS: Christian Hultholm , C ontent Mana ger, Market ing & Busine s s D evelopment , Wär t si lä Ener g y S olu t ions ,
Niklas Wägar, D ire c tor, S olu t ions , Wär t si lä Ener g y S olu t ionsmail : chr is t ian . hul tholm@war t si la .c om , mail : nik la s .wa g ar@war t si la .c om
11in detail
WÄRTSILÄ TECHNICAL JOURNAL 02.2015
In Turkey, both the customers and the total power system have found clear value in modern combustion engines being very suitable for grid stability support. Reserve operation is excellent, fast and efficient both in primary and secondary frequency control mode. Moreover, by introducing fast-starting, non-spinning, gas-fired power system reserves, Turkey would be able to utilise its hydropower resources to the fullest, instead of allocating them for reserve provision.
This article is based on the award-winning paper (Best Paper Award 2015 in the session “Flexing the Power of Gas”): “Optimal reserve operation in Turkey – frequency control and non-spinning reserves” presented at the PowerGen Europe 2015 conforence.
Turkey – power generation and installed baseSince Turkey started to gradually replace its state-dominated power market in 2001, the power generation capacity has quickly grown. In 2013, the Turkish generation capacity was already more than 60 GW and is expected to exceed 100 GW by 2020. Some 1.2 GW of this long-term capacity expansion will be in the form of nuclear power plants.
The quickly increasing electricity demand will likely impact the power system reserve margins in Turkey. Another factor contributing to an increased need of reserve capacity is the quickly growing wind power capacity. Finally, also the introduction of the nuclear power plants, i.e. very large individual units, will have a big impact on the need for reserves.
Reserves in power systemsAll power systems require a certain reserve capacity, but the requirements in terms of size and dispatch speed differ considerably. The reserve requirements are defined in the grid code prepared by the transmission system operator (TSO), who is also responsible for maintaining system stability.
Reserve capacity for normal balancing service in any power system traditionally requires that the regulating power plants operate at part-load. On part-load operation, the plant efficiency is lower than at full output, and naturally less power is produced as well. Hence, there is a cost in providing such a service.
Reserve capacity serves two main functions in a power system and is typically defined as follows:
To stabilise power grids by providing frequency control when there is a deviation between demand and production. The power plants that produce this continuous up and down frequency regulation must be in operation, i.e. “spinning”, and adjust their load to maintain the delicate balance between demand and supply.
To provide emergency reserve for maintaining system stability after contingencies such as a trip or failure in the existing power plant or transmission lines. Emergency reserve can be divided into three subcategories – primary, secondary and tertiary. Response times for each are categorised by a country’s grid codes.
RESERVE OPERATION IN TURKEYNext, a review of the operation of the reserves in the Turkish power system will be given.
Primary reserveWhen an emergency situation occurs, e.g. a plant trips, the inertia of the system maintains system stability during the first few seconds. The primary reserve then automatically responds to the frequency deviation in the system. As soon as the frequency falls below a set limit, this reserve starts to ramp up without any dispatcher involvement. The primary reserve has to be spinning since the required response time is typically 5-10 seconds, and it has 30-60 seconds to ramp up to its full output. In Turkey, these time periods are 2 seconds and 30 seconds, respectively.
The minimum size of this reserve capacity is typically equal to the biggest generating unit in the power system, or sometimes the largest grid connection contingency, so that if the largest unit trips, the spinning reserve kicks-in before the system collapses. However, the primary reserve requirement of the Turkish power system is actually smaller and has further decreased from 770 MW to 300 MW, owing to the ENTSO-E interconnection [1].
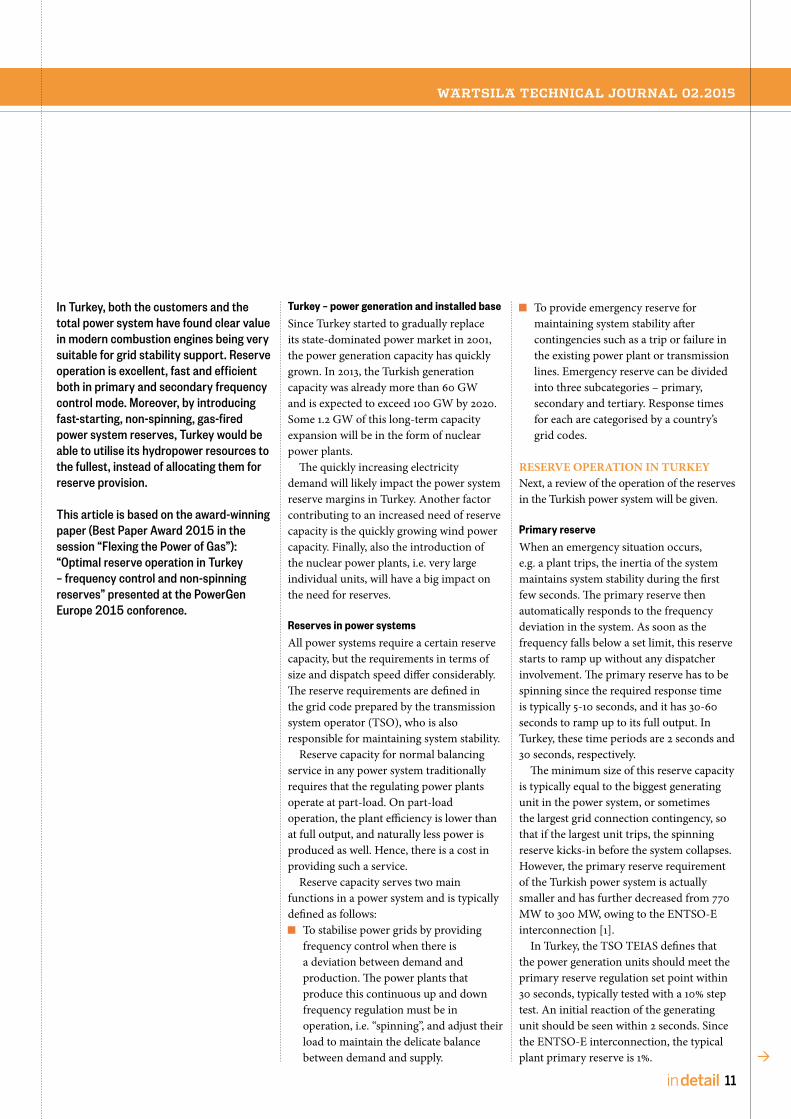
In Turkey, the TSO TEIAS defines that the power generation units should meet the primary reserve regulation set point within 30 seconds, typically tested with a 10% step test. An initial reaction of the generating unit should be seen within 2 seconds. Since the ENTSO-E interconnection, the typical plant primary reserve is 1%.
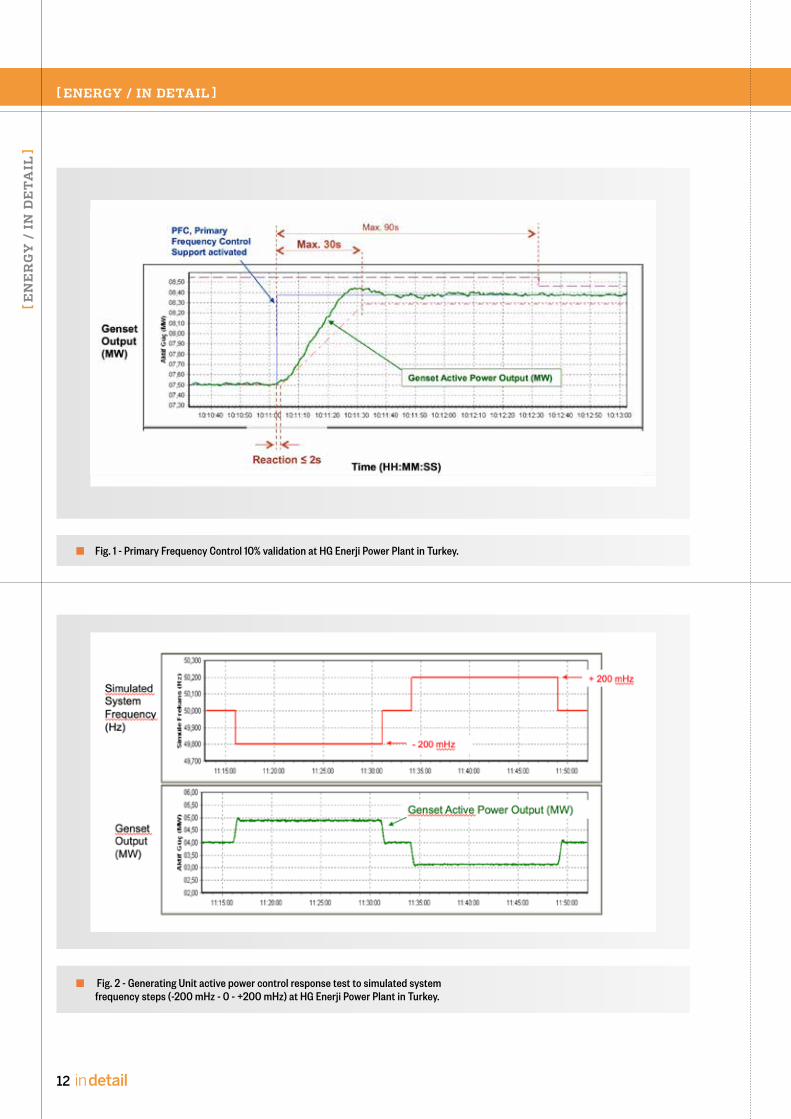
Fig. 2 - Generating Unit active power control response test to simulated system frequency steps (-200 mHz - 0 - +200 mHz) at HG Enerji Power Plant in Turkey.
Fig. 1 - Primary Frequency Control 10% validation at HG Enerji Power Plant in Turkey.
12 in detail
[ EN
ER
GY
/ I
N D
ET
AIL
]
[ ENERGY / IN DETAIL ]
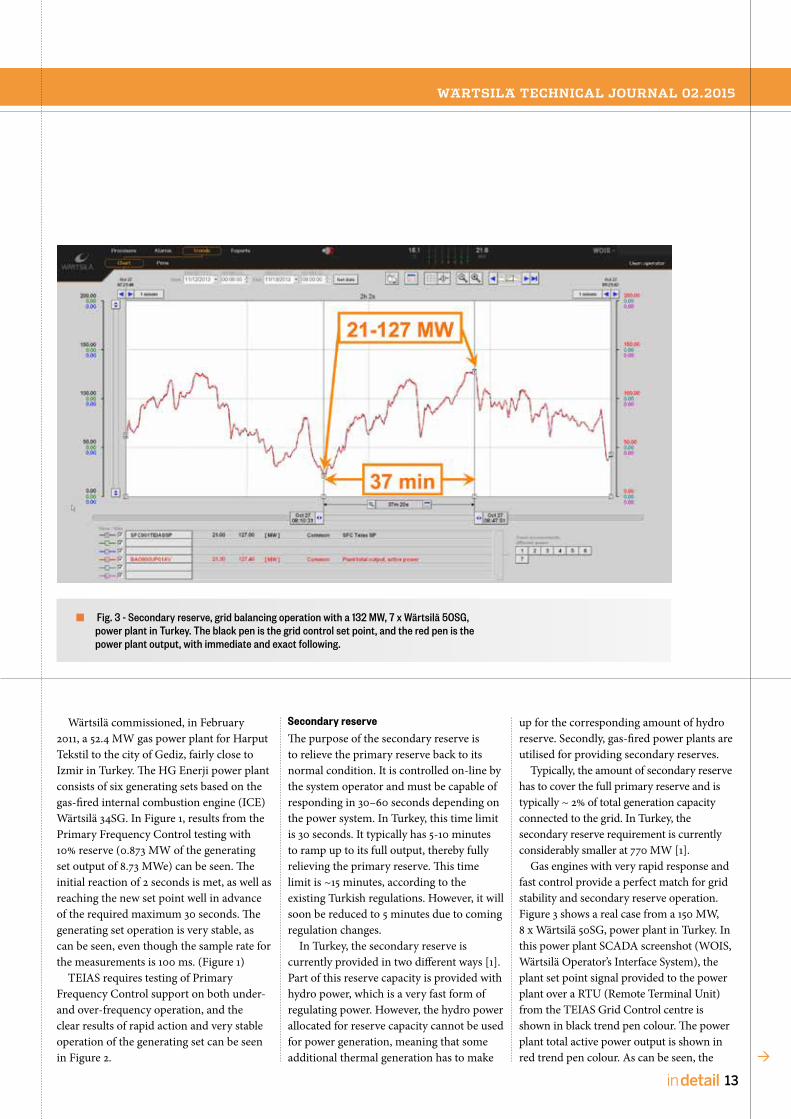
Fig. 3 - Secondary reserve, grid balancing operation with a 132 MW, 7 x Wärtsilä 50SG, power plant in Turkey. The black pen is the grid control set point, and the red pen is the power plant output, with immediate and exact following.
13in detail
WÄRTSILÄ TECHNICAL JOURNAL 02.2015
Wärtsilä commissioned, in February 2011, a 52.4 MW gas power plant for Harput Tekstil to the city of Gediz, fairly close to Izmir in Turkey. The HG Enerji power plant consists of six generating sets based on the gas-fired internal combustion engine (ICE) Wärtsilä 34SG. In Figure 1, results from the Primary Frequency Control testing with 10% reserve (0.873 MW of the generating set output of 8.73 MWe) can be seen. The initial reaction of 2 seconds is met, as well as reaching the new set point well in advance of the required maximum 30 seconds. The generating set operation is very stable, as can be seen, even though the sample rate for the measurements is 100 ms. (Figure 1)
TEIAS requires testing of Primary Frequency Control support on both under- and over-frequency operation, and the clear results of rapid action and very stable operation of the generating set can be seen in Figure 2.
Secondary reserveThe purpose of the secondary reserve is to relieve the primary reserve back to its normal condition. It is controlled on-line by the system operator and must be capable of responding in 30–60 seconds depending on the power system. In Turkey, this time limit is 30 seconds. It typically has 5-10 minutes to ramp up to its full output, thereby fully relieving the primary reserve. This time limit is ~15 minutes, according to the existing Turkish regulations. However, it will soon be reduced to 5 minutes due to coming regulation changes.
In Turkey, the secondary reserve is currently provided in two different ways [1]. Part of this reserve capacity is provided with hydro power, which is a very fast form of regulating power. However, the hydro power allocated for reserve capacity cannot be used for power generation, meaning that some additional thermal generation has to make
up for the corresponding amount of hydro reserve. Secondly, gas-fired power plants are utilised for providing secondary reserves.
Typically, the amount of secondary reserve has to cover the full primary reserve and is typically ~ 2% of total generation capacity connected to the grid. In Turkey, the secondary reserve requirement is currently considerably smaller at 770 MW [1].
Gas engines with very rapid response and fast control provide a perfect match for grid stability and secondary reserve operation. Figure 3 shows a real case from a 150 MW, 8 x Wärtsilä 50SG, power plant in Turkey. In this power plant SCADA screenshot (WOIS, Wärtsilä Operator’s Interface System), the plant set point signal provided to the power plant over a RTU (Remote Terminal Unit) from the TEIAS Grid Control centre is shown in black trend pen colour. The power plant total active power output is shown in red trend pen colour. As can be seen, the
14 in detail
[ EN
ER
GY
/ I
N D
ET
AIL
]
[ ENERGY / IN DETAIL ]
power plant is following the grid set point immediately and exactly, even to the point that it is difficult to distinguish the difference between the control signal from the grid and the plant output following. The two trend pens are more or less on top of each other.
As highlighted in Figure 3, a reserve balancing need from 21 to 127 MW is provided within 37 minutes with some up/down balancing in between. This power plant can provide up/down regulation of a remarkable 48 MW/minute.
In 2014, the total secondary reserve requirement was 770 MW in Turkey, and the clear majority of that reserve is provided by fast responding Wärtsilä gas engines. The TSO TEIAS have clearly recognised that this technology can provide a controllable response. The update rate of control set point sent to the plant for the reserve is 1 second, and the gas engine driven power plants respond immediately. (Figure 3)
Tertiary reserveThe tertiary reserve has the task of relieving the secondary reserve for the next contingency. It is normally non-spinning, and the operation mode is manual. Phone calls are the normal way of activating the reserve, and it typically needs to respond in 10-15 minutes. In Turkey, the response time for the tertiary reserve is 15 minutes.
The tertiary reserve is traditionally non-spinning capacity from typically large, simple cycle gas turbines. During the period for which this reserve is procured, in most markets, under no circumstances should it participate in the energy markets. In other words, it is only to be used in case of a system fault (i.e., contingency). Again, the necessary reserve capacity has to do with the largest single contingency, i.e., the largest system unit, and with the replacement of the full secondary reserve; the minimum provision is typically around 2-3% of total capacity on the grid.
Although several different models and criteria for determining the capacity of the tertiary reserve exist, it is very common in Europe to match its size to the largest unit in the system. This, for example, applies to the power systems of Spain (and additionally 2%
of the expected load during the considered period) [2], France [3], Austria [4] and Kosovo [5]. In Turkey’s case, the above would mean that the tertiary reserve would be the size of the capacity of the Atatürk dam, i.e. 2400 MW.
20% PRIMARY FREQUENCY CONTROL OPERATIONAs discussed earlier, the typical plant primary reserve in Turkey is 1%, but the performance is tested with a 10% step test. At a 7 x Wärtsilä 50SG, 130 MW power plant in Turkey, successful operation of secondary frequency operation has been conducted since 2012. In addition to the secondary frequency control operation, the plant started to operate with the full 10% of primary frequency control in the autumn of 2013. In December 2013, the customer approached Wärtsilä to evaluate the possibilities to start to operate with 20% primary frequency control, requesting a faster ramp rate to reach 3.7 MW within 30 seconds on a unit level.
The Wärtsilä 18V50SG is the world’s largest gas-powered ICE based generating unit and has outstanding reserve load ramping performance. A unit operating at its nominal operating temperatures can ramp up from 10% to 100% in just 42 seconds, thus providing an excellent base for answering the Turkish customer request for 20% primary frequency control operation.
Updated ramp rates were provided to the customer, and the official 20% primary frequency control tests were conducted in January 2014. From February 2014 onwards, the customer has been able to operate with the 20% primary frequency control, in addition to the secondary control, which, in a way, can be seen more as a balancing operation. This case is a perfect example of full utilisation of one of the three corners of the SPG, the Operational Flexibility, which has been further enhanced for this customer and their operation.
The plant was primarily intended to operate in base load operation, but thanks to very fast reserve operation, the customer could extend its ancillary services with first the 10% and then 20% primary frequency control with minor control system
parameter changes. The time-to-market timeline of 2 months with the 20% primary frequency control was also very short in this excellent case.
NON-SPINNING SECONDARY RESERVEOne of the most interesting features of SPG based on Wärtsilä gas engines is the 30 seconds to reach synchronization from a stand-by operation, stopped mode. This enables a non-spinning secondary reserve operation, where a vast majority of reserves can be in stand-by, and both fuel and water usage and emissions are minimized. According to several studies (examples from UK and California, USA), substantial system level savings can be made, since other existing conventional generation reserves can be minimized. Thus, the total system efficiency will be higher [6] [7] [8].
Technological challengeMost traditional thermal plants are based on steam cycles and offer good efficiency by using high pressure superheated steam in their processes. Starting and stopping power plants with such cycles is always a major undertaking, a slow process requiring modest heat-up rates. Starting these power plants in less than 1 hour exposes the technology to high thermal stresses and causes wear and tear. Start-up times for coal-fired power plants are around 4 hours, in hot stand-by conditions, and 1-1.5 hours for gas turbine combined cycles.
It is obvious that such thermal plants cannot provide any off-line services to the system stability, which requires 5 seconds to 15 minutes start-up times. As a consequence, both primary and secondary reserves need to be online, i.e., “spinning.” However, running thermal power plants on part-load considerably reduces their efficiency, hence increasing the fuel consumption and emissions. In the case of Turkey, considerable amounts of such ramp-up capacity are currently kept continuously available.
The question is: is there a more optimal way of operating the power system assets and still providing the necessary stability services?
15in detail
WÄRTSILÄ TECHNICAL JOURNAL 02.2015
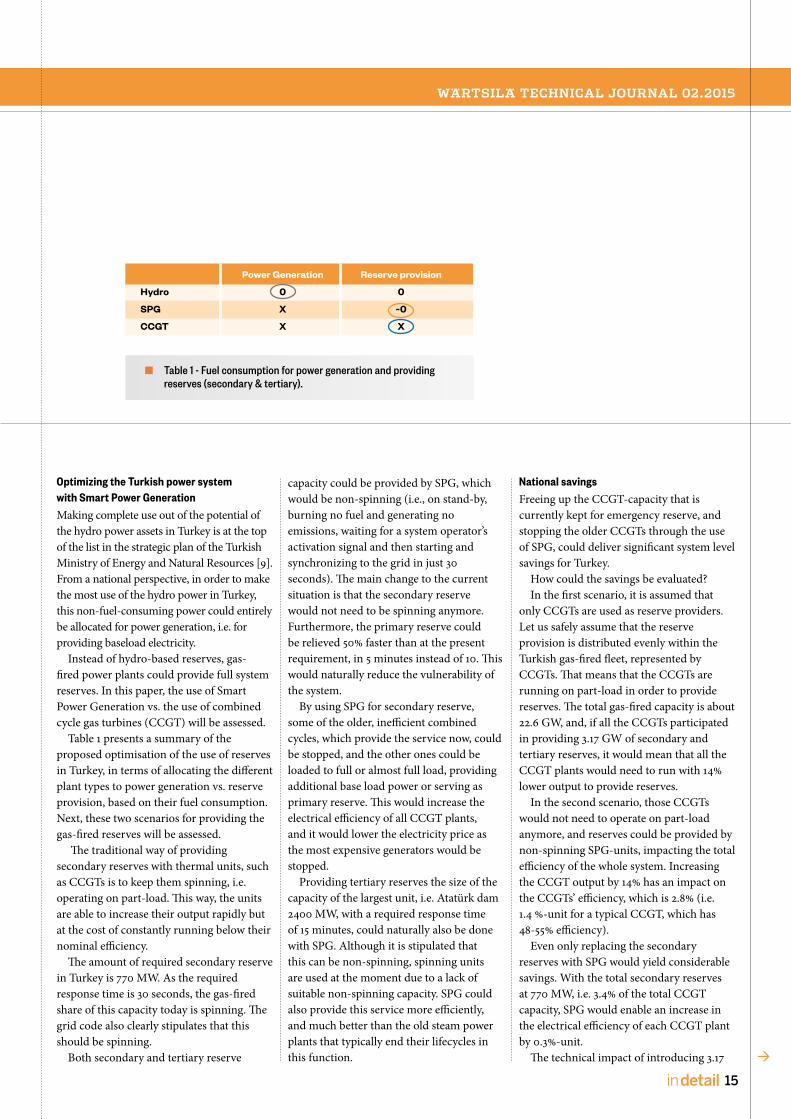
Table 1 - Fuel consumption for power generation and providing reserves (secondary & tertiary).
Power Generation Reserve provision
Hydro 0 0
SPG X ~0
CCGT X X
Optimizing the Turkish power system with Smart Power GenerationMaking complete use out of the potential of the hydro power assets in Turkey is at the top of the list in the strategic plan of the Turkish Ministry of Energy and Natural Resources [9]. From a national perspective, in order to make the most use of the hydro power in Turkey, this non-fuel-consuming power could entirely be allocated for power generation, i.e. for providing baseload electricity.
Instead of hydro-based reserves, gas-fired power plants could provide full system reserves. In this paper, the use of Smart Power Generation vs. the use of combined cycle gas turbines (CCGT) will be assessed.
Table 1 presents a summary of the proposed optimisation of the use of reserves in Turkey, in terms of allocating the different plant types to power generation vs. reserve provision, based on their fuel consumption. Next, these two scenarios for providing the gas-fired reserves will be assessed.
The traditional way of providing secondary reserves with thermal units, such as CCGTs is to keep them spinning, i.e. operating on part-load. This way, the units are able to increase their output rapidly but at the cost of constantly running below their nominal efficiency.
The amount of required secondary reserve in Turkey is 770 MW. As the required response time is 30 seconds, the gas-fired share of this capacity today is spinning. The grid code also clearly stipulates that this should be spinning.
Both secondary and tertiary reserve
capacity could be provided by SPG, which would be non-spinning (i.e., on stand-by, burning no fuel and generating no emissions, waiting for a system operator’s activation signal and then starting and synchronizing to the grid in just 30 seconds). The main change to the current situation is that the secondary reserve would not need to be spinning anymore. Furthermore, the primary reserve could be relieved 50% faster than at the present requirement, in 5 minutes instead of 10. This would naturally reduce the vulnerability of the system.
By using SPG for secondary reserve, some of the older, inefficient combined cycles, which provide the service now, could be stopped, and the other ones could be loaded to full or almost full load, providing additional base load power or serving as primary reserve. This would increase the electrical efficiency of all CCGT plants, and it would lower the electricity price as the most expensive generators would be stopped.
Providing tertiary reserves the size of the capacity of the largest unit, i.e. Atatürk dam 2400 MW, with a required response time of 15 minutes, could naturally also be done with SPG. Although it is stipulated that this can be non-spinning, spinning units are used at the moment due to a lack of suitable non-spinning capacity. SPG could also provide this service more efficiently, and much better than the old steam power plants that typically end their lifecycles in this function.
National savingsFreeing up the CCGT-capacity that is currently kept for emergency reserve, and stopping the older CCGTs through the use of SPG, could deliver significant system level savings for Turkey.
How could the savings be evaluated?In the first scenario, it is assumed that
only CCGTs are used as reserve providers. Let us safely assume that the reserve provision is distributed evenly within the Turkish gas-fired fleet, represented by CCGTs. That means that the CCGTs are running on part-load in order to provide reserves. The total gas-fired capacity is about 22.6 GW, and, if all the CCGTs participated in providing 3.17 GW of secondary and tertiary reserves, it would mean that all the CCGT plants would need to run with 14% lower output to provide reserves.
In the second scenario, those CCGTs would not need to operate on part-load anymore, and reserves could be provided by non-spinning SPG-units, impacting the total efficiency of the whole system. Increasing the CCGT output by 14% has an impact on the CCGTs’ efficiency, which is 2.8% (i.e. 1.4 %-unit for a typical CCGT, which has 48-55% efficiency).
Even only replacing the secondary reserves with SPG would yield considerable savings. With the total secondary reserves at 770 MW, i.e. 3.4% of the total CCGT capacity, SPG would enable an increase in the electrical efficiency of each CCGT plant by 0.3%-unit.
The technical impact of introducing 3.17

16 in detail
[ EN
ER
GY
/ I
N D
ET
AIL
]
[ ENERGY / IN DETAIL ]
Technical impact Replacing Replacing
3170 MW 770 MW reserves reserves
Total CCGT capacity providing reserves MW 22 598 22 598
Required reserves MW 3 170 770
Reserves share of total CCGT capacity % 14,0% 3,4%(each CCGT could increase its output this amount if
there would not be any need to provide reserves)
Impact on each CCGT’s efficiency when increasing output by above row % % 2,8% 0,7%
Fuel consumed [11], [12] (historical) TWh 202,0 202,0
Fuel consumed (optimized) TWh 196,3 200,6
Reduction in fuel consumption TWh 5,7 1,4
% 2,8% 0,7%
Financial impact (average gas price 2013–2040) Replacing Replacing
3170 MW 770 MW reserves reserves
Fuel price (average 2013-2040) [13] TL/GJ 30,16 30,16
€/MWh 30,96 30,96
Fuel cost, historical dispatch Mill € 6 253,7 6 253,7
Fuel cost, optimized dispatch Mill € 6 078,2 6 211,1
Fuel cost savings Mill € 175,5 42,6
SPG capacity needed MW 3 170 770
Investment cost (EPC) Mill €/MW 0,600 € 0,600 €
Total investment cost Mill € 1902 462
Savings per year Mill € 175 43
Simplified payback time years 10,8 10,8
Table 2 - Technical calculation.
Table 3 - Financial calculation.

17in detail
WÄRTSILÄ TECHNICAL JOURNAL 02.2015
GW or 770 MW of flexible SPG capacity is described in detail in Table 2.
According to a recent forecast from the U.S. Energy Information Administration, the Henry Hub spot price for natural gas will rise to $7,65/MMBtu in 2040, i.e. an increase of almost 60 % from today’s $4,80/MMBtu [12]. Assuming that a similar price development will take place in Turkey, replacing 3.17 GW of CCGT reserves with flexible SPG will provide annual fuel cost savings of €175 million (at 2013-2040 average gas price), and the cost of the investment can be paid back in 10.8 years. Correspondingly, replacing 770 MW of CCGT reserves with SPG will yield savings of €43 million per year, with the same payback time. The detailed economic impact of replacing the CCGT reserve capacity with SPG units is shown in Table 3.
CONCLUSION AND SUMMARYSmart Power Generation based on gas engines provides numerous and unique combinations of valuable features with multiple operation modes and fuel flexibility, allowing clear benefits for power system operators and power producers.
In Turkey, both the customers and the total power system have found clear value in modern combustion engines being very suitable for grid stability support. Reserve operation is excellent, fast and efficient both in primary and secondary frequency control mode. The latest case of 20% primary frequency control, officially approved by TEIAS, is yet another improvement, where the operational flexibility is further developed and applied according to customer requests and system needs.
The new potential of non-spinning secondary reserve is the next interesting value enhancement from a total power system perspective. When considering renewable integration that ensures fast and efficient load following, SPG based on gas engines is the obvious choice.
By introducing fast-starting, non-spinning, gas-fired power system reserves, Turkey would be able to utilise its hydro power resources to the fullest, instead of allocating them for reserve provision.
Moreover, with the increasing risk of power shortages prior to the commissioning of the new nuclear power plants, Turkey also needs to consider installing reserve capacity that can be brought on-stream quickly. SPG provides a highly viable alternative with construction times of less than 1.5 years.
The addition of these flexible, gas-fired power plants will not only fill a potential power gap. It will allow the entire system to operate more efficiently and economically by providing system reserve capacity with higher efficiency and lower costs, even after new large baseload capacity comes online.
To allow the use of SPG as secondary reserve, the grid code would have to be modified to allow the secondary reserve to be non-spinning.
Summary of benefits of the Smart Power Generation solution for Turkey:
A quick remedy for the acute capacity deficit – delivery of 3 GW within 1.5 years
Contribution to power system stability through rapid Primary Frequency Control
Contribution to power system stability through rapid secondary reserves
Annual savings of €175 million compared to using only spinning CCGT-units for provision of reserves
Reduced import of gas – up to 2.8% per year
Lower wholesale electricity price Reduced CO2 emissions Improved system stability due to faster
replacement of primary reserves – 5 minutes instead of 10 minutes
Improved reserve readiness for the quickly growing wind power capacity
Improved reserve readiness for the adding large individual nuclear power plants.
References[1] TEIAS, “Grid Access and Integration of
Renewable Energy Resources (RES)”, 2011.
[2] Resolución de 13-7-2006, BOE 21/07/06.
[3] Rebours, Y. and Kirschen, D., “A Survey of
Definitions and Specifications of Reserve Services”,
The University of Manchester, 2005.
[4] Energie-Control Austria, “Balancing Energy”,
2009.
[5] Kosovo Electricity Transmission, System and
Market Operator (KOSTT), “Generation Adequacy
Plan 2011−2020”, sin anno.
[6] DNV Kema California study, http://www.
smartpowergeneration.com/spg/downloads
[7] Redpoint UK study, http://www.
smartpowergeneration.com/spg/downloads
[8] Hultholm C, Non-Spinning Power System
Reserves Enabling an Efficient Integration of
Renewables, ICCI 2014
[9] Yarbay R. Z., Güler A.Ş and Yaman E.,
“Renewable Energy Sources and Policies in
Turkey”, 6th International Advanced Technologies
Symposium (IATS’11), 16-18 May 2011, Elazığ, Turkey
[10] Thermoflow GT PRO (software), 2012.
[11] U.S Energy Information Administration (EIA),
“Turkey – Country Analysis Brief Overview”.
[12] International Energy Agency (IEA), “Oil & Gas
Security – Emergency Response of IEA Countries”,
2013
[13] U.S Energy Information Administration (EIA),
“AEO2014 Early Release Overview”, 2014.

18 in detail
[ EN
ER
GY
/ I
N D
ET
AIL
]
[ ENERGY / IN DETAIL ]
Electricity market reform policy options and impact on investments – case example GermanyAUTHOR: Melle Kruisdijk, Dire c tor of Market D evelopment , Europ e & Afr ic a , Wär t si lä Ener g y S olu t ions mail : mel le . kr uisdi jk@war t si la .c om

19in detail
WÄRTSILÄ TECHNICAL JOURNAL 02.2015
The expansion of renewable energy sources affects the operation of thermal power plants and pushes down the profitability of these plants to the point where owners consider de-commissioning capacity. However, thermal generation is required to provide electricity when the sun is not shining or the wind not blowing. Additionally, more flexibility is required to balance the volatile production from wind and solar. Under such challenging conditions, which electricity market design options are considered by policy makers to ensure investments in much needed flexible generation? This article provides insight into the effects of two ‘main’ policy options on the security of supply, power system costs, and incentives for investment.
This article is based on the award winning paper: “Market reform policy options – case example Germany” presented at the PowerGen Europe 2015 conference.
The increasing expansion of renewable energy sources, such as wind and photovoltaic, in the electricity generation mix is affecting thermal power plants in three different ways. These plants see (1) fewer operating hours with (2) lower wholesale prices and (3) an ever-increasing, volatile operating regime driven by the need to balance the fluctuating electricity production by renewables. Consequently, profitability of thermal power plants is dropping to levels where owners of these plants are considering closing or mothballing these units (or already have).
This situation can jeopardize the security of the supply in power systems. Thermal power plants are needed to provide electricity when the sun is not shining or the wind not blowing. Additionally, more flexibility is needed to balance the volatility introduced by increasing amounts of renewable energy. Alarmed by this, several EU member state governments, as well as the European Commission, are considering what changes are required to attract new
investments in needed flexible generation capacity.
The German Federal Ministry for Economic Affairs and Energy (BMWi) published in October 2014 the discussion paper “An Electricity Market for Germany’s Energy Transition,” also known as “the Green Paper .” The Green Paperi is intended to provide the basis for the market design decisions to be taken in 2015. Due to its central location and size within Europe, and its high amount of renewable capacity, the German electricity market design is expected to strongly influence the rest of Europe and is, therefore, an important case to examine.
This article describes the two market design policy options presented in the Green Paper: trust in an optimised electricity market (energy only market [EOM 2.0]) or the introduction of a second market (the “capacity market” [CM]). To provide insight into the effects of these two policy options on the security of supply, system costs, and incentives for investment,
Fig. 1 - Profitability of a new-build CCGT.
EOM 2.0 CM (OCGT capacity payment)EOM without uplift
2024
2025
2030
2031
2026
2027
2032
2033
2028
2029
2034
0
-20
20
-80
-60
-40
-100
-120
Net
pro
fit, €
/kW

20 in detail
[ EN
ER
GY
/ I
N D
ET
AIL
]
[ ENERGY / IN DETAIL ]
Wärtsilä has commissioned Baringa (a consulting company with a focus on energy, commodities and financial services) to analyse whether an EOM 2.0 can incentivise investment in the German market, and, if so, what types of technologies are most incentivised under this market structure compared to an energy market featuring a CM. The full analysis was provided by Wärtsilä as a response to BMWi’s Green Paper consultation and can be found on their website.ii
Baringa used its in-house model of the North West European electricity markets and PLEXOS for power systems (a third party market dispatch engine) to model two scenarios for the evolution of the German electricity market across the period 2020-2035:
an EOM 2.0 scenario, where wholesale prices are allowed to rise above generators’ Short Run Marginal Costs (SRMC), and
a CM scenario, reflecting a market-wide capacity mechanism, where all generating capacity is able to receive a capacity payment based upon the ‘missing money’1 that an Open Cycle Gas Turbine (OCGT)2 requires to enter the market, but where the energy market is restricted to SRMC bidding only (i.e. ‘no mark-up’ rules).
Notably, Baringa assumed that the EOM 2.0 scenario would also feature a strategic reserve for the transition to the new energy market arrangements, allowing for 4.5 GW of capacity to be retained by Transmission System Operators (TSOs) for emergency purposes (in line with the Green Paper proposals from BMWi).
This strategic reserve is assumed to be for dispatch as a ‘last resort’ (e.g., at the Value of
Lost Load (VoLL)), and, therefore, does not affect Baringa’s modeled market dispatch results. The strategic reserve is made transitional by allowing a procured plant to close without being replaced, meaning that the reserve will largely disappear on its own by approximately 2029.
Technology decisions for new generation capacity additions are made on the basis of the most profitable generating technology, calculated based on Baringa’s profitability analysis.
Baringa calculated the total system costs for both scenarios using the energy market volume and price modeling results, the cost of procuring the strategic reserve (for the EOM 2.0 scenario), and the cost of market-wide capacity payments (for the CM scenario).3
Profitability analysis: the EOM 2.0 provides stronger incentives for flexibilityThe profitability analysis shows that low capital expenditure, flexible forms of capacity, such as gas engines and OCGT, are exposed to stronger incentives to invest under the EOM 2.0 scenario. This is driven by their ability to collect uplift in the wholesale market and superior operational capabilities, allowing them to collect additional revenues from operating flexibly in the intraday and ancillary services markets.
For example, the profitability for a new-build Combined Cycle Gas Turbine (CCGT) in the EOM 2.0 scenario is shown in Figure 1. This chart demonstrates the difference that uplift can make to CCGT revenues. While the CCGT is still loss-making in the EOM 2.0 scenario, losses are higher still where no uplift is applied. (Figure 1)
The profitability of a more flexible new-build OCGT is illustrated in Figure 2. As
CM payments are assumed to be based on the value of missing money for an OCGT, the profitability under the CM is assumed to be EUR 0/kW across the modeling timeframe.
The EOM without uplift does not provide new build OCGT with the necessary revenues to recover its fixed costs. However, the EOM 2.0 scenario with uplift enables the technology to just achieve profitability; after discounting at 6%, Baringa estimates a net present value of profits over the period of just over EUR 3/kW in the EOM 2.0 scenario. (Figure 2)
The profitability of even more flexible gas engines in the EOM 2.0 scenario is observed to be higher than OCGT, earning EUR 146/kW in net present value terms across the modeling period (see Figure 3). Gas engines deliver higher profitability than an OCGT because they are more efficient. Therefore, gas engines have a lower SRMC (allowing them to recover higher infra-marginal rents), are more flexible in operation with a lower minimum stable operating limit, and have a shorter start up time.
However, under the CM, gas engines are observed to be loss-making, primarily because they have higher annuitised capital costs than OCGTs (meaning that the capacity payment based on OCGT “missing money” does not recover these fully). While gas engines are still able to earn some infra-marginal rent, even in the energy market with no “mark-up” rule, these earnings are not sufficient to generate a profit. (Figure 3)
These results highlight that the market design choice can have a significant impact on the technology choice for investors. The Baringa analysis suggests that the EOM 2.0 is more likely to deliver more flexible and lower capital expenditure-intensive capacity, which is more in line with the future needs of the

Fig. 2 -Profitability of a new-build OCGT.
Fig. 3 - Profitability of a new-build gas engine.
21in detail
WÄRTSILÄ TECHNICAL JOURNAL 02.2015
EOM 2.0
EOM 2.0
CM (OCGT capacity payment)
CM (OCGT capacity payment)
EOM without uplift
EOM without uplift
2024
2024
2025
2025
2030
2030
2031
2031
2026
2026
2027
2027
2032
2032
2033
2033
2028
2028
2029
2029
2034
2034
60
60
40
40
80
80
-40
-40
-20
-20
0
0
20
20
-60
-60
-80
-80
Net
pro
fit, €
/kW
Net
pro
fit, €
/kW

Fig. 4 - Total cost of EOM 2.0 scenario and CM scenario.
22 in detail
[ EN
ER
GY
/ I
N D
ET
AIL
]
[ ENERGY / IN DETAIL ]
German system. Indeed, the need for market characteristics that encourage investment in flexibility to manage intermittency is a key focus of the Green Paper.
Cost analysis: the EOM 2.0 delivers at lower overall cost per annum than the CMBaringa’s modeling results also indicate that the EOM 2.0 can deliver at a lower overall cost than the CM, even after accounting for the additional cost of a strategic reserve.
The strategic reserve is assumed to be procured from the 12 GW of plant closures by 2023 in the EOM 2.0 scenario. The choice of plant is determined based on keeping open those that require the lowest payments in terms of missing money to cover fixed costs; i.e., the least profitable plants are still assumed to be decommissioned. On this assumption, the plants that are procured are mostly coal plants that were commissioned in the 1980s, which have fixed costs of approximately EUR 250m per annum in total. A large portion of this capacity reaches the end of its life expectancy between 2025 and 2029, and then it will be decommissioned, which brings down the cost of the strategic reserve.
To calculate total costs in the EOM 2.0 scenario, wholesale market prices
incorporating uplift, as well as the costs of the strategic reserve, were taken into account.
For the CM scenario, the capacity payment, based upon the level of missing money calculated for an OCGT, was applied across all plants deemed to be eligible (i.e. conventional capacity). Baringa also compared the capacity payment, based upon the missing money calculated for a CCGT, to demonstrate the impact that setting a capacity payment at this level would have on overall costs.
The results from these total cost calculations are presented in Figure 4.
As Figure 4 illustrates, the costs under the EOM 2.0 scenario are generally close to those of the CM scenario in most years. On average, Baringa observed that the EOM 2.0 is approximately EUR 150m per annum lower cost than a CM based on OCGT missing money. Over the modeled period 2020-2035, this delivers a saving of EUR 2.5 bn net present value4.
In comparison, using a CM based on the missing money of a CCGT increases costs significantly, by around EUR 3 bn a year on average, compared to EOM 2.0. Over the modeled period, this costs German consumers an extra EUR 34 bn in net present value.
Conclusions and recommendationsWärtsilä considers that the analysis described out above provides a number of key insights into the debate on whether electricity markets should follow an EOM 2.0 or CM design. These include:
It is likely that any new conventional baseload capacity, such as Combined Cycle Gas Turbines (CCGT), will continue to be loss-making in both market designs because they are unlikely to generate for the hours required to earn sufficient revenues. This is caused both by the over-supply situation in Germany, and also the long-term reduction in running hours caused by the significant penetration of renewables in the German market. Even if CCGTs are paid capacity payments in the range of EUR 36-48/kW per annum, (the missing money of a ‘best new entrant’ in capex terms) Baringa still does not find them to be profitable in both market designs.
The EOM 2.0 creates stronger incentives for flexibility than the CM, as it targets financial incentives on flexible operation itself, instead of remunerating all types of capacity with the same level of payment. Although the analysis is conservatively based on historic intra-day and ancillary
EOM 2.0 with strategic reserve
CM – (payments based on CCGT missing money)CM – (payments based on OCGT missing money)
2024
2020
2025
2021
2030
2031
2026
2022
2027
2023
2032
2033
2028
2029
2034
2035
25
20
30
0
5
10
15
€bn
23in detail
WÄRTSILÄ TECHNICAL JOURNAL 02.2015
service prices, Baringa observes an increase in the profitability of flexible resources (relative to inflexible resources) in the EOM 2.0 scenario.
Lastly, the results showed that between 2020 and 2035, the EOM 2.0 serves the system at a cost that is approximately EUR 2.5 bn lower in net present value terms than the estimated costs under the CM scenario (with missing money based on the cost for a best new entrant). If Baringa instead bases the capacity payment on the missing money of a CCGT, the estimated costs under the CM scenario are EUR 34 bn higher (in NPV terms) than under the EOM 2.0 scenario.
Our recommendations for the market design policy debate are the following:
1. Based on the results of the Baringa analysis, governments should consider the advantages that EOM 2.0 will have in expediting the transition of an electricity market to one that is predominantly supplied by intermittent renewables balanced with flexible generation, such as gas engines. 2. Given these advantages, and the compelling results of the Baringa analysis, we believe that a market design based on
the EOM 2.0 provides a better alternative for providing a secure supply to a power system transiting to one that is dominated by renewables. This is because:
a. An EOM 2.0 market design provides efficient entry and exit signals while creating stronger incentives for the right type of capacity for the market.
b. It reduces the need for political involvement and the administrative burden associated with designing, implementing and running a CM (with recent experience in the UK providing a case in point).
c. The overall costs of the EOM 2.0 are lower compared to a CM
As Germany is one of the front runners in transforming its power system, the EOM 2.0 market design should be considered as a ‘blueprint’ for other EU member states. When other member states follow the same market design, a truly integrated, European, market-based energy system, which integrates renewables in a cost efficient and secure manner, can emerge.
In June 2015, the German government published the intention to reform the German energy market in line with the EOM 2.0 model presented in the Green Paper.
Footnotesi October 2014, Federal Ministry for Economic
Affairs and Energy (BMWi), http://www.bmwi.de/DE/
Themen/energie,did=693402.html
ii http://www.bmwi.de/DE/Themen/Energie/
Strommarkt-der-Zukunft/Gruenbuch/
stellungnahmen-gruenbuch.html?
1 Missing money refers to the level of revenues
missing from the market that are required for
a generator to recover its fixed operations and
maintenance costs and any capital costs.
2 Assumed to be a “best new entrant” - a capacity
provider that is able to deliver generating capacity
at the lowest capital cost.
3 Our estimate of total system costs does not
include the cost of ancillary services.
4 Discounted at 3.5%
24 in detail
[ EN
ER
GY
/ I
N D
ET
AIL
]
[ ENERGY / IN DETAIL ]
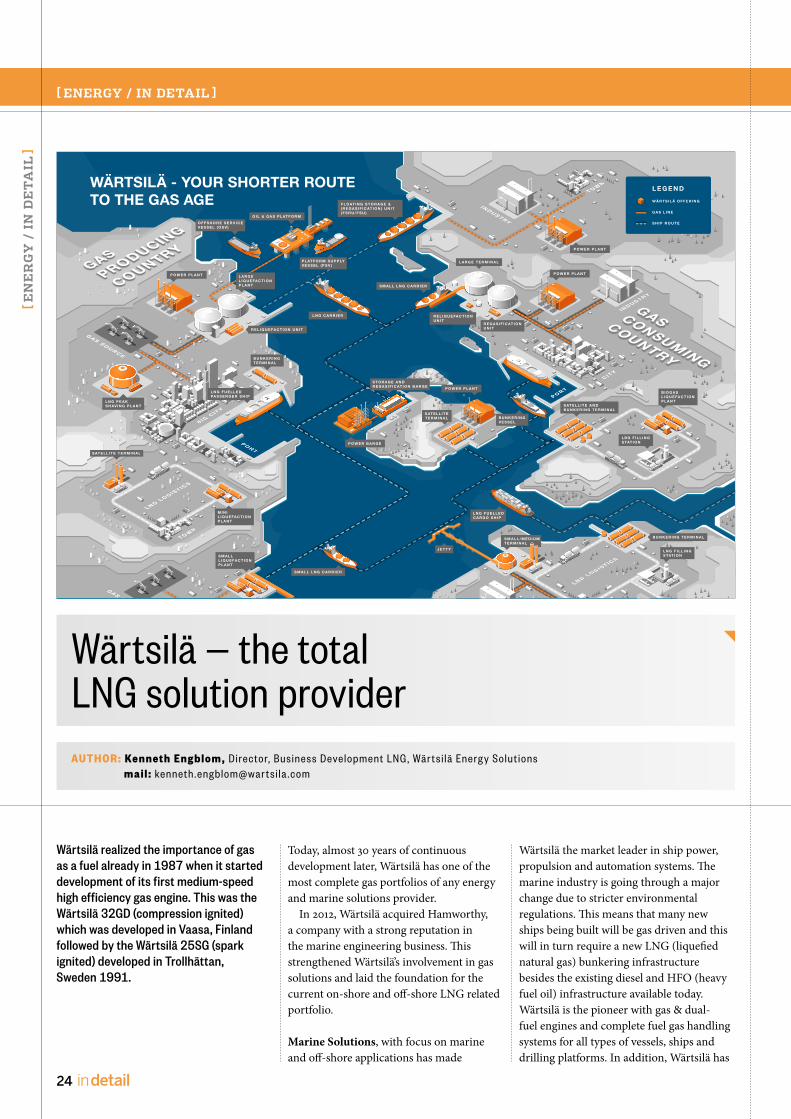
Wärtsilä — the total LNG solution providerAUTHOR: Kenneth Engblom, Dire c tor, Busine s s D evelopment LN G , Wär t si lä Ener g y S olu t ions
mail : kenneth .eng blom@war t si la .c om
Wärtsilä realized the importance of gas as a fuel already in 1987 when it started development of its first medium-speed high efficiency gas engine. This was the Wärtsilä 32GD (compression ignited) which was developed in Vaasa, Finland followed by the Wärtsilä 25SG (spark ignited) developed in Trollhättan, Sweden 1991.
Today, almost 30 years of continuous development later, Wärtsilä has one of the most complete gas portfolios of any energy and marine solutions provider.
In 2012, Wärtsilä acquired Hamworthy, a company with a strong reputation in the marine engineering business. This strengthened Wärtsilä’s involvement in gas solutions and laid the foundation for the current on-shore and off-shore LNG related portfolio.
Marine Solutions, with focus on marine and off-shore applications has made
Wärtsilä the market leader in ship power, propulsion and automation systems. The marine industry is going through a major change due to stricter environmental regulations. This means that many new ships being built will be gas driven and this will in turn require a new LNG (liquefied natural gas) bunkering infrastructure besides the existing diesel and HFO (heavy fuel oil) infrastructure available today. Wärtsilä is the pioneer with gas & dual-fuel engines and complete fuel gas handling systems for all types of vessels, ships and drilling platforms. In addition, Wärtsilä has
L A R G E T E R M I N A L
R E G A S I F I C AT I O NU N I T
S M A L L L N G C A R R I E R
L N G C A R R I E R
F L O AT I N G S T O R A G E &( R E G A S I F I C AT I O N ) U N I T( F S R U / F S U )
S T O R A G E A N DR E G A S I F I C AT I O N B A R G E
O I L & G A S P L AT F O R M
O F F S H O R E S E R V I C EV E S S E L ( O S V )
P L AT F O R M S U P P LYV E S S E L ( P S V )
S M A L L L N G C A R R I E R
P O W E R B A R G E
S AT E L L I T ET E R M I N A L
P O W E R P L A N T
P O W E R P L A N T
B U N K E R I N GV E S S E L
P O W E R P L A N TP O W E R P L A N T
B U N K E R I N GT E R M I N A L
L N G F U E L L E DPA S S E N G E R S H I P
L N G P E A KS H AV I N G P L A N T S AT E L L I T E A N D
B U N K E R I N G T E R M I N A L
L N G F U E L L E DC A R G O S H I P
S M A L L / M E D I U MT E R M I N A L
L N G F I L L I N GS TAT I O NS M A L L
L I Q U E FA C T I O N P L A N T
B I O G A SL I Q U E FA C T I O N P L A N T
M I N IL I Q U E FA C T I O N P L A N T
S AT E L L I T E T E R M I N A L
L A R G EL I Q U E FA C T I O N P L A N T
L B G F I L L I N G S TAT I O N
B U N K E R I N G T E R M I N A L
J E T T Y
WÄRTSILÄ - YOUR SHORTER ROUTETO THE GAS AGE
R E L I Q U E FA C T I O N U N I T
R E L I Q U E FA C T I O NU N I T
L E G E N D
G A S L I N E
S H I P R O U T E
W Ä RT S I L Ä O F F E R I N G
25in detail
WÄRTSILÄ TECHNICAL JOURNAL 02.2015
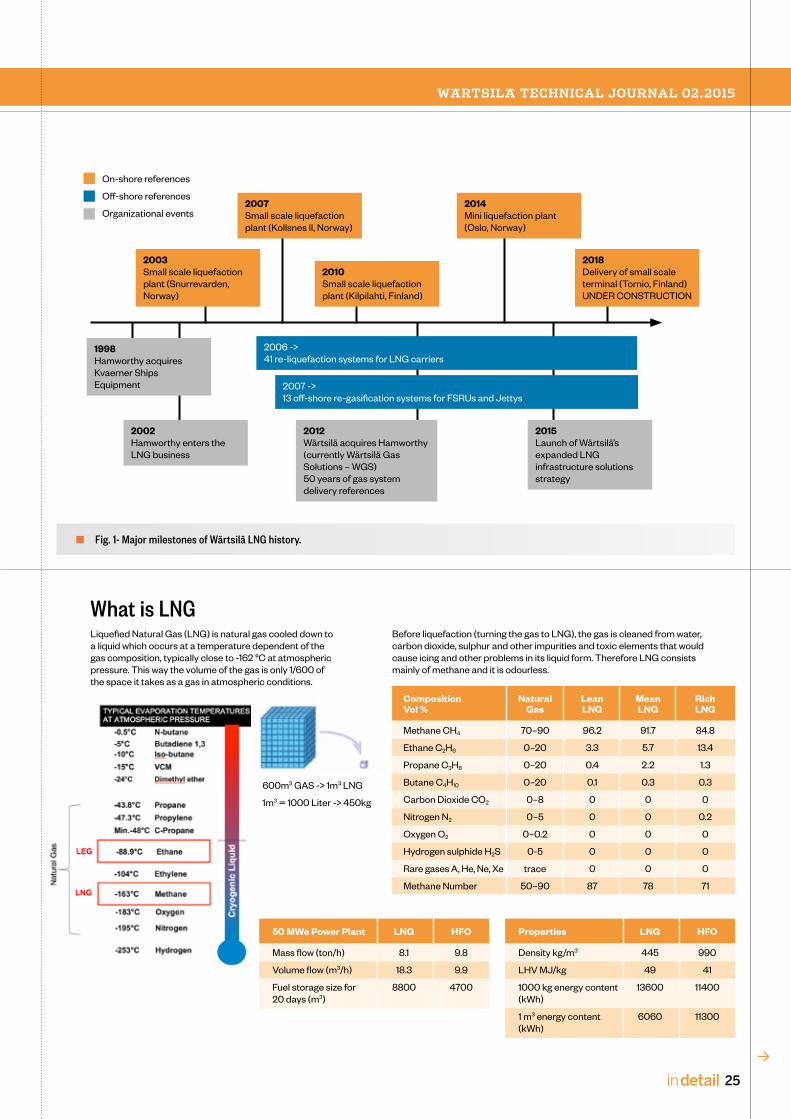
Fig. 1- Major milestones of Wärtsilä LNG history.
Composition Natural Lean Mean RichVol % Gas LNG LNG LNG
Methane CH4 70–90 96.2 91.7 84.8
Ethane C2H6 0–20 3.3 5.7 13.4
Propane C3H8 0–20 0.4 2.2 1.3
Butane C4H10 0–20 0.1 0.3 0.3
Carbon Dioxide CO2 0–8 0 0 0
Nitrogen N2 0–5 0 0 0.2
Oxygen O2 0–0.2 0 0 0
Hydrogen sulphide H2S 0-5 0 0 0
Rare gases A, He, Ne, Xe trace 0 0 0
Methane Number 50–90 87 78 71
Before liquefaction (turning the gas to LNG), the gas is cleaned from water, carbon dioxide, sulphur and other impurities and toxic elements that would cause icing and other problems in its liquid form. Therefore LNG consists mainly of methane and it is odourless.
Properties LNG HFO
Density kg/m3 445 990
LHV MJ/kg 49 41
1000 kg energy content 13600 11400(kWh)
1 m3 energy content 6060 11300(kWh)
50 MWe Power Plant LNG HFO
Mass flow (ton/h) 8.1 9.8
Volume flow (m3/h) 18.3 9.9
Fuel storage size for 8800 470020 days (m3)
Liquefied Natural Gas (LNG) is natural gas cooled down to a liquid which occurs at a temperature dependent of the gas composition, typically close to -162 °C at atmospheric pressure. This way the volume of the gas is only 1/600 of the space it takes as a gas in atmospheric conditions.
What is LNG
2007Small scale liquefaction plant (Kollsnes II, Norway)
2010Small scale liquefaction plant (Kilpilahti, Finland)
2014Mini liquefaction plant (Oslo, Norway)
2018Delivery of small scale terminal (Tornio, Finland)UNDER CONSTRUCTION
2003Small scale liquefaction plant (Snurrevarden, Norway)
1998Hamworthy acquires Kvaerner Ships Equipment
2002Hamworthy enters the LNG business
2012Wärtsilä acquires Hamworthy (currently Wärtsilä Gas Solutions – WGS)50 years of gas system delivery references
2015Launch of Wärtsilä’s expanded LNG infrastructure solutions strategy
2006 ->→41 re-liquefaction systems for LNG carriers
2007 ->13 off-shore re-gasification systems for FSRUs and Jettys
On-shore references
Off-shore references
Organizational events
600m3 GAS -> 1m3 LNG
1m3 = 1000 Liter -> 450kg

26 in detail
[ EN
ER
GY
/ I
N D
ET
AIL
]
[ ENERGY / IN DETAIL ]
also been providing complete regasification systems for FSRUs (floating storage and regasification units) and re-liquefaction systems for LNG carriers since 2006.
Energy Solutions, with focus on power plants and other energy related on-shore applications has made Wärtsilä one of the biggest suppliers of gas and liquid fuel power plants in the 5–600 MW range. These plants are used as baseload and/or grid stability plants or lately as “wind chasers” and “sunset balancers”, compensating for the intermittency of wind power and the sudden drop of solar power in the evenings when we need power the most. These multi-duty power plants which are providing superior operational flexibility combined with the highest possible simple cycle efficiency are called Smart Power Generation power plants. The majority of new plants are equipped either with gas or dual-fuel engines and many existing HFO power plants are being converted to gas. The energy industry is clearly shifting to gas but the challenge is that gas is not yet readily available everywhere in the same way as diesel and HFO are. But with LNG, large amounts of gas can economically be brought to new areas presently not covered by gas pipelines and gas infrastructure.
Wärtsilä has during the last few years developed an extensive LNG product portfolio and know-how. Today we are
proud to present one of the most complete portfolios of LNG solutions and services in the market. See Figure 1 for the main milestones in Wärtsilä’s LNG history.
The LNG technologyWärtsilä and former Hamworthy have over the last years made major efforts to develop liquefaction and regasification technology and optimize it for future market requirements. Thanks to the investment, Wärtsilä has today extremely robust and energy efficient solutions available for liquefaction and regasification. The text below explains Wärtsilä’s process solutions and unique features of the main processes used in LNG infrastructure solutions, namely liquefaction, storage, boil-off gas (BOG) handling and regasification:
LiquefactionWärtsilä has developed two main liquefaction technologies that are suitable for mini and small-scale liquefaction capacities. A MR (mixed refrigerant) process for the smaller sizes and the Reversed Brayton Cycle process for the larger sizes.
MR (mixed refrigerant): The standard MR or SMR (single mixed refrigerant) process using a turbo compressor and refrigerants consisting of methane, ethane, propane, pentane and nitrogen is normally used for large capacity liquefaction systems.
The composition of the mixed refrigerant is chosen for adaptation to the cool down process. A good match between cooling curves will increase the efficiency of the system. The refrigerants work in a closed loop, but during stand-still when the system is heated up, part of the refrigerant charge will be lost. To re-start the system, it needs to be refilled again with the correct mixture.
Wärtsilä has developed a simplified version of the MR process based on a simple screw compressor and a special mix of refrigerants. Thanks to a buffering system it is a fully closed loop system that does not need refilling after a start and stop procedure. The system is delivered as three prefabricated modules. It is based on standard components with a level of standardisation that allows for low investment cost and fast manufacturing of the module. The repetitive design gives consistent high quality in a compact module. With a slightly different refrigerant mixture, an intelligent automation system and standardized components, Wärtsilä has been able to combine the high efficiency of the MR process, with the simplicity needed in smaller plants. For small capacities, below 50 TPD (metric tonne per day), Wärtsilä’s MR process is the ideal solution. (Figure 2)
Wärtsilä’s MR solution is perfect for biogas and landfill gas liquefaction plants that are usually built in smaller sizes. The first plant built and operating with this
LNG Value Chain
The LNG value chain starts with gas extraction/production followed by pre-treatment/processing and liquefaction. Then the LNG is stored in large insulated tanks ready for transport. It is transported with specially built LNG tankers across oceans. At the receiving end, LNG is pumped to large on-shore tanks or off-shore FS(R)Us. Finally LNG is regasified and pumped into the local gas pipelines or further transported by trucks in the form of LNG.
Gas
Natural Gas
Production
Processing and Liquefaction (LNG Train)
Shipping Regasification End User
LNG LNG Gas

27in detail
WÄRTSILÄ TECHNICAL JOURNAL 02.2015
Advantages of Wärtsilä’s MR technology for mini liquefaction plants • Easy and quick start up and shut down of all systems • Can be started in 30 min, but typically <3h due to heat exchanger cool down limitations• The lowest specific power consumption in the small size plants.• All components based on conventional parts and proven technology –> Spares can be delivered quickly• Short delivery time ( <12 months) where the cold box and compressor are the only long lead items• Reliable main rotating machinery with high efficiency (Oil flooded screw compressor)• Compact design & easy shipment as all in one module and a separate compressor skid• Designed for unmanned operation • Local control of LNG export –> truck driver handles loading• Simple energy supply, only electrical power needed • Standard capacities: 10, 17 and 25 tons/day• Plug and play philosophy, skid based – relocation possible• Broad range of applications, biogas, pipeline gas, CBM and associated gas
Advantages of Wärtsilä’s Reversed Brayton Cycle for small scale liquefaction plants • Robust, reliable and simple to operate technology• Designed for unmanned operation• Capacity control is very easy and quick• Easy start-up and shutdown of all systems• Local control of LNG export, truck driver handles loading• Simple energy supply, only electrical power needed • Refrigerant will be produced directly from air on site – No logistics connected to the refrigerant• There is no required handling of chemicals• ZERO FLARE solution –> during normal operations, hydrocarbon losses will be zero.
Fig. 2 - Process overview of Wärtsilä MR technology (Cold box = insulated with perlite or polyurethane).
Fig. 3 - Process overview of Wärtsilä Reversed Brayton technology.

28 in detail
[ EN
ER
GY
/ I
N D
ET
AIL
]
[ ENERGY / IN DETAIL ]
technology was the biogas liquefaction plant for the City of Oslo, Norway, which is operational since 2014.
Reversed Brayton Cycle: For the larger sizes >50 ton/day Wärtsilä recommends a liquefaction system with double expanders based on the Reversed Brayton Cycle process. The advantages of this system versus other systems is that it is very adaptive to capacity changes and is very easy to operate. Furthermore, the nitrogen used as refrigerant is produced directly from air at site. Wärtsilä has further improved and fine-tuned the Reversed Brayton process for low electricity consumption. Wärtsilä’s Reversed Brayton system has been used in more than 40 LNG carriers for their re-liquefaction systems, much thanks to its ease of operation, reliability and robustness. (Figure 3)
LIN (liquid nitrogen): Besides these two main technologies Wärtsilä has also built a small liquefaction plant for Gasum in Finland based on LIN cooling. The advantages of this process is its simple installation with low investment cost, but the disadvantage is high energy consumption.
StorageUsually the most expensive part of a large LNG terminal is the insulated storage tank(s). Onshore storage can either be arranged using a flat-bottom tank with storage capacity of 8000–160,000 m3, spherical tanks of 1000–8000 m3 or bullet tanks for smaller LNG storage volumes. The bullet tanks are normally in the range of 250–1500 m3 meaning that larger storage capacities (up to 20,000 m3) are arranged with several tanks in a row.
Flat bottom tanks can be divided into single (integrity) containment, double (integrity) containment or full (integrity) containment tanks. Above-ground full containment tank technology is the preferred solution when it comes to storing large quantities of LNG with maximum safety in a limited site area. But depending on safety requirements and
free space available around the tank also the single and double containment tanks can be considered. Flat bottom tanks are produced at site, which prolongs construction time. (Figure 4)
Bullet tanks are of interest when it comes to storing smaller volumes of LNG. They are stainless steel pressure vessels insulated by perlite or/and vacuum. These systems are modular, flexible, available in vertical or horizontal formats, and may be arranged in tank farms of any number of manifold rows of tanks to provide the desired amount of storage. Bullet tanks are pre-fabricated in factories, which potentially reduces site costs. (Figure 5)
Boil-off gas (BOG) handlingOne of the challenges handling LNG is the BOG. BOG is produced because LNG is stored at cryogenic conditions (below −162°C at atmospheric pressure) in a much warmer ambient environment. It is the result of several factors:
Heat leak into the LNG carrier, storage tanks, process equipment and process piping
Mechanical energy input by process equipment [e.g. low-pressure (LP) in-tank and high-pressure (HP) send-out pumps]
Displaced vapours from the LNG carrier and LNG storage tanks due to unloading, loading and send-out flowrates
Atmospheric pressure changes Elevation difference between the LNG
carrier and the storage tanksBOG creates pressure in the tank that has to be managed/released in order to maintain the pressure within the allowed tank design pressure. BOG during normal operation and storage is only about 0.05% (of tank mass)/day, while it can be up to 0.15%/day during ship unloading. Then during the ship unloading when excess BOG is generated it is common that the BOG is returned to the LNG carrier through a vapour return line compensating for the liquid volume reduction in the LNG carrier. BOG consists mainly of methane which is not allowed to be purged into the atmosphere due to
its greenhouse gas effect, so the simplest way to get rid of BOG is to burn or flare it. This is of course not desirable, wasting expensive gas, therefore this option is only considered when no other options are available. The normal way to handle BOG in terminals with a constant send-out is to use a BOG compressor pumping the BOG out together with the gas send-out to a local offtaker, such as a power plant, or into the gas pipeline. Depending on the gas piping pressure level there is either an LP or an HP BOG compressor. A temporary solution to get rid of the BOG forming at the top of the tank is to recirculate or top spray the tank with cold LNG from the bottom. Another alternative that also requires LNG send-out is to use a BOG re-condenser. In the BOG re-condenser, the BOG is mixed with subcooled LNG for re-condensation of the BOG.
When there is no gas send-out, the LNG terminal is in a so called zero send-out mode. If you have excess BOG during zero send-out mode the only other alternative to flaring is to re-liquefy the BOG and pump it back into the tank.
Wärtsilä has developed modularized packages for the various BOG handling systems with the BOG compressor as the main component.
Wärtsilä’s recommendation is to build the terminal in conjunction with gas consumers that can utilize the BOG in their process or power production. This way we can guarantee a consumption any time there is excessive BOG and there is no waste nor any need to use energy for re-liquefying the gas. Combining a Wärtsilä gas power plant with a terminal is a perfect solution as the BOG can be directly converted into electric power which is used in the LNG terminal itself or exported to other electricity consumers.
Send-out systemThe send-out system is the main process of a terminal that includes the regasification/vaporization unit. The BOG compressor is normally integrated into this system, releasing the excess BOG together with the send-out as described in the earlier chapter.
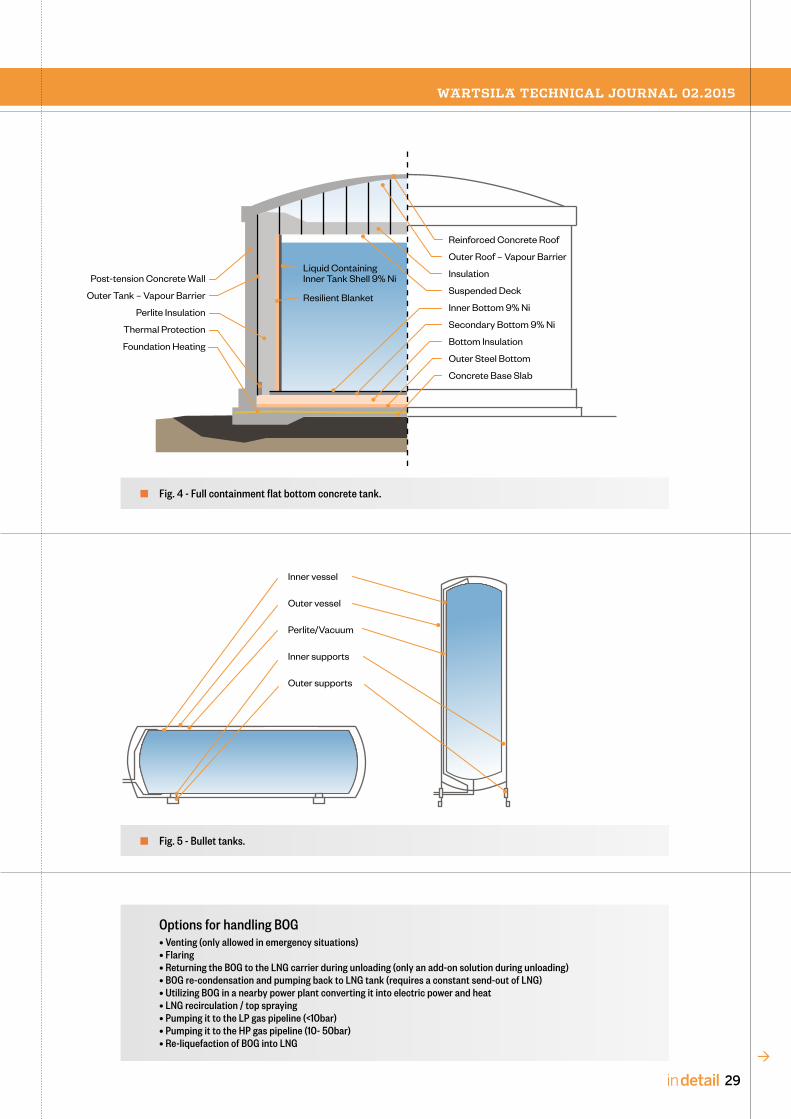
29in detail
WÄRTSILÄ TECHNICAL JOURNAL 02.2015
Options for handling BOG• Venting (only allowed in emergency situations)• Flaring• Returning the BOG to the LNG carrier during unloading (only an add-on solution during unloading)• BOG re-condensation and pumping back to LNG tank (requires a constant send-out of LNG)• Utilizing BOG in a nearby power plant converting it into electric power and heat• LNG recirculation / top spraying• Pumping it to the LP gas pipeline (<10bar)• Pumping it to the HP gas pipeline (10- 50bar)• Re-liquefaction of BOG into LNG
Fig. 5 - Bullet tanks.
Fig. 4 - Full containment flat bottom concrete tank.
Inner vessel
Outer vessel
Perlite/Vacuum
Inner supports
Outer supports
Reinforced Concrete Roof
Post-tension Concrete Wall
Inner Bottom 9% Ni
Foundation Heating
Insulation
Perlite Insulation
Bottom Insulation
Outer Roof – Vapour Barrier
Outer Tank – Vapour Barrier
Secondary Bottom 9% Ni
Suspended Deck
Liquid Containing Inner Tank Shell 9% Ni
Resilient Blanket
Thermal Protection
Outer Steel Bottom
Concrete Base Slab

30 in detail
[ EN
ER
GY
/ I
N D
ET
AIL
]
[ ENERGY / IN DETAIL ]
Depending on the requirement, there can be an LP send-out system (< 10 bar), or an HP send-out (10-50 bar). The low pressure send-out is a fairly simple system where the tank low pressure LNG pumps are pushing the LNG via the regasification/vaporization module to the pipeline. In case of a high pressure send-out system there will be additional HP pumps that can be supplied as part of the vaporizer/regasification module. Typically gas transmission pipelines require a pressure over 10 bar while more local gas distribution pipelines can have a design pressure of less than 10 bar.
Regasification/vaporizationIn order to convert the LNG back to gaseous form for the final consumers all the energy that was extracted from the gas to make it liquid in the first place has to be returned to it through the vaporizer. The vaporizer is essentially a large heat exchanger that heats the LNG.
Typical types of vaporizers that have been used worldwide for LNG regasification are:
Open rack vaporizers (ORV) based on seawater heating (Figure 6)
Submerged combustion vaporizers (SCV) based on fuel heating (Figure 7)
Ambient air vaporizers (AAV) based on ambient air heating
Intermediate fluid vaporizers (IFV)
FSRUs (Floating Storage and Regasification Units) and onshore regasification terminals close to shore use only seawater to provide heat for vaporization but this has the risk of seawater freezing and clogging heat exchangers. Instead Wärtsilä uses propane and seawater in cascade loop to warm the LNG. Wärtsilä built the first pilot plant based on this technology already in 2005. Propane is used in the first stage heat exchanger to heat the LNG from -160°C to -10°C. In the second stage, the LNG is then further heated and vaporized by using seawater directly as the heating medium.
Wärtsilä uses printed circuit heat exchangers that allow for a compact design capable of high pressures. The robustness in
terms of turndown capability, ramping up and down has also been demonstrated.
In situations where seawater cannot be used, or seawater is too cold, energy has to be provided from a gas burner in a submerged combustion vaporizer (SCV) with a steam/water-glycol heat exchanger. Unfortunately fuel costs when discharging a 145,000 m3 LNG carrier provided with a steam/water–glycol unit only can be quite substantial. To save fuel, Wärtsilä has developed a solution using energy from the seawater in combination with cooling water from the Wärtsilä engines. This is then backed up with energy from the gas burner
only when needed. This way fuel costs can be cut considerably.
Wärtsilä’s regasification modules, with their optimized energy use in combination with high reliability and simplicity of control, have been a proven solution supplied to 12 or roughly 1/3 of the world’s most modern FSRUs.
Total solutionsWe have now described the main sub processes of the liquefaction plants and regasification terminals. But a total system is only as good as its weakest link and Wärtsilä’s core competence lays in designing
Fig. 7 - Submerged Combustion vaporizer.
Fig. 6 - Open Rack vaporizer.
Natural Gas To Metering
Natural Gas To Metering
SeawaterIntake Pumps
SeawaterTo Outfall
LNG
LNG
Stack
Fuel Gas
Air Blower
Air
Burner
Seawater In
Gas turbines require 15–40 bar of gas pressure, while a Wärtsilä power plant runs well on gas pressures as low as 6 bar.
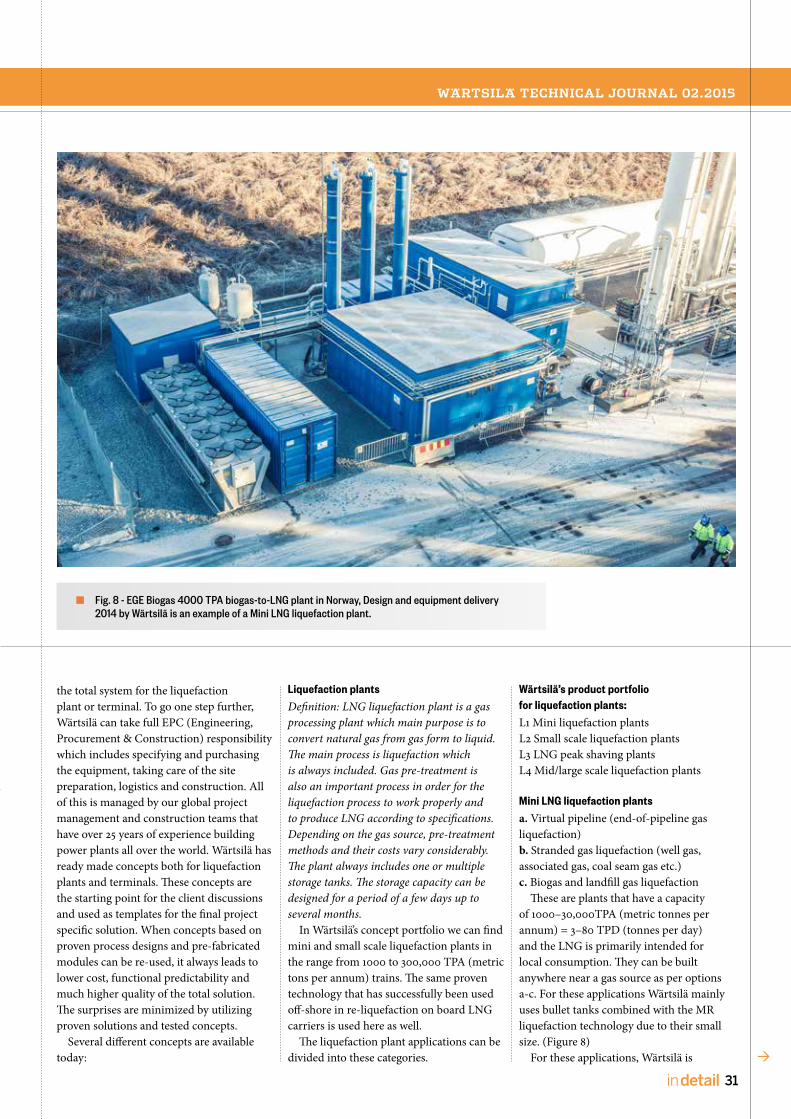
31in detail
WÄRTSILÄ TECHNICAL JOURNAL 02.2015
the total system for the liquefaction plant or terminal. To go one step further, Wärtsilä can take full EPC (Engineering, Procurement & Construction) responsibility which includes specifying and purchasing the equipment, taking care of the site preparation, logistics and construction. All of this is managed by our global project management and construction teams that have over 25 years of experience building power plants all over the world. Wärtsilä has ready made concepts both for liquefaction plants and terminals. These concepts are the starting point for the client discussions and used as templates for the final project specific solution. When concepts based on proven process designs and pre-fabricated modules can be re-used, it always leads to lower cost, functional predictability and much higher quality of the total solution. The surprises are minimized by utilizing proven solutions and tested concepts.
Several different concepts are available today:
Liquefaction plantsDefinition: LNG liquefaction plant is a gas processing plant which main purpose is to convert natural gas from gas form to liquid. The main process is liquefaction which is always included. Gas pre-treatment is also an important process in order for the liquefaction process to work properly and to produce LNG according to specifications. Depending on the gas source, pre-treatment methods and their costs vary considerably. The plant always includes one or multiple storage tanks. The storage capacity can be designed for a period of a few days up to several months.
In Wärtsilä’s concept portfolio we can find mini and small scale liquefaction plants in the range from 1000 to 300,000 TPA (metric tons per annum) trains. The same proven technology that has successfully been used off-shore in re-liquefaction on board LNG carriers is used here as well.
The liquefaction plant applications can be divided into these categories.
Wärtsilä’s product portfolio for liquefaction plants:L1 Mini liquefaction plantsL2 Small scale liquefaction plantsL3 LNG peak shaving plantsL4 Mid/large scale liquefaction plants
Mini LNG liquefaction plantsa. Virtual pipeline (end-of-pipeline gas liquefaction)b. Stranded gas liquefaction (well gas, associated gas, coal seam gas etc.)c. Biogas and landfill gas liquefaction
These are plants that have a capacity of 1000–30,000TPA (metric tonnes per annum) = 3–80 TPD (tonnes per day) and the LNG is primarily intended for local consumption. They can be built anywhere near a gas source as per options a-c. For these applications Wärtsilä mainly uses bullet tanks combined with the MR liquefaction technology due to their small size. (Figure 8)
For these applications, Wärtsilä is
Fig. 8 - EGE Biogas 4000 TPA biogas-to-LNG plant in Norway, Design and equipment delivery 2014 by Wärtsilä is an example of a Mini LNG liquefaction plant.
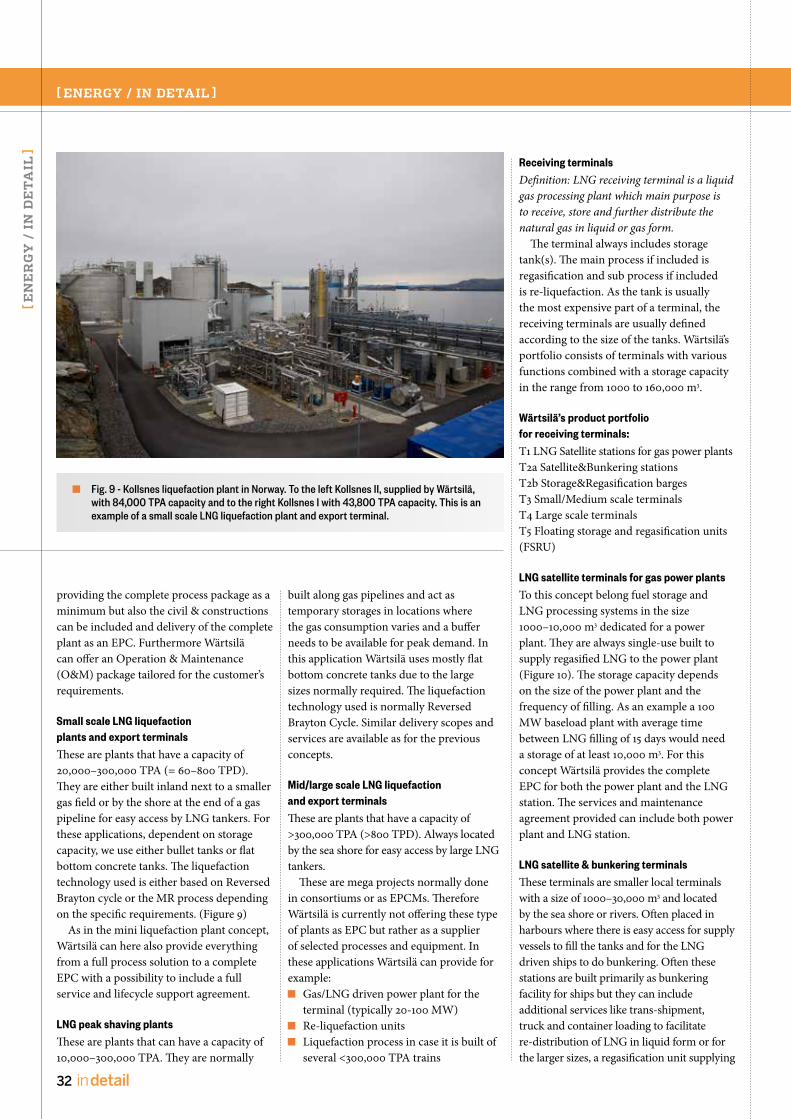
32 in detail
[ EN
ER
GY
/ I
N D
ET
AIL
]
[ ENERGY / IN DETAIL ]
providing the complete process package as a minimum but also the civil & constructions can be included and delivery of the complete plant as an EPC. Furthermore Wärtsilä can offer an Operation & Maintenance (O&M) package tailored for the customer’s requirements.
Small scale LNG liquefaction plants and export terminalsThese are plants that have a capacity of 20,000–300,000 TPA (= 60–800 TPD). They are either built inland next to a smaller gas field or by the shore at the end of a gas pipeline for easy access by LNG tankers. For these applications, dependent on storage capacity, we use either bullet tanks or flat bottom concrete tanks. The liquefaction technology used is either based on Reversed Brayton cycle or the MR process depending on the specific requirements. (Figure 9)
As in the mini liquefaction plant concept, Wärtsilä can here also provide everything from a full process solution to a complete EPC with a possibility to include a full service and lifecycle support agreement.
LNG peak shaving plantsThese are plants that can have a capacity of 10,000–300,000 TPA. They are normally
built along gas pipelines and act as temporary storages in locations where the gas consumption varies and a buffer needs to be available for peak demand. In this application Wärtsilä uses mostly flat bottom concrete tanks due to the large sizes normally required. The liquefaction technology used is normally Reversed Brayton Cycle. Similar delivery scopes and services are available as for the previous concepts.
Mid/large scale LNG liquefaction and export terminalsThese are plants that have a capacity of >300,000 TPA (>800 TPD). Always located by the sea shore for easy access by large LNG tankers.
These are mega projects normally done in consortiums or as EPCMs. Therefore Wärtsilä is currently not offering these type of plants as EPC but rather as a supplier of selected processes and equipment. In these applications Wärtsilä can provide for example:
Gas/LNG driven power plant for the terminal (typically 20-100 MW)
Re-liquefaction units Liquefaction process in case it is built of
several <300,000 TPA trains
Receiving terminals Definition: LNG receiving terminal is a liquid gas processing plant which main purpose is to receive, store and further distribute the natural gas in liquid or gas form.
The terminal always includes storage tank(s). The main process if included is regasification and sub process if included is re-liquefaction. As the tank is usually the most expensive part of a terminal, the receiving terminals are usually defined according to the size of the tanks. Wärtsilä’s portfolio consists of terminals with various functions combined with a storage capacity in the range from 1000 to 160,000 m3.
Wärtsilä’s product portfolio for receiving terminals:T1 LNG Satellite stations for gas power plantsT2a Satellite&Bunkering stationsT2b Storage&Regasification bargesT3 Small/Medium scale terminalsT4 Large scale terminalsT5 Floating storage and regasification units (FSRU)
LNG satellite terminals for gas power plants To this concept belong fuel storage and LNG processing systems in the size 1000–10,000 m3 dedicated for a power plant. They are always single-use built to supply regasified LNG to the power plant (Figure 10). The storage capacity depends on the size of the power plant and the frequency of filling. As an example a 100 MW baseload plant with average time between LNG filling of 15 days would need a storage of at least 10,000 m3. For this concept Wärtsilä provides the complete EPC for both the power plant and the LNG station. The services and maintenance agreement provided can include both power plant and LNG station.
LNG satellite & bunkering terminalsThese terminals are smaller local terminals with a size of 1000–30,000 m3 and located by the sea shore or rivers. Often placed in harbours where there is easy access for supply vessels to fill the tanks and for the LNG driven ships to do bunkering. Often these stations are built primarily as bunkering facility for ships but they can include additional services like trans-shipment, truck and container loading to facilitate re-distribution of LNG in liquid form or for the larger sizes, a regasification unit supplying
Fig. 9 - Kollsnes liquefaction plant in Norway. To the left Kollsnes II, supplied by Wärtsilä, with 84,000 TPA capacity and to the right Kollsnes I with 43,800 TPA capacity. This is an example of a small scale LNG liquefaction plant and export terminal.
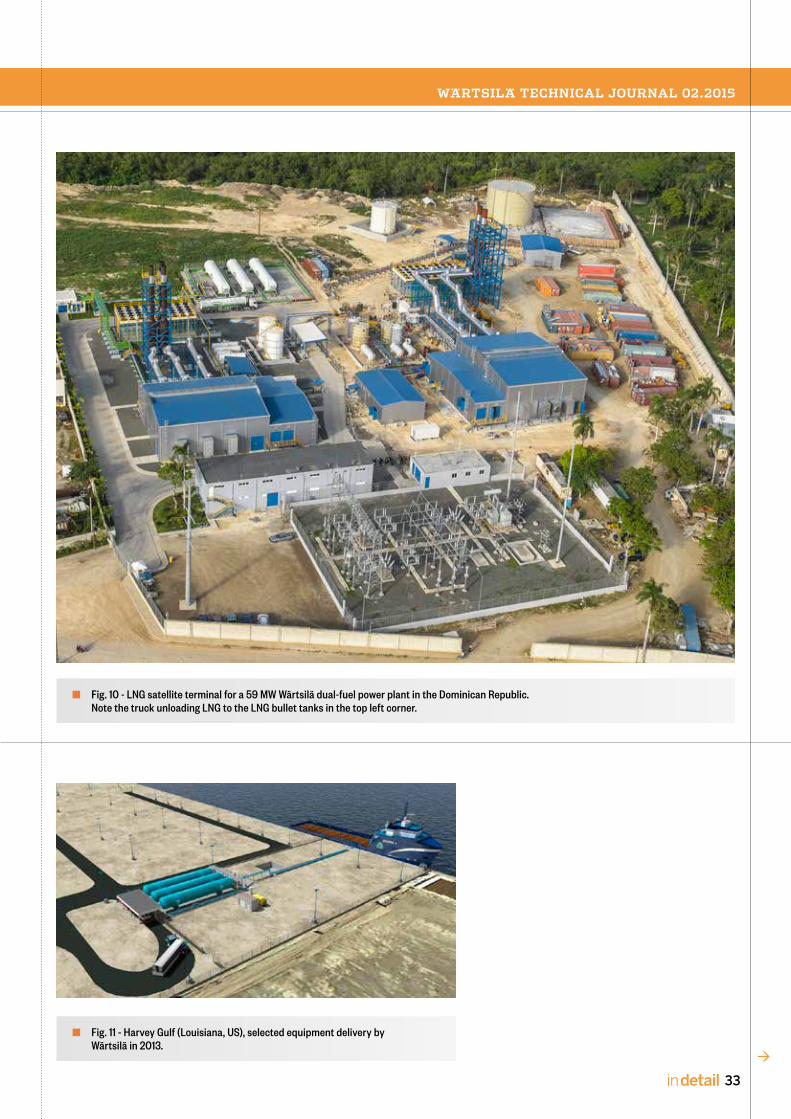
33in detail
WÄRTSILÄ TECHNICAL JOURNAL 02.2015
Fig. 10 - LNG satellite terminal for a 59 MW Wärtsilä dual-fuel power plant in the Dominican Republic. Note the truck unloading LNG to the LNG bullet tanks in the top left corner.
Fig. 11 - Harvey Gulf (Louisiana, US), selected equipment delivery by Wärtsilä in 2013.
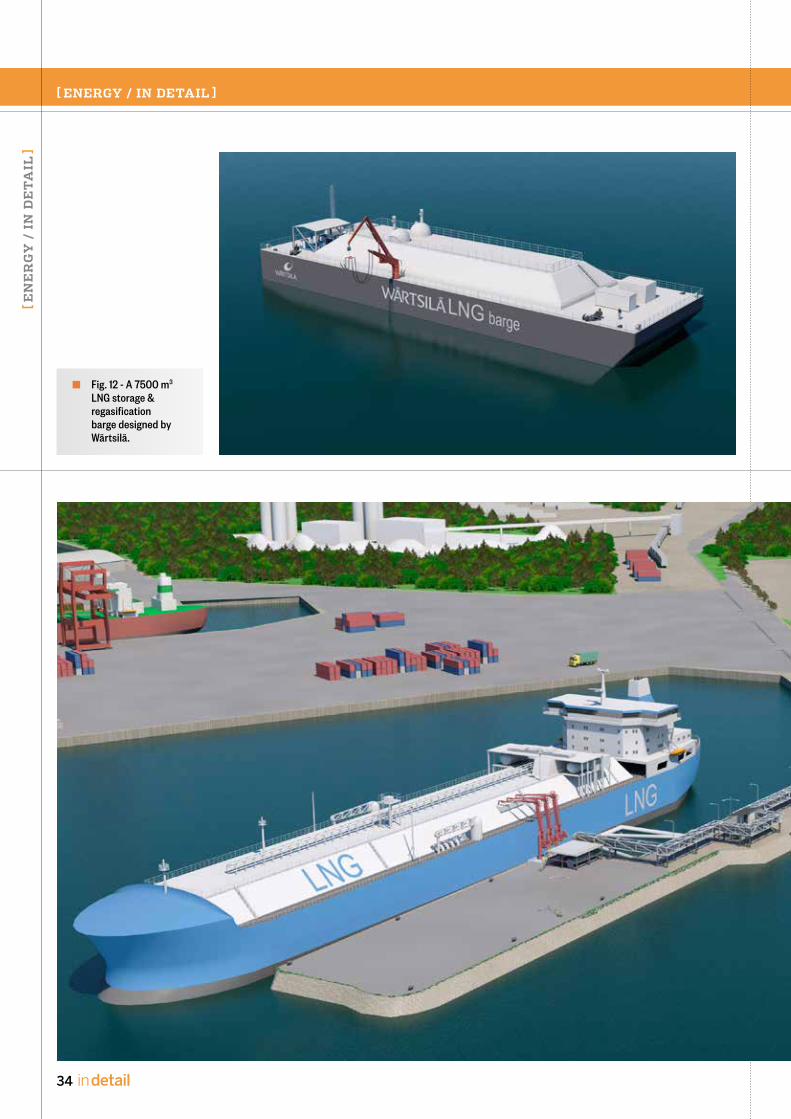
34 in detail
[ EN
ER
GY
/ I
N D
ET
AIL
]
[ ENERGY / IN DETAIL ]
Fig. 12 - A 7500 m3 LNG storage & regasification barge designed by Wärtsilä.

35in detail
WÄRTSILÄ TECHNICAL JOURNAL 02.2015
a local gas pipeline could be added. Wärtsilä’s preference is to deliver these
projects as EPC with full delivery and performance guarantees. The terminal can be supported with full service agreements.(Figure 11)
LNG storage & regasification bargesThe smallest FSRUs today are around 120,000 m3. There are no small LNG carriers available that can be converted to FSRUs. Wärtsilä has created a solution for this problem, by designing a barge containing storage tanks (1000–25,000 m3) and regasification
systems. These can in certain conditions be an attractive alternative to on-shore satellite and bunkering terminals. The LNG barge can be equipped with the similar processes as the land based solution. The process can also be split between the barge and the land, by locating for example the LNG storage on the barge and parts of the process equipment and support facilities on shore.
Wärtsilä prefers to deliver the barge and necessary infrastructure on-shore as a complete EPC. Wärtsilä can also provide the services and maintenance agreements for the total solution. (Figure 12)
Small/medium scale LNG terminalsThese are terminals in the size of 20,000–160,000 m3 located at sea shores, working as hubs for whole regions or larger cities. Due to the major investment and volumes, a group of industries and consumers are needed to make these projects possible. They are always multi use terminals which can include regasification, pipeline distribution, ship bunkering, trans-shipment, truck and container loading to facilitate re-distribution of LNG in liquid form. (Figure 13)
Fig. 13 - Manga LNG terminal in Tornio, Finland. EPC delivery by Wärtsilä.

36 in detail
[ EN
ER
GY
/ I
N D
ET
AIL
]
[ ENERGY / IN DETAIL ]
Fig. 14 - Dragon LNG Terminal, in Wales, UK. Wärtsilä will deliver the re-liquefaction system, to be installed during 2016–17. Photo: Dragon LNG Limited.
Large scale LNG terminalsThese terminals are built only in countries with large imports of LNG. These are terminals with >150,000 m3 tank capacities and a throughput of >3 MTPA and located at the sea shore for easy access by large tankers. (Figure 14)
In these mega projects Wärtsilä does not assume EPC responsibility but rather supplies selected equipment and design packages. Wärtsilä can for example supply:
Gas/LNG driven power plant for the
terminal (typically 10–50 MW) Re-liquefaction process Regasification process
FSRU or FSU + jetty regasificationA FSU (floating storage unit) is really an LNG carrier that is stationed at a seashore. If you add a regasification unit it is called an FSRU (floating storage and regasification unit). The sizes are the typical size of LNG carriers or in the range of 120,000–200,000 m3. They have to be located in places with enough draught
(>10 m) and easy access and possibility to maneuver large LNG carriers to unload the cargo on to the FSU or FSRU. In case of an FSU, a regasification system needs to be built on the shore or jetty close to the FSU.
The FSU/FSRUs are built in ship yards and Wärtsilä acts as a supplier of equipment and process package. Wärtsilä can deliver the complete power system with engines, propellers and control system for the FSU/FSRU as well as the re-liquefaction and regasification processes. (Figure 15)

37in detail
WÄRTSILÄ TECHNICAL JOURNAL 02.2015
Fig. 15 - PGN FSRU Lampung, where Wärtsilä has delivered 3 regasification trains with max capacity of 360 TPH. Photo: Höegh LNG.

38 in detail
[ EN
ER
GY
/ I
N D
ET
AIL
]
[ ENERGY / IN DETAIL ]
Total solution provider:LNG terminals and liquefaction plants are complex projects when it comes to design and construction. It is important that the total concept and all aspects of the project is thought through from the beginning. Things to consider:
Location (site & marine) considerations: Location and site Onshore geophysics Seismicity and seismic hazards Metocean conditions and effect on
construction Manoeuvrability Mooring analysis Bathymetry
Design, construction and operational considerations:
Size of LNG carriers, replenishment/supply schedule, tank size
Required berth availability Operating philosophy, BOG
management Gas delivery flow rate, availability
requirement Investigations into local construction
expertise, equipment and materials
Only by doing proper pre-studies it is possible to optimize the functionality and operational cost of the plant. With the LNG process knowledge in combination with the site preparation and construction services and EPC capabilities in-house Wärtsilä can develop feasible solutions that can be backed up with firm cost estimates. With a Wärtsilä EPC and O&M the customer can get a lump-sum price with guaranteed delivery time and long term performance guarantee.
Project development & financing: Before you have the final product in place there is typically several years of project development and authority approvals needed. Wärtsilä has over 15 years of experience with project development. Wärtsilä has a team of experienced project developers all over the world with full access to its project execution and technical support organisation. This team has the
required knowledge of LNG business environment and available solutions in order to evaluate and make projects happen. Wärtsilä can help our customers arrange financing and with a track record of projects always delivered on time and in budget the banks have one less risk to worry about. Wärtsilä may also invest own equity in selected projects.
Project execution: The core of Wärtsilä has always been our EPC capabilities. Wärtsilä has a unique track record in the EPC business with almost all projects done in time and with lost time injuries rate of less than 1 (<1 accidents/million working hours). LNG projects are always assigned to dedicated project teams that have undergone the necessary training to take on the special requirements of LNG projects. Safety and risk management are of essence in LNG projects. Therefore series of prudent risk analyses are conducted during the project to ensure a safe system. With a lump-sum EPC, Wärtsilä can give guarantees on final price, construction time and plant performance, elements of investment having importance when obtaining financing, and especially for non-recourse debt financing.
Modularised solutions: By high level of modularisation and reusing proven solutions, Wärtsilä can shorten the construction time and guarantee high quality. To fully utilize these benefits, it is important that Wärtsilä can work closely together with the customer. By collaborating from early conceptual phase, Wärtsilä can create a more cost effective solution and quicker project completion than what is achievable through a traditional FEED (Front End Engineering & Design) + ITT (invitation to tendering) process. The client can in some cases save up to 2-5% of the total cost and generate revenue 8-12 months earlier by avoiding the FEED + ITT process. It is important to involve the construction and operation personnel in the design and project planning. Wärtsilä has always had a close co-operation between our designers, constructors and operators as they all belong to the same organisation.
Lifecycle support: Wärtsilä’s service agreements cover nearly 19 GW of generating capacity in both marine and land based installations – more than 450 installations. The key persons are Wärtsilä’s own experts, with additional well trained labour hired based on needs. Wärtsilä can provide full maintenance agreements of LNG terminals and liquefaction plants. This service covers maintenance planning, parts logistics, manpower coordination and maintenance reporting. In order to perform maintenance efficiently and reliably, we ensure that required manpower and spare parts are available for planned maintenance.
Typical scope of supply for a maintenance agreement is:
Online remote operations support Maintenance management & planning Technical evaluation Operational data analysis Technical support Spare parts for planned maintenance Manpower for planned maintenance Inventory management Safety stock & onsite tools Capital spare parts
SummaryCombining the LNG process know-how and proprietary liquefaction and regasification technologies with project development, EPC and lifecycle support, Wärtsilä is now in a unique position to help our customers develop, build and operate complete LNG infrastructure solutions and even including the gas power plant. All of this can be backed-up with a price, delivery and performance guarantee. That is what being the total LNG solution provider means! (Figure 16)

39in detail
WÄRTSILÄ TECHNICAL JOURNAL 02.2015
Fig. 16 - Providing complete solutions both for LNG terminals and gas power plants.
Project Development &
Financing
Equipment & Engineering
LNG Terminal
Gas Power Plant
EPC Operation & Maintenance

40 in detail
[ MARINE / IN DETAIL ]
[ MA
RIN
E /
IN
DE
TA
IL ]
Creating Optimal LNG Storage SolutionsAUTHOR: Sören Karlsson, Busine s s D evelopment Mana ger, Wär t si lä Mar ine S olu t ions
mail : soren . kar ls son@war t si la .c om
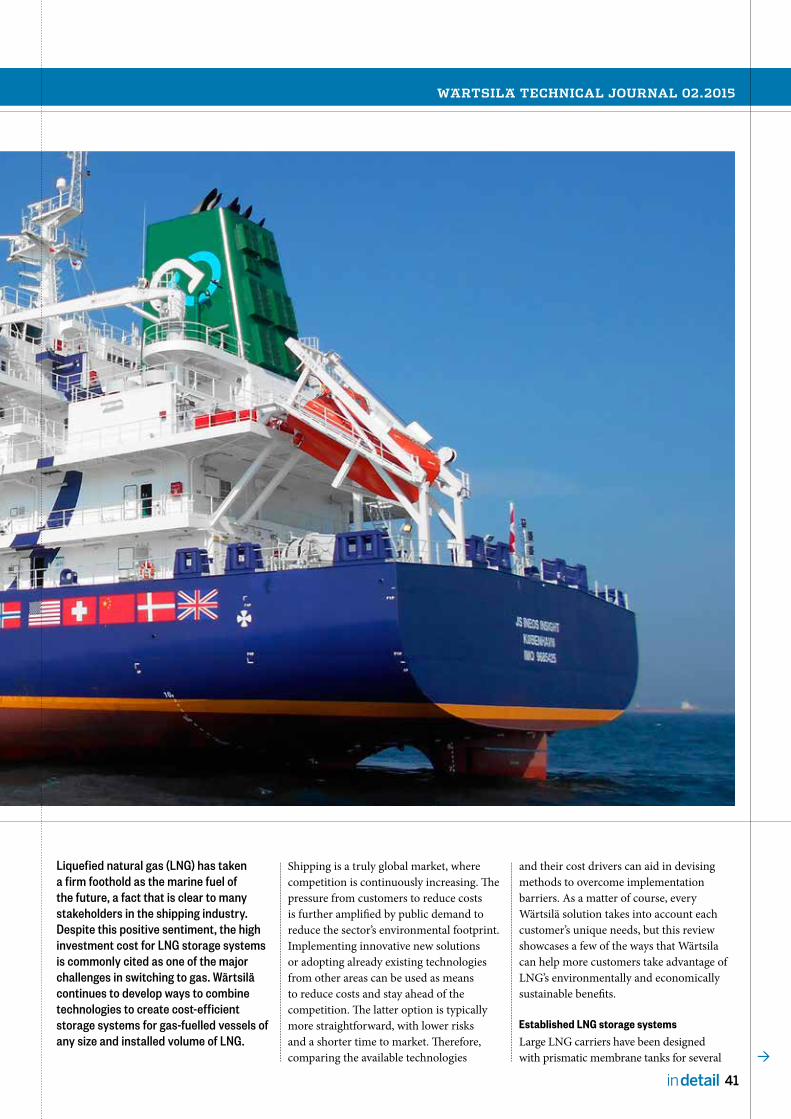
WÄRTSILÄ TECHNICAL JOURNAL 02.2015
41in detail
Liquefied natural gas (LNG) has taken a firm foothold as the marine fuel of the future, a fact that is clear to many stakeholders in the shipping industry. Despite this positive sentiment, the high investment cost for LNG storage systems is commonly cited as one of the major challenges in switching to gas. Wärtsilä continues to develop ways to combine technologies to create cost-efficient storage systems for gas-fuelled vessels of any size and installed volume of LNG.
Shipping is a truly global market, where competition is continuously increasing. The pressure from customers to reduce costs is further amplified by public demand to reduce the sector’s environmental footprint. Implementing innovative new solutions or adopting already existing technologies from other areas can be used as means to reduce costs and stay ahead of the competition. The latter option is typically more straightforward, with lower risks and a shorter time to market. Therefore, comparing the available technologies
and their cost drivers can aid in devising methods to overcome implementation barriers. As a matter of course, every Wärtsilä solution takes into account each customer’s unique needs, but this review showcases a few of the ways that Wärtsila can help more customers take advantage of LNG’s environmentally and economically sustainable benefits.
Established LNG storage systemsLarge LNG carriers have been designed with prismatic membrane tanks for several

42 in detail
[ MARINE / IN DETAIL ]
[ MA
RIN
E /
IN
DE
TA
IL ]
decades. Today, this design is the most popular LNG containment system for volumes over 100 000 m3. However, the high degree of sophistication required during onsite manufacturing, combined with the complex cargo handling system, has limited the success of the design as an LNG fuel tank.
At the other end of the scale, the most successful concept for gas-fuelled vessels has been vacuum insulated tanks. Vacuum insulation is the best insulation technology available, and is likely to remain so. A vacuum is maintained in the annular space between the two inner and outer tanks in order to reduce the convective heat transfer. In addition, the annular space is filled with an absorptive material to reduce the heat transfer due to radiation. With very low boil-off rates, the tank pressure can be easily maintained below the opening pressure of the safety valves for very small storage volumes. Therefore, vacuum insulated tanks will continue to be the preferred alternative for small LNG storage tanks below 240 m3.
The standard storage system for transporting various liquid hydrocarbons at low temperatures for several decades has been the IGC Code Type-C austenitic steel pressure vessels. The insulation was initially applied using polystyrene panels glued to the outer surface of the pressure
vessel. Today, polyurethane foam (PUR) sprayed directly on the surface is the leading insulation method, as it reduces the labour cost during the assembly of the panels on the outer surface. Foam spraying creates a homogenous surface without boundary layers or sources for subsurface crack initiation and propagation mechanisms. Additionally, the lower heat conductivity of the PUR insulation allows a slightly better holding time with the same insulation thickness. A common misconception is that insulation is fragile and sensitive and cannot be used without a steel canopy for weather protection. In reality, the insulation is covered by an outer fire resistant cladding, which creates a hard outer surface.
New developments in LNG tank insulationMany believe that PUR insulated tanks require large additional installation space. However, an insulation thickness of 300−350 mm is normally sufficient. Vacuum insulated LNG storage tanks are normally fitted with 250−300 mm annular space, despite the lower thermal conductivity. The actual constraint comes from the need to install the interconnecting pipes in the annular space, rather than from insulation requirements. In installations where fast LNG bunkering time is a necessity, the
large bunkering pipes may result in an even bigger annular space.
Since the pipes laid in the annular space are almost impossible to inspect and can only be repaired by cutting through the outer tank, the pipe design undergoes vigorous engineering activity, including pipe stress and fatigue analysis, using finite element modelling (FEM). Since the inner tank is suspended in the outer tank, the movement and interaction of the inner tank with the outer tank is taken as boundary conditions for FEM calculations. In a similar way, the local stresses are analysed for both the inner and outer tank, where the forces from the piping impact the tank design.
Hence, a high degree of competence is required in each discipline, with numerous engineering hours before the design is completed. The design is then submitted to the nominated classification society for approval. Once the approval has been received, the long lead items, such as steel plates and castings, can be ordered. The high degree of technical sophistication inevitably increases the amount of engineering hours and, consequently, costs.
A vacuum insulated tank is, in principle, two pressure vessels, where one pressure vessel is installed inside the other, and a vacuum is applied in the annular space.
Fig. 1 - Tank pressure as a function of LNG (Methane) temperature. At atmospheric pressure, an increase of temperature with 9°C raises tank pressure with only 1bar, but at the end 2°C increase has the same affect.
8
6
10
0-160-165 -125 -120-135-145 -130-140-150-155
2
4
Pre
ssur
e (b
ar(g
)) &
ΔT
(°C
)
Temperature (°C)
ΔT for 1 bar pressure increase

WÄRTSILÄ TECHNICAL JOURNAL 02.2015
43in detail
The inner tank is designed to withstand the internal pressure plus an additional 1 bar of pressure for the vacuum in the annular space. The outer tank only needs to withstand the suction force from the vacuum, or the buckling force. For a cylinder, internal vacuum is more challenging to withstand than internal pressure. Therefore, the outer tank plate thickness is similar to the inner tank plate thickness. Eliminating the outer tank and applying PUR insulation can reduce the LNG storage system weight by approximately 40%, compared to a vacuum insulated tank design.
Similarly, the saddles for a single shell tank are simpler in design and can even be incorporated in the ship’s hull. It is possible because the saddles cannot come into contact with cryogenic LNG in any damage
scenario, thus avoiding becoming brittle. Consequently, the saddles can be made of carbon steel instead of stainless steel. This straightforward single shell mechanical construction reduces the engineering effort, saving large amounts of material. These cost savings can be directly transferred to the end user, reducing the overall cost of the LNG storage system.
Lower LNG tank pressure, longer holding timeAs heat leaks into the tank, LNG evaporates and slowly increases the tank pressure. The classification society requirement for a minimum holding time of 15 days regulates the minimum insulation requirements for an LNG storage tank. Figure 1 shows the equilibrium curve between vapour and liquid phase of methane from atmospheric pressure up to 10 bar(g). For single shell
tanks, gas feed pressure to the consumers can be achieved with deep well pumps, described later in this article. The pressure and temperature in the tank can, therefore, be kept at the original LNG bunkering temperature. A pressure increase from atmospheric pressure to five bar would require an LNG temperature rise of 27°C. However, for medium-speed engines, sufficient engine feed gas pressure is typically achieved by pressurising the LNG tank to the engine operating pressure of approximately 5 bar(g), by means of evaporating a small quantity of LNG and feeding the gas back to the tank. The starting point for the pressure increase is thus the operating pressure of 5 bar(g). Due to the exponential nature of the equilibrium curve, the liquid at higher pressures absorbs much less heat. A pressure
The various systems are fully integrated to achieve maximum efficiencies. Complete propulsion plant delivered by Wärtsilä including CPP, 2 x 6L50DF, twin-in single out gearbox, 2 x 6L20DF auxiliary gensets.

44 in detail
[ MARINE / IN DETAIL ]
[ MA
RIN
E /
IN
DE
TA
IL ]
increase from 5 bar(g) to the maximum allowed pressure (10 bar(g)) results only in a net temperature increase of 12,5°C, in other words, approximately only half the amount of energy that can be absorbed in the upper pressure range. Thus, the lower pressure range is the most critical and partly compensates for the lower insulation properties of PUR insulated tanks.
The regulations for gas-fuelled vessels also allow gas consumption by engines and boilers, as a means to handle the boil-off gas (BOG) generated. The consumers of the BOG have to be available at all times; thus, power for the propulsion system cannot be considered as a gas consumer. However, electricity for the hotel load, generated by dual-fuel auxiliary engines or a generator connected to a main engine power take-off
(PTO), may be added, provided that gas can be extracted directly from the LNG tank’s gas phase. Extracting the BOG from the gas phase will reduce tank pressure and consequently increase the holding time.
Here, the advantages of using Type-C tanks are evident. As the tanks are designed as pressure vessels, the BOG, therefore, can be easily fed directly to the auxiliary engines without the need for compressors.
A rectangular or prismatic tank is optimal with respect to space utilisation, but it cannot easily withstand internal pressure without adding stiffeners, etc., which add considerable weight and manufacturing effort. Therefore, a BOG re-liquefaction system has to be installed in order to control the tank pressure. The re-liquefaction system substantially
increases the investment costs and reduces the system’s feasibility as a storage system for gas-fuelled vessels. However, for LNG carriers, the economy of scale reduces the auxiliary system cost per cubic metre stored, making prismatic tanks competitive above 10,000 m3. Several new designs and concepts are on the drawing board, and the first contracts have been awarded for small-scale LNG carriers.
A safer, more reliable LNG pump Medium-speed, gas-burning engines have been the favoured option for gas-fuelled vessels for almost two decades. Today, as the concept of operating on natural gas has matured, large 2-stroke engines are available on the market. Both the sizes of the vessels and of the prime movers, as well as the LNG
By engineering and supplying the complete cargo plant, the gas fuel supply system and the propulsion plant enables Wärtsilä to achieve optimal energy consumption efficiency for the entire vessel.
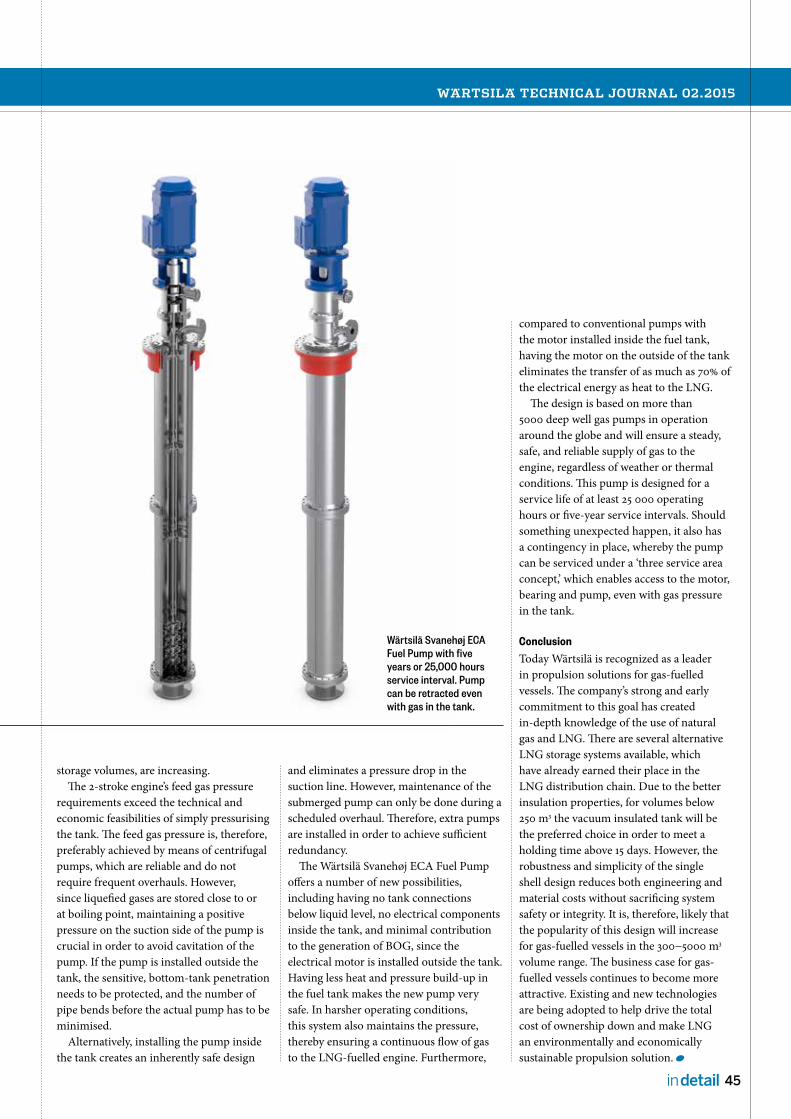
WÄRTSILÄ TECHNICAL JOURNAL 02.2015
45in detail
storage volumes, are increasing.The 2-stroke engine’s feed gas pressure
requirements exceed the technical and economic feasibilities of simply pressurising the tank. The feed gas pressure is, therefore, preferably achieved by means of centrifugal pumps, which are reliable and do not require frequent overhauls. However, since liquefied gases are stored close to or at boiling point, maintaining a positive pressure on the suction side of the pump is crucial in order to avoid cavitation of the pump. If the pump is installed outside the tank, the sensitive, bottom-tank penetration needs to be protected, and the number of pipe bends before the actual pump has to be minimised.
Alternatively, installing the pump inside the tank creates an inherently safe design
and eliminates a pressure drop in the suction line. However, maintenance of the submerged pump can only be done during a scheduled overhaul. Therefore, extra pumps are installed in order to achieve sufficient redundancy.
The Wärtsilä Svanehøj ECA Fuel Pump offers a number of new possibilities, including having no tank connections below liquid level, no electrical components inside the tank, and minimal contribution to the generation of BOG, since the electrical motor is installed outside the tank. Having less heat and pressure build-up in the fuel tank makes the new pump very safe. In harsher operating conditions, this system also maintains the pressure, thereby ensuring a continuous flow of gas to the LNG-fuelled engine. Furthermore,
Wärtsilä Svanehøj ECA Fuel Pump with five years or 25,000 hours service interval. Pump can be retracted even with gas in the tank.
compared to conventional pumps with the motor installed inside the fuel tank, having the motor on the outside of the tank eliminates the transfer of as much as 70% of the electrical energy as heat to the LNG.
The design is based on more than 5000 deep well gas pumps in operation around the globe and will ensure a steady, safe, and reliable supply of gas to the engine, regardless of weather or thermal conditions. This pump is designed for a service life of at least 25 000 operating hours or five-year service intervals. Should something unexpected happen, it also has a contingency in place, whereby the pump can be serviced under a ‘three service area concept,’ which enables access to the motor, bearing and pump, even with gas pressure in the tank.
ConclusionToday Wärtsilä is recognized as a leader in propulsion solutions for gas-fuelled vessels. The company’s strong and early commitment to this goal has created in-depth knowledge of the use of natural gas and LNG. There are several alternative LNG storage systems available, which have already earned their place in the LNG distribution chain. Due to the better insulation properties, for volumes below 250 m3 the vacuum insulated tank will be the preferred choice in order to meet a holding time above 15 days. However, the robustness and simplicity of the single shell design reduces both engineering and material costs without sacrificing system safety or integrity. It is, therefore, likely that the popularity of this design will increase for gas-fuelled vessels in the 300−5000 m3 volume range. The business case for gas-fuelled vessels continues to become more attractive. Existing and new technologies are being adopted to help drive the total cost of ownership down and make LNG an environmentally and economically sustainable propulsion solution.

46 in detail
[ MARINE / IN DETAIL ]
[ MA
RIN
E /
IN
DE
TA
IL ]
Engine offerings for the new Wärtsilä AHTS (Anchor Handling Tug Supply) vessels ensure economy and adaptability.
The main design criteria for the propulsion system of the new WSD 46-Series from Wärtsilä Ship Design were: high but flexible power for versatile vessel operation combined with market-leading fuel consumption.
One enabler of these characteristics is the Wärtsilä two-speed reduction gear for use with medium-speed engines. Another point to the very source of fuel efficiency – engine power.
According to their 150, 180 and the
220 ton bollard pull (tbp) capacities, the WSD 46-Series anchor handlers feature mechanical/electric hybrid propulsion and onboard electrical power systems based on 8-cylinder Wärtsilä 31 in V-configuration, 6-cylinder version of Wärtsilä 32 and Wärtsilä 26 diesel engines. The engines burn distillate fuel and are arranged in pairs of main and auxiliary engines with equal cylinder counts. Via motor/generators on the PTI/PTO shafts of the two-speed gears, the generator sets can provide propulsion
New innovative AHTS vessel design
Offshore performance permutationsAUTHOR: Nico Höglund, Mana ger, A ppl ic at ions D evelopment s , Wär t si lä Mar ine S olu t ions
mail : nic o. hog lund@war t si la .c om

WÄRTSILÄ TECHNICAL JOURNAL 02.2015
47in detail
power boost, or power can be generated from the main engines when the anchor handlers are steaming between destinations. In the boost mode, the vessels attain, on a hybrid mechanical-electric basis, the same flexibility as a “father-and-son” mechanical twin main engine propulsion system.
The idea was to design propulsion systems for the WSD 46-Series that are both modular and scalable.
Taking scalable first, this means that whichever of the three nominal bollard pull ratings the vessel has, its major arrangement remains unchanged, instead the main and auxiliary engine configurations are changed. And, in terms of modularity, the system is modular in the sense that it allows several different machinery concepts, so that it could also be readily executed as either fully electric or fully mechanical drive concepts.
Illustrating the adaptability of the basic concept, the 220 tbp AHTS vessel is offered with two 8-cylinder Wärtsilä 31 state-of-the-art engines, recently also acknowledged by Guinness World Records as being the world’s most efficient 4-stroke diesel engine. On the intermediate 180 tbp size, there is a choice of 6-cylinder Wärtsilä 32 engines or 9-cylinder Wärtsilä 26 main engines. In
both cases, the auxiliary engines remain the same, i.e., 2 x 8-cylinder in-line Wärtsilä 26 on the 180 tbp and 2 x 6-cylinder in-line Wärtsilä 32 on the 220 tbp version.
Bollard pull power For the 180 tpb size, there are two variants which are capable of meeting the nominal bollard pull with a varying number of cylinders, according to the needs of the anchor handler’s operating profile.
This benefit of close adaptability to a given load profile is primarily enabled by Wärtsilä’s “tug rating” concept.
Market research shows that the maximum bollard pull mode of an AHTS vessel is around 5% of the operating profile and sometimes much less. Thus, for those customers requiring lower operating times at maximum bollard pull, we have developed the tug rating. It states that the twin main engines on the WSD 46-Series vessels can be operated at up to 10% above their normal maximum rated output for 30 minutes out of every 12 hours. On the other hand the “tug rating” can also be used as a compliment to reach an additional max-plus bollard pull for a shorter period of time, which can give the operator further peace of
mind knowing there is additional back-up power available.
A schematic of the 180 btp AHTS in its max 180 ton bollard pull mode illustrates the benefit of the tug rating option. With both the 9-cylinder in-line Wärtsilä 26 engines at 108% load, they are boosted via the PTO motor/generator on the 2-speed gear with input of around 1.9 MW to each CP propeller – i.e., with gen-sets running at 90% load while also feeding other onboard consumers.
Looking at the benefit of the tug rating option, maximum rated bollard pull is also available but, as per the tug rating specification, for a considerably shorter time. Therefore, the owner saves fuel by using an engine with fewer cylinders that can easily cope with the anchor handler’s other operating modes and saves on maintenance since, as is well known, servicing on medium-speed engines is primarily determined by the number of cylinders to be maintained.
Fuel efficiency The tug rating benefit for the smaller engines reflects the fact that operating modes other than max bollard pull represent 95% of the typical operating modes of
Bollard pull Main engine Aux engine
150 ton 2x 8L26 2x 6L26
180 ton 2x 6L32 or 2x 9L26 2x 8L26
220 ton 2x 8V31 2x 6L32
Typical hybrid mechanical-electric engine configurations and engine permutations on the WSD 46-Series anchor handler range.

48 in detail
[ MARINE / IN DETAIL ]
[ MA
RIN
E /
IN
DE
TA
IL ]
the WSD 46-Series anchor handlers. Accordingly, the engines of the vessels, and their sophisticated control systems, have been chosen and tuned to achieve optimised fuel economy in every operating mode. Assisted by the two 2-speed gear concept, this is primarily achieved by automatically maximising the time the engines consume in their most economical operating range.
Transit modeAnchor handlers consume most of their fuel in transit between harbours and offshore installations, meaning that favourable fuel efficiency with the engine at its optimal loading has the biggest impact on operating costs.
The graph of fuel consumption versus load for the Wärtsilä 31 engine shows that it is more fuel efficient than its 32 cm bore competitors under all load conditions.Building on this advantage, the propulsion control systems also include a sophisticated load sharing system designed to keep the engines in operation, at any given time, within their optimum operating ranges for fuel economy and low emissions.
The effect of maximising the engines’ time spent in economical, load operating ranges becomes clear when looking at the time spent in dynamic positioning when
engines are running at part load. The Wärtsilä 32 engine’s fuel consumption versus engine load is best in 32 cm bore class also considering part load range where anchor handlers spend most of their operating time and therefore significant fuel savings can be achieved.
Dynamic positioning The third major AHTS mode is dynamic positioning. This involves using the propulsion system to hold the vessel on a precise station, sometimes in strong winds, waves and currents, so that anchor handling and other functions can be executed close to a drilling rig or production platform.
For this function, the WSD 46-Series AHTS vessels use fore and aft tunnel thrusters powered from the generating sets. During dynamic positioning, which can be accompanied by loads from other electrical consumers such as the winches, it is important that the engines have good response to load changes since load on the thrusters varies considerably from second to second.
On the Wärtsilä 26 engines, Wärtsilä has tested and verified that they can cope with a 43% load step in two seconds, and the system is thus capable of meeting the needs of the 180 tbp vessel size in dynamic
positioning mode. Similarly, a gradual power increase from 0 to 100% load can be executed in well below 20 seconds. In addition, the Wärtsilä 26 powered generating sets also have excellent black-out recovery. This capability is designed to cover a situation where we have only one generator set in operation, and it cuts out. If this occurs, the second gen-set can be on standby and take over the load within less than 10 seconds, giving a significant additional safety benefit to the whole vessel.
Environmental friendlinessThe AHTS vessels are subject to emissions regulations, which set limits on oxides of sulphur (SOx) and oxides of nitrogen (NOx), with especially strict limits when vessels are in designated Emission Control Areas (ECAs).
These are mainly coastal waters near centres of population or areas of environmental sensitivity.
AHTS vessels usually use low sulphur distillate fuels, which mean they have no problems with SOX emissions. In terms of NOX, all Wärtsilä engines are tuned to work with our SCR aftertreatment units, and this is the form of NOx reduction we will use on the AHTS vessels to comply with IMO Tier III in ECAs. Wärtsilä engines used on the
Fuel consumption graph of the Wärtsilä 31 engine in steaming (transit) mode.
6050
Wärtsilä 31
Other maker
Other maker
100908070
SFO
C (g
/kW
h)
Engine load (% MCR)

WÄRTSILÄ TECHNICAL JOURNAL 02.2015
49in detail
AHTS applications will have IMO Tier III certificates according to requirements.
Future conditional What future holds for AHTS ships is hard to predict, but it is clear that the business environment is changing. It is becoming more and more competitive and challenging, fuel prices are much more volatile than in
the past, and emission requirements are getting progressively stricter.
These factors are drivers for greater efficiency, flexibility, and low emissions, and Wärtsilä is developing its products not only to meet these needs. The new Wärtsilä 31 with 610 kW per cylinder is a perfect solution for anchor handlers.
Where fuel efficiency, operational
flexibility, high power density, long intervals between overhauls, and high levels of safety are of paramount importance.
The aspiration is to be the best, and, with the help of efficient technologies, Wärtsilä intends to remain the most valued business partner in the market.
Tug rating operating field of the WSD 46-series AHTS vessels.
The 180 tbp AHTS variant with 9-cylinder in-line Wärtsilä 26 main engines in maximum bollard pull mode.
100%
80%
60%
0%
40% 50%30%
Bollard pull propeller curve
Rating field
Free running
100%80% 90%60% 70%
20%
40%
Engi
ne lo
ad (%
MC
R)
Engine speed (% RPM)

50 in detail
[ MARINE / IN DETAIL ]
[ MA
RIN
E /
IN
DE
TA
IL ]
Wärtsilä’s involvement in the GRIP Project provided new insights into advanced propulsion techniques – and resulted in a hit product, too.
Cutting down on ships’ fuel consumption is a big priority for the frontrunners of the marine industry. There is already an urgent need for retrofitting energy saving devices (ESDs) to existing ships – and little time to waste. With this in mind, Wärtsilä decided to participate in the GRIP Project (Green Retrofitting through Improved Propulsion) – a European collaborative research project
with a total of 11 partners from 6 countries – in order to do its part in the promotion of greener marine hi-tech.
GRIP is a three-year project with a total budget of €4.1 million, partly funded by the European Union under the 7th Framework Programme (FP7). The project was coordinated by Dutch research institute MARIN and was concluded in April 2015.
Pre Swirl Stator installed on MV Valovine
GRIP on InnovationAUTHORS: Rober t Niemotko, G eneral Mana ger, Innovat ion & Pro duc t D evelopment , Propulsion S ys tem S er vic e s
Anton Voermans, Mana ger Hydro dynamic D e sig n Eng ine er ing , Propulsion S ys tem S er vic e smail : rob er t . niemotko @war t si la .c om , mail : anton .vo ermans@war t si la .c om

WÄRTSILÄ TECHNICAL JOURNAL 02.2015
51in detail
According to Robert Niemotko, General Manager, Business & Product Development (Propulsion) at Wärtsilä, the experiences from the project were good.
“We wanted to gain knowledge for future development, especially with regard to energy saving devices. We succeeded very well in meeting this goal,” he says.
United frontThe aim of the GRIP project was to reduce fuel consumption in shipping by 5% (with reductions for individual ships up to 10%) and thus reduce exhaust-gas emissions. The first objective was to give ship owners a sound rationale for the choice of ESDs. The second key objective was to give insight into the detailed requirements of the device design, by performing an analysis of the interaction between hull and propeller and the structural integrity of the device.
Wärtsilä’s role in the project was threefold. First, the company set out to create an Early Assessment Tool, which constituted the Work Package 1 (of 8 in total) of the project.
Secondly, the influence of ESDs on neighboring flow devices (i.e., propellers) was analysed, both from hydrodynamic and mechanical points of view. Thirdly, a strong reviewing role was identified for setting up a method to design and analyse ESDs.
Taking chargeWärtsilä’s broad experience in retrofitting made it a great match for the project, says Anton Voermans, Team Leader for propeller design at Wärtsilä.
“Wärtsilä was one of the first companies contacted for this project and also participated in composing of the research program,” Voermans says. Altogether, there were a dozen companies, all with their respective areas of expertise and responsibility, involved in GRIP.
From Wärtsilä, there was a team of 5 to 10 people at a time participating in GRIP, bringing in expertise from hydrodynamic engineering, mechanical engineering and project management. Working with the Early Assessment Tool, it was clear from the beginning that it needed to be an “easy-to-use” tool for the ship owners.
“The ship owners want to find out whether it is feasible to add an energy saving device to the ship. Their key concerns deal with the acquired energy savings and the payback period for the investment,” says Voermans.
“The challenge for us was to come up with an Early Assessment Tool that would do the job quickly without compromising reliability.” In the end, that was exactly what Voermans’ team did; now the ship owners have a convenient tool that they can use in their decision-making.
Get the factsGoing into the project, the Project Consortium also had to deal with the “mystic notions” concerning the key principles of the ESDs. Robert Niemotko points out that for many devices presently available on the market, it is not clear if or how energy is saved. Therefore, the choice of an ESD for a ship owner is mainly based on trust, while it should be a matter of science, research and hard fact. Through GRIP, the most promising ESDs were studied for several ship types to document insights into flow changes, performance improvement and energy savings.
“When you understand the principles under which ESDs operate, you can design ESDs,” Voermans sums up.
Shedding new light into ESDs is a welcome change in an industry where things are sometimes kept under the radar for competitive reasons. For example,
many ships today come from Far Eastern yards that tend to keep the hull lines secret. Therefore, a ship owner cannot order an ESD without returning to the original ship yard.
Solving scalabilityStill, designing a device is one thing. You need to be able to manufacture, install and test it, too. The proof is in the pudding, and, in this instance, performing reliable tests became somewhat of an issue. In scale model testing for ships, there is always the problem that you can make smaller scale ships all day long, but you cannot make the water any “smaller” than it is.
As a consequence, some energy saving devices show great promise in model tests but fail in full-scale validations. For other devices, manufacturers claim proof of large improvements on real-size ships, but these claims cannot be verified by independent observers.
“Validation, how we can measure the benefits accurately, is always an issue in testing,” Voermans says.
Fortunately, GRIP found a candidate vessel – a bulk carrier named Valovine – that could be used for the project. The tests, performed in summer 2014, showed an energy reduction of nearly 7%.
“It was a big success,” says Niemotko, adding that, in similar projects, you often have to settle for a paper report. However, as project partner ULJ (Uljanik Brodogradiliste DD) provided the newly built bulk carrier to be used as a test subject, they got so much more out of the exercise.
Igniting innovationFurthermore, as the work carried out in GRIP proved fruitful, Wärtsilä’s own product development received an extra spark from the project as well. Utilizing
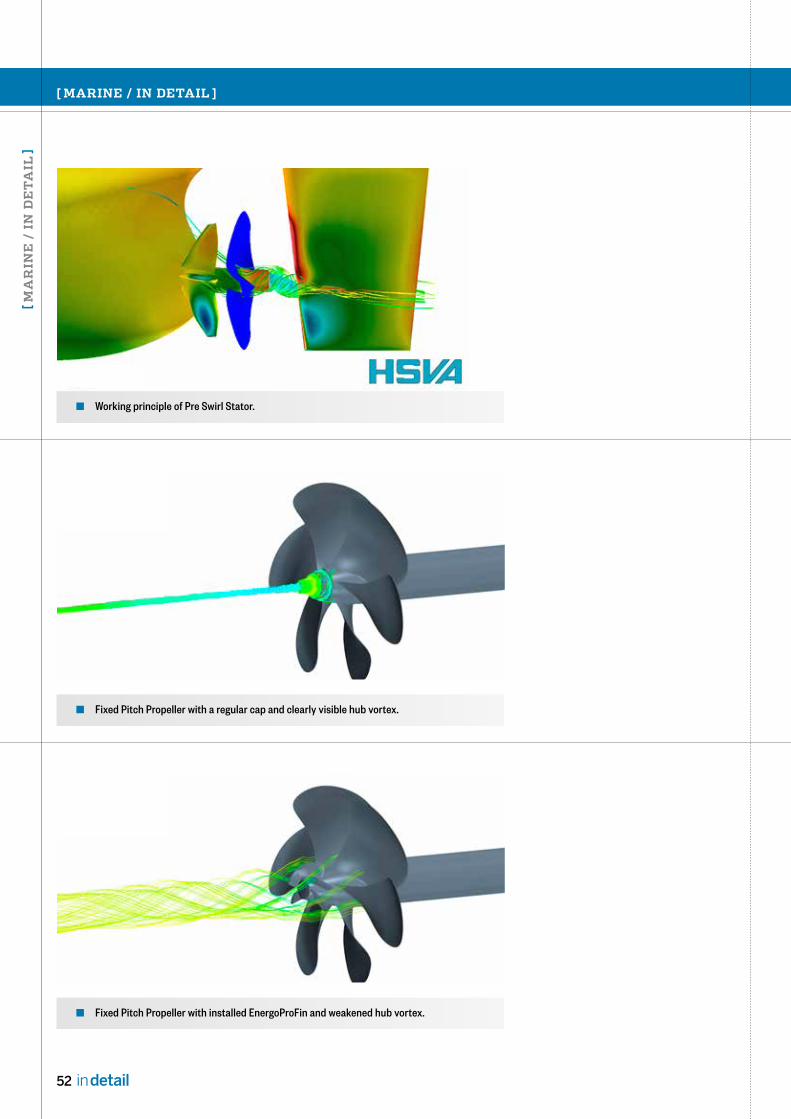
52 in detail
[ MARINE / IN DETAIL ]
[ MA
RIN
E /
IN
DE
TA
IL ]
Working principle of Pre Swirl Stator.
Fixed Pitch Propeller with installed EnergoProFin and weakened hub vortex.
Fixed Pitch Propeller with a regular cap and clearly visible hub vortex.
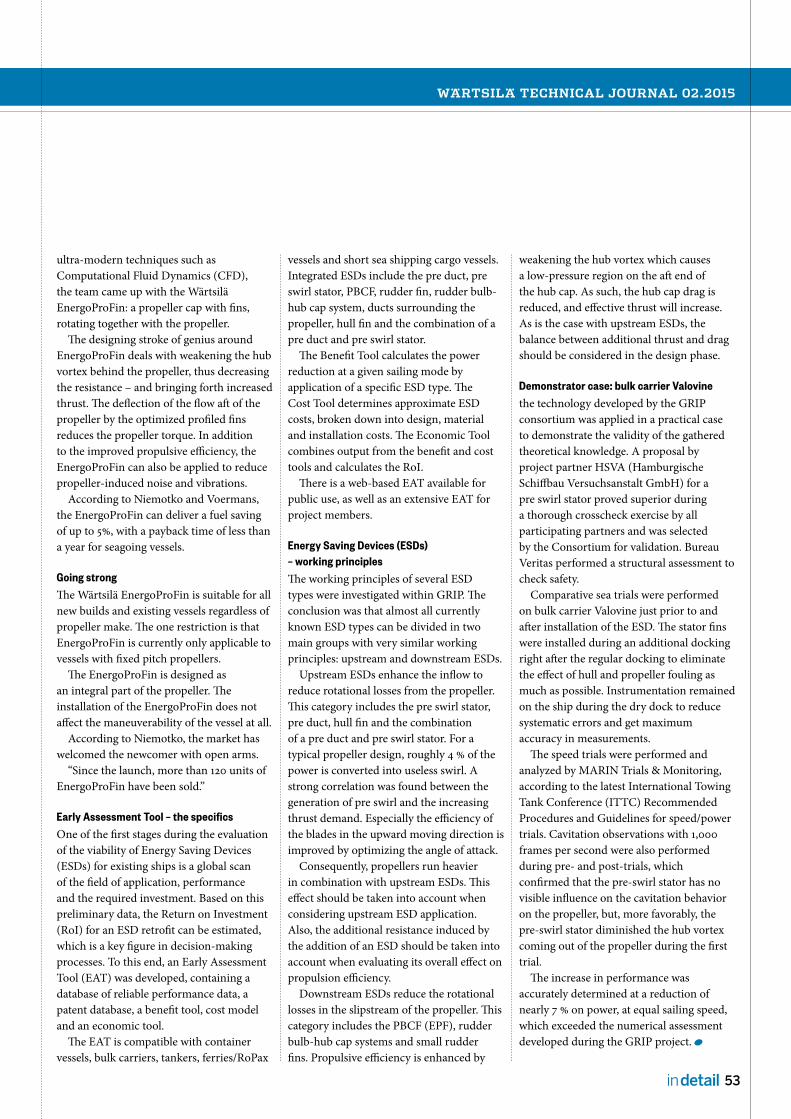
WÄRTSILÄ TECHNICAL JOURNAL 02.2015
53in detail
ultra-modern techniques such as Computational Fluid Dynamics (CFD), the team came up with the Wärtsilä EnergoProFin: a propeller cap with fins, rotating together with the propeller.
The designing stroke of genius around EnergoProFin deals with weakening the hub vortex behind the propeller, thus decreasing the resistance – and bringing forth increased thrust. The deflection of the flow aft of the propeller by the optimized profiled fins reduces the propeller torque. In addition to the improved propulsive efficiency, the EnergoProFin can also be applied to reduce propeller-induced noise and vibrations.
According to Niemotko and Voermans, the EnergoProFin can deliver a fuel saving of up to 5%, with a payback time of less than a year for seagoing vessels.
Going strongThe Wärtsilä EnergoProFin is suitable for all new builds and existing vessels regardless of propeller make. The one restriction is that EnergoProFin is currently only applicable to vessels with fixed pitch propellers.
The EnergoProFin is designed as an integral part of the propeller. The installation of the EnergoProFin does not affect the maneuverability of the vessel at all.
According to Niemotko, the market has welcomed the newcomer with open arms.
“Since the launch, more than 120 units of EnergoProFin have been sold.”
Early Assessment Tool – the specificsOne of the first stages during the evaluation of the viability of Energy Saving Devices (ESDs) for existing ships is a global scan of the field of application, performance and the required investment. Based on this preliminary data, the Return on Investment (RoI) for an ESD retrofit can be estimated, which is a key figure in decision-making processes. To this end, an Early Assessment Tool (EAT) was developed, containing a database of reliable performance data, a patent database, a benefit tool, cost model and an economic tool.
The EAT is compatible with container vessels, bulk carriers, tankers, ferries/RoPax
vessels and short sea shipping cargo vessels. Integrated ESDs include the pre duct, pre swirl stator, PBCF, rudder fin, rudder bulb-hub cap system, ducts surrounding the propeller, hull fin and the combination of a pre duct and pre swirl stator.
The Benefit Tool calculates the power reduction at a given sailing mode by application of a specific ESD type. The Cost Tool determines approximate ESD costs, broken down into design, material and installation costs. The Economic Tool combines output from the benefit and cost tools and calculates the RoI.
There is a web-based EAT available for public use, as well as an extensive EAT for project members.
Energy Saving Devices (ESDs) – working principlesThe working principles of several ESD types were investigated within GRIP. The conclusion was that almost all currently known ESD types can be divided in two main groups with very similar working principles: upstream and downstream ESDs.
Upstream ESDs enhance the inflow to reduce rotational losses from the propeller. This category includes the pre swirl stator, pre duct, hull fin and the combination of a pre duct and pre swirl stator. For a typical propeller design, roughly 4 % of the power is converted into useless swirl. A strong correlation was found between the generation of pre swirl and the increasing thrust demand. Especially the efficiency of the blades in the upward moving direction is improved by optimizing the angle of attack.
Consequently, propellers run heavier in combination with upstream ESDs. This effect should be taken into account when considering upstream ESD application. Also, the additional resistance induced by the addition of an ESD should be taken into account when evaluating its overall effect on propulsion efficiency.
Downstream ESDs reduce the rotational losses in the slipstream of the propeller. This category includes the PBCF (EPF), rudder bulb-hub cap systems and small rudder fins. Propulsive efficiency is enhanced by
weakening the hub vortex which causes a low-pressure region on the aft end of the hub cap. As such, the hub cap drag is reduced, and effective thrust will increase. As is the case with upstream ESDs, the balance between additional thrust and drag should be considered in the design phase.
Demonstrator case: bulk carrier Valovinethe technology developed by the GRIP consortium was applied in a practical case to demonstrate the validity of the gathered theoretical knowledge. A proposal by project partner HSVA (Hamburgische Schiffbau Versuchsanstalt GmbH) for a pre swirl stator proved superior during a thorough crosscheck exercise by all participating partners and was selected by the Consortium for validation. Bureau Veritas performed a structural assessment to check safety.
Comparative sea trials were performed on bulk carrier Valovine just prior to and after installation of the ESD. The stator fins were installed during an additional docking right after the regular docking to eliminate the effect of hull and propeller fouling as much as possible. Instrumentation remained on the ship during the dry dock to reduce systematic errors and get maximum accuracy in measurements.
The speed trials were performed and analyzed by MARIN Trials & Monitoring, according to the latest International Towing Tank Conference (ITTC) Recommended Procedures and Guidelines for speed/power trials. Cavitation observations with 1,000 frames per second were also performed during pre- and post-trials, which confirmed that the pre-swirl stator has no visible influence on the cavitation behavior on the propeller, but, more favorably, the pre-swirl stator diminished the hub vortex coming out of the propeller during the first trial.
The increase in performance was accurately determined at a reduction of nearly 7 % on power, at equal sailing speed, which exceeded the numerical assessment developed during the GRIP project.

54 in detail
[ MARINE / IN DETAIL ]
[ MA
RIN
E /
IN
DE
TA
IL ]
The new Wärtsilä 31 engine is developed taking all of these aspects into account to further enhance the business of its owner in regard of reduced lifecycle cost and increased uptime, reduced environmental impact in combination with increased fuel and operational flexibility and with guaranteed reliability and safe operation.
World record for most efficient engineThe Wärtsilä 31 engine has been awarded a Guinness World Records title as the world’s most efficient 4-stroke diesel engine. Guinness World Records is a universally
The marine sector continues to have challenging time with sluggish demand on the dry cargo sector, when again the off-shore sector is suffering from the low crude oil prices when at the same time there is a need to comply with increasingly stricter emission and fuel regulations.
In this challenging time period reduction of lifecycle cost of the investments as well as securing current and anticipated regulation fulfilment is of utmost importance. The marine business also experiences an increased interest in use of different fuels including gas or dual-fuel operation.
The Wärtsilä 31 is the first in a new generation of medium-speed engines, designed to raise the bar, in terms of efficiency and cost of ownership, fuel and operational flexibility, reliability and environmental footprint. With the launch of this new product, Wärtsilä is setting a new standard – leading the way with a 4-stroke engine that offers the best fuel economy in its class.
AUTHORS: Ulf Åstrand, Dire c tor Pro duc t D evelopment Prog rams , Wär t si lä Mar ine S olu t ions
The new Wärtsilä 31 engine

WÄRTSILÄ TECHNICAL JOURNAL 02.2015
55in detail
recognised authority on record-breaking achievements, and the listing is based on the engine’s highest-recorded fuel efficiency levels. With the Wärtsilä 31, diesel fuel consumption can run as low as 165 g/kWh – putting it significantly ahead of any other 4-stroke diesel engine currently available on the market. Its exceptional fuel efficiency is made possible through use of new technologies, such as 2-stage turbocharging, a high-pressure fuel injection system and adjustable valve actuation, in combination with the next-generation engine control system.
By utilising the new technologies and optimising the engine parameters, efficiency is improved for all areas related to combustion, as well as thermal, mechanical (including friction and pump losses), and gas exchange efficiency.
Application areasThe Wärtsilä 31 can be used both as a main propulsion engine and in diesel electric configurations, or as an auxiliary engine, and it can be optimised for running either at constant speed, along a propeller curve or with constant torque. It is available in 8 to 16 cylinder configurattions and has a power output ranging from 4.2 to 9.8 MW, at 720 and 750 rpm.
Designed to serve a wide selection of vessel types, the Wärtsilä 31’s application areas include Offshore, Cruise & Ferry, and other marine segments. The engine comes in three alternative versions: diesel, dual-fuel (DF) and spark-ignited gas (SG). The multi-fuel capabilities that the Wärtsilä 31 brings to the market extend the possibilities for operators to utilise different qualities of fuels, from very light low sulphur
fuel to very heavy diesel, and a range of different qualities of gas. Furthermore, the Wärtsilä 31 complies with the upcoming IMO Tier 3 regulations when operating on gas or, alternatively, on diesel coupled with a Selective Catalytic Converter (SCR), without resulting in any increase in fuel consumption.
This ground breaking new engine marks the first time that an engine platform has been developed concurrently for all its fuel variants. While previous engines were typically developed to run on diesel and subsequently adapted for gas, they were never fully optimised for the gas or dual-fuel modes. In contrast, the Wärtsilä 31 delivers maximum fuel efficiency and performance across all its fuel variants.
New generation common rail fuel systemThe unrivalled level of fuel efficiency and operating flexibility achieved by the Wärtsilä 31 is the result of a number of factors. The new-generation, common rail fuel injection system, developed specially for the Wärtsilä 31. The diesel and DF engines both use the exact same fuel injection system with multiple injection capability, thereby facilitating future conversion needs, as no separate pilot fuel needs to be added.
Aside from improved combustion and, therefore, higher efficiency, the benefits of the flexible common rail system include smokeless operation on all loads, as well as reduced particle emissions. The flexibility of the fuel injection result in improved performance – especially for low loads. This is key because many modern applications operate on far lower loads these days. The Wärtsilä 31 can operate on low sulphur fuels, marine diesel oil and HFO, without any
restrictions on low load operation, while the DF engine can switch instantly between the different fuel modes independently of the fuel that is utilised.
Second-generation, two-stage turbocharging systemAnother key technology is the two-stage turbocharging system. The Wärtsilä 31 utilises the second-generation, two-stage system with a pressure ratio capability above 10 bar and turbocharger efficiency of more than 75%. This improves upon the typical efficiency level of around 65-70% for a single-stage turbocharger. By enabling earlier inlet valve closing, resulting in a lower combustion temperature, the increased pressure ratio capability enables increased engine output, as well improving fuel economy.
The 2-stage concept also offers benefits in terms of operational flexibility, because the reduced inertia of the high-speed turbocharger improves loading performance and load acceptance from low loads. Furthermore, the second-generation, two-stage system has been optimised for minimum downtime through the incorporation of an extractable cartridge concept that facilitates turbocharger overhaul without touching any engine connections.
Adjustable valve actuationIn order to make optimal use of the common rail fuel system and 2-stage turbocharging system, adjustable valve actuation is required. Due to flexible valve actuation, the correct air-fuel ratio is ensured at all engine-operating conditions (in both steady state and transient

56 in detail
[ MARINE / IN DETAIL ]
[ MA
RIN
E /
IN
DE
TA
IL ]
Facts about Wärtsilä 31• The most fuel-efficient engine on the
market, delivering the lowest level of fuel consumption of any four-stroke engine worldwide
• Fuel flexibility through three different products in one engine platform: diesel, gas and dual-fuel
• Higher uptime, as well as reduced maintenance costs up to 20 per cent, due to longer component lifetime and reduced maintenance operations
• An engine automation system combined with flexibility of the technologies enabling easy adaptation for different operating profiles – leading to outstanding operational flexibility
• Modular design makes service and repairs easier, thus reducing downtime and making the engine “future proof”
• Reliability guaranteed through extensive validation and Wärtsilä’s vast field experience of diesel, gas and dual-fuel engines

WÄRTSILÄ TECHNICAL JOURNAL 02.2015
57in detail
operation). Meanwhile, control of the inlet valve closure can be set individually on each cylinder – a feature that also can be used to improve cylinder balancing.
In addition, the uptime and availability of the engine is enhanced further due to the fact that the new hydraulic valve actuation does not require periodic adjustment of inlet and exhaust valve clearance. On current engines, this has to be carried out at 1000-hour intervals, as the valve actuation is mechanically controlled.
Environmental footprintThe Wärtsilä 31 engine is optimised to comply with all current and anticipated IMO and EPA (United States Environmental
Protection Agency) emission legislations. In gas operation, it complies with IMO Tier 3 and EPA Tier 3 without any need for after-treatment. While the diesel engine requires a SCR after the engine, it does not cause any losses in terms of fuel consumption.
This increased efficiency results in a reduced greenhouse effect, by lowering CO2 emissions, as well as the lower total hydrocarbon (THC) emissions of the gas engine, by up to 50%. The overall operational benefits also include smokeless operation and reduced particle emissions.
Operating flexibilityRegarding operational flexibility, the Wärtsilä 31 maintains outstanding
performance across its complete operating range. This optimal operating performance is the result of the unique way in which the advanced UNIC engine control system has been combined with state-of-the-art technologies. A similar improvement in fuel consumption is achieved in both low-load running and high load operation. Meanwhile, fast starting and load transient response are improved as a result of the flexibility of the fuel injection and air-fuel ratio control, along with the benefits of the 2-stage turbocharging system.
Reliability & serviceabilityWith the Wärtsilä 31, maintenance operations and frequencies have been drastically
Fuel systemdiesel
Fuel systemgas
Diesel Dual-Fuel Spark-Ignited gas
Fuel flexibility with modular design.

58 in detail
[ MARINE / IN DETAIL ]
[ MA
RIN
E /
IN
DE
TA
IL ]
reduced, resulting in significantly improved uptime. The first major overhaul is scheduled at 32,000 hours or 5 years of operations when operating on LFO or gas. While most engines of a similar output require their first maintenance interval after about 2000 operating hours, the Wärtsilä 31 has extended this by a factor of four – to 8000 hours.
When it comes to the all-important question of reliability, the Wärtsilä 31 has been verified and guaranteed through extensive calculations and simulations, utilizing Wärtsilä´s vast field experience of diesel, gas and dual-fuel engines. Rig testing was used for all newly introduced technologies and for the validation of the
three laboratory engines and currently more than 30,000 hours have been accumulated altogether on rigs and laboratory engines.
Reliability has also been ensured through the minimisation of maintenance operations. For instance, valve clearance has been eliminated, and new service concepts using exchange units are introduced. One such example is the powerpack unit, which consists of a connecting rod, piston, cylinder liner and cylinder head with related pipes combined in one exchange unit, as opposed to the traditional single spare part concept. Maintenance intervals have also been extended. All this combines to ensure high reliability and fewer maintenance
operations, resulting in significantly reduced service costs and increased uptime.
Modular design and future-proof engineThe key factor facilitating the increased uptime of the Wärtsilä 31 is its new modular design. The modular design also makes it possible to carry out fast, efficient engine conversions, as the diesel, DF and SG engine uses the same technologies and components. Furthermore, the standardised component interfaces allow engines to be converted to run on different fuels, without requiring any machining. Modular design does not only facilitate quick repairs, but it also supports future upgrades. Going forward, ship

WÄRTSILÄ TECHNICAL JOURNAL 02.2015
59in detail
STEPLESS VIC – a step towards greatness
As Vincent Van Gogh said, “Great things are done by a series of small things brought together,” and the Wärtsilä 31 is a perfect example of that. It took several new technologies in combination to achieve the engine’s record-breaking fuel efficiency. One of those key technologies, Stepless VIC (Variable Inlet valve Closing), received the Technology & Innovation Award 2015 for its important contribution to Wärtsilä 31’s greatness.
The team behind Stepless VIC, Sören Höstman, Saku Niinikangas, Johan Renvall and Magnus Sundsten, combined several small technical elements to create this technology. The long, iterative process began when Saku Niinikangas invented the basic idea for VIC, a new way of making variable valve timing. However, the team had to create and test many variations and add new innovations before all the technical issues were solved.
Over 50 different ideas were tested on a VIC rig in Vaskiluoto, Finland before VIC became an actual product. At the time, there were only two possible timings, on or off. The first engine equipped with VIC, a Wärtsilä 32, left the factory in 2008. Soon VIC became a standard solution on all Wärtsilä 32 engines.
From good to greatDespite their progress, the team did not quit there. In fast hydraulic systems, pressure pulses are a problem because it is essential to get the same hydraulic pressure in the system in order to get the same behavior, regardless of the engine speed or cylinder configuration. Therefore, the next step in developing the VIC technology further was to try to find a way to achieve consistent pressure.
The idea for Stepless VIC was born at a hydraulic fair in Tampere, where the team heard about the latest in solenoid technology. They learned that they could improve the current VIC product and make the inlet valve closing fully variable, if they put a solenoid valve in parallel with the current solution.
After this discovery, the team made prototypes using this concept, but many more thousands of hours of rig testing and many redesigns of the product still were required before the final product was born. Now Stepless VIC is a standard solution on all Wärtsilä 31 engines and is one of the seemingly small things that enables the Wärtsila 31 engine to achieve its great fuel efficiency.
owners will be able to install the latest, state-of-the-art technologies simply by replacing the module containing the upgrade. This will be particularly useful when new emission standards are introduced, but it also may apply to future fuel types. In a world in which it is impossible to predict what new technologies and regulations the future might hold, this is an engine that can be relied on for many years to come – either in its current or upgraded form. This is why the Wärtsilä 31 has become known as the ‘future-proof ’ engine.
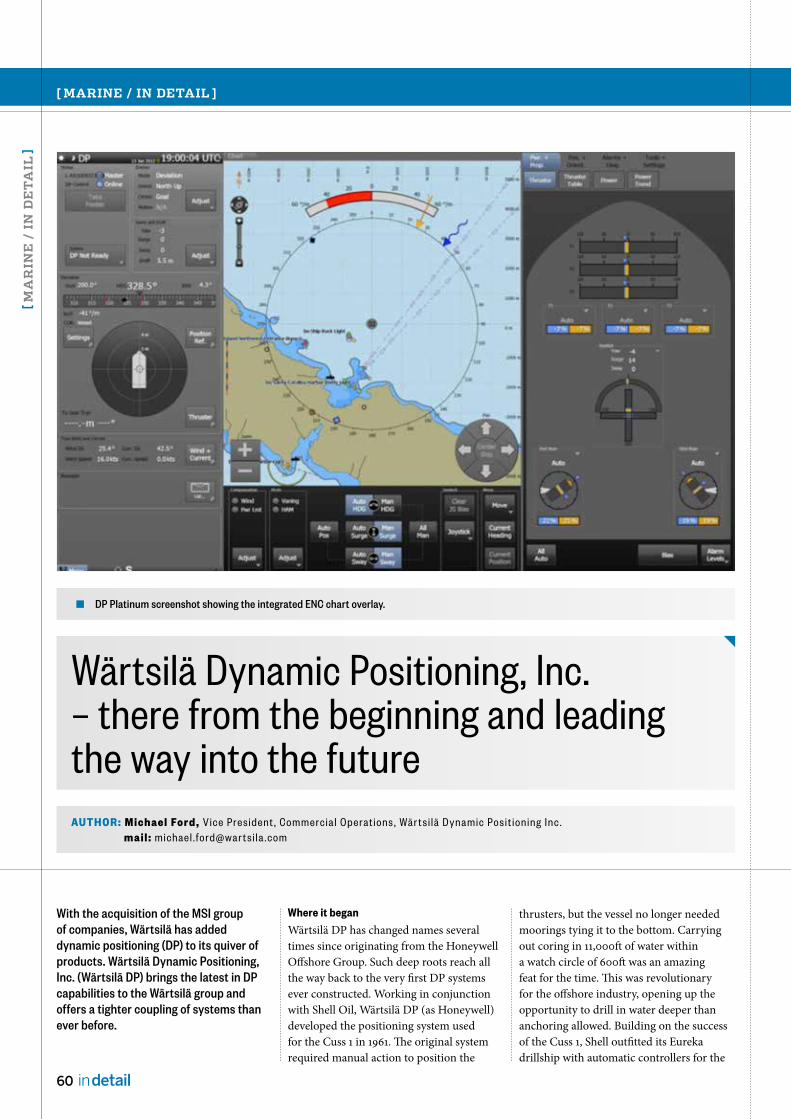
60 in detail
[ MARINE / IN DETAIL ]
[ MA
RIN
E /
IN
DE
TA
IL ]
Where it beganWärtsilä DP has changed names several times since originating from the Honeywell Offshore Group. Such deep roots reach all the way back to the very first DP systems ever constructed. Working in conjunction with Shell Oil, Wärtsilä DP (as Honeywell) developed the positioning system used for the Cuss 1 in 1961. The original system required manual action to position the
thrusters, but the vessel no longer needed moorings tying it to the bottom. Carrying out coring in 11,000ft of water within a watch circle of 600ft was an amazing feat for the time. This was revolutionary for the offshore industry, opening up the opportunity to drill in water deeper than anchoring allowed. Building on the success of the Cuss 1, Shell outfitted its Eureka drillship with automatic controllers for the
With the acquisition of the MSI group of companies, Wärtsilä has added dynamic positioning (DP) to its quiver of products. Wärtsilä Dynamic Positioning, Inc. (Wärtsilä DP) brings the latest in DP capabilities to the Wärtsilä group and offers a tighter coupling of systems than ever before.
Wärtsilä Dynamic Positioning, Inc. – there from the beginning and leading the way into the futureAUTHOR: Michael Ford, Vic e Pre sident , C ommercia l O p erat ions , Wär t si lä D ynamic Po si t ioning Inc .
mail : michael . ford@war t si la .c om
DP Platinum screenshot showing the integrated ENC chart overlay.

WÄRTSILÄ TECHNICAL JOURNAL 02.2015
61in detail
Table 1 - DP classes.
Class 0 No redundancy or backup.
Loss of position can occur after a single failure.
Class 1 Backup coordinated controller.
Loss of position can occur after a single failure.
Class 2 Loss of position should not occur in the event of a single fault
in any active component or system EXCEPT due to loss of a compartment to fire or flood.
Class 3 Loss of position should not occur in the event of a single fault in
any active component or system INCLUDING due to loss of a compartment to fire or flood.
Fig. 1 - A typical DP Class 1 system.
thrusters. This would come to be known as the first automatic station keeping (ASK) system— a true dynamic positioning system.
Through the years, many notable projects were completed, including the first ASK system for a cable-laying vessel in 1968 for the M/V Naubuc, the first operational ASK system for exploratory drilling on the SEDCO 445 in 1970, the redundant ASK system onboard the Hughes Glomar Explorer from 1970-1972, the first ASK system with integrated power management onboard Discoverer 534 in 1972, the first ASK on a diver support vessel onboard the Arctic Surveyor in 1973 and the first ASK system onboard a semi-submersible for exploratory drilling on the SEDCO 709. Wärtsilä DP has lead the development of dynamic positioning from the beginning.
Product EvolutionThe first systems were simple analogue control systems and even used manual controls for the thruster positioning. Computer processors were evolving at the same time and provided expanded options for improving control under DP. The first system used simple control boards, which evolved into the long-standing VME form factor. With the explosion of personal computers through the 1980’s and into the 1990’s, processing power became not only less expensive but smaller. Similarly, the heavy and limited video displays were replaced with more modern cathode ray tube color displays to take advantage of the latest programming graphics. The user interfaces (UI) shifted from simple dots on an oscilloscope to intuitive touchscreens with high definition graphics. Performance improved, but more importantly, so did safety and efficiency. Wärtsilä DP undertook a yearlong development process in 2010 to completely update the user interface. Starting from the basic principles of DP and the most common tasks, we engaged our engineers, DP operators and owners to design a new way to interact with the DP system. Similar to smart phones, which have become constant companions, the

62 in detail
[ MARINE / IN DETAIL ]
[ MA
RIN
E /
IN
DE
TA
IL ]
UI now pulls the operator in and provides direct feedback. Touching the screen to activate commands gives the operator direct confirmation of the actions and keeps the user’s focus on the screen to view the vessel response. Instead of looking down to push a button and then back up for confirmation, the operator stays engaged with the system. Only the most pertinent data is immediately in front of the operator to prevent information overload and increase the chances for good decision-making. Our innovative bullseye provides immediate and intuitive feedback to the operator regarding the vessel’s position. All of the detailed data is available as required, but it is strategically placed where DP operators expect to find it. This UI redesign has lead the industry and pushed virtually all of our competitors to begin the challenging step to catch up to our lead. Combined with the latest LED displays and reliable computer processors, our systems offer high-end performance for our customers. Each system uses the same “building blocks” to allow expansion to meet customer requirements. Operator workstations utilize touchscreen LED displays, a marine rated CPU, trackball and a three axis joystick to
allow complete system control. The signal processor connects the system to the rest of the ship using analogue and digital I/O for the thruster/engine/generator connections and serial data channels for the reference sensor interfaces. Required reference sensors round out the equipment including DGPS, Relative Range and Bearing systems, hydroacoustic systems, gyrocompasses, wind sensors and motion reference units to provide the DP system with a “view” of the outside world. A typical Class 1 system is shown above (Figure 1) noting the sensors and interfaces. Class designation is based on the redundancy of the system (see Table 1) with higher classes having increased tolerance for failures.
Specialist capabilitiesWärtsilä DP has always been at the forefront of developing new technologies. Whether it was a “drillship,” known as the Glomar Explorer, destined to appear in the history books for clandestine operations or evolving multiple modes into “EcoDP,” focused not only on reducing machinery wear but also conserving valuable fuel. As vessels have developed new capabilities, DP systems have been pushed to support those operations.
Many times this has resulted in pioneering new control modes and true algorithm development. For example, the Glomar Explorer was built under “Project Azorian” for the specific goal of recovering a sunken Soviet submarine. One of the critical capabilities was the dynamic positioning system, which enabled the vessel to remain in position over the wreck site.
Not all modes carry such historical significance, but they provide real world capabilities that allow for expanded windows of operation in more challenging environments. With the rapid increase in wind turbine technology came a call for offshore wind farms. The very environment that made sites preferable for wind also created challenges for the vessels installing the systems. Utilizing the same creative knowledge that has evolved with the company, Wärtsilä DP developed the successful Jack-up compensation mode. This mode leads the industry for wind farm installation vessels by allowing DP operations in challenging conditions that most DP systems cannot handle, due to the complexity of moving legs and touchdowns. Jack-up vessels are extremely challenging to operate without DP, but with Jack-up
HGO Innovation wind farm installation vessel. Illustration Courtesy of HGO InfraSea Solutions.

WÄRTSILÄ TECHNICAL JOURNAL 02.2015
63in detail
compensation mode, difficult conditions often are handled.
Participating in an industry focused on oil and gas means we, too, must be responsible to the environment. While other companies raced ahead with lack-luster “conservation modes” that offered little more than reduced performance, Wärtsilä DP put the resources forward to develop a true, environmentally friendly mode that does not compromise the performance of the system. EcoDP provides reduced wear on the machinery while reducing fuel consumption.
Wärtsilä DP continues to develop new modes, based on customer needs and trends we see in the industry, and to lead the way forward.
Product FutureJust as the consumer electronics market adopts new technology and drives forward, we continually investigate opportunities for improved performance and safety. While the industry is just beginning to talk about remote control or unmanned ships, Wärtsilä DP has been providing wireless controls for years. We pioneered control beyond line of sight and continue to perfect the technology as communication systems increase their
bandwidth capability. This stands to evolve even faster as the new satellite arrays come online over the next several years and offer substantially higher bandwidth capability.
We are continually looking at options to bring data to the operator more efficiently and safely. As trends move towards simply larger displays, we have already moved on to heads up displays (HUDs). These may form the wave of the future by putting vital data right on the bridge windows to keep the operator both engaged with the system and looking outside at the real world.
We are already investigating the opportunities for tighter coupling of other ship systems vital to DP. What if each thruster could tell the DP exactly how much thrust it could produce based on the status of its bearings, temperature or other parameters? Combining both intelligence and function integration will lead the way towards smarter vessels that are safer and more environmentally friendly. The DP system is the “brain” of the vessel relying on the “muscles” (thrusters) of the system and the “eyes and ears” (reference sensors) to provide control. The tighter the connection between these systems the better the system can perform.
DP Platinum demo console.
Market potentialWith the industry currently down, there are still opportunities and potential for technology gains. Right now we are investing in improved configuration tools and expanded modes. We are developing the next generation of Class 3 systems for the expanding deepwater market, including drilling, construction, and specialty systems. Though the average age of the deep water drilling fleet is low (~10year), this only comprises a portion of the total drilling fleet. When the shallow water fleet and jackup fleets are considered, the age increases dramatically. Add to this the number of rigs being scrapped due to the economic situation, and the market is ripe for an upturn. In addition, many of the lower producing wells are again being shut down due to the low oil prices. This creates a need for decommissioning vessels, which virtually demands DP for every build. For the wells that are not being shut down, the more marginal wells that can be connected via subsea, the fewer personnel required in the field, thereby saving operators vital funds in a slow market. This again drives demand for construction vessels, capable of working in deeper and deeper water, that demand complex integrated DP systems. Last, the specialty market continues to grow especially in the renewables segment. Wind farms are continuing to grow, and new forms, such as tidal energy, are beginning to emerge. These circumstances are driving a demand for the most capable DP vessels yet to operate in extreme currents as high as 10 knots. Wärtsilä DP already has systems operating at these speeds and higher for custom applications, which positions us well for market growth.
Whether a simple joystick system for an OSV, a custom DP within the integrated bridge system of a yacht or cruise ship or a highly complex integrated Class 3 control system for a next generation drilling rig, Wärtsilä DP can provide a solution to meet the customer’s needs.

64 in detail
[ FU
TU
RE
/ I
N D
ET
AIL
]
[ FUTURE / IN DETAIL ]
As many competencies are developed better through doing, more universities now offer project-based, or experiential learning programmes. One can learn a theory or general skill from a textbook or lecture, but, when actually applying the concept in the “real world,” the nuances become apparent. There are finer points that one cannot pick up simply by reading, and often they are among the most important aspects to know. Real-life, industry-led projects give students opportunities to observe and understand what is happening, refine and increase their knowledge, and then practice and test their skills. In addition to helping students become more confident in their field, experiential learning motivates students to take on new challenges and drives
Visionary collaborationAUTHOR: Anna Aistrich PHOTO: Karl Vilhjálmsson
In partnership with Aalto University, Wärtsilä plays a key role in helping mould the next generation of product developers.
Aalto students (left to right) Jukka Kemppainen, Saga Santala, Shweta Nair and Romil Desai were part of an 11-member team developing a functional, technological solution alongside their Wärtsila mentor, Ilari Parkkinen (rear).

65
WÄRTSILÄ TECHNICAL JOURNAL 02.2015
in detail
sees the importance of working through this experiential process. “At the beginning of the project, I tell the student team that I don’t want to see a single technological solution during the first two months. I do it to highlight the distinction of an end-user or customer focus: first finding out the real customer/end-user needs and then building solutions based on those findings. It can be surprisingly hard in the beginning because we are used to moving ahead with technological solutions without first thinking about what the customer/end-user might actually need.”
Drive11, the 11-member international (9 from Finland and 2 from India) team partnered with Parkkinen, wanted to create a solution to help streamline the process of constructing power plants. It took 8.5 months of work via weekly Skype meetings between Finland and India to design and build a prototype of a task management and seamless communications system. The final product, an application called Taskar, was designed to simplify the power plant assembly process so that multilingual team members could complete the work without having to follow written instructions from a manual, which may not be available in their own language. Although Taskar is the functional end result of the collaboration, the most valuable product was the expertise the team members gained through the process.
Project Manager Saga Santala, an Industrial Design student, felt that the collaboration helped everyone recognize his/her own limitations and learn how to be a better team player. With a multicultural team of different personalities and genders working across three continents, Santala experienced just how critical teamwork and open communication are to good cooperation. For example, when part of the team did a site visit to a power plant in Cabo Verde, they had to work hard to find ways to transfer the knowledge they gained to team members who were not present.
For Romil Desai, in Industrial Design, getting input from people in the field was essential to creating a useful product. Workers suggested additions that improved the functionality of the app, and they thought of applied uses that the Drive11 team had not considered before.
Jukka Kemppainen, a Mechanical Engineering student, explained how the team members had to learn new skills to be
able to complete their project. They also had to ask questions to find out which pieces were still needed and then find out from whom or where they could get the required information, materials or skills.
Interestingly, Taskar employs many of the same learning elements that the students themselves received from their collaboration with Parkkinen. When trying to learn how to do something new, experts suggest breaking the task down into smaller components, mastering them one at a time and then adding them all together. Visual learning is also a great way to speed up the process, which is why people search YouTube for instructional videos on almost every topic and then follow the steps modeled in the video. Finally, to achieve mastery, the learner needs the ability to evaluate the outcome. Since it is difficult for someone just learning to do it alone, he or she needs someone else, like a mentor or coach, to judge whether and how well the desired result was achieved. As psychologist and author Daniel Kahneman explains, “The acquisition of skills requires a regular environment, an adequate opportunity to practice, and rapid and unequivocal feedback about the correctness of thoughts and actions.”
Taskar incorporates all three steps. Using a tablet enabled with Augmented Reality, a plant assembly worker receives step-by-step instructions for tasks downloaded from Microsoft Project. By overlaying directions on the live image of a structure, assembly instructions are easier to understand because the worker sees exactly which parts and tools are needed, where the parts go and how the work is progressing in real-time. As the task proceeds, required approvals from a supervisor are requested and can be given remotely through Taskar. In addition to getting feedback on all critical steps, a worker using Taskar can move on to the next step more quickly than if waiting for a supervisor to be available onsite physically. By improving work efficiency and accuracy through this hands-on instruction, Taskar could help Wärtsilä save time and resources.
Although the learning process was aimed mainly at the students, Parkkinen and Wärtsilä also gained wisdom from the partnership. “The students challenge our normal way of working with their enthusiasm and out-of-the-box, fresh ideas for addressing customer needs. It’s crucial to be able adapt our solutions whenever the customer needs change.”
them to find solutions to problems that are presented to them. This is why hands-on learning – from apprenticeships to vocational work experience – has been a key element of trade learning for centuries.
For the fourth time, Wärtsilä partnered with teams of engineering, industrial design and business students in the Product Development Project (PdP) course at Aalto University in Helsinki. The PdP enables these students to put their academic knowledge into practice in a product design challenge to benefit their industry partners in “bring[ing] new ideas, technologies or business plans to life.”
Ilari Parkkinen, the Wärtsilä employee mentor paired with a group of students,


![four7. 02 Twenty 2007 - Crasmantwentyfour7.studio.crasman.fi/pub/web/pdf/magazine... · issue no. 02 Twenty 2007 four7. WÄRTSILÄ TECHNICAL JOURNAL [ ] Cooling Indian offi ces Business](https://static.fdocuments.in/doc/165x107/5a70ec177f8b9abb538c67be/four7-02-twenty-2007-crasmantwentyfour7studiocrasmanfipubwebpdfmagazinepdf.jpg)