WAC Minutes November 4, 2016 WAC - mwra.state.ma.us · WAC Minutes November 4, 2016 ... glaciers...
13
WAC Minutes November 4, 2016 The Wastewater Advisory Committee to the MWRA met with the Water Supply Citizens Advisory Committee at the Waterworks Museum Attendees/Contributors: WAC: Taber Keally (chair), Mary Adelstein, Craig Allen, Wayne Chouinard, Stephen Greene, Dan Winograd BOTH WAC/WSCAC: Adrianna Cillo, James Guiod (Advisory Board), Martin Pillsbury (MAPC), WSCAC: Janet Rothrock, Paul Lauenstein, Whitney Beals (chair), Jerry Eves, Bill Fadden, Kurt Tramposch Guests: Sean Navin, Katie Ronan, Wendy Leo (MWRA), Julie Wood (CRWA), Renata von Tscharner (CRC), Bill Copithorne (Town of Arlington), Lise Marx (MWRA), Julie Wormser (Boston Harbor Now!), David Vallee (National Weather Service), John Reinhart (MyRWA), Nathan Philips, Lou Taverna (Chair, MWRA Advisory Board), Jonathan Yeo (DCR) Staff: Andreae Downs (WAC), Lexi Dewey (WSCAC) FUTURE MEETING DATES/TOPICS NEXT: Friday, Dec. 2, 10:30am: Stormwater/Green Infrastructure Planning, BWSC at the MassDEP Offices One Winter St., Boston, Second Floor, Conference Room A (note change in location) VOTES: October 2016 minutes approved EXECUTIVE DIRECTOR’S REPORT: The Outfall Monitoring Science Advisory Panel and related Public Interest Advisory Committee are both looking for members to ask new questions about the Harbor/Bay and the outfall. Contact Andreae with suggestions or questions: [email protected] MWRA UPDATES: On Deer Island—the valve and pump replacement for the 10 giant pumps in the North Main Pump Station continues—but can be done without shutting down the entire North system— instead, engineers are able to isolate flow to one side or another in dry weather. This week they finished one pump/valve.
Transcript of WAC Minutes November 4, 2016 WAC - mwra.state.ma.us · WAC Minutes November 4, 2016 ... glaciers...

WAC
Minutes
November 4, 2016
The Wastewater Advisory Committee to the MWRA met with the Water Supply Citizens
Advisory Committee at the Waterworks Museum
Attendees/Contributors:
WAC: Taber Keally (chair), Mary Adelstein, Craig Allen, Wayne Chouinard, Stephen Greene,
Dan Winograd
BOTH WAC/WSCAC: Adrianna Cillo, James Guiod (Advisory Board), Martin Pillsbury
(MAPC),
WSCAC: Janet Rothrock, Paul Lauenstein, Whitney Beals (chair), Jerry Eves, Bill Fadden, Kurt
Tramposch
Guests: Sean Navin, Katie Ronan, Wendy Leo (MWRA), Julie Wood (CRWA), Renata von
Tscharner (CRC), Bill Copithorne (Town of Arlington), Lise Marx (MWRA), Julie Wormser
(Boston Harbor Now!), David Vallee (National Weather Service), John Reinhart (MyRWA),
Nathan Philips, Lou Taverna (Chair, MWRA Advisory Board), Jonathan Yeo (DCR)
Staff: Andreae Downs (WAC), Lexi Dewey (WSCAC)
FUTURE MEETING DATES/TOPICS
NEXT: Friday, Dec. 2, 10:30am: Stormwater/Green Infrastructure Planning, BWSC at the
MassDEP Offices One Winter St., Boston, Second Floor, Conference Room A (note change in
location)
VOTES:
October 2016 minutes approved
EXECUTIVE DIRECTOR’S REPORT:
The Outfall Monitoring Science Advisory Panel and related Public Interest Advisory Committee
are both looking for members to ask new questions about the Harbor/Bay and the outfall. Contact
Andreae with suggestions or questions: [email protected]
MWRA UPDATES:
On Deer Island—the valve and pump replacement for the 10 giant pumps in the North Main
Pump Station continues—but can be done without shutting down the entire North system—
instead, engineers are able to isolate flow to one side or another in dry weather. This week they
finished one pump/valve.

Cross Harbor Cable—Eversource is occasionally cutting power to DI through the cable while
they determine how deep it lies in the harbor. This will happen occasionally through the fall and
may shut down during December and perhaps during the summer. The plant can run on back-up
power during these outages.
ADVISORY BOARD UPDATES: Water and sewer retail rate survey should be out early
December. Also, Dec. 8, the metropolitan tunnel redundancy discussion for water supply is
scheduled for 9 am at Boston College.
PRESENTATIONS & DISCUSSION:
Julie Wormser, Boston Harbor Now! Climate Change and its impacts on Boston
Superstorm Sandy was the wakeup call around what water can do to a city. But the storm
affected Boston differently than New York. So, what are Boston’s design challenges with sea
level rise?
Coastal flooding arises from three causes:
1. storm surges—eastern wind—at low barometric pressure—when water can go higher.
2. Wicked high tides—when sun & moon align
3. Sea level rise
Like a baby in a bathtub—the higher the underlying water is during calm periods, the more likely
you are to get flooding during storms.
Boston is protected by islands and peninsulas to seaward (Cape Cod, Cape Anne, etc.), and the
harbor being circular. New York has much less protection.
Boston tops out at 6’ of storm surge. Below is the King Tide—when the moon is close to earth
and is full. This is with no storm—calm, when the sea is about 2 ½ feet above normal high tide.
At King Tide, we have water coming up through the storm drains.

Looking at high tides plus storm surge—you can see that Sandy hit at high tide in New York, 16’
storm tide, or 10’ above high tide.
Boston saw a 4-5-foot storm surge, but it hit at low tide. But our tide cycle is much higher than
New York’s. Boston’s is about 10’ normally. We only care about storm surges that hit at high
tide.
But adding sea level rise
complicates the issue:
These numbers are about 3’
higher than when we first
started modeling. That’s
because we now know how to
model with glacial melt. We
also didn’t know that the
glaciers exert gravitational pull.
So, when those melt, we will
see relatively higher sea level,
because Greenland’s glaciers
are so much smaller than
Antarctica’s.
We care because 1/3 of Boston floods tidally at 7.5’. Most of those areas are fill. Here’s the
design challenge: How do we keep our city viable as our coastline recedes?
The 1% flood map used to determine insurance rates today by 2050 could represent those areas
flooded annually or by King Tides, and daily by 2100.
That floods the Innovation District, Bayside Expo, Fort Point Channel, Charlestown Navy Yard,
Dock Square. We simply can’t live with that level of corrosive salt water. So, we are due for a
third wave of major engineering—to keep this from happening.
Boston has been taking this seriously, even without a crisis to help make the change more
possible. What needs to happen is to institutionalize all the work that has happened—so all the
new development is climate prepared.
We are also getting more heat—by mid-
century we may look like DC, by the end
of the century, we may look like
Birmingham:
Back to sea level rise—what do we do?
Dutch say: first, build a barrier to keep
water out daily.
When that fails, need floodable transition
zones where water can go without harm.
When that fails, we need to be able to
batten down
When that fails, you must move uphill or
upstairs.
Living with water—how can we live with water where it won’t do harm? Elevate resources that
can’t flood & create areas water can go without harm. Because this will be expensive, solve other
problems as you are dealing with flood control—transportation, affordable housing, great social
space.
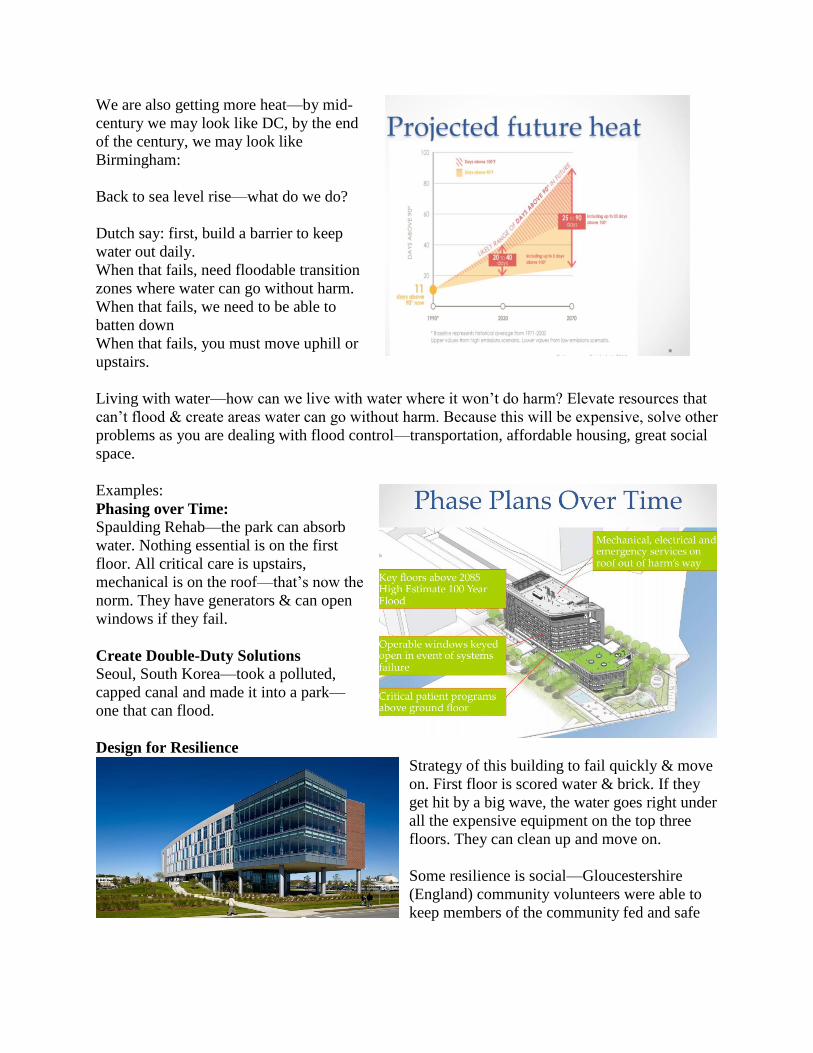
Examples:
Phasing over Time:
Spaulding Rehab—the park can absorb
water. Nothing essential is on the first
floor. All critical care is upstairs,
mechanical is on the roof—that’s now the
norm. They have generators & can open
windows if they fail.
Create Double-Duty Solutions Seoul, South Korea—took a polluted,
capped canal and made it into a park—
one that can flood.
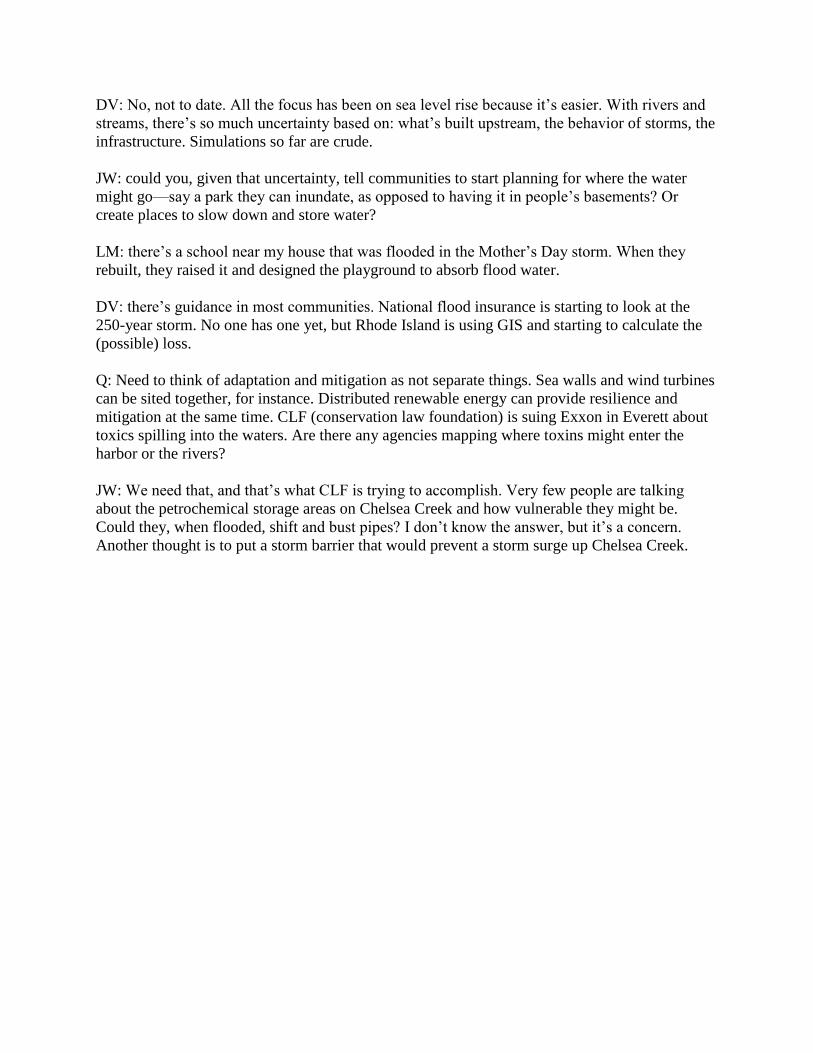
Design for Resilience Strategy of this building to fail quickly & move
on. First floor is scored water & brick. If they
get hit by a big wave, the water goes right under
all the expensive equipment on the top three
floors. They can clean up and move on.
Some resilience is social—Gloucestershire
(England) community volunteers were able to
keep members of the community fed and safe

when they saw intense flooding. They have now made the system permanent and extended it to
isolated people of color.
Finally—can’t be voluntary. We must make sure that this is part of the zoning code so all our
buildings can survive.
Dutch example—making room for the river – they paid farmers to move, cut a channel, built new
housing, and dropped the channel, so there’s room for a storm.
David Vallee, National Weather Service, Climate and River Flood Behavior
We can see that the climate is changing,
but how does it look in New England so
far—and going forward?
Some of what we have done in New
England has made the consequences of
climate change worse.
In my office, we model river behavior
(after a storm). We are struggling to
model the current behaviors—now have
more vicious, urban spikes. Dramatic
increases in rainfall frequency and
flooding.
In addition, the whole behavior of
drought has changed in New England.
What we are seeing: a blocked-up jet stream. Storms are coming up the East Coast, or down
from Canada—both pick up tropical moisture as they come toward us. The jet stream is getting
curvier—that means we are seeing many more occurrences of two kinds of storms:
1. Large systems that stay in place over many days & dumping rain on us (Mother’s Day
storm)
2. Storms that follow one another (March 2010 or the 2015 snow storms)
This won’t happen every year. But the trend is increased frequency—and the issue is that it
saturates the soils. What happens then is flooding.
Also—higher temperatures mean that the atmosphere holds more moisture. So, each occurrence
is likely to be worse.
Our forecast accuracy has increased significantly out to 2 weeks. Beyond 3-4 weeks extending to
seasonal forecasts the Northeast is extremely challenging. The major drivers of our storm tracks
such as the Blocking over Greenland (phase of the North American Oscillation--its phase
determines if we have blocking over Greenland or not.) or the Western Pacific Pattern (the phase
of the Pacific-North American Oscillation--it determines if there is a strong ridge of high

pressure just off upper West Coast.) change about every 4 to 6 weeks and they interact with each
other. Forecasting these phases and their changes in phase remains at the very limit of our
predictability today.
So why is this important? Big shifts in precipitation frequency is messing with how we’ve
designed our infrastructure. Thus, we are seeing more flooding, especially in our smaller
watersheds. Why the smaller ones?
1. Typically, don’t have flood control
2. With increased urbanization over the last 30-40 years, we’ve taken away the capacity of
the land to slow the water heading towards the rivers.
Temperature trends in MA: we are getting warmer—climbing at a rate of a degree Fahrenheit
every 35 years. We are losing latitude on the planet. Our climate in Boston today is more like
New Jersey was.
We are also losing sustained cold periods. Even the polar vortex year—2015—was still warmer
than the old annual average of the 1930s. That influences precipitation.
Precipitation trends in MA: climbing about an
inch every 10 years. We haven’t built for this.
Frequency of wet years has increased over the
last 2 decades. And the frequency of events has
increased. On top of this, the heaviest rains have
both become more frequent, and heavier—we
are getting 12-15 heavy rain events a year, when
we used to get 6-8. So, all over New York and
New England we are seeing more blockbuster
rain events.
Drought: Yes, we have a drought now. But look
at the trends in the Palmer Drought Index:
Droughts are much less long-lasting as well as rarer. We
are calling this a flash drought. It didn’t happen gradually—
it’s like the faucet was just turned off. And this year it started
right as the growing season was beginning—in June. This
hurts our agriculture. But this is the trend.
Compare this year’s drought to the 60s. Our streams get as
low as they did in the 60s, but they come back more quickly,
and in fact can flood more easily.
Notice also in the 1960s, we had continued low rainfall and
little recharge.

We are getting a few heavy storms that give us recharge, although can get into drought quicker.
How does that impact water supply? In big systems, they have designed for drought & have
storage. But in smaller reservoirs or systems that draw from wells, you are going to feel those
droughts.
Back to the wet side—we design our stormwater and conduit size for the 100-year flood, or what
you can expect 1 percent of the time. But the 100-year flood numbers have shifted. We designed
for 6-7” of rain (in 24 hours), and are receiving 8-9” over a large part of MA.
In coastal communities, you have two problems—they didn’t design for this kind of storm, plus
sea level rise. Peabody in the news much?
That means changes in flood frequency & magnitude, compounded by more impervious surface
(urbanization), compounded by climate.
Graphs of Southern New England river gauge data—pre-1970 and more recently. Flooding
increasing everywhere except the Neponset. Why? In that watershed, they’ve added greenspace
and places to store stormwater—and they’ve worked, even in the face of climate change.
There are things out there that can help.
Time of year changes—prior to 1970, flooded after the snow melts—March. And tropical
systems coming up the coast in late summer.
Now—look at the change. Everything is neutered. We get intense floods in late spring as well as
late winter. More precipitation in late February, early March in liquid form—but before
vegetation has come up to help take some of the moisture out of the system. That’s what caught
us in 2010—all that rain in mid-February, early March.
We are also seeing more intensity of flooding—looking at Merrimac and Connecticut rivers. The
Army Corps projects have helped cut the crests, but as you go down river, by Hartford & further
down, there’s nowhere for the water to go.
So—New England is a hot spot for heavy flooding. Combination of climate change and what
we’ve done to the place. We designed without knowing we might see a 1-2” shift. And we are
getting flash droughts--but larger systems can weather these changes.

What do we do?
Can we protect valuable infrastructure?
Can we adapt to increased rainfall—
through green technology, buying
properties in the floodplain for a
natural buffer?
Or do we retreat? There’s a point of
diminishing return.
On rivers, there are compartments of
opportunity—our communities are
built up along rivers. Some
communities have adapted in a smart
way—make the first two floors along a
river parking, so you can speed dial & get the cars out before the flood. And get the mechanicals
up away from the water.
Lise Marx, MWRA & Our Eastern Massachusetts Facilities
I am talking about adaptation in this presentation, although MWRA is also taking measures to
mitigate climate change & that is included in the slides.
MWRA looks at what we might expect, works to mitigate the impacts and to be resilient.
MWRA is fortunate in that Deer Island and Nut Island were designed to withstand almost 2 feet
of sea level rise.
For our other facilities, MWRA’s approach is to be pragmatic—and not to lose opportunities.
When we upgrade our facilities, we are always looking at updated information.
The current bench line to plan towards is the recently revised FEMA100-year flood elevation,
plus 2.5 feet of sea level rise. When we chose this, we thought that gave us until about 2070. But
we are continually looking at our facilities, and make modifications as new information comes
in.

The blue line
here is the first-floor
elevation.
Yellow is the 100-
year (1% FEMA)
flood.
Red is 100-year
flood with 2.5’ sea
level.
Green reflects the
SLOSH model
results for a
Category 1
Hurricane and
reflects a worst-case
scenario of wind,
tide level and angle
of approach.
Then we did some analysis. Something just above the red line you might want to plan for.
You can see on the right—where we have a generator—this is just one example of why we care
and why it’s a problem.
MWRA’s goals are to protect staff,
protect our facilities, and continue to
provide service to our customers. In the
event facilities, cannot continue
operations, we want to be able to
recover as soon as possible.
Adaption: Short-term measures including things
like temporary flood barriers, moving
equipment up off the floor, and
temporarily moving our emergency
operation center and equipment inland
during storms.
Long-term—continue to monitor the science. Looking to put that knowledge into designs for
planned rehabilitation of facilities.

Alewife Brook Pump Station
As we do these adaptations, we are also
looking at mitigating our effects on the
climate.
PANEL DISCUSSION:
Q: Given David Vallee’s flood projections,
is it the case that only the sewer facilities
are at risk as the climate changes?
Marx: Focus to date has been on sea level
rise. It is mostly wastewater facilities that
are located near the coast and Boston Harbor tributaries and we have also looked closely at the
Clinton WWTP along the Nashua River.
Q: Has MWRA been thinking about tidal infiltration into local sewer pipes?
LM: We have started to think about that, but communities are responsible for the local pipes.
MWRA has some CSO (combined sewer) outfalls that are tidal, and we have tide gates—our job
is to make sure they are tight and functional. Long-term, we treat what comes into our system,
and we have significant capacity during most storm events. MWRA’s I/I program also makes
significant funding available to the local communities to address local infiltration and inflow
problems.
Q: Have you done analysis of how the long-term CSO control plan might be affected?
LM: That plan is based on a typical year and was worked out with EPA and DEP. Now we are
starting the assessment phase of that plan. If there are changes over time in the area, EPA might
revisit things, but for now, we are satisfied that the plan meets the goals.
Q: In sea level calculations, besides ice melt, warmer water and decreasing gravitational pull
from the southern glaciers, is there anything else affecting sea level rise?
Wormser: We used to just look at thermal expansion—3-6 feet is just how water that is warmer
expands. More recently, also added ice melt off land masses. Ice in the water doesn’t change the
levels. Only recently did we realize that the ice masses are so large that they gravitationally draw
water toward them. Antarctica’s melt will bring us more water. Locally, there’s also the gulf
stream. If it is closer, then the ocean will rise higher near us.
Q: Sounds like will need greater investment over the next several decades. Any numbers?
JW: You can protect your structure from storm flooding, but not tidal flooding. You can’t create
a wall around your building. So we advise—design for storm flooding to a certain level. If we

don’t build a city-wide barrier above that, it’s not going to be survivable, so don’t bother.
Temporary storm barriers don’t survive wave action well. At a building level, we advise making
openings storm safe—relatively cheap. But if talking major renovations, need to consider filling
in the basement, because some of the retrofitting is so expensive. Going to need to talk about
storm safe buildings, otherwise it’s a public investment level.
Q: Who is writing the building codes to make sure developers don’t avoid doing this?
JW: Boston has done a tremendous amount of work. Have charts full of numbers as well as risk
tolerance (different risks for hospitals vs. warehouses). So your code may need to differentiate by
use. But answer is nobody has done this yet. Our advocacy has been to institutionalize this
information. Building codes are at the state level. So at the Boston level, looking at an
amendment just for Boston or zoning overlays. Also want to index those risk levels, so we don’t
have to go back every few years to update.
LM: MWRA is thinking in a similar way—at some point, adaptation becomes a broader state,
regional, New England issue and isn’t just us out there. At some point, we are at all-in.
JW: I don’t see any other agency that can tackle this. In my perfect world, MWRA would
become, drinking water, stormwater & sewer, because it has the ability to raise money.
Lou Taverna: The Advisory Board position is that stormwater is a local community issue.
JW: Every other region that has done well has a central agency that coordinates. Boston cannot
do it by itself. The water front communities cannot by themselves build a sea wall.
Q: There’s a trade-off between mitigation & adaptation. Sweden has set its mitigation even
faster. Commend MWRA for its wonderful example of how to mitigate carbon emissions. To
what extent should we emphasize mitigation over adaptation, given the high cost of adaptation?
JW: I think the reason we are at this so late is because people didn’t want to give up on the idea
of prevention. We are at the point where we also must adapt. But it must be a both/and.
Q: How much predictability can you give us—so we can get things out of the way of a flood?
Vallee: A week to 10 days for rainfall is pretty reliable. But it’s hard to know which particular
watershed. We are not at that level of specificity. But our goal is to get to up to 30 days at a more
granular level. Rainfall is just so challenging. A Nor’easter particularly hits the Merrimack
Valley, because the water hits upstream, and just as it gets down the river, the rain hits there. I’ll
tell you this—I thought we had a wet season coming (this year). But it never happened. Coming
off the February 2016 flood, we realized we were wrong. I want to do better than that. What
would you be looking for? Probability of a particular flow?
Q: I’d like to know, as part of the planning, what kind of, almost, fire drill we need to prepare
for—who to evacuate and how far. When you have a lot of uncertainty, hard to prepare.

DV: We are trying to get to the point where we can do that 7 days out. Sometimes we are just
giving governors a warning that they have flooding coming this side of biblical.
Q: The 100-year storm event in 24 hours that we designed for. I’m a city engineer. When I first
started, we were using 6.2” (stormwater pipe diameters). A few years later, raised to 7.0” and
faced developer outrage. Now, considering your information, are we looking at 8.3”? Is it only
going to get worse?
DV: I wish I had the answer. There is science out there showing that we will have so much
evaporation with additional heat that we will hold more water in the atmosphere, and could
plateau. But the intensity of the events may be worse. May be less frequent. The State of Maine
has mandated a higher level of stormwater readiness for all buildings and highways. But that’s
easier to do when you aren’t already in a built-out community. It comes back to cost & benefit—
and what should we be designing for.
JW: In a perfect world, our regulations would be indexed to the best science, so we would have
some predictability around building lifespan.
DV: Until you engineer yourself out of your tax base. When you retreat, you are giving back tax
base, which is a third rail. In your case—you haven’t got the room!
JW: that gets us back to the coastline. When 1/3 of Boston is tidal—is that $60b of lost tax base.
It’s that catastrophic.
DV: Versus building a barrier.
JW: but at some point, that barrier has an end. At some point, the coast is moving. And a lot of
the most expensive real estate we have will depreciate over time. So, it’s not a logistical issue,
it’s how do we shift our economy?
Q: But as you know, all regulation gets challenged. We are even arguing about climate change.
Q: Is there any predictability to what will be happening with the jet stream?
DV: at this point, no. Climate models do continue to predict that if we don’t change the amount
of carbon in the atmosphere, it may continue. But other things, like changes in the gulf stream,
carbon absorption by the ocean, warmth held in the ocean—and when does that come back out.
And we know there’s a lag time between when carbon goes up & when it comes out. But
bringing that down to rainfall, it’s impossible to predict. Much more challenging than sea level
rise.
Q: In our planning agency, doing planning work, we know what we need to do with sea level
rise. Is there modeling of the ranges of effects on the rivers, so we can tell communities, here’s
what you should be thinking about?
DV: No, not to date. All the focus has been on sea level rise because it’s easier. With rivers and
streams, there’s so much uncertainty based on: what’s built upstream, the behavior of storms, the
infrastructure. Simulations so far are crude.
JW: could you, given that uncertainty, tell communities to start planning for where the water
might go—say a park they can inundate, as opposed to having it in people’s basements? Or
create places to slow down and store water?
LM: there’s a school near my house that was flooded in the Mother’s Day storm. When they
rebuilt, they raised it and designed the playground to absorb flood water.
DV: there’s guidance in most communities. National flood insurance is starting to look at the
250-year storm. No one has one yet, but Rhode Island is using GIS and starting to calculate the
(possible) loss.
Q: Need to think of adaptation and mitigation as not separate things. Sea walls and wind turbines
can be sited together, for instance. Distributed renewable energy can provide resilience and
mitigation at the same time. CLF (conservation law foundation) is suing Exxon in Everett about
toxics spilling into the waters. Are there any agencies mapping where toxins might enter the
harbor or the rivers?
JW: We need that, and that’s what CLF is trying to accomplish. Very few people are talking
about the petrochemical storage areas on Chelsea Creek and how vulnerable they might be.
Could they, when flooded, shift and bust pipes? I don’t know the answer, but it’s a concern.
Another thought is to put a storm barrier that would prevent a storm surge up Chelsea Creek.