W P S (DEPR): 06 / 2014 RBI WORKING PAPER SERIES · · 2014-06-24I. Introduction Employment has...
22
W P S (DEPR): 06 / 2014 RBI WORKING PAPER SERIES Estimating Employment Elasticity of Growth for the Indian Economy Sangita Misra and Anoop K Suresh DEPARTMENT OF ECONOMIC AND POLICY RESEARCH JUNE 2014
Transcript of W P S (DEPR): 06 / 2014 RBI WORKING PAPER SERIES · · 2014-06-24I. Introduction Employment has...
W P S (DEPR): 06 / 2014
RBI WORKING PAPER SERIES
Estimating Employment Elasticity
of Growth for the Indian Economy
Sangita Misra
and
Anoop K Suresh
DEPARTMENT OF ECONOMIC AND POLICY RESEARCH
JUNE 2014
1
Estimating Employment Elasticity of Growth for the Indian Economy
Sangita Misra and Anoop K Suresh1
Abstract
This paper provides updated estimates on employment elasticity - both aggregate as well as sector specific - using a variety of approaches. The aggregate employment elasticity estimates for India have declined over the decades and vary from 0.18 (arc elasticity) to 0.20 (point elasticity) during the post reform period. Sector-wise, while agriculture has witnessed negative elasticity, services including construction have generally been employment intensive. Manufacturing employment elasticity has hovered around 0.3. Within manufacturing, the employment elasticity for organized manufacturing sector based on various estimates is in the range of 0.4-0.5 for 2000s. Sectors which have been employment intensive during 2000s include wearing apparel, Furniture and Leather Products, Motor Vehicles, rubber products and Electrical Equipment. With growth moderating in 2012 and 2013, employment elasticity is likely to have lowered. Going forward, employment intensive growth is crucial for India to meet the demographic dividend challenge.
Key Words: Employment Elasticity, Growth
JEL Classification: E24, R23
1 The authors are working in the Structural Issues Division of the Department of Economic and Policy Research.
This paper was prepared in connection with a Central Board query under the overall guidance of Smt Balbir
Kaur, Adviser. The authors are thankful to Dr Nachiket Mor, Central Board member, RBI for his valuable
comments on the paper. Views expressed by the authors are their personal and not the institution that they
belong to. Usual disclaimer applies.
2
Estimating Employment Elasticity of Growth for the Indian Economy
I. Introduction
Employment has always figured as an important element of the growth and
development process of the Indian economy. India being a highly populated country,
employment becomes a crucial element. Employment acts as a link between
economic growth and poverty reduction. Employment serves as a significant variable
in the attainment of inclusive and sustainable growth. The focus of employment in
the overall development planning had emerged around second half of 1970s and
1980s when it was felt that unemployment was on a rise. With the initiation of
reforms post 1990s, it has generally been analysed whether reforms driven growth of
the Indian economy has been job creating or not. The great recession has further
renewed the concerns about unemployment and job creation due to the slow down,
both globally as well as in India. Against this backdrop, this paper aims to compute
employment elasticity for the Indian economy, over the decades and more
specifically for the 2000s using the latest available data.
Employment elasticity is a measure of the percentage change in employment
associated with a 1 percentage point change in economic growth. The employment
elasticity indicates the ability of an economy to generate employment opportunities
for its population as per cent of its growth (development) process. Employment
elasticity measurement generally faces two sets of criticisms: (1) the relationship
between employment and output need not be uni-directional and (2) the notion of
employment elasticity is valid for a given state of technology, wage rate and policies.
Notwithstanding these criticisms, employment elasticity represents a convenient way
of summarising the employment intensity of growth or sensitivity of employment to
output growth (Islam and Nazara, 2000). These are also commonly used to track
sectoral potential for generating employment and in forecasting future growth in
employment.
In the empirical literature, there are two methodologies that have generally
been used for calculation of employment elasticities. These are based on compound
annual growth rate (CAGR) approach that gives the ‘arc’ elasticity and regression
approaches that provide point elsticity. The formula for calculation of ‘arc’ elasticity of
employment is generally as under:
L /L e = -------- (1) Y /Y
3
where L denotes employment and Y denotes GDP for the economy. The numerator
refers to the percentage change in employment, while the denominator refers to the
percentage change in income, which is essentially the GDP growth rate. While for
other countries, simple percentage change is used, in case of India, since
employment data is available once in five years, CAGR approach is used.
An alternative way to compute the elasticity is to estimate a log linear
regression equation between employment and GDP that generates the point
elasticity of employment. The conventional form of the equation is
(2)
where variables L and Y denote employment and GDP, respectively, and ln
stands for the natural logarithm of the relevant variable2. Here, the regression
coefficient serves as the employment elasticity. In other words,
d ln L dL /L
e = ------- = -------- (3)
d ln Y dY /Y
The existing estimates on aggregate employment elasticity covering all
sectors are based on National Sample Survey Organisation (NSSO) employment
data up to 2009-10. NSSO 2011-12 survey results got released in June 2013. As of
now, neither the Planning Commission nor any other private researcher/research
institutions have updated aggregate employment elasticity by using the 2011-12
NSSO survey results As regards organized manufacturing, ASI data for 2011-12 got
released recently in January 2014. It is against this backdrop that this paper attempts
to provide updated estimates on aggregate as well as sectoral employment
elasticities for India by using latest NSSO and ASI data. The paper is divided into
various sections. Section II of the paper provides a brief on the existing estimates on
employment elasticity in India. Section III gives a description of the NSSO and ASI
database, which have been used in the paper. Section-IV gives employment
elasticity estimates; both aggregate as well as sector specific using a variety of
approaches so as to reinforce the robustness of the results. Conclusion and policy
implications are given in Section V.
2 Various extensions to equation (2) are also used to compute elasticity across sectors and industries.
4
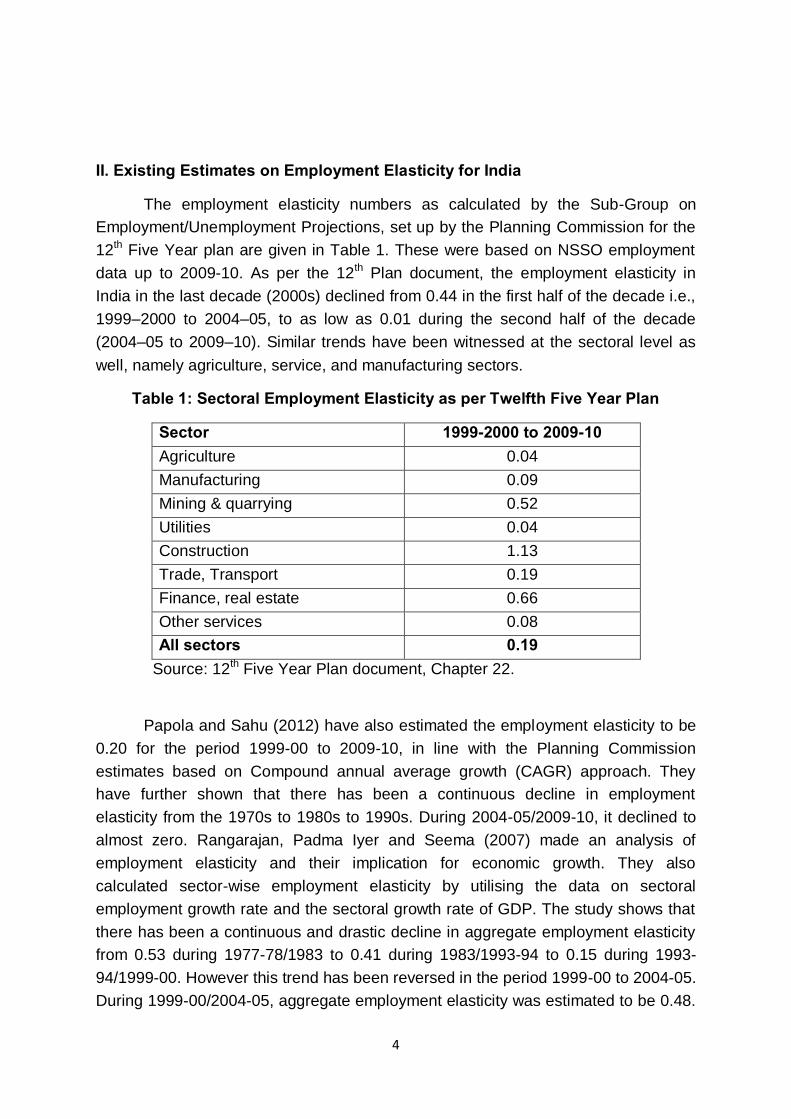
II. Existing Estimates on Employment Elasticity for India
The employment elasticity numbers as calculated by the Sub-Group on
Employment/Unemployment Projections, set up by the Planning Commission for the
12th Five Year plan are given in Table 1. These were based on NSSO employment
data up to 2009-10. As per the 12th Plan document, the employment elasticity in
India in the last decade (2000s) declined from 0.44 in the first half of the decade i.e.,
1999–2000 to 2004–05, to as low as 0.01 during the second half of the decade
(2004–05 to 2009–10). Similar trends have been witnessed at the sectoral level as
well, namely agriculture, service, and manufacturing sectors.
Table 1: Sectoral Employment Elasticity as per Twelfth Five Year Plan
Sector 1999-2000 to 2009-10 Agriculture 0.04
Manufacturing 0.09
Mining & quarrying 0.52
Utilities 0.04
Construction 1.13
Trade, Transport 0.19
Finance, real estate 0.66
Other services 0.08
All sectors 0.19 Source: 12th Five Year Plan document, Chapter 22.
Papola and Sahu (2012) have also estimated the employment elasticity to be
0.20 for the period 1999-00 to 2009-10, in line with the Planning Commission
estimates based on Compound annual average growth (CAGR) approach. They
have further shown that there has been a continuous decline in employment
elasticity from the 1970s to 1980s to 1990s. During 2004-05/2009-10, it declined to
almost zero. Rangarajan, Padma Iyer and Seema (2007) made an analysis of
employment elasticity and their implication for economic growth. They also
calculated sector-wise employment elasticity by utilising the data on sectoral
employment growth rate and the sectoral growth rate of GDP. The study shows that
there has been a continuous and drastic decline in aggregate employment elasticity
from 0.53 during 1977-78/1983 to 0.41 during 1983/1993-94 to 0.15 during 1993-
94/1999-00. However this trend has been reversed in the period 1999-00 to 2004-05.
During 1999-00/2004-05, aggregate employment elasticity was estimated to be 0.48.

5
The overall employment growth rate accelerated to a high of 2.8 per cent per annum
during this period (Bhalla, 2008). In addition, there are many studies that have
attempted to compute employment elasticity for organised manufacturing based on
ASI data (Goldar, 2000, Nagaraj, 2000, Kannan and Ravindran, 2009).
International organizations like ILO also estimate employment elasticity for
different countries/regions. A cross country comparison of region- wise estimates is
given in Table 2. “South Asia” that includes India recorded employment elasticity of
0.3 during 2004-08 that marks a slight decline from early 2000s.
Table 2: World and Regional Estimate of Employment Elasticity
Employment elasticity Average annual GDP growth rate
1992-96 1996-00 2000-04 2004-08 1992-96 1996-00 2000-04 2004-08
WORLD 0.3 0.4 0.3 0.3 3.1 3.7 3.3 4.4
Developed Economies & European Union 0.3 0.3 0.2 0.5 2.4 3.3 1.9 2.2
Central & South-Eastern Europe (non-EU) 0.2 0.2 0.2 0.2 -5.5 3.2 6.0 6.7
East Asia 0.1 0.2 0.1 0.1 10.2 7.0 7.8 9.3
South-East Asia & the Pacific 0.3 0.1 0.3 0.4 7.8 1.6 4.9 5.8
South Asia 0.3 0.4 0.4 0.3 6.0 5.4 5.5 8.4
Latin America & the Caribbean 0.6 0.9 0.8 0.5 3.3 3.0 2.3 5.0
Middle East 1.1 1.5 0.7 0.7 2.9 3.3 5.1 5.7
North Africa 0.8 0.6 0.8 0.7 2.3 4.3 4.3 5.6
Sub-Saharan Africa 0.7 0.7 0.5 0.5 2.9 3.0 6.0 6.1
Source: Employment Elasticities Indicator KILM 19 (2009), International Labour
Organization (ILO)
Studies have also attempted to explain the cross country variations in
employment elasticities in terms of various structural factors such as labour market
policies, product market policies as well as government size. Macroeconomic
policies that aim at reducing (output and price) volatility and increasing trade
openness have been observed to have a significant effect in increasing employment
elasticities (Crivelli et al, 2012). International literature is also supported by Indian
literature which states that the determinants of employment elasticity can be
classified into labour market variables such as labor supply, labour market reforms
(tax GDP ratio) and trend in the share of wages as well as macro economic variables
like economic stability, investment, public expenditures etc (Pattanaik and Nayak
2010; Mazumdar and Sarkar 2007).

6
III. Employment Data: NSSO and ASI
The All India employment and unemployment surveys conducted by the
National Sample Survey Office (NSSO) are the primary source of various indicators
of labour force at national and state levels, which are used for planning and policy
formulation by various government organizations as well as researchers. They are in
fact the major as well as most comprehensive source of data on employment-
unemployment situation in the country. NSS surveys on employment &
unemployment with large samples of households was conducted quinquenially (once
in five years) for the first time in 27th round (October 1972-September 1973) survey.
The concepts and definitions recommended by Dantwala committee (set up by the
Indian Planning Commission) formed the basis of this survey. Since then, eight
comprehensive quinquennial surveys on employment and unemployment situation in
India have so far been carried out by the NSSO3. The concepts, definitions and
procedures in these surveys are based primarily on the recommendations of the
Dantwala Committee. The results of these surveys are being brought out in the form
of NSS reports.
The latest NSSO survey on employment is the 68th Round for the year 2011-
12, released in June 2013. As per UPSS basis, the latest survey reveals that the
work force was about 472.9 million (rural male: 234.6, rural female: 101.8, urban
male: 109.2 and urban female: 27.3) as on 1st January 2012 whereas the number of
persons in the labour force was reported to be 483.7 millions (rural male: 238.8, rural
female: 103.6, urban male: 112.5 and urban female: 28.8). The unemployment rate
in 2011-12 was recorded to be 2.2 per cent on usual principal subsidiary basis
(UPSS) basis (Table 3).
Table 3: Comparison of employed persons and unemployment rate (UPSS)
Indicator/Year 1999-2000 2004-05 2009-10 2011-12 Employment (millions) 396.76 457.46 460.18 472.9
Unemployment rate (per cent) 2.2 2.3 2.0 2.2
A comparison of the 68th round survey results vis-a-vis previous rounds
reveals certain interesting facts. There has been consistent increase in absolute
employment across various sectors from 396.8 million in 1999-00 to 460 million in
2009-10 to 472.9 million in 2011-12. Notwithstanding an absolute increase in
3 These were carried out during the 32nd round (July 1977 – June 1978), 38th round (January 1983 – December
1983), 43rd round (July 1987 – June 1988), 50th round (July 1993 – June 1994), 55th round (July 1999 – June
2000), 61st round (July 2004- June 2005) , 66th round (July 2009- June 2010) and the latest 68th round (July-
2011-June 2012).

7
employment, the unemployment rate which was rising till 2004-05 fell in 2009-10 but
has again risen slightly in 2011-12 to 2.2 per cent raising apprehensions of jobless
growth4. The work participation rate (WPR) fell from 392 in 2009-10 (66th NSSO
survey) to 386 in the 68th round NSSO survey in 2011-12 in line with the fall in labour
force participation rate (LFPR)5. The fall in WPR was mainly due to fall in rural areas
for both males and females, whereas in urban areas, the WPR has gone up for both
males and females (Annex Table 1).
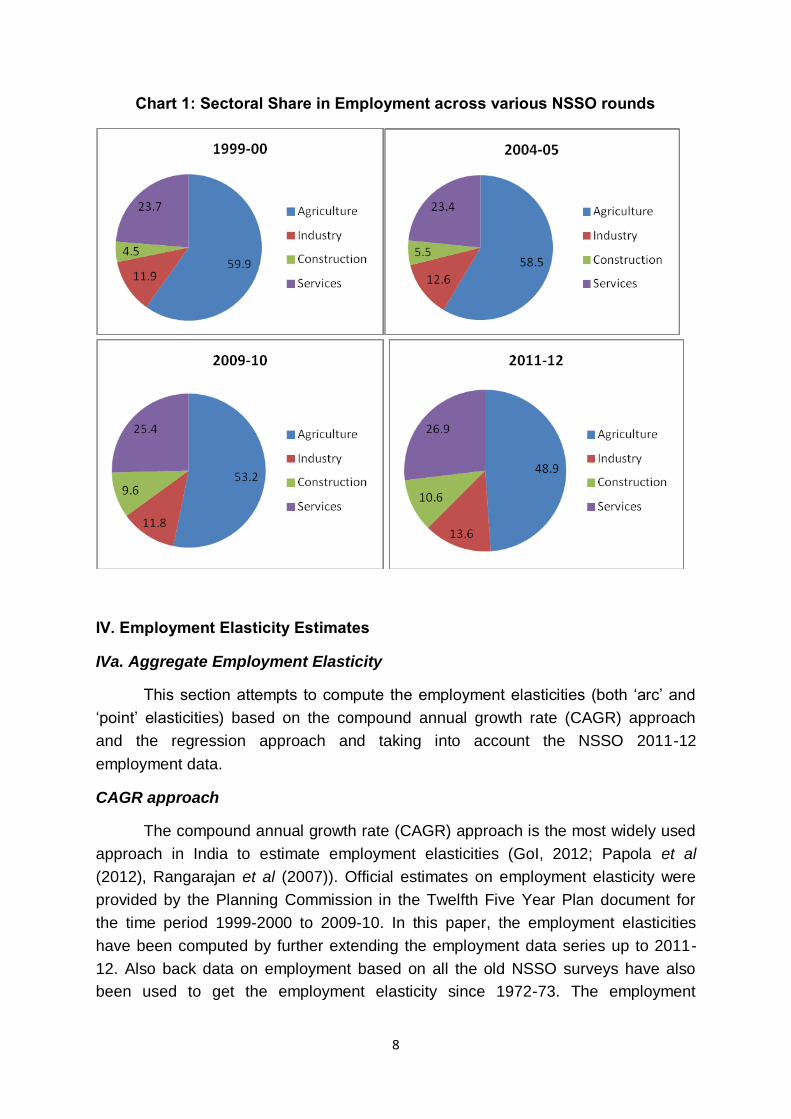
An analysis of sectoral share in employment over the years reveals that there
has been a shift in employment away from agriculture towards manufacturing,
construction and service activities. The share of agriculture has declined
continuously from 59.9 per cent in 1999-00 to 48.9 per cent in 2011-12 whereas the
share of construction sector has consistently risen from 4.5 per cent in 1999-00 to
10.6 per cent in 2011-12. The industrial sector saw a reasonable increase in its
share from 11.9 per cent in 1999-00 to 13.6 per cent in 2011-12, notwithstanding a
slight dip in 2009-10. Services have also seen an increase in its share, particularly in
sub sectors such as transport, banking, storage and communications and education
services (Chart 1).
Another source of employment data is the Annual Survey of Industries (ASI)
which is the principal source of industrial statistics, particularly for the organised
manufacturing sector in India. The major advantage of ASI data (released by the
Ministry of Statistics and Programme Implementation, MOSPI) is that since it is
conducted annually, time series information is available unlike that of NSSO. The
ASI was launched in 1960 with 1959 as the reference year and is continuing since
then except for 1972. The scope and coverage of ASI survey has been modified
from time to time. From ASI 2000-01 to ASI 2003-04, the census sector was
modified to include units employing 100 and more workers instead of 200 and more
workers and to some extent because of this, ASI data since 2000-01 are not strictly
comparable with that of previous ASI rounds. In ASI 2004-05, National Industrial
Classification (NIC) 2004 was introduced and from 2008-09, the latest classification
NIC-2008 was introduced. Given the fact that industrial sector occupies an important
position in the Indian economy, job creation in the industrial sector, particularly
manufacturing sector is the key to achieving the employment challenge as envisaged
in the 12th Plan. An analysis of the employment elasticity for manufacturing sector
based on ASI data has also, therefore, been attempted in this study.
4 In terms of Usual principal subsidiary status. 5 As per NSSO, Labour Force Participation Rate (LFPR) is defined as the number of persons in the labour force
per 1000 persons. Worker Population Ratio (WPR) is defined as the number of persons employed per 1000
persons
8
Chart 1: Sectoral Share in Employment across various NSSO rounds
IV. Employment Elasticity Estimates
IVa. Aggregate Employment Elasticity
This section attempts to compute the employment elasticities (both ‘arc’ and
‘point’ elasticities) based on the compound annual growth rate (CAGR) approach
and the regression approach and taking into account the NSSO 2011-12
employment data.
CAGR approach
The compound annual growth rate (CAGR) approach is the most widely used
approach in India to estimate employment elasticities (GoI, 2012; Papola et al
(2012), Rangarajan et al (2007)). Official estimates on employment elasticity were
provided by the Planning Commission in the Twelfth Five Year Plan document for
the time period 1999-2000 to 2009-10. In this paper, the employment elasticities
have been computed by further extending the employment data series up to 2011-
12. Also back data on employment based on all the old NSSO surveys have also
been used to get the employment elasticity since 1972-73. The employment

9
elasticity numbers based on the CAGR approach during 1972-73 to 2011-12 are
reported in Table 4. As can be seen, there has been a continuous decline in
employment elasticity from the 1970s to 1980s to 1990s. During the 2000s till date
(i.e., 1999-2000 to 2011-12), employment elasticity was about 0.20 (a shade higher
than that of 0.19 per cent as estimated by Planning Commission till 2009-10).
Employment elasticity was high (about 0.5 per cent) for the first half of 2000s. It
declined significantly during the second half of 2000s. Notwithstanding an
improvement during 2009-10 to 2011-12, it has remained lower than that of the first
half of 2000s. For the post reform period as a whole (1993-94 to 2011-12),
employment elasticity was placed at 0.18.
Table 4: Employment Elasticity: CAGR approach
Year Employment
Growth (CAGR) GDP growth
(CAGR) Employment
Elasticity 1972-73 to 1977-78 2.6 4.6 0.57 1977-78 to 1983 2.1 3.9 0.54 1983 to 1988-87 1.7 4.0 0.42 1988-87 to 1993-94 2.4 5.6 0.43 1993-94 to 1999-2000 1.0 6.8 0.15 1999-2000 to 2004-05 2.8 5.7 0.50 2004-05 to 2009-10 0.1 8.7 0.01 2009-10 to 2011-12 1.4 7.4 0.18 1999-00 to 2011-12 1.5 7.3 0.20 1993-94 to 2011-12 1.1 6.0 0.18
It may be noted that the fall in employment elasticity has been accompanied
by a fall in unemployment rate as well between 2004-05 and 2009-10. This is
essentially due to a fall in labour force participation rate (LFPR), across all ages in
2009-10 vis-à-vis 2004-05. Labour force participation rate, which reflects the persons
who express their willingness to work has been declining from 430 per thousand
persons in 2004-05 to 400 per thousand persons in 2009-10 and further to 395 per
thousand persons in 2011-12. The decline in LFPR is visible in case of rural females,
possibly on account of greater number of persons opting for education/skill
development. Studies using NSSO data show that there has been a steady increase
in the ratio of students to total population from 20.5 per cent in 1993-4 to 24.3 per
cent in 2004-5 and further to 26.6 per cent in 2009- 10 (Thomas, 2012). The
students to population ratio increased faster in rural areas and more so for females
(GoI, 2013). Consequently, the unemployment rate that is the difference between
people who are willing to work (indicated by LFPR) and who are actually
working/employed (indicated by WPR) as a proportion of the former also went down
10
implying that relatively larger proportions of people who were willing to work were
actually employed in 2009-10.
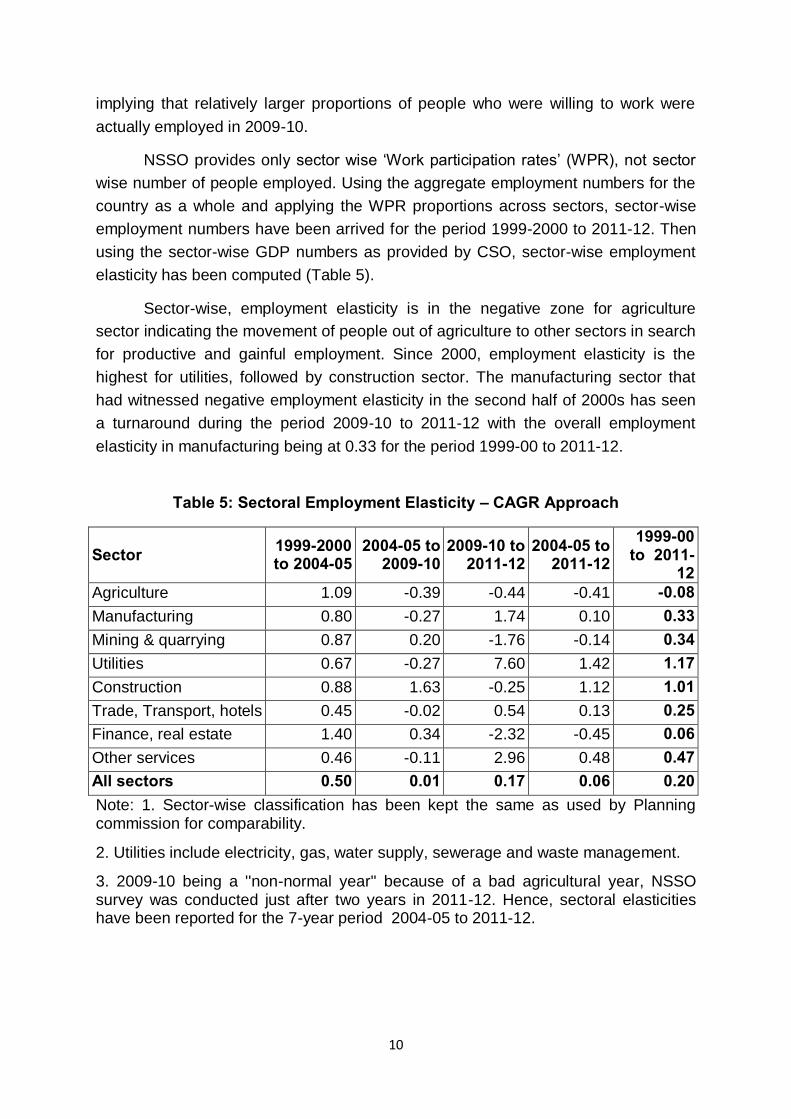
NSSO provides only sector wise ‘Work participation rates’ (WPR), not sector
wise number of people employed. Using the aggregate employment numbers for the
country as a whole and applying the WPR proportions across sectors, sector-wise
employment numbers have been arrived for the period 1999-2000 to 2011-12. Then
using the sector-wise GDP numbers as provided by CSO, sector-wise employment
elasticity has been computed (Table 5).
Sector-wise, employment elasticity is in the negative zone for agriculture
sector indicating the movement of people out of agriculture to other sectors in search
for productive and gainful employment. Since 2000, employment elasticity is the
highest for utilities, followed by construction sector. The manufacturing sector that
had witnessed negative employment elasticity in the second half of 2000s has seen
a turnaround during the period 2009-10 to 2011-12 with the overall employment
elasticity in manufacturing being at 0.33 for the period 1999-00 to 2011-12.
Table 5: Sectoral Employment Elasticity – CAGR Approach
Sector 1999-2000 to 2004-05
2004-05 to 2009-10
2009-10 to 2011-12
2004-05 to 2011-12
1999-00 to 2011-
12 Agriculture 1.09 -0.39 -0.44 -0.41 -0.08 Manufacturing 0.80 -0.27 1.74 0.10 0.33 Mining & quarrying 0.87 0.20 -1.76 -0.14 0.34 Utilities 0.67 -0.27 7.60 1.42 1.17 Construction 0.88 1.63 -0.25 1.12 1.01 Trade, Transport, hotels 0.45 -0.02 0.54 0.13 0.25 Finance, real estate 1.40 0.34 -2.32 -0.45 0.06 Other services 0.46 -0.11 2.96 0.48 0.47 All sectors 0.50 0.01 0.17 0.06 0.20 Note: 1. Sector-wise classification has been kept the same as used by Planning commission for comparability.
2. Utilities include electricity, gas, water supply, sewerage and waste management.
3. 2009-10 being a ''non-normal year'' because of a bad agricultural year, NSSO survey was conducted just after two years in 2011-12. Hence, sectoral elasticities have been reported for the 7-year period 2004-05 to 2011-12.
11
Regression approach
While the Twelfth Plan document does talk of using the regression approach
for estimating elasticity, results have been reported only for the CAGR approach.
The reason why regression approach is not very popular in India is that while time
series data on GDP is available, the continuous time series for employment is not
available in India. Given this data limitation, some approximation/interpolation of the
labour data has to be done to arrive at time series information on employment. The
most common approach of deriving these data is as follows: NSSO rounds provide
the work participation rates (WPR) per thousand of population for the years 1999-00,
2004-05, 2009-10 and 2011-12. Assuming the WPR to remain unchanged between
the two quinquennial surveys and multiplying the WPR with the corresponding
population, one gets employment numbers in millions for the period 1999-2000 to
2011-12. It may be mentioned that although population census is conducted only
decennially, the interpolated annual population figures, as given in the Census
document, are generally used. The information on WPR as available from NSSO
major rounds is used as the control variable and the series is then interpolated using
annual population figures to obtain the time series data on employment. The
information available from NSSO thin rounds for some of the mid-years are also
used to do necessary adjustments.
This approach has been used to arrive at the time series data for labour input
in the KLEMS project6. However, this information from the project is available only up
to 2008. Based on NSSO’s last two major rounds, 2009-10 and 2011-12, the KLEMS
series has been extended up to 2011-12 using the same approach. Employment
elasticity has then been calculated by running a log-log regression of employment
figures so generated on observed real GDP figures (independent variable) from
1993–1994 to 2011-12. The long run employment elasticities (point elasticities) as
computed using this methodology are reported in Table 6. The employment elasticity
at the aggregate level is observed to be about 0.20 which is in line with some of the
previous estimates7. Elasticity is observed to be the highest for construction sector at
1.03. It is also observed to be significant for manufacturing and mining and
quarrying.
6 In line with the World KLEMS (Capital, Labour, Energy, Material and Services) project, the India-KLEMS
research project was undertaken as a research co-ordination effort between RBI, CSO and ICRIER in September 2009 with the objective to create an internationally comparable database for estimating productivity at the
sectoral levels. 7 Since CAGR approach shows a fall in employment elasticity between the first and the second half of 2000s,
the same was tested here using a slope dummy for the second half. While the slope dummy coefficient was
negative in all cases implying a decline in employment elasticity in the second half of 2000s, it was not found to
be statistically significant.

12
Table 6: Employment Elasticity based on log-log regression: 1993-94 to 2011-12
Sector Log-log OLS regression coefficients
All sectors 0.20**
Agriculture -0.02
Mining and Quarrying 0.22**
Manufacturing 0.29**
Utilities 0.28
Construction 1.03**
Services 0.30
Note: 1. ** and * indicate significance at 1 per cent and 5 per cent, respectively. 2. The sectoral break up here does not exactly match with the CAGR approach, particularly for services as the regression database follows classification of KLEMS database and the CAGR is directly from NSSO database.
3. The long run elasticities have been computed in a co-integration framework. The presence of co-integration has been tested using unit root tests on the residuals based on Augmented Dickey Fuller Tests.
While for agriculture, elasticity turns out to be negative, it is not statistically
significant. While this result is in line with the CAGR approach that also reveals that
agricultural growth has not been employment intensive in India in 2000s8, it is
possible that inter-state differences exist. For certain states that have had high
agricultural growth, this picture could be different. Although at aggregate level,
services elasticity is not coming to be significant, it may be interesting to analyse this
trend at a more disaggregated level, namely, for trade, hotels, transportation,
finance, real estate, social sector, defence, public administration etc. Both state-wise
and sub-sector-wise analysis could be an area of further research.
IVb. Employment Elasticity for Organised Manufacturing
Unlike all other sectors, time series information on employment is available for
the organised manufacturing sector based on Annual Survey of Industries (ASI)
data. This enables us to further firm up our elasticity numbers, particularly for the
organised manufacturing sector. There is more or less consensus that organised
industrial sector growth during the 1980s was “jobless”. During the decade of 1990s,
while the immediate post-reforms period (first half of 1990s) was characterised by
8It may be noted that even in absolute terms, there has been a decline in number in number of people employed
in agriculture sector in the 2000s as per NSSO data.
13
employment boom, the second half witnessed some job losses (Goldar, 2000,
Nagaraj, 2000, Kannan and Ravindran, 2009). Using the ASI data, it is observed that
during the 2000s, about 5.4 million jobs got created in the organised manufacturing
sector, with a large proportion of these in the second half of 2000s.
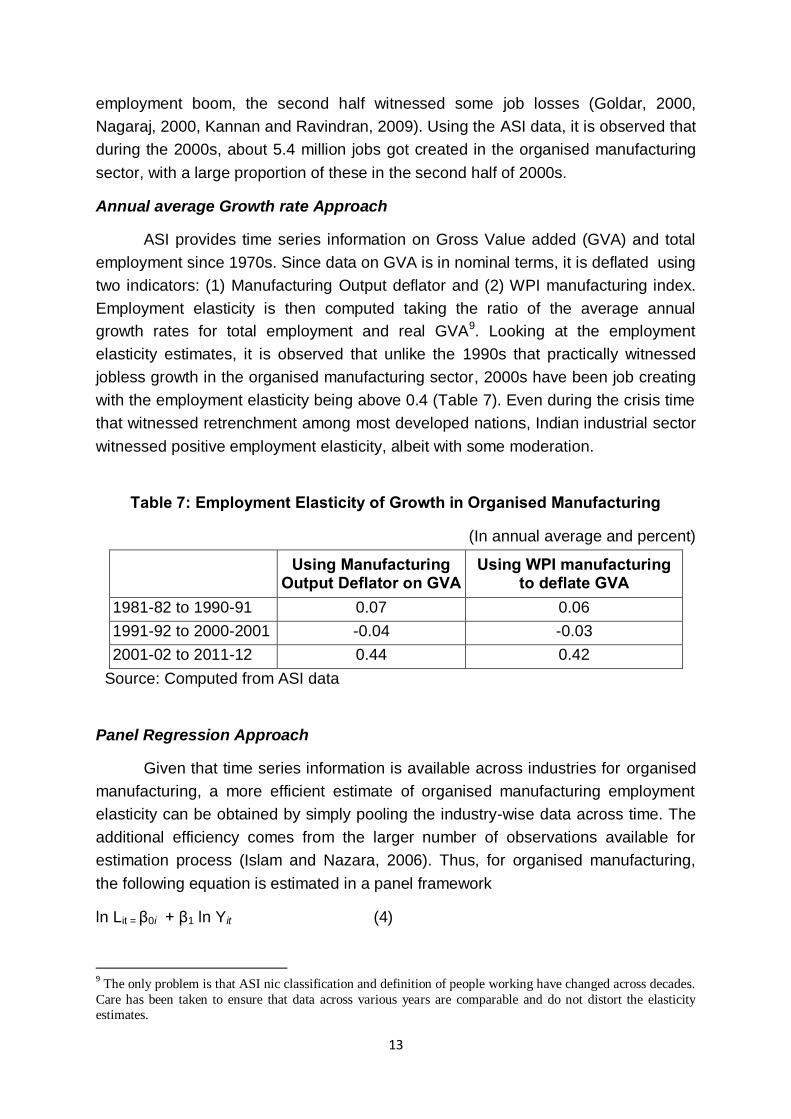
Annual average Growth rate Approach
ASI provides time series information on Gross Value added (GVA) and total
employment since 1970s. Since data on GVA is in nominal terms, it is deflated using
two indicators: (1) Manufacturing Output deflator and (2) WPI manufacturing index.
Employment elasticity is then computed taking the ratio of the average annual
growth rates for total employment and real GVA9. Looking at the employment
elasticity estimates, it is observed that unlike the 1990s that practically witnessed
jobless growth in the organised manufacturing sector, 2000s have been job creating
with the employment elasticity being above 0.4 (Table 7). Even during the crisis time
that witnessed retrenchment among most developed nations, Indian industrial sector
witnessed positive employment elasticity, albeit with some moderation.
Table 7: Employment Elasticity of Growth in Organised Manufacturing
(In annual average and percent)
Using Manufacturing Output Deflator on GVA
Using WPI manufacturing to deflate GVA
1981-82 to 1990-91 0.07 0.06
1991-92 to 2000-2001 -0.04 -0.03
2001-02 to 2011-12 0.44 0.42
Source: Computed from ASI data
Panel Regression Approach
Given that time series information is available across industries for organised
manufacturing, a more efficient estimate of organised manufacturing employment
elasticity can be obtained by simply pooling the industry-wise data across time. The
additional efficiency comes from the larger number of observations available for
estimation process (Islam and Nazara, 2006). Thus, for organised manufacturing,
the following equation is estimated in a panel framework
ln Lit = β0i + β1 ln Yit (4)
9 The only problem is that ASI nic classification and definition of people working have changed across decades.
Care has been taken to ensure that data across various years are comparable and do not distort the elasticity
estimates.

14
where variables L and Y are defined as before. i denotes the particular sub-sector of
organized manufacturing and t denotes time period.
The analysis is done for the different sub-sectors as given by ASI data over
the period 2001-02 to 2011-12 during which comparable ASI data is available. Given
that both the deflators – manufacturing Output and WPI manufacturing – give
broadly similar results, from here on, real GVA have been arrived only by deflating
using the WPI manufacturing sub-sector indices. Estimation results are reported in
Table 8. Employment elasticity with respect to real GDP is observed to be 0.57.
Table 8: Organised Manufacturing Employment Elasticity:
Panel Regression Coefficients
Log employment on Equation 4 Constant 4.60**
Log Output 0.57**
R square 0.22
N 220
Note: 1. ** and * indicate significance of coefficient at 1 per cent and 5 per cent levels, respectively.
2. Hausman test has been used to decide on the appropriate panel models.
3. Introducing a slope dummy for the second half of 2000s, it is observed that the coefficient of slope dummy is small negative in both the cases implying a decline in employment elasticity in the second half of 2000s. However, it was not observed to be statistically significant.
Sector wise employment elasticity for organised manufacturing during 2000s
Notwithstanding gains in employment during the 2000s in the organised
manufacturing sector, differences persist across industries. And panel results also
indicate that industry-wise variations are significant. Recognising this, a preliminary
attempt is made here to estimate the industry-wise employment elasticities during
2000s. The GVA for the majority of the sub-sectors (accounting for about 88 per cent
of total) is deflated by the corresponding WPI. For example, GVA for ‘Basic Metals’
has been deflated by WPI for ‘Basic Metals, Alloys and Metal Products’ to arrive at
the real GVA for that sub-sector. Results are reported in Table 9 (next page). Some
industries have been employment creating in a larger way and have higher elasticity
than all-India average. These include manufacture of furnitures, Leather and Leather
Products, Wearing Apparel, Motor Vehicles and Trailers, rubber and plastic products
and Manufacturing of Computer electronic and optical products. Clearly, two
15
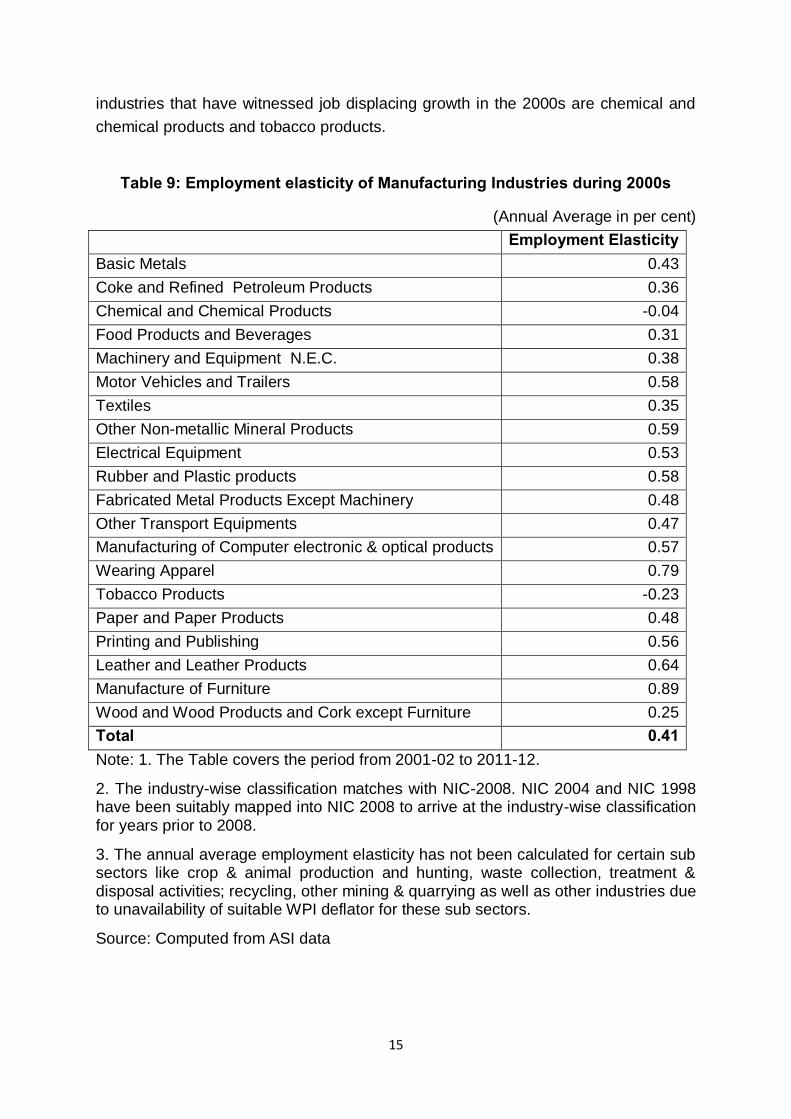
industries that have witnessed job displacing growth in the 2000s are chemical and
chemical products and tobacco products.
Table 9: Employment elasticity of Manufacturing Industries during 2000s
(Annual Average in per cent)
Employment Elasticity Basic Metals 0.43
Coke and Refined Petroleum Products 0.36
Chemical and Chemical Products -0.04
Food Products and Beverages 0.31
Machinery and Equipment N.E.C. 0.38
Motor Vehicles and Trailers 0.58
Textiles 0.35
Other Non-metallic Mineral Products 0.59
Electrical Equipment 0.53
Rubber and Plastic products 0.58
Fabricated Metal Products Except Machinery 0.48
Other Transport Equipments 0.47
Manufacturing of Computer electronic & optical products 0.57
Wearing Apparel 0.79
Tobacco Products -0.23
Paper and Paper Products 0.48
Printing and Publishing 0.56
Leather and Leather Products 0.64
Manufacture of Furniture 0.89
Wood and Wood Products and Cork except Furniture 0.25
Total 0.41 Note: 1. The Table covers the period from 2001-02 to 2011-12.
2. The industry-wise classification matches with NIC-2008. NIC 2004 and NIC 1998 have been suitably mapped into NIC 2008 to arrive at the industry-wise classification for years prior to 2008.
3. The annual average employment elasticity has not been calculated for certain sub sectors like crop & animal production and hunting, waste collection, treatment & disposal activities; recycling, other mining & quarrying as well as other industries due to unavailability of suitable WPI deflator for these sub sectors.
Source: Computed from ASI data
16
V. Conclusion and Policy Implications
The aggregate employment elasticity estimates for India vary from 0.18 (arc
elasticity) to 0.20 (point elasticity) during the post reform period (1993-94 to 2011-
12). This implies that for every 10 per cent change in real GDP, there is about 1.8-2
per cent change in employment. Also, this employment elasticity marks a significant
decline from the 1970s and 1980s. Elasticities vary considerably across sectors.
While agriculture has witnessed negative elasticity, services including construction
have generally been employment intensive. Manufacturing employment elasticity has
hovered in the range 0.29-0.33. Within manufacturing, the employment elasticity for
organized manufacturing sector based on various estimates seems to be higher, in
the range 0.42-0.57 for 2000s and it has risen over the previous two decades. Given
the huge productivity and wage differentials between organised and unorganised
sectors, greater employment generation in organised manufacturing is crucial as it
has larger multiplier effects10.
The employment elasticity estimates of this study cover the period up to 2011-
12. Subsequent to this, India has seen significant moderation in its GDP growth
rates, particularly during 2012-13 and 2013-14. While employment numbers are not
yet available for these years, Labour Bureau quarterly surveys as well as various
private agencies’ information point towards moderation in employment generation. If
these data sources are any hint, then one might see some changes employment
elasticity depending upon the relative pace of moderation in employment generation
vis-à-vis growth.
Going forward, it is the relative cost of capital vis-à-vis labour and the nature
of investment demand that will determine to what extent growth would be job-
creating. Increased capital to labour ratio in the organised sector for a labour
abundant country like India is a concern that has been well-highlighted (GoI, 2013). If
India has to meet the demographic dividend challenge, focus should be on industries
where employment elasticity is higher. On a rough basis, about 10 million people
would need a job every year for the next 15 years (Chakraborty, 2013). Finding
productive jobs for such huge numbers is a big challenge, and clearly the answer lies
in stepping up growth, and importantly, stepping up the employment intensity of
growth. Also, these additional jobs will have to be created keeping in mind the overall
structural changes that Indian labour market has been going through, particularly in
terms of movement of people away from agriculture and reduction in women labour
force as they move towards education. The non-farm sector has to gear up to
10 It may be noted that aggregate manufacturing elasticity and organized manufacturing elasticity being from
two different sources can atbest be indicative of broad trends though not strictly comparable.
17
shoulder the burden of agriculture. Amongst the non-farm sector, while the services
sector has led India’s growth and employment story for some time now, it is the
manufacturing sector, particularly the organised manufacturing that has to play a
more important role in creating jobs in the coming times as envisaged in the 12 th
Plan.
Each of the approaches used in the paper has limitations that are well known.
While the CAGR approach has the limitation that it measures only the arc elasticity
i.e., between two time periods rather than point elasticity, it is used more often in the
official circles. The regression method to compute the aggregate elasticity, despite
its known advantages over the CAGR method, suffers from a major drawback in the
Indian case due to the interpolation exercise required to arrive at time series
information on employment11. The main aim of the paper has been to provide
updated and revised estimates for employment elasticity in India at the aggregate
level as well as for the broad sectors through different possible approaches
recognizing the fact that individually each of these approaches has its own
limitations, particularly in the Indian context. Computing employment elasticities at
greater disaggregation – sector wise and state-wise - could be an area of future
research. Building on this study, one could also explore what are the various
macroeconomic and structural factors that have influenced employment elasticity in
India.
11 That is why most studies in the Indian context have computed employment elasticity for organized
manufacturing where time series information is available even though it represents only about 27 per cent of the
total labour force in organized manufacturing.

18
References:
Bhalla G.S (2008) ‘Globalisation and Employment Trends in India’, The Indian Journal of Labour Economics, vol 51, no 1.
Chakravarty K.C (2013) ‘Environmental & Social Sustainability: Key Issues & concerns’, Yes Bank–GIZ–UNEP Sustainability Series event on Environment and Social Risk Management, Mumbai, April.
Crivelli E., D. Furcerri and J.Toujas – Bernate (2012), “Can policies affect employment intensity of Growth? A Cross Country Analysis”, IMF Working paper, August.
Goldar B (2000) ‘Employment growth in organized manufacturing in India’, Economic and Political weekly , vol 35, no 14, April 1-7, pp 1191-1195.
Government of India (2012), 12th Plan document, Chapter 22 on Employment and Skill Development, 2012.
--------(2013), Economic Survey, February.
--------Report of the Subgroup on employment for the 12th five year Plan, December, 2011.
Islam Iyanatul and Suahasil Nazara (2000), “Estimating employment elasticity for the Indonesian economy”, International Labour Office, Jakarta.
Kannan K P and Raveendran G (2009) ‘A quarter century of jobless growth in India’s organized manufacturing’, Economic and Political weekly, vol 44, no 10, March.
Kelly, G.M. (2000) ‘Employment and Concepts of Work in the New Global Economy’, International Labour Review, vol.139, no.1, pp. 5-32
Mazumdar Deepak and Sarkar Sandip (2007), ‘Employment Elasticity in organised manufacturing in India’, University of Toronto, Canada.
Nagaraj R (2001) ‘Organised manufacturing employment’, Economic and political weekly, September 16,vol 35, No-38, pp 3445-3448.
National Sample Survey 55th, 61th, 64th, 66th and 68th Round
Papola T.S. and Partha Pratim Sahu (2012), “Growth and Structure of Employment in India: Long-Term and Post-Reform Performance and the Emerging Challenge’’, Institute for Studies on Industrial Development, New Delhi, March.
Pattanaik Falguni and Nayak N C (2010), ‘Employment Intensity of service sector in India: Trends and determinants”, International conference on Business and Economics Research, Kuala Lumpur, Malaysia.
19
Rangarajan C, Padma Iyer kaul and Seema (2007), “Revisiting Employment and Growth”, Money and Finance, September.
Thomas Jose Jayan(2012) ‘India’s Labour Market during the 2000s- Surveying the changes’, Economic and Political Weekly, vol 67, no 51, December 22.
United Nations (2009), Employment Elasticities Indicator (KILM 19), ILO Trends Econometric Models, International Labour Organisation (www.ilo.org/kilm).
Economic and Political weekly Research Foundation database.
KLEMS database (www.rbi.org.in)
Website- www.mospi.gov.in (Ministry of Statistics and programme implementation)
www.rbi.org.in (Reserve Bank of India).
20
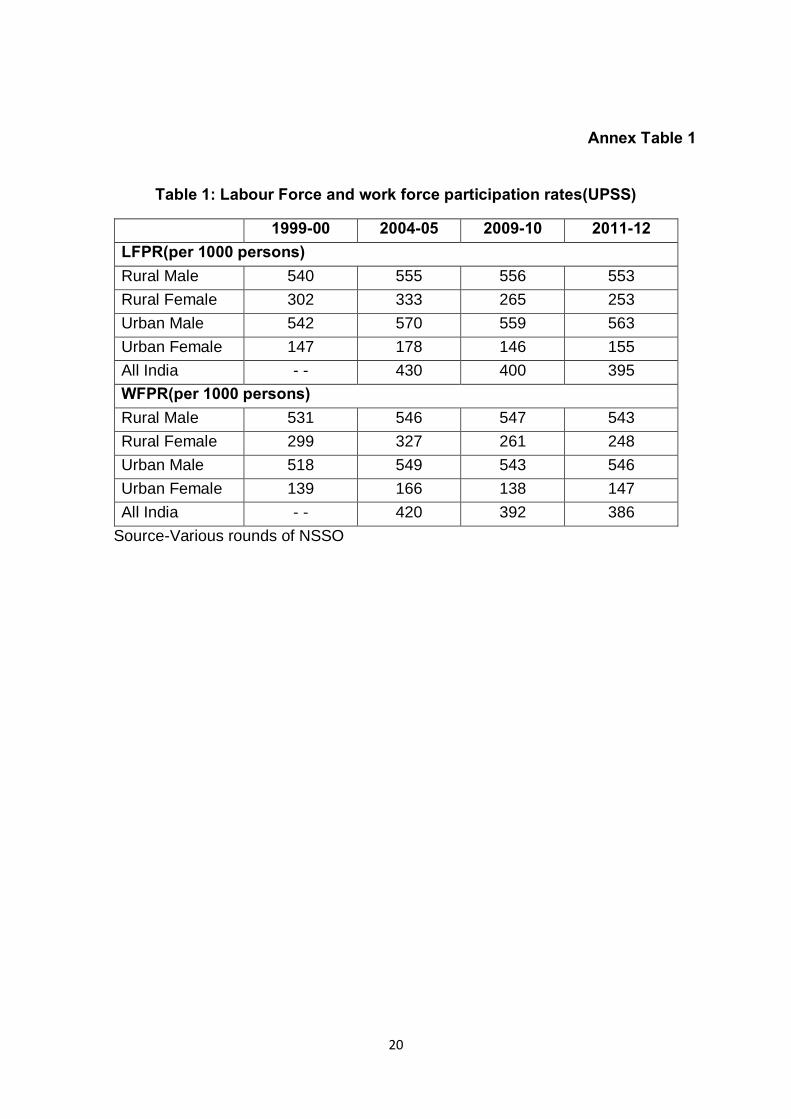
Annex Table 1
Table 1: Labour Force and work force participation rates(UPSS)
1999-00 2004-05 2009-10 2011-12 LFPR(per 1000 persons) Rural Male 540 555 556 553
Rural Female 302 333 265 253
Urban Male 542 570 559 563
Urban Female 147 178 146 155
All India - - 430 400 395
WFPR(per 1000 persons) Rural Male 531 546 547 543
Rural Female 299 327 261 248
Urban Male 518 549 543 546
Urban Female 139 166 138 147
All India - - 420 392 386
Source-Various rounds of NSSO
The Reserve Bank of India (RBI) introduced the RBI Working Papers series in
March 2011. These papers present research in progress of the staff members
of RBI and are disseminated to elicit comments and further debate. The
views expressed in these papers are those of authors and not that of
RBI. Comments and observations may please be forwarded to authors.
Citation and use of such papers should take into account its provisional
character.
Copyright: Reserve Bank of India 2014


![hapter 1: Introducing Dapr...namespace sample. microservice.web [ApiContr011er] 0 references public class SaluteWor1dContr Service 1 Service 2 Depr runtime Depr runtime Order Service](https://static.fdocuments.in/doc/165x107/60c019cee1a9721dae68c23c/hapter-1-introducing-dapr-namespace-sample-microserviceweb-apicontr011er.jpg)