W P S (DEPR): 10 / 2014 RBI WORKING PAPER SERIES
18
W P S (DEPR): 10 / 2014 RBI WORKING PAPER SERIES Analytics of Food Inflation in India Thangzason Sonna Dr. Himanshu Joshi Alice Sebastian and Upasana Sharma DEPARTMENT OF ECONOMIC AND POLICY RESEARCH OCTOBER 2014
Transcript of W P S (DEPR): 10 / 2014 RBI WORKING PAPER SERIES

W P S (DEPR): 10 / 2014
RBI WORKING PAPER SERIES
Analytics of Food Inflation in India
Thangzason SonnaDr. Himanshu JoshiAlice SebastianandUpasana Sharma
DEPARTMENT OF ECONOMIC AND POLICY RESEARCHOCTOBER 2014

The Reserve Bank of India (RBI) introduced the RBI Working Papers series inMarch 2011. These papers present research in progress of the staff membersof RBI and are disseminated to elicit comments and further debate. Theviews expressed in these papers are those of authors and not that ofRBI. Comments and observations may please be forwarded to authors.Citation and use of such papers should take into account its provisionalcharacter.
Copyright: Reserve Bank of India 2014

1
Analytics of Food Inflation in India*1
Abstract
Food inflation in India has remained stubborn in recent years. A number of proximatefactors such as increasing demand particularly arising from higher rural wages, risingagricultural cost of production, changing consumption pattern favoring protein items,increases in minimum support prices (MSPs) and droughts in certain years arebelieved to have led to higher food inflation. This paper examines the relevance ofthese factors and finds that increasing real rural wages have played the mostdominant role in the determination of overall food inflation in India in the long-run.Though statistically significant, the long-run impact of hikes in MSP of food crops,namely, rice and wheat and input cost inflation (except wages) on food inflation werenot as over-bearing as were generally perceived. Similarly, the long-run impact ofprotein expenditure on food inflation, though significant statistically, was found to beweak. In the short-run, the impact on food inflation stems from the same factors thatare important in the long-run viz., increases in rural real wages, MSP and input pricepressures. Empirical results indicate that the introduction of MGNREGA does notseem to have caused any significant increase in food inflation as generally perceived.Since the increase in real wages have the largest influence in driving food inflation, itbears to reason that there is a need to raise agricultural productivity in line with theincrease in real wages to assuage food price pressures.
JEL Classification: E31, E64, Q18
Key Words: Food Inflation, minimum Support Price (MSP), Johansen’s multivariatecointegration, Vector Error Correction Model (VECM) adjustment factors/coefficient, weakexogeneity, causality.
* This paper is prepared by Thangzason Sonna (A.Ad), Dr. Himanshu Joshi (Director), Alice Sebastian (RO) andUpasana Sharma (RO) of the Development Studies Division (DSD) of the Department of Economic and PolicyResearch (DEPR), Reserve Bank of India (RBI). The authors are grateful to Smt. Balbir Kaur, Adviser, DEPR forher useful suggestions. The paper reflects personal views of the authors.

2
Analytics of Food Inflation in India
Introduction
Beginning 2005-06:Q2 till 2012-13:Q4, with the exception of few quarters during2007-08 and 2011-12, food inflation in terms of wholesale price index (WPI) remainedabove overall inflation. The quarterly food inflation grew at an average rate of 10.16 percent during this period compared with 6.76 per cent for overall inflation. In contrast, duringthe preceding period of five years between 1999-00 till 2005-06, the overall inflation wasgenerally observed to be higher than food inflation. This was the period when inflation ingeneral was low, and the average quarterly food inflation of 2.63 per cent during theperiod was much lower than the overall inflation rate of 4.90 per cent (Chart 1).
-202468
1012141618202224
1999
Q1
1999
Q3
2000
Q1
2000
Q3
2001
Q1
2001
Q3
2002
Q1
2002
Q3
2003
Q1
2003
Q3
2004
Q1
2004
Q3
2005
Q1
2005
Q3
2006
Q1
2006
Q3
2007
Q1
2007
Q3
2008
Q1
2008
Q3
2009
Q1
2009
Q3
2010
Q1
2010
Q3
2011
Q1
2011
Q3
2012
Q1
2012
Q3
Per C
ent
Chart 1: Food Inflation vs Overall WPI
AllWPI FoodWPI
It is also observed that higher average food inflation during the latter periodwas more persistent than the former when the average food inflation was muchlower - a fact supported by comparatively larger estimated autocorrelations in thelatter than the former period (Chart 2).
Chart 2: Patterns of Autocorrelation of Food Inflation in Phases I & II
-0.3-0.2-0.1
00.10.20.30.40.50.6
1 2 3 4 5 6 7 8 9 10 11 12 13 14 15Au
toco
rrel
atio
n
Phase I (1999:Q1-2005:Q1)
* Ljung Box : 29.652 (0.013)
00.10.20.30.40.50.60.70.80.9
1 2 3 4 5 6 7 8 9 10 11 12 13 14 15
Au
toco
rrel
atio
n
Phase II (2005:Q2-2008:Q4)
* Ljung Box: 300.44 (0.0000)
3
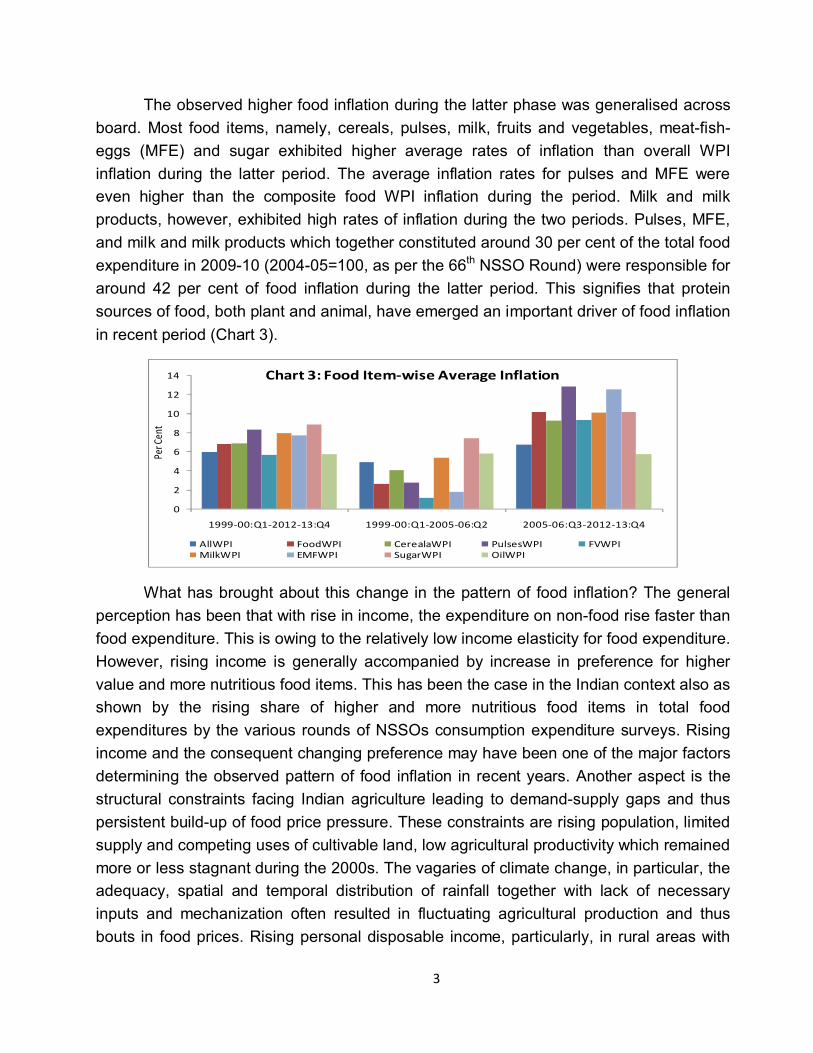
The observed higher food inflation during the latter phase was generalised acrossboard. Most food items, namely, cereals, pulses, milk, fruits and vegetables, meat-fish-eggs (MFE) and sugar exhibited higher average rates of inflation than overall WPIinflation during the latter period. The average inflation rates for pulses and MFE wereeven higher than the composite food WPI inflation during the period. Milk and milkproducts, however, exhibited high rates of inflation during the two periods. Pulses, MFE,and milk and milk products which together constituted around 30 per cent of the total foodexpenditure in 2009-10 (2004-05=100, as per the 66th NSSO Round) were responsible foraround 42 per cent of food inflation during the latter period. This signifies that proteinsources of food, both plant and animal, have emerged an important driver of food inflationin recent period (Chart 3).
0
2
4
6
8
10
12
14
1999-00:Q1-2012-13:Q4 1999-00:Q1-2005-06:Q2 2005-06:Q3-2012-13:Q4
Per C
ent
Chart 3: Food Item-wise Average Inflation
AllWPI FoodWPI CerealaWPI PulsesWPI FVWPIMilkWPI EMFWPI SugarWPI OilWPI
What has brought about this change in the pattern of food inflation? The generalperception has been that with rise in income, the expenditure on non-food rise faster thanfood expenditure. This is owing to the relatively low income elasticity for food expenditure.However, rising income is generally accompanied by increase in preference for highervalue and more nutritious food items. This has been the case in the Indian context also asshown by the rising share of higher and more nutritious food items in total foodexpenditures by the various rounds of NSSOs consumption expenditure surveys. Risingincome and the consequent changing preference may have been one of the major factorsdetermining the observed pattern of food inflation in recent years. Another aspect is thestructural constraints facing Indian agriculture leading to demand-supply gaps and thuspersistent build-up of food price pressure. These constraints are rising population, limitedsupply and competing uses of cultivable land, low agricultural productivity which remainedmore or less stagnant during the 2000s. The vagaries of climate change, in particular, theadequacy, spatial and temporal distribution of rainfall together with lack of necessaryinputs and mechanization often resulted in fluctuating agricultural production and thusbouts in food prices. Rising personal disposable income, particularly, in rural areas with

4
the implementation of MGNREGA and the steep hikes in MSPs in recent years may havealso contributed to increase in and changing composition of demand for food and thushigher food inflation. The role of fiscal and monetary policy, especially the impact of thestimulus packages and the monetary stance in the wake of the global financial crisis havealso been ascribed to have also contributed to rising inflation in general. However, thesefactors have not been put under empirical analysis as to whether they have contributed tofood price inflation. It is in this backdrop that an attempt is being made in this study toempirically verify the contribution of these factors to the observed pattern of food inflationduring the period (1999-00:Q1 to 2012-13:Q4).
Section II surveys the literature on empirical studies on recent experienceregarding food inflation in India. Section III describes the data used, Section IV includesthe methodology employed and Section V deals with the empirical results. Section VIpresents some concluding observations.
II. Factors behind Food Inflation in India – A Review of Literature
There have been number of empirical and analytical studies in India which havetried to explain the recent trend in food inflation in India. These studies have broadlyattributed food inflation in India to supply and demand side factors:
Supply side factors
One of the traditional explanations for rising food prices has been the supply-sideshocks related to weather either because of droughts or floods. Mohanty (2010) arguesthat drought-led high food prices have contributed significantly to seven out of ninedouble-digit inflation episodes (between 1956 and 2010) in India. Over the years thevolume and spatial distribution of monsoon rains have a significant impact on agriculturalproduction and hence food inflation (Mohanty, 2014). The Reserve Bank of India (RBI)has also emphasized that supply shocks have been the main drivers of inflation (ReserveBank of India, 2010). Chand (2010) argues that the main reason for India’s high foodinflation during 2009 was the supply shocks due to droughts and carryover effect of lowgrowth of food production in 2008–09.
In addition to short-run transient supply-side factors, there are also long-termstructural supply-side factors which raise food prices such as a shift in land use from foodcrops to export-oriented commercial crops since the mid-1990s, environmentaldegradation and the resultant fall in agricultural productivity. A commodity wise analysis ofinflation by Nair & Eapen (2012) has found that majority of the commodities was subjectto inflationary pressures due to domestic supply-side constraints. With the exception of

5
milk, the paper finds no concrete evidence to support the popular view that the higherfood prices in recent years were the outcome of a “secular shift” in food consumptionpatterns towards high-value agriculture products.
Demand side factors
As far as demand side is concerned, rising incomes especially rural farm wages(Chand 2010, Mohanty 2013) and increase in real consumption (Mohanty 2013) arehighlighted as major reasons. The Indian economy has been growing fast since theopening of the economy in the early 1990s. In addition to the high growth of the economy,the rapidly expanding Indian middle class has been cited as a major cause of the rise infood prices in India in recent years. In his analysis of ‘Changing Inflation Dynamics inIndia’, Mohanty (2011) demonstrates that average annual monthly per capita expenditurehas risen faster in the second half of the 2000s than in the first half. Though the share ofper capita food expenditure has decreased during this period, there has been a clearstructural shift in food consumption towards protein-based food items in recent years. Theprices of these items, including fruits and vegetables, have increased at higher rates thanthat of cereal products, since the supply side of these products has not been able to meetsuch a rapid increase in demand (Mohanty, 2011 and 2014). Subbarao (2011), Rajan(2014) and Gokarn (2010 and 2011) have explained the high value food and proteindriven food inflation by showing that the change in income distribution and income levelsthat has taken place in India in recent years, has led the demand for protein-based fooditems like pulses, eggs, milk and milk products and meat products.
Another source of the demand-driven inflation is the expansionary income supportoffered to the poor through schemes, such as Mahatma Gandhi National RuralEmployment Guarantee Scheme (MGNREGA), pay commission awards and other socialwelfare schemes. These welfare and employment oriented schemes such as MNGREGShave infused substantial amounts of liquidity and purchasing power generating increaseddemand for food items (Rakshit 2011, Ministry of Agriculture, GoI). Rajan (2014) notedthat “a sharp pickup in rural wages was seen after the rural employment guaranteeprogram (assuring 100 days of employment to every household whose adult membersvolunteer to do unskilled manual work) was enacted. MGNREGA may have contributed tothe bargaining power of rural workers, but careful econometric studies suggest that itaccounts for only a small fraction of the rural wage increase, and indeed, any effect iswaning.That said, the indexation of MGNREGA wages suggests its effects in pushingrural wage inflation will not disappear entirely.” Further, occasional pay commissionawards may also have added to the pressure on worker wages in general.

6
Other analysts have also argued that the government sponsored public work, inparticular, the MGNREGA has increased the bargaining power of the work force. It isamenable to facts that agricultural wages have shown a sustained increase in recentyears. Even after accounting for inflation, real wage increase has been significantlypositive (Mohanty, 2014). The increase in agricultural wage was found to be a significantdeterminant of movements in food prices through its impact on cost of agriculturalproduction (Guha and Tripathi, 2014).
Gulati and Saini (2013) using a linear regression framework showed that the threefactors i.e. fiscal deficit, rising farm wages and transmission of the global food inflationtogether accounted for 98 per cent of the food inflation in India during 1995-96 toDecember, 2012. Among the three factors, fiscal deficit with the coefficient of 0.46 withone year lag was the most prominent, followed by farm wages with the coefficient of 0.32with one year lag and 0.30 for global food prices, respectively.
According to the CII and McKinsey report, India’s per-capita gross domesticproduct (GDP) would increase by 320 per cent during 2012-2030. This increase in incomewould lead to 4 per cent increase per annum in overall food consumption from `11 trillionin 2010 to `22.5 trillion. In line with this, per-capita consumption is expected to post anannual 3 per cent increase from `9,360 to `15,390 during the period (CII and McKinsey,April 2013).
Some analysts also point out that the genesis of prevailing higher inflationary spiralcan be attributed to the lagged impact of monetary and fiscal stimuli provided byauthorities to tide over the global financial crisis (Rangarajan and Sheel 2013; Reddy2013). The unprecedented magnitude and complexity of the challenge necessitated fiscaland monetary stimulus2. In India, two fiscal stimulus packages along with monetaryeasing programme were resorted to immediately in the aftermath of the eruption of thecrisis to manage its fallout which probably resulted in the extant build up of inflationarypressures. Ganguly and Gulati (2013) infer that the fiscal stimulus that the Government ofIndia provided in 2009 to avert economic recession coupled with drought led to rising foodprices since mid-2009.
2 The stimulus package necessitated temporary deviation from the fiscal consolidation process embodied in the FiscalResponsibility and Budget Management (FRBM) Act. As part of the stimulus package, special bonds amounting to1.8 per cent of GDP were issued to oil marketing companies and fertiliser companies during 2008-09 to cover for theirunder-recoveries in the face of high international prices and lower administered prices to contain the spiralling ofinflation. The fiscal correction and consolidation process of the State Governments that was progressing during theprevious few years was halted during 2008-09. On the monetary front, the repo and reverse repo rates were raisedgradually since September 2004, along with higher reserve requirements. The tightening stance was pursued moreaggressively in the first half of 2008-09 to contain the building inflationary pressures but was subsequently relaxedsharply with the unfolding of the global financial crisis in late 2008-09.

7
Finally the role of MSP in determining the market prices can hardly beoveremphasized. The MSP as a concept is sought to be the national floor level price withan open ended operation at which the Government stands ready to buy/procure whateverfarmers are ready to sell. As a policy instrument, the MSP is designed for ensuringremunerative and stable price environment which is equitable. However, “since minimumsupport prices are intended to be a floor for market prices, they have sometimes directlyset the market price when increases have been substantial, for key crops the rate of priceinflation seems to relate to the increase in MSP in recent years” (Rajan, 2014). Thus, anyincreases in MSP can set up inflationary pressures in the system (Mishra and Roy, 2011).Gaiha and Kulkarni (2005) showed a strong positive correlation between the level of MSP(for rice and wheat) and WPI as well as CPI-AL after controlling for time trends and levelof income.
III. Data
The data used in the empirical analysis includes factors considered relevant foreliciting the determinants of food inflation in India as pointed out by experts and analystson this subject and highlighted in Section II. These variables include rural wages,consumption expenditure for food and proteins provided by National Accounts Statistics(NAS)3, index of agricultural input cost4, WPI for food, CPI for agricultural labor (CPI-AL),production weighted MSP for rice and wheat and rainfall. Data used in the study havebeen sourced from official sources, namely, Central Statistics Office (CSO), Ministry ofAgriculture (MoA), Reserve Bank of India (RBI) and Commission for Agricultural Costsand Prices (CACP). The quarterly data used in the analysis covers the period 1998-99:Q1
3 In India, the private final consumption expenditure (PFCE) is generated from two sources: firstly, as a part of theNational Accounts Statistics (NAS), the Central Statistics Office (CSO) compiles annually the estimates of privateconsumption. Secondly, the Household Consumer Expenditure Surveys (HCES) of the National Sample SurveyOrganisation (NSSO) yields the estimates of private consumption. The estimates of private consumption from thesetwo sources are different, primarily as these are derived from different approaches. The NSSO estimate consumptionexpenditure by conducting a survey of selected households whereas the CSO estimate is prepared following“commodity flow” approach. This approach consists of netting out intermediate consumption, change in stocks andexports net of imports from the total value of output to get the net availability of the commodities in the domesticeconomy. An amount is also discounted for the wastage of agricultural produce. The difference in NSSO and NASexpenditure of food items is less than the difference in the expenditure on non-food items. This study used the NASbased consumption expenditure, primarily due to availability of annual time-series data, extrapolated for quarterlyseries. The NSSO based consumption expenditure, however, is infrequent and not suitable for robustinterpolation/extrapolation.
4 The Index of agricultural input costs was constructed from WPI. The components taken are akin to CACP’s agriculturalinputs, namely, fertiliser and pesticides, electricity, high speed diesel, light diesel, lubricants, fodder, cattle feed,tractors, and agricultural machinery and equipments. For this purpose, the weights of the respective components inWPI were normalised to 100 and the price indices aggregated using the new weights for arriving at the compositeinput cost index.

8
until 2012-13:Q4. Uniform series of all these data were compiled and deseasonalisedwherever necessary. Certain data series such as expenditure on protein items from NASwhich were only available on yearly basis, were interpolated using standard dynamicprogramming method to generate quarterly series for the purpose of analysis. Ruralwages was converted into real using CPI-AL. The section below gives a brief descriptionof the evolution of some of these important variables during the period underconsideration.
The rural farm wages grew in real terms, using consumer price index foragricultural labourers (CPI-AL) as deflator, at an average rate of around 0.67 per cent perquarter (Y-o-Y) during the period 2006-07:Q2 till 2012-13:Q4 compared with 0.01 per centduring 1999-00:Q1 to 2006-07:Q1. The average nominal growth rates of rural farm wagesbeing 15.5 per cent and 2.9 per cent, respectively, for the corresponding periods. Thelatter phase of higher growth of rural farm wages coincided with the phase of higher foodprice inflation and the implementation of MGNREGA.5 Given these coincidences, it isworth reckoning that given the relatively inelastic demand for food, particularly in ruralareas, rising cost of food production and rising farm wages may have contributed tohigher food price inflation. This is all the more likely as rural households constitutedaround 70 per cent of the total population (2011 census) and their demand for food isinelastic. Rising farm wages is believed to be putting severe pressure on cost ofproduction of food while raising the benchmark ‘reservation wage' in the economy - thelowest rate that workers are prepared to accept for jobs across sectors (Damodaran,2012). It is, therefore quite plausible that the increase in farm wages might have led to anincrease in cost of production and demand for food over the period and thus food priceinflation, warranting empirical validation.
The various rounds of NSSO’s expenditure surveys have shown that in recentperiod, food consumption pattern in India has undergone a change in favour of high-valueand more nutritious food items like milk and milk products, MFE and, fruits andvegetables, away from staple and starch centric cereals. This shift has beenaccompanied by falling share of food expenditure in total expenditure. Even thoughempirical validation of changing food consumption pattern is not within the ambit of thisstudy, the observed pattern of compositional shift broadly follows the Bennet’s Law whichstated that as income rises food consumption pattern shifts away from starch intensivetowards more nutritious and high value food, and the Engel’s law which states that asincome rises the proportion of expenditure on food falls. It is, therefore, natural to infer
5 The question of whether MGNREGA was the reason for the higher increase in rural farm wages during the latterphase is an issue still debated in academic circles and is outside the ambit of the current study.

9
that rising income and the associated change in preferences may have contributed tohigher inflation rates for food items like milk and milk products, and MFE during the latterphase. As regard pulses, since the country is not yet self-sufficient in its production,higher inflation for pulses can be assessed in terms of demand-supply mismatch.6 In thisregard, the approach paper of the 12th Five Year Plan (TFYP) has rightly pointed out that– “The challenge is how to feed India’s growing population with rising incomes, but limitedland and water resources. The economy is expected to grow strongly and, as the variousNSSO surveys on household expenditure reveal, an average household still spendsnearly half of its expenditure on food and food products. Thus, pressure on food demandis likely to remain strong over the TFYP period while consumption is likely to be morediversified as cereals now account for only 15.0 per cent of the total consumptionexpenditure.”
There has been a significant increase in agricultural cost of production in the recent
period. To understand the extent to which increase in cost of production in agriculture has
contributed to food price inflation, we have used the agricultural input price index in the
analysis. This index includes major farm inputs like fertilisers, pesticides, electricity, high
speed diesel, light speed diesel oil, fodder, cattle feed, tractor, agricultural machinery &
implements and lubricants. This index shows an upward trend and effectively traces the
path of food WPI (Chart 4). Among the agricultural inputs, light diesel oil recorded the
highest inflation, followed by high speed diesel and lubricants.
In recent years, there have been progressive hikes in the MSPs of major crops.Steep hikes in MSPs were observed across major food items which were evident even
6 According to the Working Group of the 12th Five Year Plan, even by the terminal year of the Plan in 2016-17, thedemand-supply gap of pulses would be around 1-4 million tonnes.

10
when expressed in terms of average annual hikes. The average annual hikes in MSPs formost food items during 2007-13 were higher than during 1998-06. This period of steeperhikes in MSPs also roughly coincided with the period of higher food inflation. There havebeen studies that observed close correlation between MSP and food price inflation. In thecurrent study, an attempt has been made to capture the impact of MSP in a morecomprehensive way by using production weighted MSP for major crops as explanatoryvariable.7
The vagary of weather and its impact on food production is not a recentphenomenon as far as Indian agriculture is concerned. Years of deficient rainfall haveoften been associated with fall in agricultural production (Chart 4). Extreme climaticconditions have also affected agricultural production adversely. It has been observed thatthe sudden slump in food supply associated with climatic conditions has led to food priceinflation. However, going by the past experience it has also been the case that rainfalldeficiencies have not always been associated with increased food inflation. This impliesthat deficient rainfall can have at best temporary supply side impact on production andfood inflation – and the sustained rise in food inflation observed especially since 2005-06onwards could be attributed to reasons other than climatic vagaries.
Chart 5: Rainfall, Crop Productions and Food Inflation
-25.0
-20.0
-15.0
-10.0
-5.0
0.0
5.0
10.0
-30.0
-20.0
-10.0
0.0
10.0
20.0
30.0
40.0
50.0
2005-06 2006-07 2007-08 2008-09 2009-10 2010-11 2011-12 2012-13 2013-14 Ra
infa
ll a
nd
So
win
g D
ev
iati
on
%
Kh
ari
f C
rop
Gro
wth
South-west Monsoon and Kharif Crops
Rice PulsesFoodgrains OilseedsCotton Jute & mestaSugarcane Kharif sowing (RS)SW Monsoon deviation from Normal (RS) LPA and Normal Sowing (RS)
-50.0
-40.0
-30.0
-20.0
-10.0
0.0
10.0
20.0
30.0
-20.0
-15.0
-10.0
-5.0
0.0
5.0
10.0
15.0
20.0
25.0
2005-06 2006-07 2007-08 2008-09 2009-10 2010-11 2011-12 2012-13 2013-14R
ain
fall
an
d S
ow
ing
Dev
iati
on
%
Ra
bi C
rop
Gro
wth
North-east Monsoon and Rabi Crops
Wheat RicePulses FoodgrainsOilseeds Rabi sowing (RS)NE Monsoon deviation from Normal(RS) LPA and Normal Sowing (RS)
IV. Methodology
The methodology used in the paper is the standard cointegration and errorcorrection modeling based on Johansen’s multivariate cointegration method which entails
7 Taking the average production weighted MSP of food and commercial crops, namely, rice, wheat, pulses, oilseedsand sugarcane as explanatory variables do not yields statistically significant results. Thus, the average productionweighted MSP of rice and wheat has been taken as explanatory variable in regression.

11
estimation of vector error correction model (VECM). This method deploys I(1) variables inestimating the cointegrating equation followed by the test of the stationarity of the errorterm. This is followed by the second step namely, the test of weak exogeneity of thevariables in the system. The test is carried out by eliciting the statistical significance of theadjustment factors (coefficients of the error correction terms) in the cointegrating system.Weakly exogenous variables suggest the existence of short-run causality vis-à-vis thedependent variable in the VECM within a robust framework. The basic approach to theconducting cointegration analysis is given below.
A standard VAR for M endogenous variables can be transformed into a VECMthat can be represented as follows
Assuming that there is a set of observations running fromLet the observations on for be collected in a successive rowvectors which together make a matrix of order Similalry, the observationson are collected in a matrix of order andlet is the matrix of successive observations on Then the system ofequations is
Where and The hypothesis of cointegration is that
the matrix is of rank This is equivalent to the proposition that where has order and has order and both matrices are
of rank
The log-likelihood function of the model that needs to be optimized to obtainparameter estimates has the following form
where is the variance covariance matrix of the VECM.

12
V. Empirical Results
The empirical results are based on the methodology discussed in IV.Accordingly Table I reports the results of the augmented Dickey Fuller (ADF) unitroot tests for the variables eventually selected for estimating the model.
Table 1: ADF Test of Unit Root Variables Without
trendWith
TrendFirst
DifferenceFood WPI 2.37 -0.88 -6.62*Real Rural wages 2.30 0.58 -4.61*Protein Food Expenditure -0.06 -2.68 -4.00*Weighted Average MSP -1.63 -2.85 -7.14*AgriInput -0.13 -2.19 -4.29*Rainfall -4.92* -4.93* -Note: The critical values for the rejection of the null are -4.12 and -3.55, respectively in thetrend and no trend case. One lag was chosen for the ADF test based on AIC and SBC criteria.All variables were transformed into natural logarithms. * indicates that the variable is stationaryor I(0). The test was re-conducted to extended differenced lags with same inference.
Table 1 indicates that the variables selected for the cointegrating equation, exceptfor rainfall, are integrated of order one [I(1)] and hence can constitute a long-termequilibrium relationship. The stationarity property of rainfall data series suggests that itcan only be considered as a short-run variable, but not as a part of the long-termcointegrating spacer. The estimated cointegrating vector with largest eigenvalue (0.669)was considered for further analysis. The significance of the corresponding Trace statistic(195.85 with p=0.00) confirms the presence of cointegration.
*: significant at 1 per cent.**: significant at 10 per cent.
where,

13
FoodWPI : Wholesale price index of food items (2004-05=100)RWages : Real rural farm wages
Protein : Ratio of private consumption expenditure on plant and animal proteinfood items including pulses, milk and milk products, meat-fish-eggs andoil to total food expenditure.
AvgMSP : Production weighted average MSP of rice and wheat
AgriInput : Index of agricultural input costs constructed from WPI.
The estimated coefficients of the long-term cointegrating vector/relationshipsuggest that real rural wages have the largest impact on food inflation, followed byweighted average MSP of rice and wheat and index for agricultural inputs, respectively.The long-term impact of expenditure on protein items on overall food inflation was foundto be significant but weak statistically indicating a rather muted influence of theseexpenditures on overall food inflation. The coefficient of real rural wages of 0.92 impliesthat food inflation increases almost pari passu with real rural wages giving soundcredence to the proposition that rising real rural wages are indeed at the heart ofincreasing food inflation. The elasticity of average MSP of food inflation estimated to be at0.34, and that of agricultural input at 0.23 are both statistically significant suggesting thatthey also have been instrumental in driving food inflation up during the period.
The dominant influence of real wages in determining long-run food inflation andespecially its visible upward push since mid-2009 appears somehow coincident with largeexpansion of MGNREGA to 615 districts in 2008-09 from 330 districts in 2007-08. Thisexpansion of MGNREGA resulted in a substantial increase in aggregate expenditure onwages under the programme to `18,200 crore in 2008-09 from `10,738 crore in 2007-08,giving rise to debate about its adverse implications for food inflation. However, empiricalevidence adduced in this study shows that the impact of MGNREGA on food inflation isnot sustained. A dummy for controlling MGNREGA expansion effect in 2008-09introduced in the VECM is not only of small (0.009) magnitude but also statisticallyinsignificant. The sharp upward spike in food inflation beginning mid-2009 should not betherefore ascribed to MGNREGA alone.
The second equally important aspect of the analysis consists of the testing of weakexogeneity of each of the system variables with respect to food inflation. Apart from thedirection of causality, this test also proffers evidence on what would affect food inflation inthe short-run. The procedure is accomplished by testing the significance of adjustmentfactors as discussed in Section IV. The results of these tests are reported below.

14
Table 2: Tests of Weak Exogeneity
Variable Likelihood Chi-square statistic p-valueReal Rural wages 28.67 0.00*Weighted Average MSP 9.02 0.00*AgriInput 3.69 0.05*Protein Expenditure 0.11 0.75Note: The critical values for Chi-square stat for rejecting weak exogeneity is 3.841. Thefigures in brackets in the second column are respective p values. A * confirms causality.
The results from testing weak exogeneity with respect to food inflation suggeststhat even in the short-run, the three factors, namely, real rural wages, average MSP andagricultural input cost inflation are strongly significant in influencing the former.
VI. Concluding Remarks
The study shows that the persistence of food inflation in recent years can largelybe ascribed to higher wages, particularly, in the rural sector pushed further by hikes inMSP of rice and wheat and input cost inflation. These very factors also explained themovement of food price in the short-run. The long-term impact of protein expenditure,though large in magnitude, was found to be weakly significant. The vagaries of monsoonhave contributed to food price pressures occasionally, but they may not have long-termimpact on food prices. Empirical results indicate that the introduction of MGNREGA doesnot seem to have caused any significant increase in food inflation as generally perceived.
The pressure on food prices is likely to increase as economic growth finds durabletraction once again. It is therefore necessary to turn agriculture growth into a ‘missionmode’ so as to increase productivity through enhanced investments and improvedtechnology. Needless to state, reducing the supply-demand gap in agriculture productionin the long-run and improving supply logistics will be of utmost importance for assuagingfood price pressures and for sustaining the pace of economic activity by securingadequate food availability at reasonable prices.

15
References
1. Agriculture Statistics at a Glance, Various Issues, Ministry of Agriculture,Government of India, Available at http://eands.dacnet.nic.in/latest_2006.htm.
2. Atul Guha, Ashutosh Kr Tripathi, (2014)., “Link between Food Price Inflation andRural Wage Dynamics” Economic and Political Weekly, June 28, 2014 (Vol. XLIXNos. 26 & 27).
3. Bandara J.S., (2013), ‘What is Driving India's Food Inflation? A Survey of RecentEvidence’, South Asia Economic Journal, 14(1), page 127-156.
4. Chand R. (2010), ‘Understanding the Nature and Causes of Food Inflation’,Economic and Political Weekly, volume 45, number 9, page 10-13.
5. Commission for Agricultural Costs and Prices (CACP), Ministry of Agriculture,Government of India, Available at http://cacp.dacnet.nic.in/
6. Commodity price data (Pink Sheet),World Bank, Available athttp://www.worldbank.org/
7. Damodaran H., “An alternative theory of Inflation” The Hindu June 12, 2012.
8. Gaiha Raghav and Vani S. Kulkarni. 2005, “Foodgrains Surpluses, Yields andPrices in India. Global Forum on Agriculture: Policy Coherence for Development”30th November -1st December 2005. Paris. France.
9. Ganguly and Gulati (April 2013), “The Political Economy of Food Price Policy – TheCase of India”, United Nations University, World Institute for Development EconomicResearch, Working Paper No.2013/034.
10. Gokarn, S. (2010), ‘The price of protein’. Monthly Bulletin, Reserve Bank of India,November 2010.
11. Gokarn, S. (2011), ‘Food Inflation: This Time it’s Different’ Monthly Bulletin, ReserveBank of India, January 2011.
12. Ministry of Agriculture, Government of India, “The State of Indian Agriculture 2011-12” Chapter V, Page 126. Available at http://agricoop.nic.in/sia111213312.pdf
13. Gulati and Saini (2013), ‘Taming Food Inflation in India’, Discussion Paper No. 4,Commission for Agricultural Costs and Prices, Ministry of Agriculture, Governmentof India.
14. Handbook of Statistics on Indian Economy, Various Issues, Reserve Bank of India(RBI), Available at RBI home page http://www.rbi.org.in/Home.aspx.

16
15. Mahendra Dev S., Chandrasekhara Rao, “Agricultural Price Policy, Farm Profitabilityand Food Security: An Analysis of Rice and Wheat”, Available in the homepage ofCommission for Agricultural Costs and Prices (CACP), Ministry of Agriculture,Government of India, Available at http://cacp.dacnet.nic.in/
16. Mishra P. and Roy D. (2011), ‘Explaining Inflation in India: The Role of Food Prices’,Indian Policy Forum, volume 8.
17. Mohanty, D. (2010). ‘Perspectives on inflation in India’. Speech delivered at theBankers Club, Chennai, on 28 September 2010.
18. Mohanty, D. (2011). ‘Changing inflation dynamics in India’. Speech delivered at theIndian Institute of Technology Guwahati (IITG) on 3 September 2011.
19. Mohanty D. (2013), ‘Indian Inflation Puzzle’, Speech given at the function of Late Dr.Ramchandra Parnerkar Outstanding Economics Award 2013 at Mumbai on January31.
20. Mohanty, D (2014)., ‘Why is recent food inflation in India so persistent?’. Speechdelivered at the annual Lalit Doshi Memorial Lecture, Xavier’s Chapter, delivered atthe St. Xavier’s College, Mumbai, 13 January 2014.
21. Nair, Sthanu R and Leena Mary Eapen (2012): “Food Price Inflation in India (2008 to2010): A Commodity-wise Analysis of the Causal Factors”, Economic & PoliticalWeekly, No 20, 46-64.
22. Price Statistics, Ministry of Statistics and Programme Implementation, Governmentof India, Available at http://mospi.nic.in/Mospi_New/site/home.aspx
23. Rajan, Raghuram (2014), Governor RBI, (February 26, 2014), “Fighting Inflation”,inaugural speech at FIMMDA-PDAI Annual Conference 2014, on February 26, 2014at Mumbai.
24. Rakshit, M (2011), “Inflation and Relative Prices in India 2006-10: Some Analyticaland Policy Issues”, Economic & Political Weekly, No 16, 41-54.
25. Rangarajan, C and Sheel, Alok (2013), “Growth or Austerity: The Policy Dilemma”,Money & Finance, ICRA Bulletin, February 2013.
26. Reddy, YY (2013). Economic Policies and India's Reform Agenda-A New Thinking.Orient Blackswan.
27. Reserve Bank of India (2010). Annual report 2009–2010. Mumbai: Reserve Bank ofIndia.
28. Subbarao, D., Governor RBI, (November 22, 2011), “The Challenge of FoodInflation”, Presidential Address delivered at the 25th Annual Conference of theIndian Society of Agricultural Marketing at Hyderabad.